Manitou BF SA · EURONEXT:MTU
Manitou BF SA — Q3 2013 Earnings Presentation
14 slides from Manitou BF SA's earnings presentation, Oct 24, 2013
Slide 1: Q3'13 Revenue
Q3’13 Revenue Dominique Bamas, CEO Hervé Rochet, CFO
Slide 2: Disclaimer
Disclaimer This presentation includes only summary information and does not in any way purport to be comprehensive. None of the Company or any of its affiliates, directors, officers, advisors and employees accepts any obligation, liability , claim or remedy for any loss arising from any use of these
Slide 3: Highlights
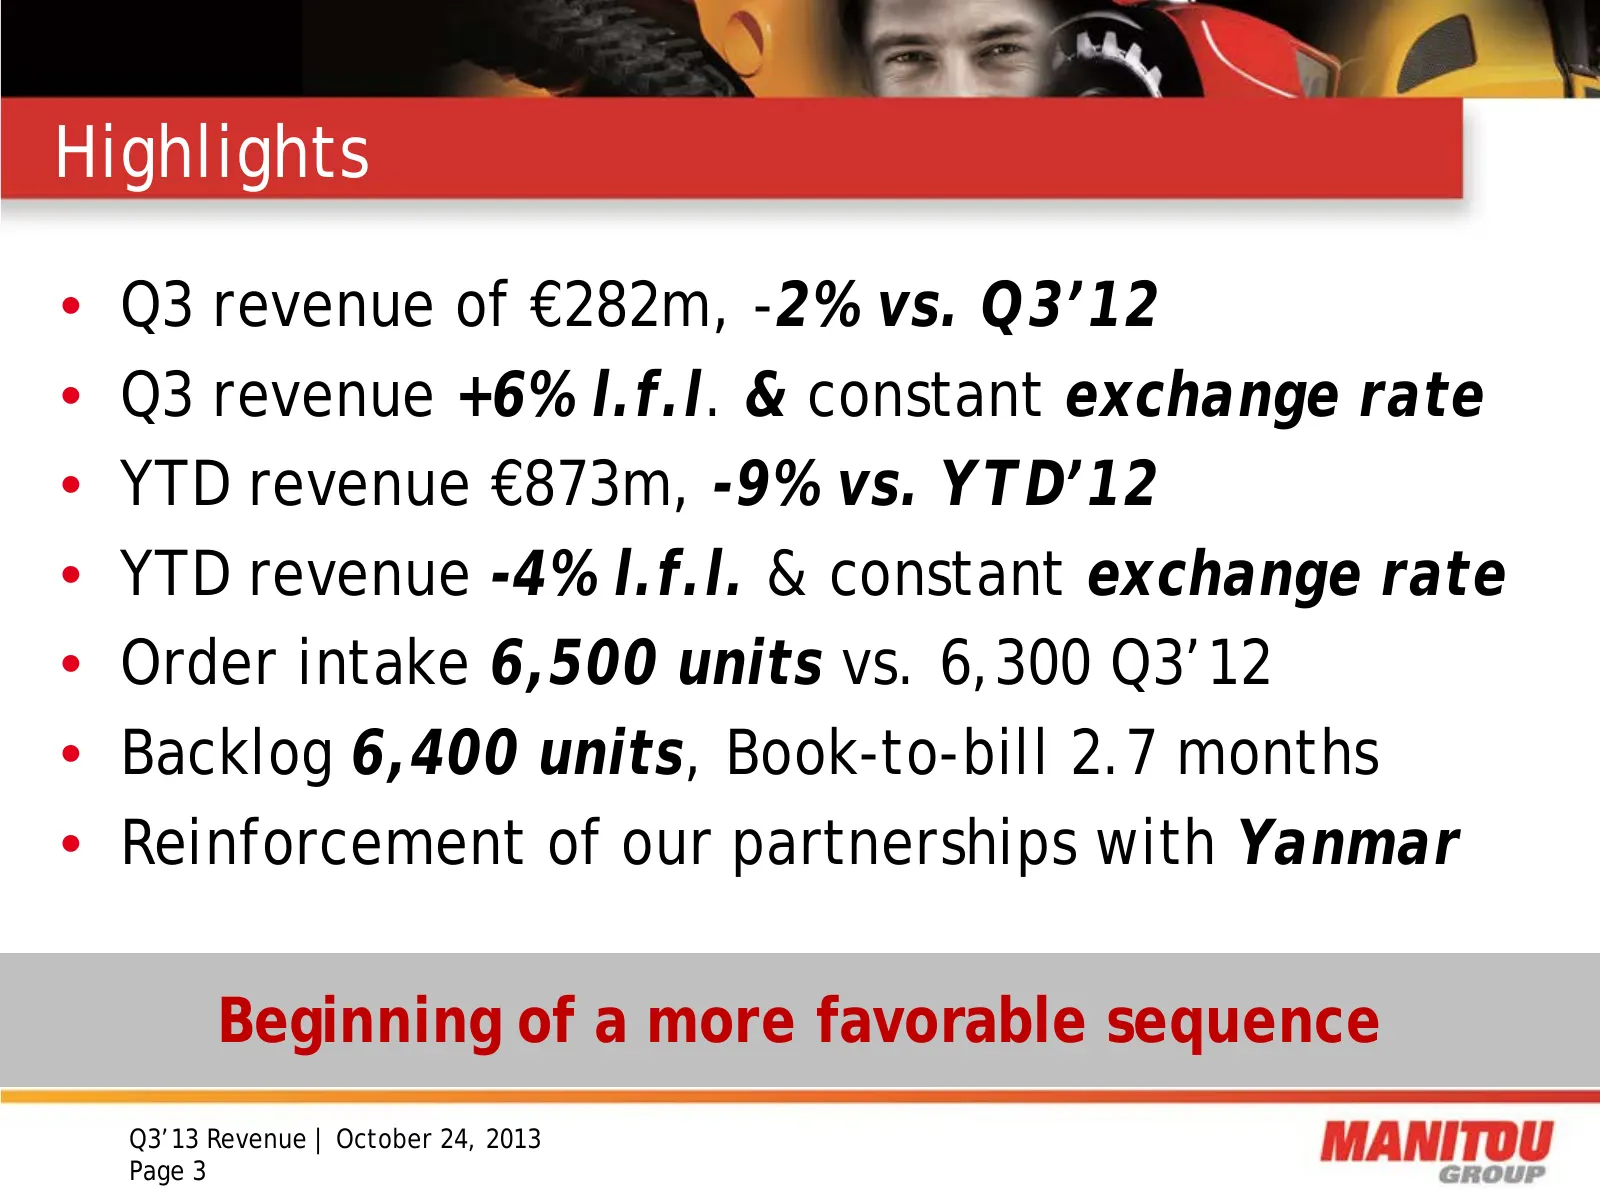
Highlights • Q3 revenue of €282m, -2% vs. Q3’12 • Q3 revenue +6% l.f.l. & constant exchange rate • YTD revenue €873m, -9% vs. YTD’12 • YTD revenue -4% l.f.l. & constant exchange rate • Order intake 6,500 units vs. 6,300 Q3’12 • Backlog 6,400 units, Book-to-bill 2.7 months • Reinforcement of our part
Slide 4: Other highlight: Revenue Q3 RTH CE
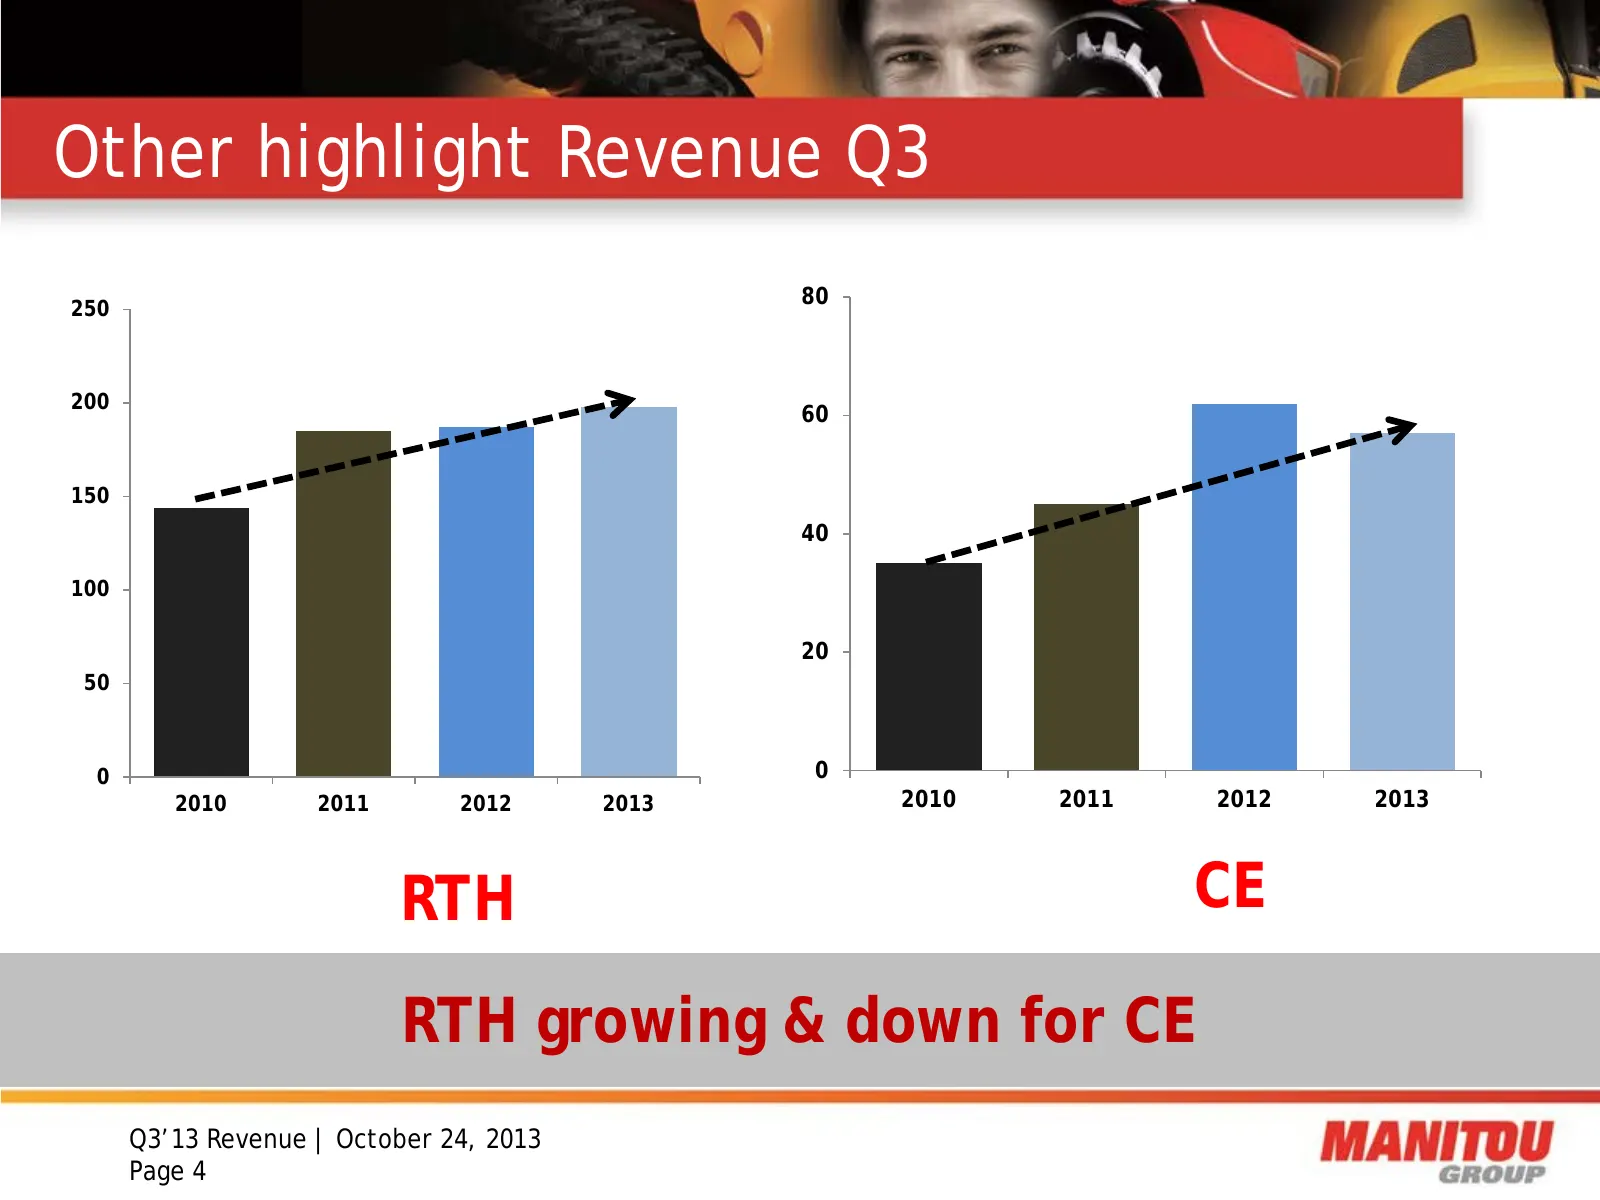
Other highlight Revenue Q3 80 250 200 60 150 40 100 20 50 0 0 2010 2011 2012 2013 2010 2011 2012 2013 RTH CE RTH growing & down for CE Q3’13 Revenue | October 24, 2013 Page 4
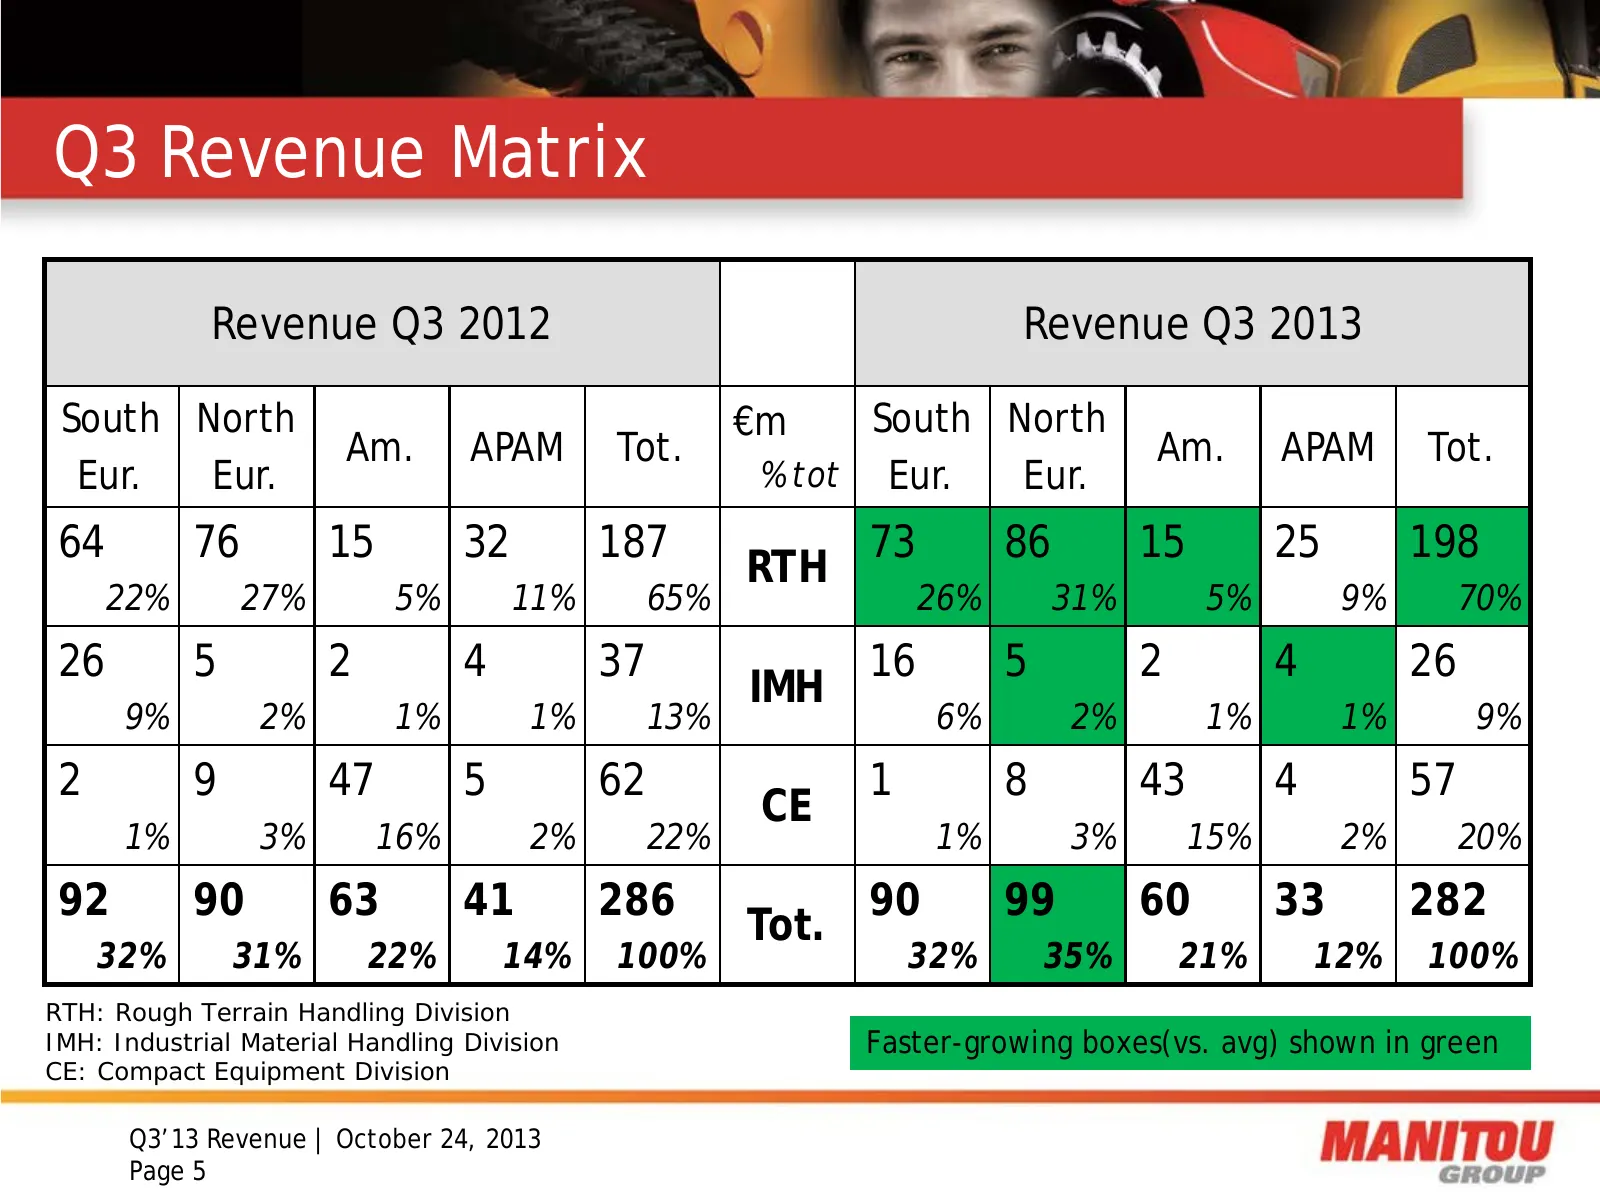
Slide 5: Q3 Revenue Matrix
Q3 Revenue Matrix Revenue Q3 2012 Revenue Q3 2013 South North €m South North Am. APAM Tot. Am. APAM Tot. Eur. Eur. % tot Eur. Eur. 64 76 15 32 187 73 86 15 25 198 RTH 22% 27% 5% 11% 65% 26% 31% 5% 9% 70% 26 5 2 4 37 16 5 2 4 26 IMH 9% 2% 1% 1% 13% 6% 2% 1% 1% 9% 2 9 47 5 62 1 8 43 4 57 CE 1% 3% 16%
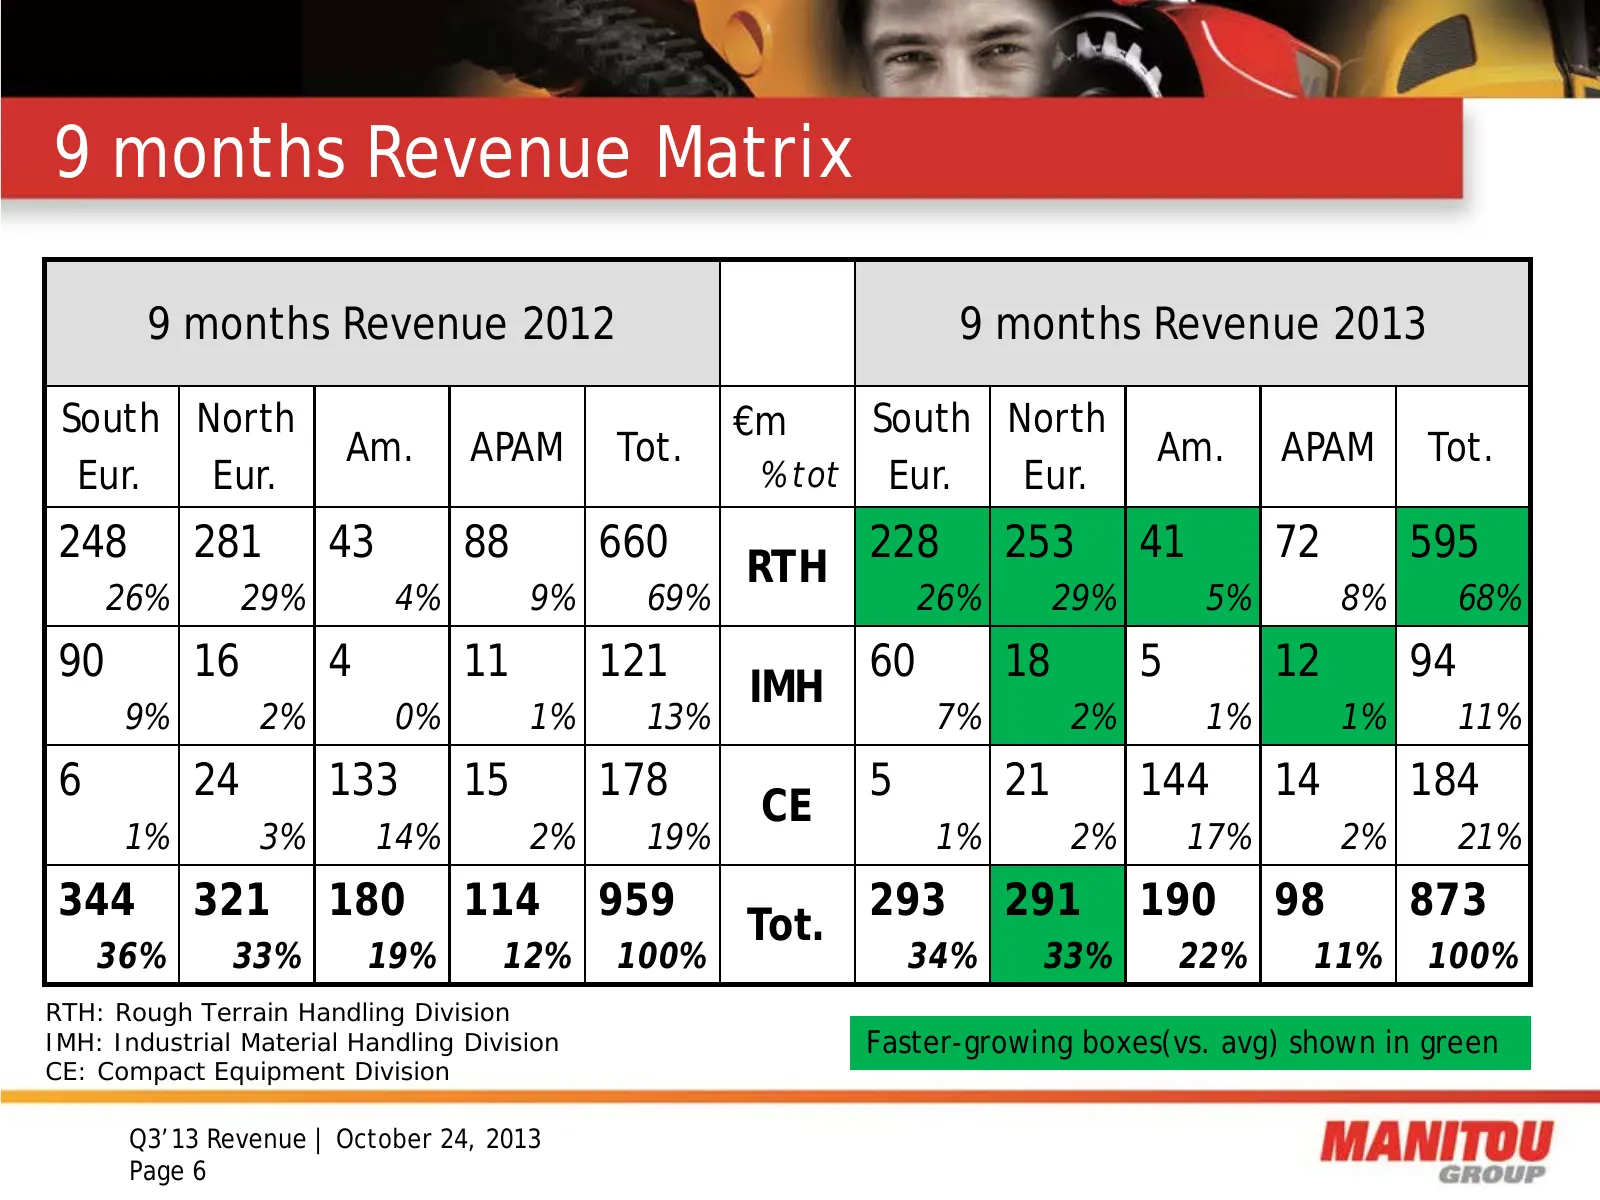
Slide 6: 9 months Revenue Matrix
9 months Revenue Matrix 9 months Revenue 2012 9 months Revenue 2013 South North €m South North Am. APAM Tot. Am. APAM Tot. Eur. Eur. % tot Eur. Eur. 248 281 43 88 660 228 253 41 72 595 RTH 26% 29% 4% 9% 69% 26% 29% 5% 8% 68% 90 16 4 11 121 60 18 5 12 94 IMH 9% 2% 0% 1% 13% 7% 2% 1% 1% 11% 6 24 133 1
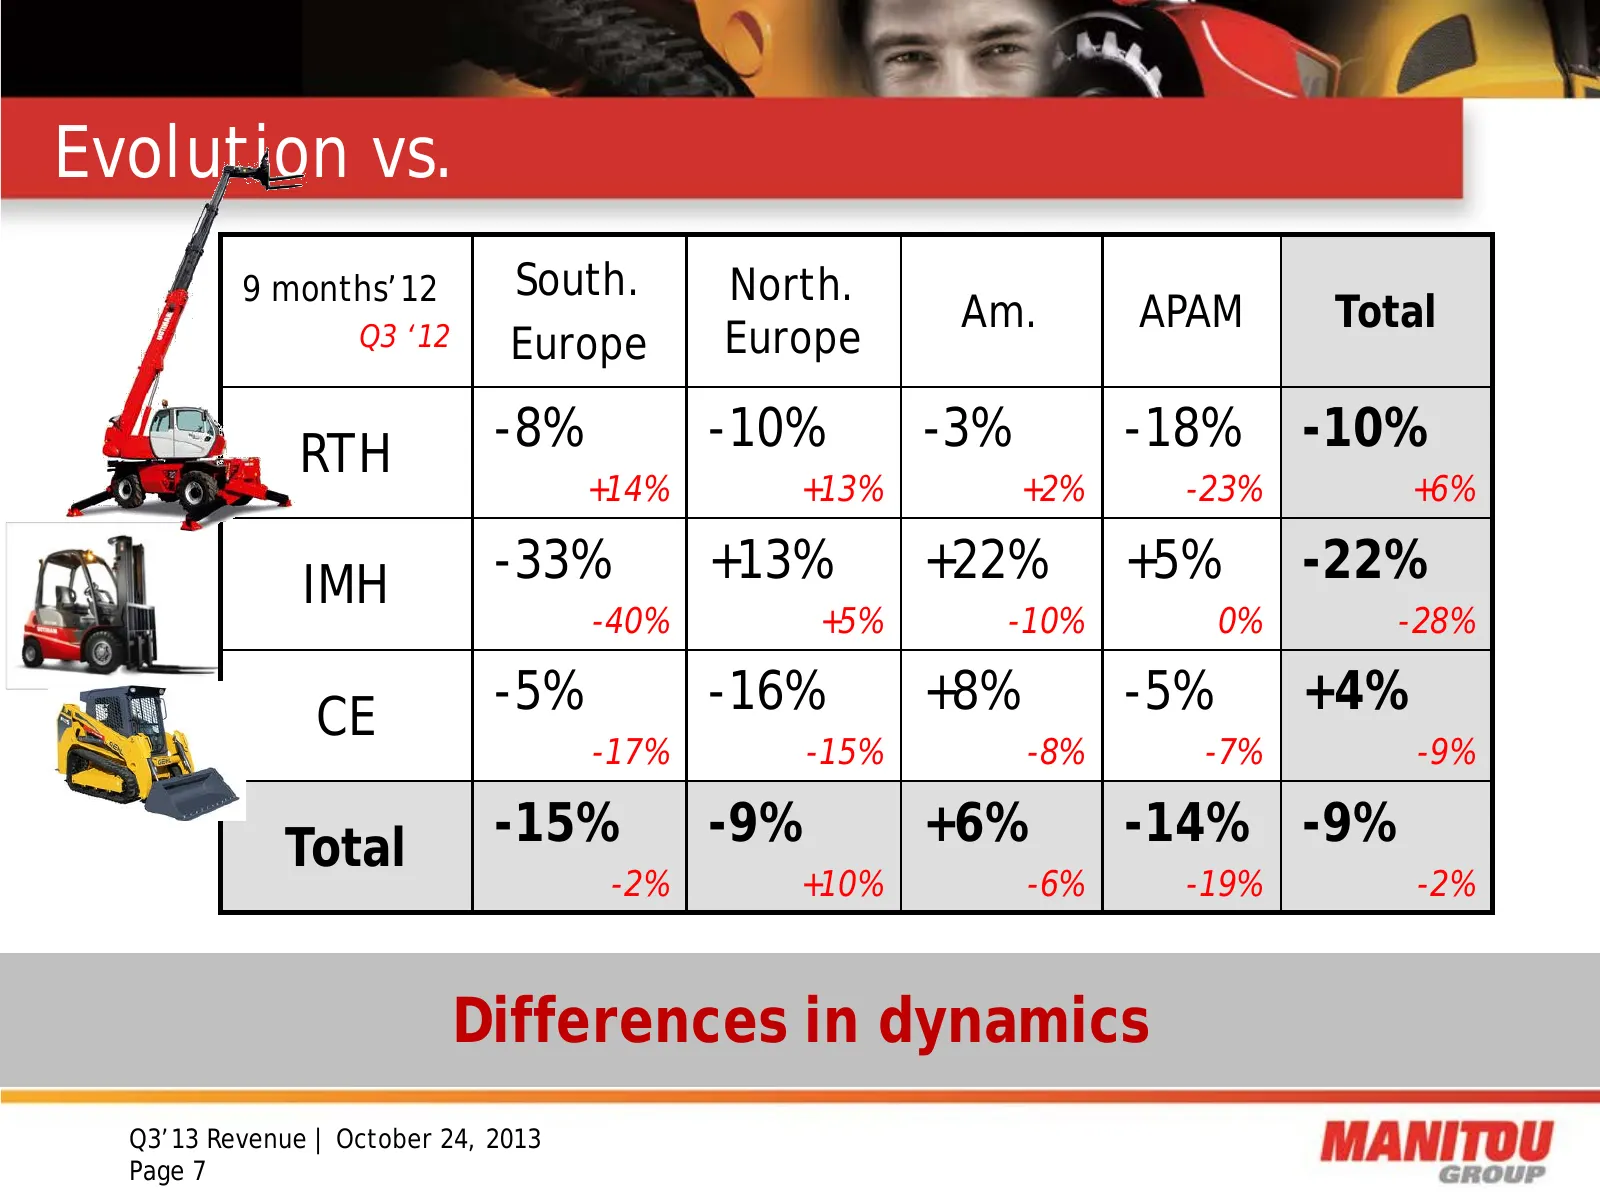
Slide 7: Evolution vs. Q3'12: Differences in dynamics
Evolution vs. 9 months’12 South. North. Am. APAM Total Q3 ‘12 Europe Europe RTH -8% -10% -3% -18% -10% +14% +13% +2% -23% +6% IMH -33% +13% +22% +5% -22% -40% +5% -10% 0% -28% CE -5% -16% +8% -5% +4% -17% -15% -8% -7% -9% Total -15% -9% +6% -14% -9% -2% +10% -6% -19% -2% Differences in dynamics Q3’1
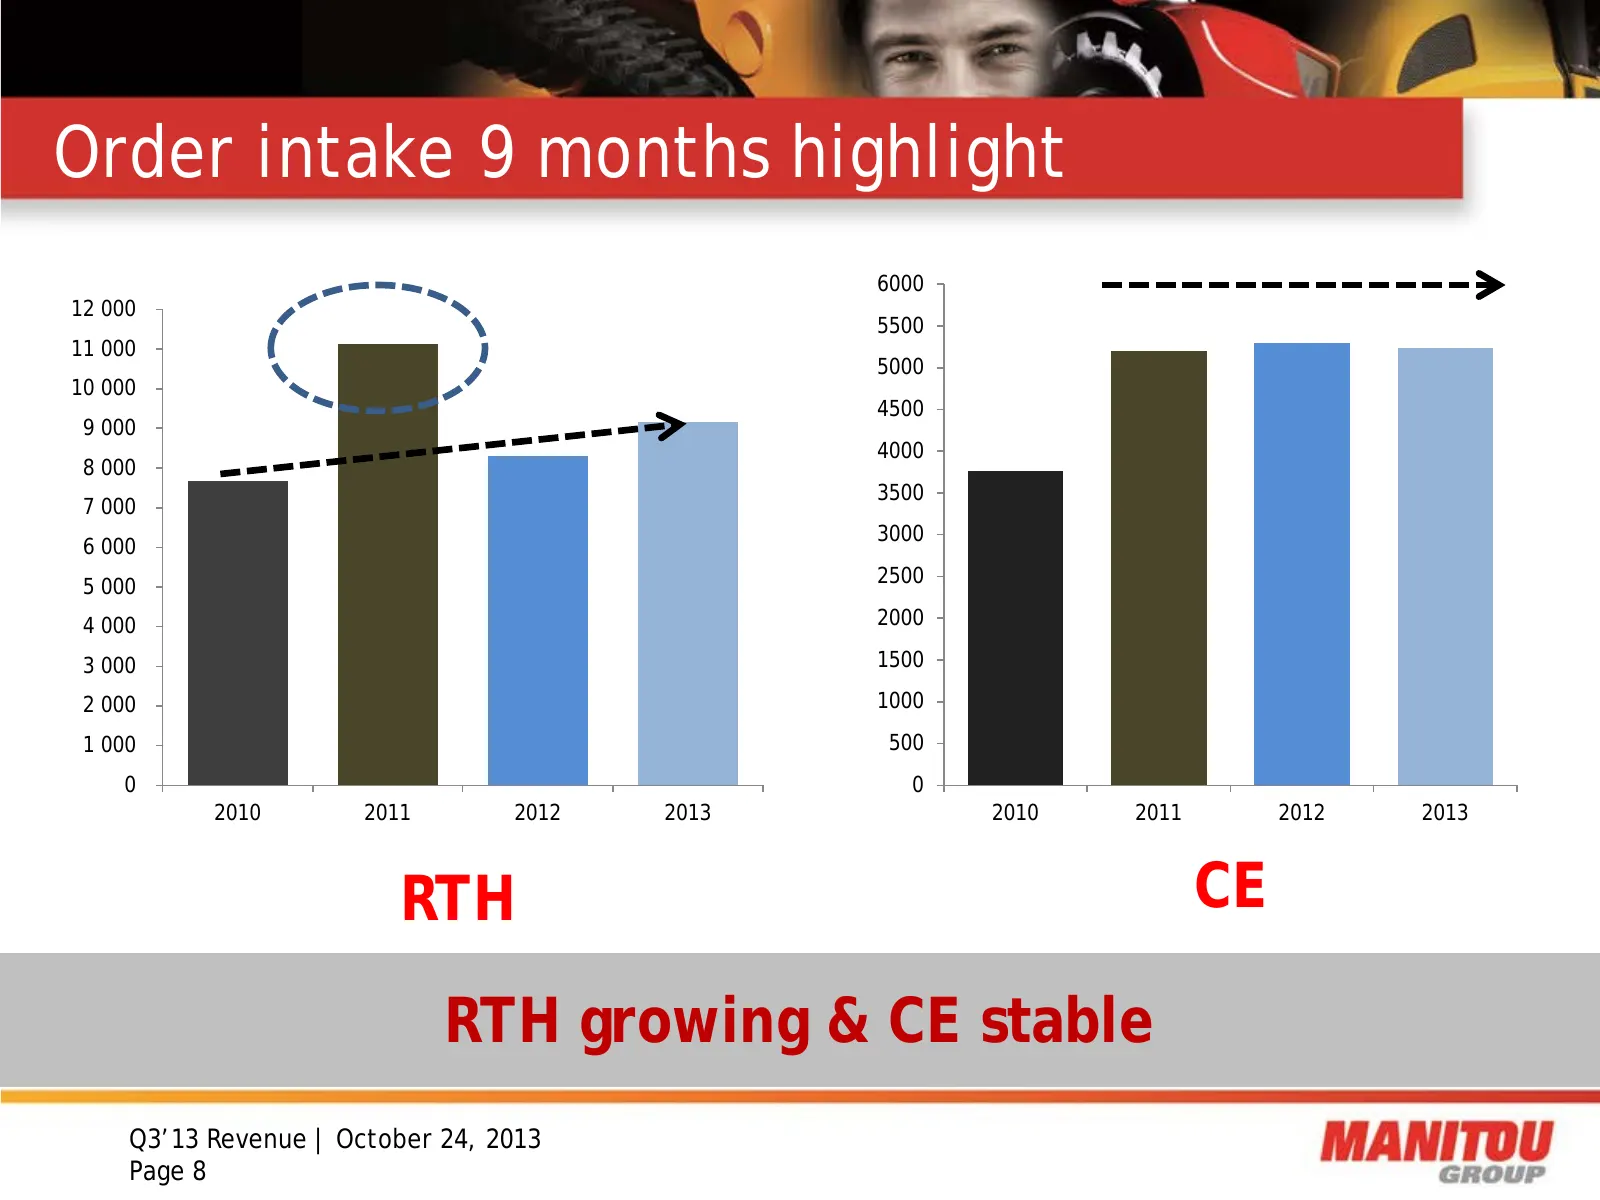
Slide 8: Order intake 9 months highlight
Order intake 9 months highlight 6000 12 000 5500 11 000 5000 10 000 4500 9 000 4000 8 000 3500 7 000 3000 6 000 5 000 2500 4 000 2000 3 000 1500 2 000 1000 1 000 500 0 0 2010 2011 2012 2013 2010 2011 2012 2013 RTH CE RTH growing & CE stable Q3’13 Revenue | October 24, 2013 Page 8
Slide 9: Backlog & order intake
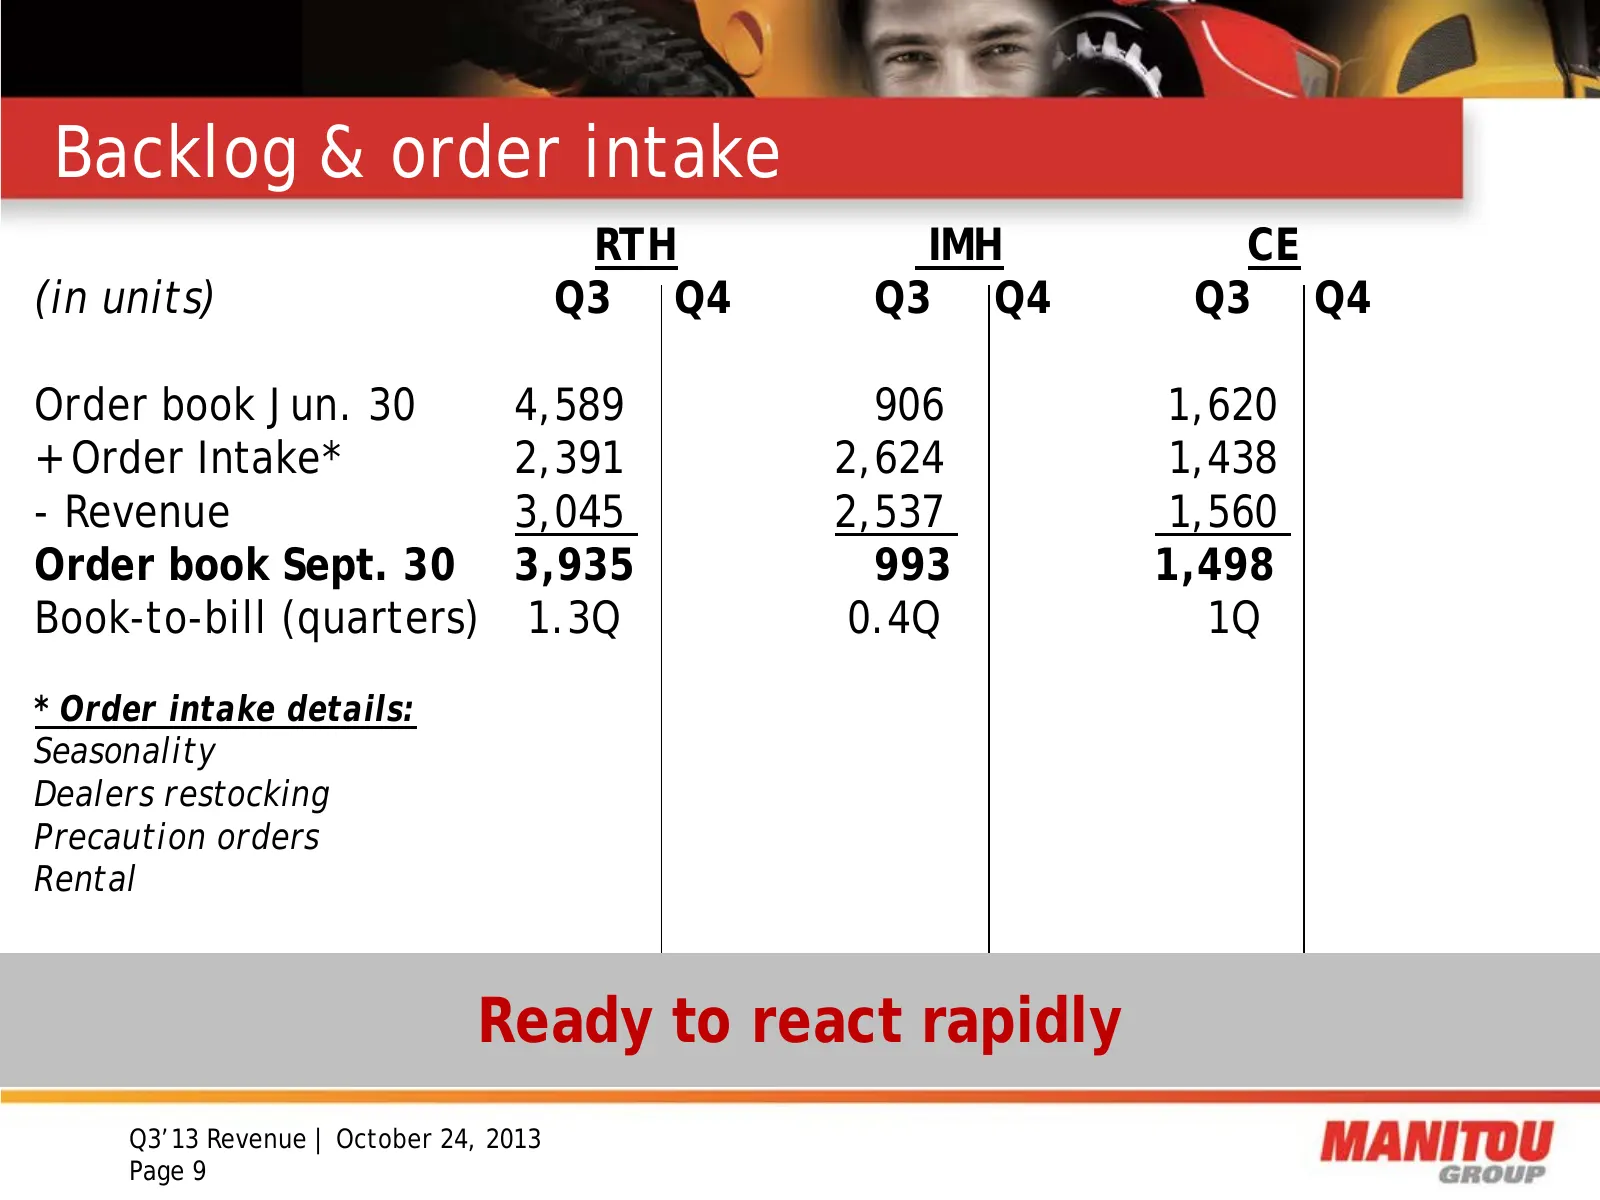
Backlog & order intake RTH IMH CE (in units) Q3 Q4 Q3 Q4 Q3 Q4 Order book Jun. 30 4,589 906 1,620 + Order Intake* 2,391 2,624 1,438 - Revenue 3,045 2,537 1,560 Order book Sept. 30 3,935 993 1,498 Book-to-bill (quarters) 1.3Q 0.4Q 1Q * Order intake details: Seasonality Dealers restocking Precaution o
Slide 10: Backlog evolution (units)
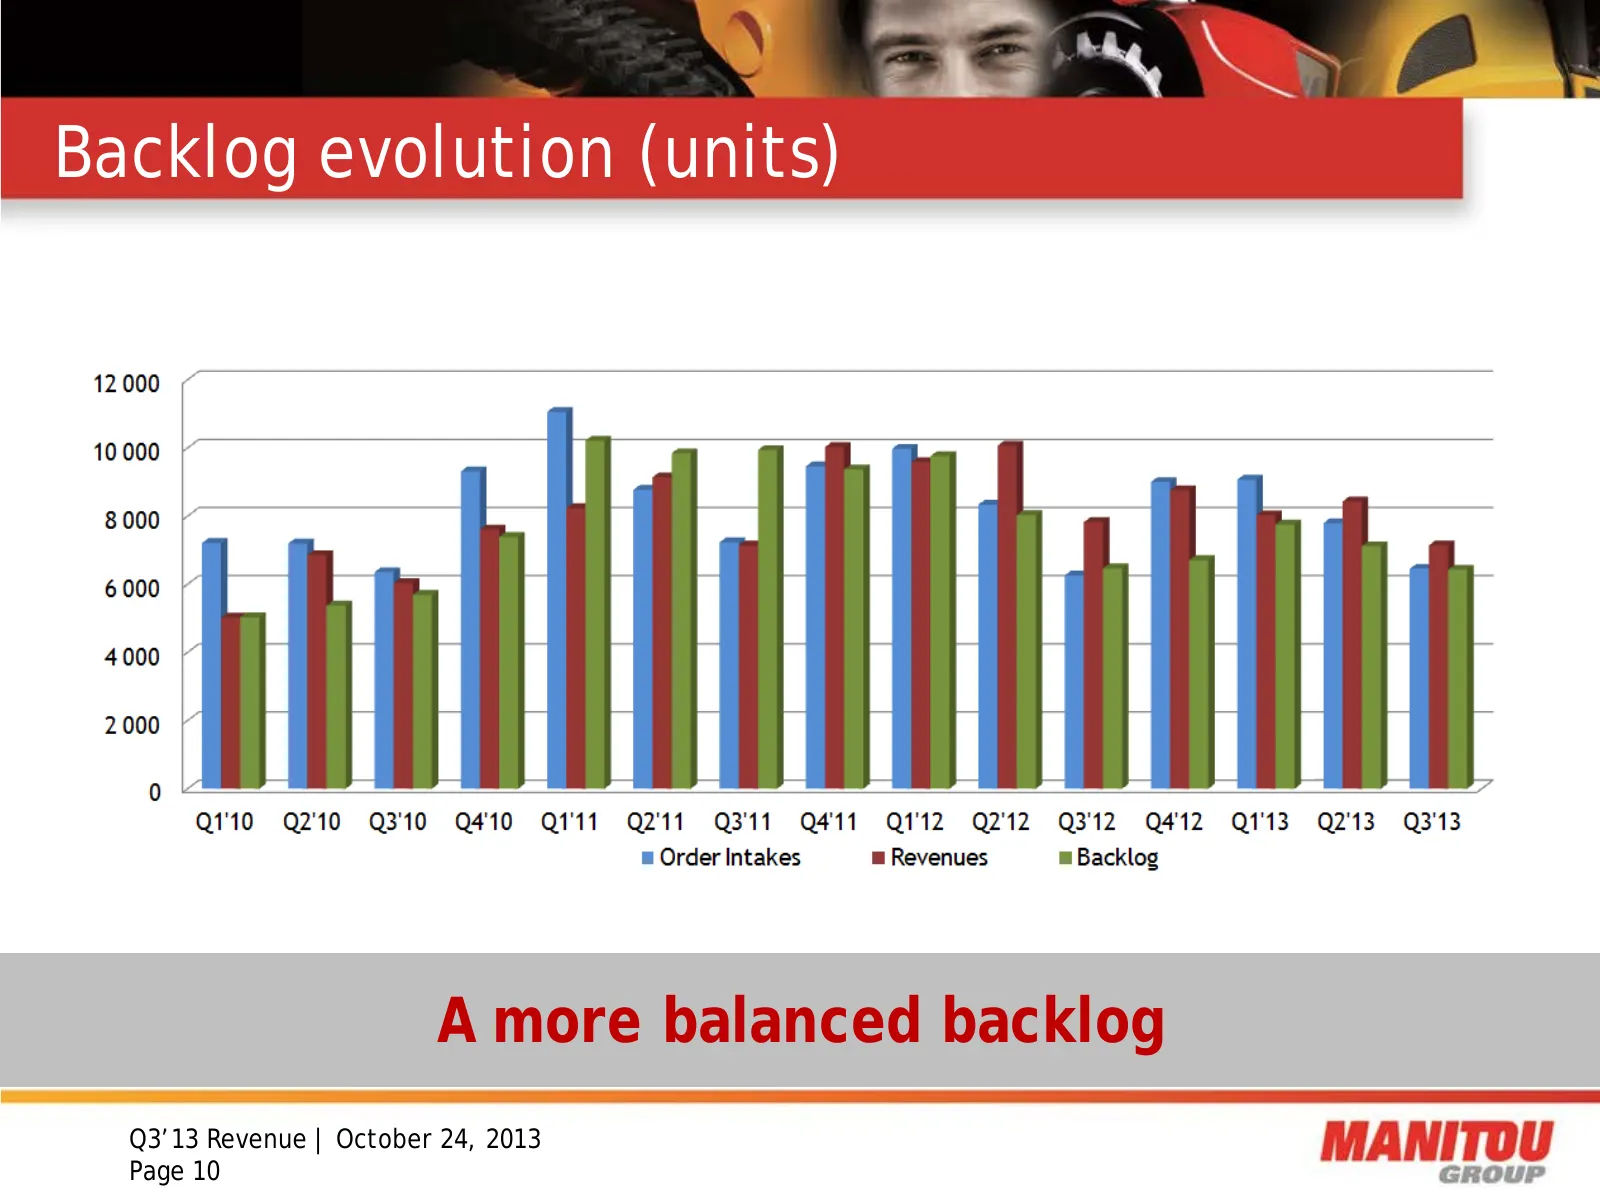
Backlog evolution (units) A more balanced backlog Q3’13 Revenue | October 24, 2013 Page 10
Slide 11: Operational review
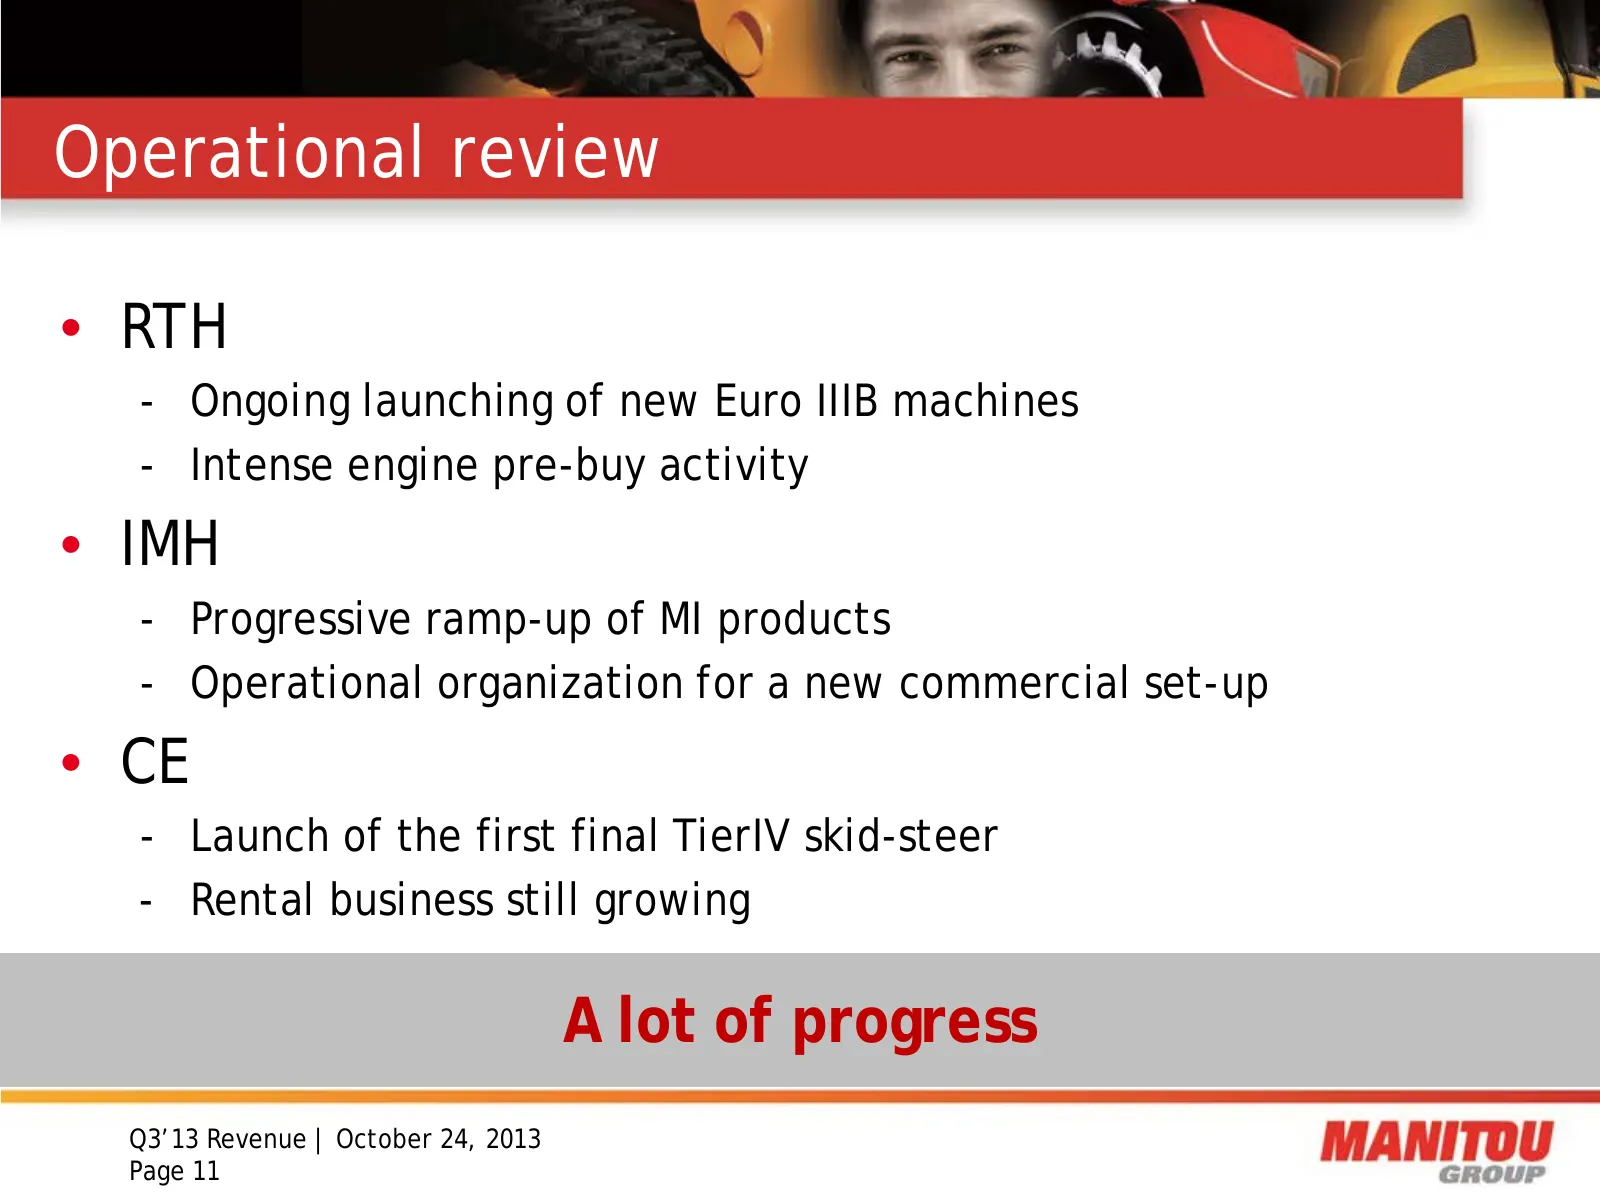
Operational review • RTH - Ongoing launching of new Euro IIIB machines - Intense engine pre-buy activity • IMH - Progressive ramp-up of MI products - Operational organization for a new commercial set-up • CE - Launch of the first final TierIV skid-steer - Rental business still growing A lot of progr
Slide 12: Yanmar partnership
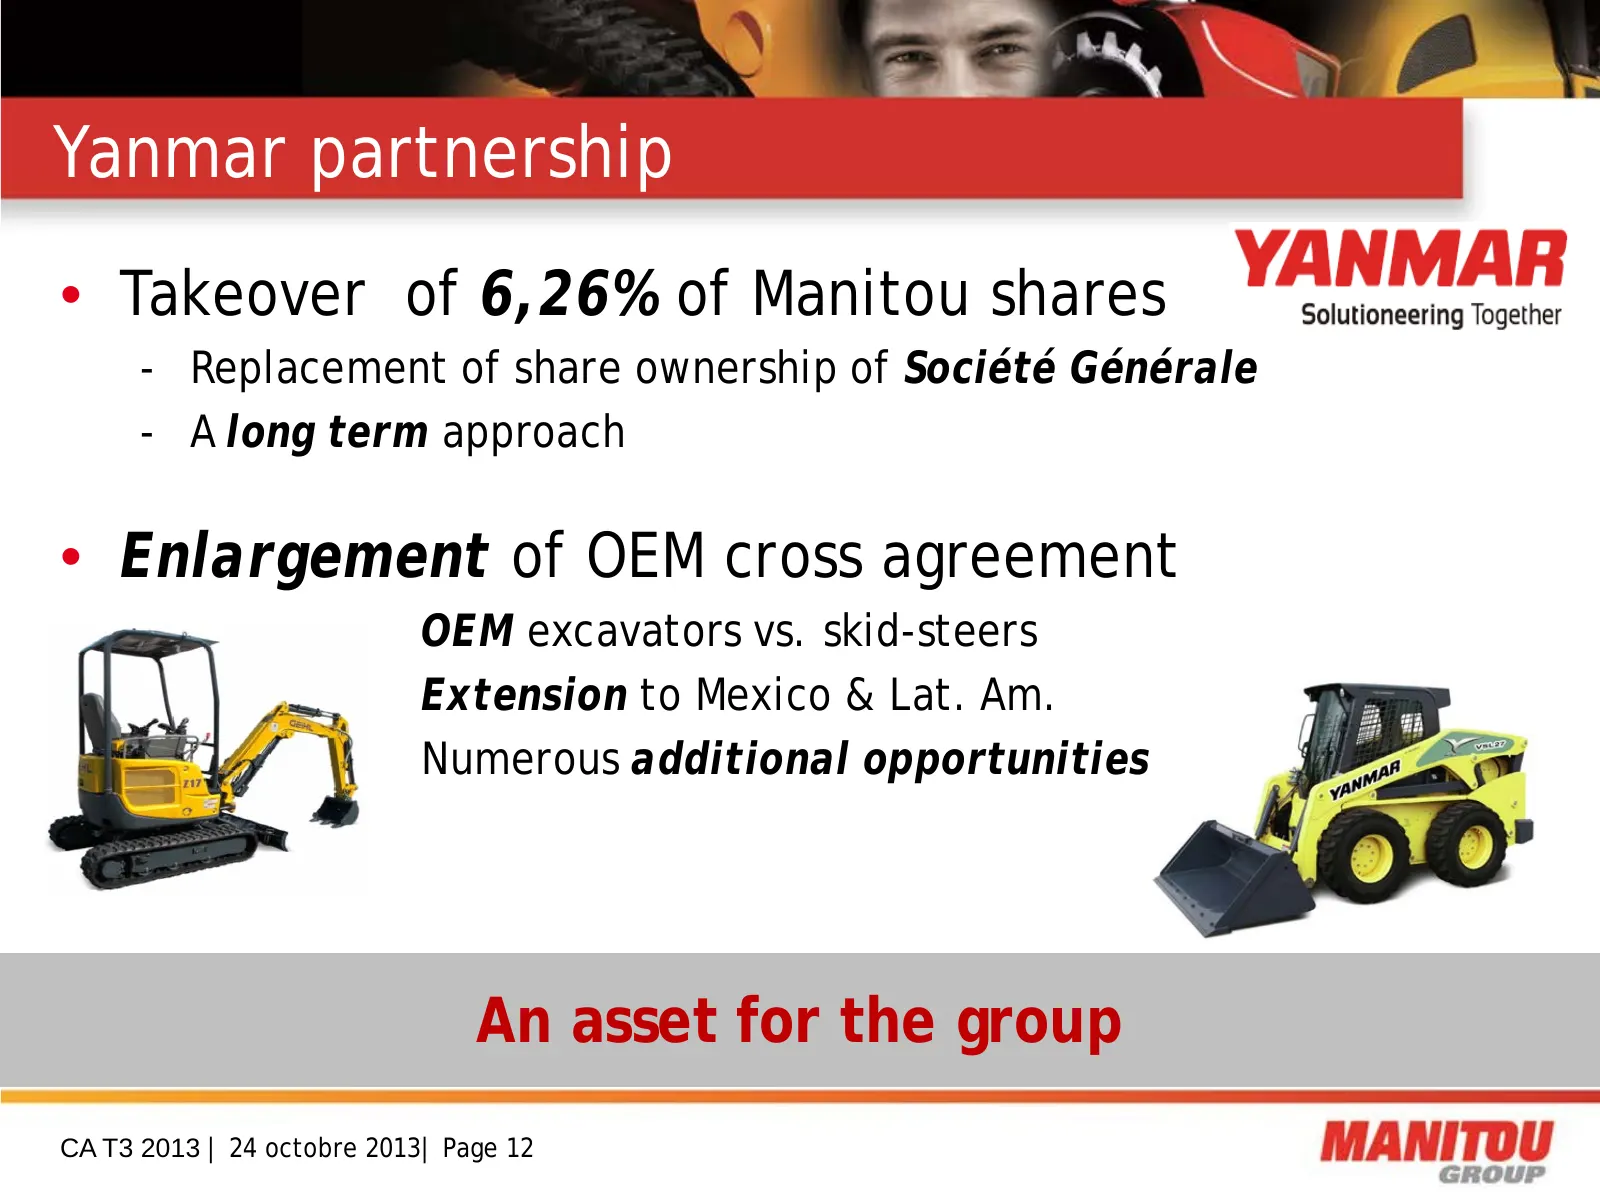
Yanmar partnership • Takeover of 6,26% of Manitou shares - Replacement of share ownership of Société Générale - A long term approach • Enlargement of OEM cross agreement OEM excavators vs. skid-steers Extension to Mexico & Lat. Am. Numerous additional opportunities An asset for the group CA T3 2013
Slide 13: A new process: Reduce
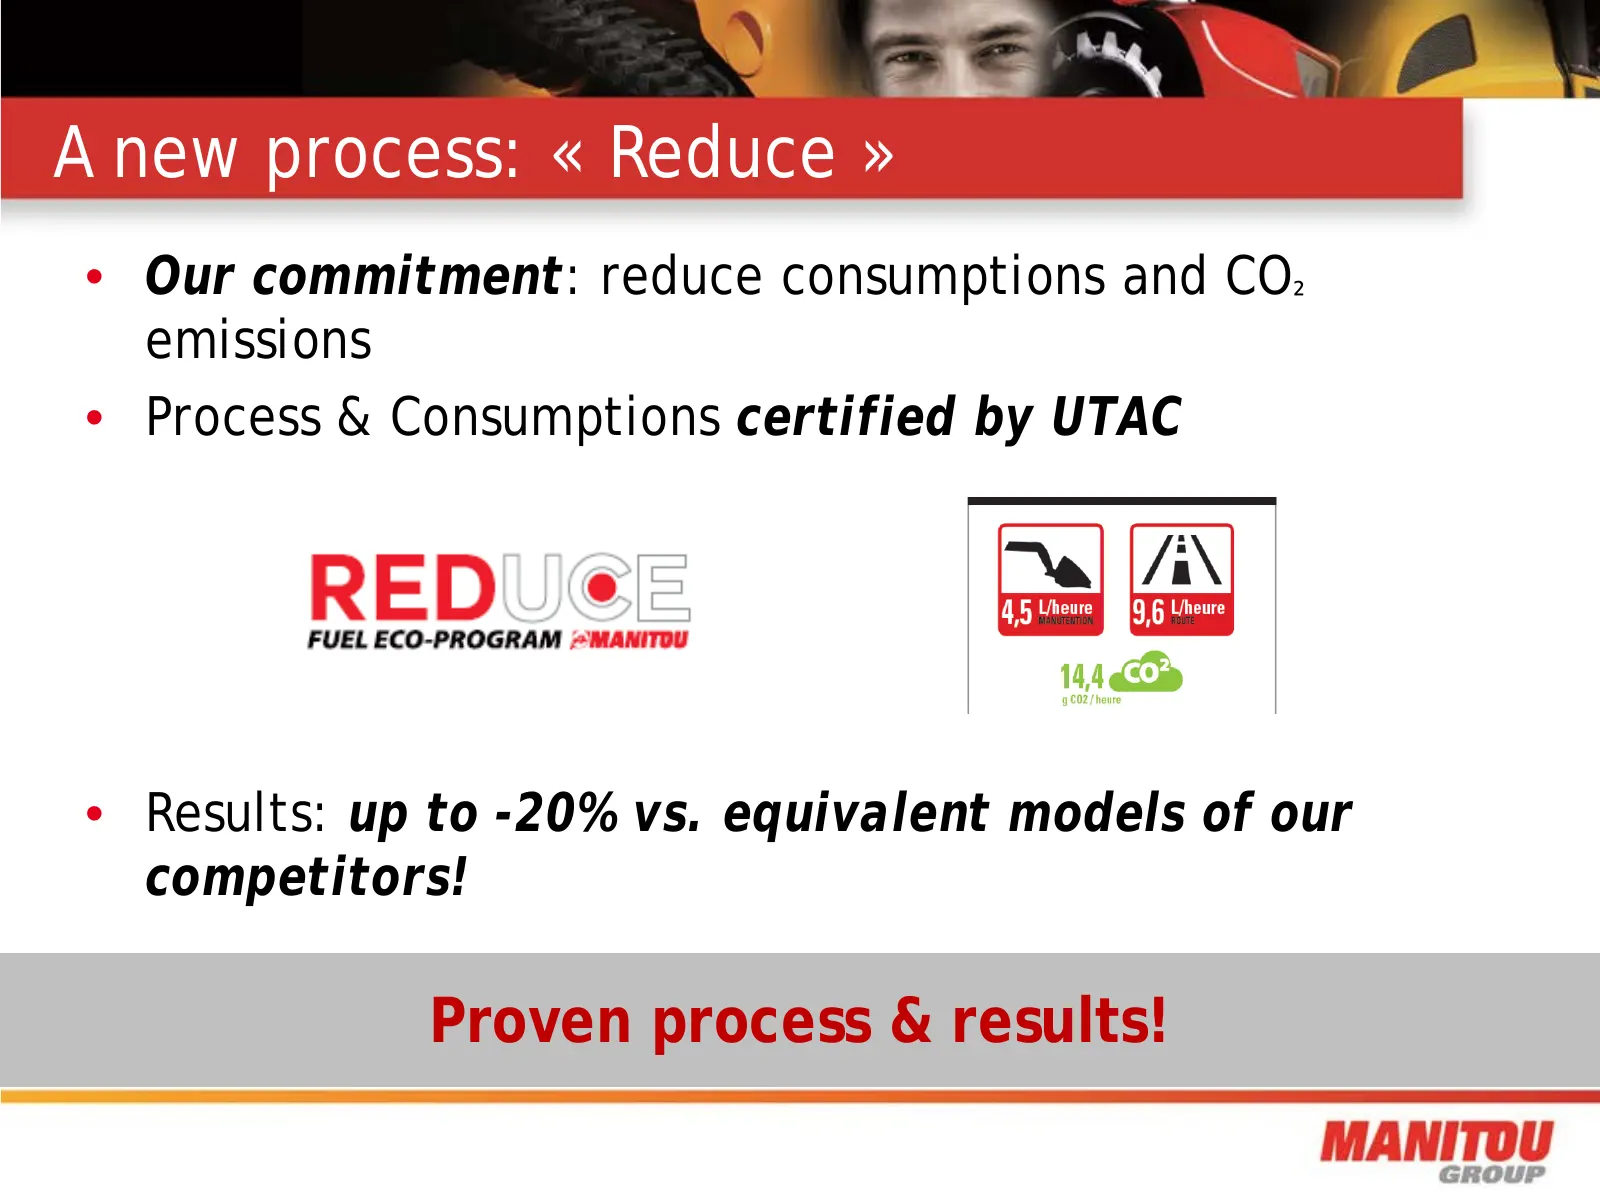
A new process: « Reduce » • Our commitment: reduce consumptions and CO² emissions • Process & Consumptions certified by UTAC • Results: up to -20% vs. equivalent models of our competitors! Proven process & results!

Slide 14: Thank you for your attention
nl Th an k yo u i) r your att en tio n
Source: Internet Archive copy of manitou-group.com
More decks from Manitou BF SA
 H1 2026 Earnings Presentation41 slides · Jul 30, 2026
 H1 2026 Earnings Presentation41 slides · Jul 30, 2026
 Shareholder Meeting (June 2026)95 slides · Jun 25, 2026
 Q1 2026 Earnings Presentation23 slides · Apr 28, 2026
 Q1 2026 Earnings Presentation23 slides · Apr 28, 2026
 FY2025 Earnings Presentation63 slides · Mar 11, 2026