Mindteck (India) Limited · NSE:MINDTECK
Mindteck (India) — Q1 FY2026-27 Earnings Presentation
12 slides from Mindteck (India)'s earnings presentation, Jun 30, 2026

Slide 1: Mindteck Investor Presentation
Mindteck Investor Presentation Quarter ended June 30, 2026 February 11, 2021

Slide 2: Financial Performance
Financial Performance 2
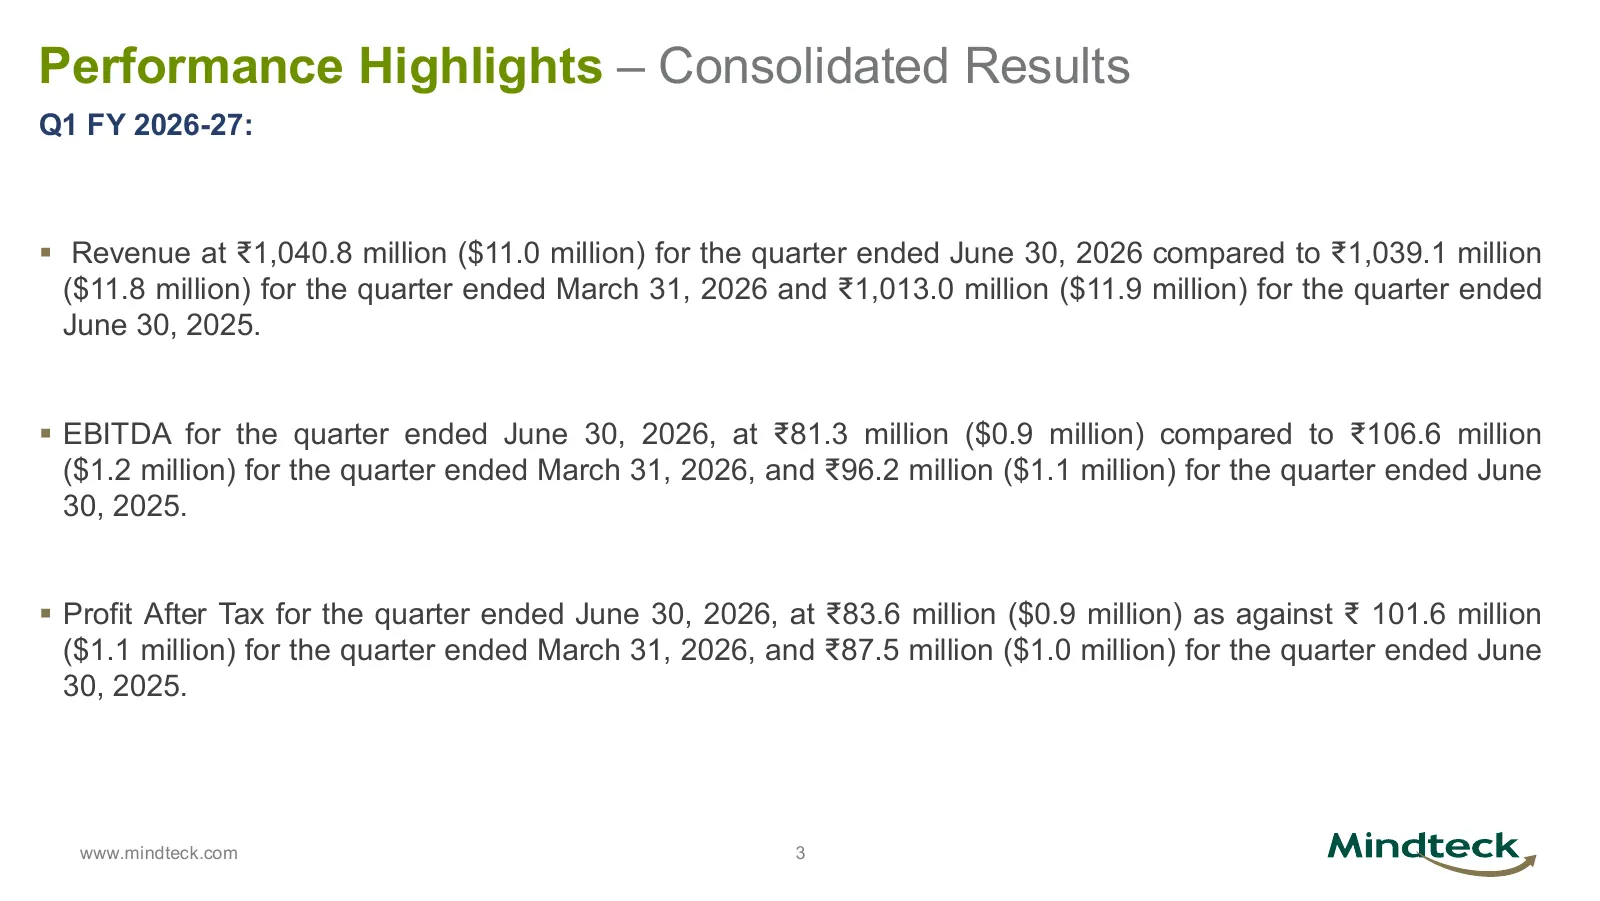
Slide 3: Performance Highlights – Consolidated Results
Performance Highlights – Consolidated Results Q1 FY 2026-27: ▪ Revenue at ₹1,040.8 million ($11.0 million) for the quarter ended June 30, 2026 compared to ₹1,039.1 million ($11.8 million) for the quarter ended March 31, 2026 and ₹1,013.0 million ($11.9 million) for the quarter ended June 30, 2025. ▪
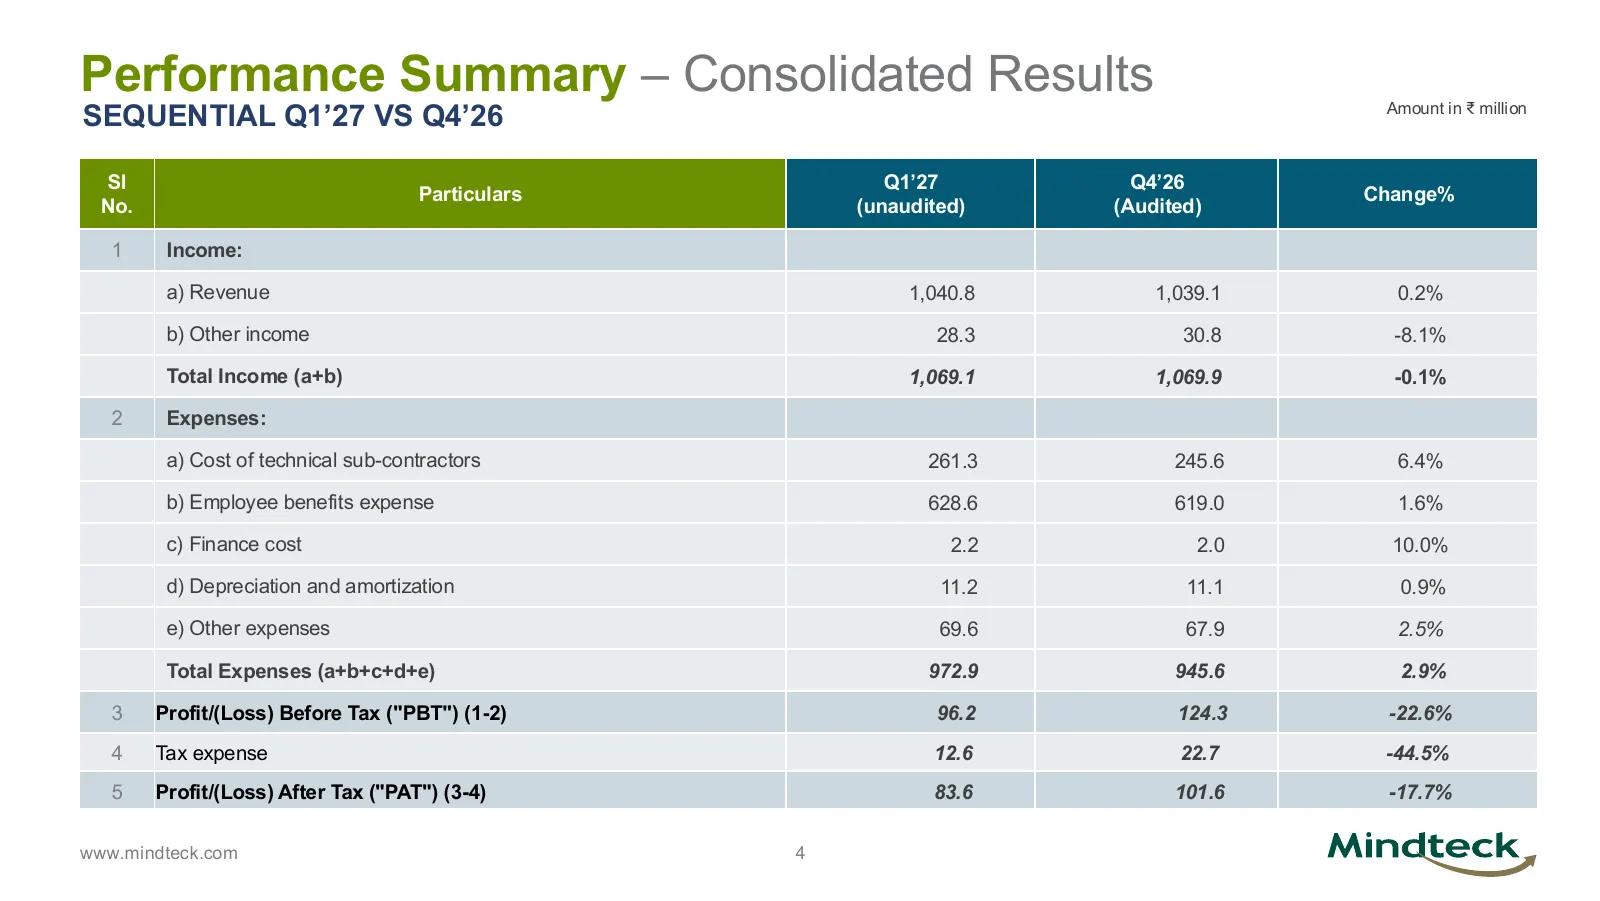
Slide 4: Performance Summary – Consolidated Results (Sequential)
Performance Summary – Consolidated Results SEQUENTIAL Q1’27 VS Q4’26 Amount in ₹ million Sl Q1’27 Q4’26 Particulars Change% No. (unaudited) (Audited) 1 Income: a) Revenue 1,040.8 1,039.1 0.2% b) Other income 28.3 30.8 -8.1% Total Income (a+b) 1,069.1 1,069.9 -0.1% 2 Expenses: a) Cost of technical su
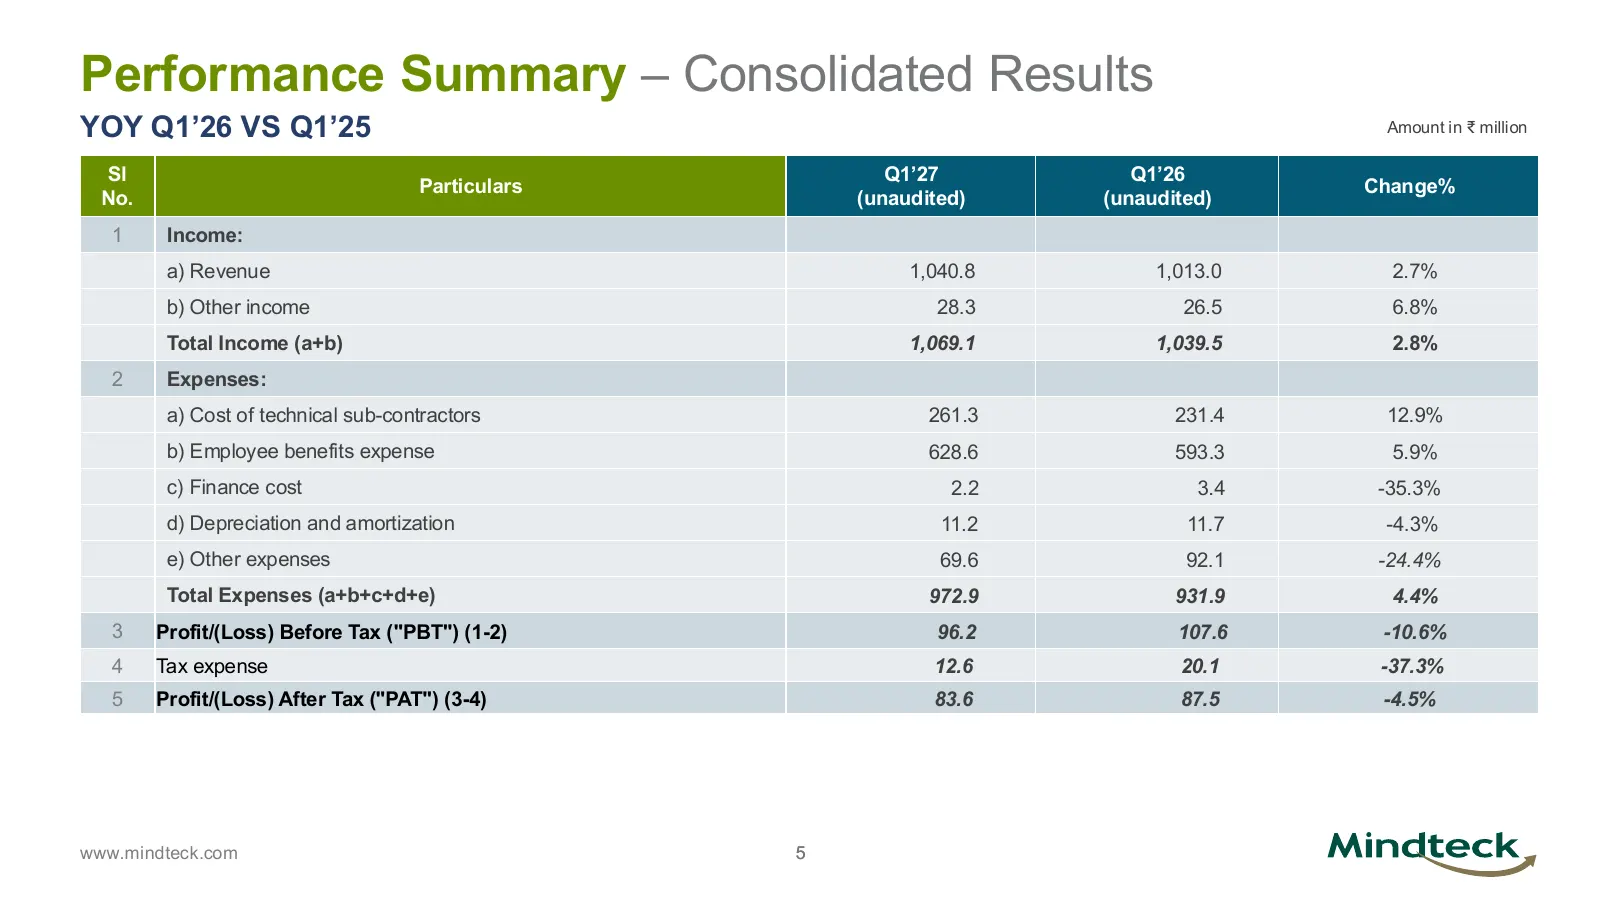
Slide 5: Performance Summary – Consolidated Results (YoY)
Performance Summary – Consolidated Results YOY Q1’26 VS Q1’25 Amount in ₹ million Sl Q1’27 Q1’26 Particulars Change% No. (unaudited) (unaudited) 1 Income: a) Revenue 1,040.8 1,013.0 2.7% b) Other income 28.3 26.5 6.8% Total Income (a+b) 1,069.1 1,039.5 2.8% 2 Expenses: a) Cost of technical sub-contr

Slide 6: Mindteck Fact Sheet
Mindteck Fact Sheet 6
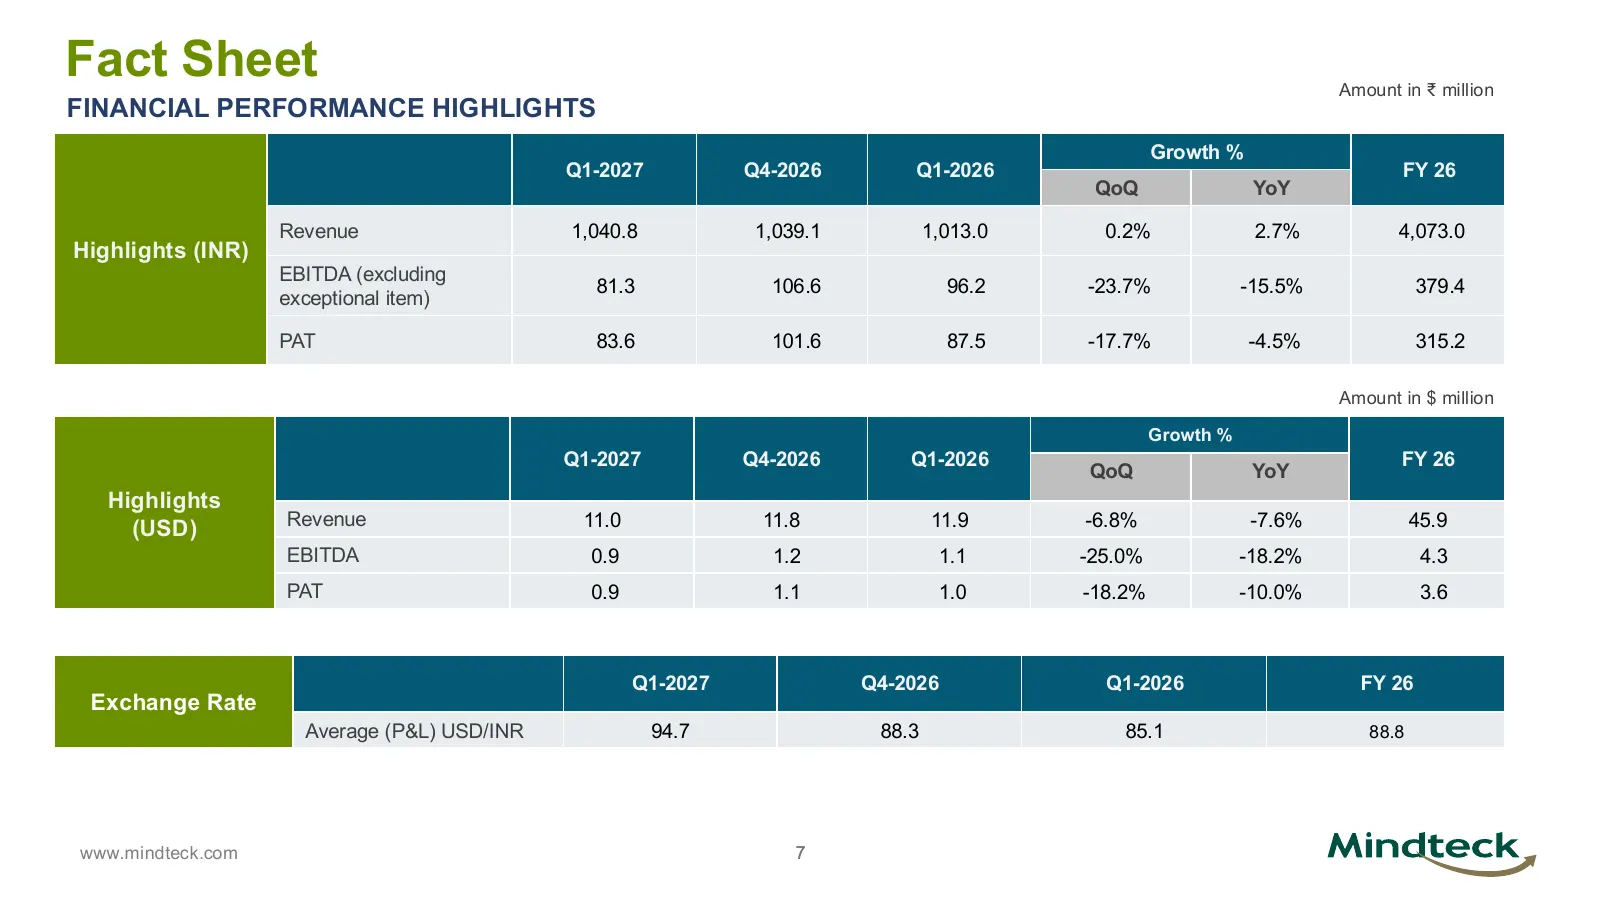
Slide 7: Fact Sheet: Financial Performance Highlights
Fact Sheet Amount in ₹ million FINANCIAL PERFORMANCE HIGHLIGHTS Growth % Q1-2027 Q4-2026 Q1-2026 FY 26 QoQ YoY Revenue 1,040.8 1,039.1 1,013.0 0.2% 2.7% 4,073.0 Highlights (INR) EBITDA (excluding 81.3 106.6 96.2 -23.7% -15.5% 379.4 exceptional item) PAT 83.6 101.6 87.5 -17.7% -4.5% 315.2 Amount in $
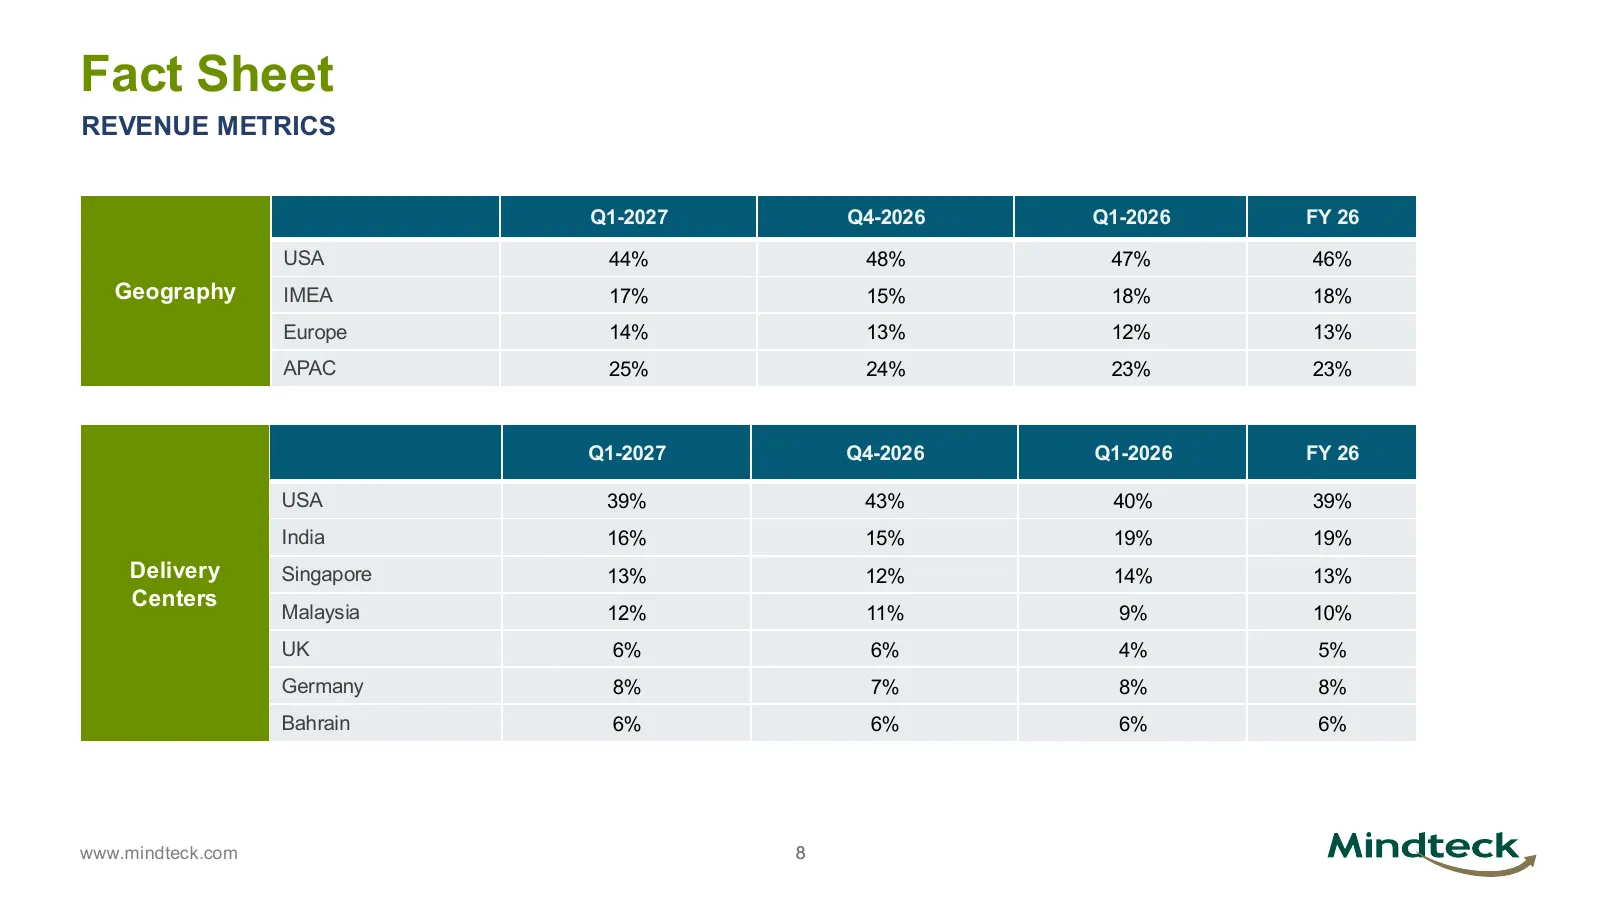
Slide 8: Fact Sheet: Revenue Metrics by Geography and Delivery Center
Fact Sheet REVENUE METRICS Q1-2027 Q4-2026 Q1-2026 FY 26 USA 44% 48% 47% 46% Geography IMEA 17% 15% 18% 18% Europe 14% 13% 12% 13% APAC 25% 24% 23% 23% Q1-2027 Q4-2026 Q1-2026 FY 26 USA 39% 43% 40% 39% India 16% 15% 19% 19% Delivery Singapore 13% 12% 14% 13% Centers Malaysia 12% 11% 9% 10% UK 6% 6%
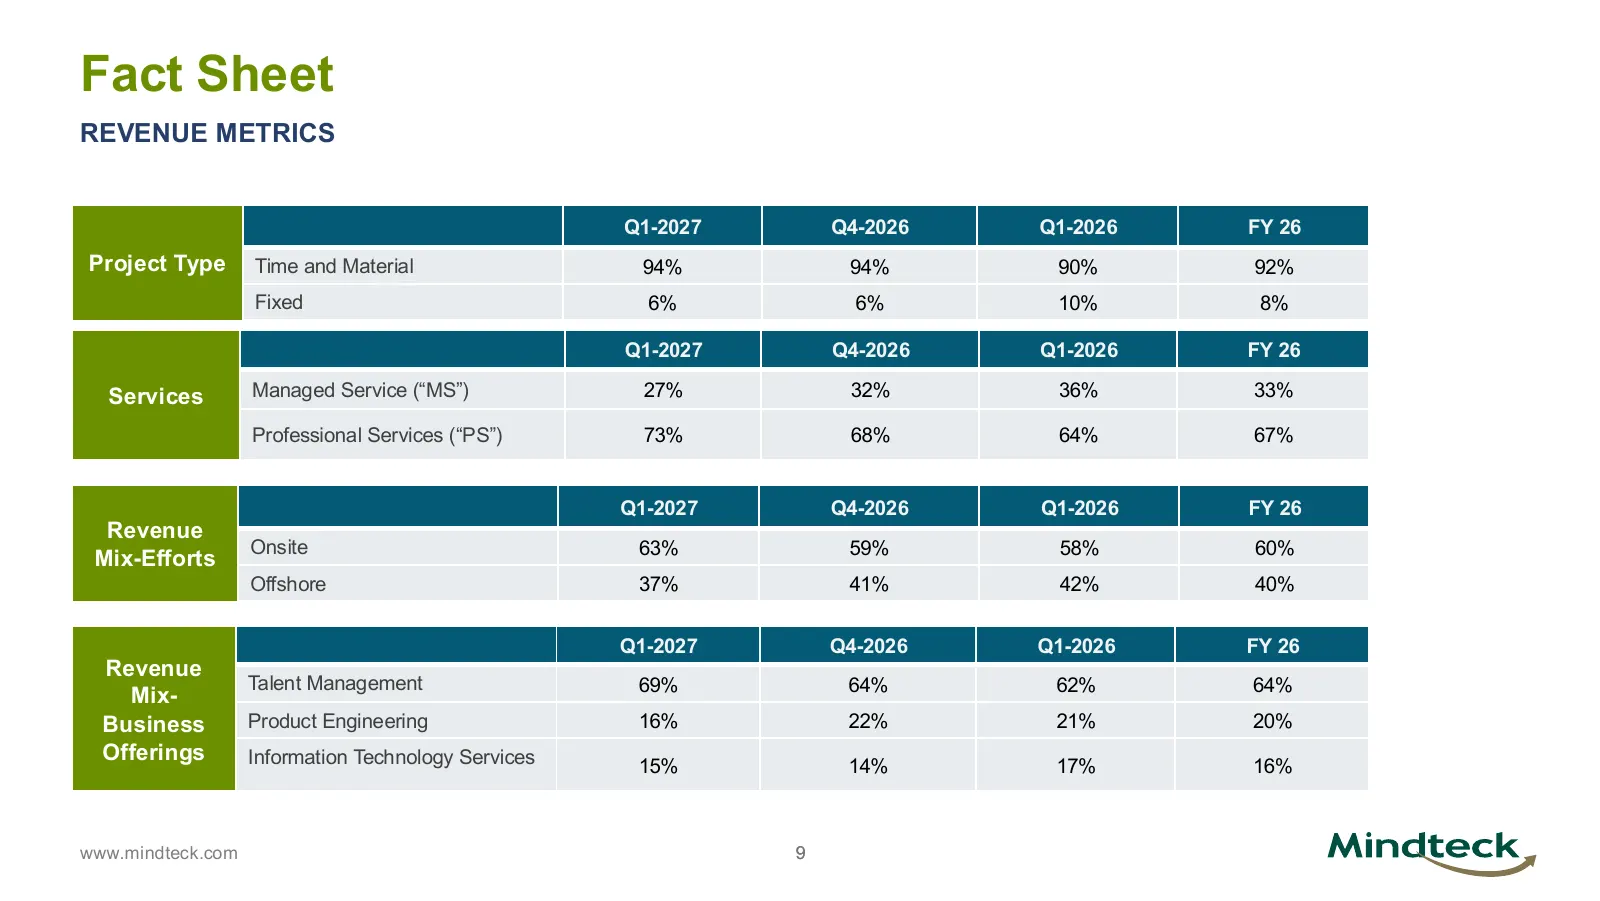
Slide 9: Fact Sheet: Revenue Metrics by Project Type and Service
Fact Sheet REVENUE METRICS Q1-2027 Q4-2026 Q1-2026 FY 26 Project Type Time and Material 94% 94% 90% 92% Fixed 6% 6% 10% 8% Q1-2027 Q4-2026 Q1-2026 FY 26 Services Managed Service (“MS”) 27% 32% 36% 33% Professional Services (“PS”) 73% 68% 64% 67% Q1-2027 Q4-2026 Q1-2026 FY 26 Revenue Onsite 63% 59% 5
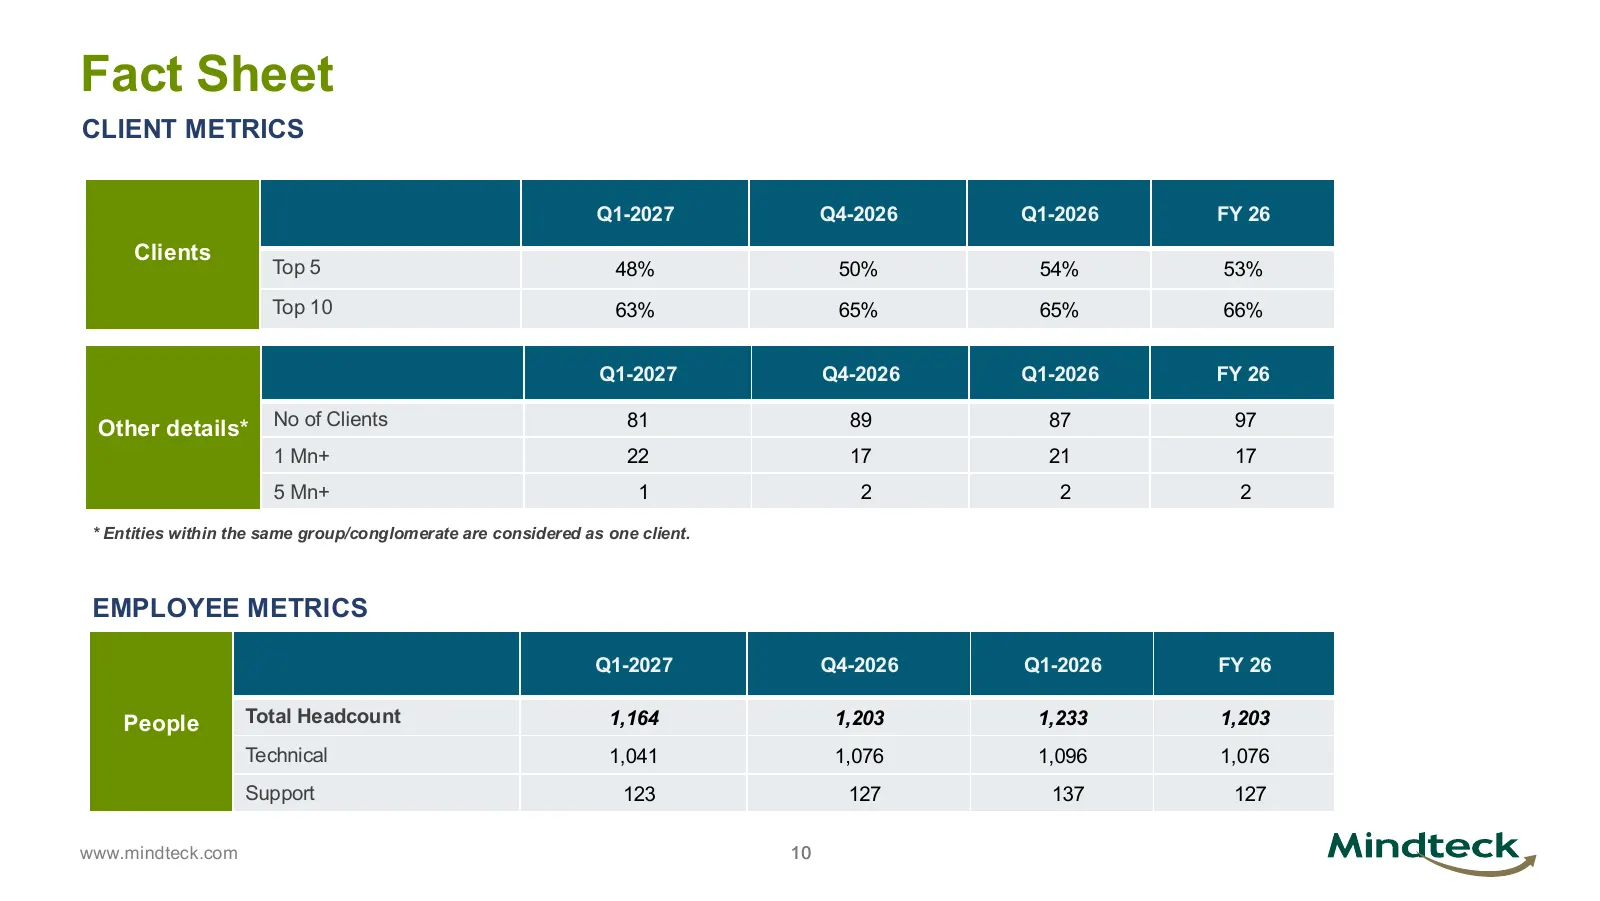
Slide 10: Fact Sheet: Client and Employee Metrics
Fact Sheet CLIENT METRICS Q1-2027 Q4-2026 Q1-2026 FY 26 Clients Top 5 48% 50% 54% 53% Top 10 63% 65% 65% 66% Q1-2027 Q4-2026 Q1-2026 FY 26 Other details* No of Clients 81 89 87 97 1 Mn+ 22 17 21 17 5 Mn+ 1 2 2 2 * Entities within the same group/conglomerate are considered as one client. EMPLOYEE MET

Slide 11: Thank You
© 2026 Mindteck. All Rights Reserved. www.mindteck.com Thank You

Slide 12: Please contact us
Please contact us Mr. Santosh K. Nandiyath Chief Financial Officer If you have any questions, Email: santosh.nandiyath@mindteck.com or need assistance: Telephone: +91 80 4154 8000 © 2026 Mindteck. All Rights Reserv ed. www.mindteck.com
Source: company website
More decks from Mindteck (India) Limited
 Q4 FY2024-25 Earnings Presentation13 slides · Mar 31, 2025
 Q2 FY2024-25 Earnings Presentation13 slides · Sep 30, 2024
 Q1 FY2024-25 Earnings Presentation12 slides · Jun 30, 2024
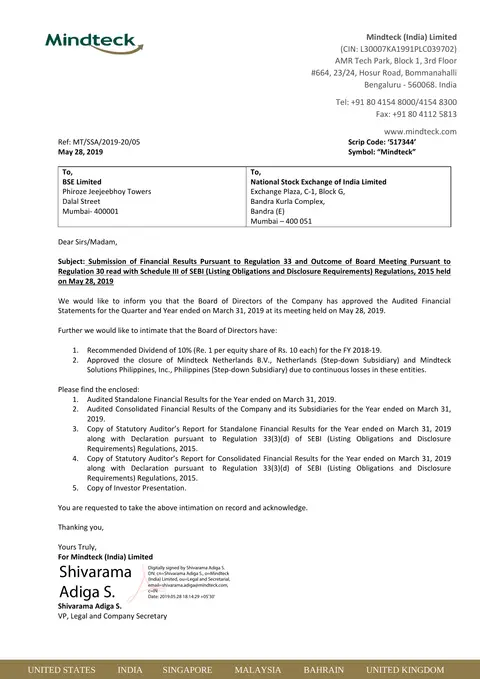 Q4 FY2019 Earnings Presentation25 slides · May 28, 2019
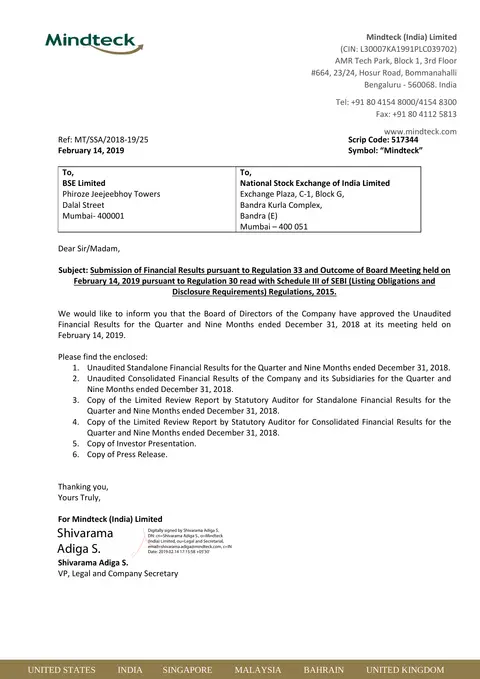 Q3 FY2019 Earnings Presentation22 slides · Feb 14, 2019
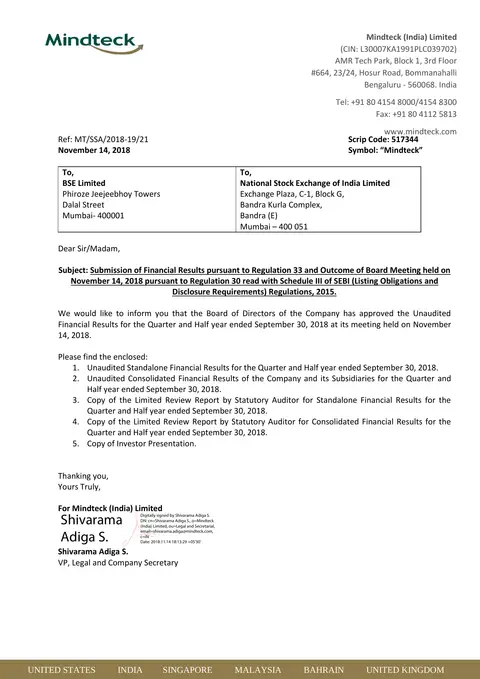 Q2 FY2019 Earnings Presentation22 slides · Nov 14, 2018