Heartland Financial USA — Investor Presentation (August 2014)
50 slides from Heartland Financial USA's investor presentation, Aug 29, 2014
Slide 1: Investor Presentation July 2014
Investor Presentation July 2014 Lynn B. Fuller Chairman, President and CEO Trading Symbol: HTLF | www.htlf.com
Slide 2: Safe Harbor
Page 2 This presentation may contain, and future oral and written statements of the Company and its management may contain, forward-looking statements within the meaning of the Private Securities Litigation Reform Act of 1995 with respect to the financial condition, results of operations, plans, obj
Slide 3: Agenda
Page 3 Agenda Heartland’s growth story Key tenets of Heartland’s business model Financial Highlights
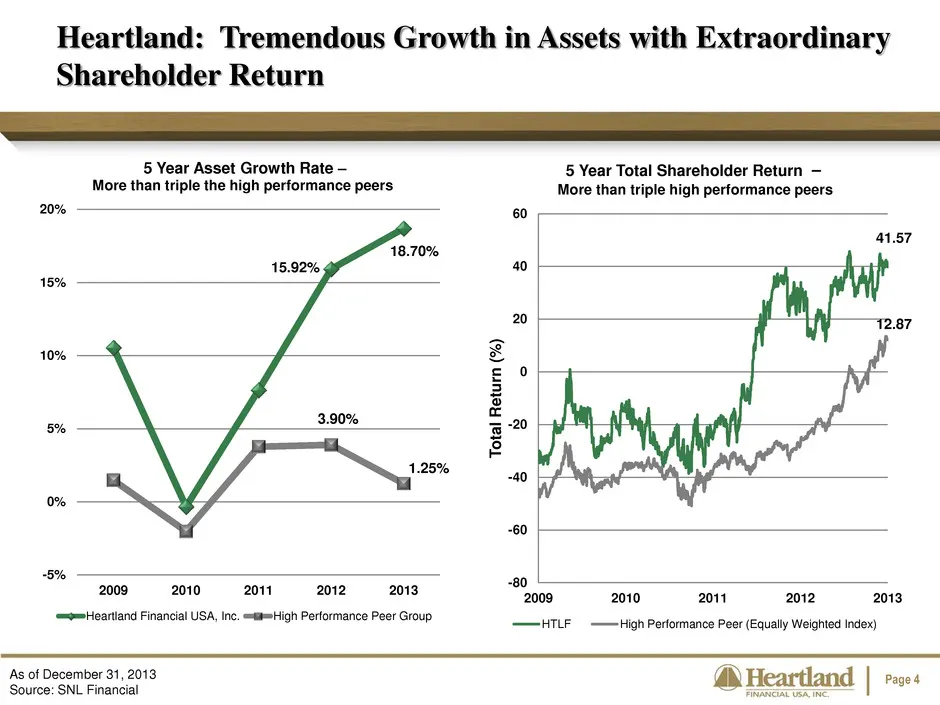
Slide 4: Tremendous Growth in Assets with Extraordinary Shareholder Return
Page 4 Heartland: Tremendous Growth in Assets with Extraordinary Shareholder Return As of December 31, 2013 Source: SNL Financial 41.57 12.87 -80 -60 -40 -20 0 20 40 60 2009 2010 2011 2012 2013 T o ta l Return ( % ) 5 Year Total Shareholder Return – More than triple high performance peers HTLF High
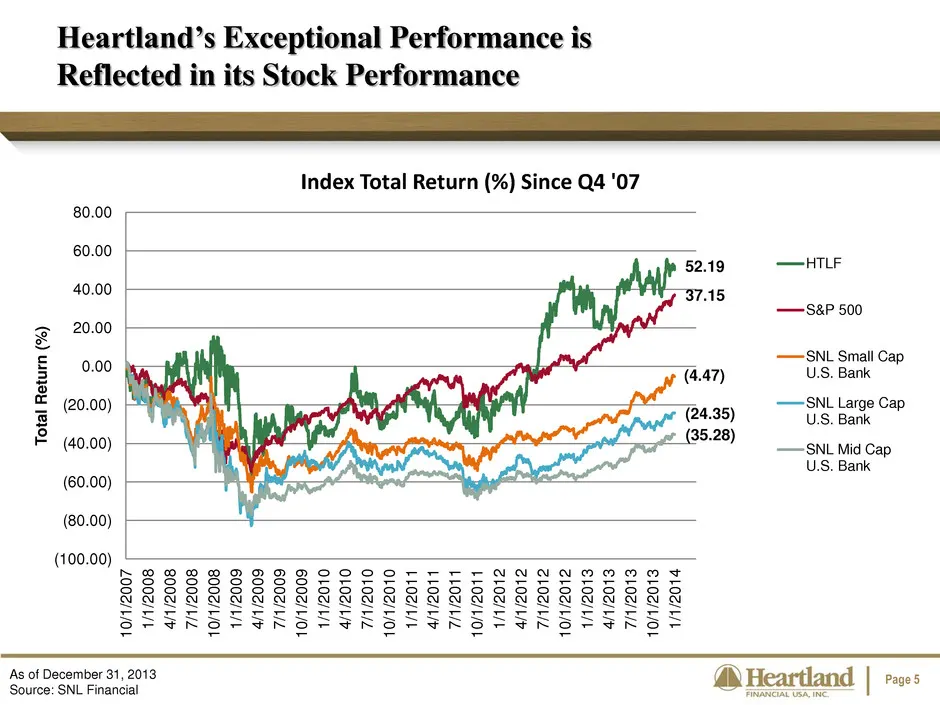
Slide 5: Exceptional Performance Reflected in Stock Performance
Page 5 Heartland’s Exceptional Performance is Reflected in its Stock Performance 52.19 37.15 (4.47) (24.35) (35.28) (100.00) (80.00) (60.00) (40.00) (20.00) 0.00 20.00 40.00 60.00 80.00 10 /1 /2 00 7 1/ 1/ 20 08 4/ 1/ 20 08 7/ 1/ 20 08 10 /1 /2 00 8 1/ 1/ 20 09 4/ 1/ 20 09 7/ 1/ 20 09 10 /1 /2 00 9
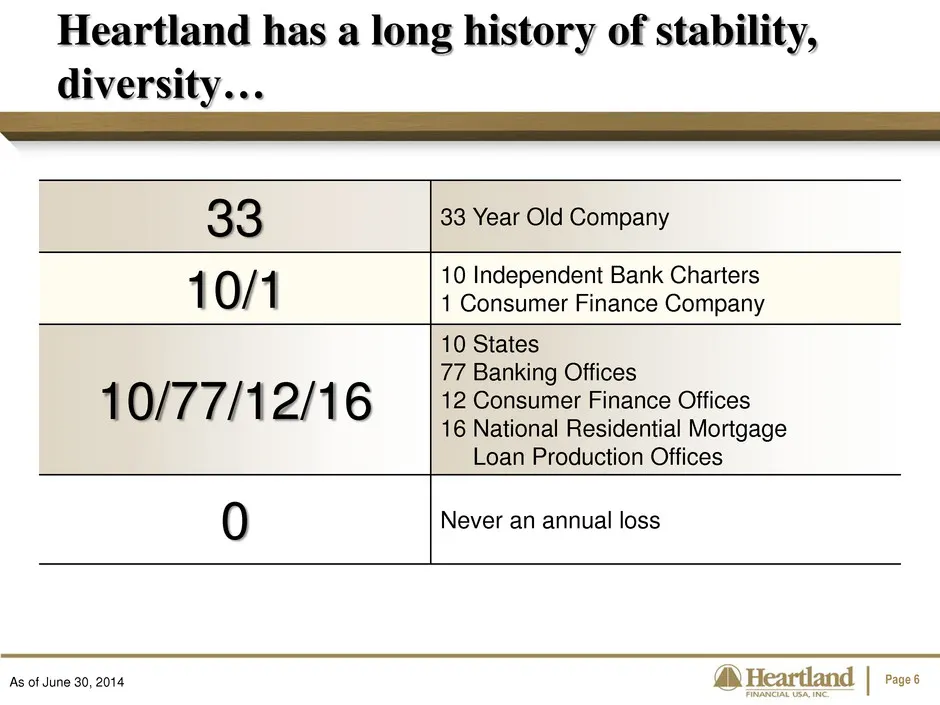
Slide 6: Heartland long history of stability, diversity
Page 6 33 33 Year Old Company 10/1 10 Independent Bank Charters 1 Consumer Finance Company 10/77/12/16 10 States 77 Banking Offices 12 Consumer Finance Offices 16 National Residential Mortgage Loan Production Offices 0 Never an annual loss Heartland has a long history of stability, diversity… As of
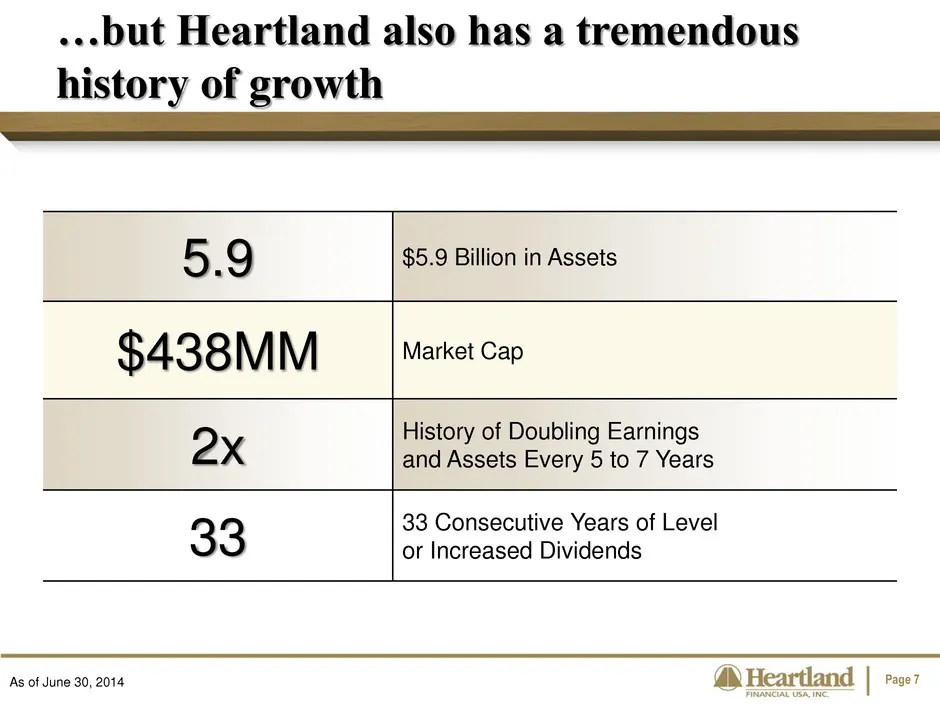
Slide 7: Tremendous history of growth
Page 7 5.9 $5.9 Billion in Assets $438MM Market Cap 2x History of Doubling Earnings and Assets Every 5 to 7 Years 33 33 Consecutive Years of Level or Increased Dividends …but Heartland also has a tremendous history of growth As of June 30, 2014
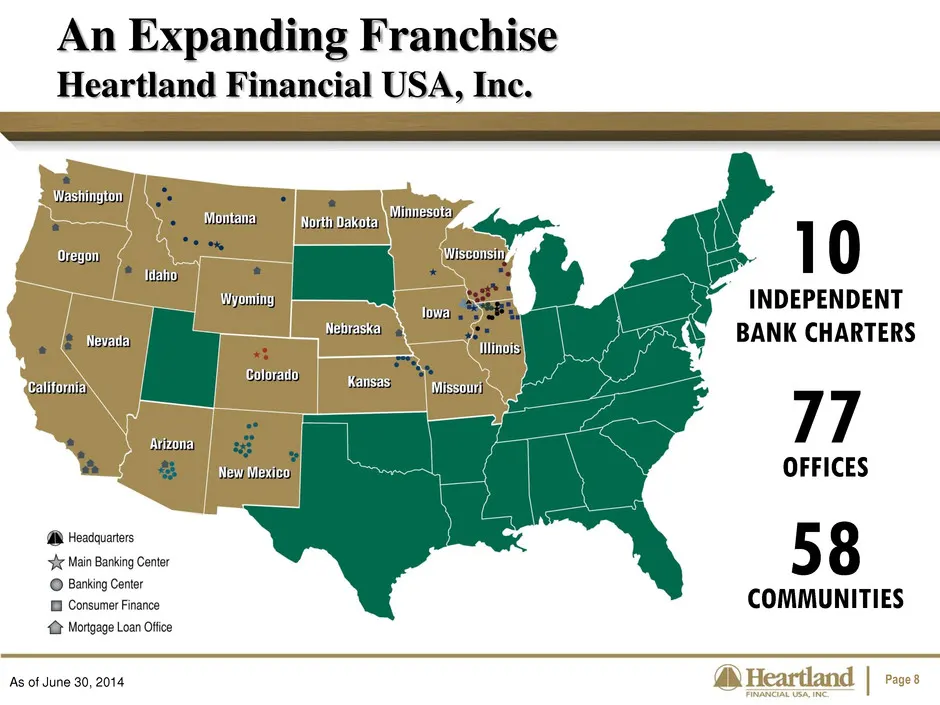
Slide 8: An Expanding Franchise
Page 8 An Expanding Franchise Heartland Financial USA, Inc. 10 INDEPENDENT BANK CHARTERS 77 OFFICES 58 COMMUNITIES As of June 30, 2014
Slide 9: Expansion Timeline
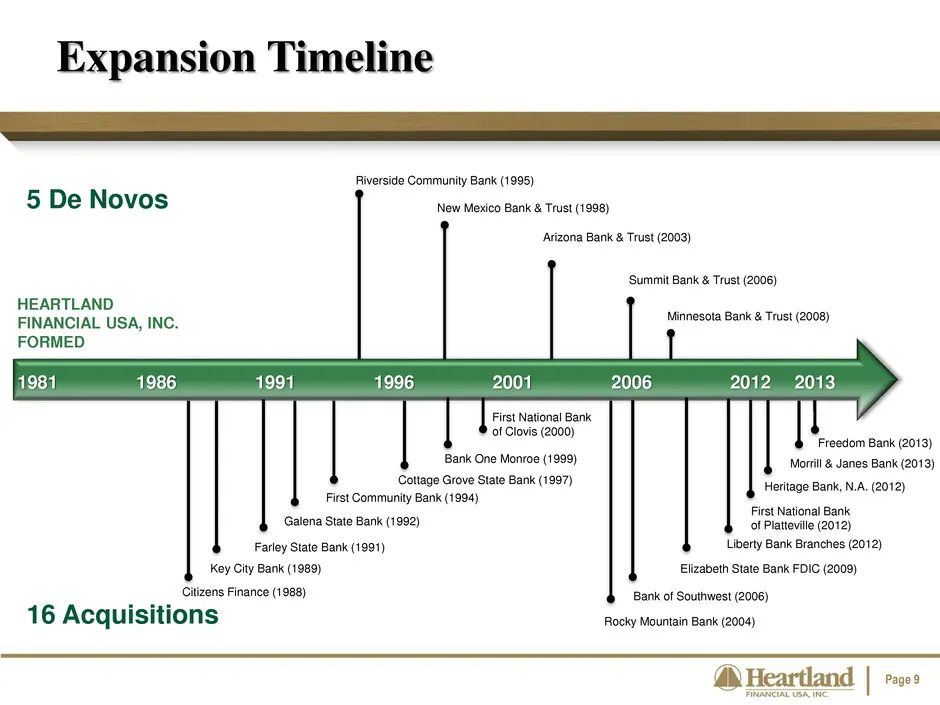
Page 9 Expansion Timeline 1981 1986 1991 1996 2001 2006 2012 Citizens Finance (1988) Key City Bank (1989) Farley State Bank (1991) Galena State Bank (1992) First Community Bank (1994) Cottage Grove State Bank (1997) Bank One Monroe (1999) First National Bank of Clovis (2000) Rocky Mountain Bank (200
Slide 10: Core competencies in M&A
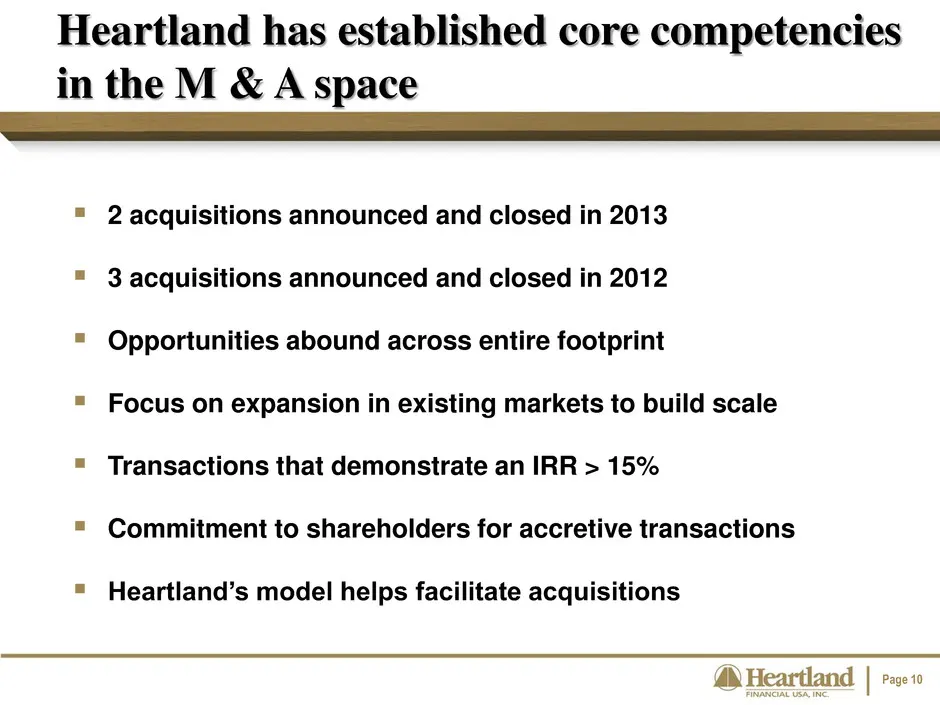
Page 10 2 acquisitions announced and closed in 2013 3 acquisitions announced and closed in 2012 Opportunities abound across entire footprint Focus on expansion in existing markets to build scale Transactions that demonstrate an IRR > 15% Commitment to shareholders for accretive transacti
Slide 11: Morrill Bancshares Acquisition
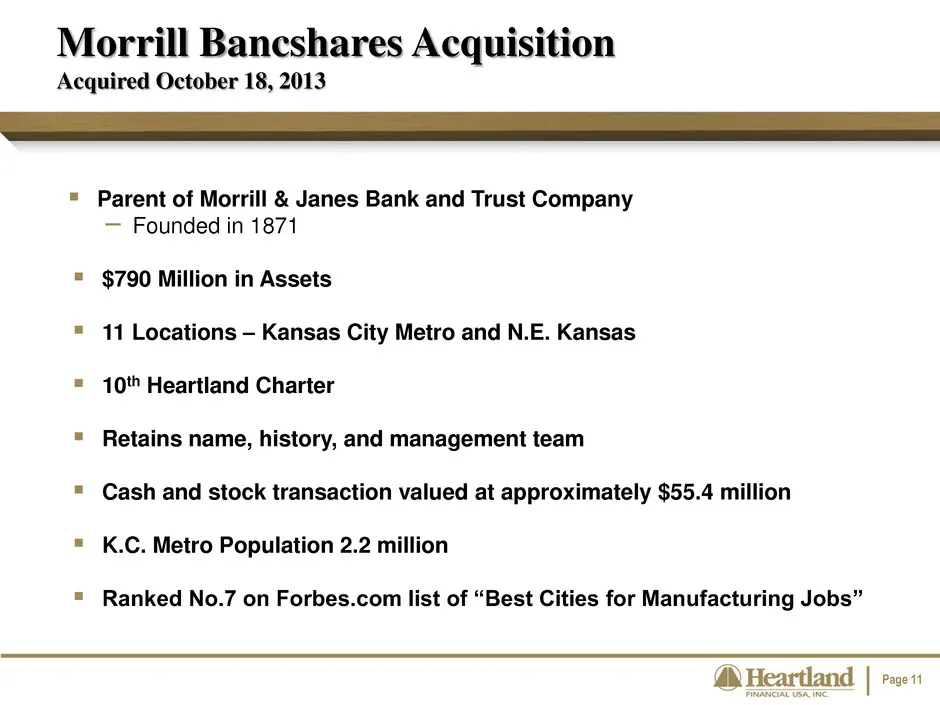
Page 11 Parent of Morrill & Janes Bank and Trust Company − Founded in 1871 $790 Million in Assets 11 Locations – Kansas City Metro and N.E. Kansas 10th Heartland Charter Retains name, history, and management team Cash and stock transaction valued at approximately $55.4 million K.C. Met
Slide 12: Market Overview: Expanding in High Growth Markets
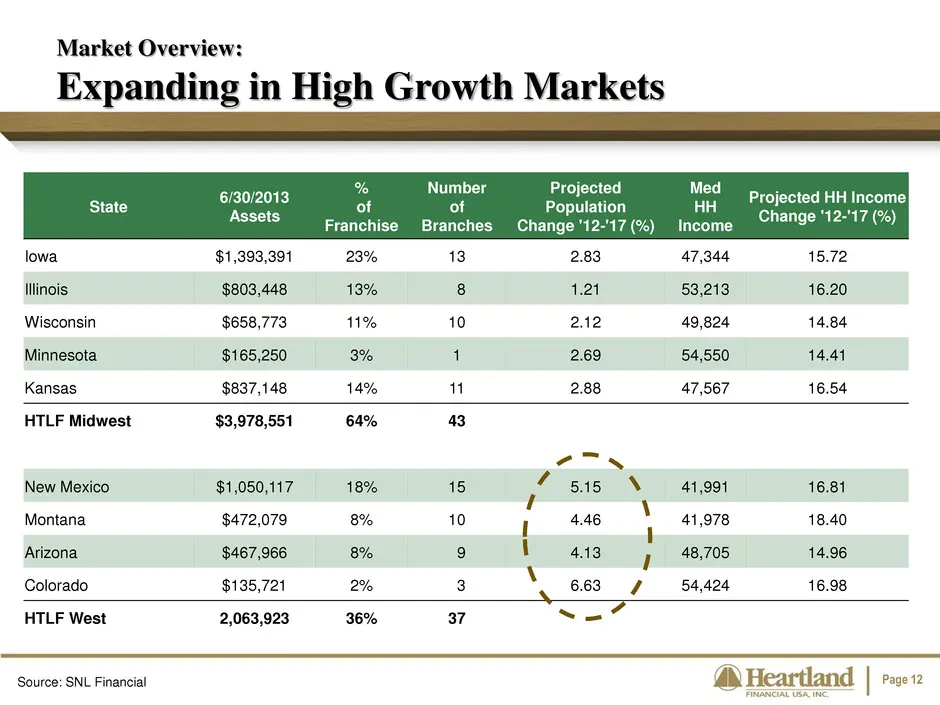
Page 12 Market Overview: Expanding in High Growth Markets State 6/30/2013 Assets % of Franchise Number of Branches Projected Population Change '12-'17 (%) Med HH Income Projected HH Income Change '12-'17 (%) Iowa $1,393,391 23% 13 2.83 47,344 15.72 Illinois $803,448 13% 8 1.21 53,213 16.20 Wisconsin
Slide 13: Asset and Earnings Growth
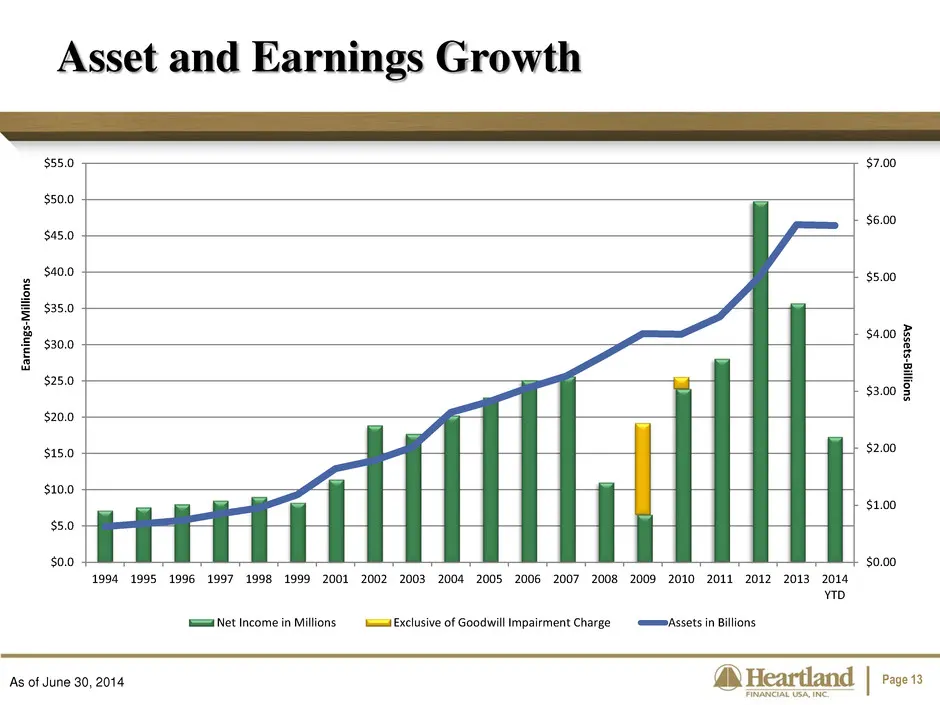
Page 13 Asset and Earnings Growth As of June 30, 2014 $0.00 $1.00 $2.00 $3.00 $4.00 $5.00 $6.00 $7.00 $0.0 $5.0 $10.0 $15.0 $20.0 $25.0 $30.0 $35.0 $40.0 $45.0 $50.0 $55.0 1994 1995 1996 1997 1998 1999 2001 2002 2003 2004 2005 2006 2007 2008 2009 2010 2011 2012 2013 2014 YTD A sset s-B illio n s Ea
Slide 14: Heartland EPS
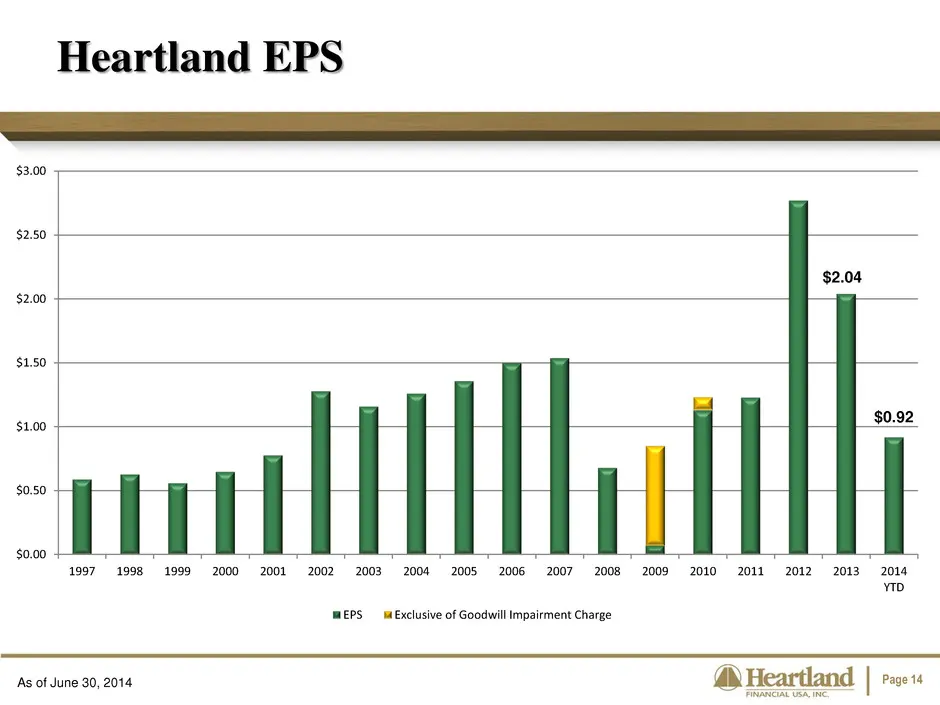
Page 14 Heartland EPS As of June 30, 2014 $2.04 $0.92 $0.00 $0.50 $1.00 $1.50 $2.00 $2.50 $3.00 1997 1998 1999 2000 2001 2002 2003 2004 2005 2006 2007 2008 2009 2010 2011 2012 2013 2014 YTD EPS Exclusive of Goodwill Impairment Charge
Slide 15: Tangible Book Value
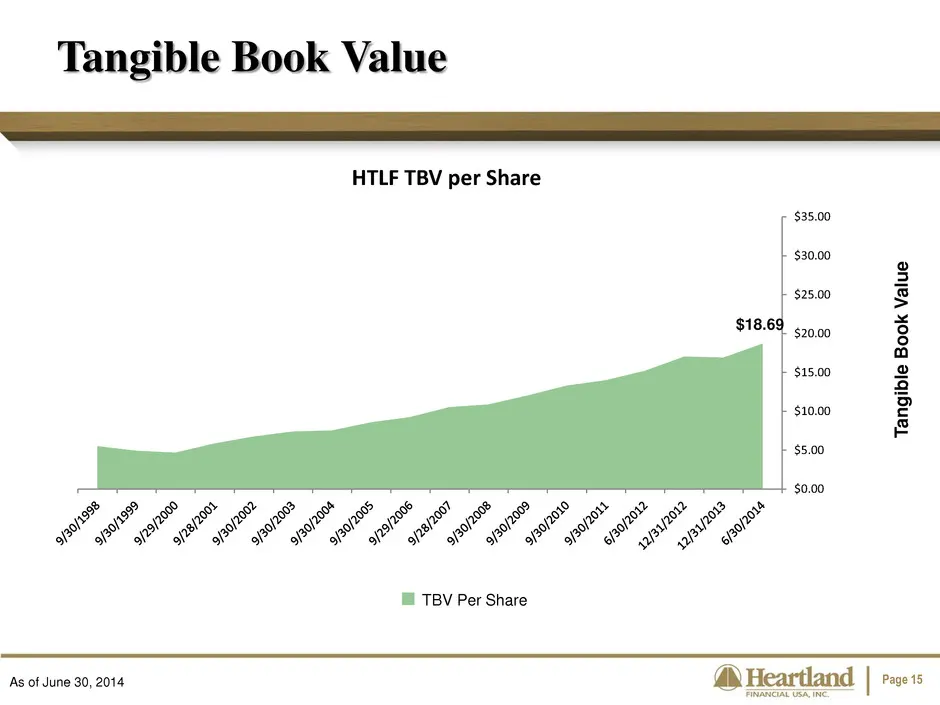
Page 15 Tangible Book Value As of June 30, 2014 T a n g ib le B o o k V a lu e TBV Per Share $18.69 $0.00 $5.00 $10.00 $15.00 $20.00 $25.00 $30.00 $35.00 HTLF TBV per Share
Slide 16: Price to TBV
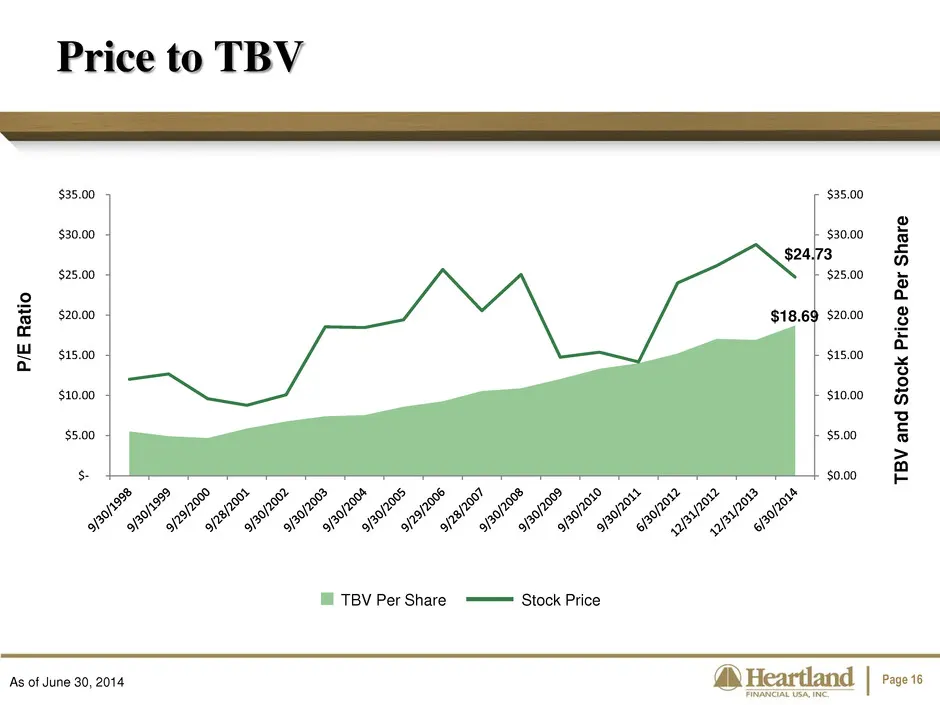
Page 16 Price to TBV As of June 30, 2014 T B V a n d St o ck P ri ce Pe r S h a re TBV Per Share Stock Price $18.69 $24.73 $- $5.00 $10.00 $15.00 $20.00 $25.00 $30.00 $35.00 $0.00 $5.00 $10.00 $15.00 $20.00 $25.00 $30.00 $35.00 P /E R at io
Slide 17: Price to TBV and Price to Earnings
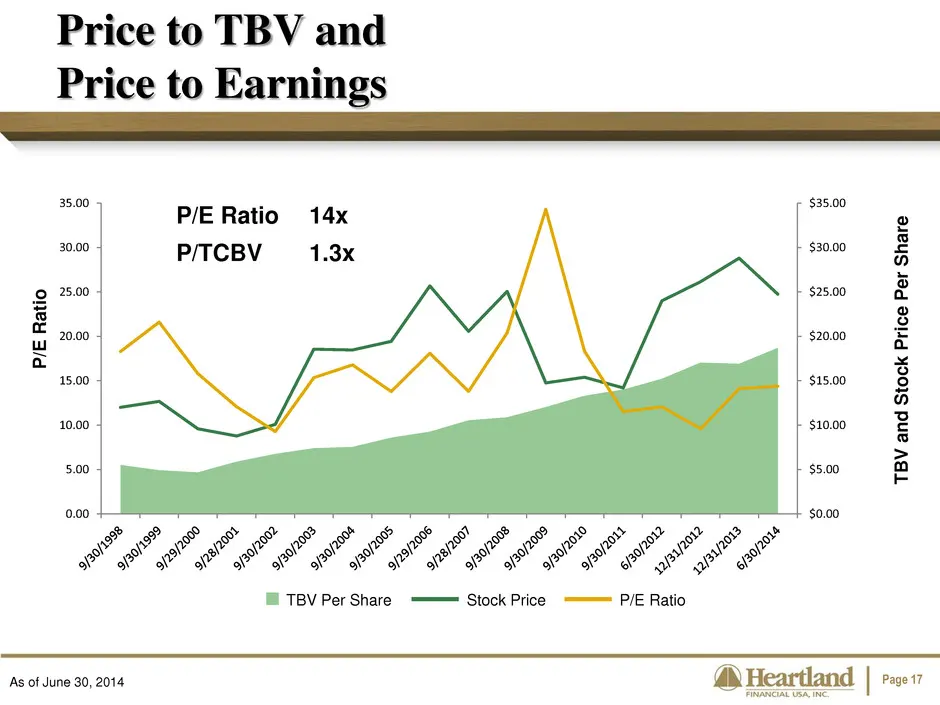
Page 17 Price to TBV and Price to Earnings As of June 30, 2014 T B V a n d St o ck P ri ce Pe r S h a re TBV Per Share Stock Price P/E Ratio P/E Ratio 14x P/TCBV 1.3x P /E R at io 0.00 5.00 10.00 15.00 20.00 25.00 30.00 35.00 $0.00 $5.00 $10.00 $15.00 $20.00 $25.00 $30.00 $35.00
Slide 18: Dividend Payout Goal and History
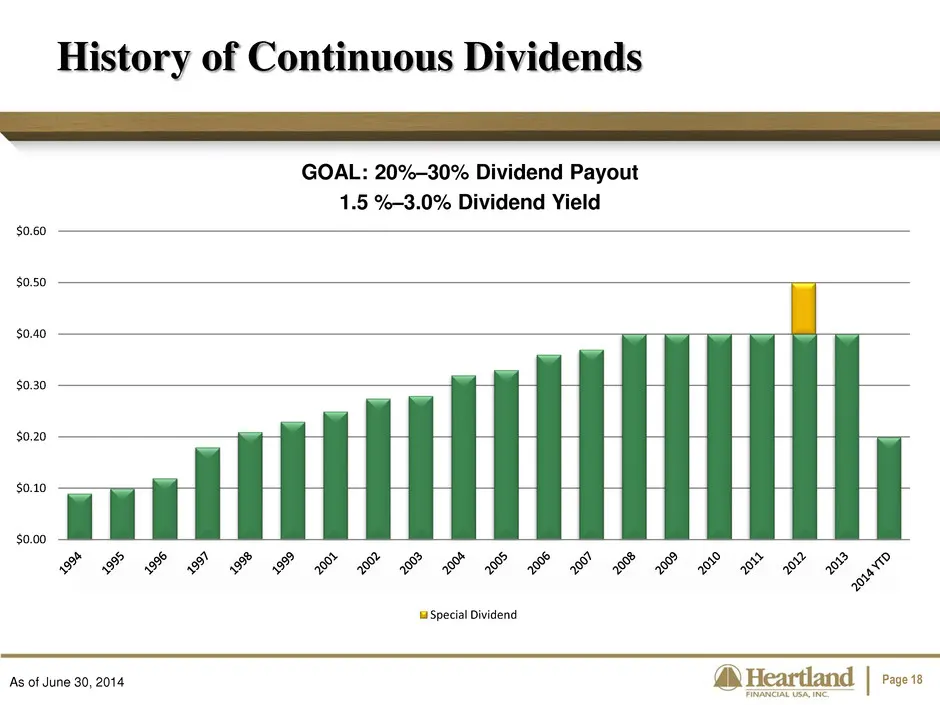
Page 18 GOAL: 20%–30% Dividend Payout 1.5 %–3.0% Dividend Yield History of Continuous Dividends As of June 30, 2014 $0.00 $0.10 $0.20 $0.30 $0.40 $0.50 $0.60 Special Dividend
Slide 19: Agenda
Page 19 Agenda Heartland’s growth story Key tenets of Heartland’s business model Financial Highlights
Slide 20: Three Core Principles: Local Bank Delivery
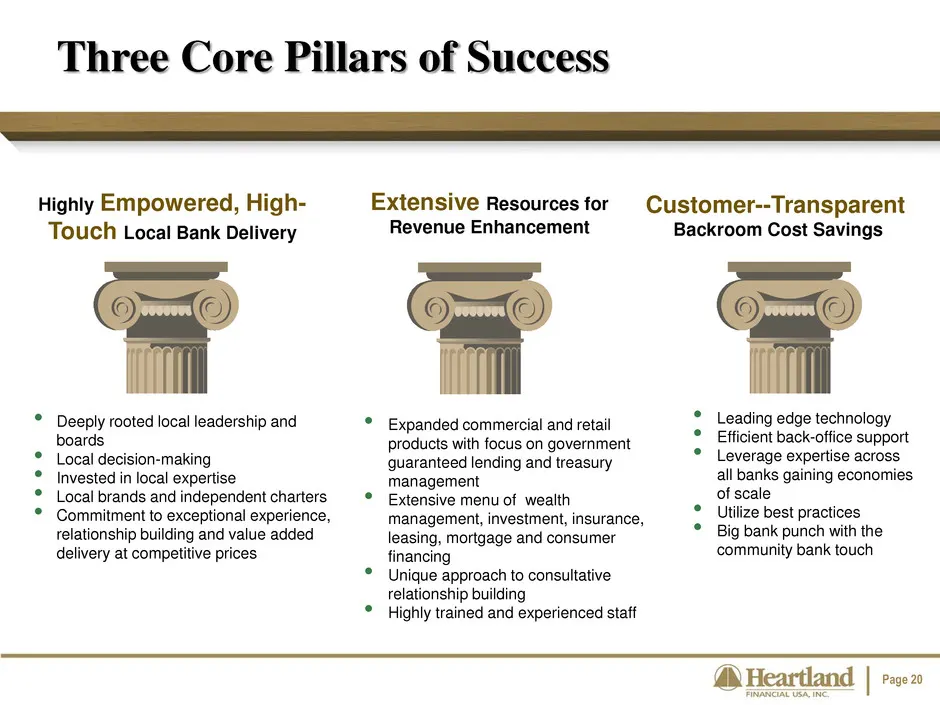
Page 20 Highly Empowered, High- Touch Local Bank Delivery • Deeply rooted local leadership and boards • Local decision-making • Invested in local expertise • Local brands and independent charters • Commitment to exceptional experience, relationship building and value added delivery at competitive pr
Slide 21: Primary Target Markets
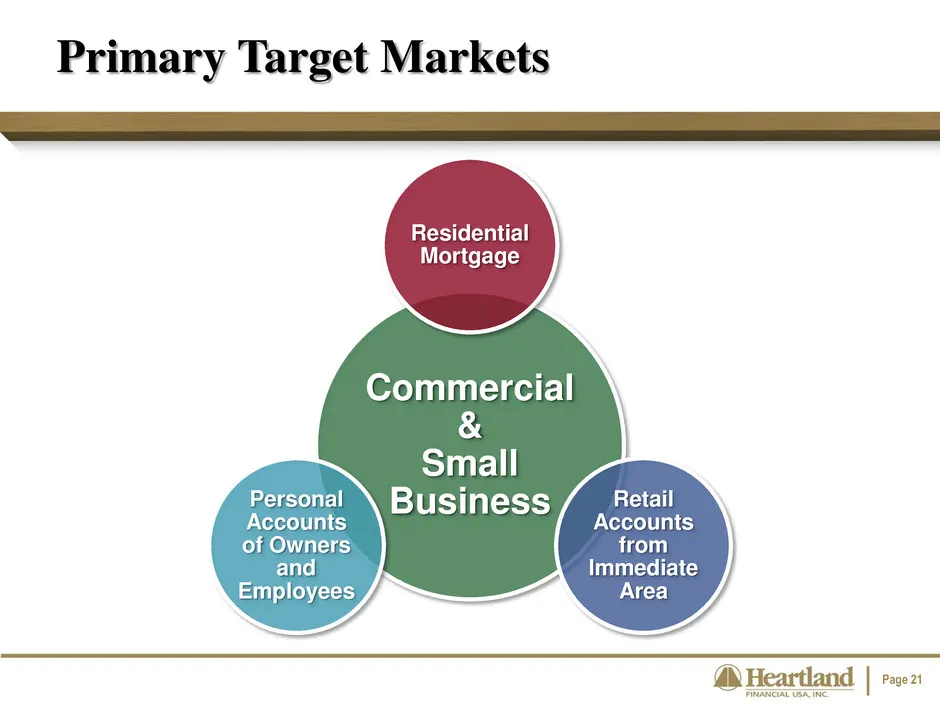
Page 21 Commercial & Small Business Residential Mortgage Retail Accounts from Immediate Area Personal Accounts of Owners and Employees Primary Target Markets
Slide 22: 5 Primary Business Lines
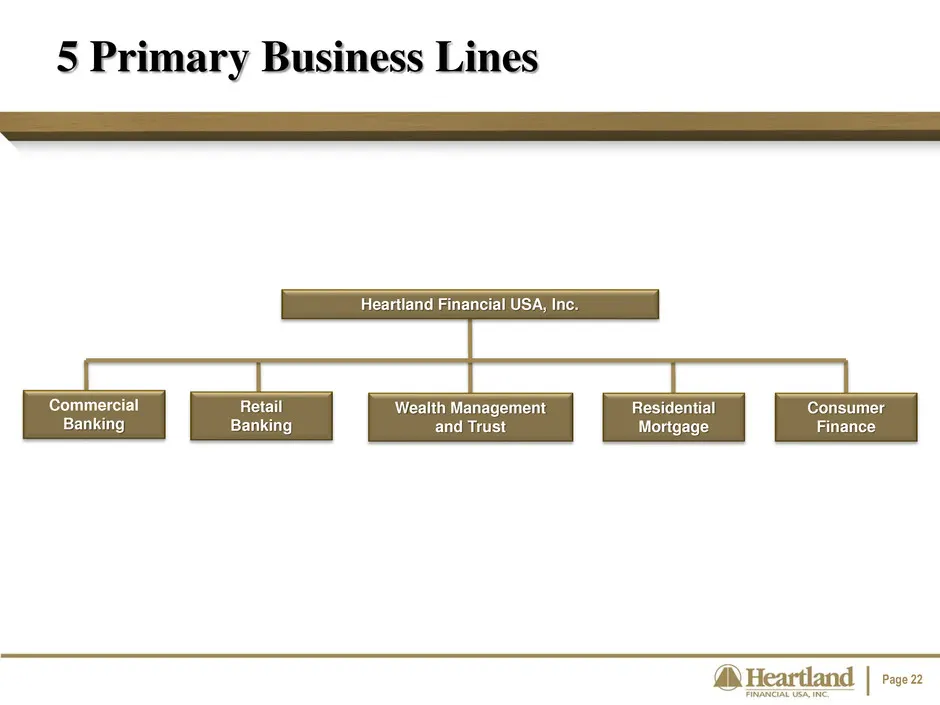
Page 22 Heartland Financial USA, Inc. Commercial Banking Retail Banking Wealth Management and Trust Consumer Finance Residential Mortgage 5 Primary Business Lines
Slide 23: Solid Capital Ratios
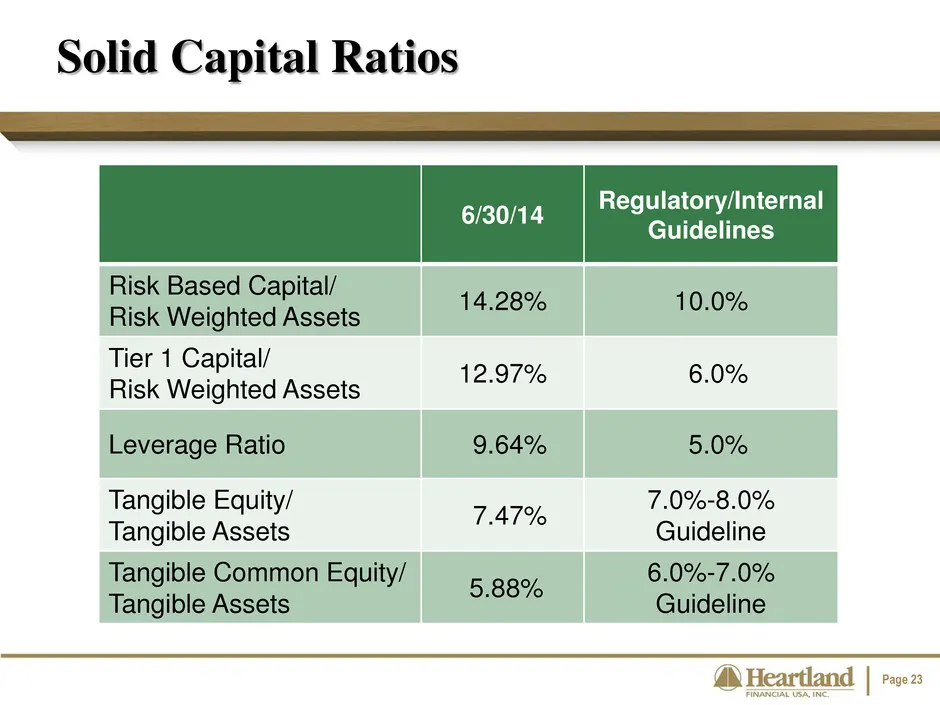
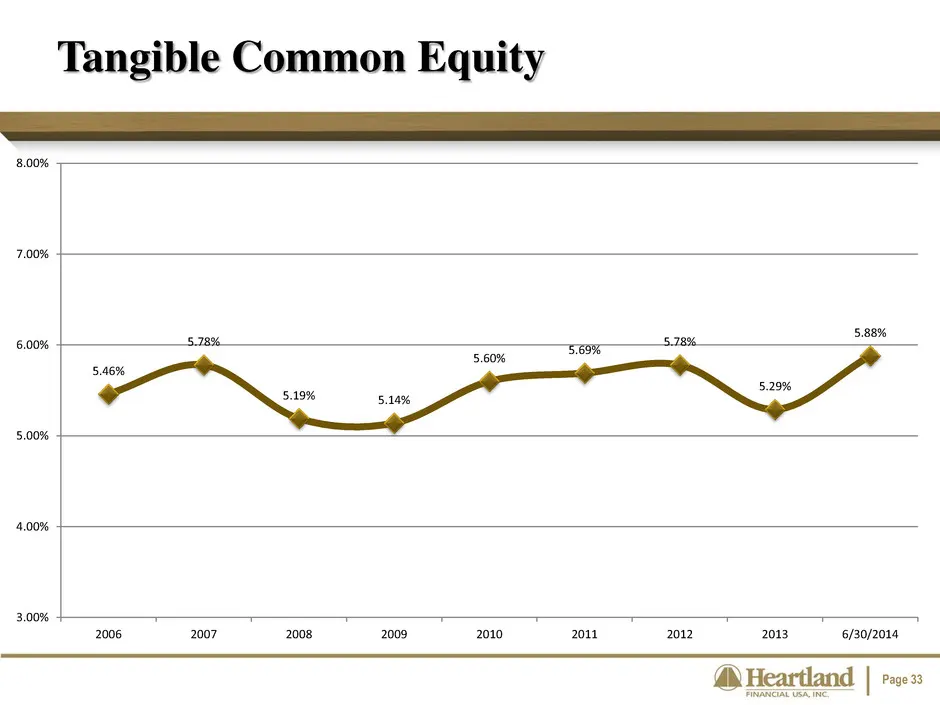
Page 23 Solid Capital Ratios 6/30/14 Regulatory/Internal Guidelines Risk Based Capital/ Risk Weighted Assets 14.28% 10.0% Tier 1 Capital/ Risk Weighted Assets 12.97% 6.0% Leverage Ratio 9.64% 5.0% Tangible Equity/ Tangible Assets 7.47% 7.0%-8.0% Guideline Tangible Common Equity/ Tangible Assets 5.88
Slide 24: Low Cost Non-Common Funding
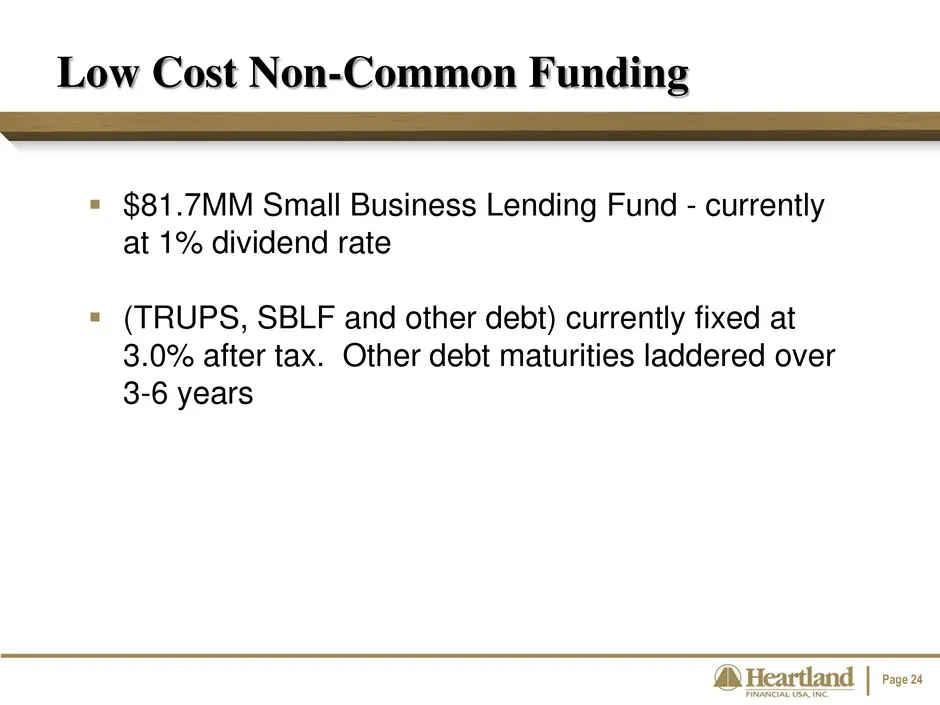
Page 24 $81.7MM Small Business Lending Fund - currently at 1% dividend rate (TRUPS, SBLF and other debt) currently fixed at 3.0% after tax. Other debt maturities laddered over 3-6 years Low Cost Non-Common Funding
Slide 25: HTLF Core Facts Summary
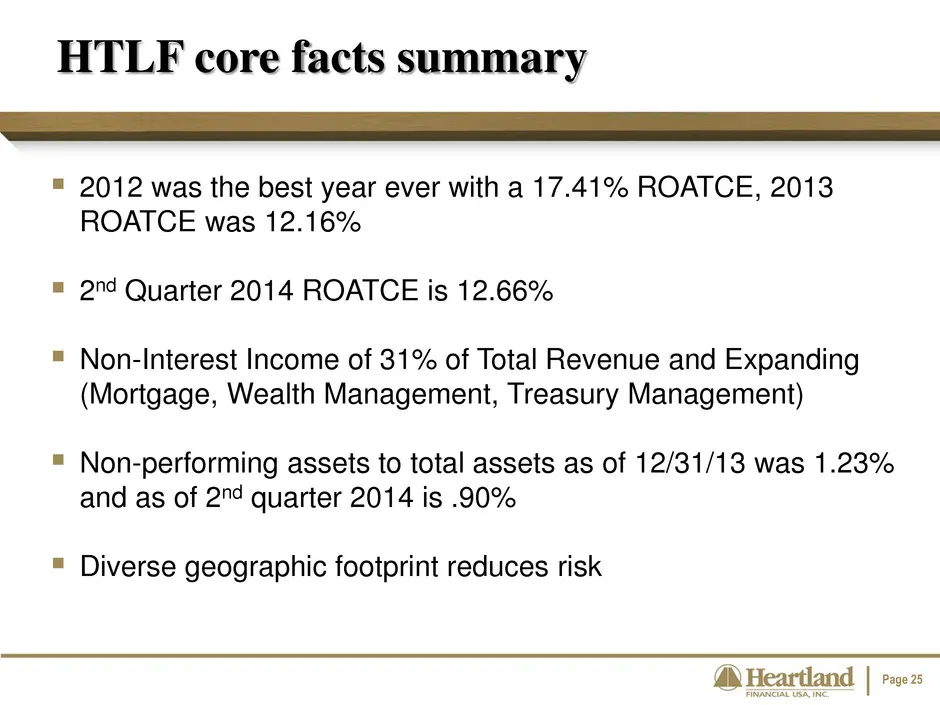
Page 25 2012 was the best year ever with a 17.41% ROATCE, 2013 ROATCE was 12.16% 2nd Quarter 2014 ROATCE is 12.66% Non-Interest Income of 31% of Total Revenue and Expanding (Mortgage, Wealth Management, Treasury Management) Non-performing assets to total assets as of 12/31/13 was 1.23% and a
Slide 26: HTLF Core Facts Summary (cont.)
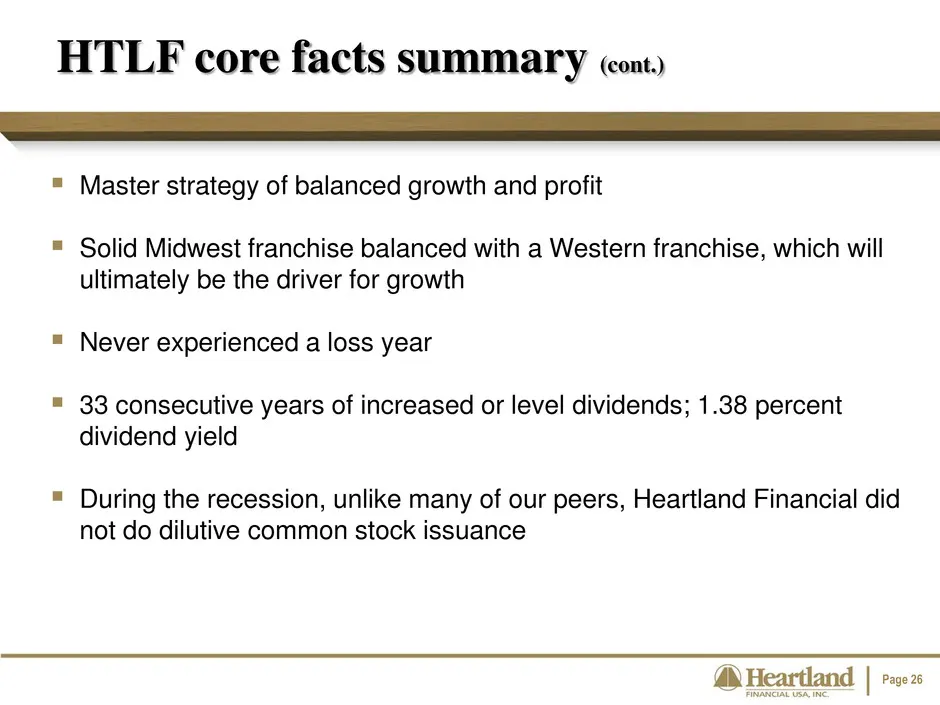
Page 26 Master strategy of balanced growth and profit Solid Midwest franchise balanced with a Western franchise, which will ultimately be the driver for growth Never experienced a loss year 33 consecutive years of increased or level dividends; 1.38 percent dividend yield During the recessi
Slide 27: Agenda
Page 27 Agenda Heartland’s growth story Key tenets of Heartland’s business model Financial Highlights
Slide 28: Financial Performance
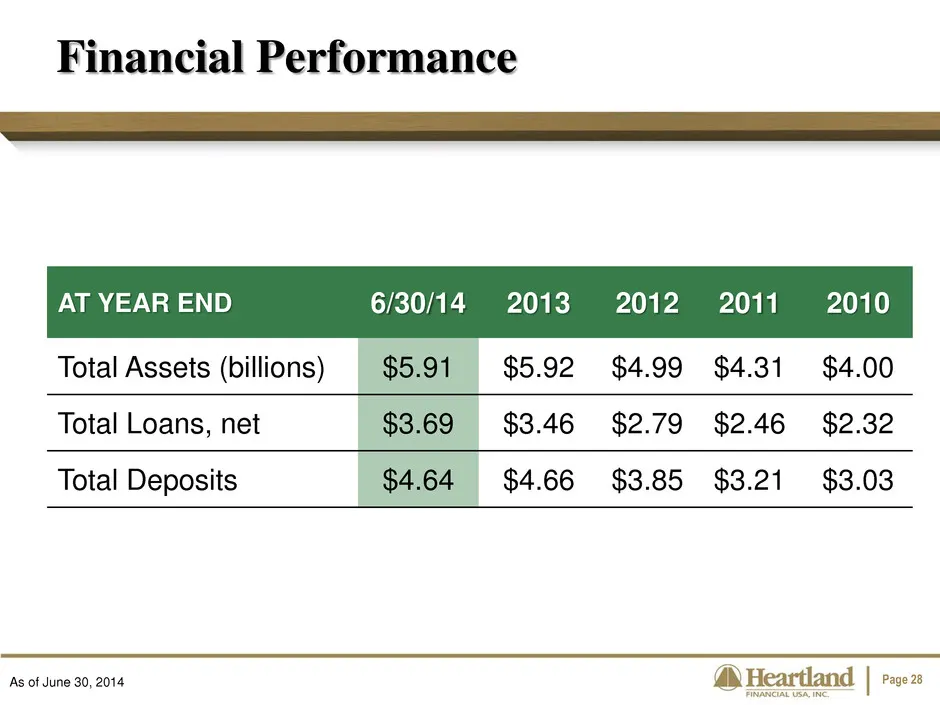
Page 28 Financial Performance As of June 30, 2014 AT YEAR END 6/30/14 2013 2012 2011 2010 Total Assets (billions) $5.91 $5.92 $4.99 $4.31 $4.00 Total Loans, net $3.69 $3.46 $2.79 $2.46 $2.32 Total Deposits $4.64 $4.66 $3.85 $3.21 $3.03
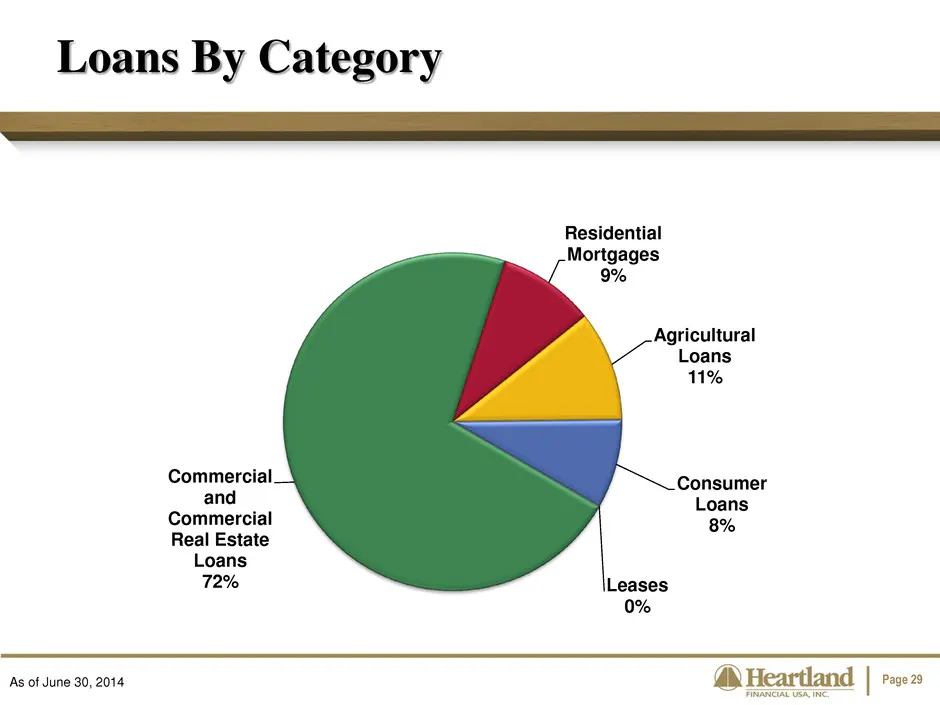
Slide 29: Loans By Category
Page 29 Commercial and Commercial Real Estate Loans 72% Residential Mortgages 9% Agricultural Loans 11% Consumer Loans 8% Leases 0% Loans By Category As of June 30, 2014
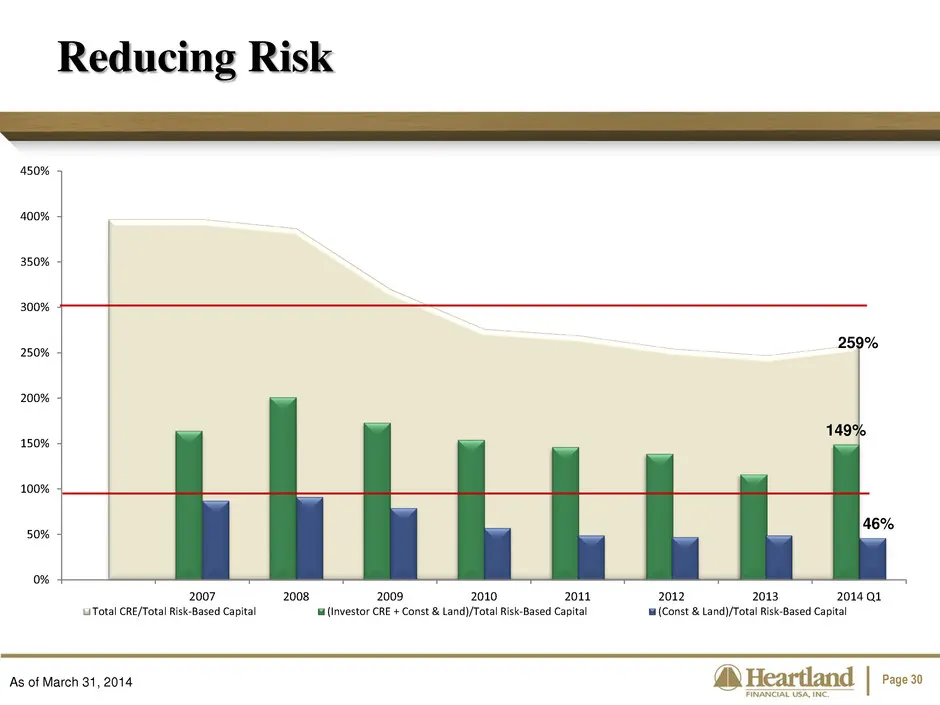
Slide 30: Reducing Risk
Page 30 Reducing Risk As of March 31, 2014 259% 149% 46% 0% 50% 100% 150% 200% 250% 300% 350% 400% 450% 2007 2008 2009 2010 2011 2012 2013 2014 Q1 Total CRE/Total Risk-Based Capital (Investor CRE + Const & Land)/Total Risk-Based Capital (Const & Land)/Total Risk-Based Capital
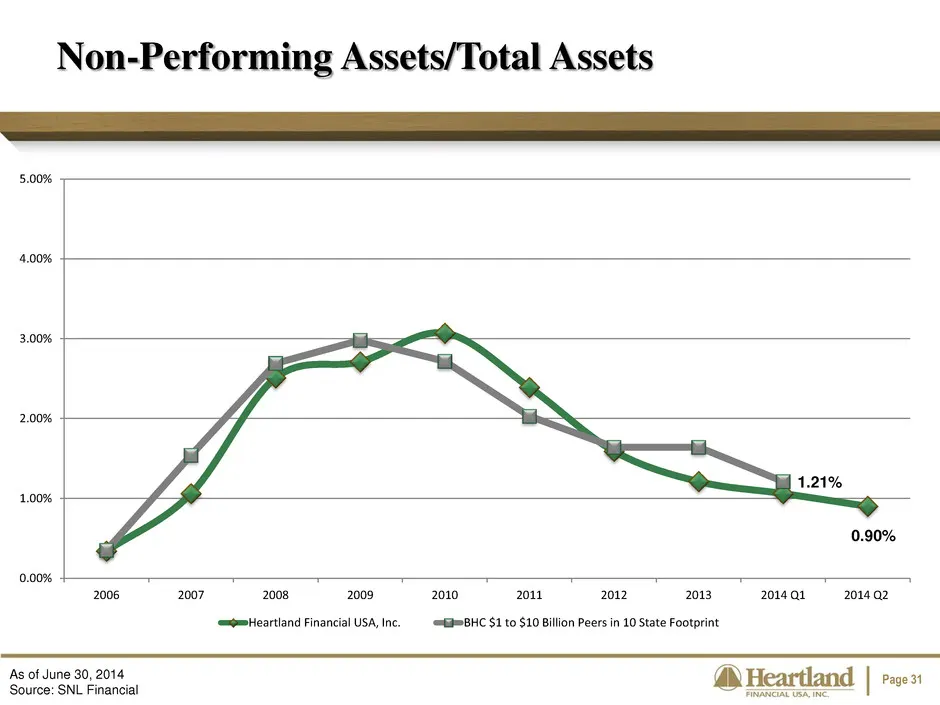
Slide 31: Non-Performing Assets/Total Assets
Page 31 Non-Performing Assets/Total Assets As of June 30, 2014 Source: SNL Financial 0.90% 1.21% 0.00% 1.00% 2.00% 3.00% 4.00% 5.00% 2006 2007 2008 2009 2010 2011 2012 2013 2014 Q1 2014 Q2 Heartland Financial USA, Inc. BHC $1 to $10 Billion Peers in 10 State Footprint
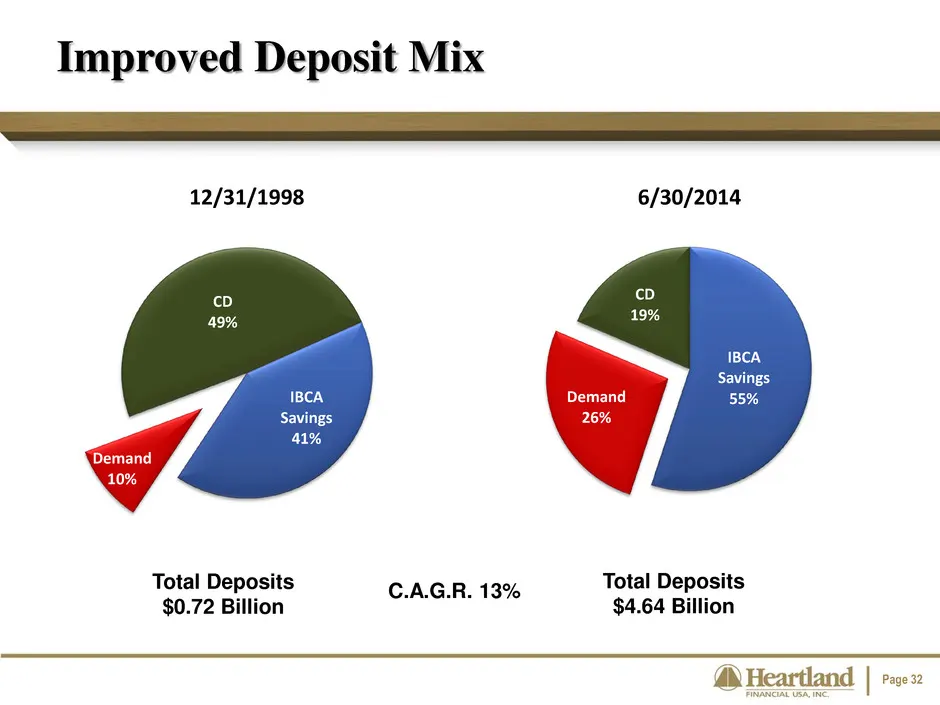
Slide 32: Improved Deposit Mix
Page 32 Improved Deposit Mix Total Deposits $0.72 Billion Total Deposits $4.64 Billion C.A.G.R. 13% IBCA Savings 41% Demand 10% CD 49% 12/31/1998 IBCA Savings 55% Demand 26% CD 19% 6/30/2014
Slide 33: Tangible Common Equity
Page 33 Tangible Common Equity 5.46% 5.78% 5.19% 5.14% 5.60% 5.69% 5.78% 5.29% 5.88% 3.00% 4.00% 5.00% 6.00% 7.00% 8.00% 2006 2007 2008 2009 2010 2011 2012 2013 6/30/2014
Slide 34: Income Recap
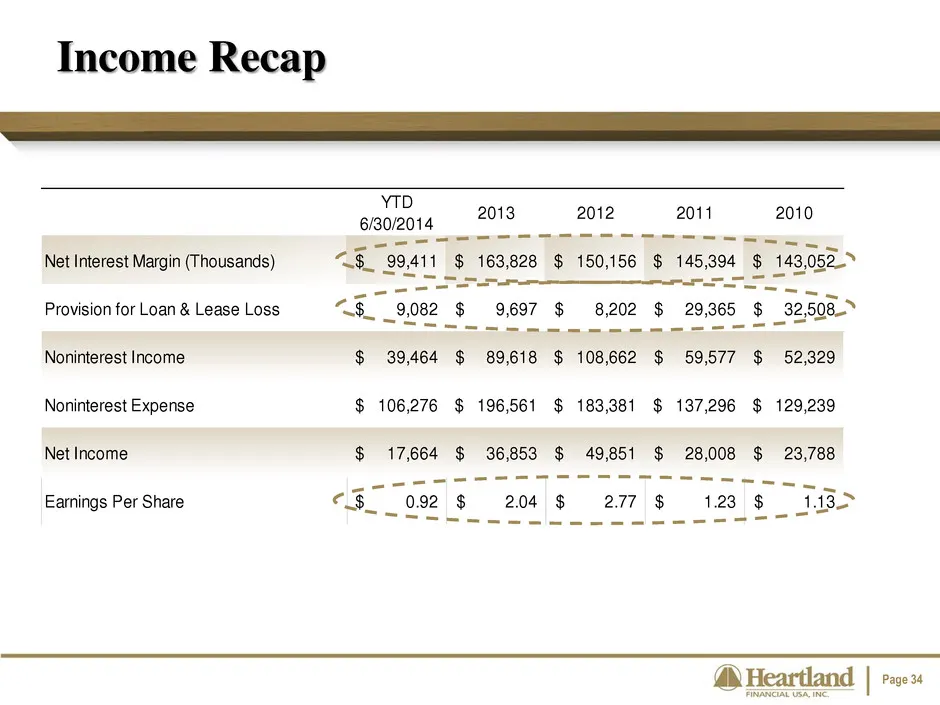
Page 34 YTD 6/30/2014 2013 2012 2011 2010 Net Interest Margin (Thousands) 99,411$ 163,828$ 150,156$ 145,394$ 143,052$ Provision for Loan & Lease Loss 9,082$ 9,697$ 8,202$ 29,365$ 32,508$ Noninterest Income 39,464$ 89,618$ 108,662$ 59,577$ 52,329$ Noninterest Expense 106,276$ 196,561$ 183,381$ 137,29
Slide 35: Net Interest Margin
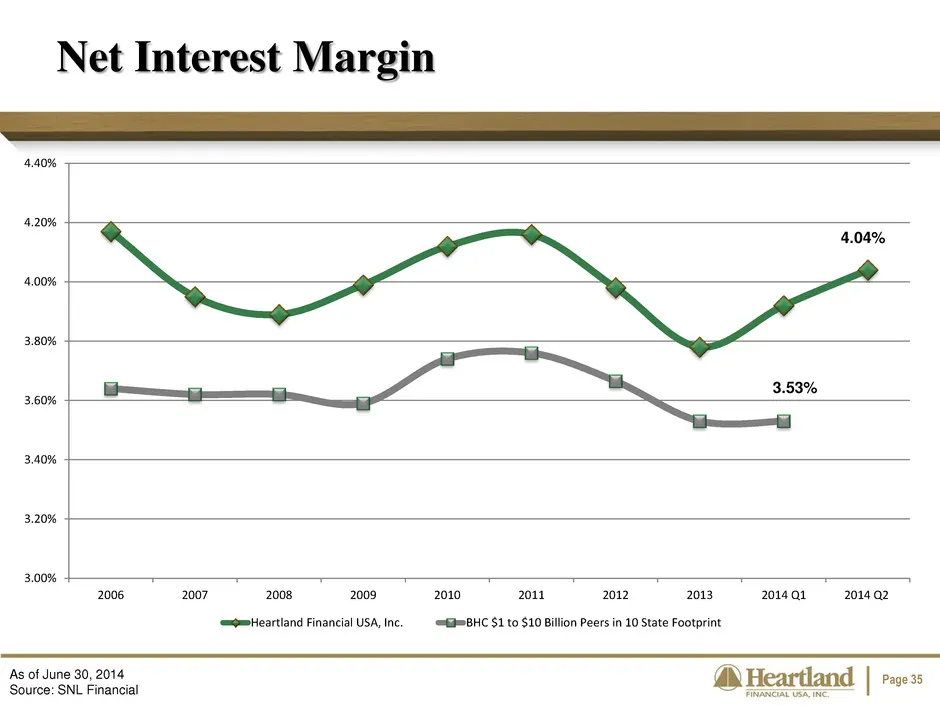
Page 35 Net Interest Margin As of June 30, 2014 Source: SNL Financial 4.04% 3.53% 3.00% 3.20% 3.40% 3.60% 3.80% 4.00% 4.20% 4.40% 2006 2007 2008 2009 2010 2011 2012 2013 2014 Q1 2014 Q2 Heartland Financial USA, Inc. BHC $1 to $10 Billion Peers in 10 State Footprint
Slide 36: Provision For Loan & Lease Losses
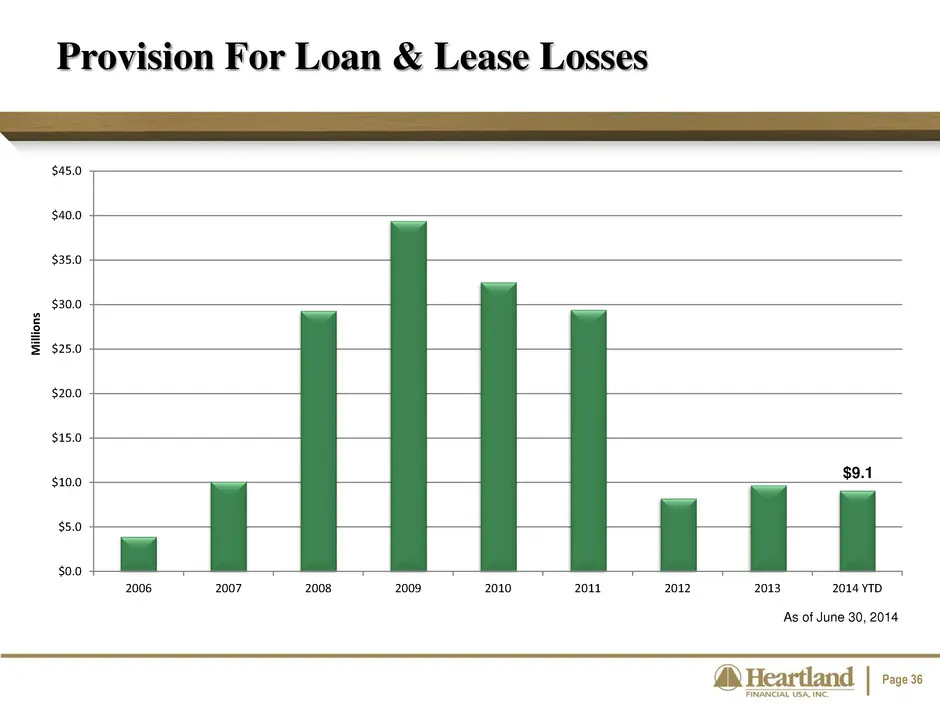
Page 36 Provision For Loan & Lease Losses As of June 30, 2014 $9.1 $0.0 $5.0 $10.0 $15.0 $20.0 $25.0 $30.0 $35.0 $40.0 $45.0 2006 2007 2008 2009 2010 2011 2012 2013 2014 YTD M ill io n s
Slide 37: Credit Trends
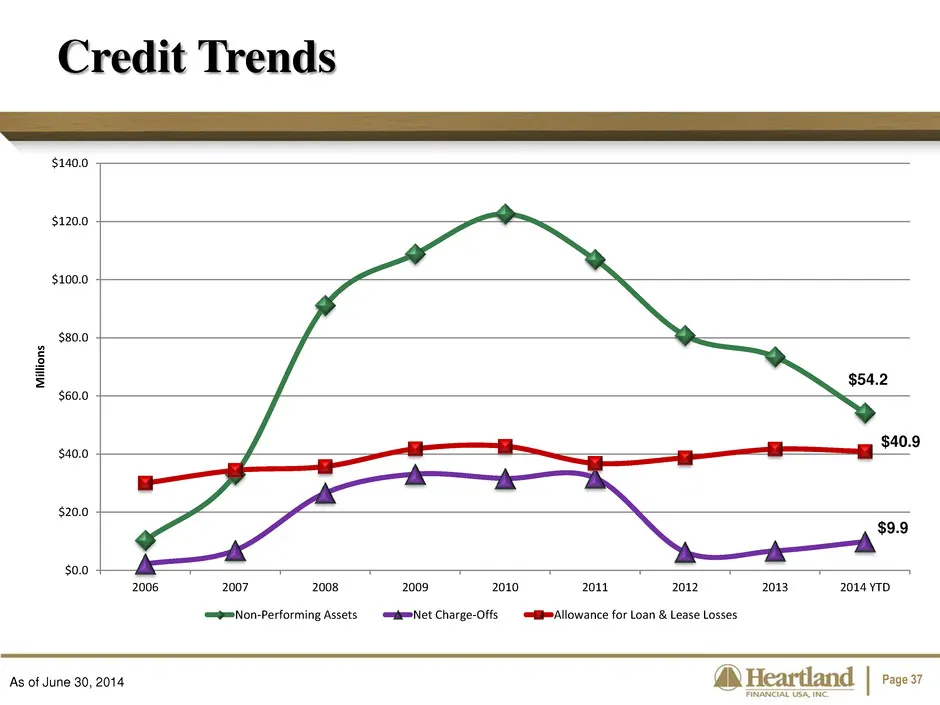
Page 37 Credit Trends As of June 30, 2014 $54.2 $9.9 $40.9 $0.0 $20.0 $40.0 $60.0 $80.0 $100.0 $120.0 $140.0 2006 2007 2008 2009 2010 2011 2012 2013 2014 YTD M ill io n s Non-Performing Assets Net Charge-Offs Allowance for Loan & Lease Losses
Slide 38: Diversified Revenue Streams
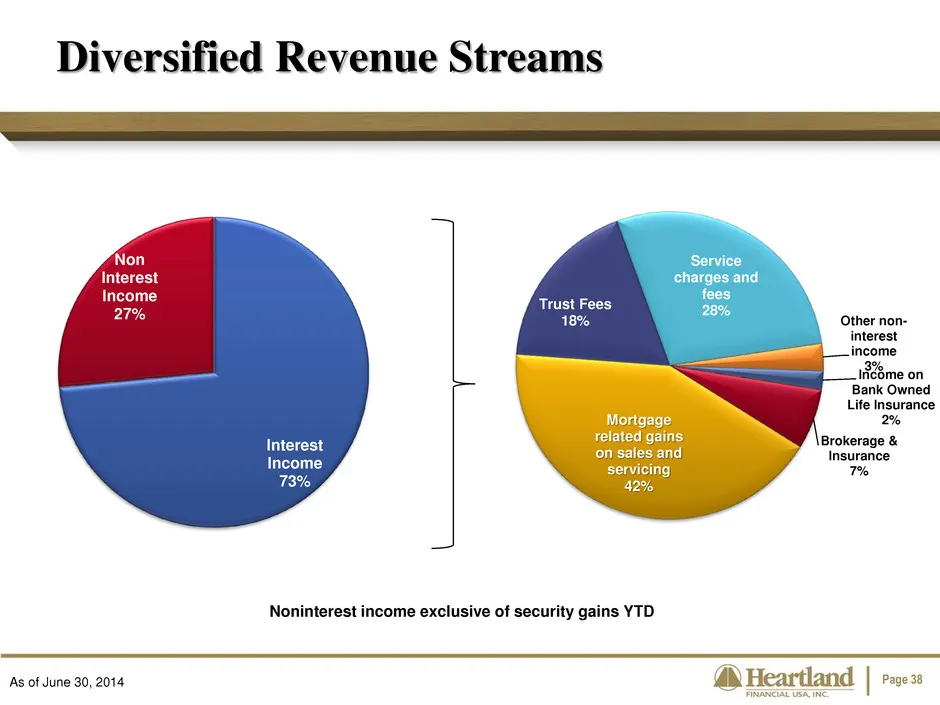
Page 38 Noninterest income exclusive of security gains YTD Diversified Revenue Streams As of June 30, 2014 Income on Bank Owned Life Insurance 2% Brokerage & Insurance 7% Mortgage related gains on sales and servicing 42% Trust Fees 18% Service charges and fees 28% Other non- interest income 3% Inter
Slide 39: Residential Mortgage Revenue Enhancement
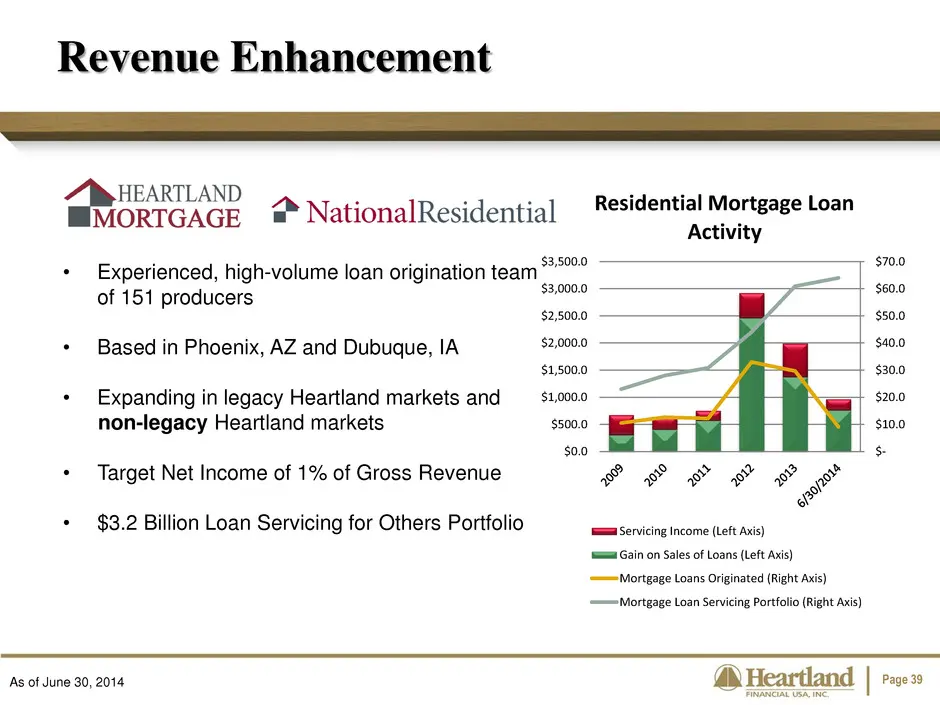
Page 39 • Experienced, high-volume loan origination team of 151 producers • Based in Phoenix, AZ and Dubuque, IA • Expanding in legacy Heartland markets and non-legacy Heartland markets • Target Net Income of 1% of Gross Revenue • $3.2 Billion Loan Servicing for Others Portfolio Revenue Enhancement
Slide 40: Wealth Management Revenue Enhancement
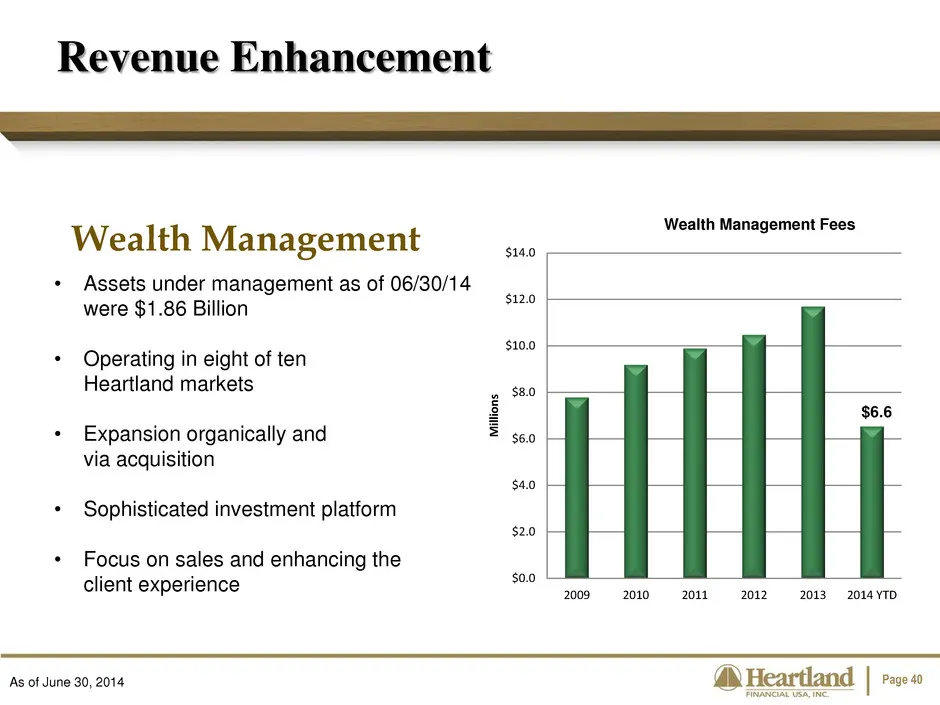
Page 40 • Assets under management as of 06/30/14 were $1.86 Billion • Operating in eight of ten Heartland markets • Expansion organically and via acquisition • Sophisticated investment platform • Focus on sales and enhancing the client experience Wealth Management Revenue Enhancement Wealth Manageme
Slide 41: Treasury Management Revenue Enhancement
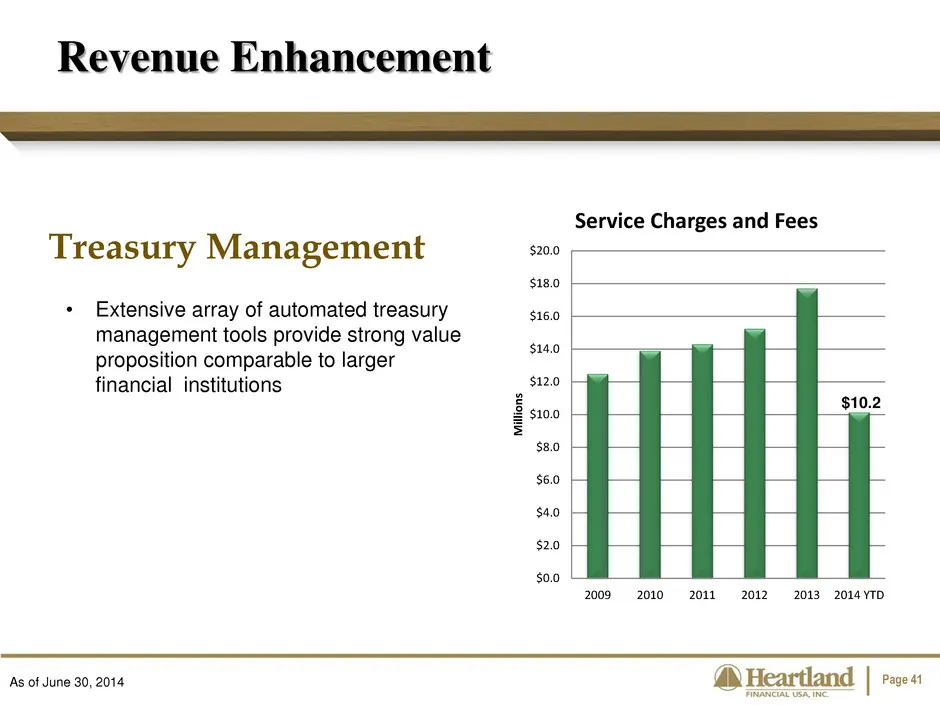
Page 41 Treasury Management • Extensive array of automated treasury management tools provide strong value proposition comparable to larger financial institutions Revenue Enhancement As of June 30, 2014 $10.2 $0.0 $2.0 $4.0 $6.0 $8.0 $10.0 $12.0 $14.0 $16.0 $18.0 $20.0 2009 2010 2011 2012 2013 2014 Y
Slide 42: Net Income (2008 – 2013)
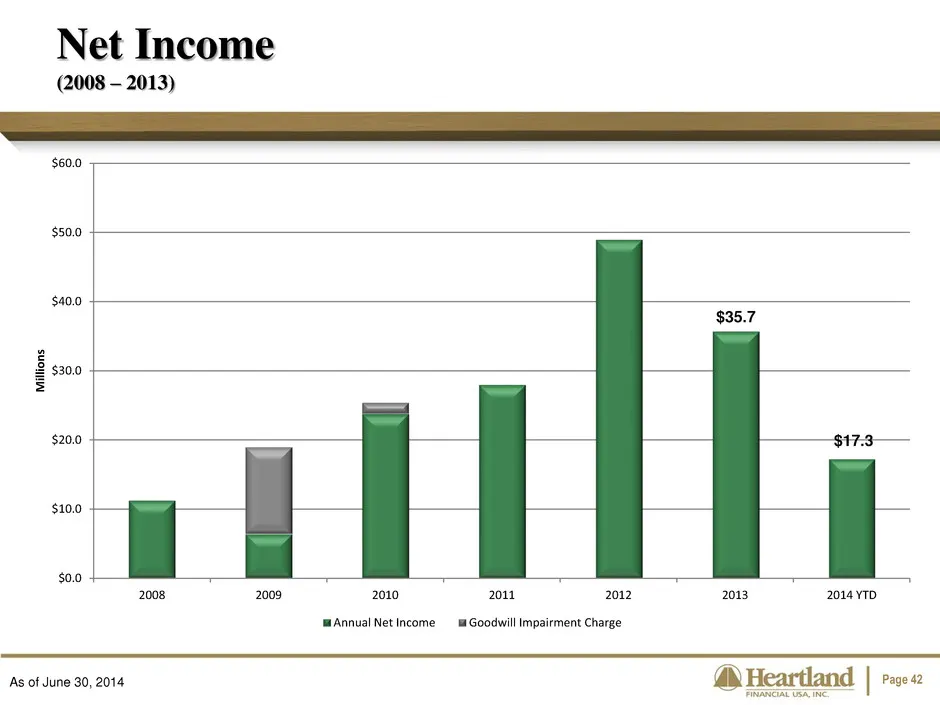
Page 42 Net Income (2008 – 2013) As of June 30, 2014 $35.7 $17.3 $0.0 $10.0 $20.0 $30.0 $40.0 $50.0 $60.0 2008 2009 2010 2011 2012 2013 2014 YTD M ill io n s Annual Net Income Goodwill Impairment Charge
Slide 43: Efficiency Ratio
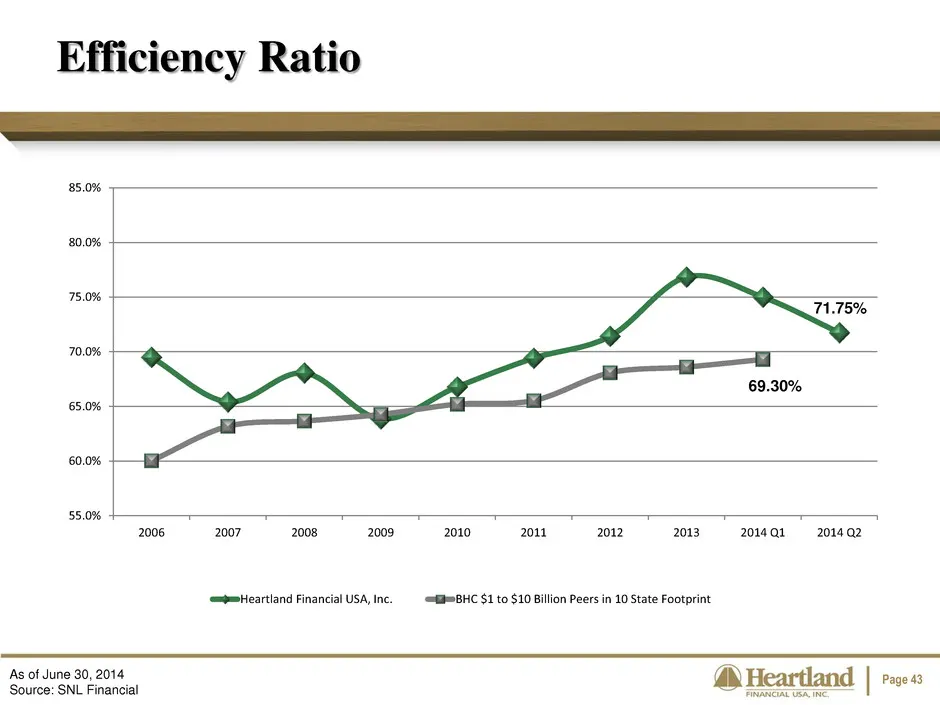
Page 43 Efficiency Ratio As of June 30, 2014 Source: SNL Financial 71.75% 69.30% 55.0% 60.0% 65.0% 70.0% 75.0% 80.0% 85.0% 2006 2007 2008 2009 2010 2011 2012 2013 2014 Q1 2014 Q2 Heartland Financial USA, Inc. BHC $1 to $10 Billion Peers in 10 State Footprint
Slide 44: Return on Average Common Equity
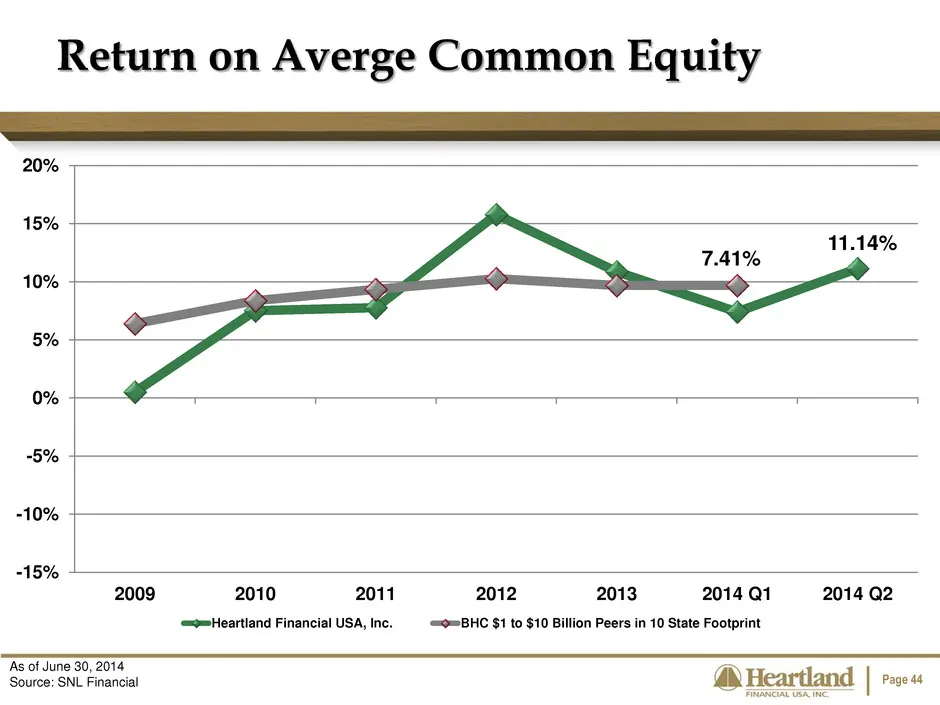
Page 44 Return on Averge Common Equity As of June 30, 2014 Source: SNL Financial 7.41% 11.14% -15% -10% -5% 0% 5% 10% 15% 20% 2009 2010 2011 2012 2013 2014 Q1 2014 Q2 Heartland Financial USA, Inc. BHC $1 to $10 Billion Peers in 10 State Footprint
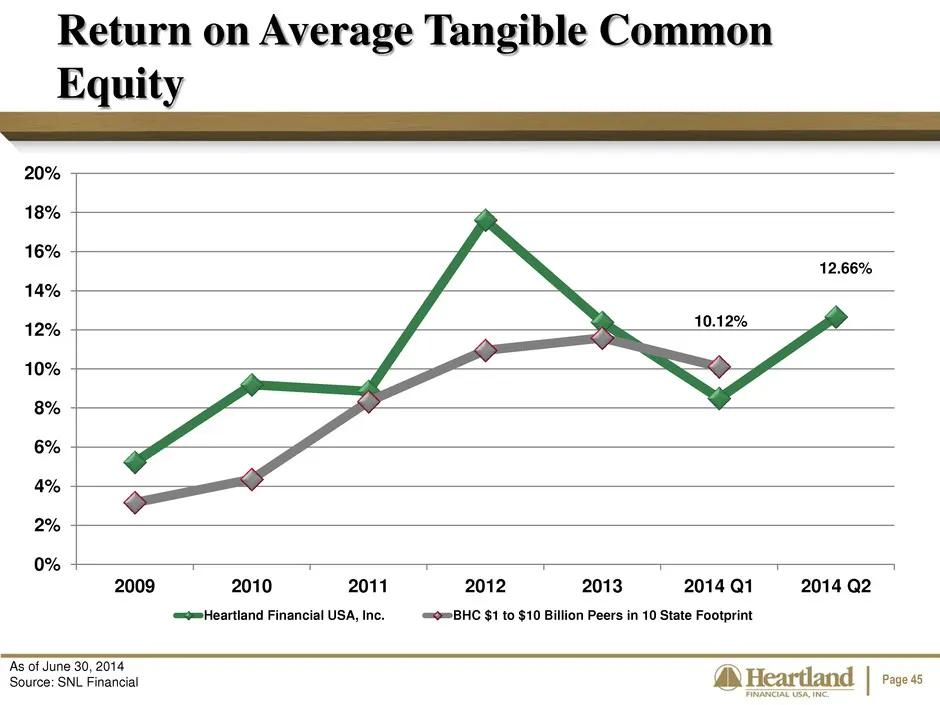
Slide 45: Return on Average Tangible Common Equity
Page 45 Return on Average Tangible Common Equity 12.66% 10.12% 0% 2% 4% 6% 8% 10% 12% 14% 16% 18% 20% 2009 2010 2011 2012 2013 2014 Q1 2014 Q2 Heartland Financial USA, Inc. BHC $1 to $10 Billion Peers in 10 State Footprint As of June 30, 2014 Source: SNL Financial
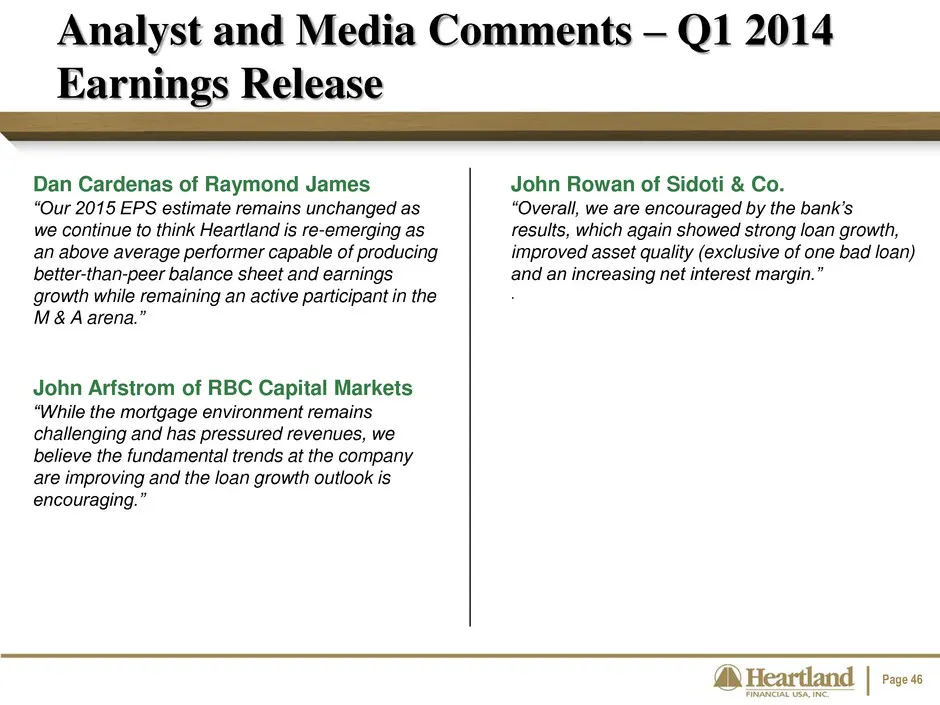
Slide 46: Analyst and Media Comments – Q1 2014 Earnings Release
Page 46 Analyst and Media Comments – Q1 2014 Earnings Release Dan Cardenas of Raymond James “Our 2015 EPS estimate remains unchanged as we continue to think Heartland is re-emerging as an above average performer capable of producing better-than-peer balance sheet and earnings growth while remaining
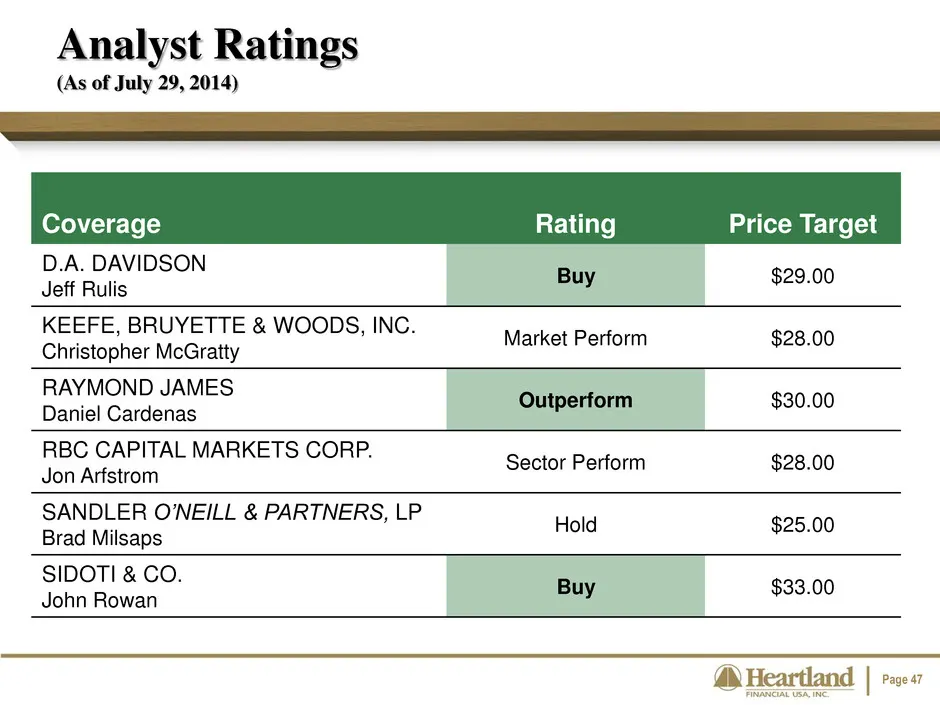
Slide 47: Analyst Ratings
Page 47 Analyst Ratings (As of July 29, 2014) Coverage Rating Price Target D.A. DAVIDSON Jeff Rulis Buy $29.00 KEEFE, BRUYETTE & WOODS, INC. Christopher McGratty Market Perform $28.00 RAYMOND JAMES Daniel Cardenas Outperform $30.00 RBC CAPITAL MARKETS CORP. Jon Arfstrom Sector Perform $28.00 SANDLER
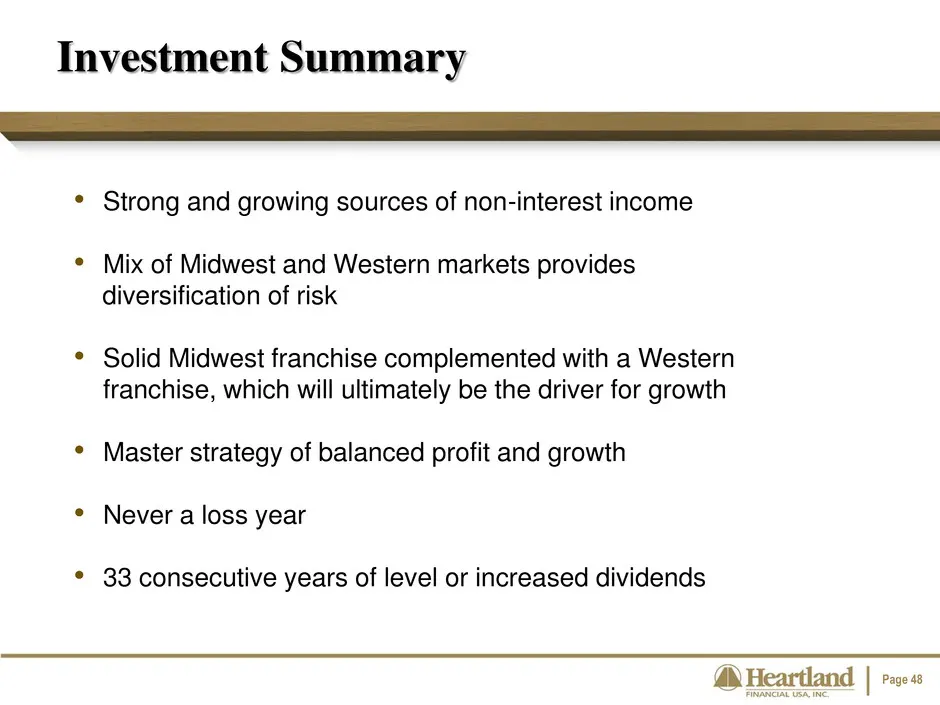
Slide 48: Investment Summary
Page 48 • Strong and growing sources of non-interest income • Mix of Midwest and Western markets provides diversification of risk • Solid Midwest franchise complemented with a Western franchise, which will ultimately be the driver for growth • Master strategy of balanced profit and growth • Never a
Slide 49: Contact Information
Contact Information LYNN B. FULLER Chuan BRYAN R. MCKEAG Frere EXECUTIVE VICE PRESIDENT BMHeartland Kesar. over ‘CHIEF FINANCIAL OFFICER oa ‘56 sopa10s PHONE (569) 569.1994 Pats 82011 ELL 920) 2660732 TOU FREe 89) 7392100 Fax sen $0995) {ie @hofeon TURE 86 7392100 svonom fom ‘ncofeom IBVECENTRALAVEN
Slide 50: Mission Statement
Mission Statement: Through excellence In customer service and Respect for the individual, EVERYONE PROFITS Trading Symbol: HTLF | www.htlf.com
Source: SEC EDGAR · 8-K filed Aug 29, 2014
More decks from Heartland Financial USA Inc
 Merger or Acquisition (July 2024)6 slides · Jul 31, 2024
 Merger or Acquisition (May 2024)6 slides · May 2, 2024
 Merger or Acquisition (May 2024)27 slides · May 2, 2024
 Q4 2023 Earnings Presentation54 slides · Feb 13, 2024
 Q4 2023 Earnings Presentation35 slides · Jan 29, 2024
 Q3 2023 Earnings Presentation55 slides · Nov 15, 2023