Heartland Financial USA — Q1 2023 Earnings Presentation
50 slides from Heartland Financial USA's earnings presentation, May 10, 2023
Slide 1: 1Q 2023 Investor Presentation
1Q 2023 Investor Presentation
Slide 2: Safe Harbor
2 Safe Harbor Within the charts and tables presented, certain segments, columns and rows may not sum to totals shown due to rounding. This investor presentation (including any information incorporated herein by reference) and future oral and written statements of HTLF and its management, may contain
Slide 3: $20 Billion Asset Regional Bank
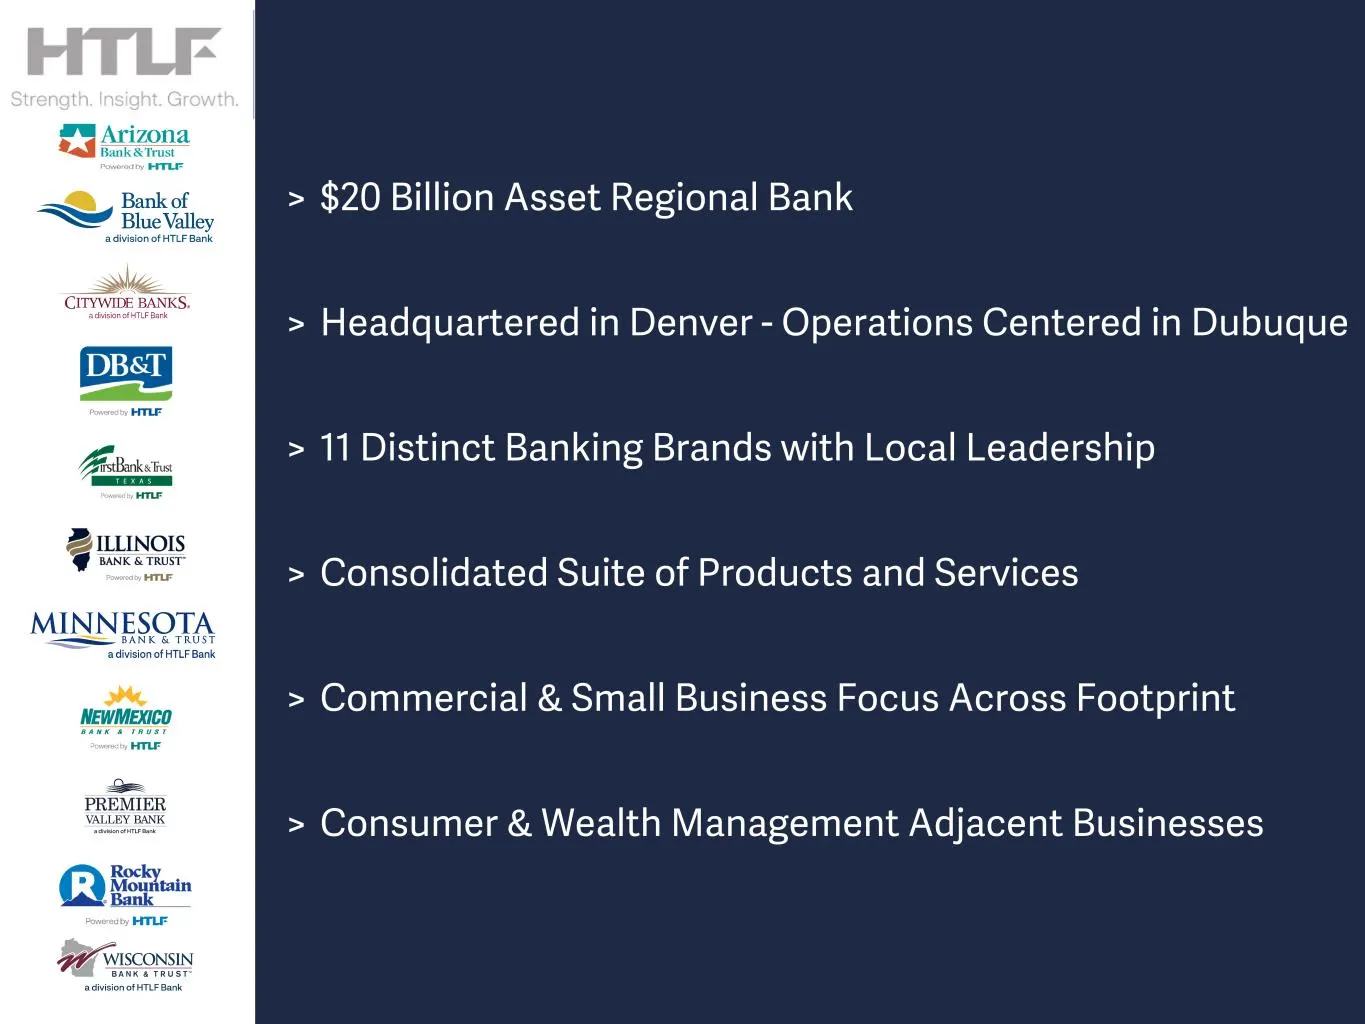
> $20 Billion Asset Regional Bank > Headquartered in Denver - Operations Centered in Dubuque > 11 Distinct Banking Brands with Local Leadership > Consolidated Suite of Products and Services > Commercial & Small Business Focus Across Footprint > Consumer & Wealth Management Adjacent Businesses
Slide 4: HTLF's Transformation
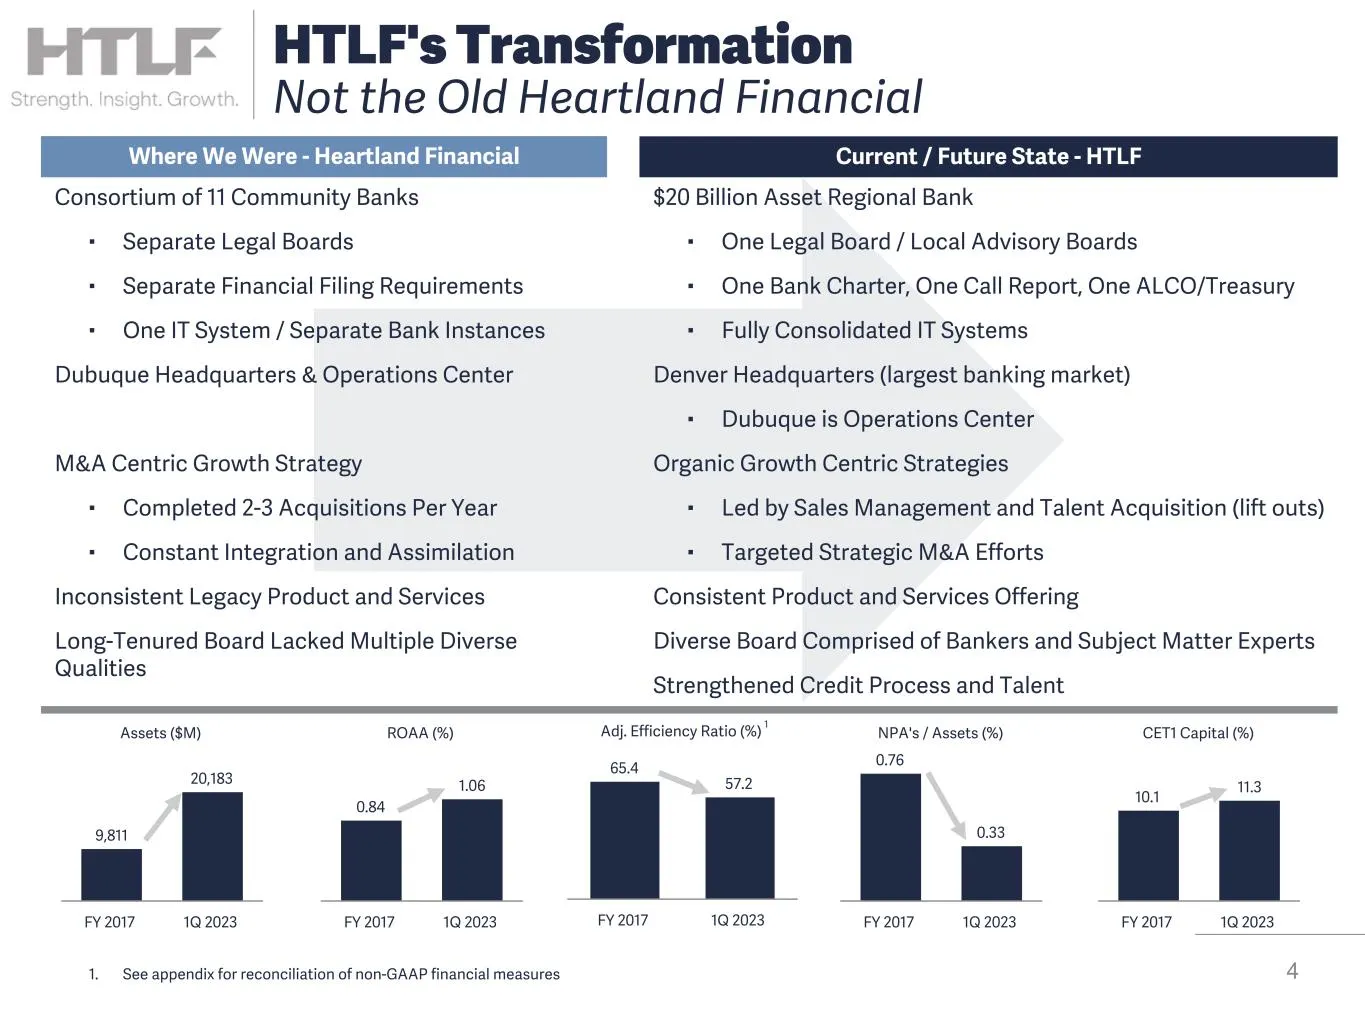
4 HTLF's Transformation Not the Old Heartland Financial Where We Were - Heartland Financial Current / Future State - HTLF $20 Billion Asset Regional Bank ▪ One Legal Board / Local Advisory Boards ▪ One Bank Charter, One Call Report, One ALCO/Treasury ▪ Fully Consolidated IT Systems Denver Headquarte
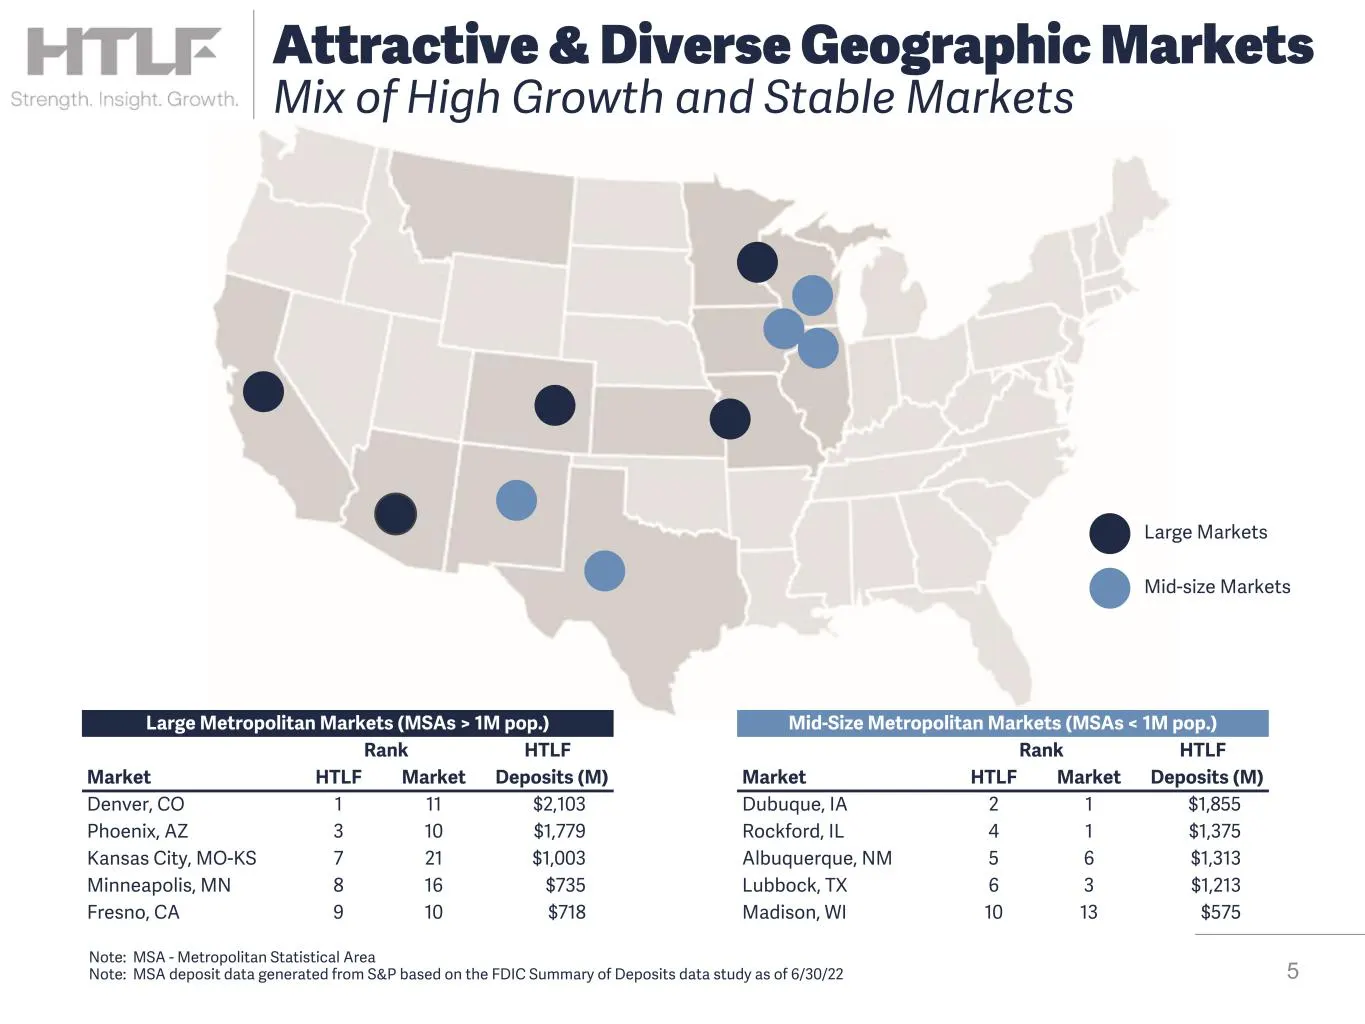
Slide 5: Attractive & Diverse Geographic Markets
Large Metropolitan Markets (MSAs > 1M pop.) Rank HTLF Market HTLF Market Deposits (M) Denver, CO 1 11 $2,103 Phoenix, AZ 3 10 $1,779 Kansas City, MO-KS 7 21 $1,003 Minneapolis, MN 8 16 $735 Fresno, CA 9 10 $718 5 Note: MSA - Metropolitan Statistical Area Note: MSA deposit data generated from S&P bas
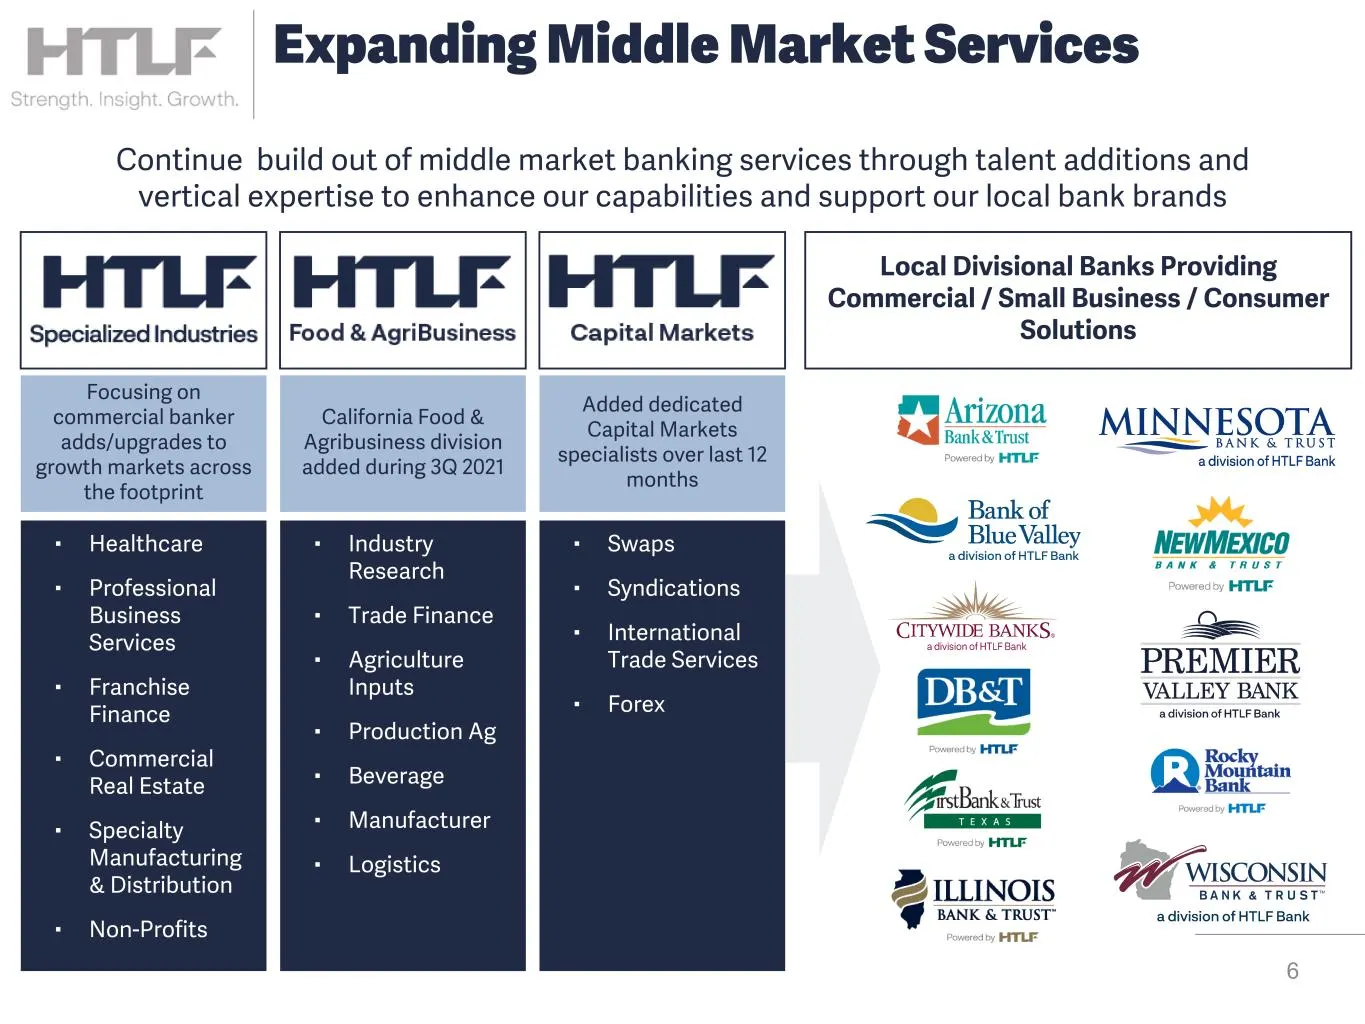
Slide 6: Expanding Middle Market Services
6 Expanding Middle Market Services Continue build out of middle market banking services through talent additions and vertical expertise to enhance our capabilities and support our local bank brands ▪ Healthcare ▪ Professional Business Services ▪ Franchise Finance ▪ Commercial Real Estate ▪ Specialty
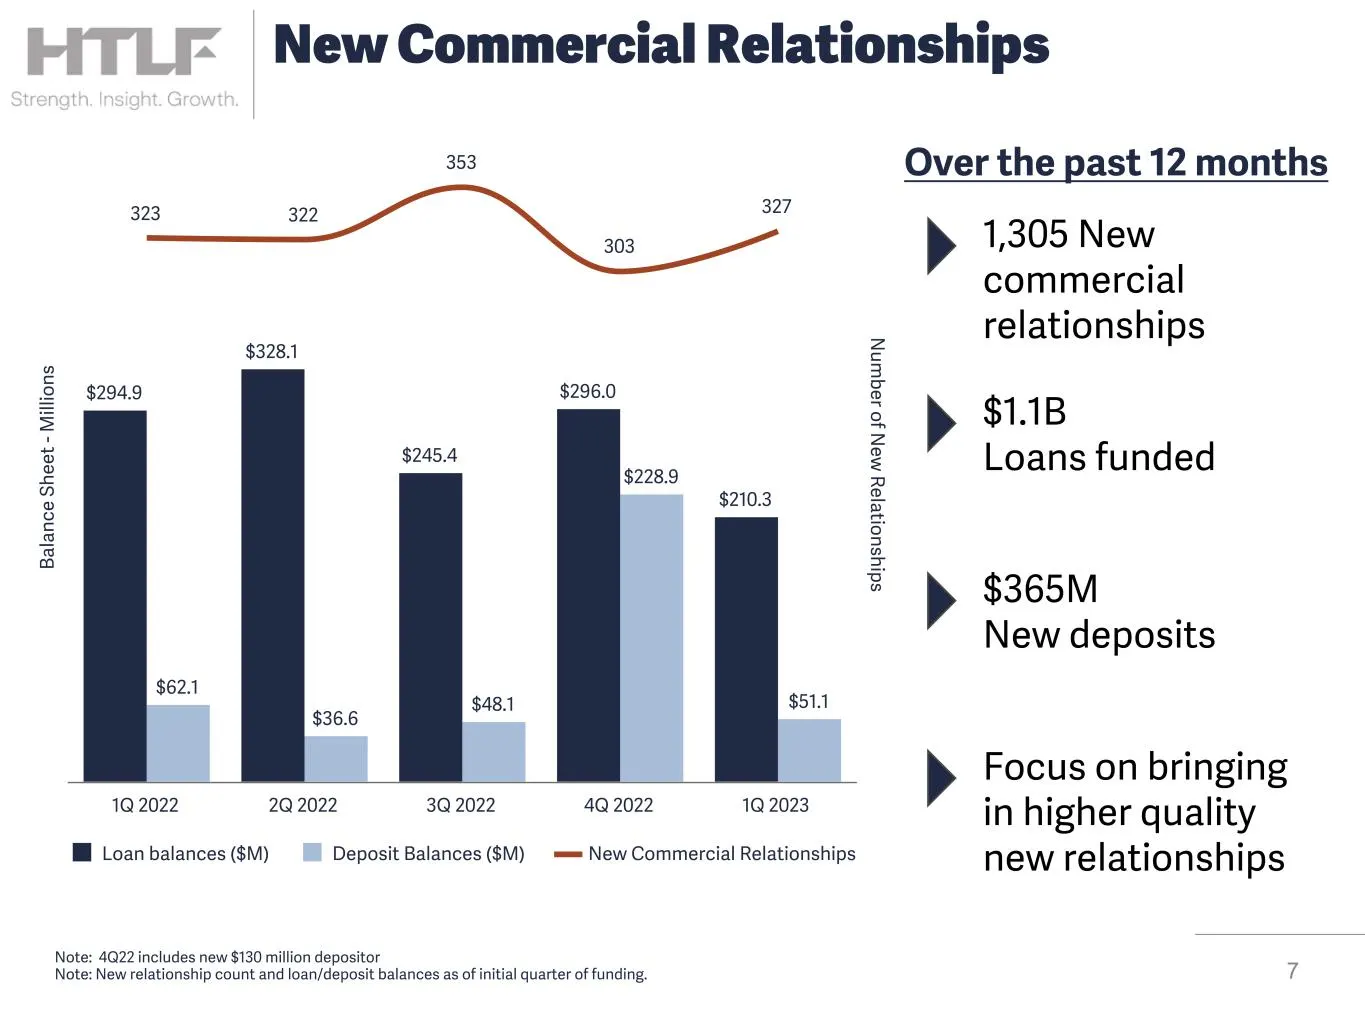
Slide 7: New Commercial Relationships
7 New Commercial Relationships B al an ce S he et - M ill io ns N um ber of N ew R elationships $294.9 $328.1 $245.4 $296.0 $210.3 $62.1 $36.6 $48.1 $228.9 $51.1 323 322 353 303 327 Loan balances ($M) Deposit Balances ($M) New Commercial Relationships 1Q 2022 2Q 2022 3Q 2022 4Q 2022 1Q 2023 1,305 Ne
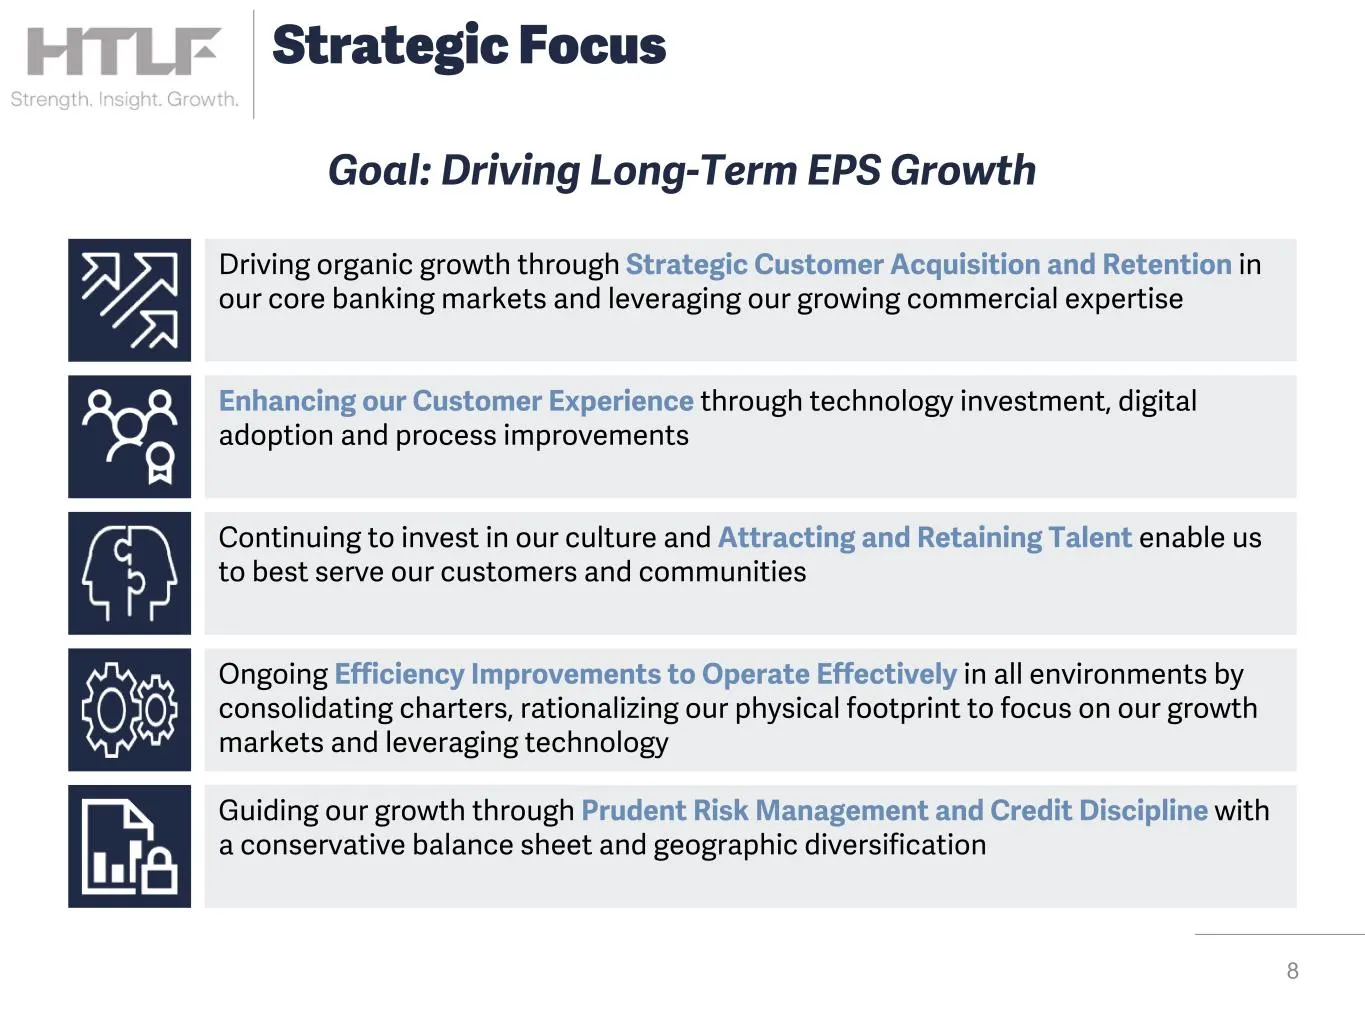
Slide 8: Driving organic growth through Strategic Customer Acquisition and Retention
Driving organic growth through Strategic Customer Acquisition and Retention in our core banking markets and leveraging our growing commercial expertise 8 Strategic Focus Enhancing our Customer Experience through technology investment, digital adoption and process improvements Ongoing Efficiency Impr
Slide 9: Increasing Dividends to Shareholders
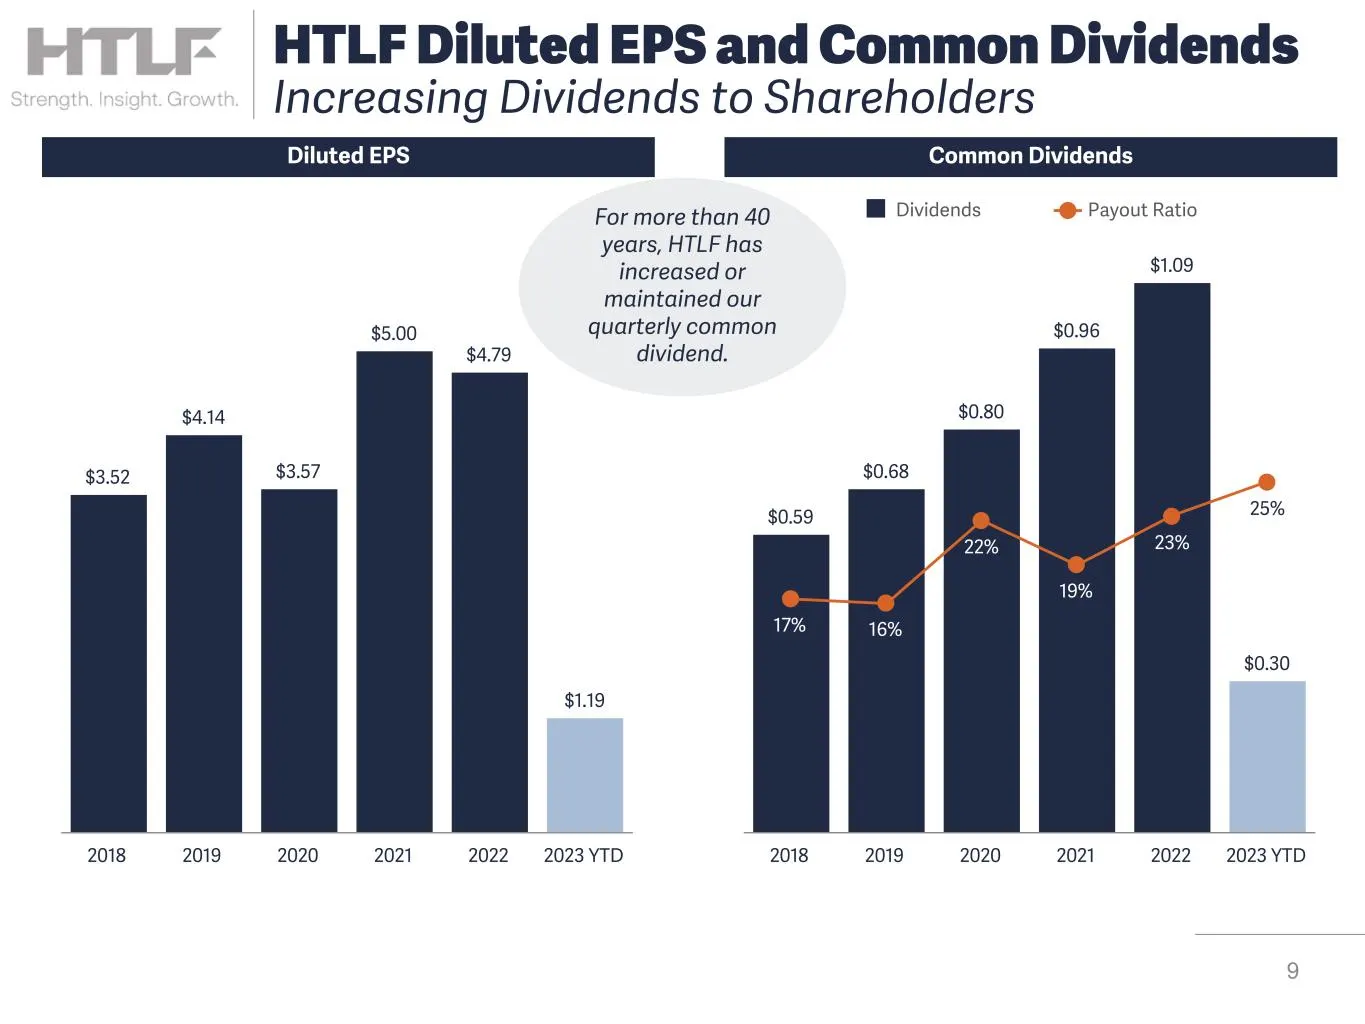
$0.59 $0.68 $0.80 $0.96 $1.09 $0.30 17% 16% 22% 19% 23% 25% Dividends Payout Ratio 2018 2019 2020 2021 2022 2023 YTD $3.52 $4.14 $3.57 $5.00 $4.79 $1.19 2018 2019 2020 2021 2022 2023 YTD 9 HTLF Diluted EPS and Common Dividends Increasing Dividends to Shareholders Diluted EPS Common Dividends For mor
Slide 10: Commitment to Deliver Long Term Growth
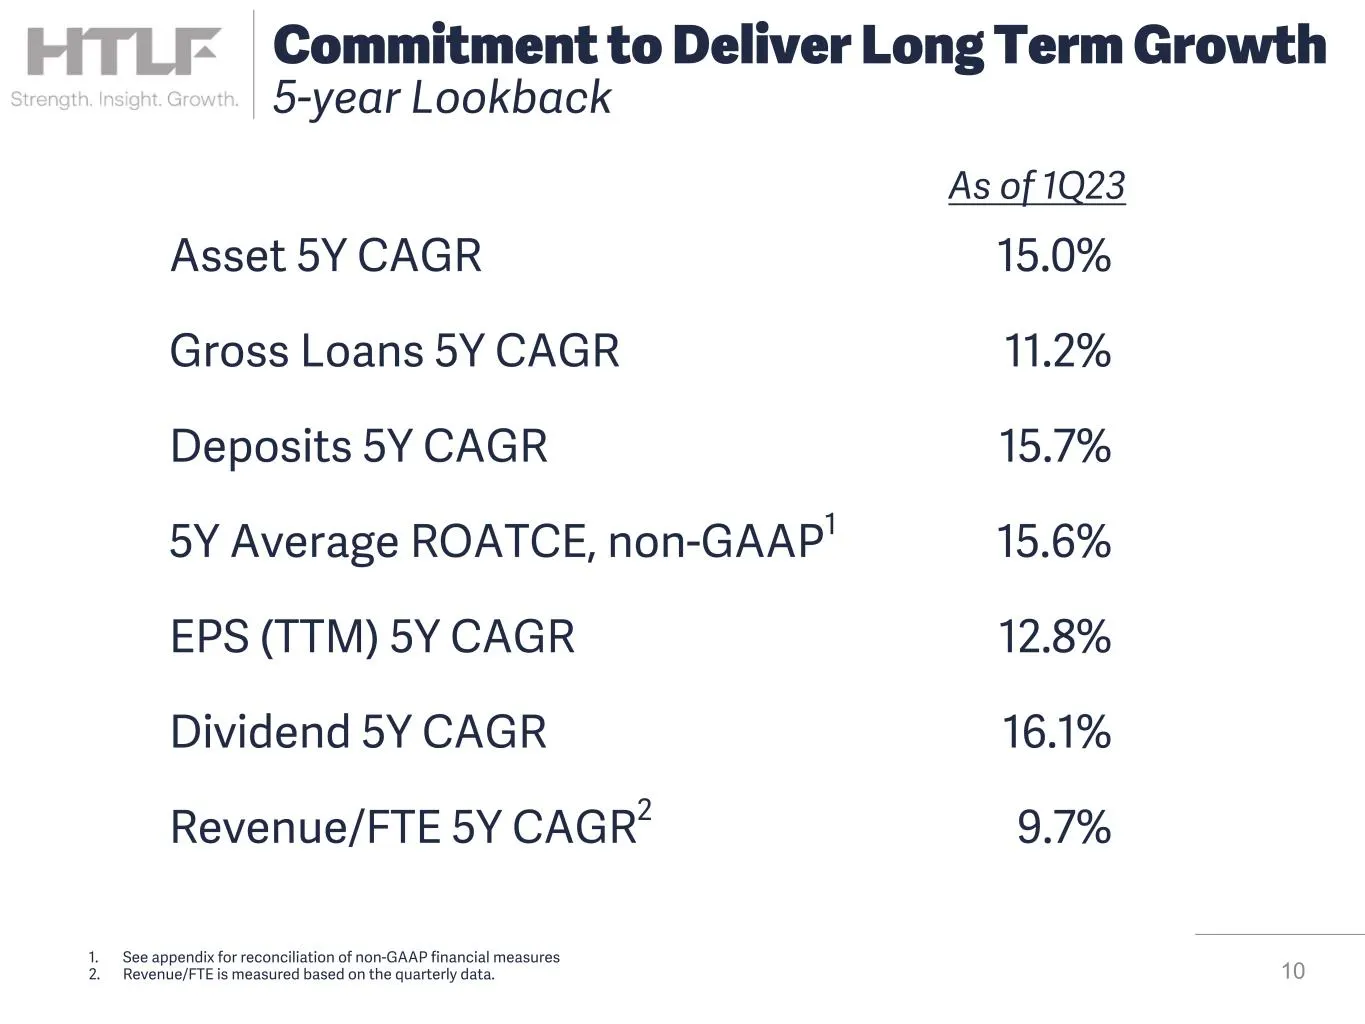
As of 1Q23 Asset 5Y CAGR 15.0 % Gross Loans 5Y CAGR 11.2 % Deposits 5Y CAGR 15.7 % 5Y Average ROATCE, non-GAAP1 15.6 % EPS (TTM) 5Y CAGR 12.8 % Dividend 5Y CAGR 16.1 % Revenue/FTE 5Y CAGR2 9.7 % 10 Commitment to Deliver Long Term Growth 5-year Lookback 1. See appendix for reconciliation of non-GAAP
Slide 11: Improving Customer Experiences
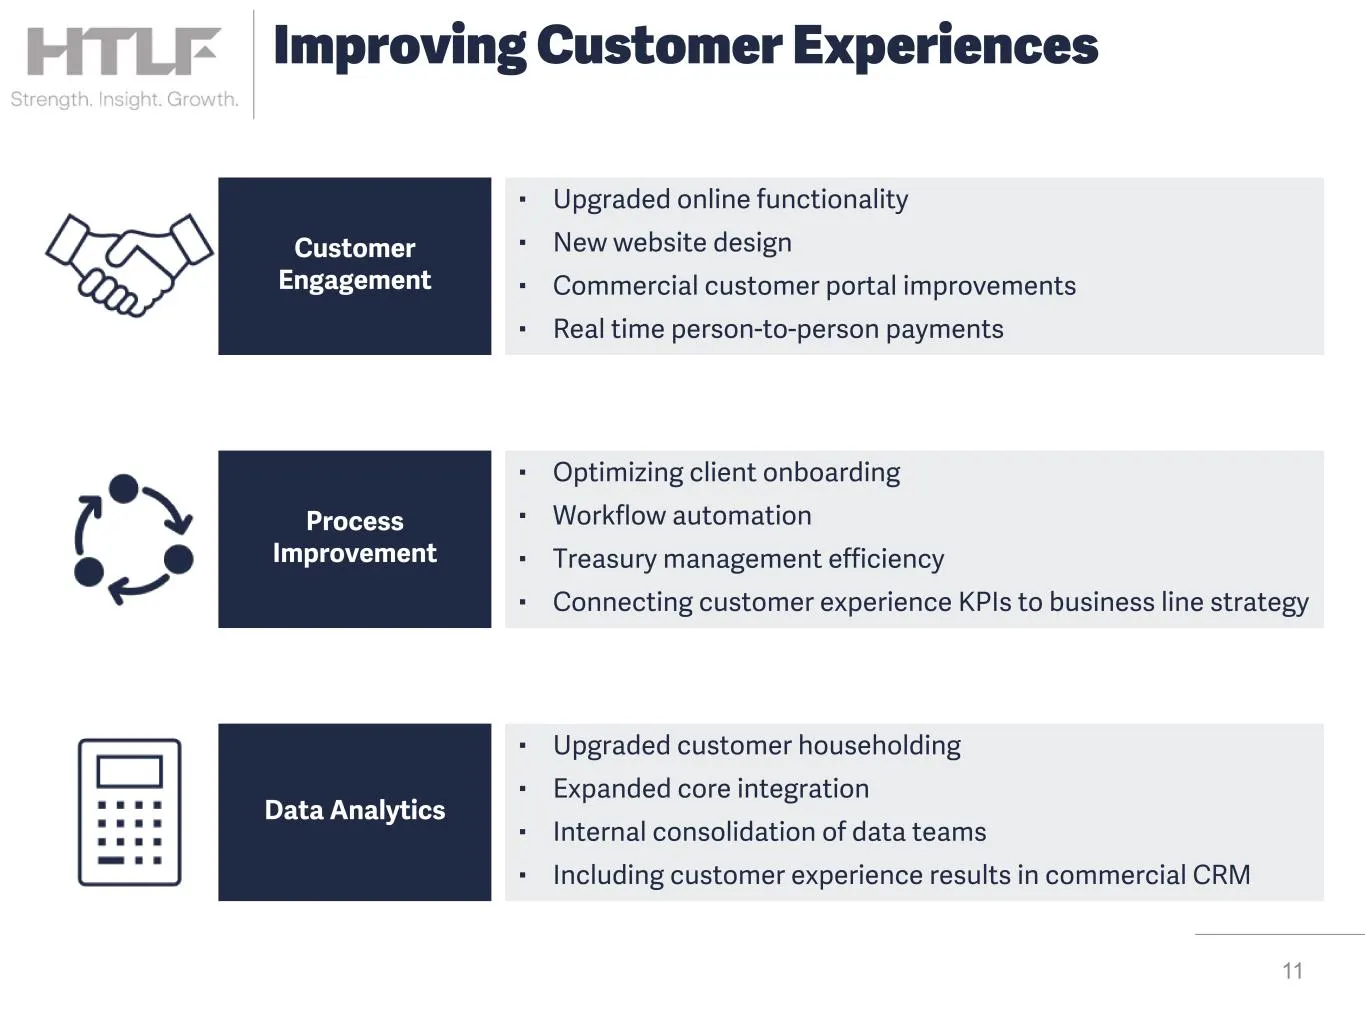
11 Improving Customer Experiences Customer Engagement Process Improvement Data Analytics ▪ Upgraded online functionality ▪ New website design ▪ Commercial customer portal improvements ▪ Real time person-to-person payments ▪ Optimizing client onboarding ▪ Workflow automation ▪ Treasury management eff
Slide 12: Bank Optimization Initiatives
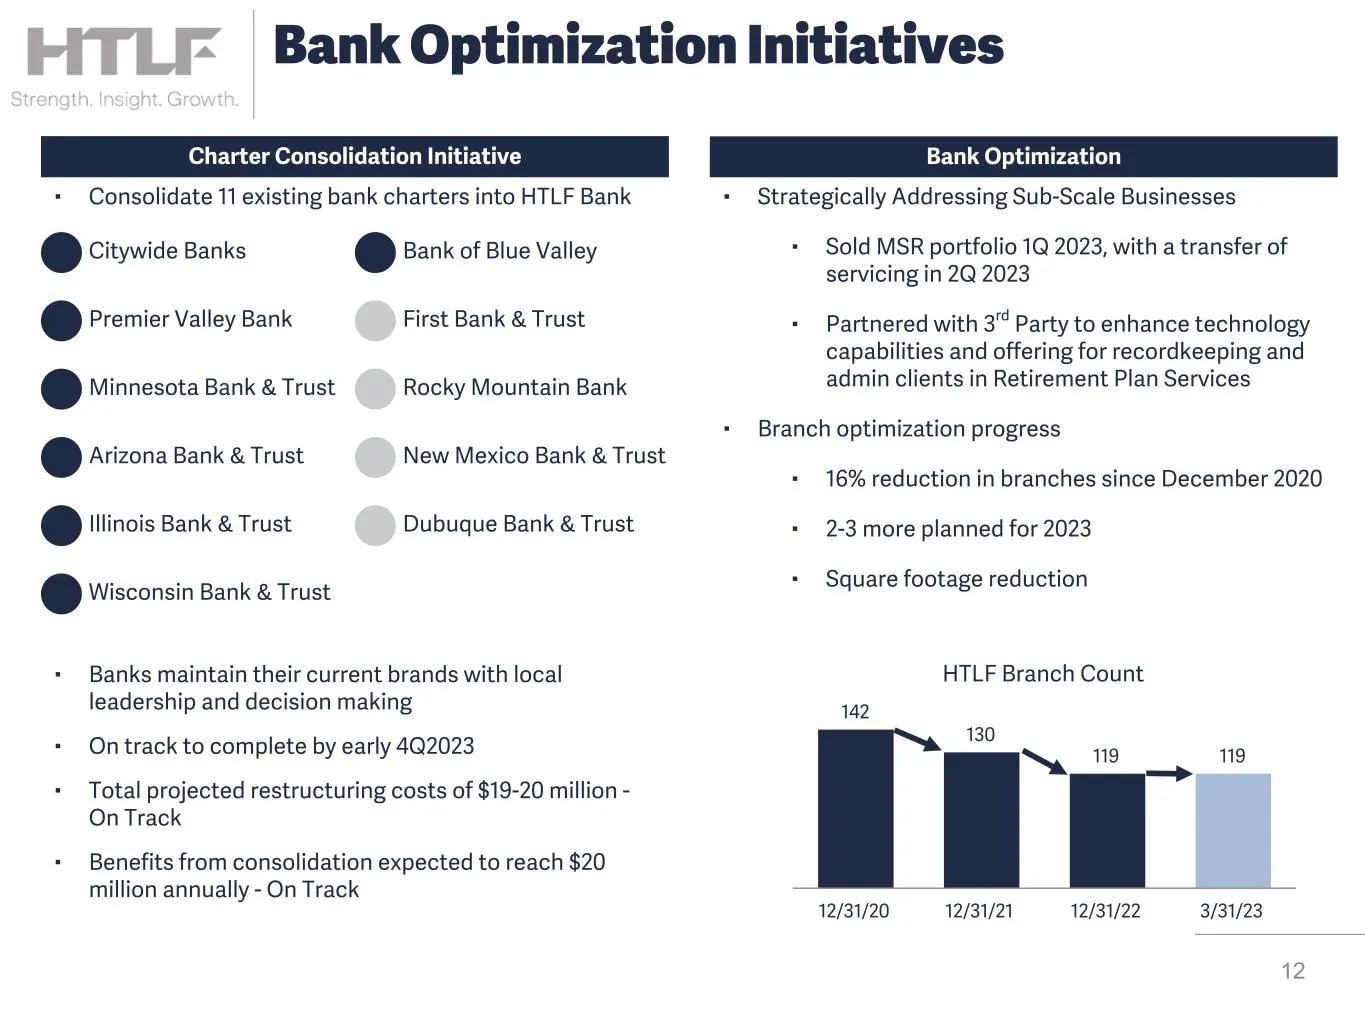
HTLF Branch Count 142 130 119 119 12/31/20 12/31/21 12/31/22 3/31/23 ▪ Consolidate 11 existing bank charters into HTLF Bank ▪ Strategically Addressing Sub-Scale Businesses ▪ Sold MSR portfolio 1Q 2023, with a transfer of servicing in 2Q 2023 ▪ Partnered with 3rd Party to enhance technology capabilit
Slide 13: Focus on Credit Discipline
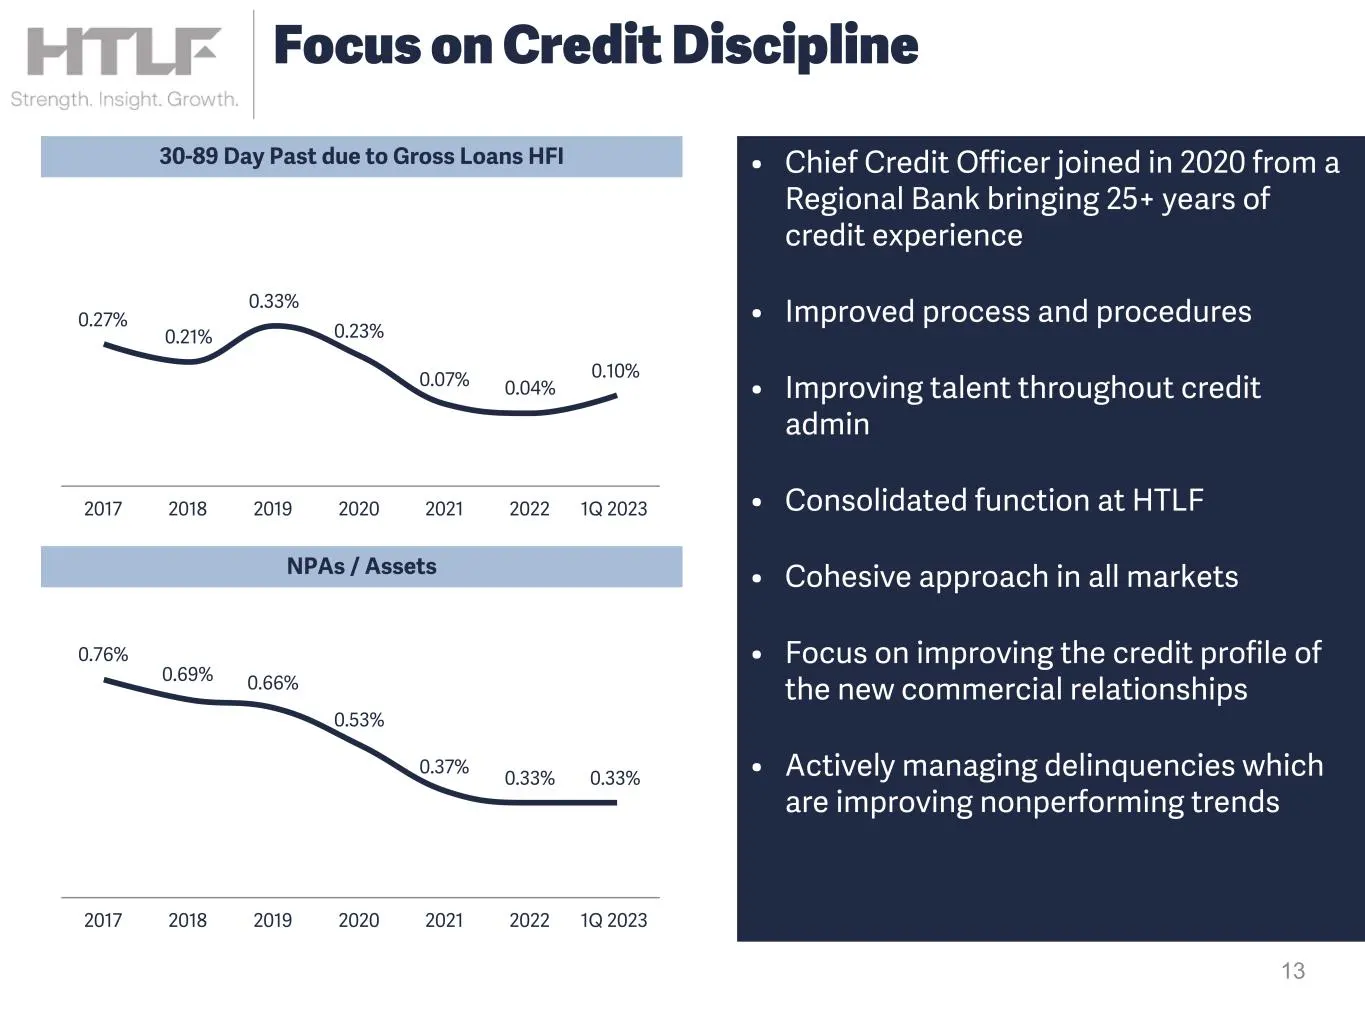
13 Focus on Credit Discipline • Chief Credit Officer joined in 2020 from a Regional Bank bringing 25+ years of credit experience • Improved process and procedures • Improving talent throughout credit admin • Consolidated function at HTLF • Cohesive approach in all markets • Focus on improving the cr
Slide 14: Improving Quality of Capital Base
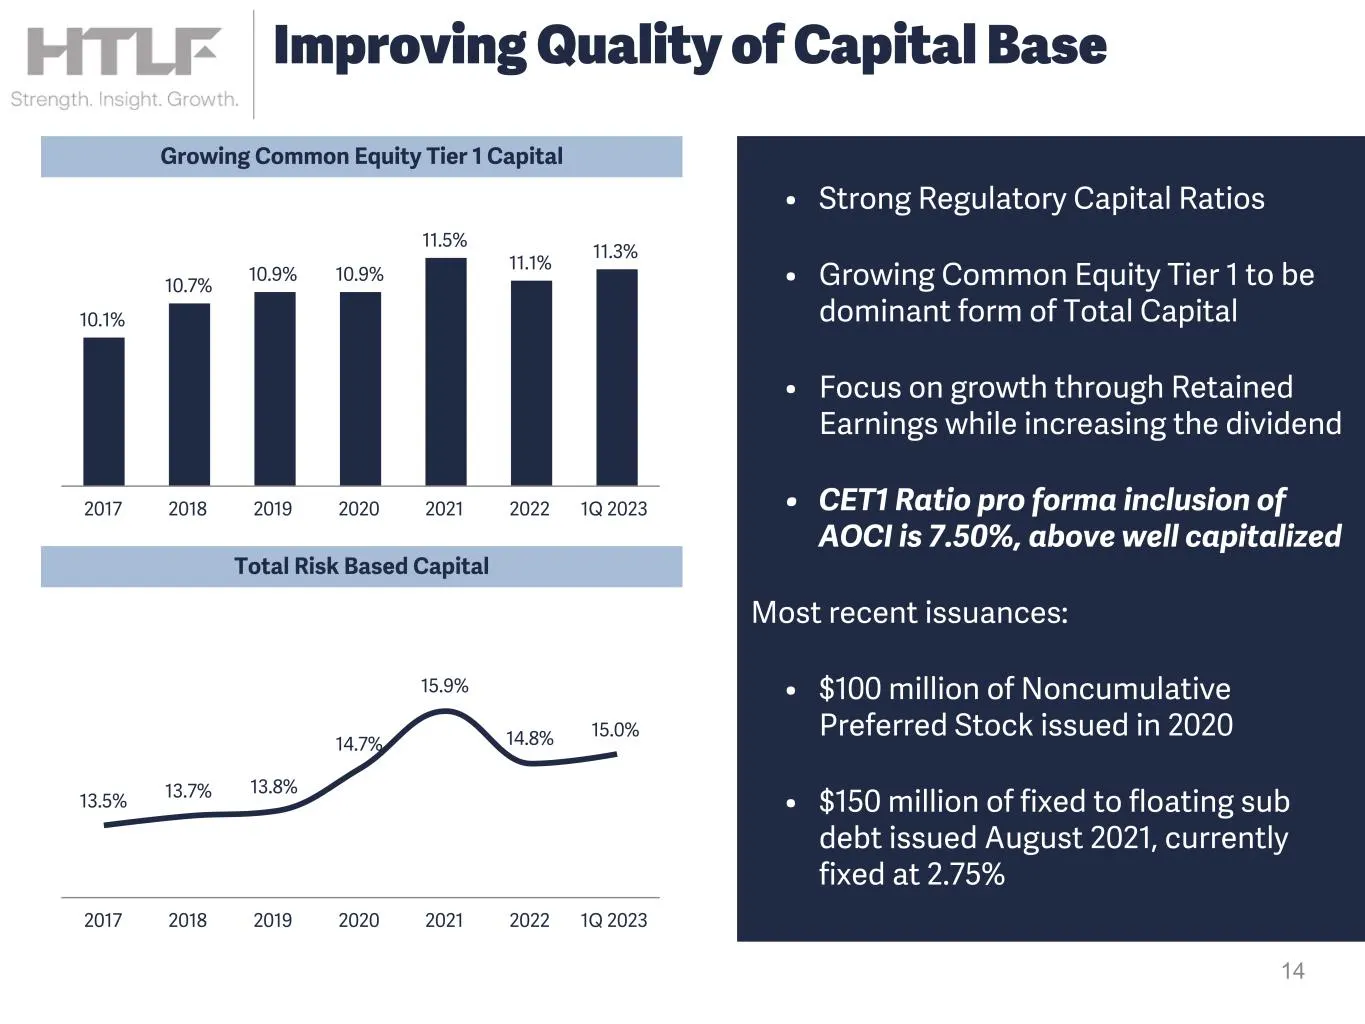
14 Improving Quality of Capital Base • Strong Regulatory Capital Ratios • Growing Common Equity Tier 1 to be dominant form of Total Capital • Focus on growth through Retained Earnings while increasing the dividend • CET1 Ratio pro forma inclusion of AOCI is 7.50%, above well capitalized Most recent
Slide 15: HTLF Investment Thesis
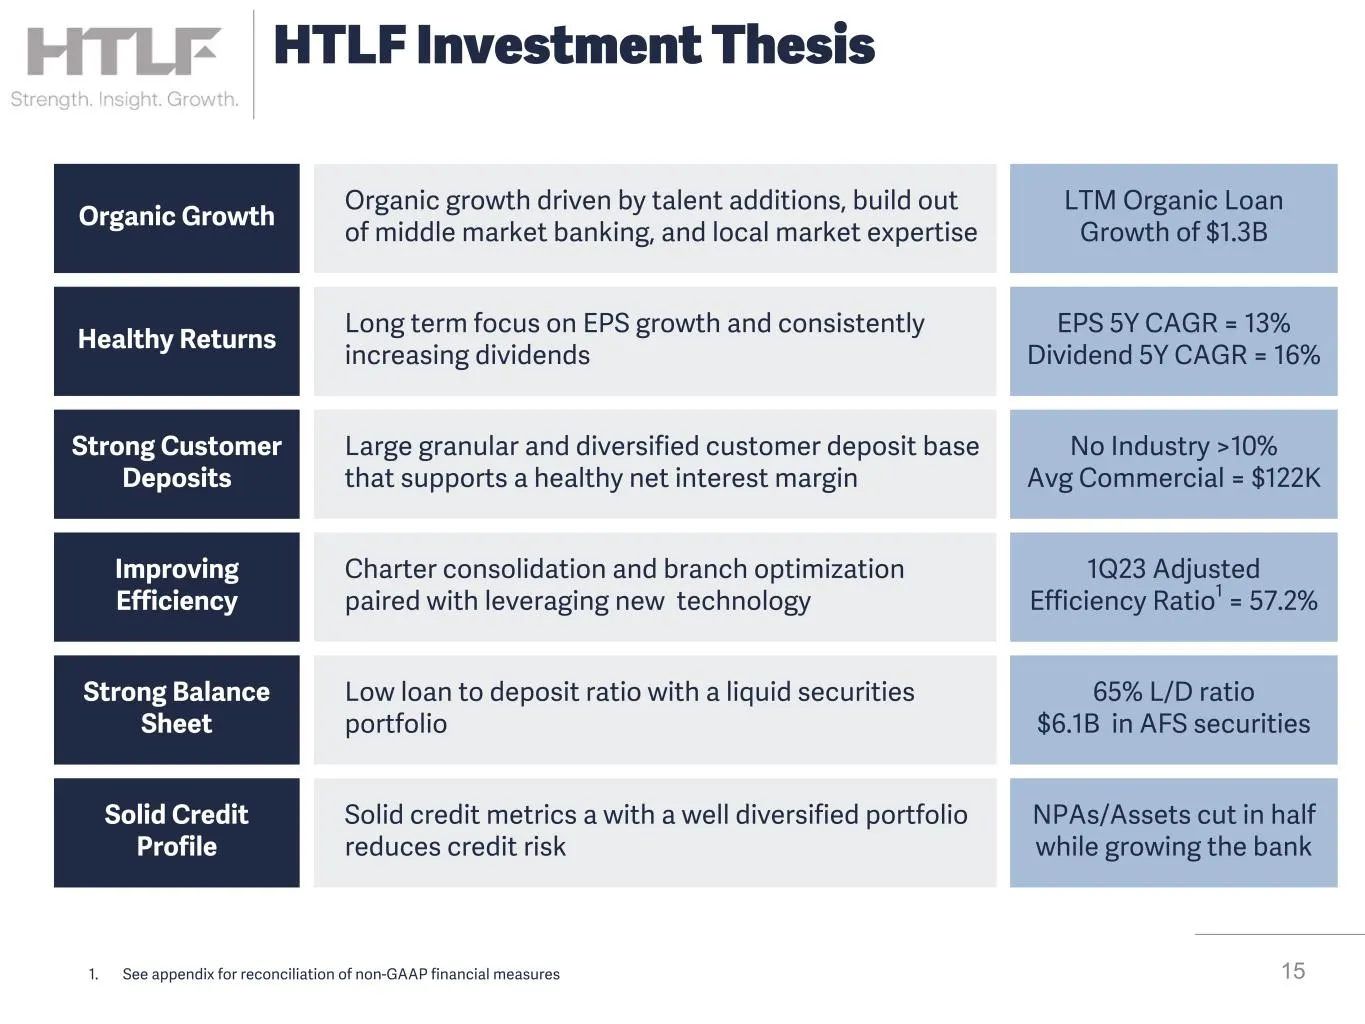
15 Organic Growth Healthy Returns Strong Customer Deposits Improving Efficiency Organic growth driven by talent additions, build out of middle market banking, and local market expertise Large granular and diversified customer deposit base that supports a healthy net interest margin Charter consolida
Slide 16: Financial Summary
Financial Summary 16
Slide 17: Fiscal 1Q 2023 Financial Highlights
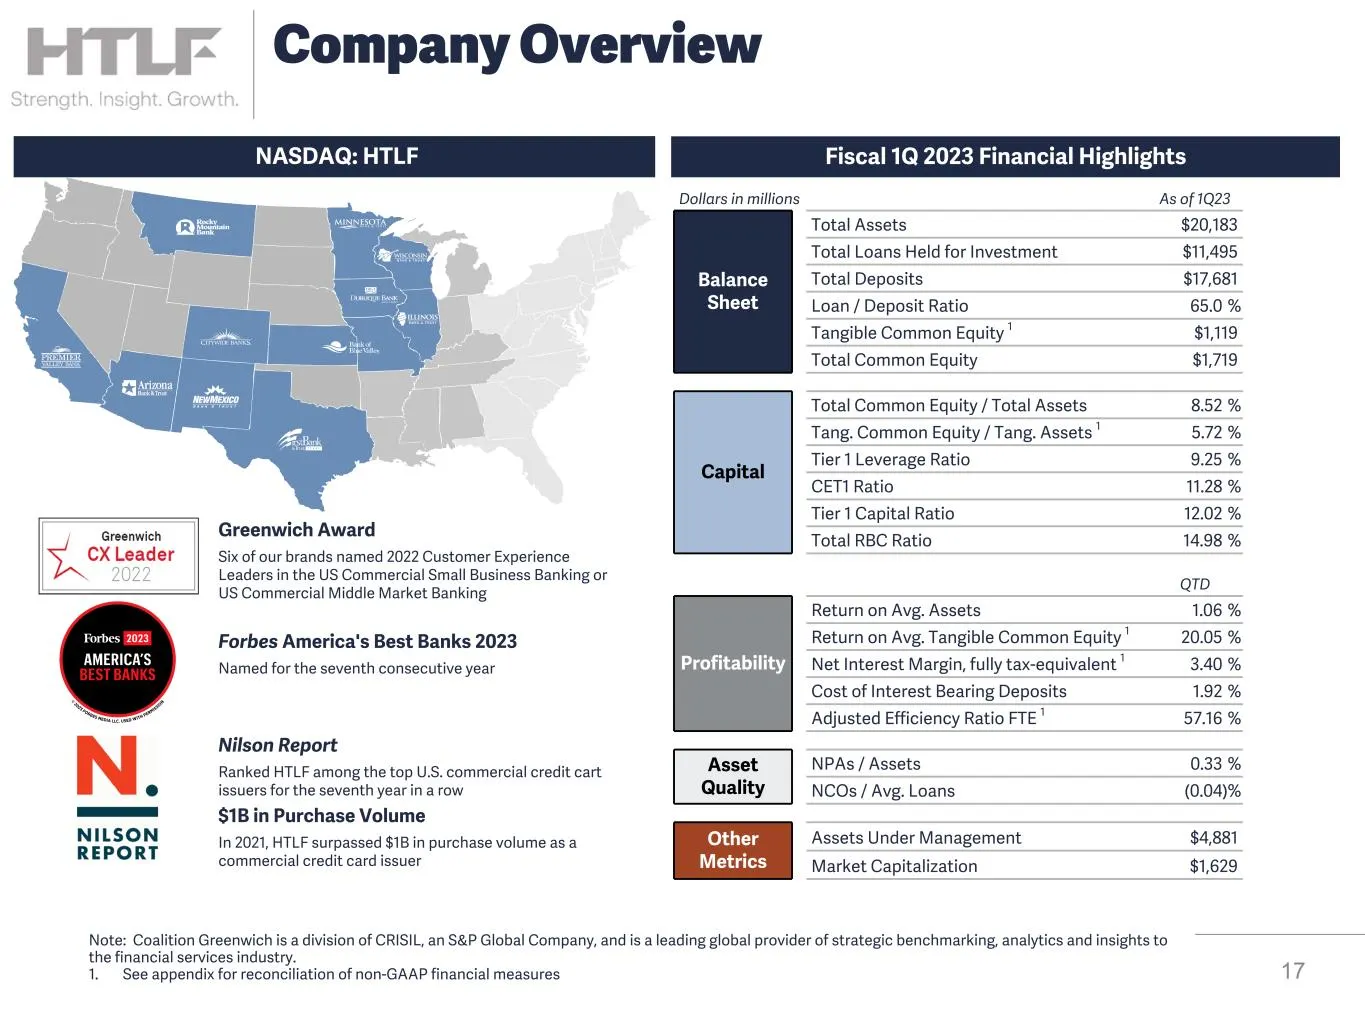
NASDAQ: HTLF Fiscal 1Q 2023 Financial Highlights Dollars in millions As of 1Q23 Balance Sheet Total Assets $20,183 Total Loans Held for Investment $11,495 Total Deposits $17,681 Loan / Deposit Ratio 65.0 % Tangible Common Equity 1 $1,119 Total Common Equity $1,719 Capital Total Common Equity / Total
Slide 18: 1Q 2023 Highlights
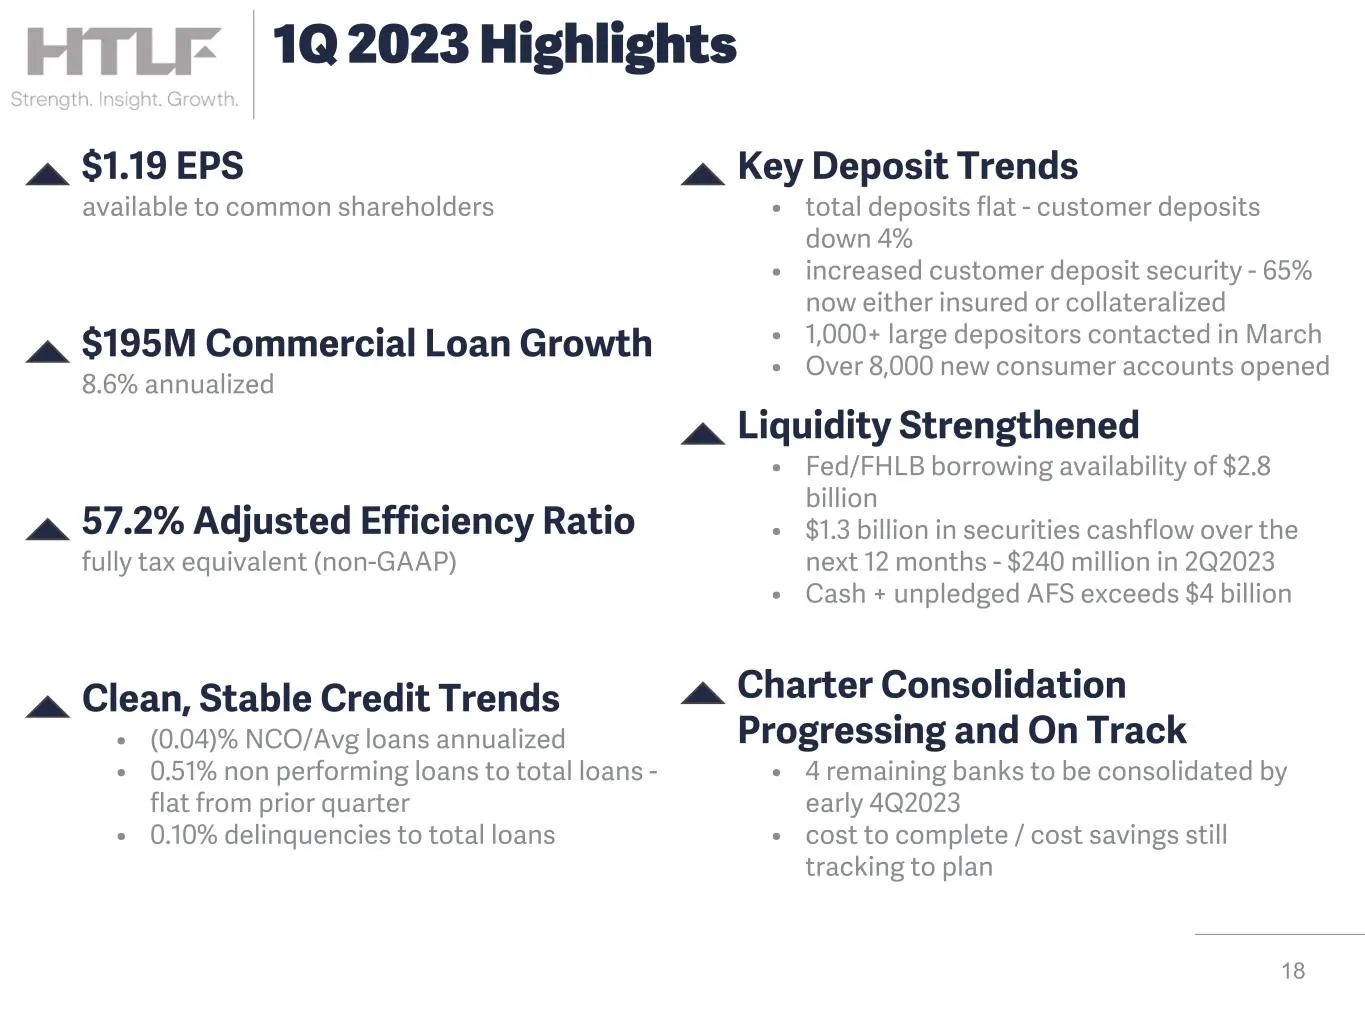
18 1Q 2023 Highlights Liquidity Strengthened • Fed/FHLB borrowing availability of $2.8 billion • $1.3 billion in securities cashflow over the next 12 months - $240 million in 2Q2023 • Cash + unpledged AFS exceeds $4 billion $1.19 EPS available to common shareholders Key Deposit Trends • total deposi
Slide 19: Deposit and liquidity actions
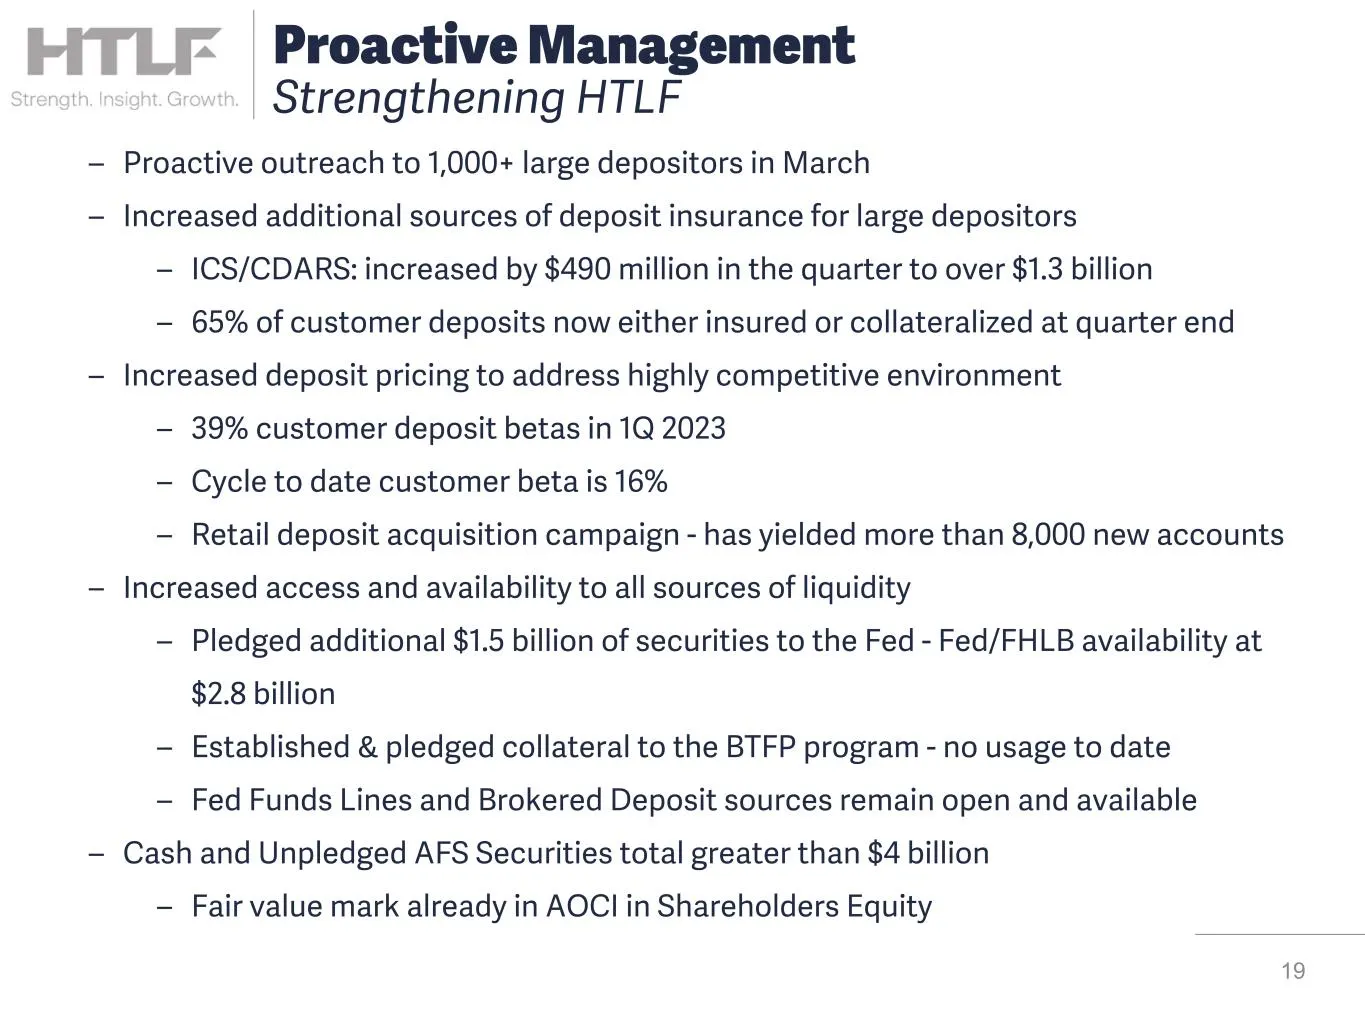
19 – Proactive outreach to 1,000+ large depositors in March – Increased additional sources of deposit insurance for large depositors – ICS/CDARS: increased by $490 million in the quarter to over $1.3 billion – 65% of customer deposits now either insured or collateralized at quarter end – Increased d
Slide 20: Diversified and Stable Deposit Base
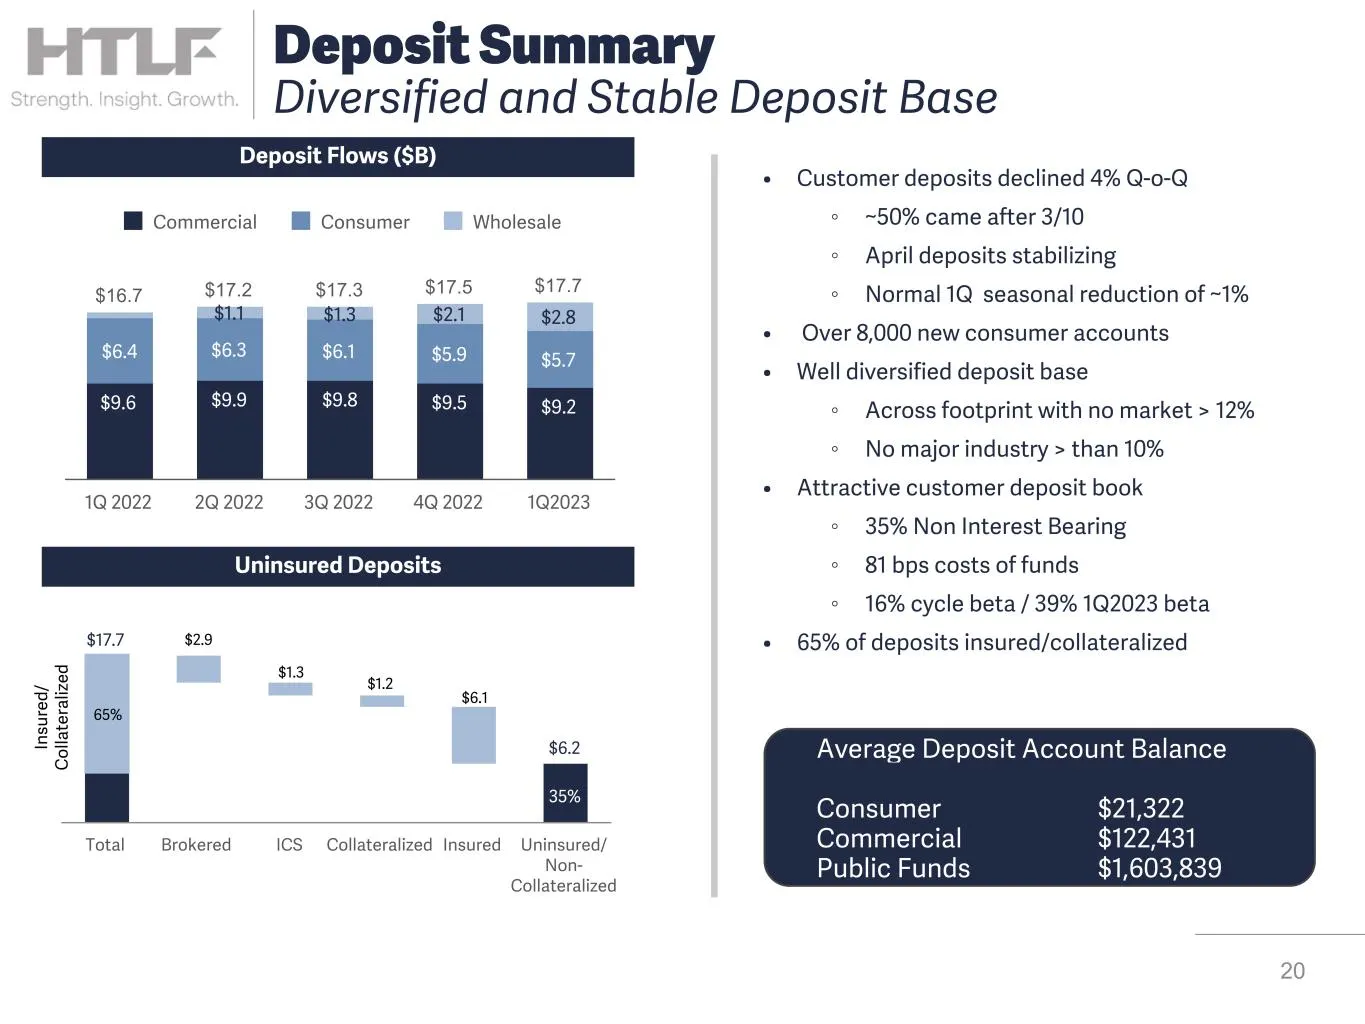
Deposit Flows ($B) 20 Deposit Summary Diversified and Stable Deposit Base Uninsured Deposits $17.7 $6.2 35% Total Brokered ICS Collateralized Insured Uninsured/ Non- Collateralized In su re d/ C ol la te ra liz ed $2.9 65% $1.3 $1.2 $6.1 $16.7 $17.2 $17.3 $17.5 $17.7 $9.6 $9.9 $9.8 $9.5 $9.2 $6.4 $6
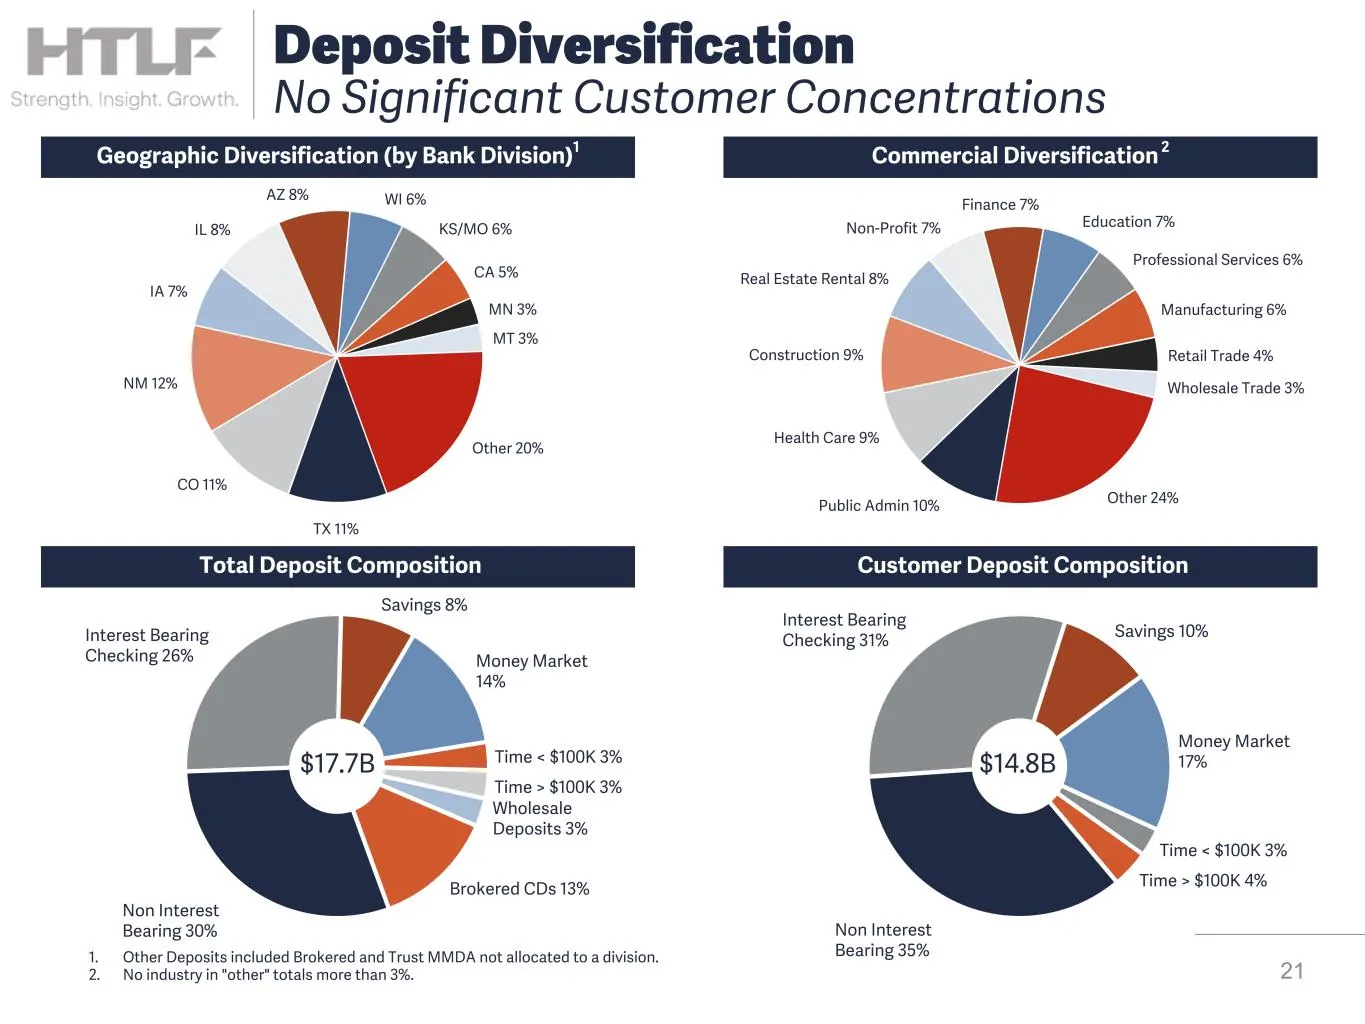
Slide 21: Deposit Diversification
Non Interest Bearing 30% Interest Bearing Checking 26% Savings 8% Money Market 14% Time < $100K 3% Time > $100K 3% Wholesale Deposits 3% Brokered CDs 13% Geographic Diversification (by Bank Division)1 Commercial Diversification 2 21 Deposit Diversification No Significant Customer Concentrations Tota
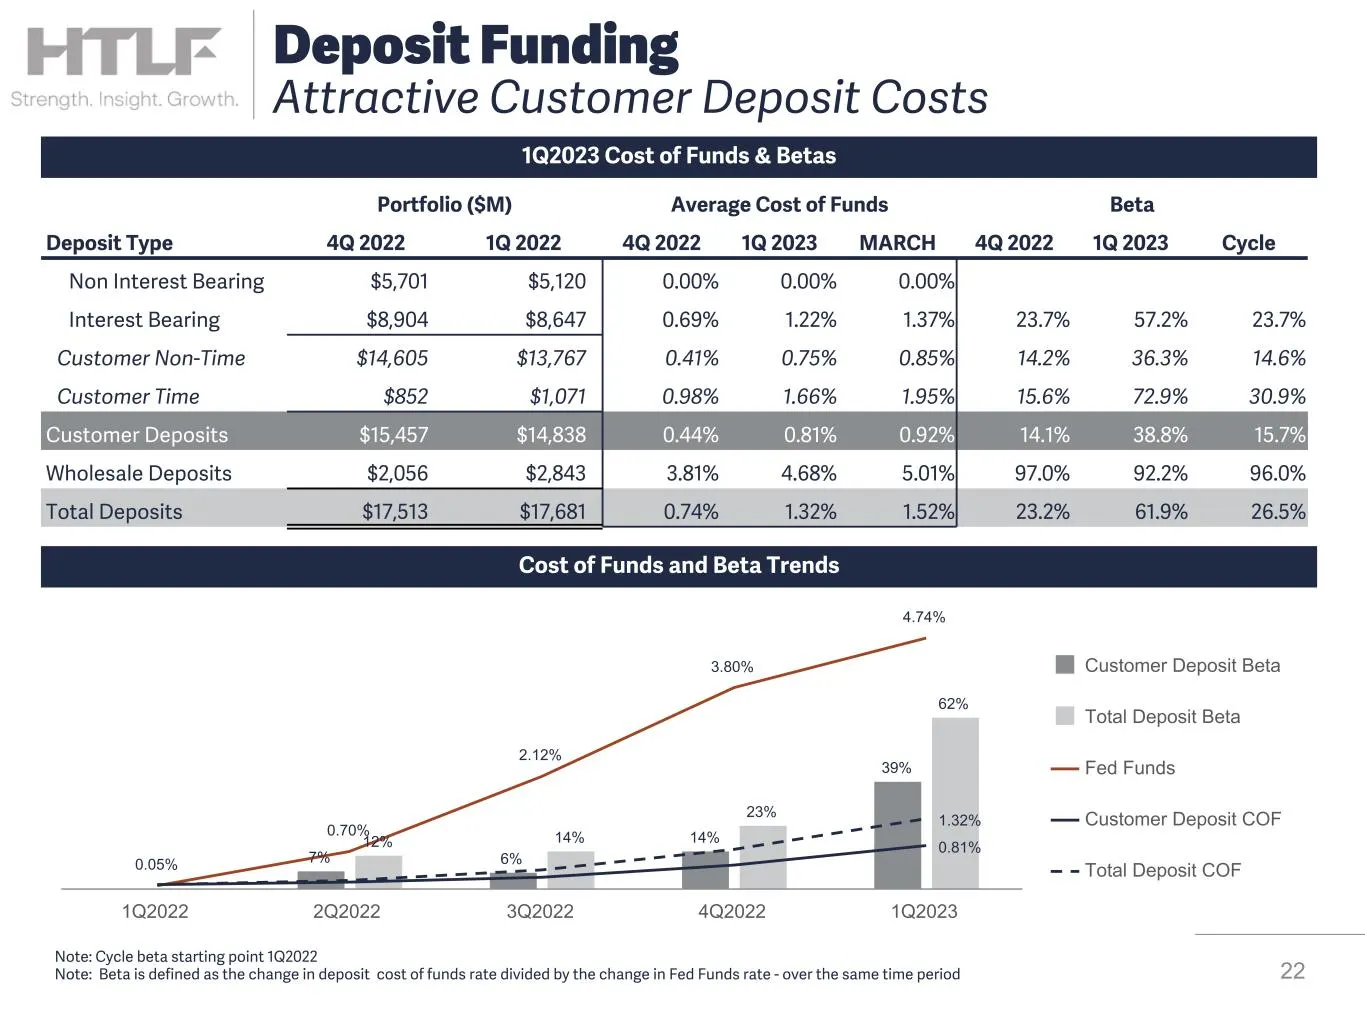
Slide 22: 1Q2023 Cost of Funds & Betas
1Q2023 Cost of Funds & Betas 22 Deposit Funding Attractive Customer Deposit Costs Portfolio ($M) Average Cost of Funds Beta Deposit Type 4Q 2022 1Q 2022 4Q 2022 1Q 2023 MARCH 4Q 2022 1Q 2023 Cycle Non Interest Bearing $5,701 $5,120 0.00 % 0.00 % 0.00 % Interest Bearing $8,904 $8,647 0.69 % 1.22 % 1.
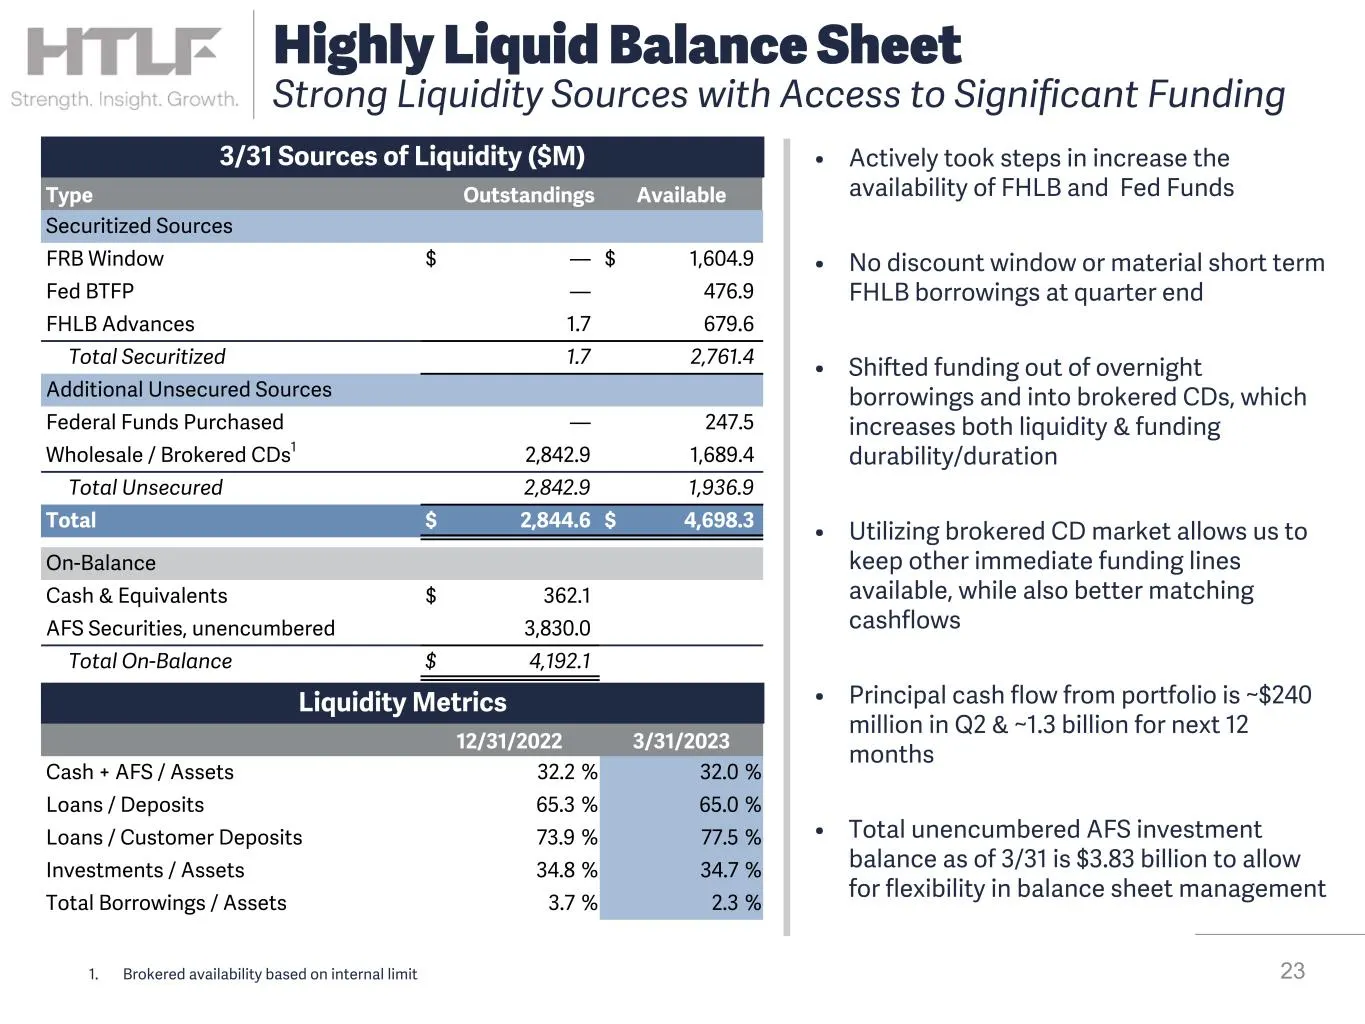
Slide 23: Highly Liquid Balance Sheet
• Actively took steps in increase the availability of FHLB and Fed Funds • No discount window or material short term FHLB borrowings at quarter end • Shifted funding out of overnight borrowings and into brokered CDs, which increases both liquidity & funding durability/duration • Utilizing brokered C
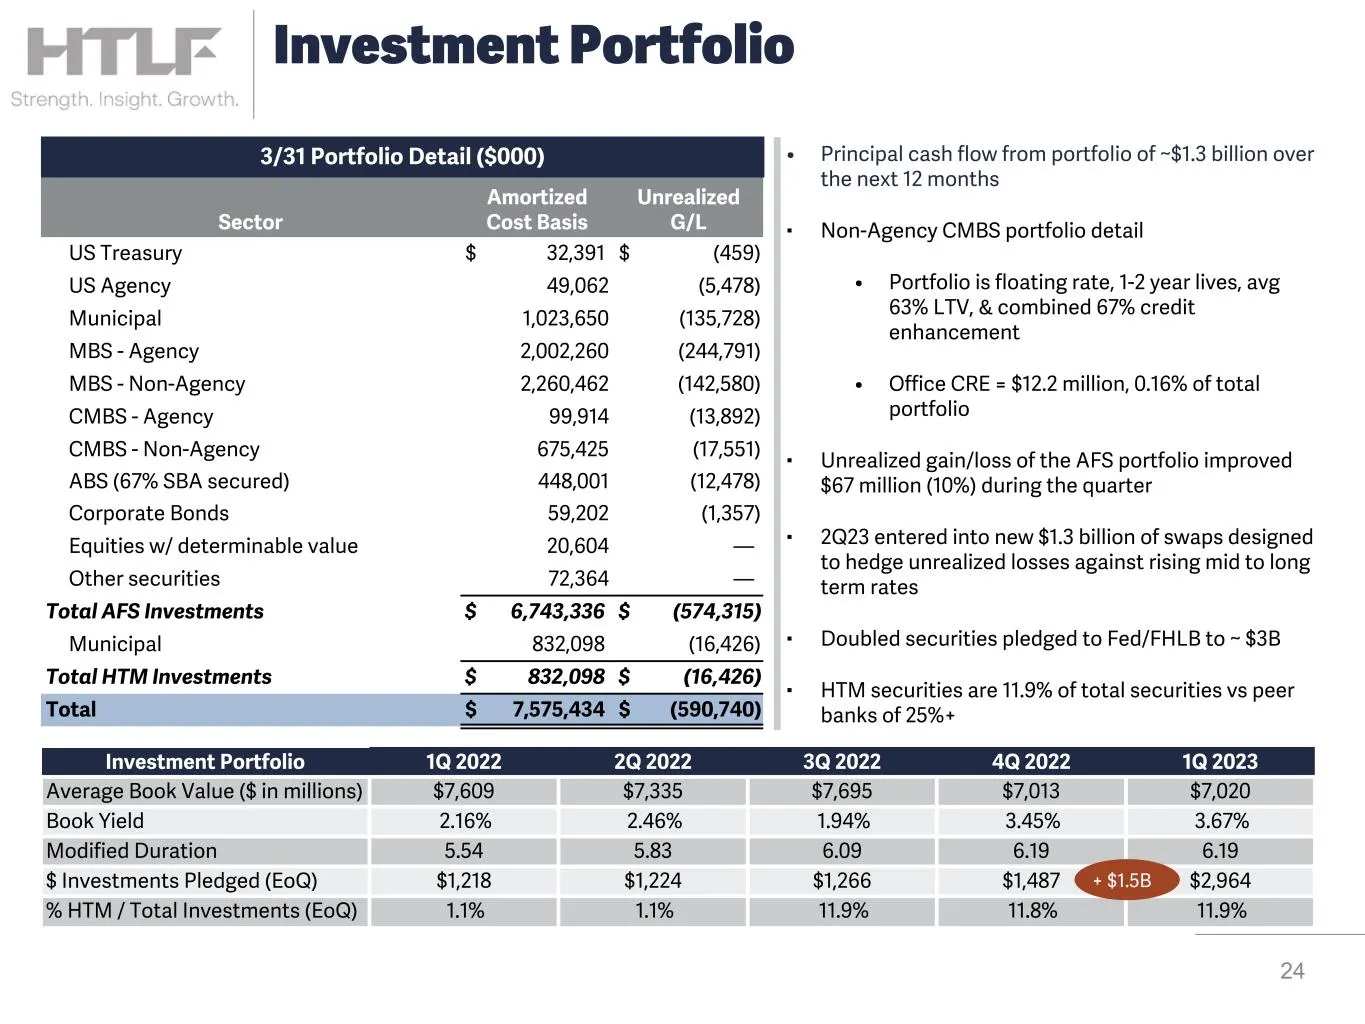
Slide 24: Investment Portfolio
Investment Portfolio 1Q 2022 2Q 2022 3Q 2022 4Q 2022 1Q 2023 Average Book Value ($ in millions) $7,609 $7,335 $7,695 $7,013 $7,020 Book Yield 2.16% 2.46% 1.94% 3.45% 3.67% Modified Duration 5.54 5.83 6.09 6.19 6.19 $ Investments Pledged (EoQ) $1,218 $1,224 $1,266 $1,487 $2,964 % HTM / Total Investme
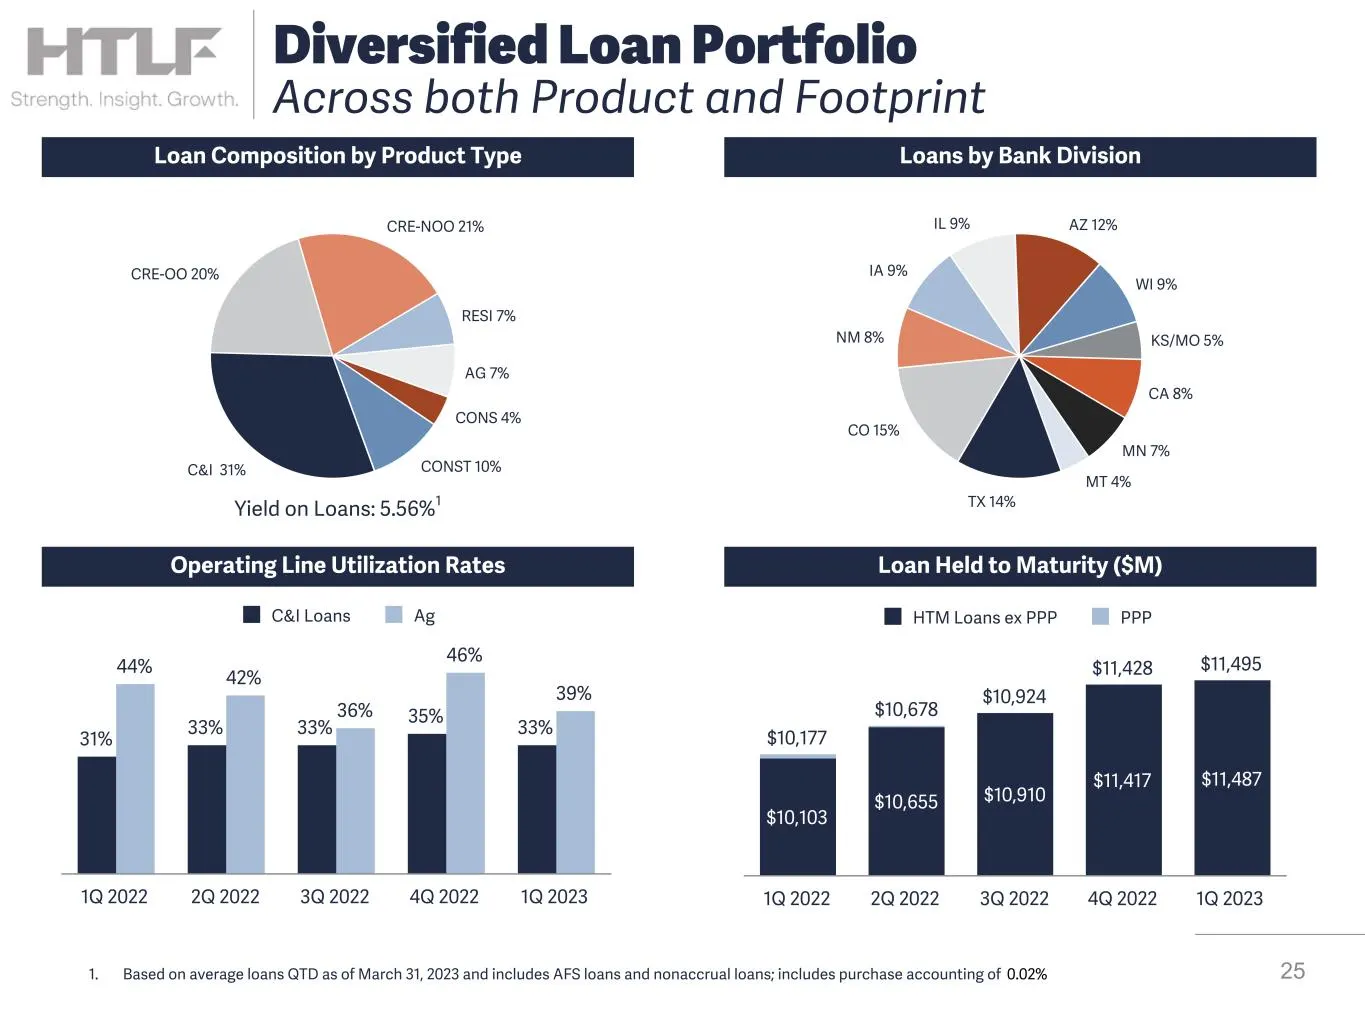
Slide 25: Diversified Loan Portfolio Across Product and Footprint
Loan Composition by Product Type Loans by Bank Division Loan Held to Maturity ($M)Operating Line Utilization Rates C&I 31% CRE-OO 20% CRE-NOO 21% RESI 7% AG 7% CONS 4% CONST 10% Yield on Loans: 5.56%1 TX 14% CO 15% NM 8% IA 9% IL 9% AZ 12% WI 9% KS/MO 5% CA 8% MN 7% MT 4% 31% 33% 33% 35% 33% 44% 42%
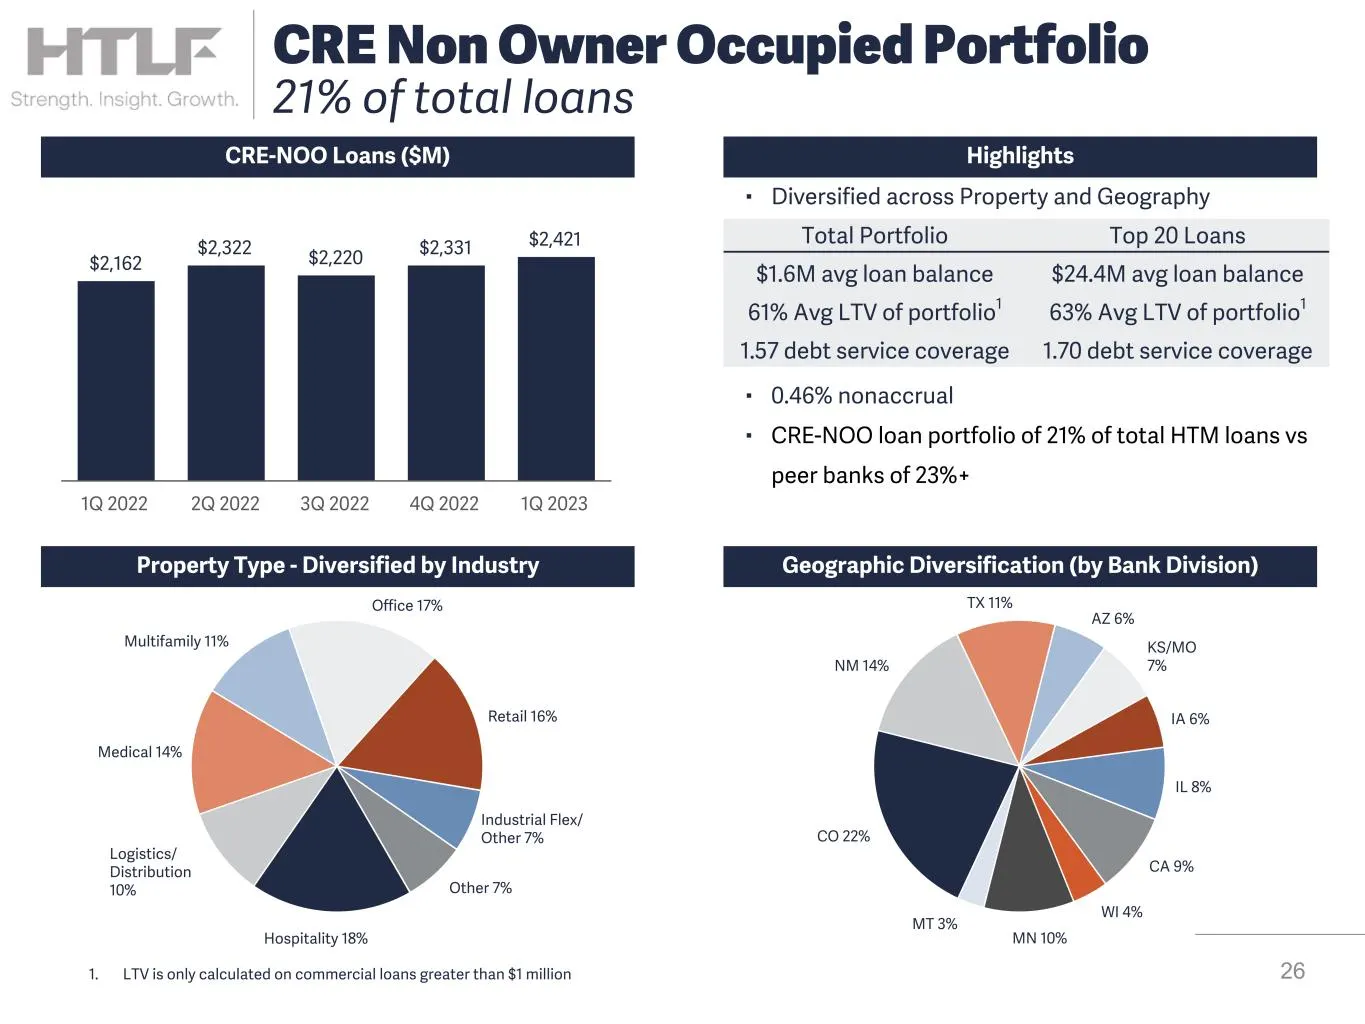
Slide 26: CRE Non Owner Occupied Portfolio
Highlights Hospitality 18% Logistics/ Distribution 10% Medical 14% Multifamily 11% Office 17% Retail 16% Industrial Flex/ Other 7% Other 7% CO 22% NM 14% TX 11% AZ 6% KS/MO 7% IA 6% IL 8% CA 9% WI 4% MN 10% MT 3% ▪ Diversified across Property and Geography ▪ 0.46% nonaccrual ▪ CRE-NOO loan portfolio
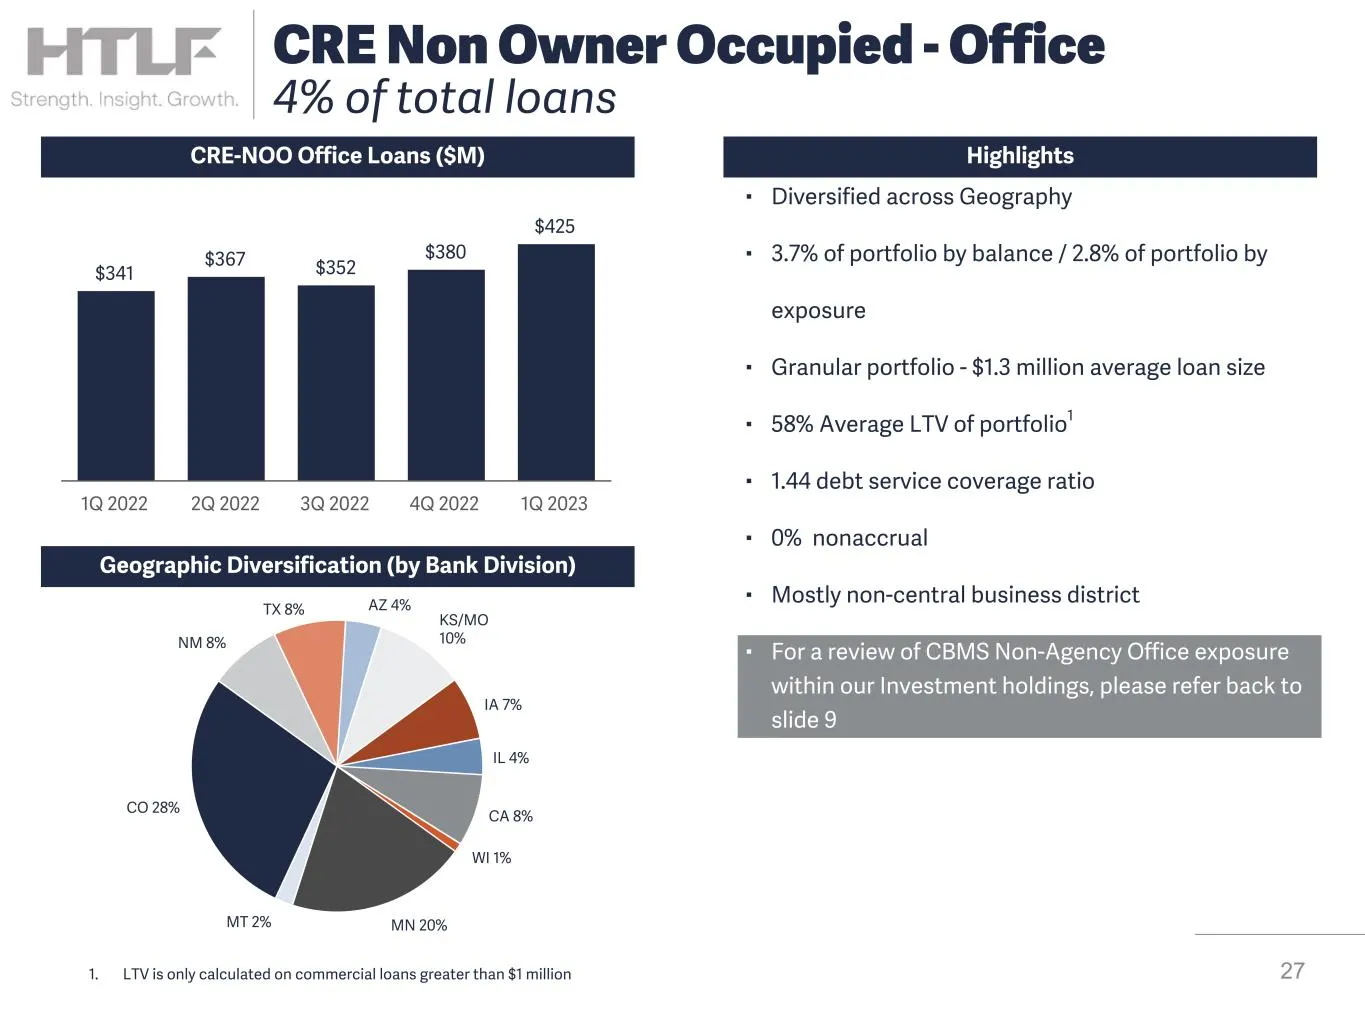
Slide 27: CRE Non Owner Occupied - Office
▪ Diversified across Geography ▪ 3.7% of portfolio by balance / 2.8% of portfolio by exposure ▪ Granular portfolio - $1.3 million average loan size ▪ 58% Average LTV of portfolio1 ▪ 1.44 debt service coverage ratio ▪ 0% nonaccrual ▪ Mostly non-central business district ▪ For a review of CBMS Non-Age
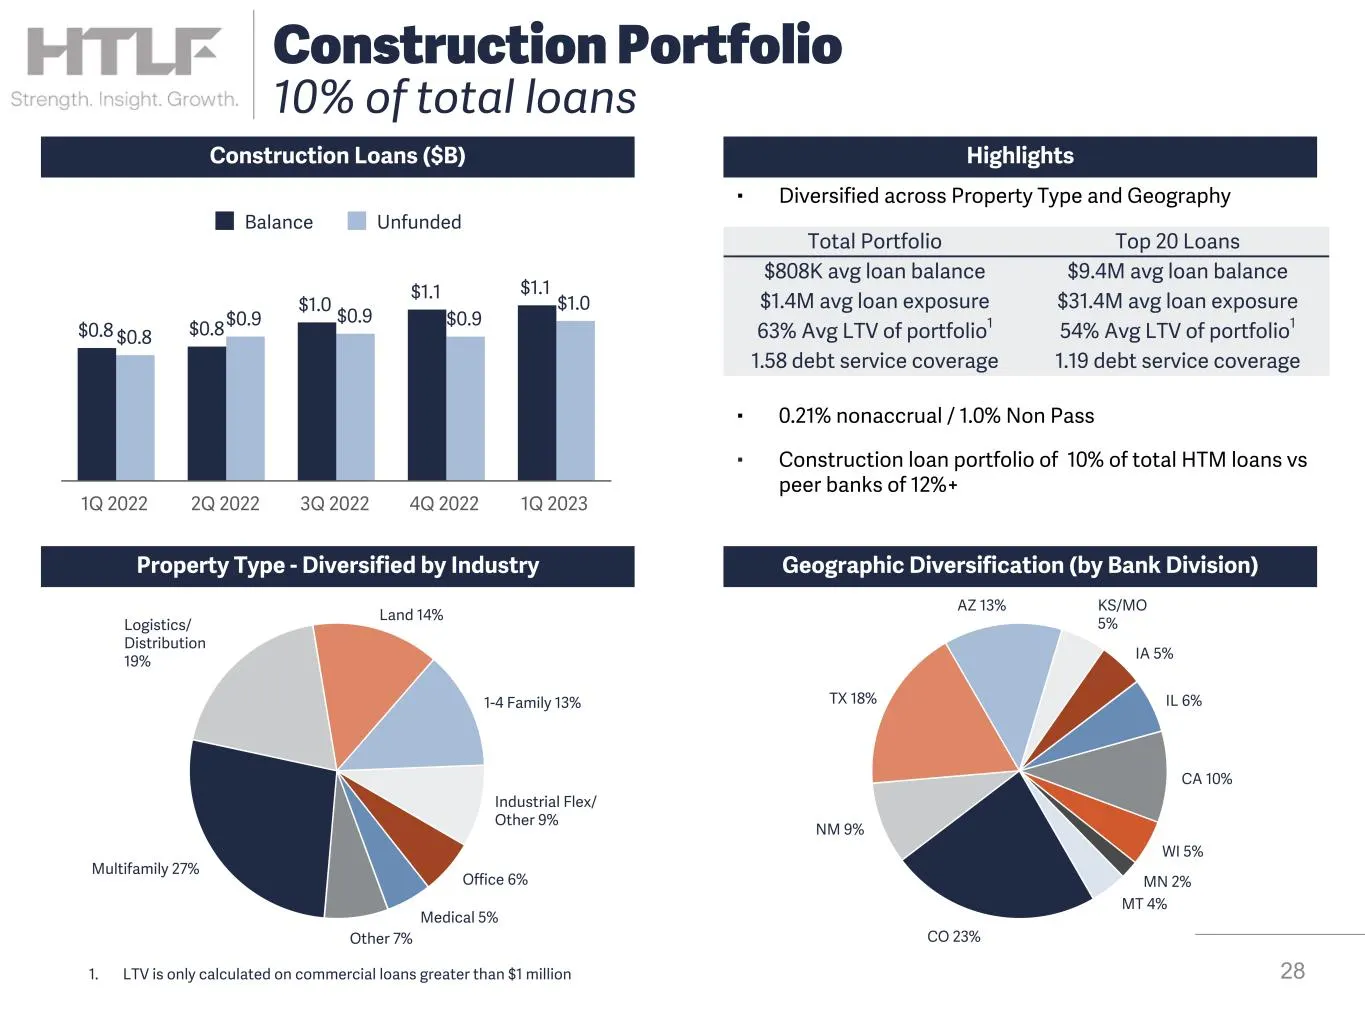
Slide 28: Construction Portfolio
28 Construction Portfolio 10% of total loans CO 23% NM 9% TX 18% AZ 13% KS/MO 5% IA 5% IL 6% CA 10% WI 5% MN 2% MT 4% Multifamily 27% Logistics/ Distribution 19% Land 14% 1-4 Family 13% Industrial Flex/ Other 9% Office 6% Medical 5% Other 7% ▪ Diversified across Property Type and Geography ▪ 0.21% n
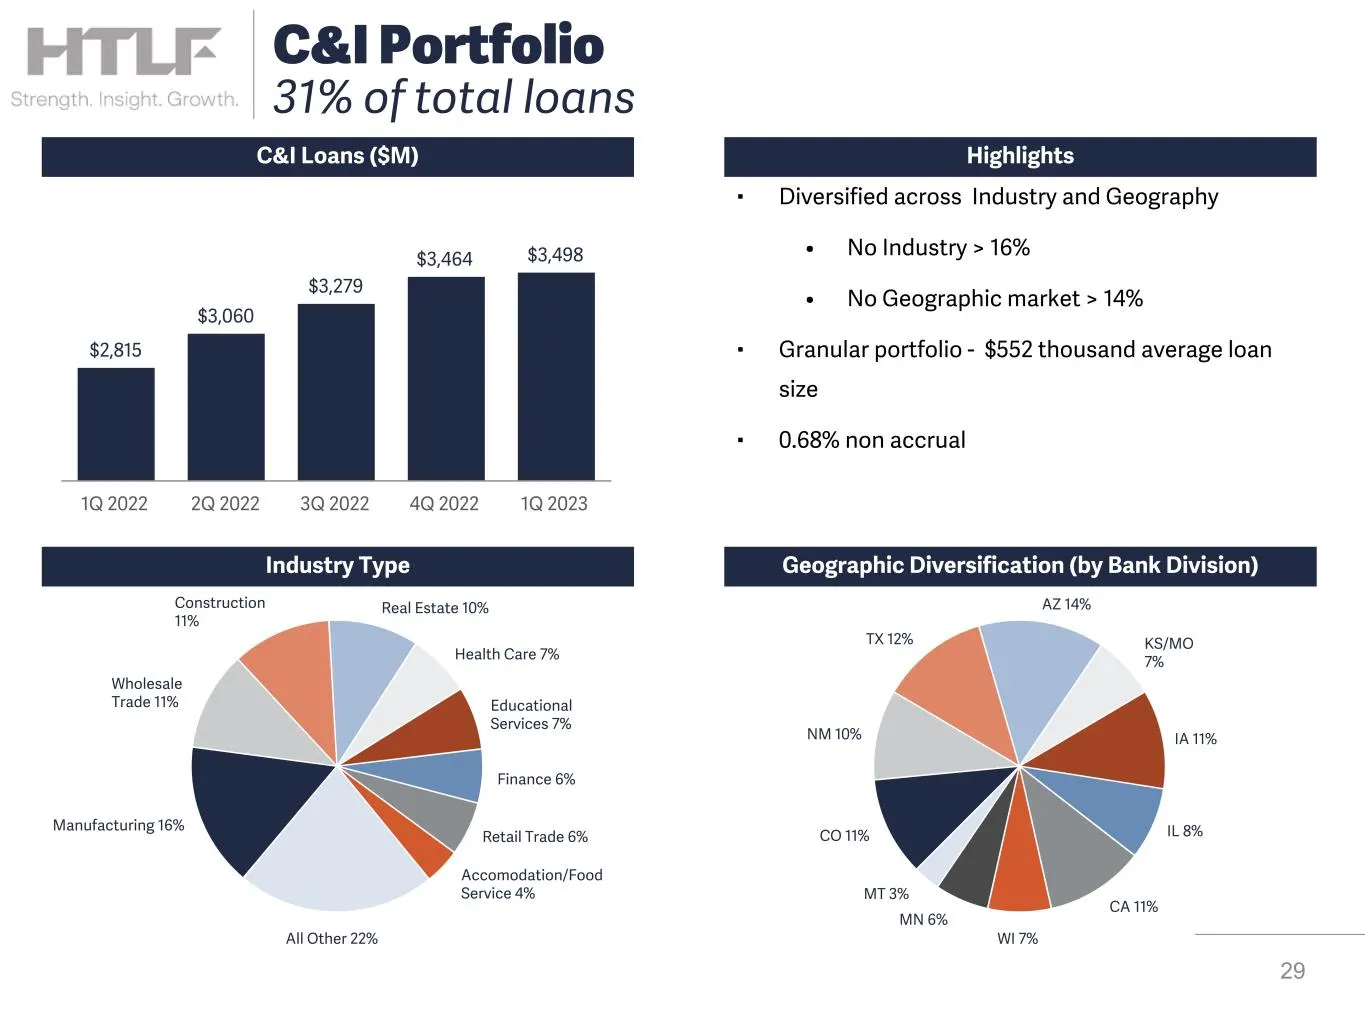
Slide 29: C&I Portfolio
Manufacturing 16% Wholesale Trade 11% Construction 11% Real Estate 10% Health Care 7% Educational Services 7% Finance 6% Retail Trade 6% Accomodation/Food Service 4% All Other 22% ▪ Diversified across Industry and Geography • No Industry > 16% • No Geographic market > 14% ▪ Granular portfolio - $552
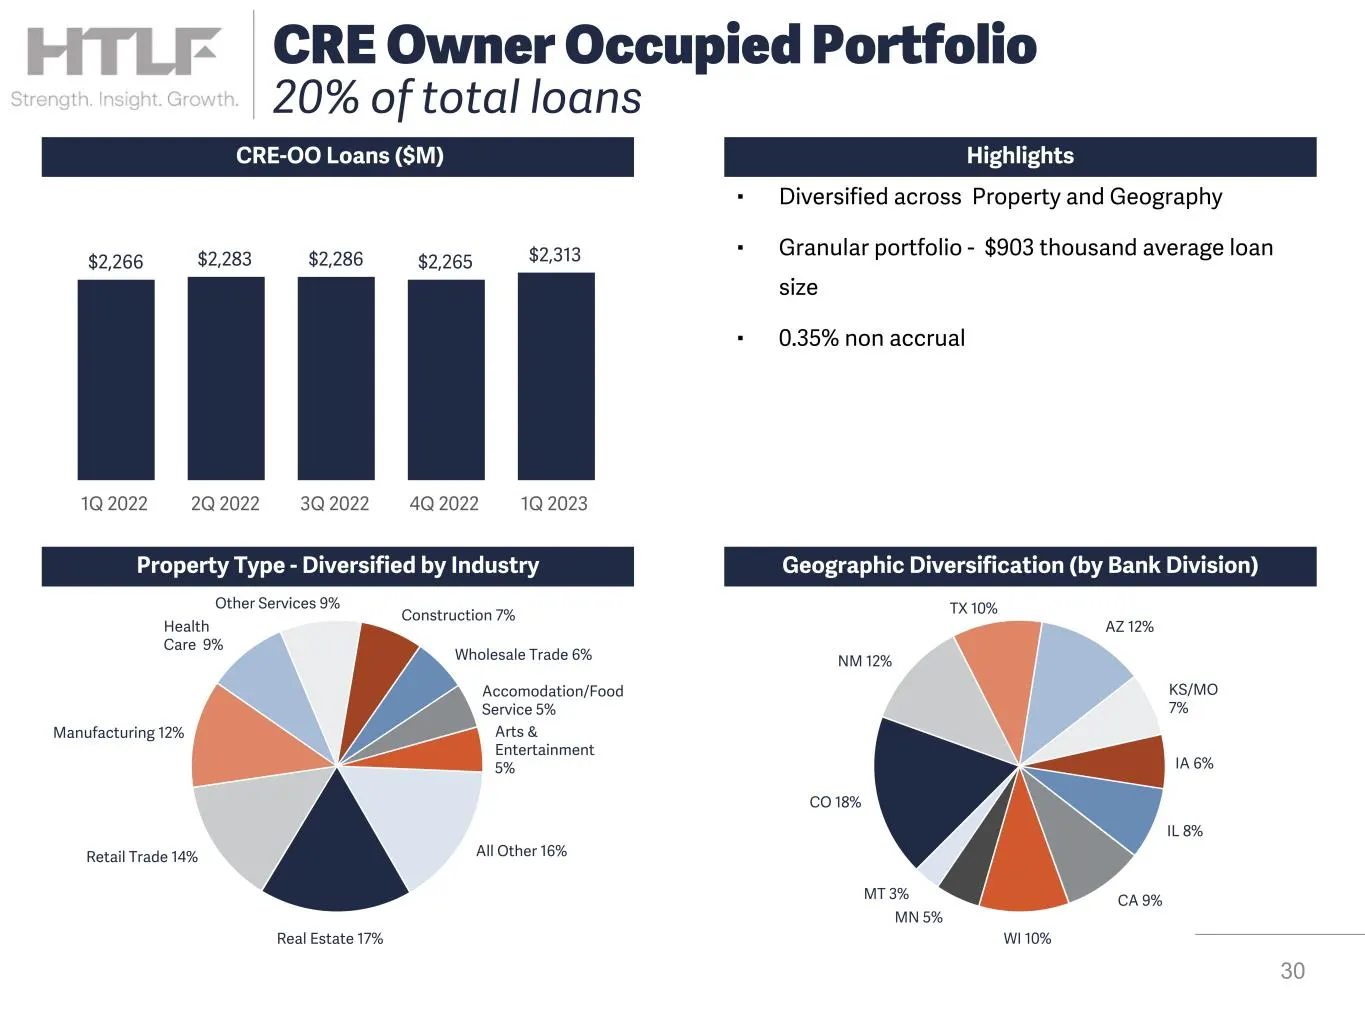
Slide 30: CRE Owner Occupied Portfolio
CO 18% NM 12% TX 10% AZ 12% KS/MO 7% IA 6% IL 8% CA 9% WI 10% MN 5% MT 3% Real Estate 17% Retail Trade 14% Manufacturing 12% Health Care 9% Other Services 9% Construction 7% Wholesale Trade 6% Accomodation/Food Service 5% Arts & Entertainment 5% All Other 16% ▪ Diversified across Property and Geogra
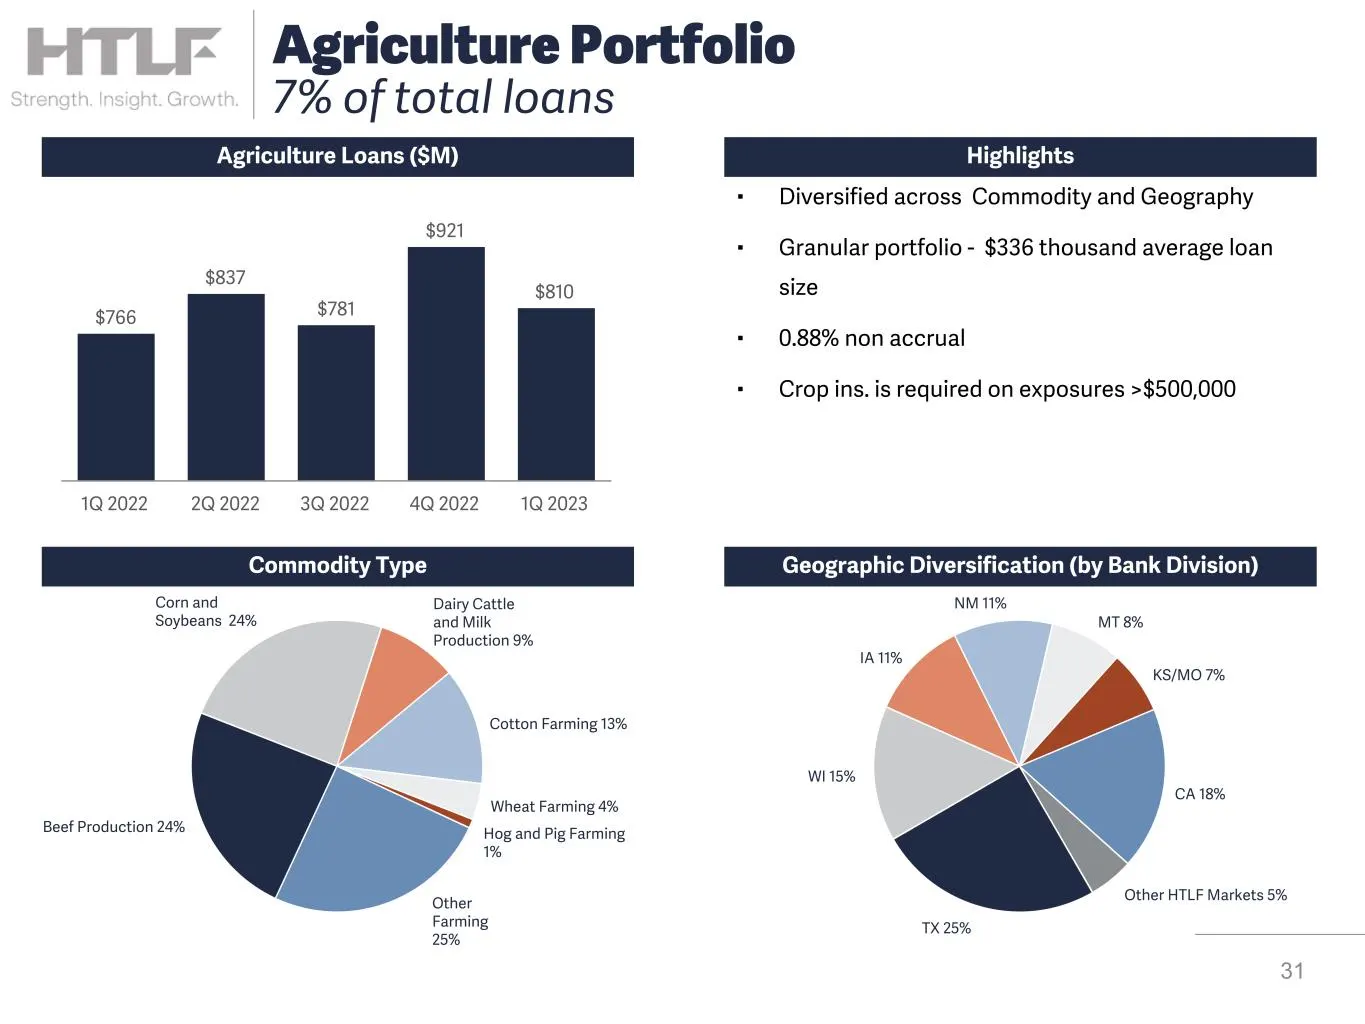
Slide 31: Agriculture Portfolio
TX 25% WI 15% IA 11% NM 11% MT 8% KS/MO 7% CA 18% Other HTLF Markets 5% ▪ Diversified across Commodity and Geography ▪ Granular portfolio - $336 thousand average loan size ▪ 0.88% non accrual ▪ Crop ins. is required on exposures >$500,000 Highlights Geographic Diversification (by Bank Division) Beef
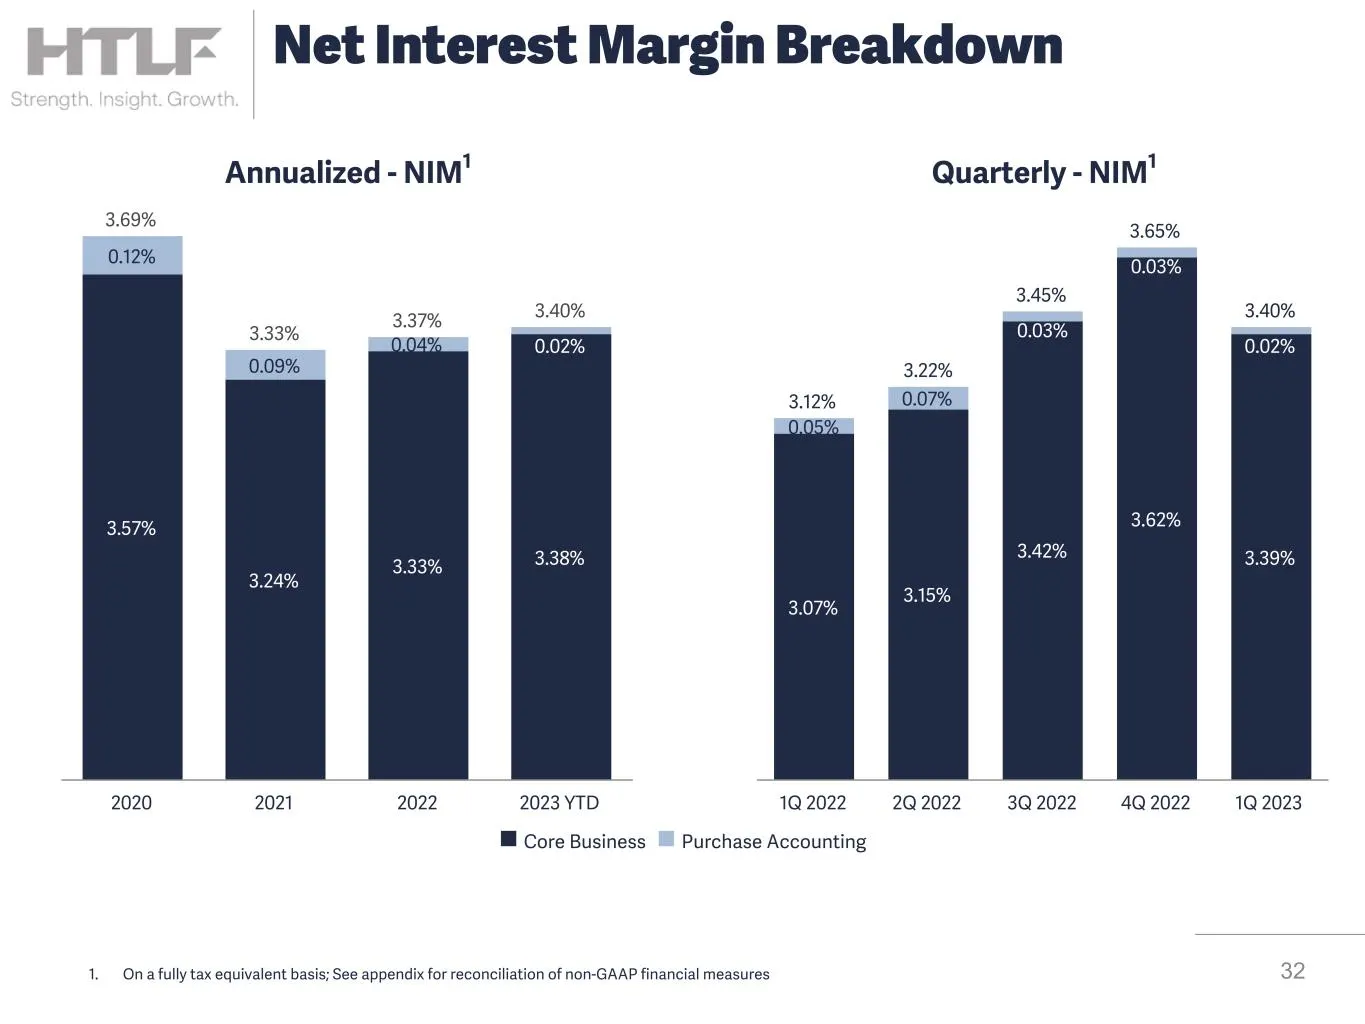
Slide 32: Net Interest Margin Breakdown
3.69% 3.33% 3.37% 3.40% 3.57% 3.24% 3.33% 3.38% 0.12% 0.09% 0.04% 0.02% 2020 2021 2022 2023 YTD 3.12% 3.22% 3.45% 3.65% 3.40% 3.07% 3.15% 3.42% 3.62% 3.39% 0.05% 0.07% 0.03% 0.03% 0.02% 1Q 2022 2Q 2022 3Q 2022 4Q 2022 1Q 2023 n Core Business n Purchase Accounting 321. On a fully tax equivalent basis
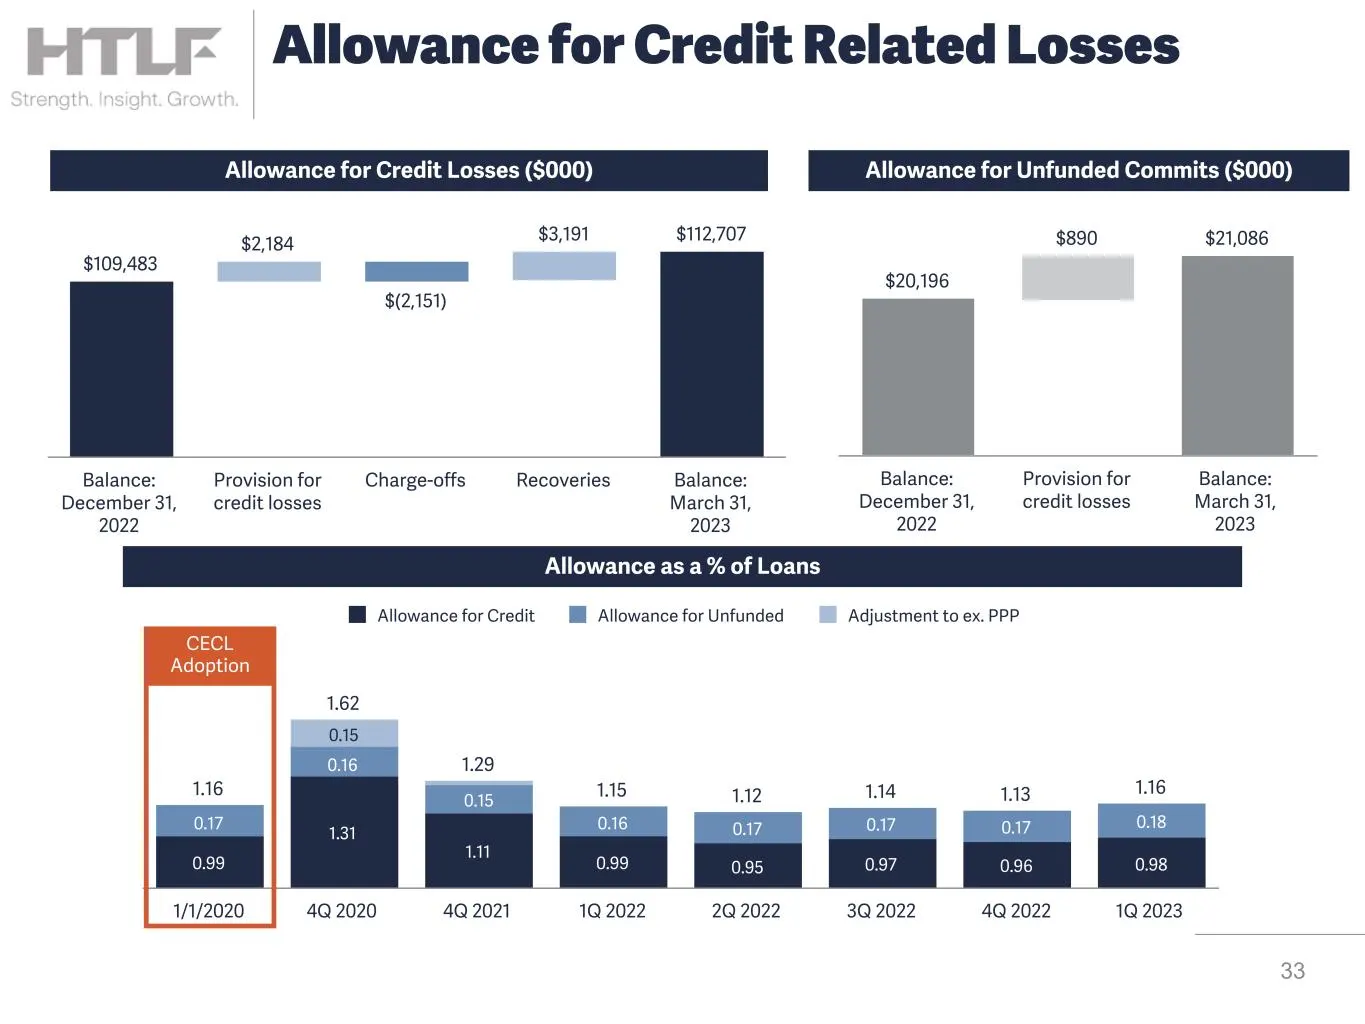
Slide 33: Allowance for Credit Related Losses
1.16 1.15 1.12 1.14 1.13 1.16 1.62 1.29 0.99 1.31 1.11 0.99 0.95 0.97 0.96 0.98 0.17 0.16 0.15 0.16 0.17 0.17 0.17 0.18 0.15 Allowance for Credit Allowance for Unfunded Adjustment to ex. PPP 1/1/2020 4Q 2020 4Q 2021 1Q 2022 2Q 2022 3Q 2022 4Q 2022 1Q 2023 $20,196 $890 $21,086 Balance: December 31, 2
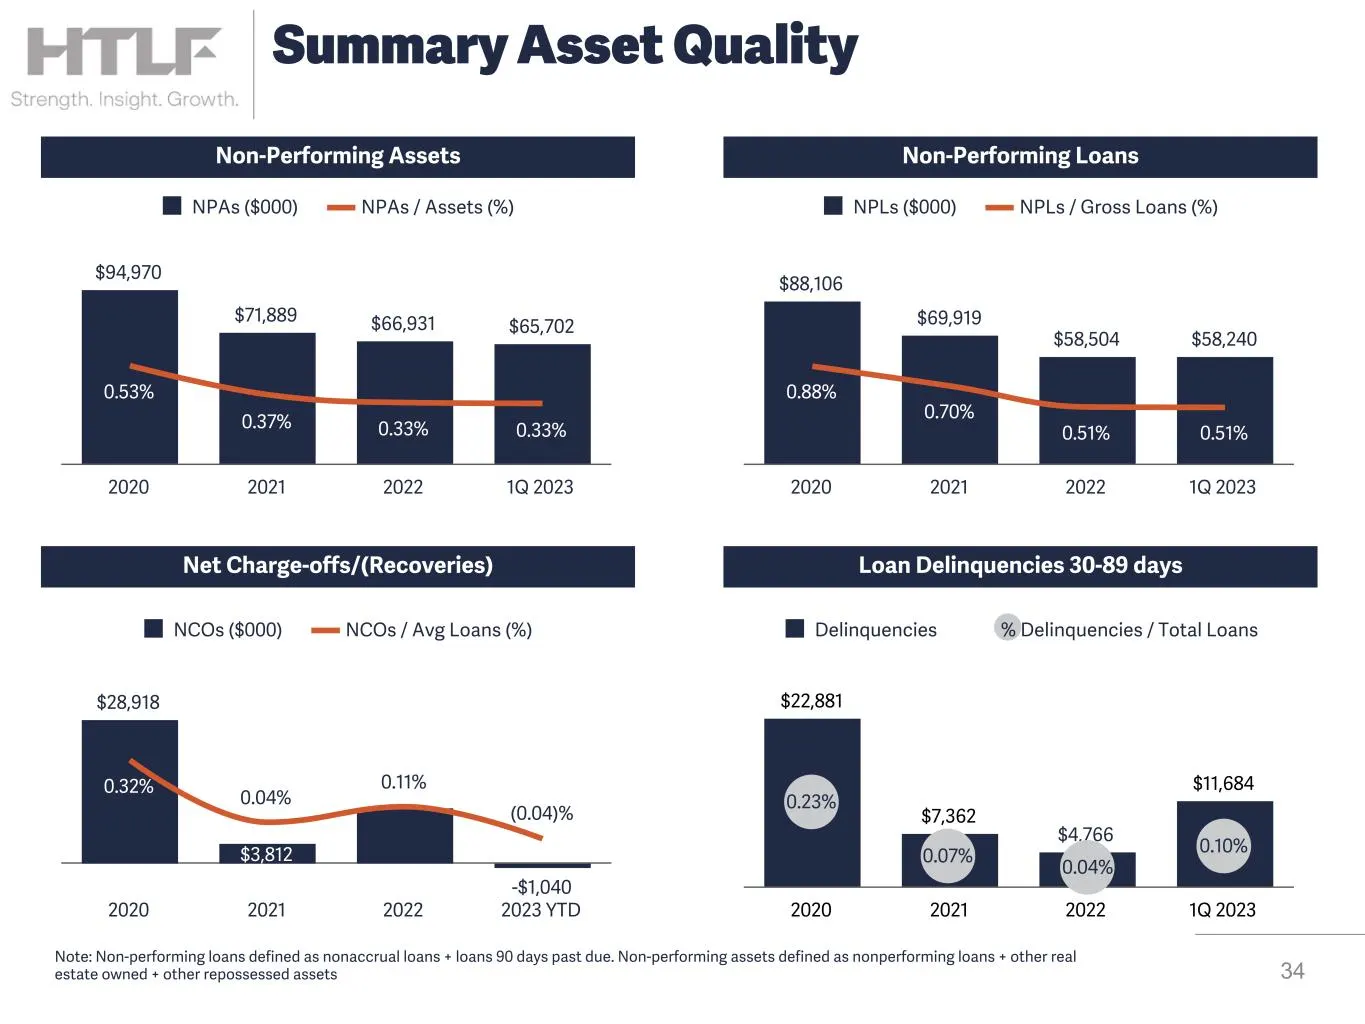
Slide 34: Summary Asset Quality
$22,881 $7,362 $4,766 $11,684 Delinquencies % Delinquencies / Total Loans 2020 2021 2022 1Q 2023 Non-Performing Assets Non-Performing Loans Net Charge-offs/(Recoveries) Loan Delinquencies 30-89 days $94,970 $71,889 $66,931 $65,702 0.53% 0.37% 0.33% 0.33% NPAs ($000) NPAs / Assets (%) 2020 2021 2022
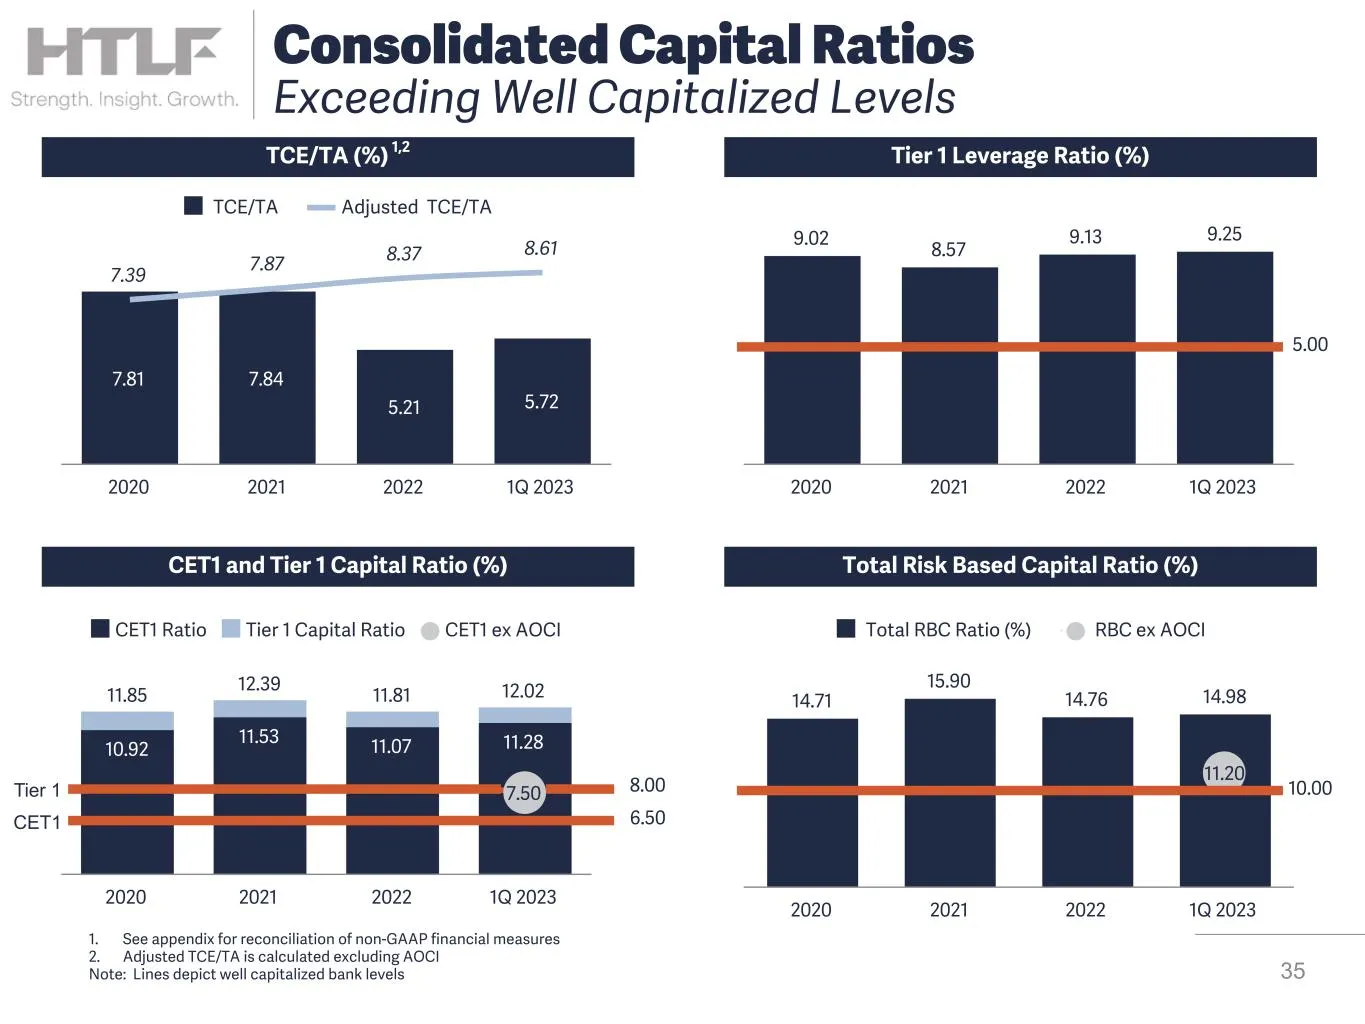
Slide 35: Consolidated Capital Ratios Exceeding Well Capitalized Levels
11.85 12.39 11.81 12.02 10.92 11.53 11.07 11.28 7.50 CET1 Ratio Tier 1 Capital Ratio CET1 ex AOCI 2020 2021 2022 1Q 2023 TCE/TA (%) 1,2 Tier 1 Leverage Ratio (%) CET1 and Tier 1 Capital Ratio (%) Total Risk Based Capital Ratio (%) 7.81 7.84 5.21 5.72 7.39 7.87 8.37 8.61 TCE/TA Adjusted TCE/TA 2020 2
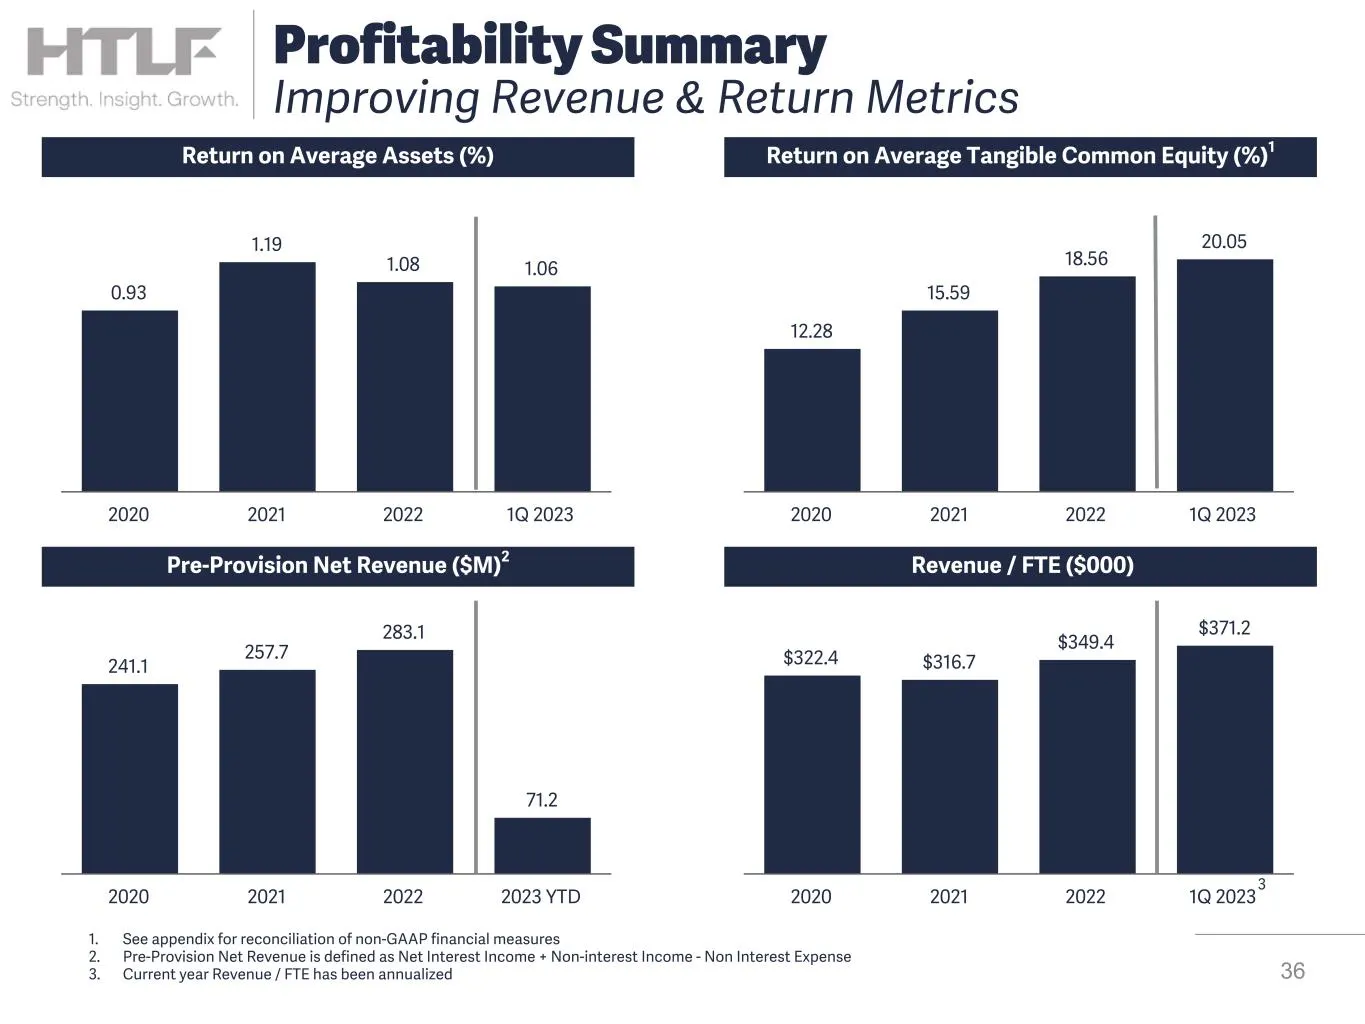
Slide 36: Profitability Summary
Return on Average Assets (%) Return on Average Tangible Common Equity (%)1 Pre-Provision Net Revenue ($M)2 Revenue / FTE ($000) 0.93 1.19 1.08 1.06 2020 2021 2022 1Q 2023 $322.4 $316.7 $349.4 $371.2 2020 2021 2022 1Q 2023 241.1 257.7 283.1 71.2 2020 2021 2022 2023 YTD 36 1. See appendix for reconcil
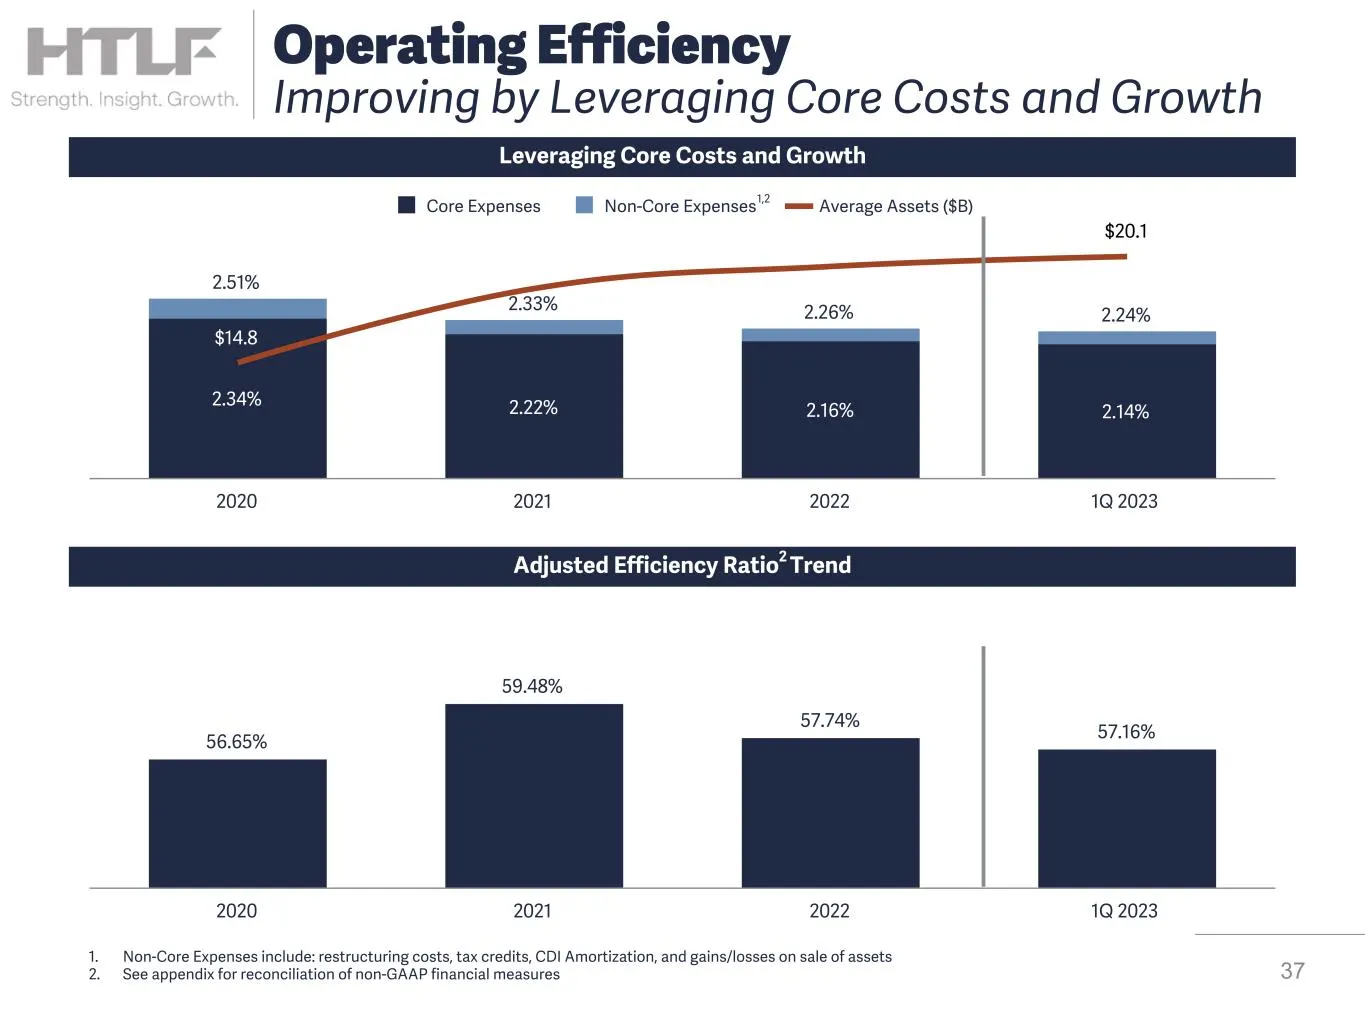
Slide 37: Operating Efficiency Improving by Leveraging Core Costs and Growth
2.51% 2.33% 2.26% 2.24% 2.34% 2.22% 2.16% 2.14% $14.8 $20.1 Core Expenses Non-Core Expenses Average Assets ($B) 2020 2021 2022 1Q 2023 56.65% 59.48% 57.74% 57.16% 2020 2021 2022 1Q 2023 1. Non-Core Expenses include: restructuring costs, tax credits, CDI Amortization, and gains/losses on sale of asse
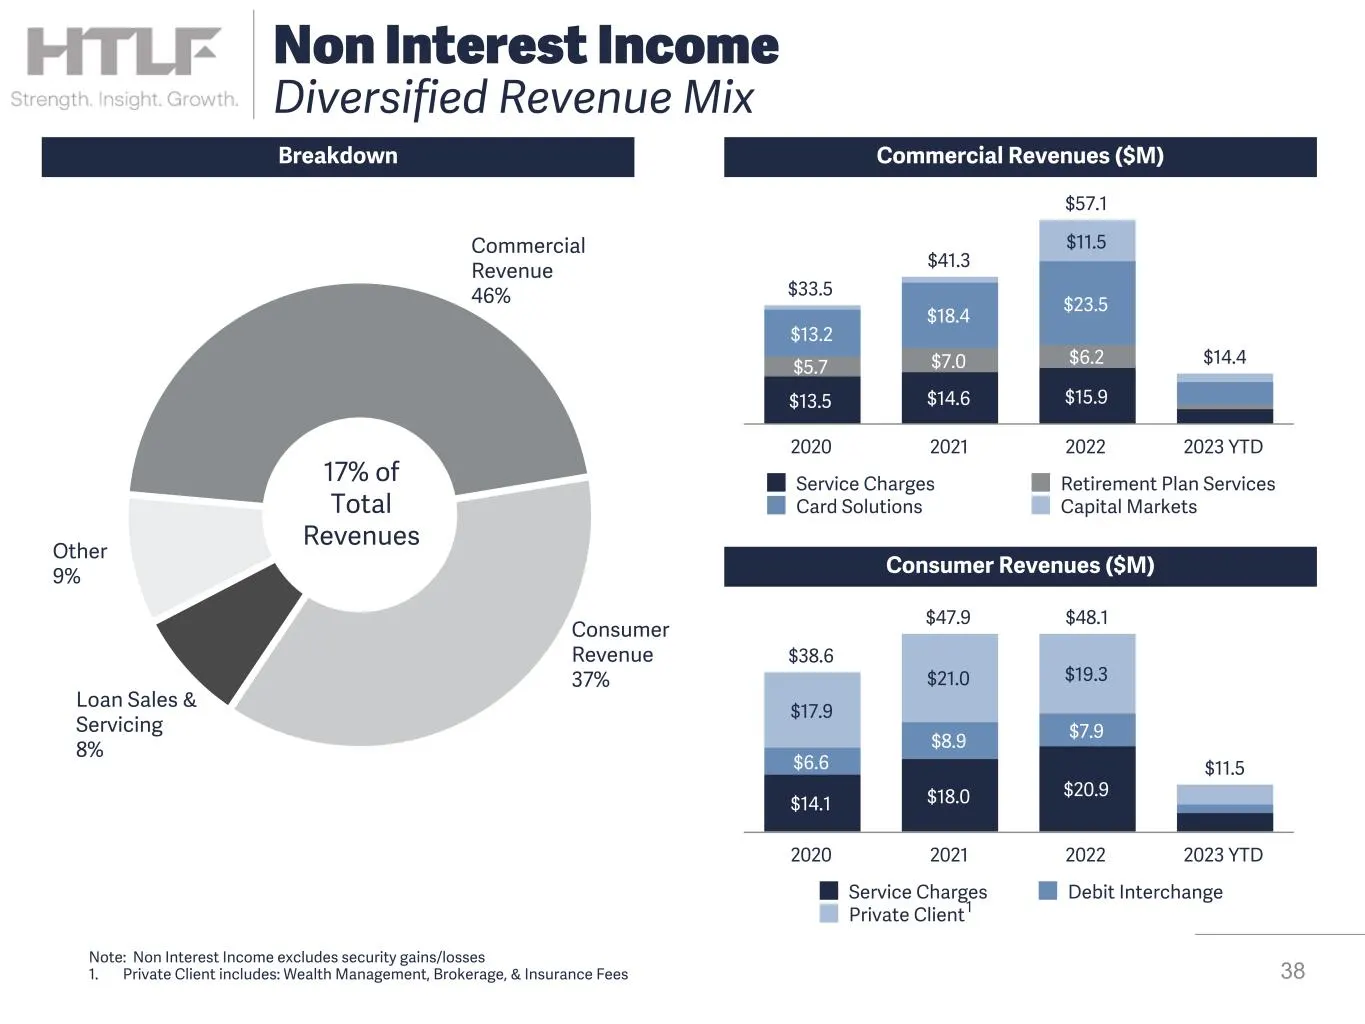
Slide 38: Non Interest Income Diversified Revenue Mix
Commercial Revenue 46% Consumer Revenue 37% Loan Sales & Servicing 8% Other 9% 38 Non Interest Income Diversified Revenue Mix $33.5 $41.3 $57.1 $14.4 $13.5 $14.6 $15.9 $5.7 $7.0 $6.2 $13.2 $18.4 $23.5 $11.5 Service Charges Retirement Plan Services Card Solutions Capital Markets 2020 2021 2022 2023 Y
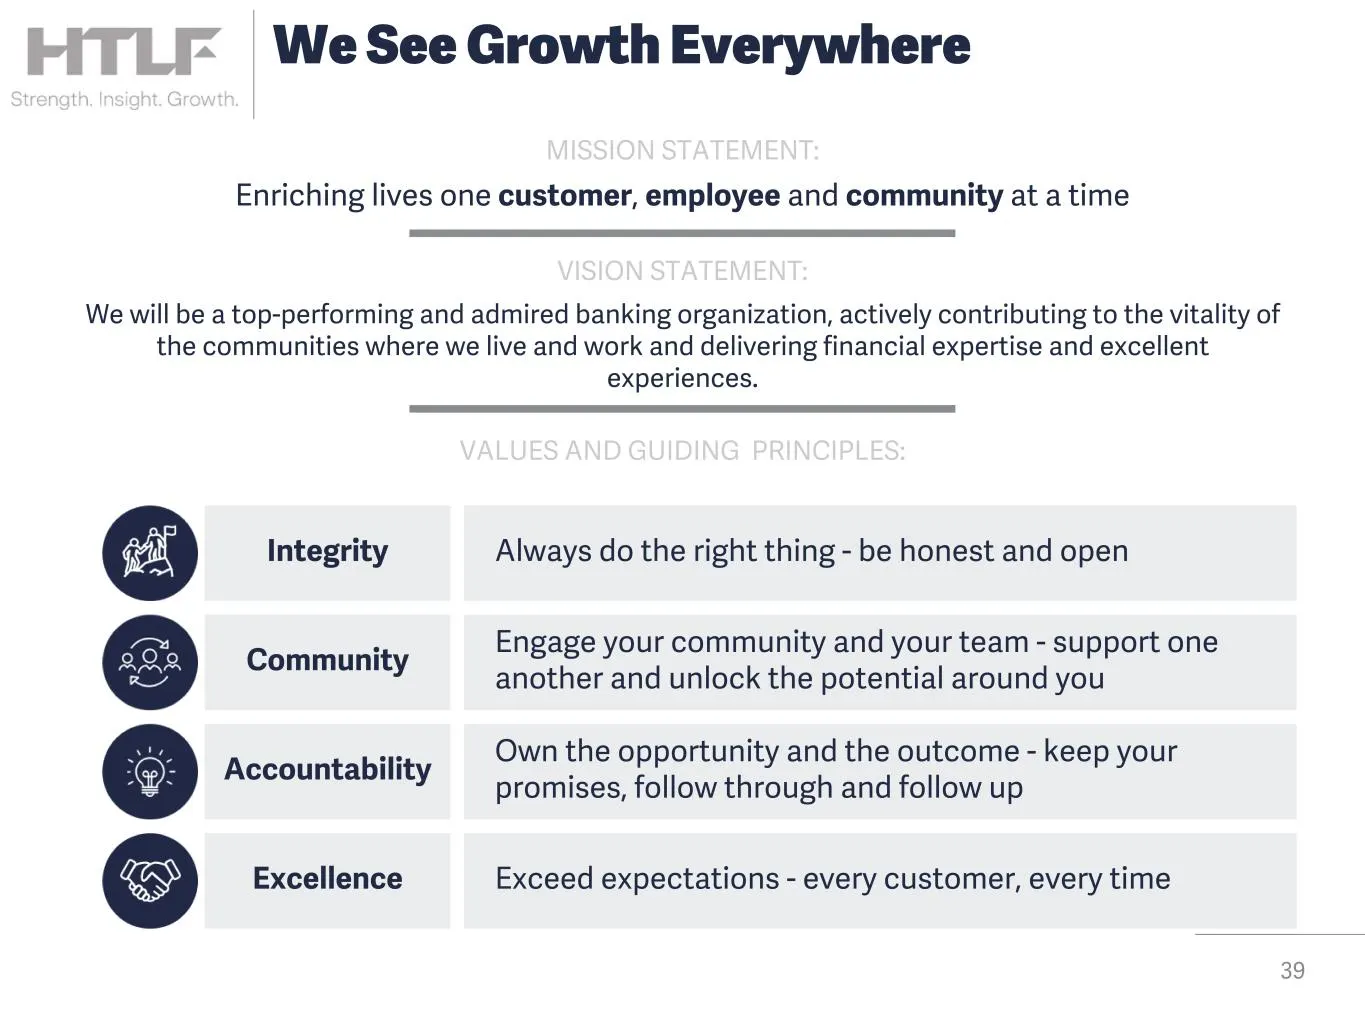
Slide 39: Mission, Vision and Values
39 Integrity Community Accountability Excellence Always do the right thing - be honest and open Engage your community and your team - support one another and unlock the potential around you Own the opportunity and the outcome - keep your promises, follow through and follow up Exceed expectations - e
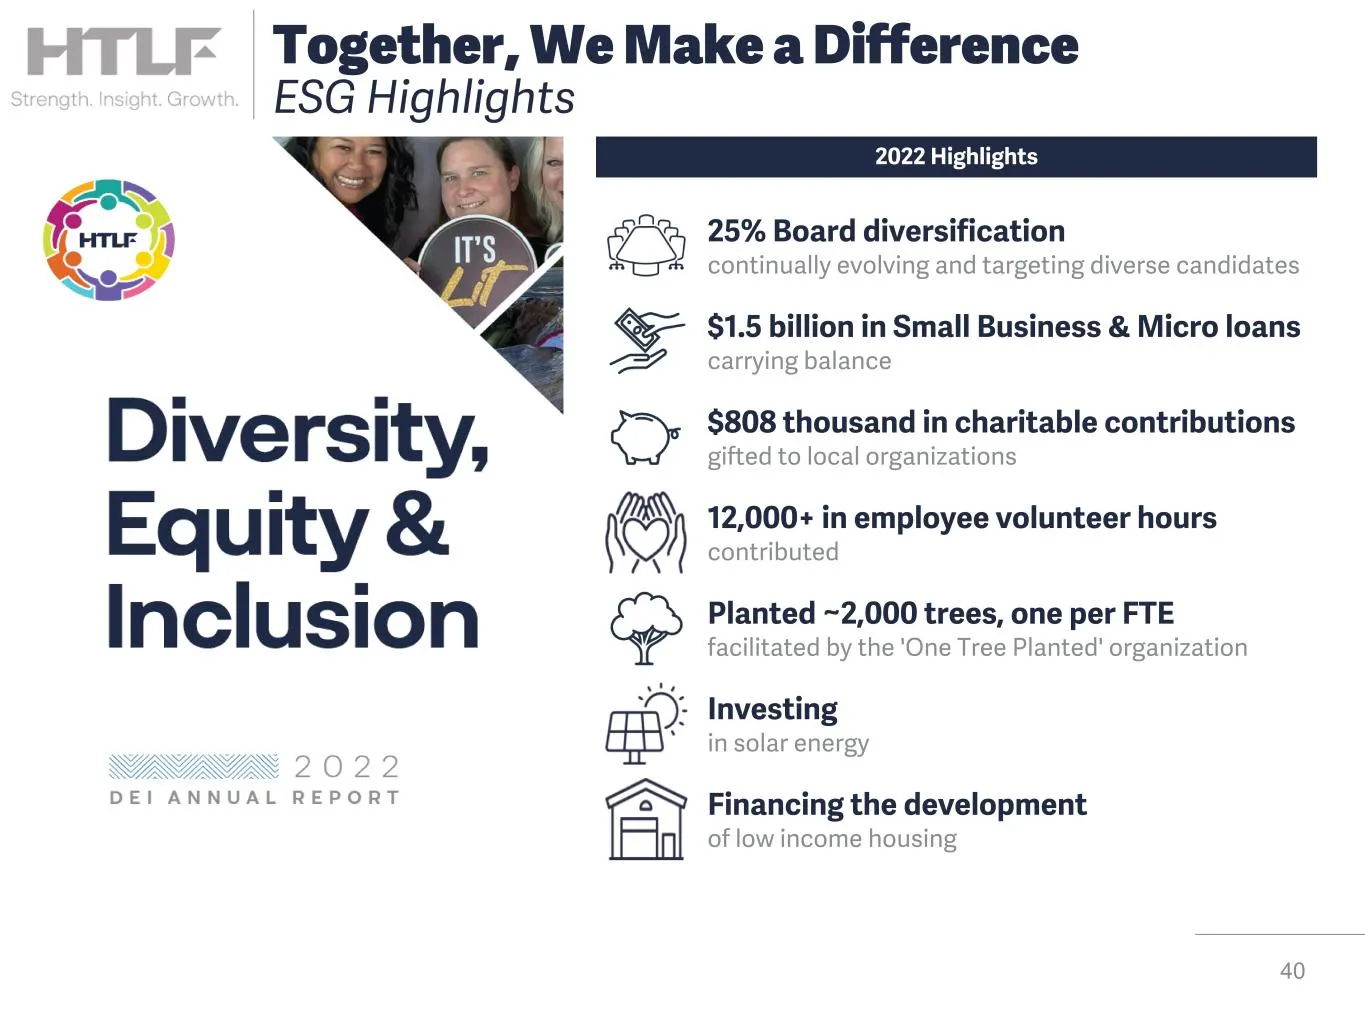
Slide 40: ESG Highlights
40 2022 Highlights 25% Board diversification continually evolving and targeting diverse candidates $808 thousand in charitable contributions gifted to local organizations $1.5 billion in Small Business & Micro loans carrying balance Planted ~2,000 trees, one per FTE facilitated by the 'One Tree Plan
Slide 41: Contact Information
LITLE Contact Information FTLF Strength. Insight. Growth. Bruce K. Lee President and CEO 563.587.4176 office 419.351.1274 cell BLee@htlf.com FHTLF Strength. Insight. Growth. Bryan R. McKeag EVP, Chief Financial Officer 563,5871994 office 920.284.0732 cell BMcKeag@htif.com FTLF Strength. Insight. Gro
Slide 42: Non-GAAP Reconciliations
42 Non-GAAP Reconciliations
Slide 43: Non-GAAP measure definitions
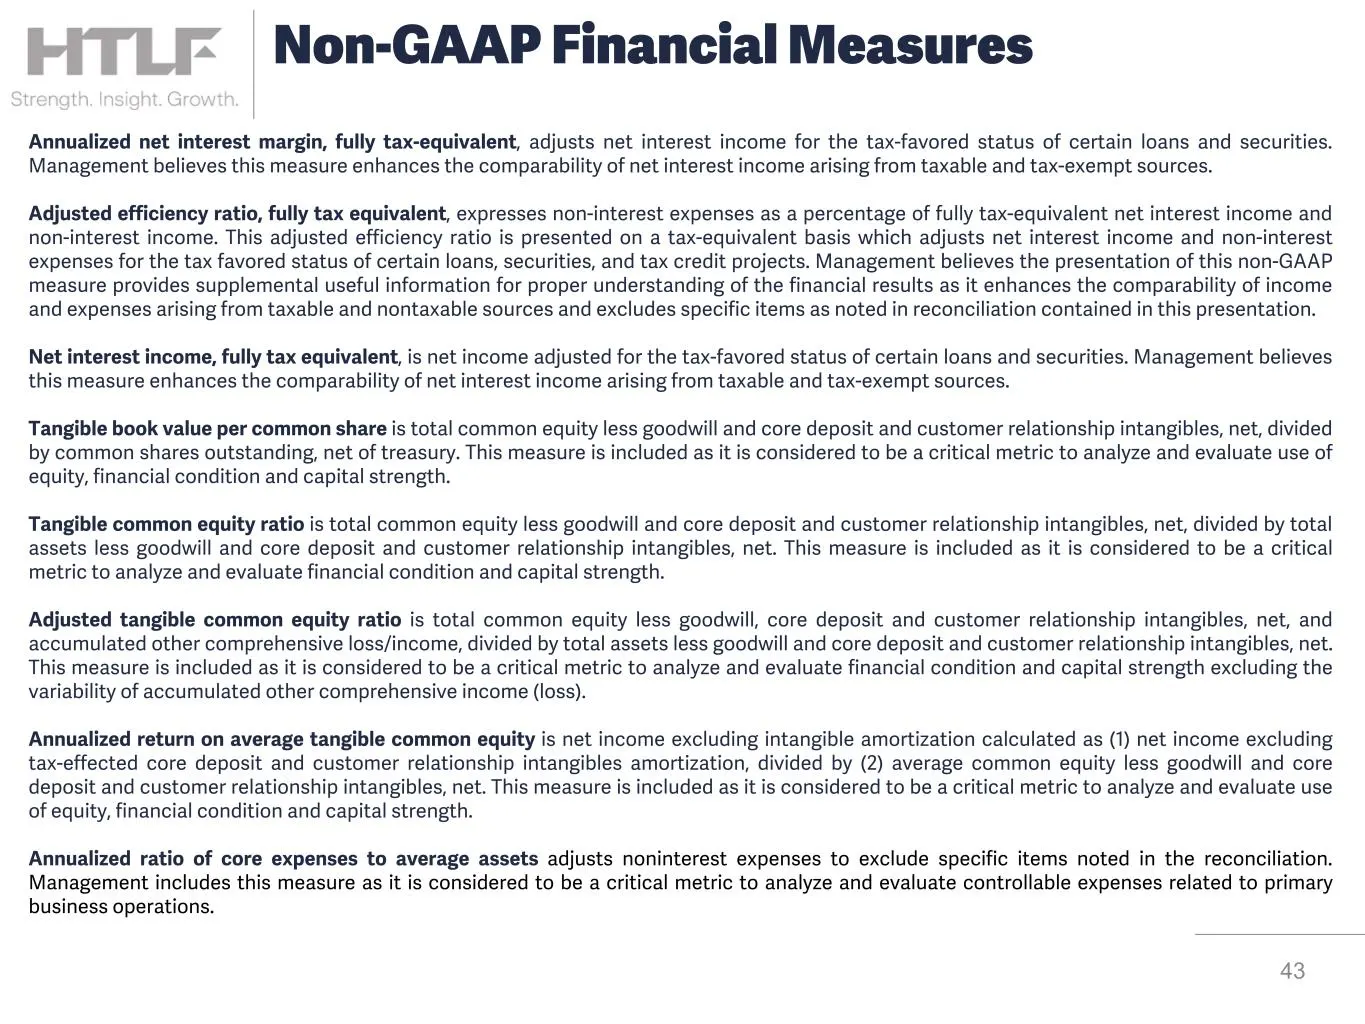
Annualized net interest margin, fully tax-equivalent, adjusts net interest income for the tax-favored status of certain loans and securities. Management believes this measure enhances the comparability of net interest income arising from taxable and tax-exempt sources. Adjusted efficiency ratio, ful
Slide 44: Reconciliation of Tangible Book Value Per Common Share
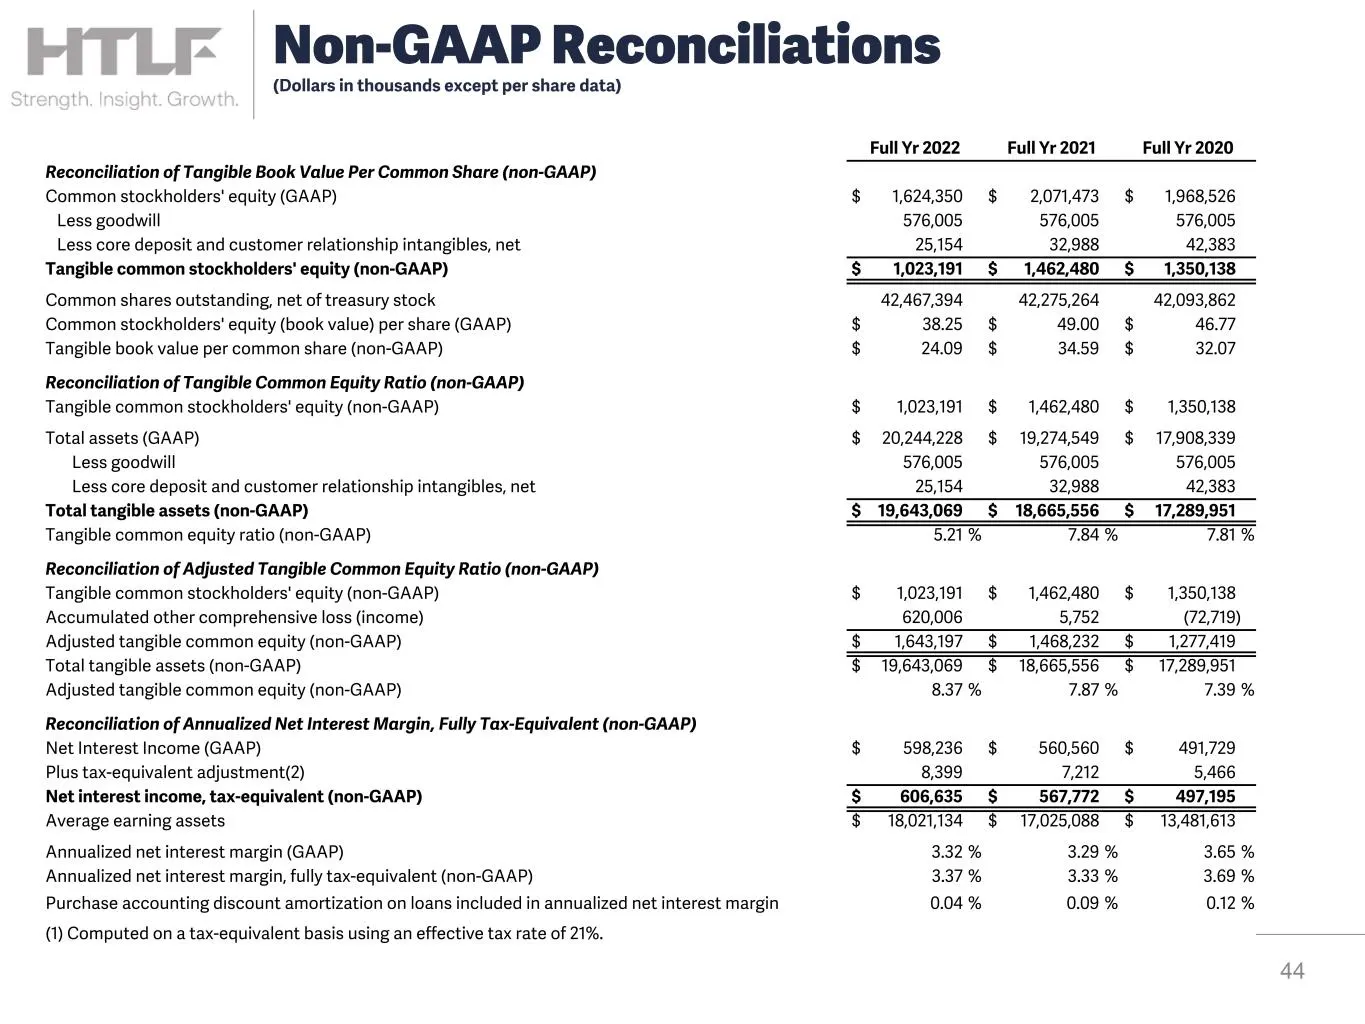
Full Yr 2022 Full Yr 2021 Full Yr 2020 Reconciliation of Tangible Book Value Per Common Share (non-GAAP) Common stockholders' equity (GAAP) $ 1,624,350 $ 2,071,473 $ 1,968,526 Less goodwill 576,005 576,005 576,005 Less core deposit and customer relationship intangibles, net 25,154 32,988 42,383 Tang
Slide 45: Reconciliation of Adjusted Efficiency Ratio
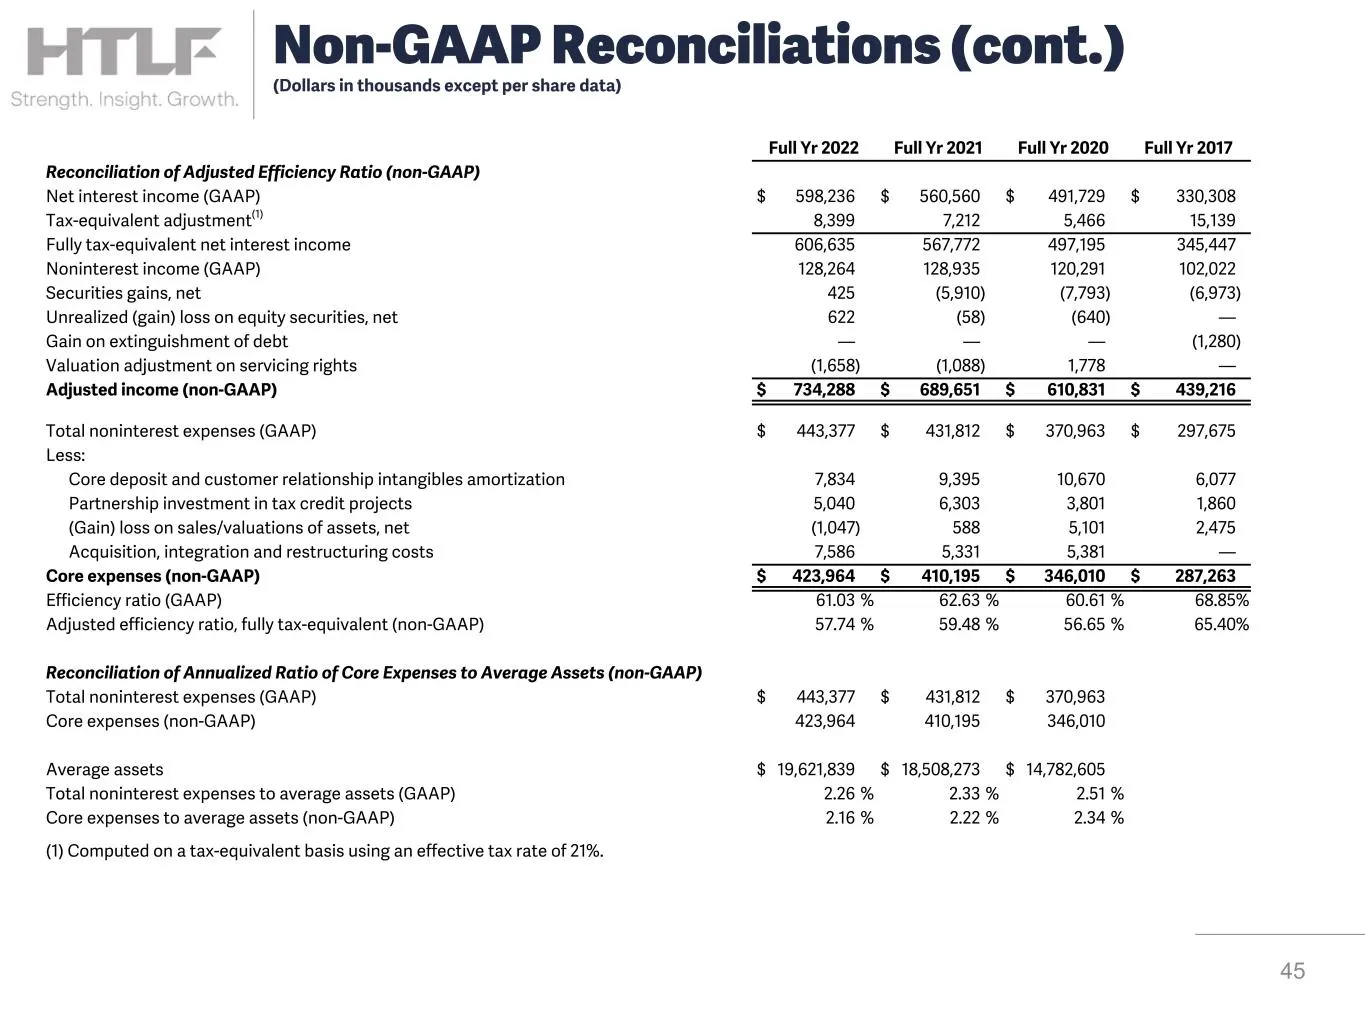
Full Yr 2022 Full Yr 2021 Full Yr 2020 Full Yr 2017 Reconciliation of Adjusted Efficiency Ratio (non-GAAP) Net interest income (GAAP) $ 598,236 $ 560,560 $ 491,729 $ 330,308 Tax-equivalent adjustment(1) 8,399 7,212 5,466 15,139 Fully tax-equivalent net interest income 606,635 567,772 497,195 345,447
Slide 46: Non-GAAP Reconciliations (cont.)
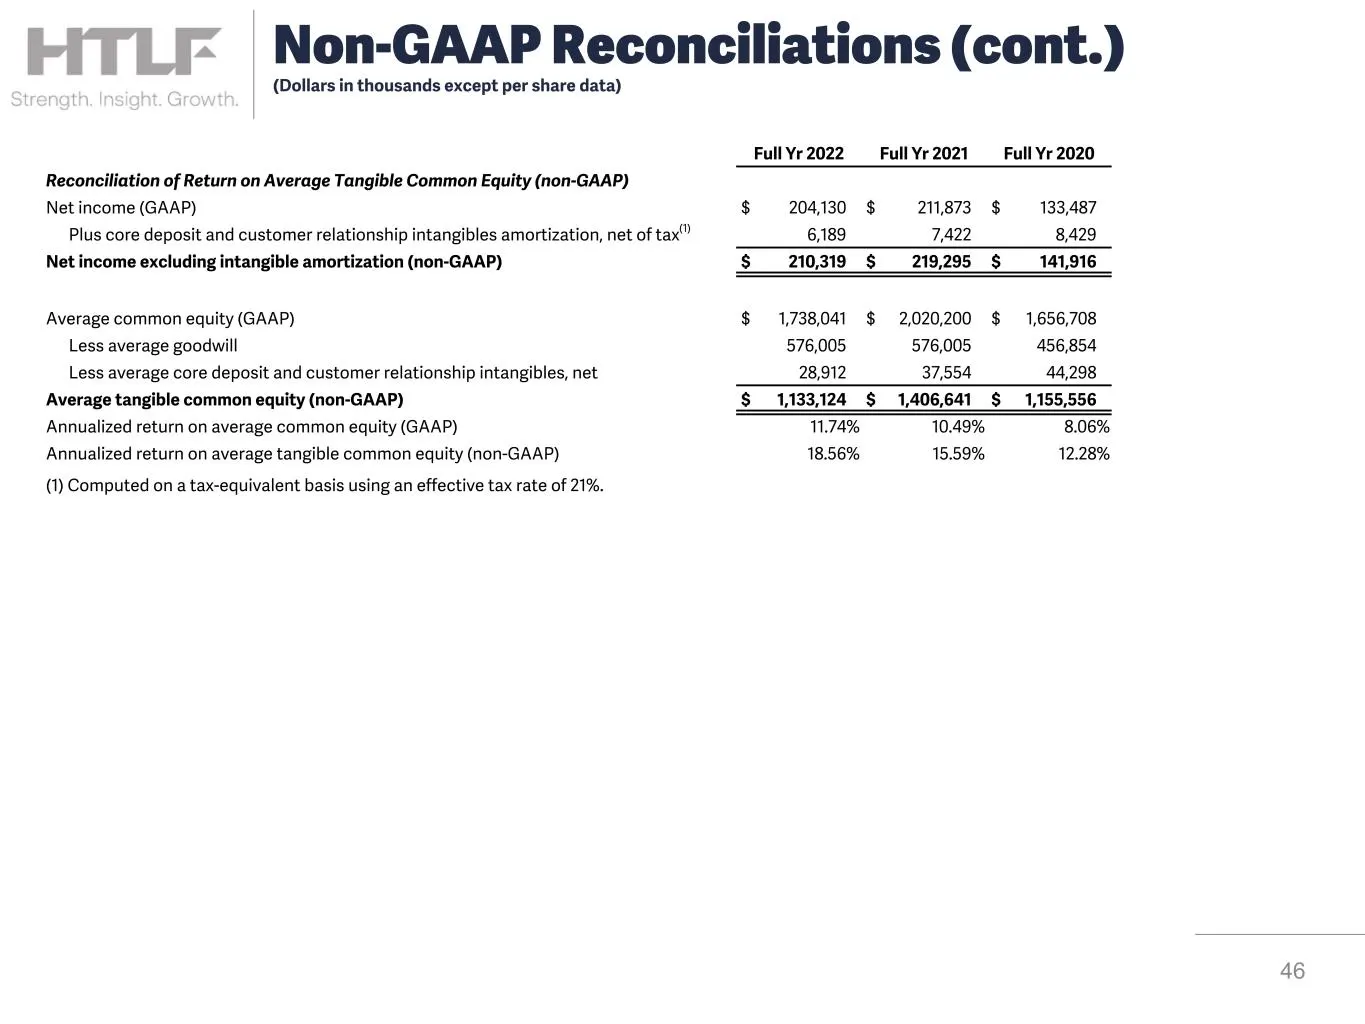
Non-GAAP Reconciliations (cont.) (Dollars in thousands except per share data) Full Yr 2022 Full Yr 2021 Full Yr 2020 Reconciliation of Return on Average Tangible Common Equity (non-GAAP) Net income (GAAP) $ 204,130 $ 211,873 $ 133,487 Plus core deposit and customer relationship intangibles amortizat
Slide 47: Reconciliation of Tangible Book Value Per Common Share (quarterly)
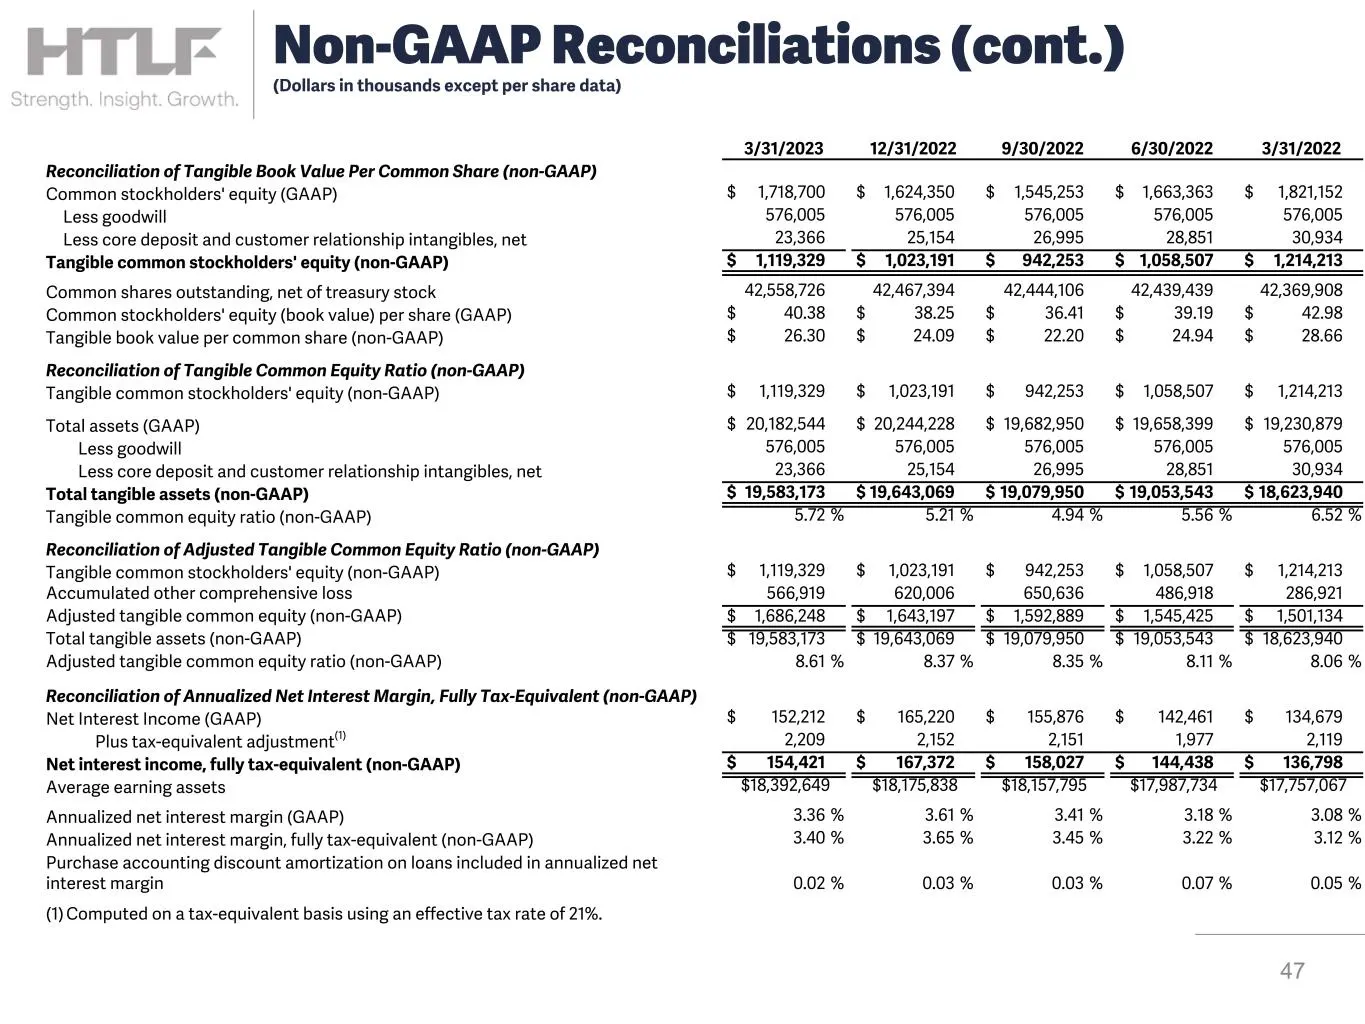
3/31/2023 12/31/2022 9/30/2022 6/30/2022 3/31/2022 Reconciliation of Tangible Book Value Per Common Share (non-GAAP) Common stockholders' equity (GAAP) $ 1,718,700 $ 1,624,350 $ 1,545,253 $ 1,663,363 $ 1,821,152 Less goodwill 576,005 576,005 576,005 576,005 576,005 Less core deposit and customer rel
Slide 48: Reconciliation of Adjusted Efficiency Ratio (quarterly)
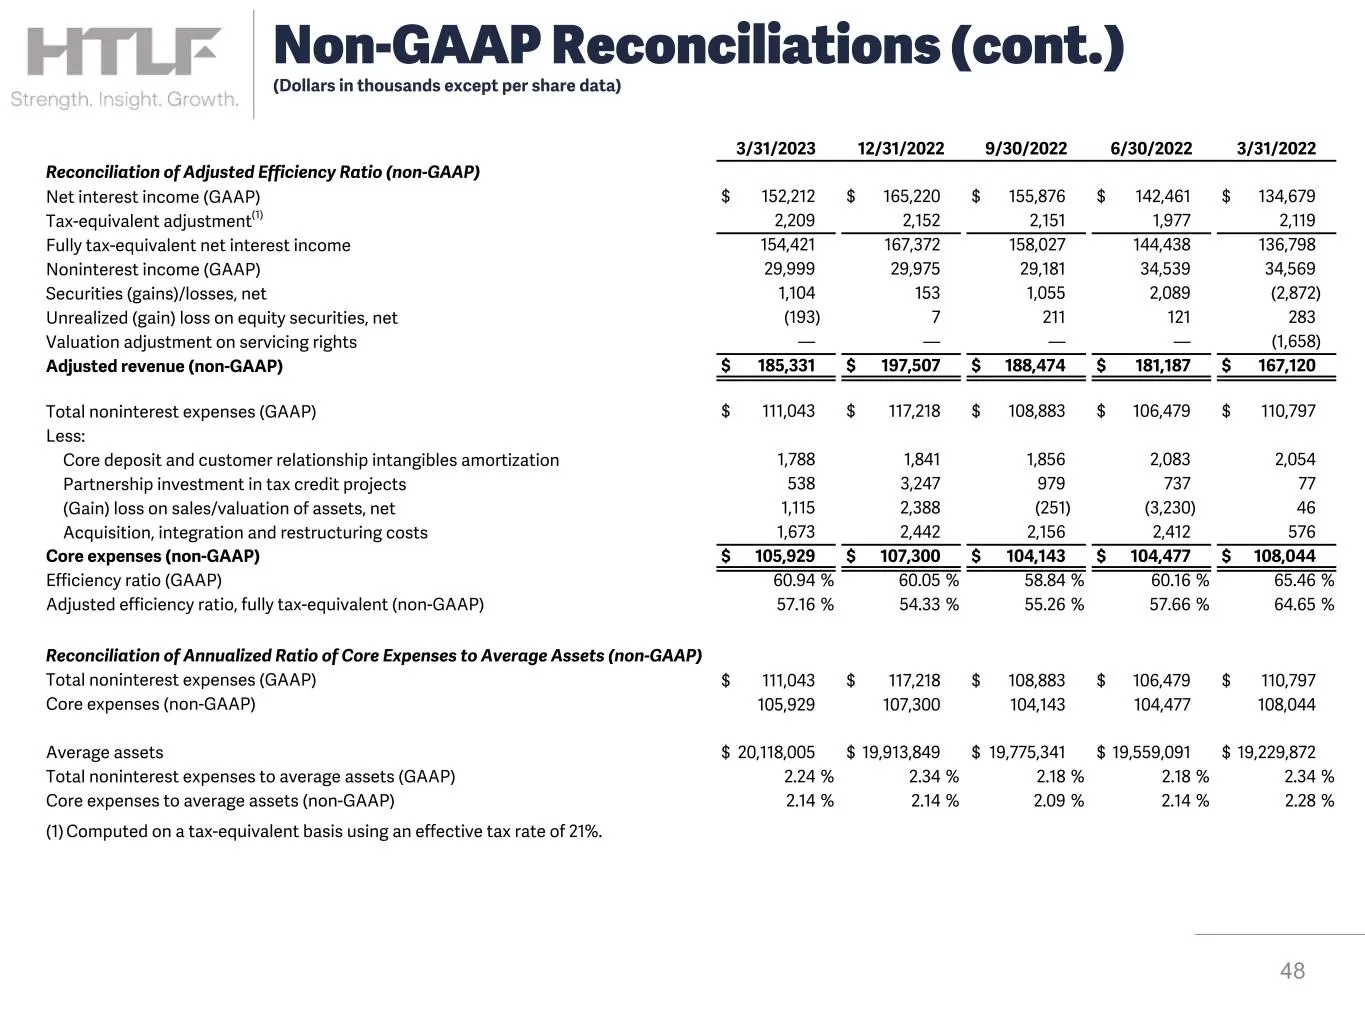
3/31/2023 12/31/2022 9/30/2022 6/30/2022 3/31/2022 Reconciliation of Adjusted Efficiency Ratio (non-GAAP) Net interest income (GAAP) $ 152,212 $ 165,220 $ 155,876 $ 142,461 $ 134,679 Tax-equivalent adjustment(1) 2,209 2,152 2,151 1,977 2,119 Fully tax-equivalent net interest income 154,421 167,372 1
Slide 49: Non-GAAP Reconciliations (cont.)
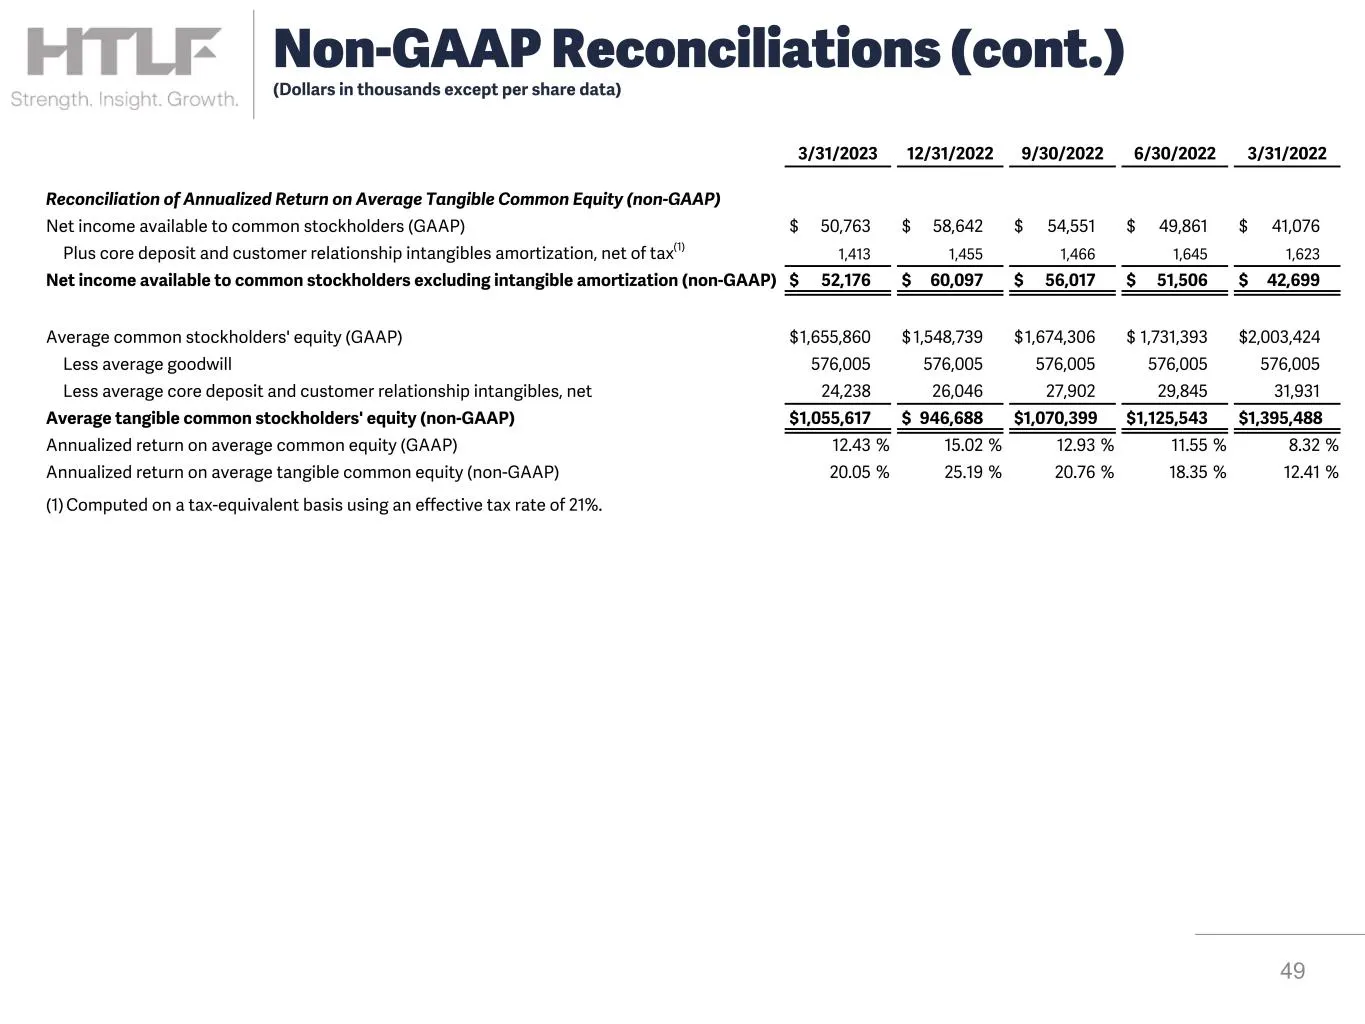
49 Non-GAAP Reconciliations (cont.) (Dollars in thousands except per share data) 3/31/2023 12/31/2022 9/30/2022 6/30/2022 3/31/2022 Reconciliation of Annualized Return on Average Tangible Common Equity (non-GAAP) Net income available to common stockholders (GAAP) $ 50,763 $ 58,642 $ 54,551 $ 49,861

Slide 50: Forward Together
Forward Together > FITLF Strength. Insight. Growth.
Source: SEC EDGAR · 8-K filed May 10, 2023
More decks from Heartland Financial USA Inc
 Merger or Acquisition (July 2024)6 slides · Jul 31, 2024
 Merger or Acquisition (May 2024)6 slides · May 2, 2024
 Merger or Acquisition (May 2024)27 slides · May 2, 2024
 Q4 2023 Earnings Presentation54 slides · Feb 13, 2024
 Q4 2023 Earnings Presentation35 slides · Jan 29, 2024
 Q3 2023 Earnings Presentation55 slides · Nov 15, 2023