Sterling Bancshares — Investor Presentation (November 2010)
30 slides from Sterling Bancshares's investor presentation, Nov 10, 2010
Slide 1: Schedule 14A Proxy Statement cover
UNITED STATES SECURITIES AND EXCHANGE COMMISSION WASHINGTON, D.C. 20549 SCHEDULE 14A Proxy Statement Pursuant to Section 14(a) of the Securities Exchange Act of 1934 (Amendment No. ) Filed by the Registrant þ Filed by a Party other than the Registrant ¨ Check the appropriate box: ¨ Preliminary Proxy
Slide 2: Sterling Bancshares Investor Presentation 3rd Quarter 2010
STERLING BANCSHARES World class banking. Deep Texas roots. ® Houston Dallas Fort Worth San Antonio Investor Presentation rd 3 Quarter 2010 SBIB
Slide 3: Forward-looking Statements
Forward-looking Statements E xcept for historical information contained herein, this presentation contains “forward- looking statements” within the meaning of the Private Securities Litigation Reform Act of 1995. Such forward-looking statements involve risks and uncertainties and are based on belief
Slide 4: Strategic Intent
Strategic Intent “We differentiate ourselves from other banks within our markets by being focused on providing competitive products and services to all constituencies within the small to medium- sized business segment with annual sales of less than $100 million.” World Class Banking. Deep Texas Root
Slide 5: Leading Texas Franchise
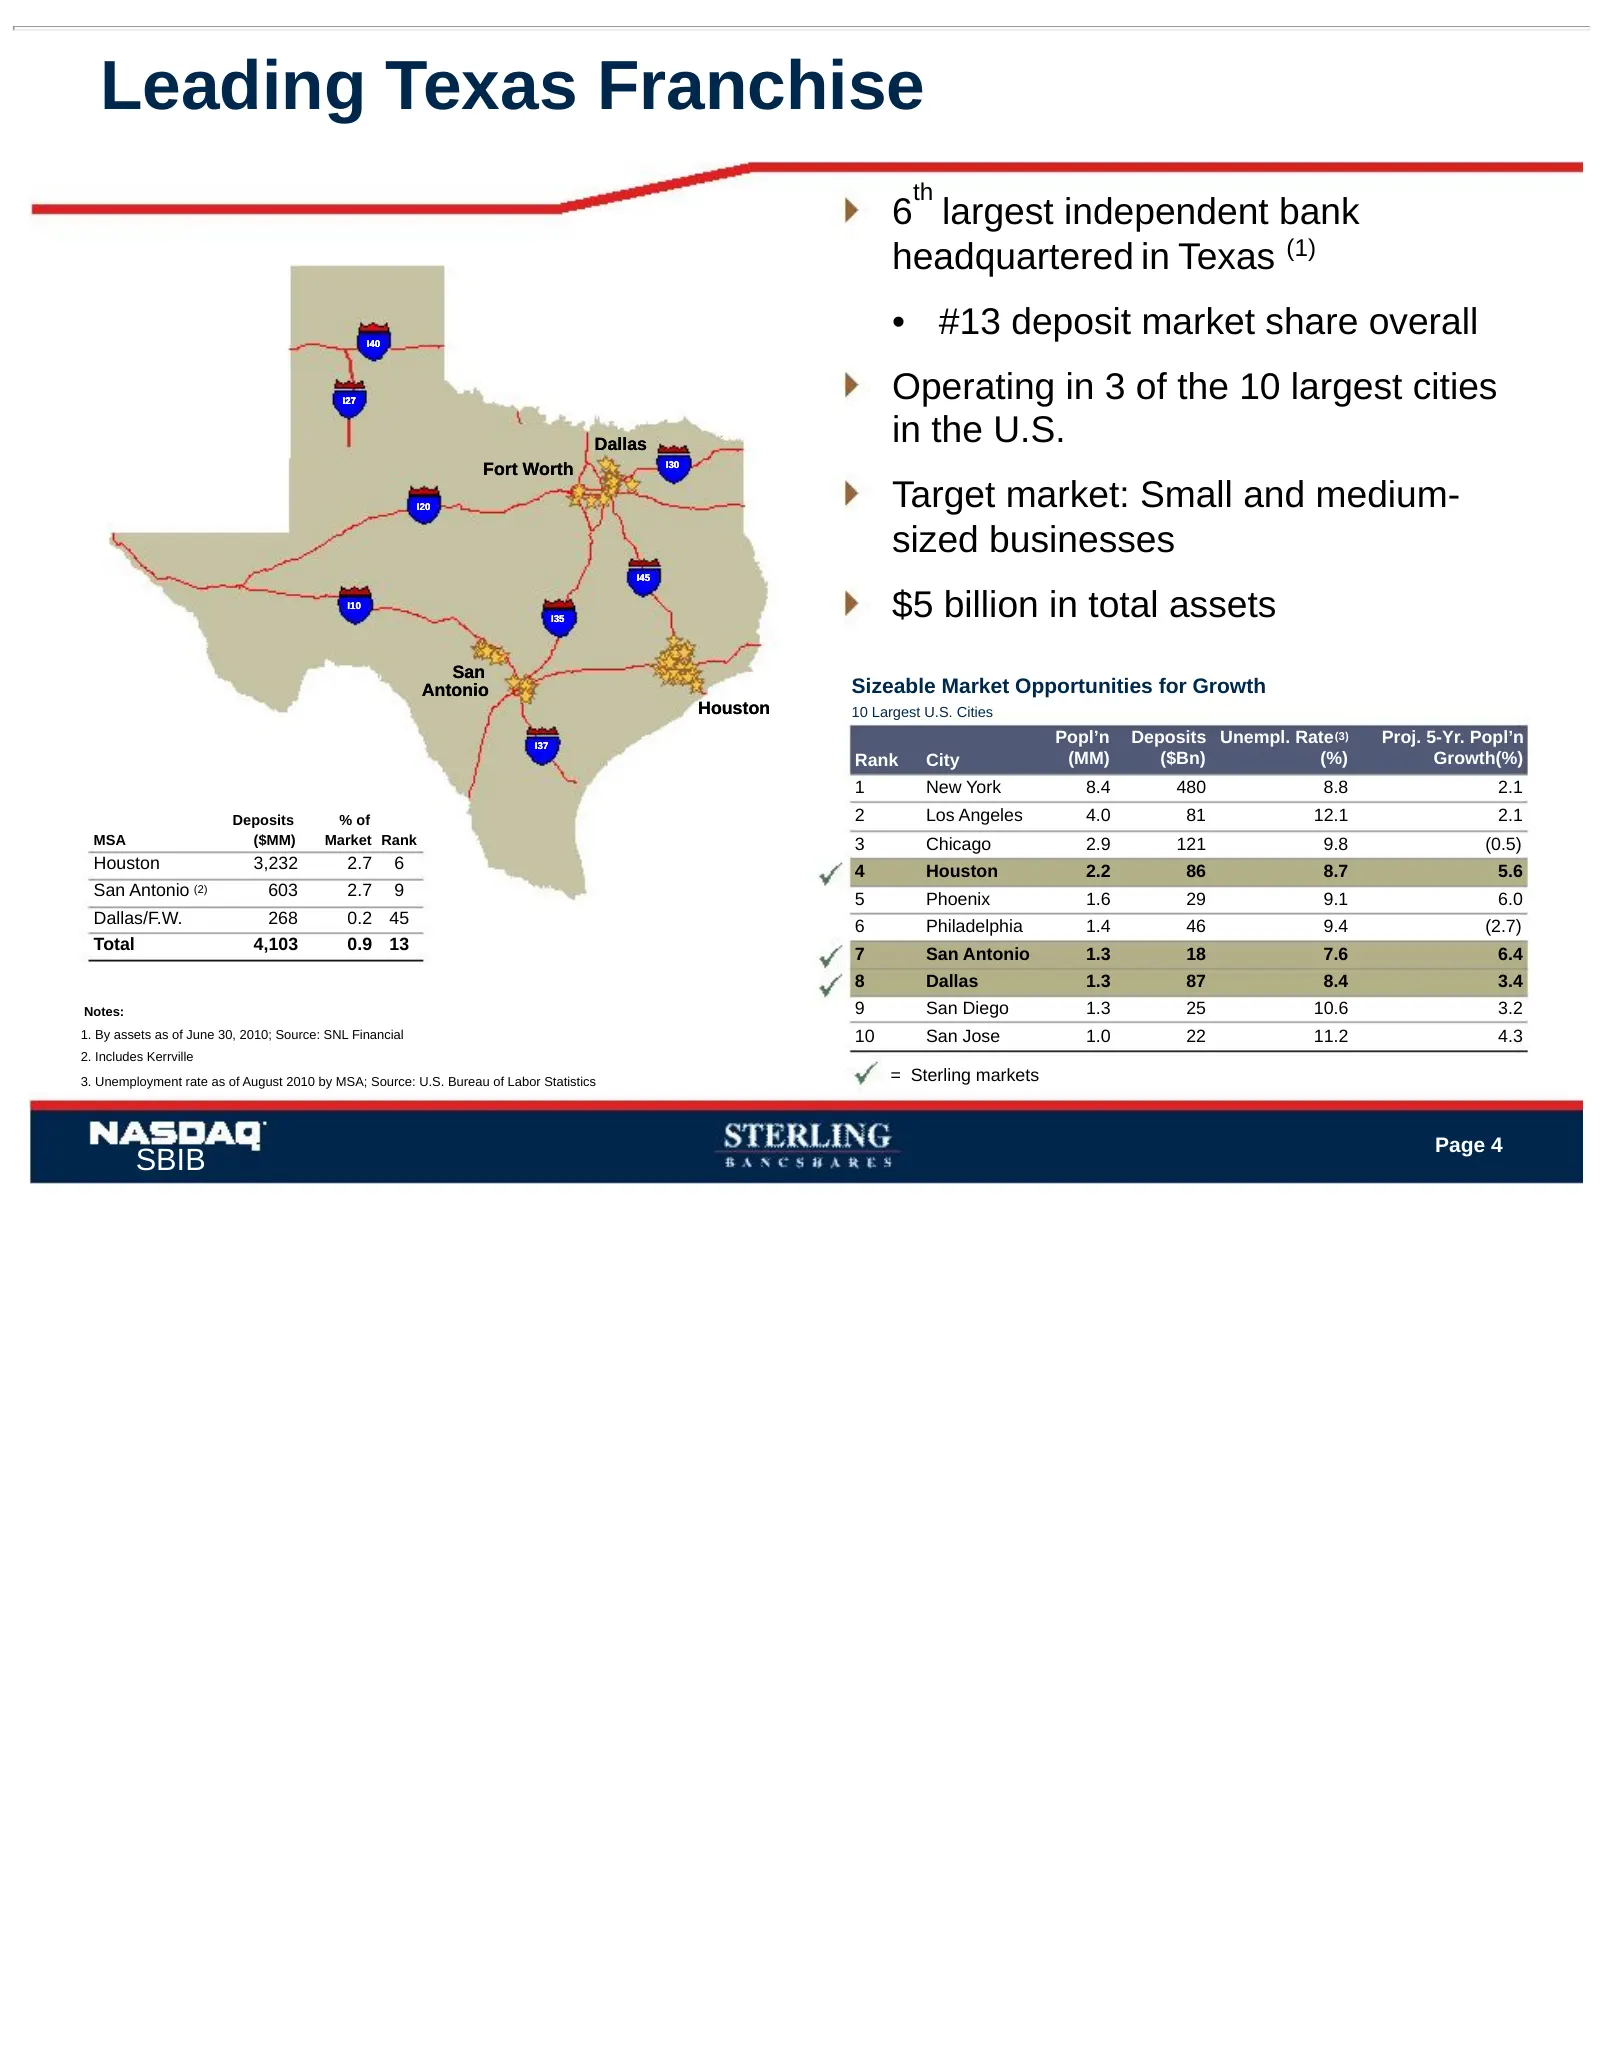
Leading Texas Franchise th 6 largest independent bank headquartered in Texas (1) I40 • #13 deposit market share overall I27 Operating in 3 of the 10 largest cities Dallas in the U.S. Fort Worth I30 I20 Target market: Small and medium- sized businesses I45 I10 I35 $5 billion in total assets San Anton
Slide 6: Our Core Markets – Texas Advantage
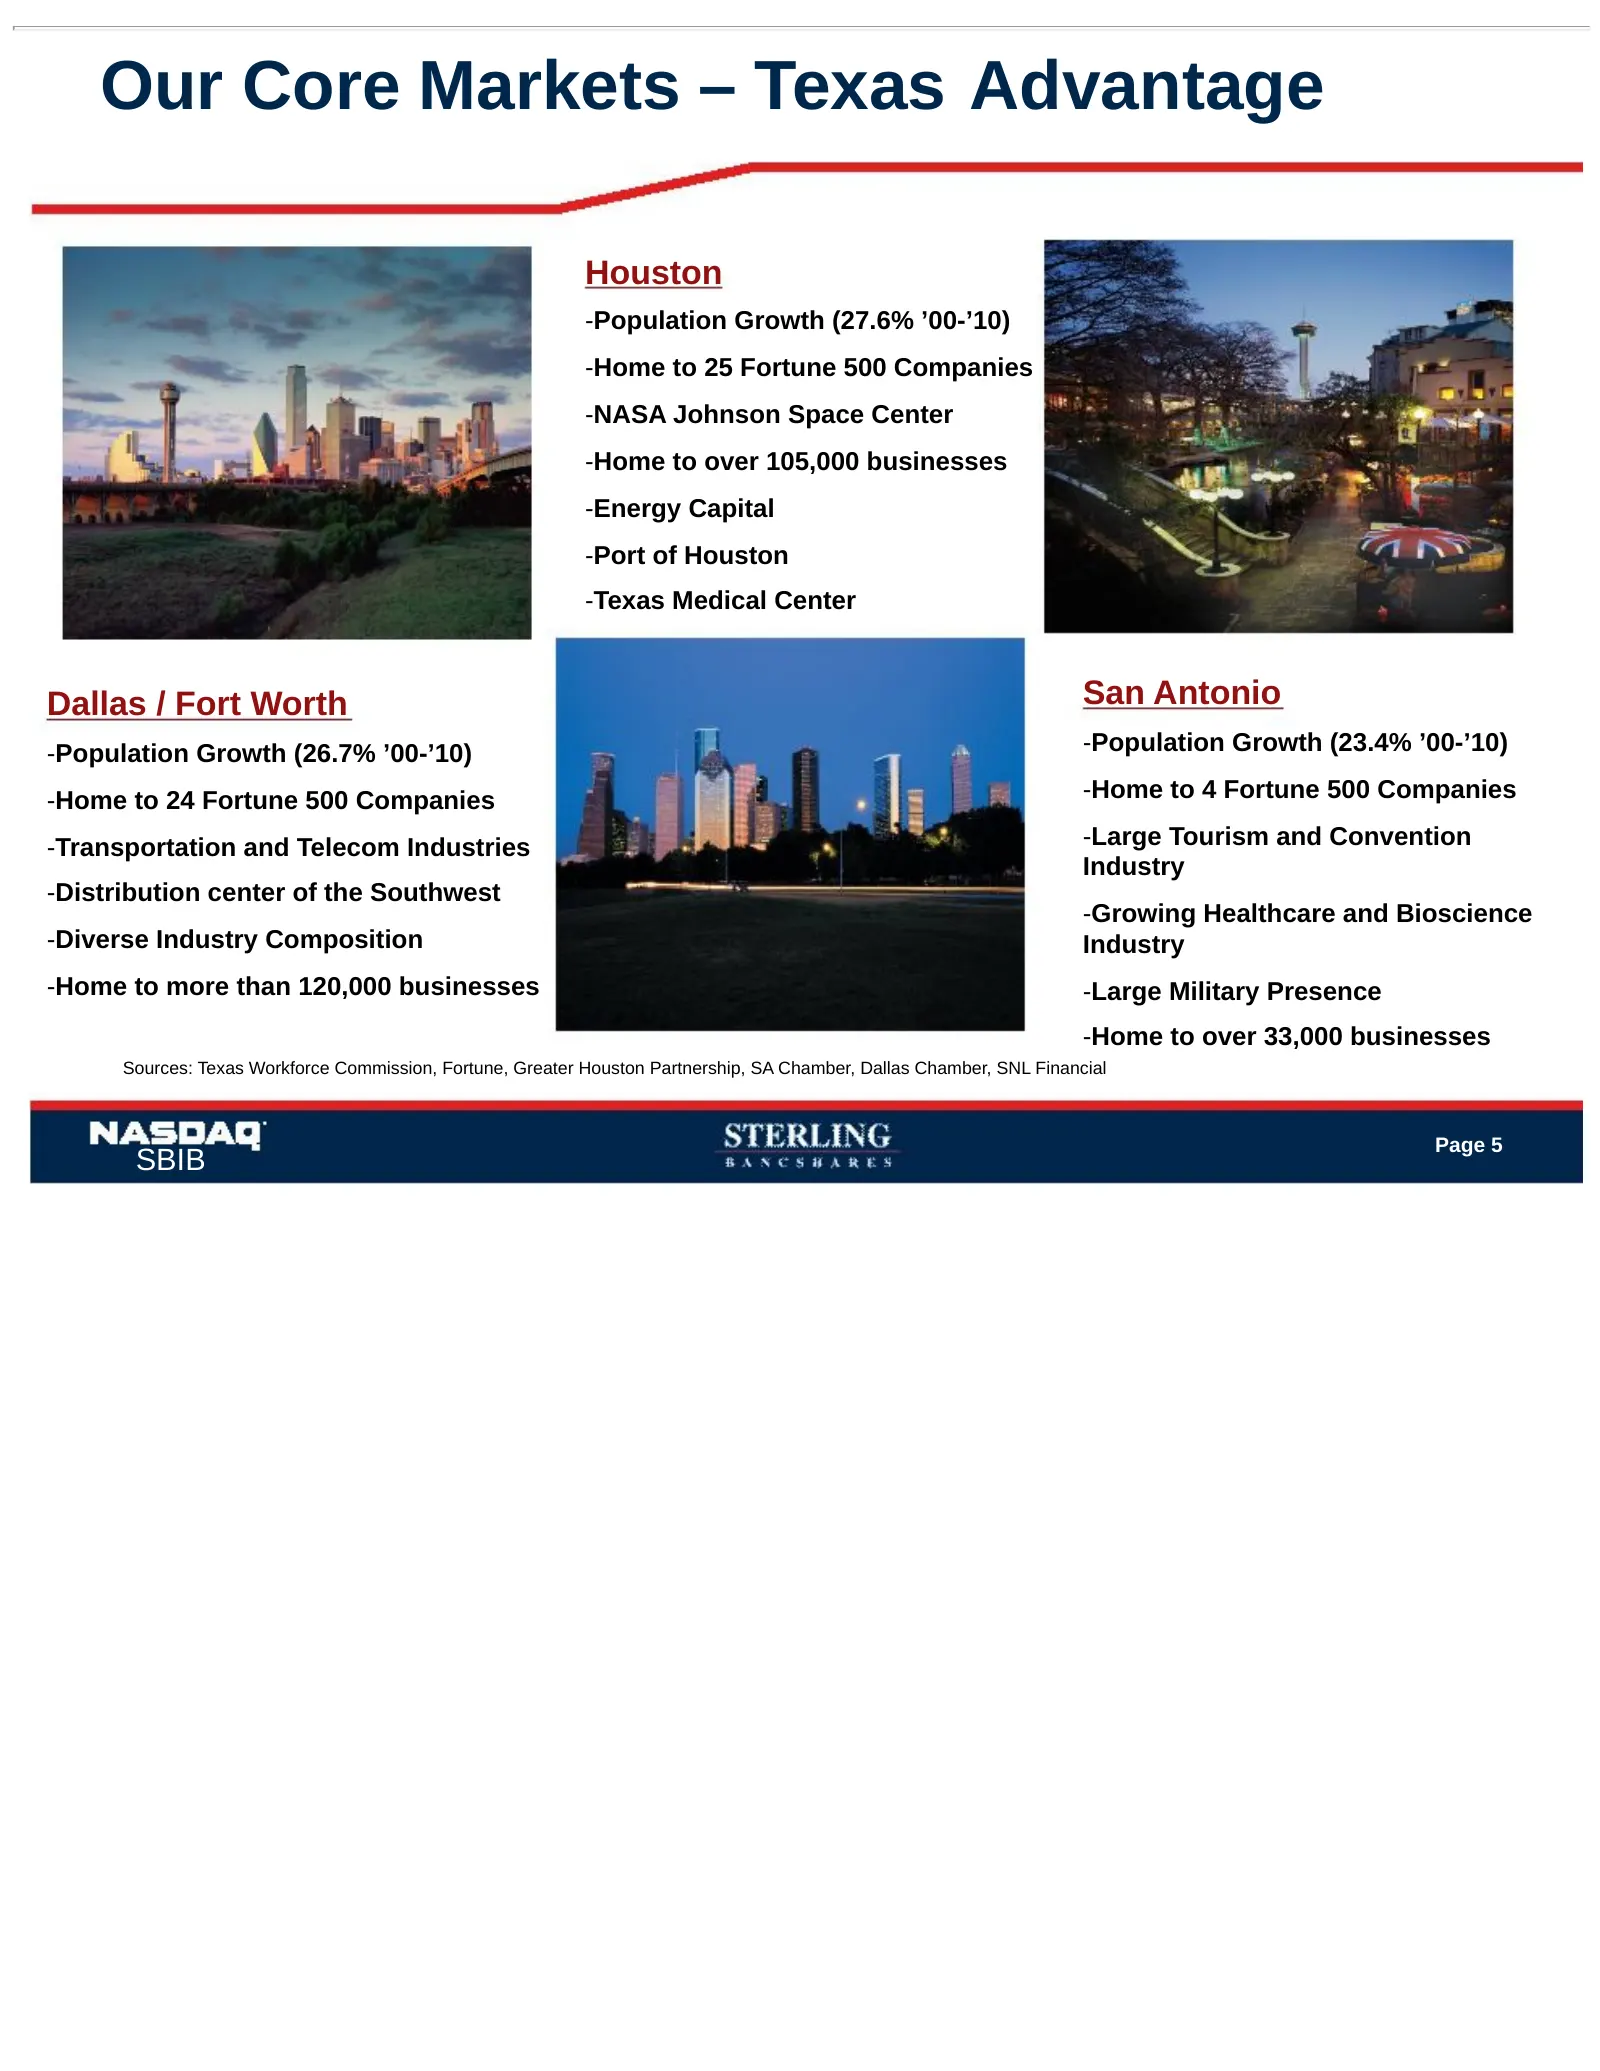
Our Core Markets – Texas Advantage Houston -Population Growth (27.6% ’00-’10) -Home to 25 Fortune 500 Companies -NASA Johnson Space Center -Home to over 105,000 businesses -Energy Capital -Port of Houston -Texas Medical Center Dallas / Fort Worth San Antonio -Population Growth (26.7% ’00-’10) -Popul
Slide 7: Texas: Among Strongest Economies in U.S.
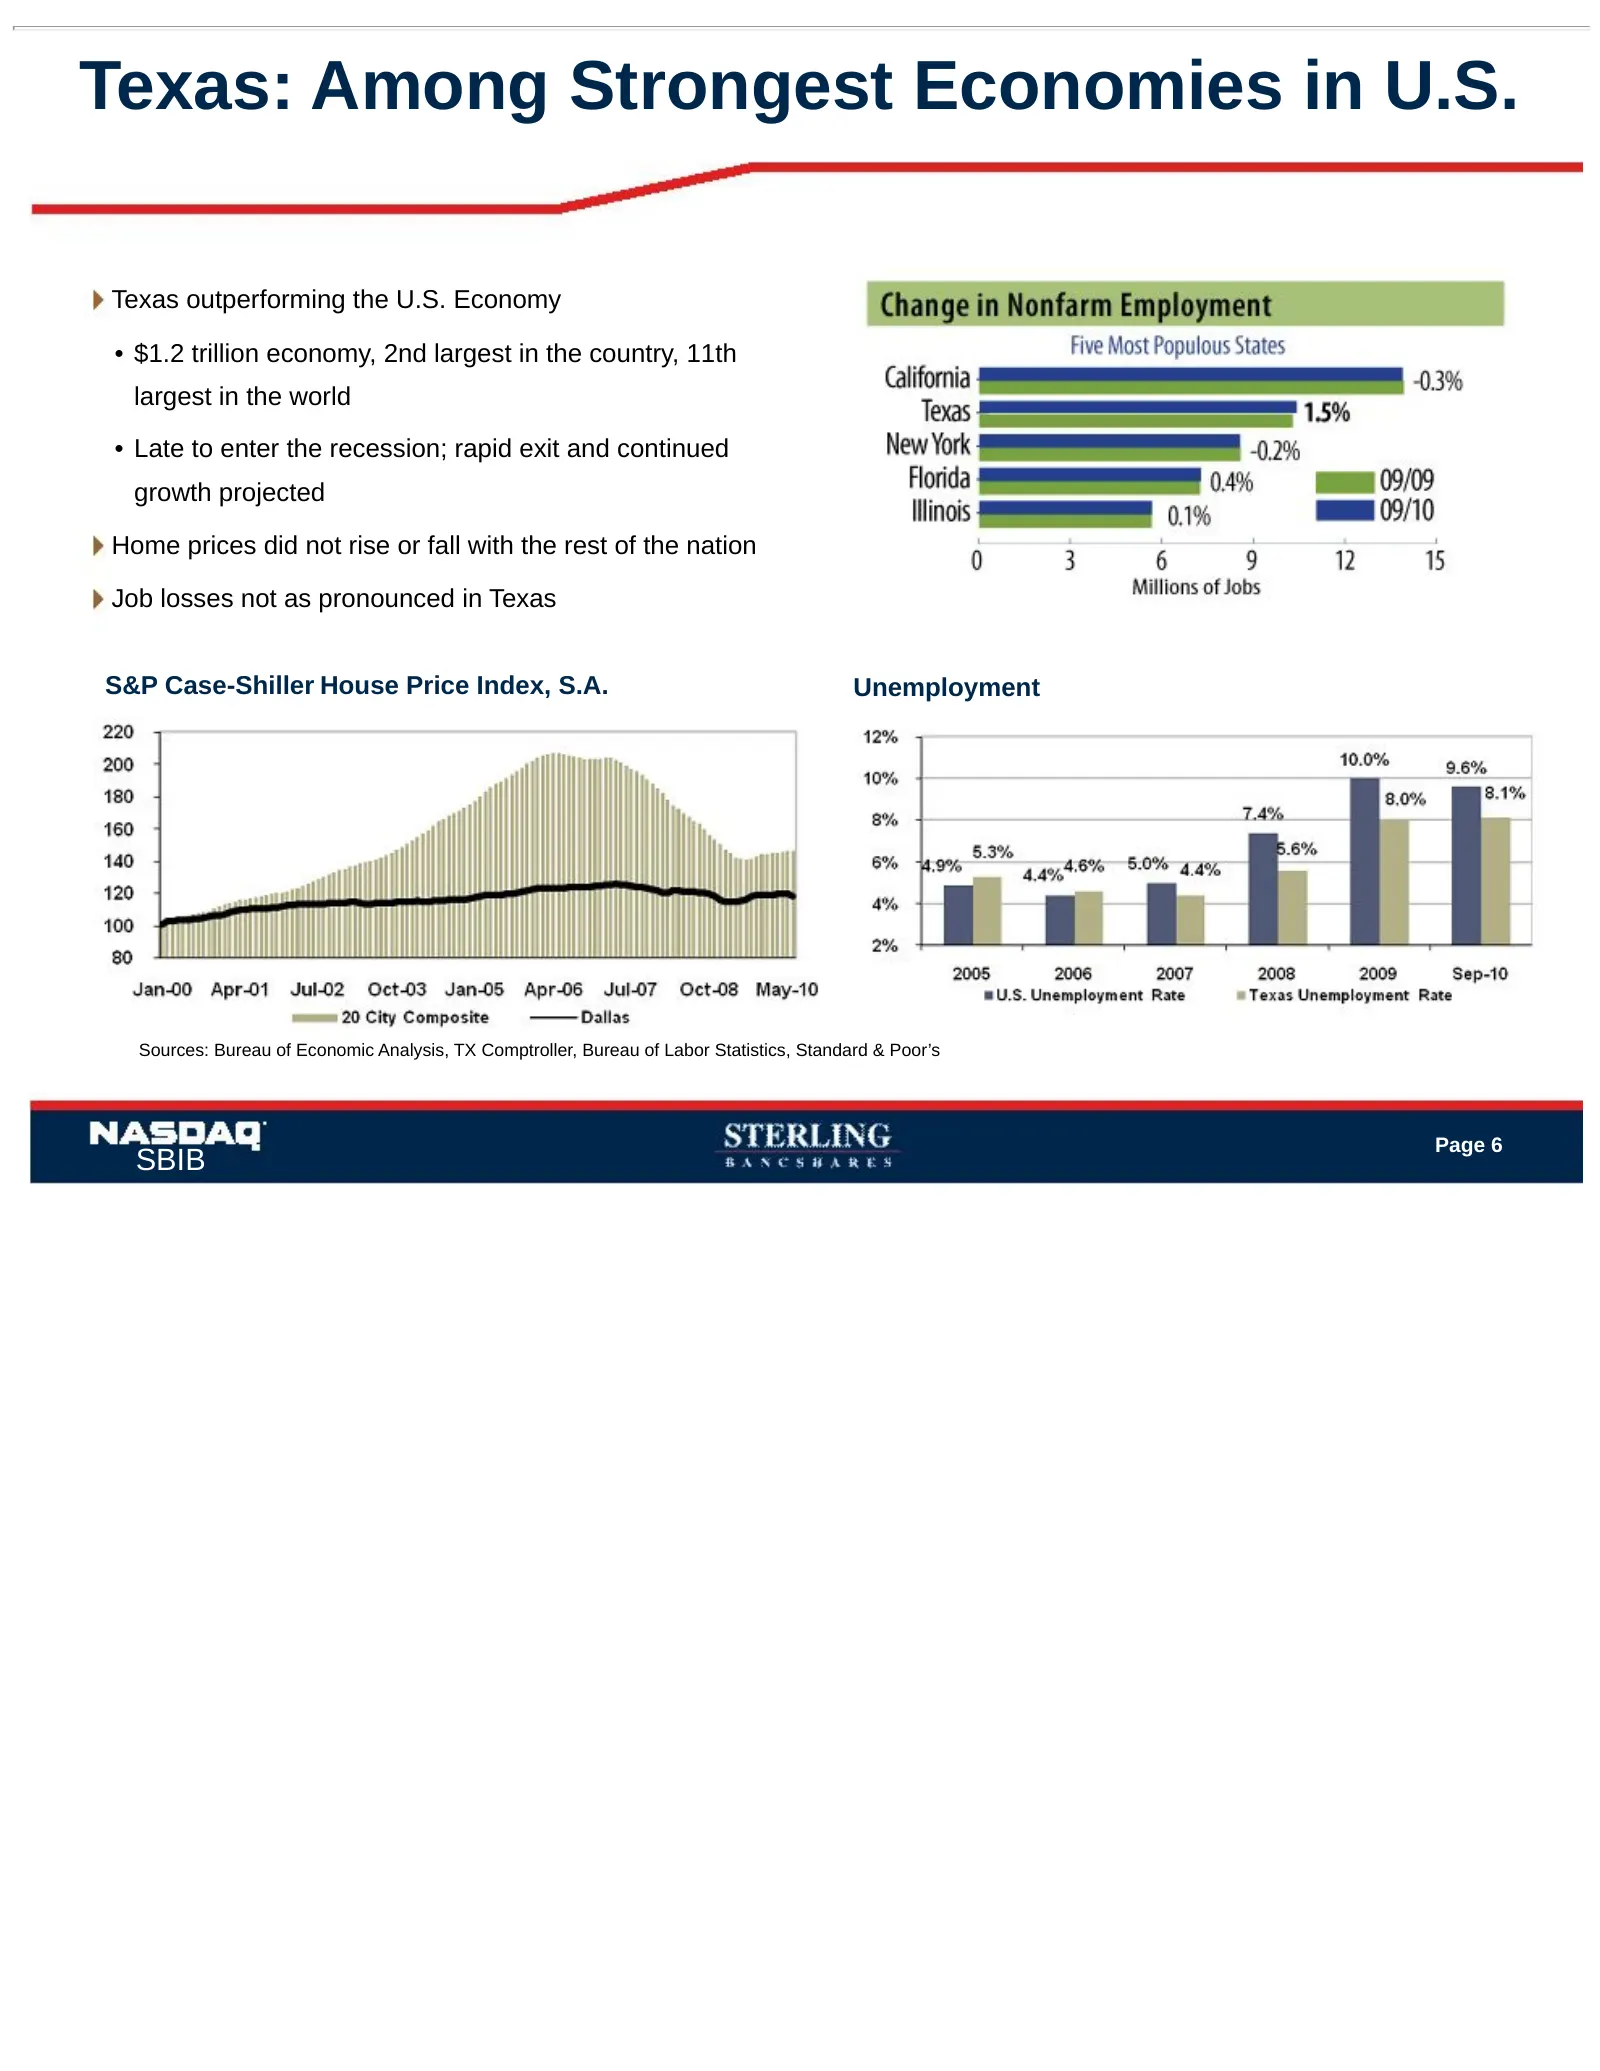
Texas: Among Strongest Economies in U.S. Texas outperforming the U.S. Economy • $1.2 trillion economy, 2nd largest in the country, 11th largest in the world • Late to enter the recession; rapid exit and continued growth projected Home prices did not rise or fall with the rest of the nation Job losse
Slide 8: Sterling's Competitive Advantage
Sterling’s Competitive Advantage The ability to create lasting relationships by meeting the business and personal banking needs of business owners, their employees, and their families and friends. Therefore, our advantage is realized through: • Our bankers • Our values • Our focus on our market segm
Slide 9: Internal Growth
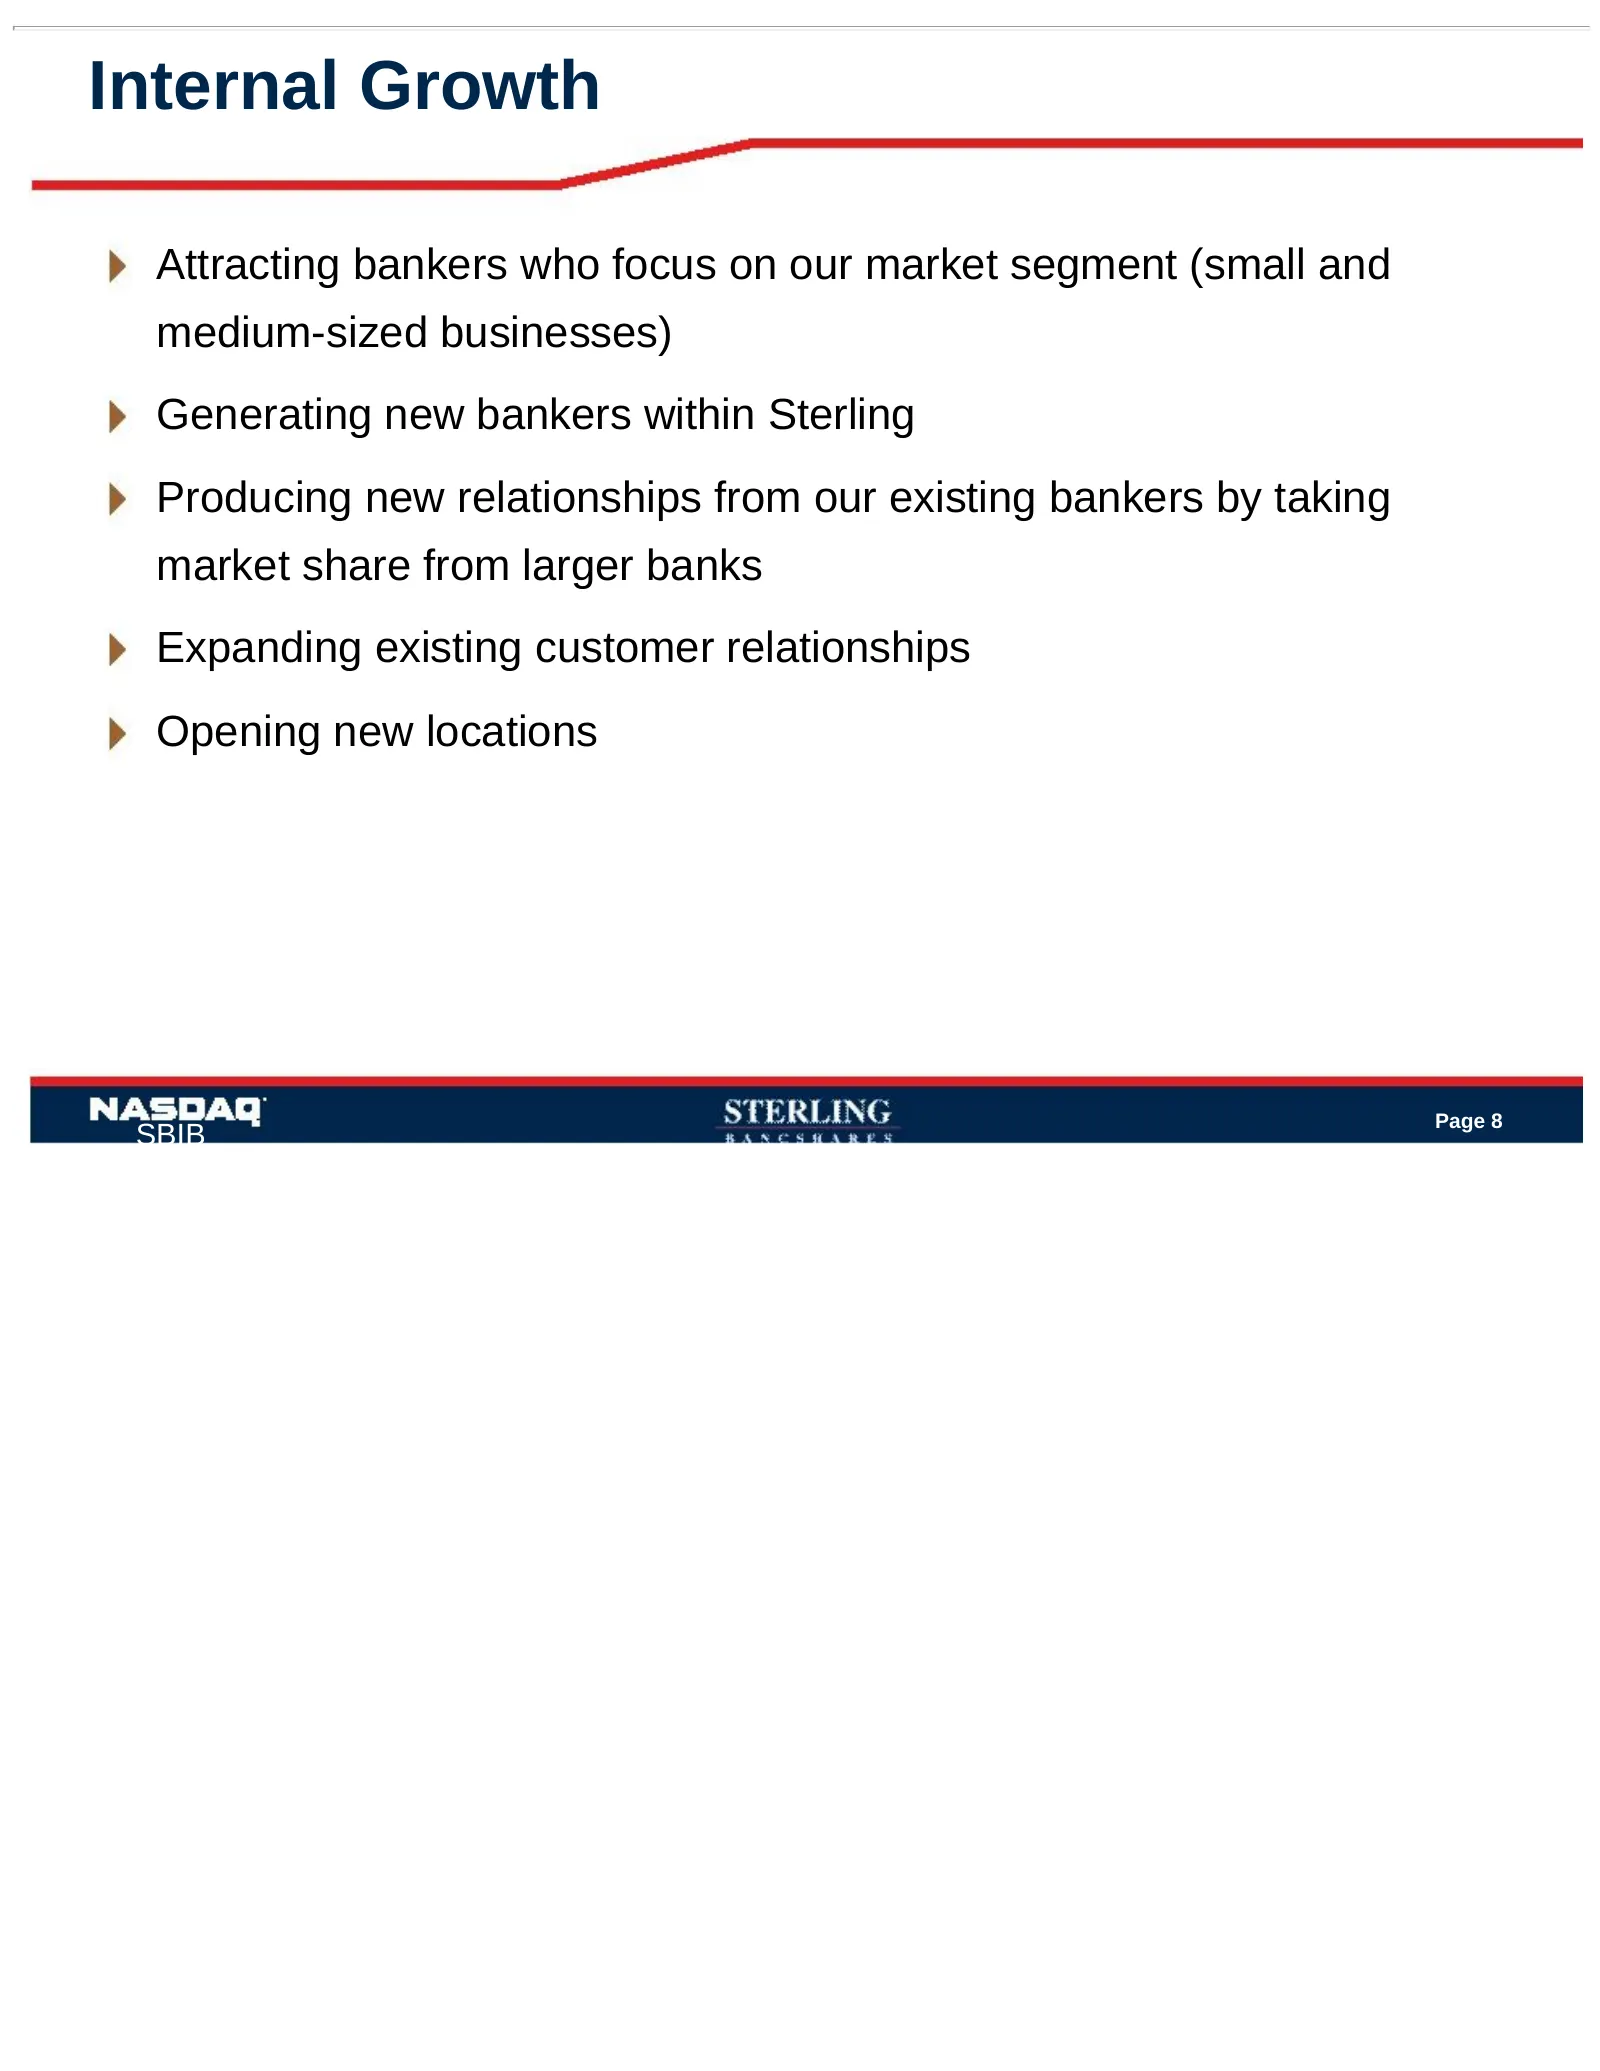
Internal Growth Attracting bankers who focus on our market segment (small and medium-sized businesses) Generating new bankers within Sterling Producing new relationships from our existing bankers by taking market share from larger banks Expanding existing customer relationships Opening new locations
Slide 10: Strategic Acquisitions
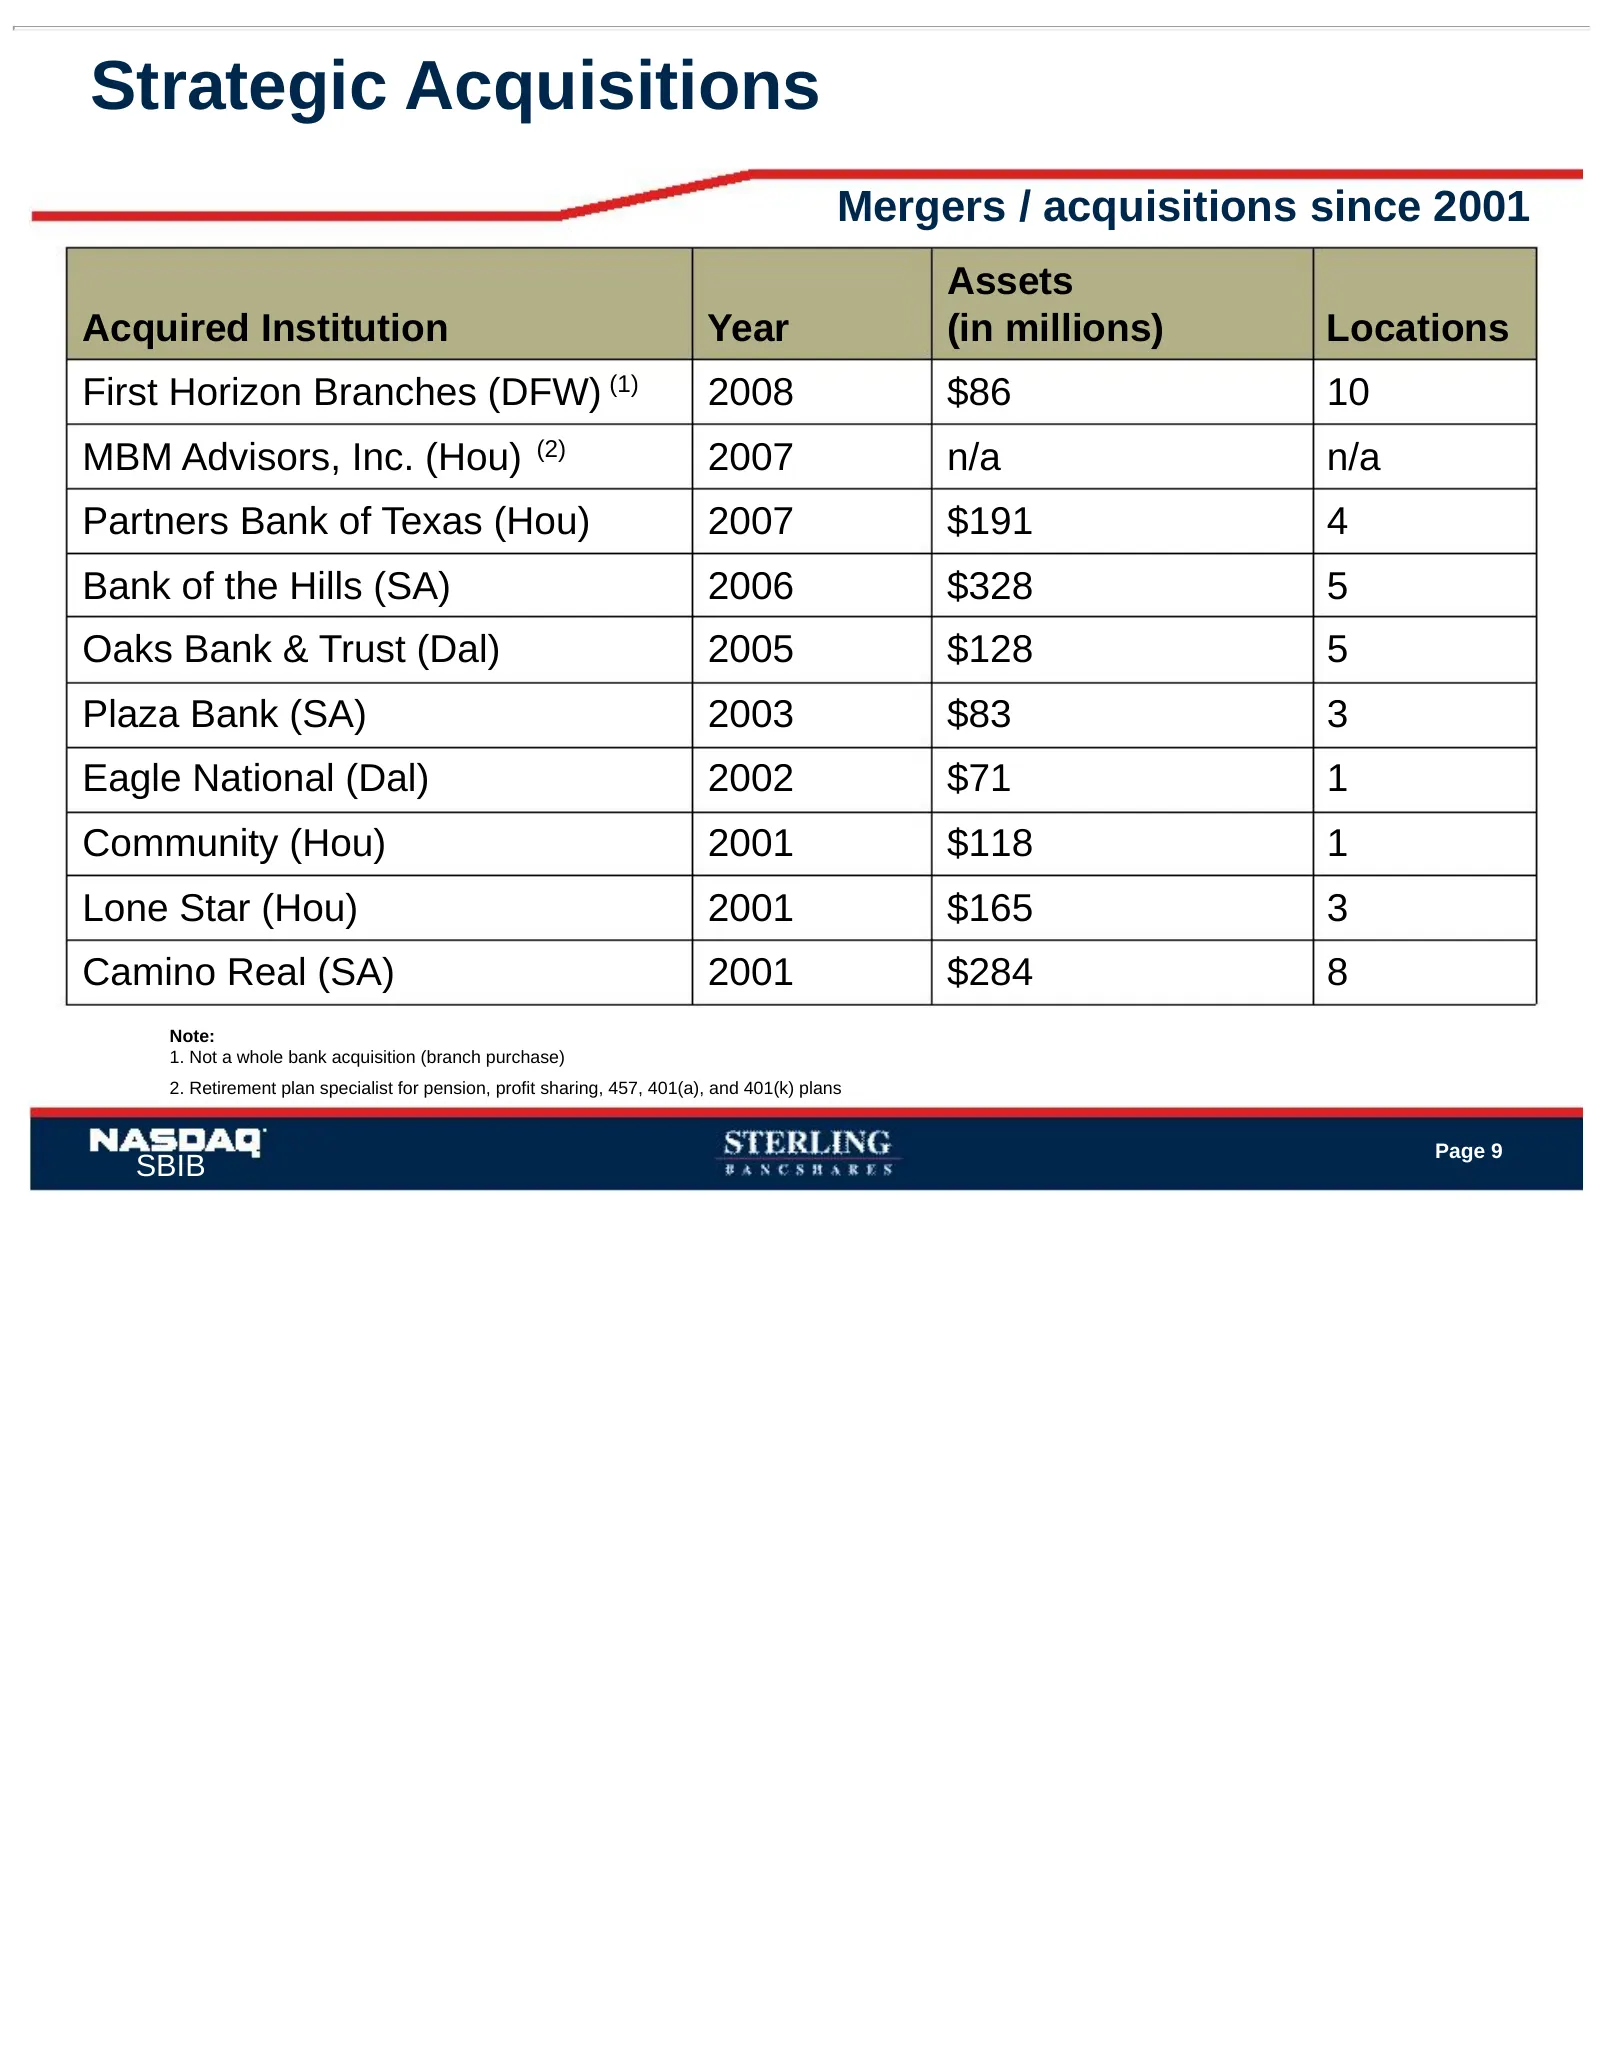
Strategic Acquisitions Mergers / acquisitions since 2001 Assets Acquired Institution Year (in millions) Locations First Horizon Branches (DFW) (1) 2008 $86 10 MBM Advisors, Inc. (Hou) (2) 2007 n/a n/a Partners Bank of Texas (Hou) 2007 $191 4 Bank of the Hills (SA) 2006 $328 5 Oaks Bank & Trust (Dal)
Slide 11: Business Lines that Support Core Growth
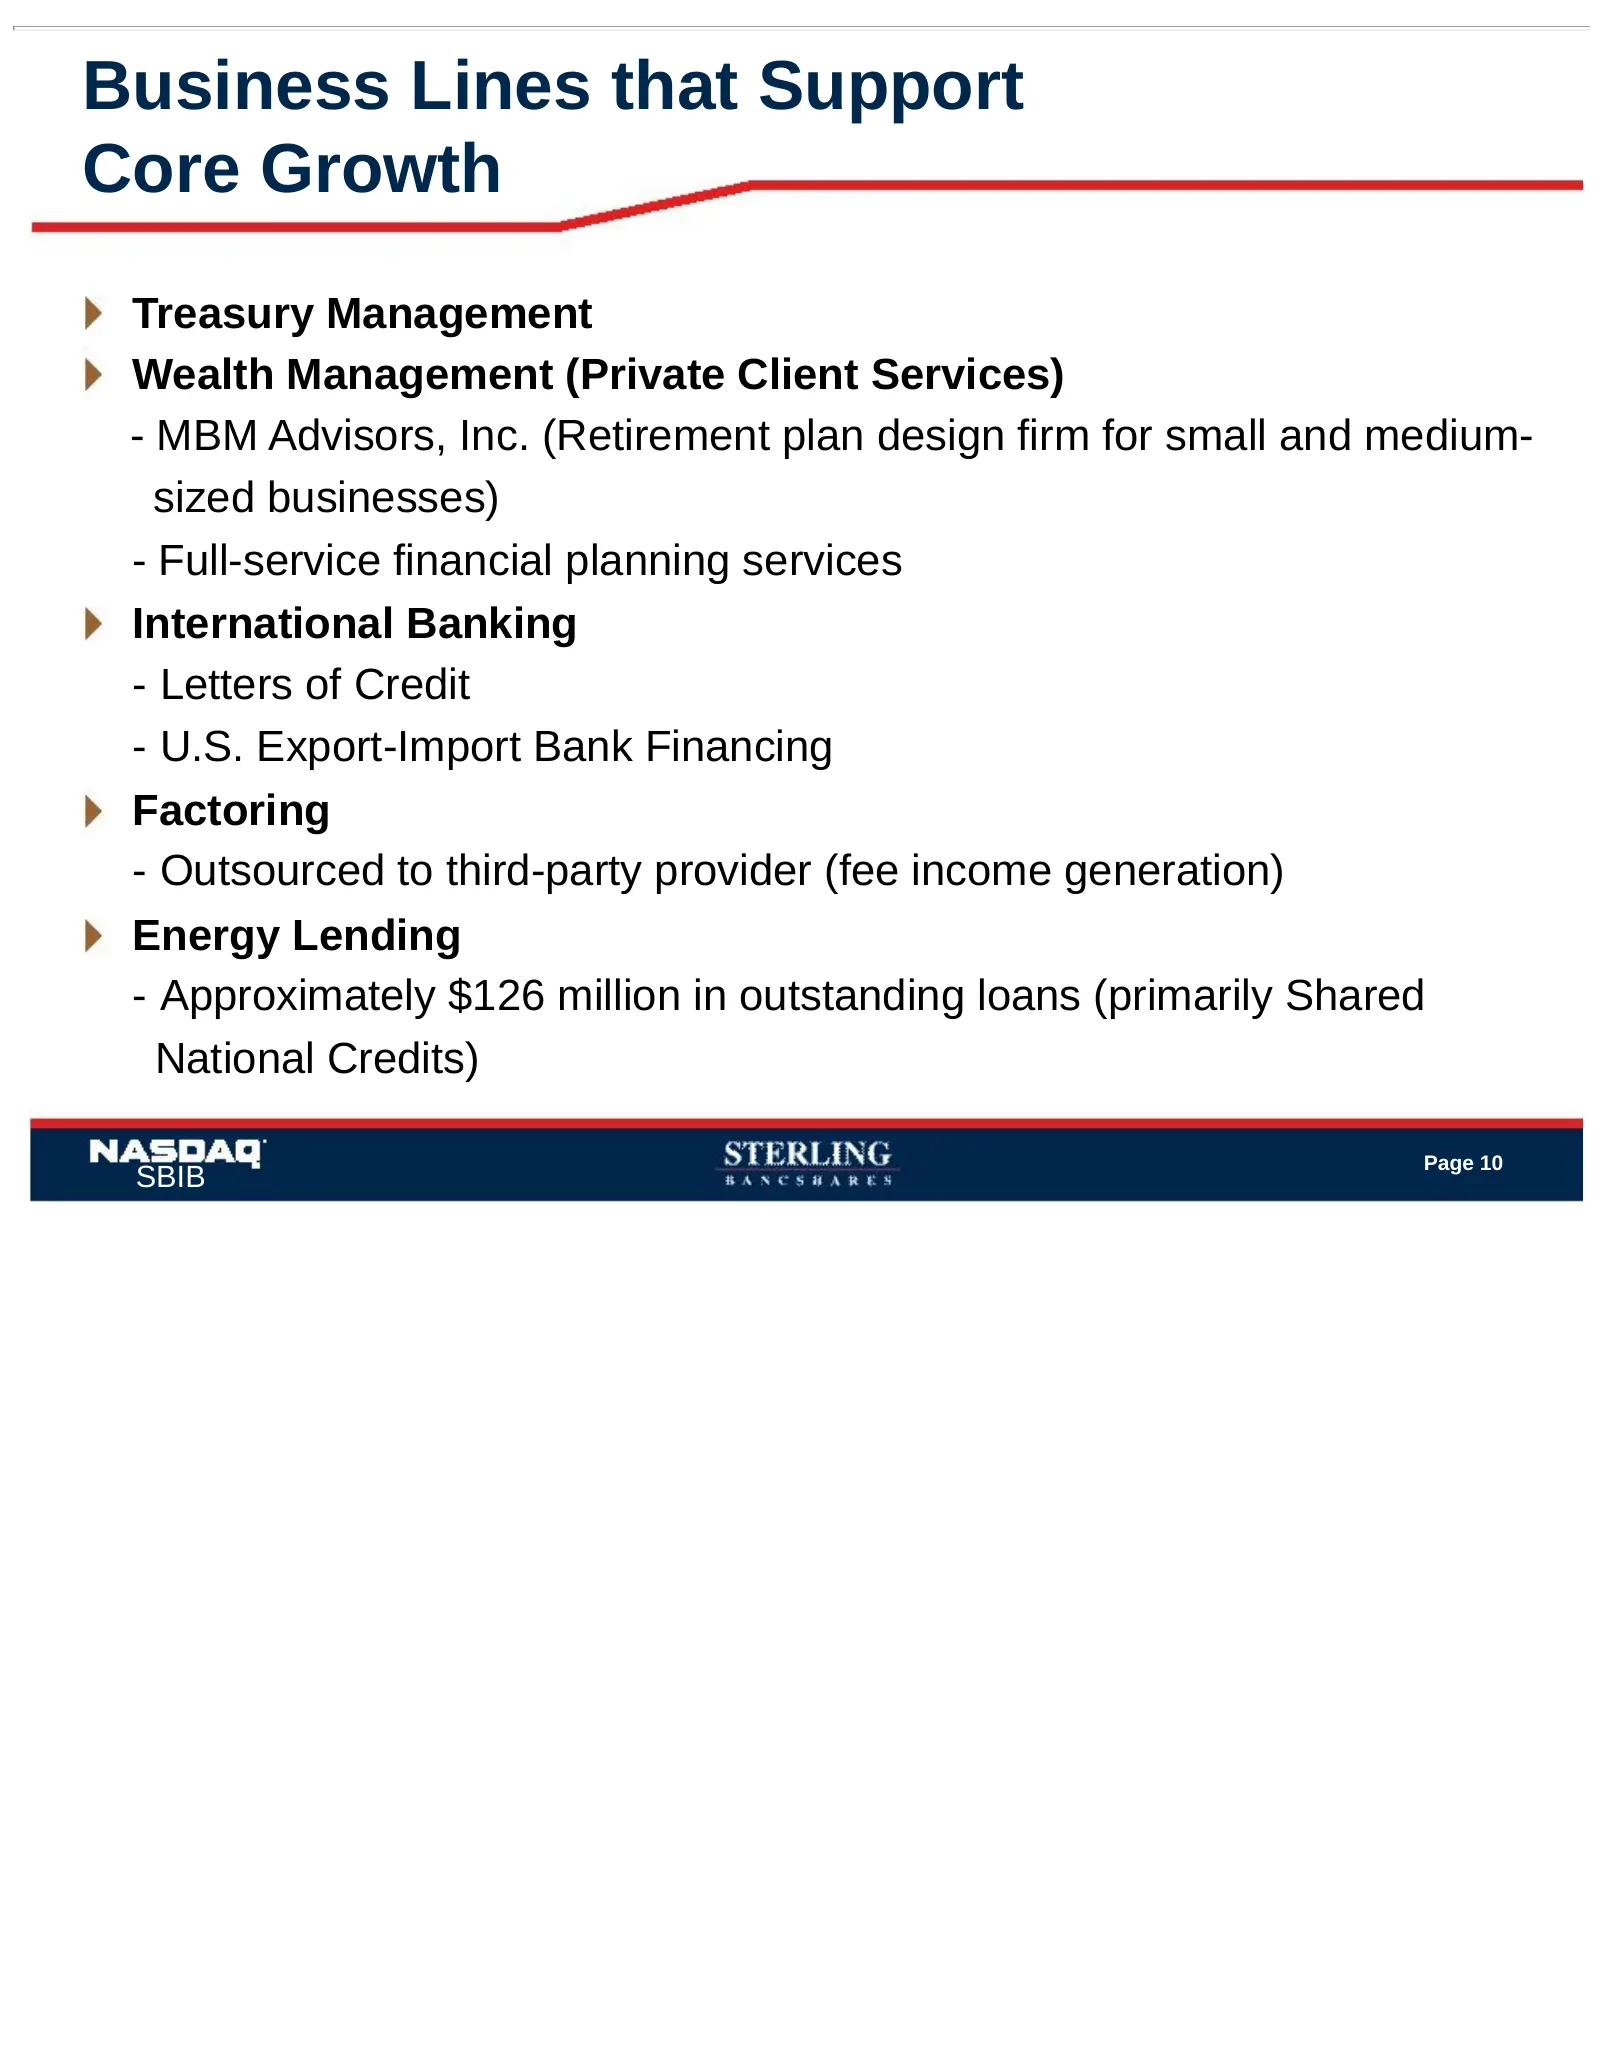
Business Lines that Support Core Growth Treasury Management Wealth Management (Private Client Services) - MBM Advisors, Inc. (Retirement plan design firm for small and medium- sized businesses) - Full-service financial planning services International Banking - Letters of Credit - U.S. Export-Import
Slide 12: Business Highlights
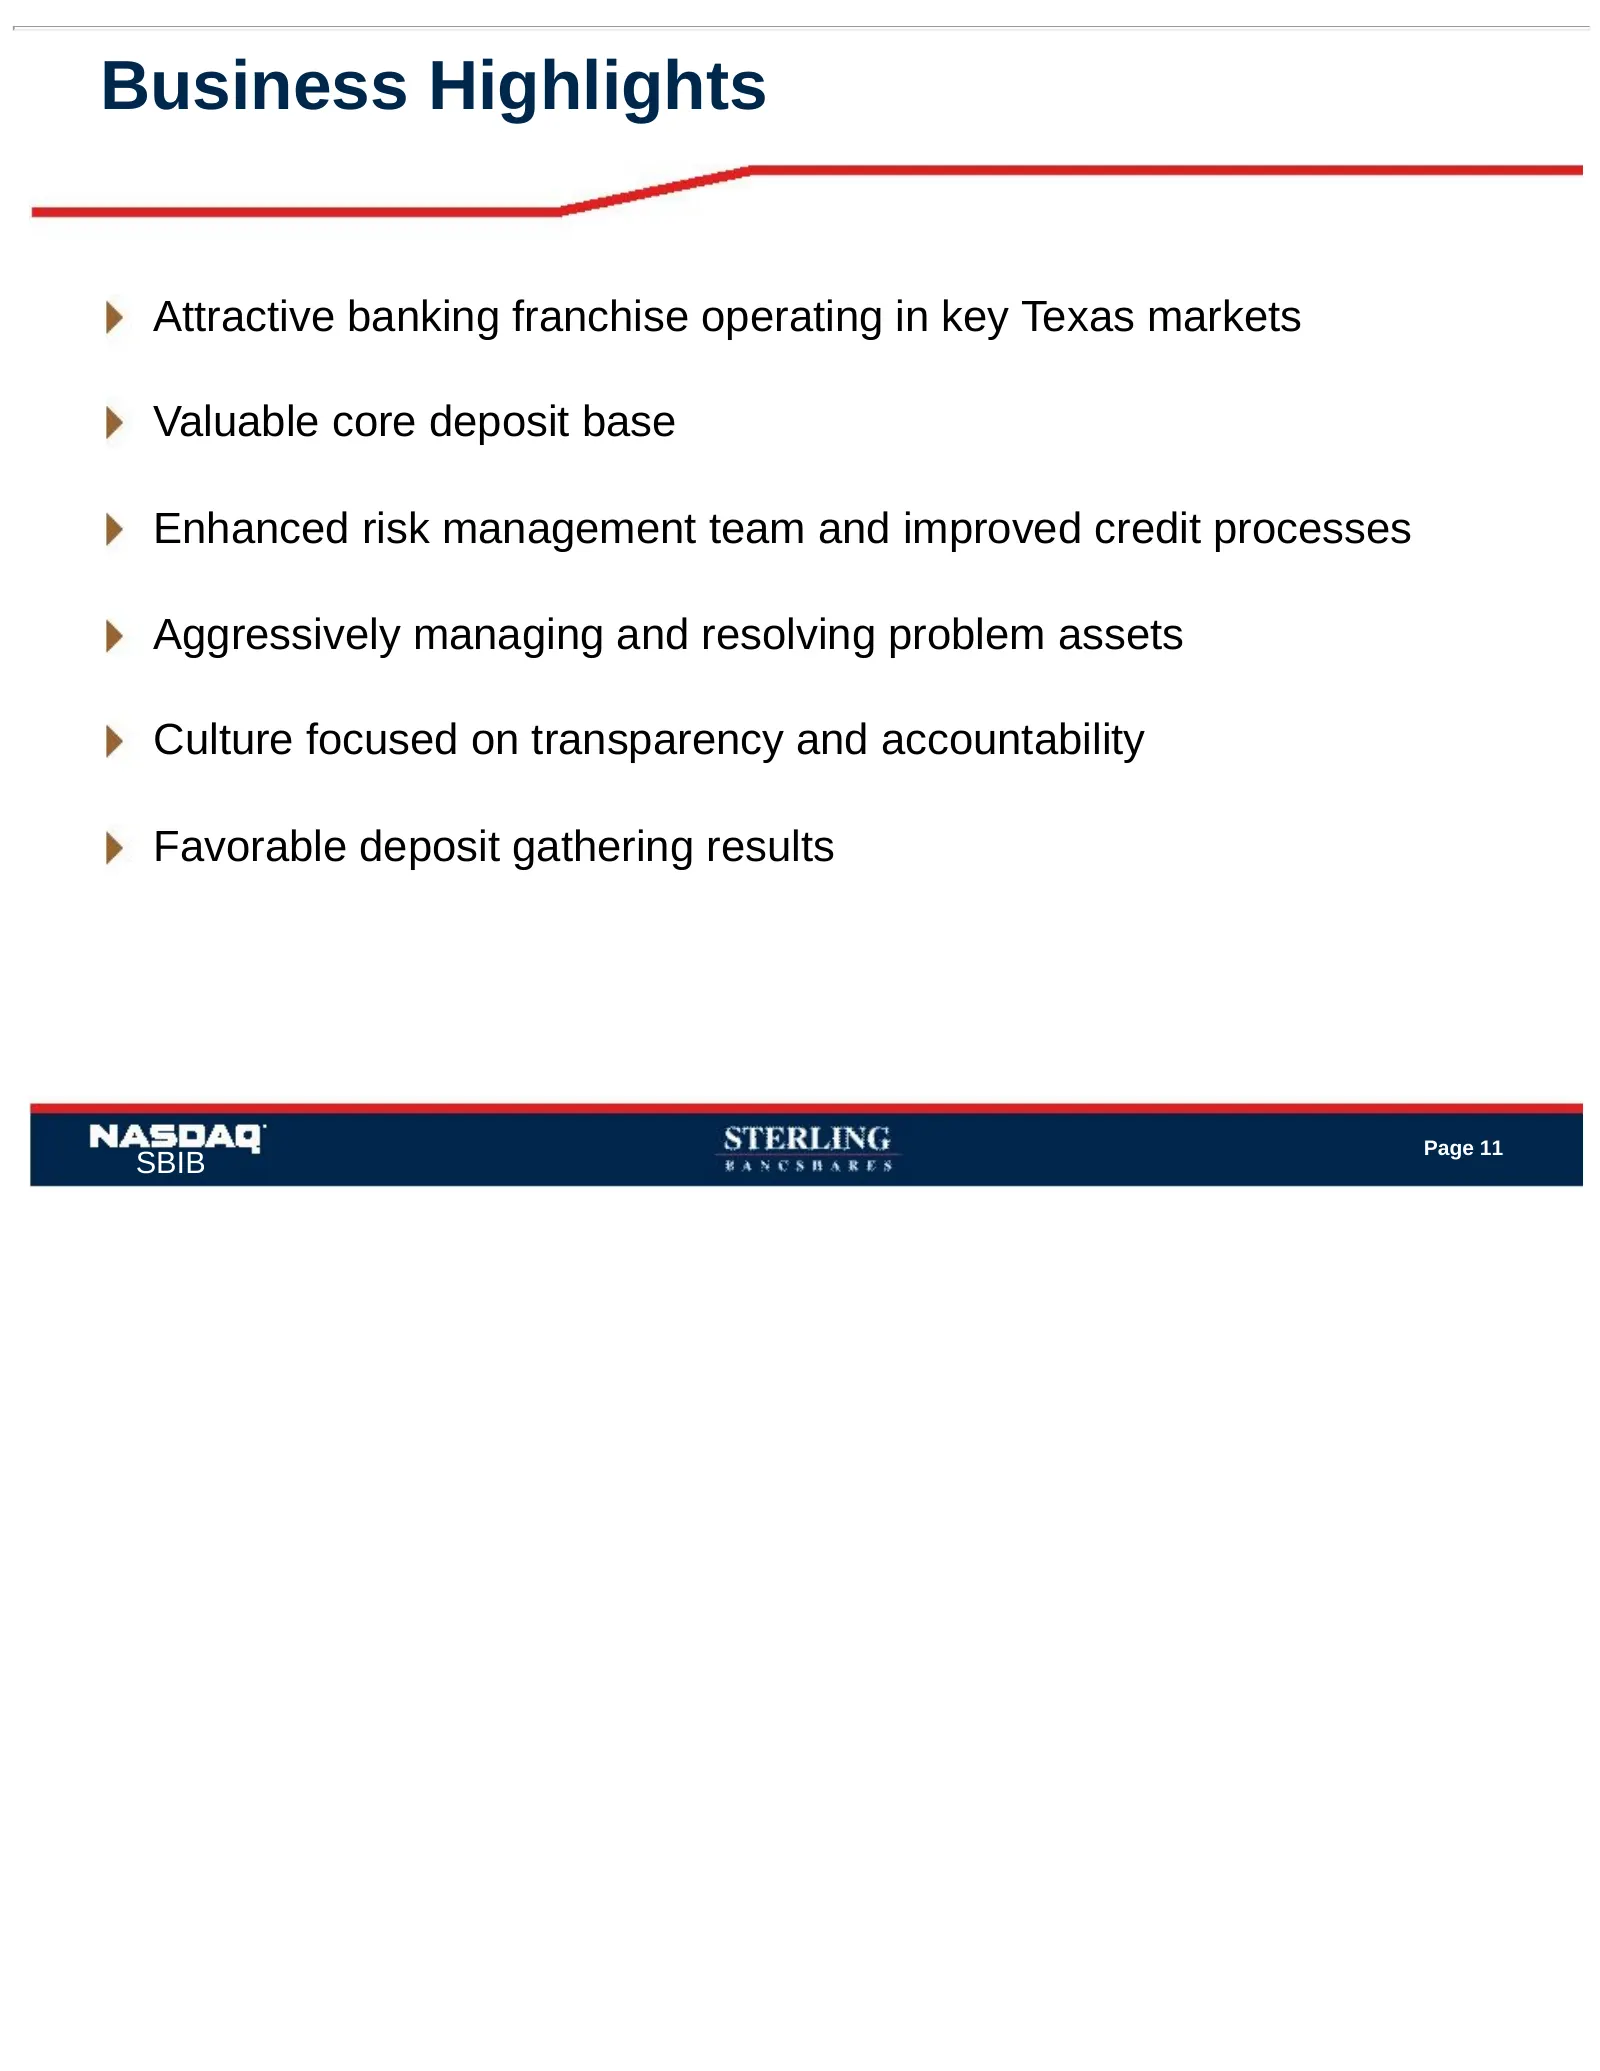
Business Highlights Attractive banking franchise operating in key Texas markets Valuable core deposit base Enhanced risk management team and improved credit processes Aggressively managing and resolving problem assets Culture focused on transparency and accountability Favorable deposit gathering res
Slide 13: 3Q'10 Financial Highlights
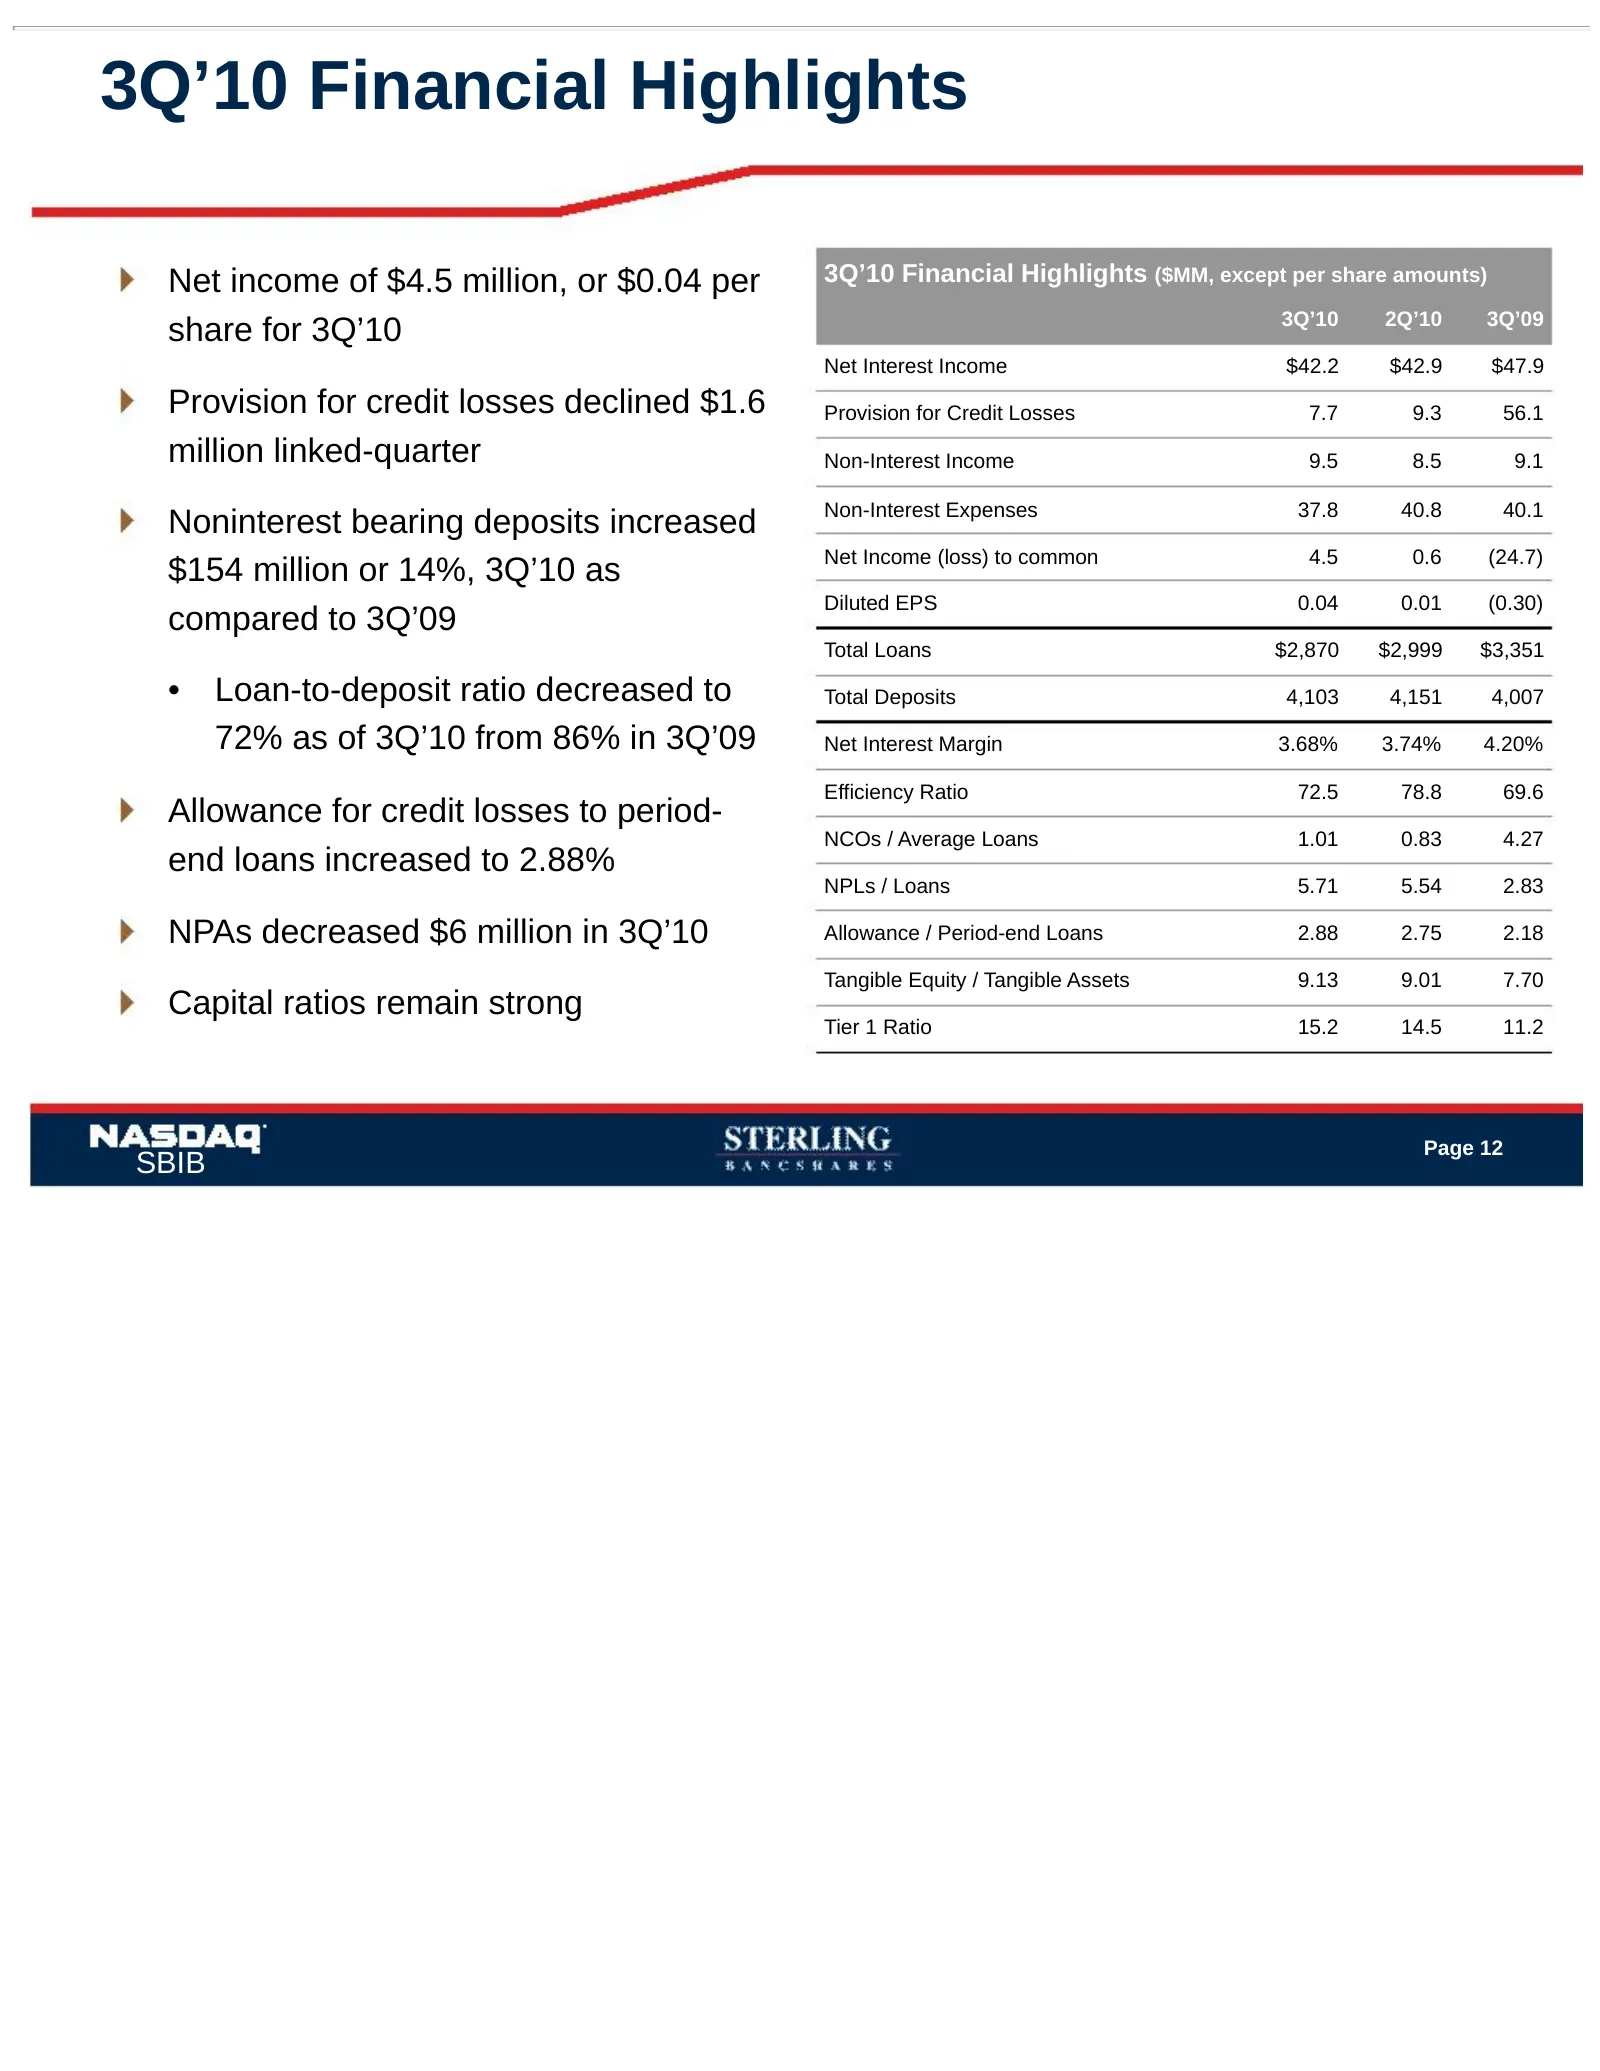
3Q’10 Financial Highlights Net income of $4.5 million, or $0.04 per 3Q’10 Financial Highlights ($MM, except per share amounts) 3Q’10 2Q’10 3Q’09 share for 3Q’10 Net Interest Income $42.2 $42.9 $47.9 Provision for credit losses declined $1.6 Provision for Credit Losses 7.7 9.3 56.1 million linked-qua
Slide 14: Attractive Long-Term Franchise
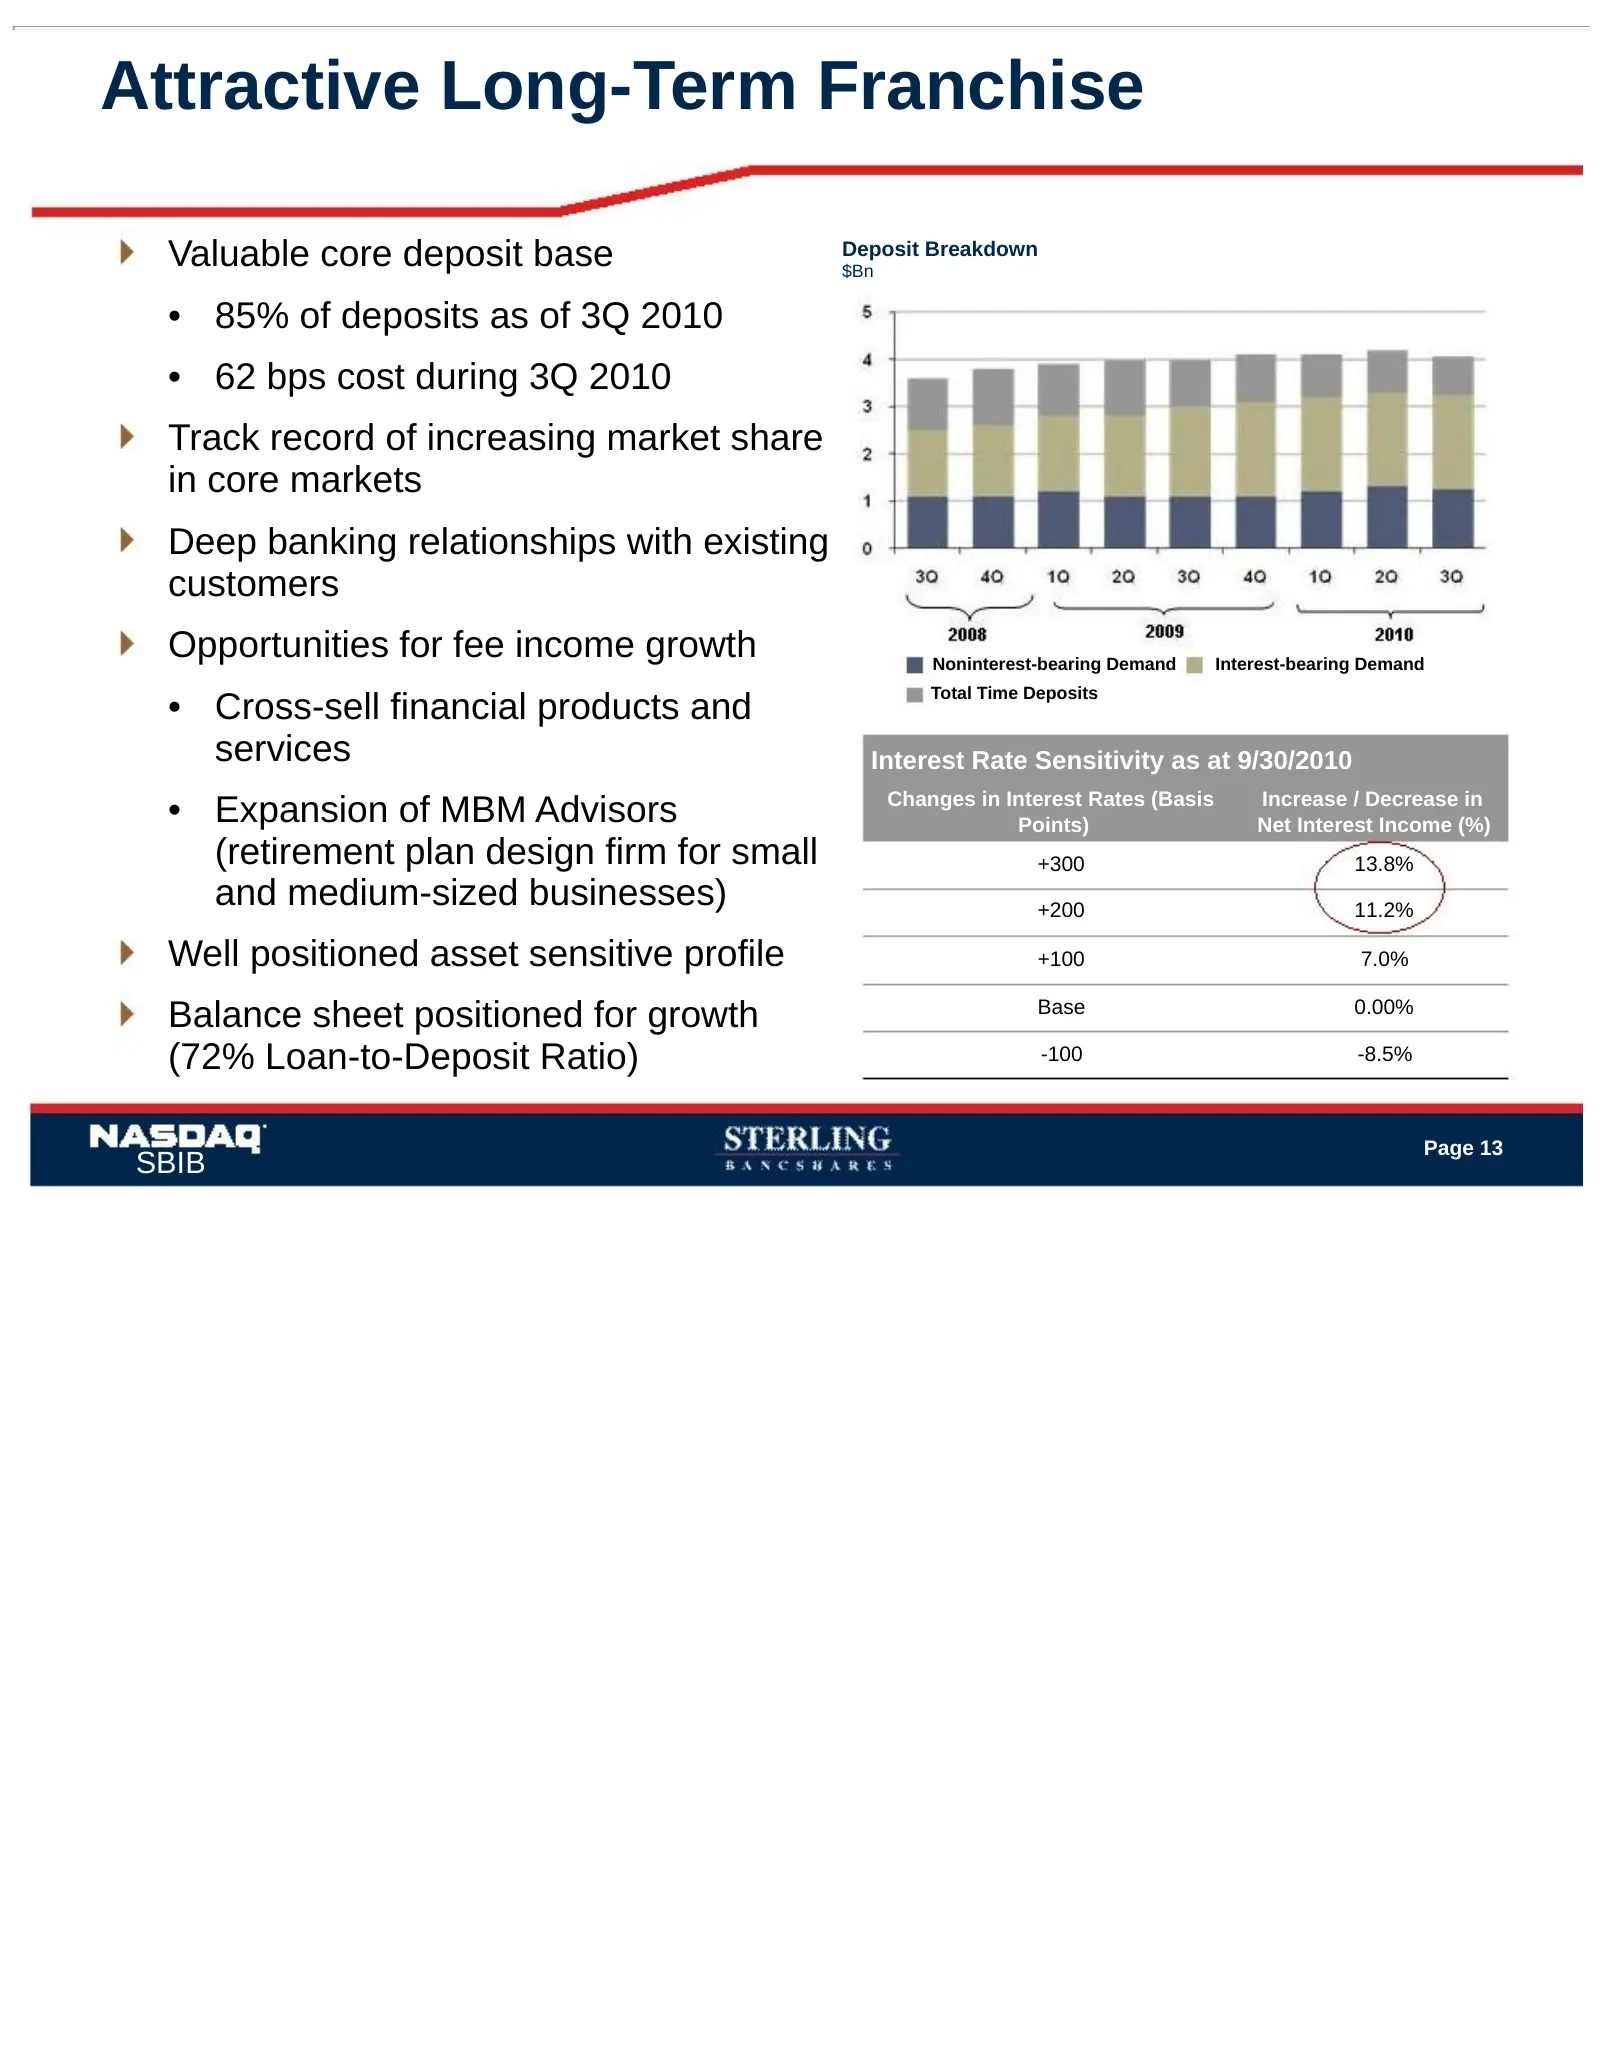
Attractive Long-Term Franchise Valuable core deposit base Deposit Breakdown $Bn • 85% of deposits as of 3Q 2010 • 62 bps cost during 3Q 2010 Track record of increasing market share in core markets Deep banking relationships with existing customers Opportunities for fee income growth Noninterest-bear
Slide 15: Loan Mix
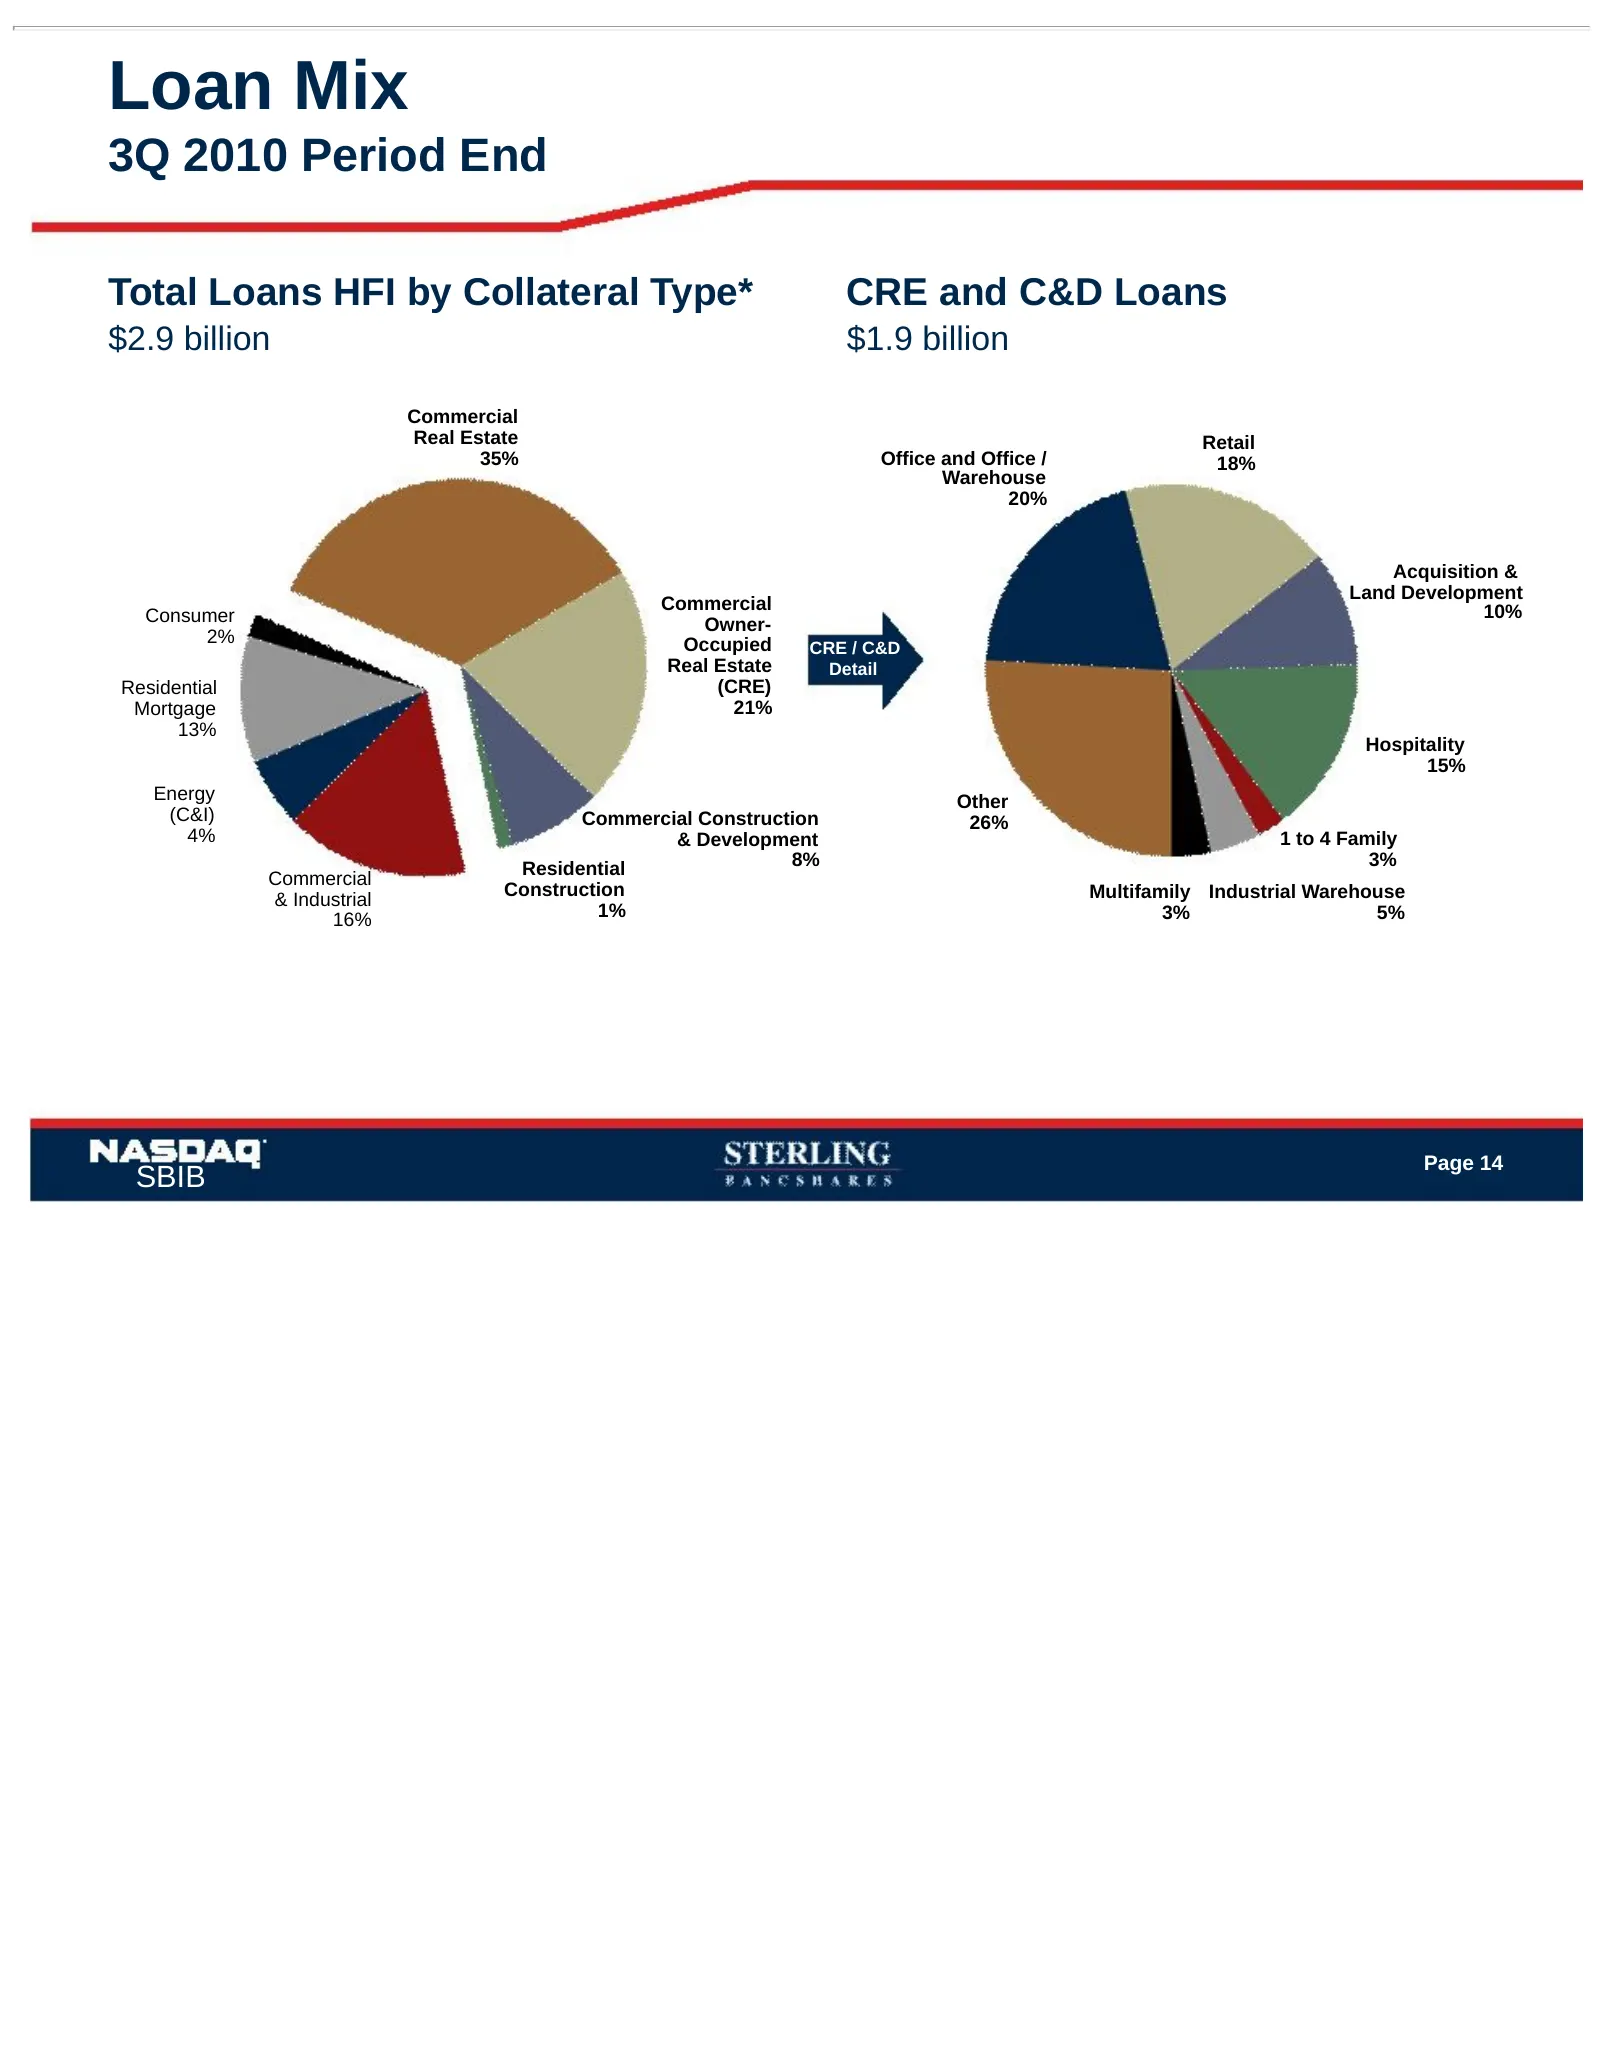
Loan Mix 3Q 2010 Period End Total Loans HFI by Collateral Type* CRE and C&D Loans $2.9 billion $1.9 billion Commercial Real Estate Retail 35% Office and Office / 18% Warehouse 20% Acquisition & Land Development Commercial 10% Consumer Owner- 2% Occupied CRE / C&D Real Estate Detail Residential (CRE)
Slide 16: Oil & Gas Reserve Based Lending
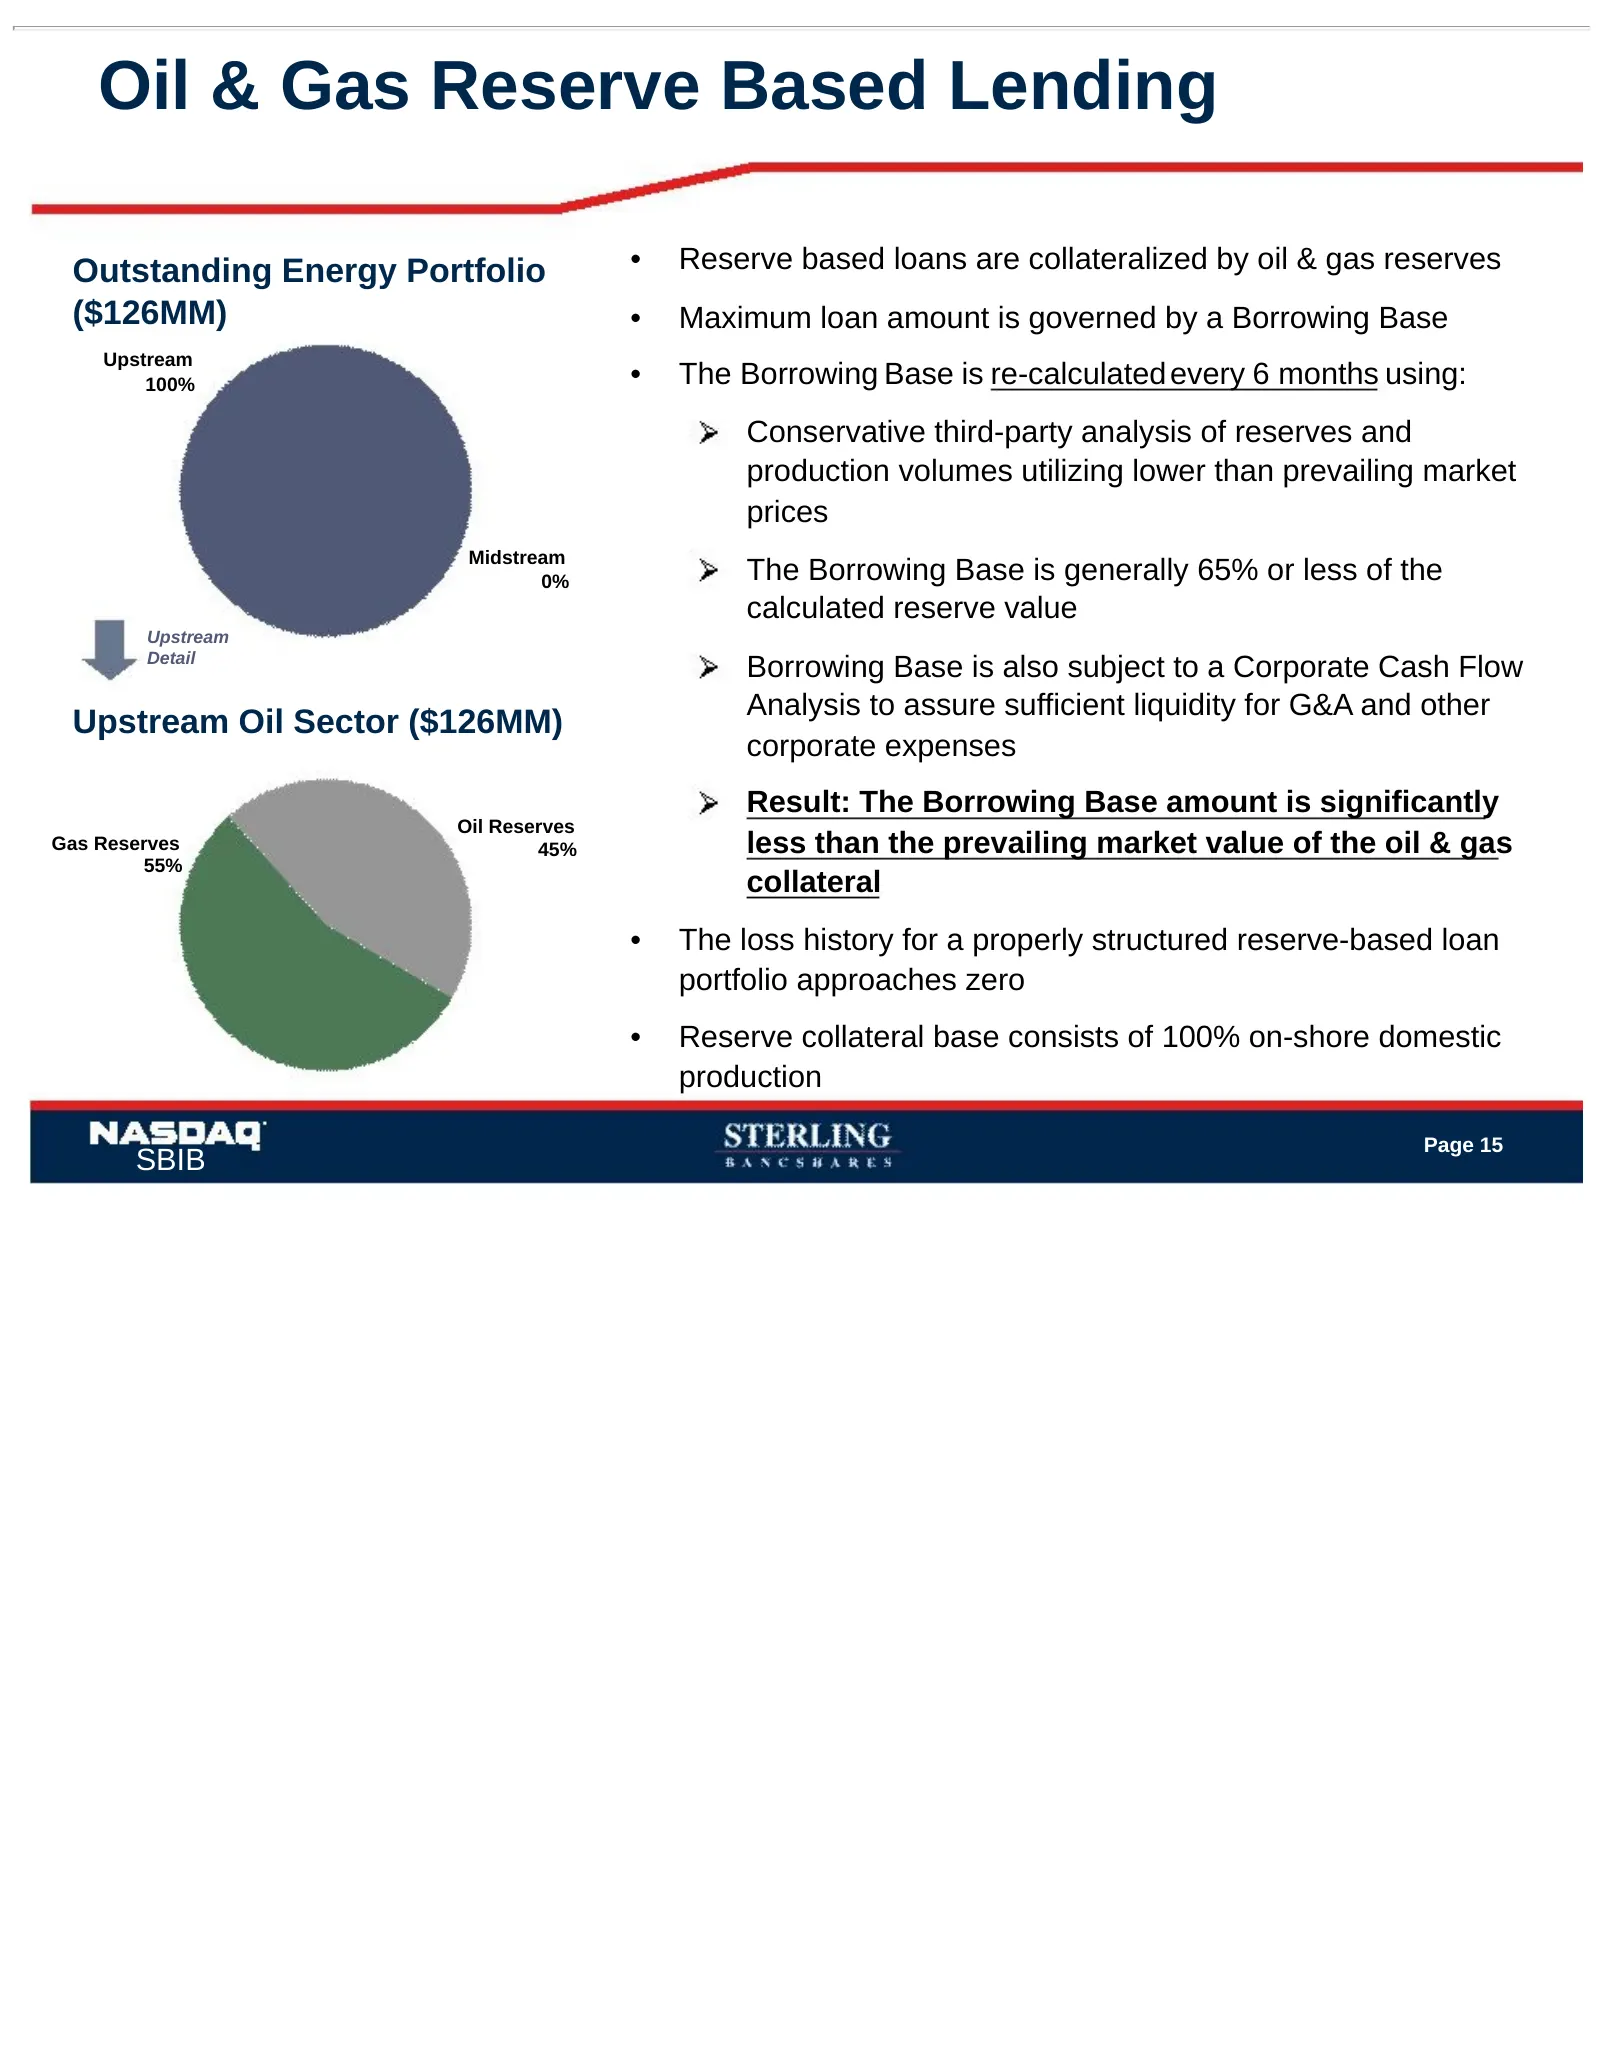
Oil & Gas Reserve Based Lending Outstanding Energy Portfolio • Reserve based loans are collateralized by oil & gas reserves ($126MM) • Maximum loan amount is governed by a Borrowing Base Upstream 100% • The Borrowing Base is re-calculated every 6 months using: Conservative third-party analysis of re
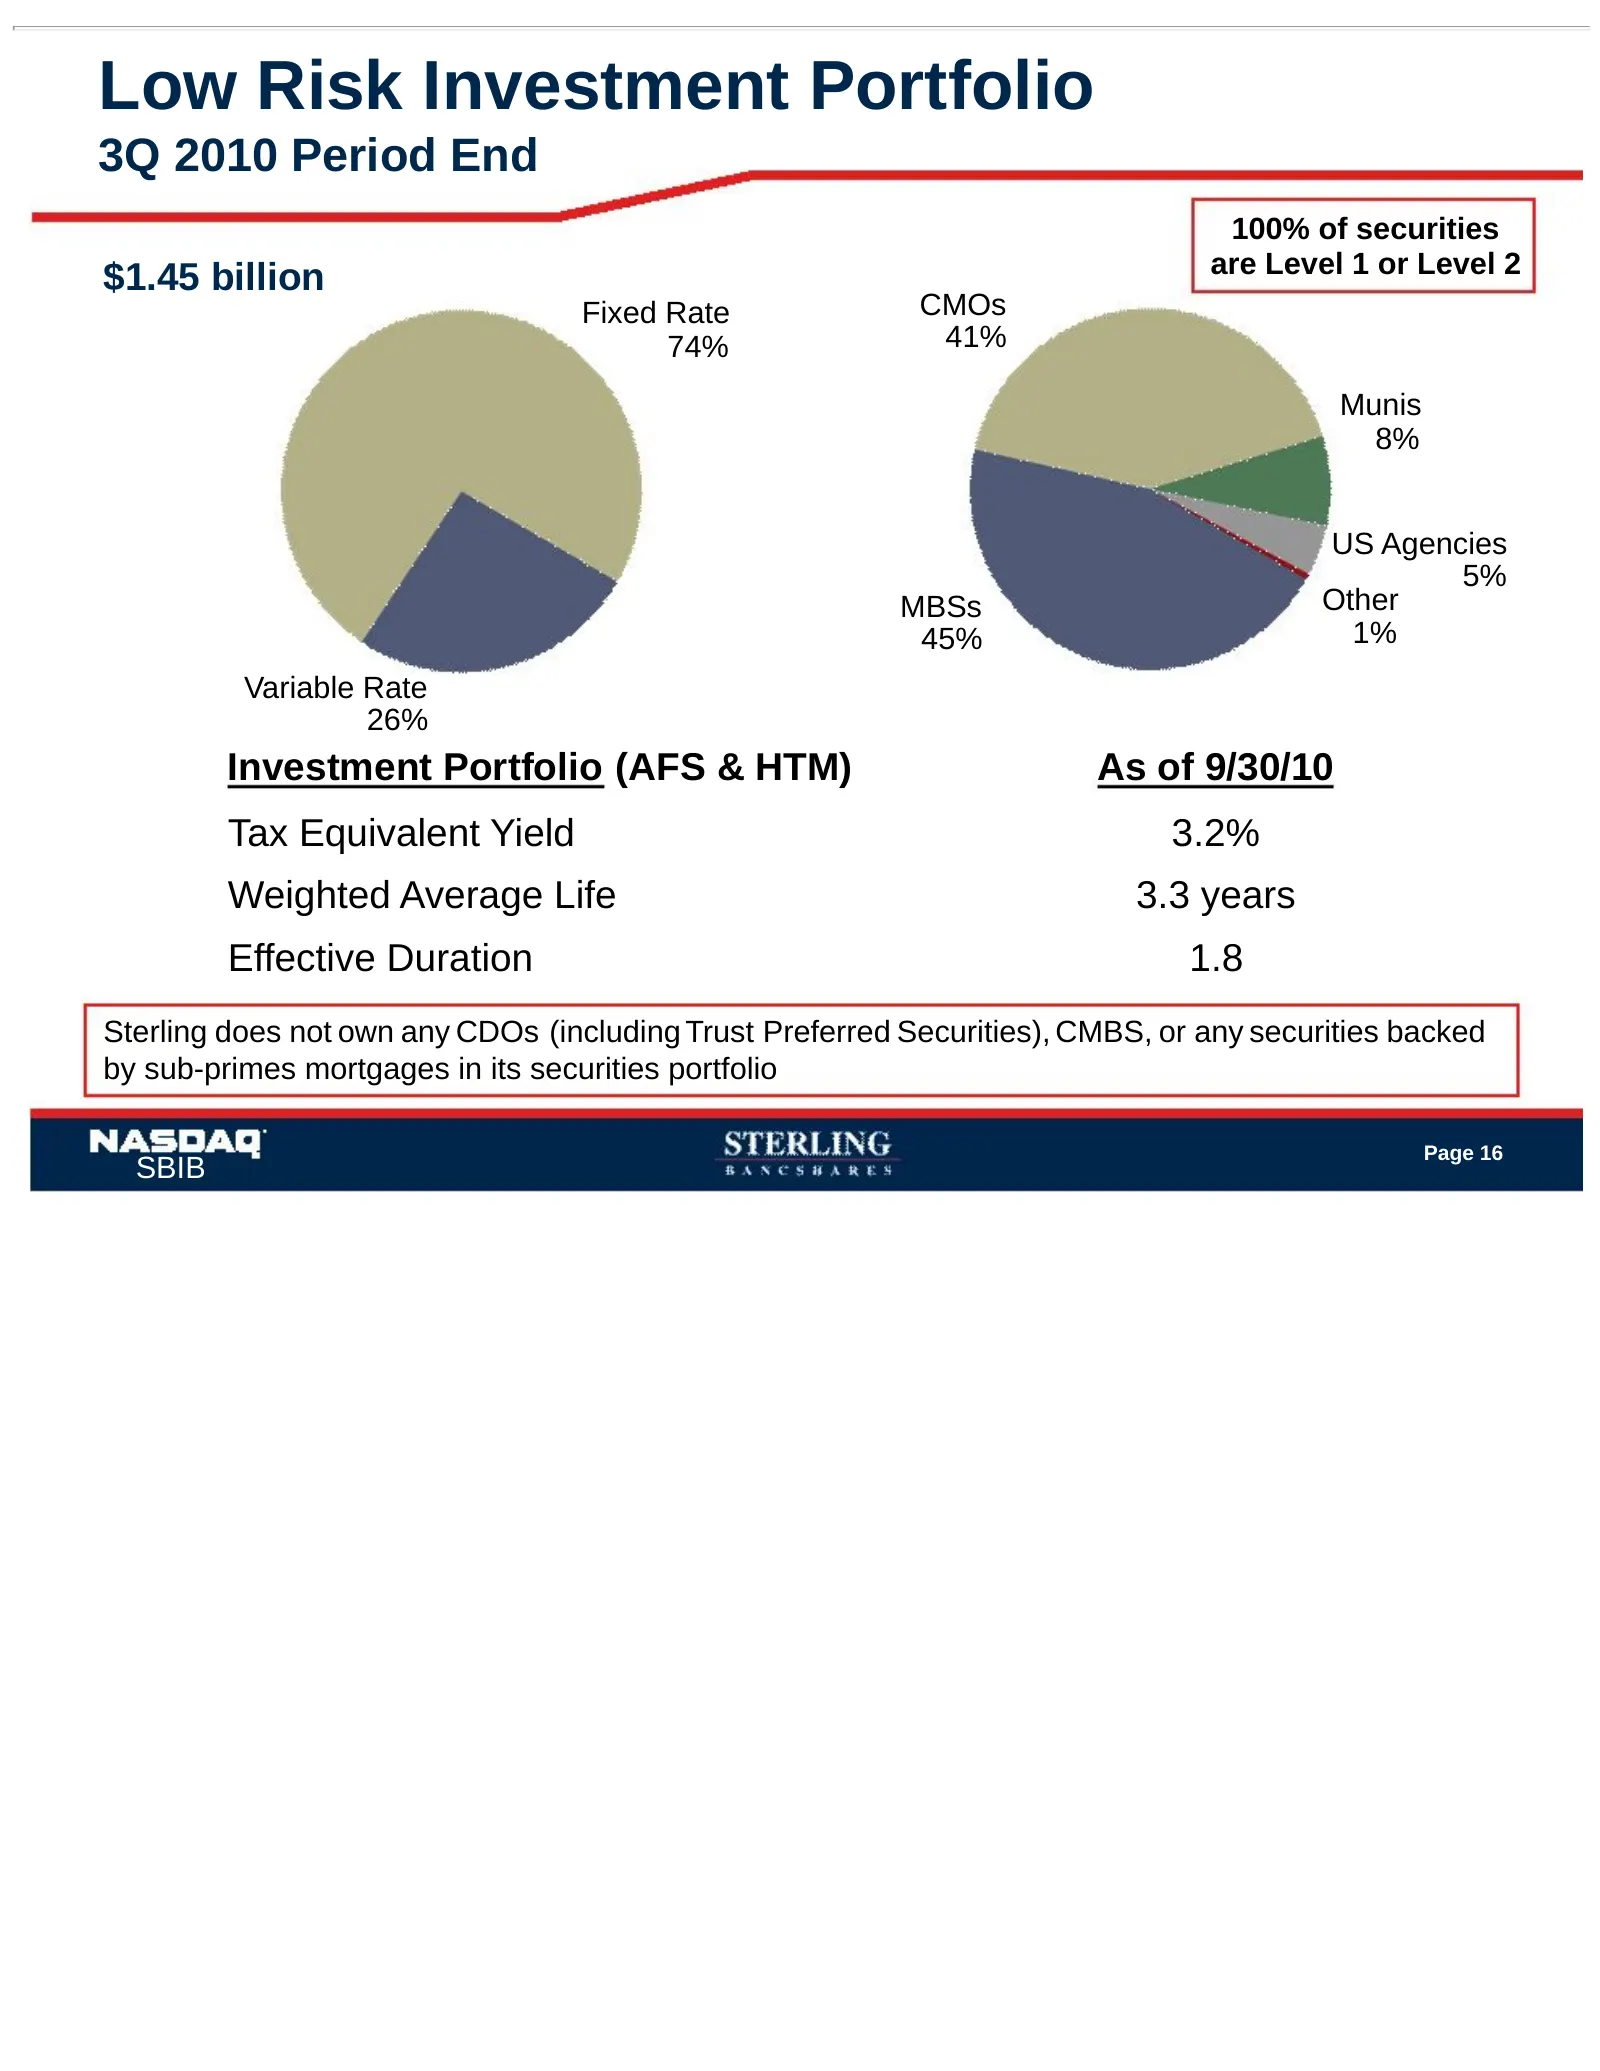
Slide 17: Low Risk Investment Portfolio
Low Risk Investment Portfolio 3Q 2010 Period End 100% of securities are Level 1 or Level 2 $1.45 billion Fixed Rate CMOs 74% 41% Munis 8% US Agencies 5% MBSs Other 45% 1% Variable Rate 26% Investment Portfolio (AFS & HTM) As of 9/30/10 Tax Equivalent Yield 3.2% Weighted Average Life 3.3 years Effect
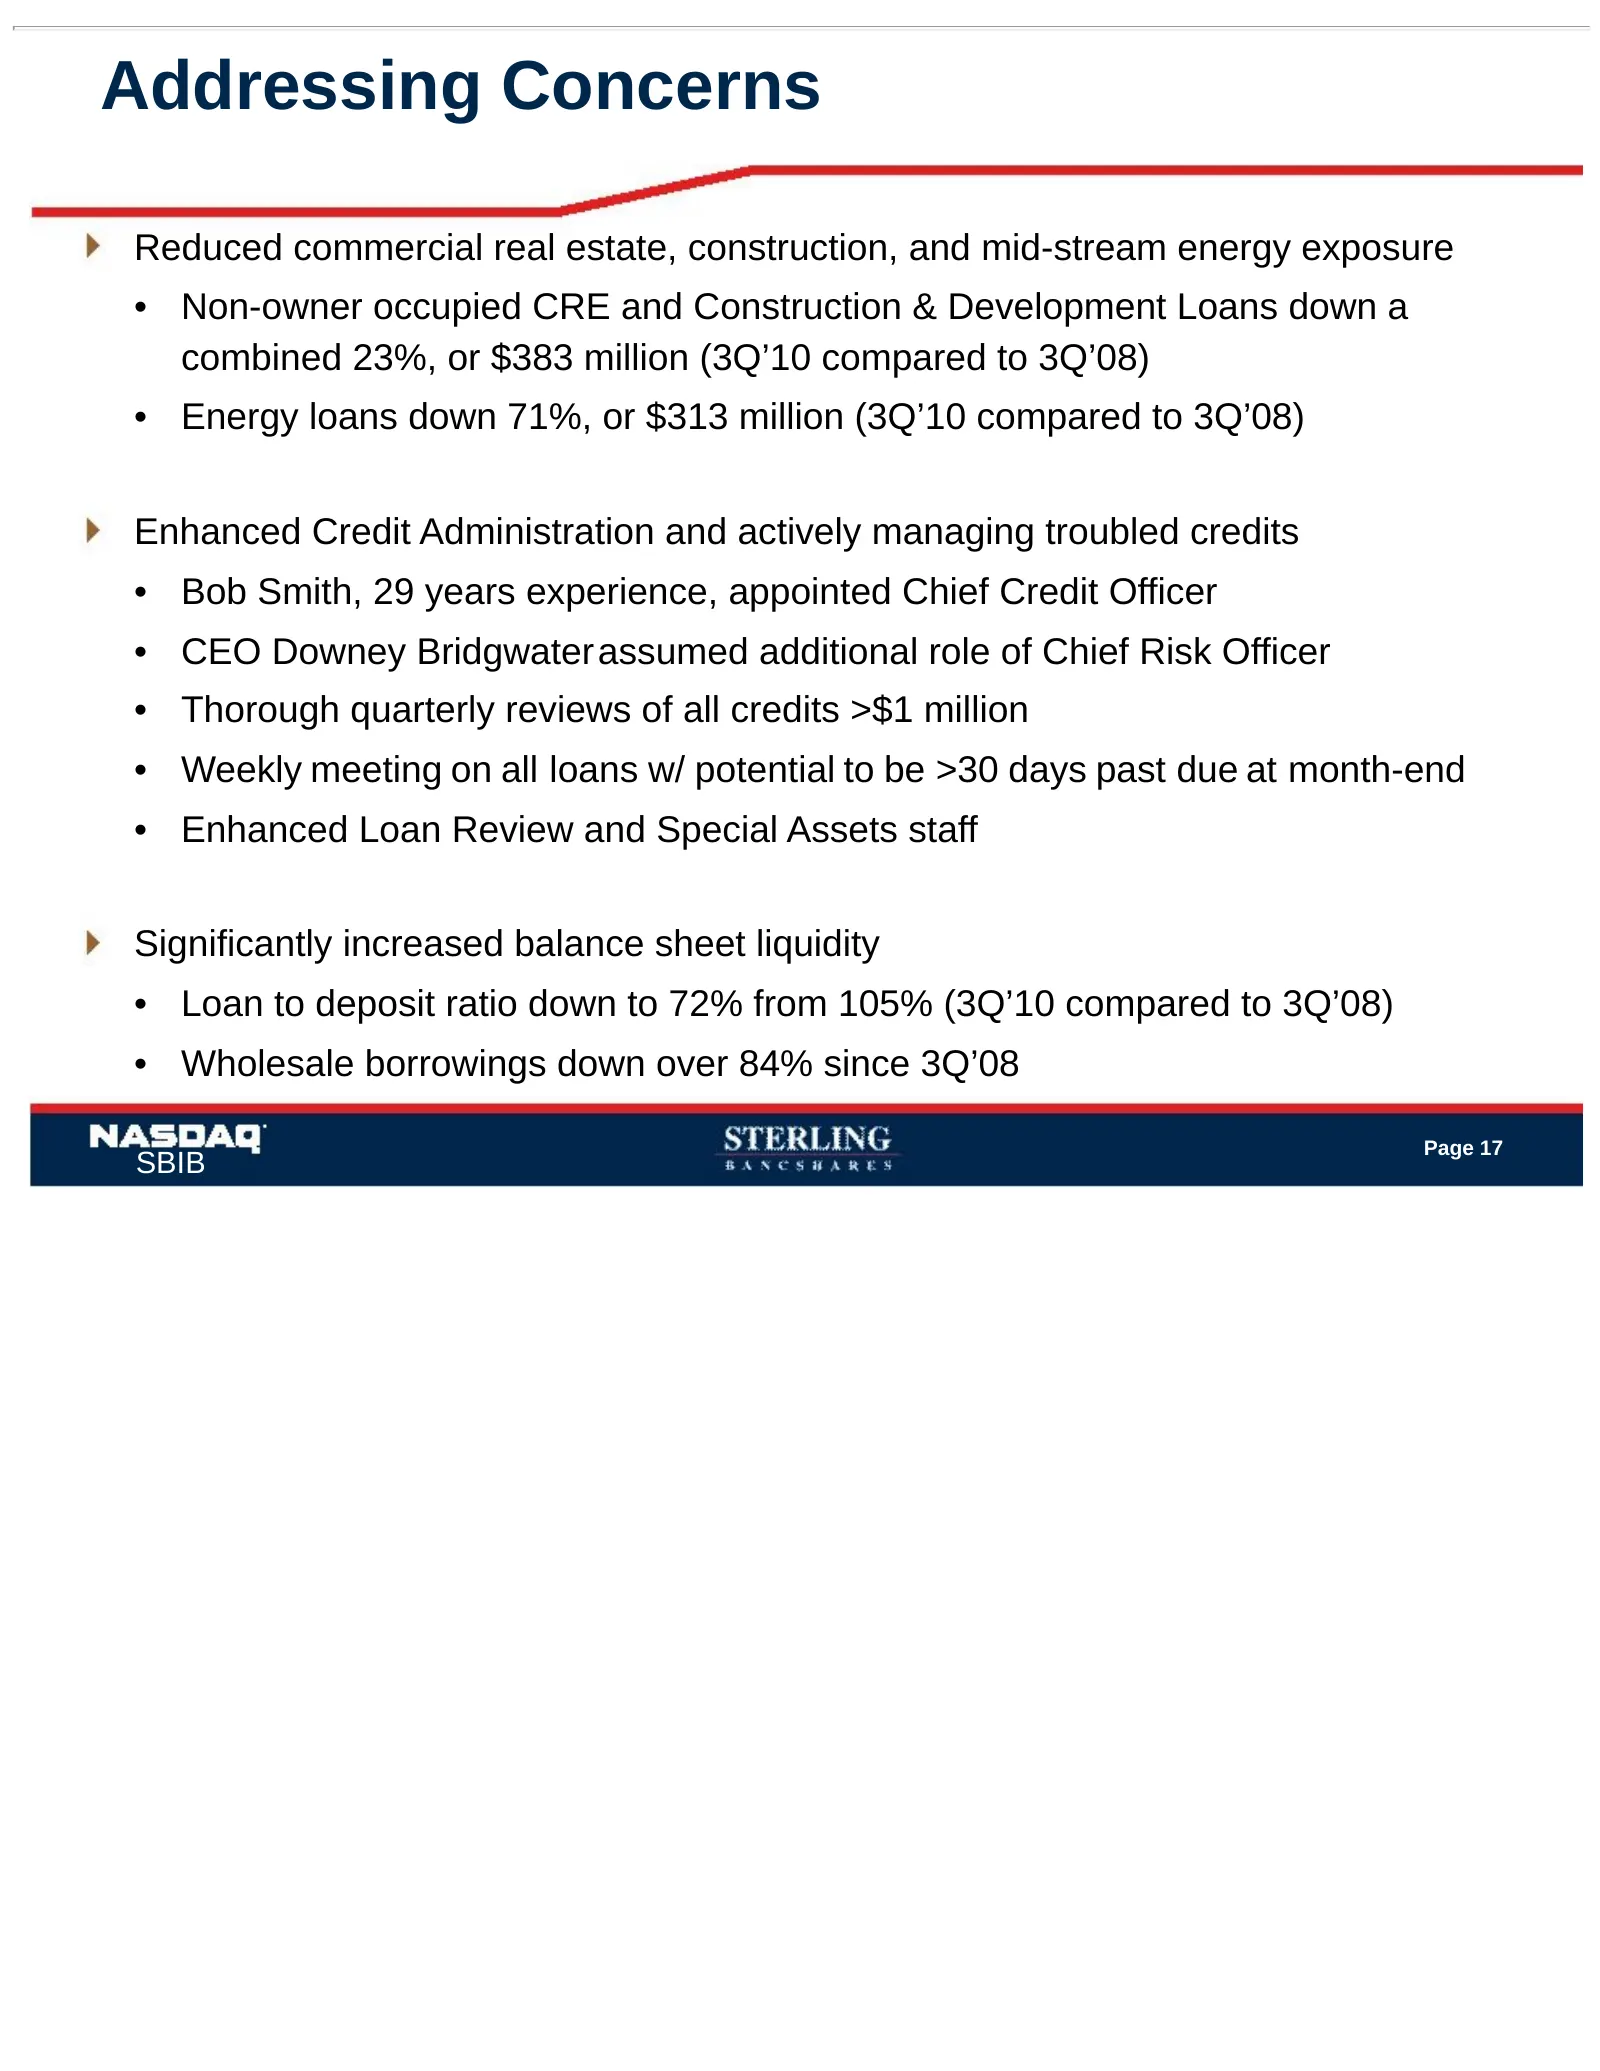
Slide 18: Addressing Concerns
Addressing Concerns Reduced commercial real estate, construction, and mid-stream energy exposure • Non-owner occupied CRE and Construction & Development Loans down a combined 23%, or $383 million (3Q’10 compared to 3Q’08) • Energy loans down 71%, or $313 million (3Q’10 compared to 3Q’08) Enhanced Cr
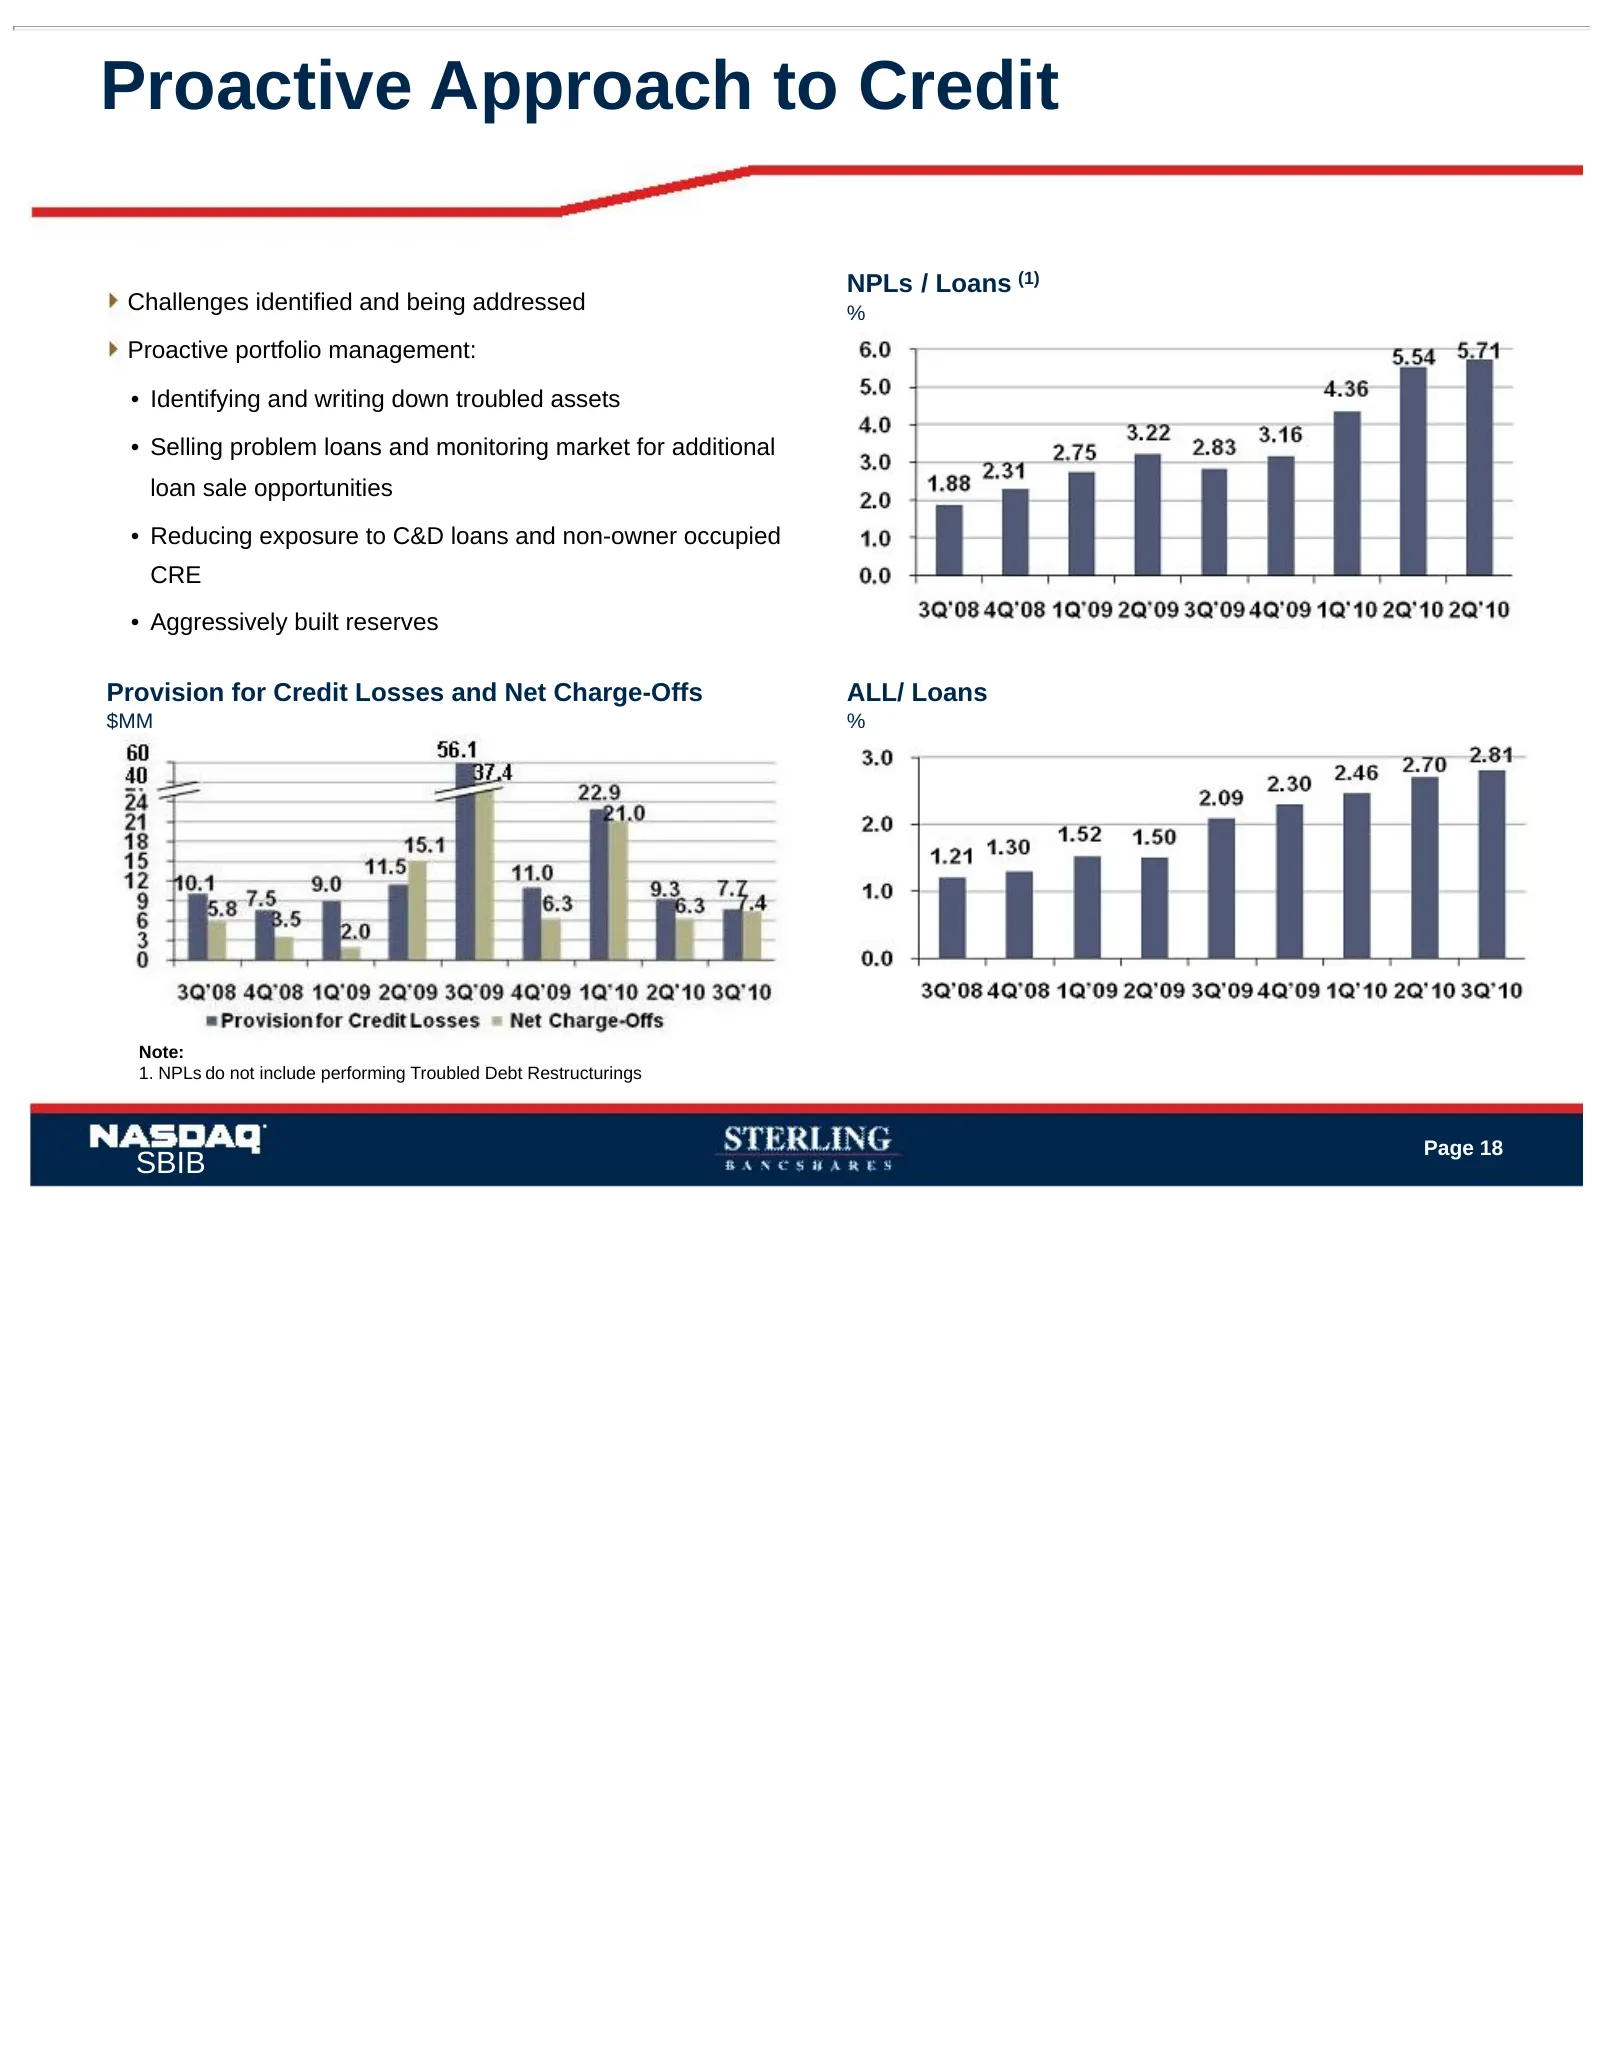
Slide 19: Proactive Approach to Credit
Proactive Approach to Credit NPLs / Loans (1) Challenges identified and being addressed % Proactive portfolio management: • Identifying and writing down troubled assets • Selling problem loans and monitoring market for additional loan sale opportunities • Reducing exposure to C&D loans and non-owner
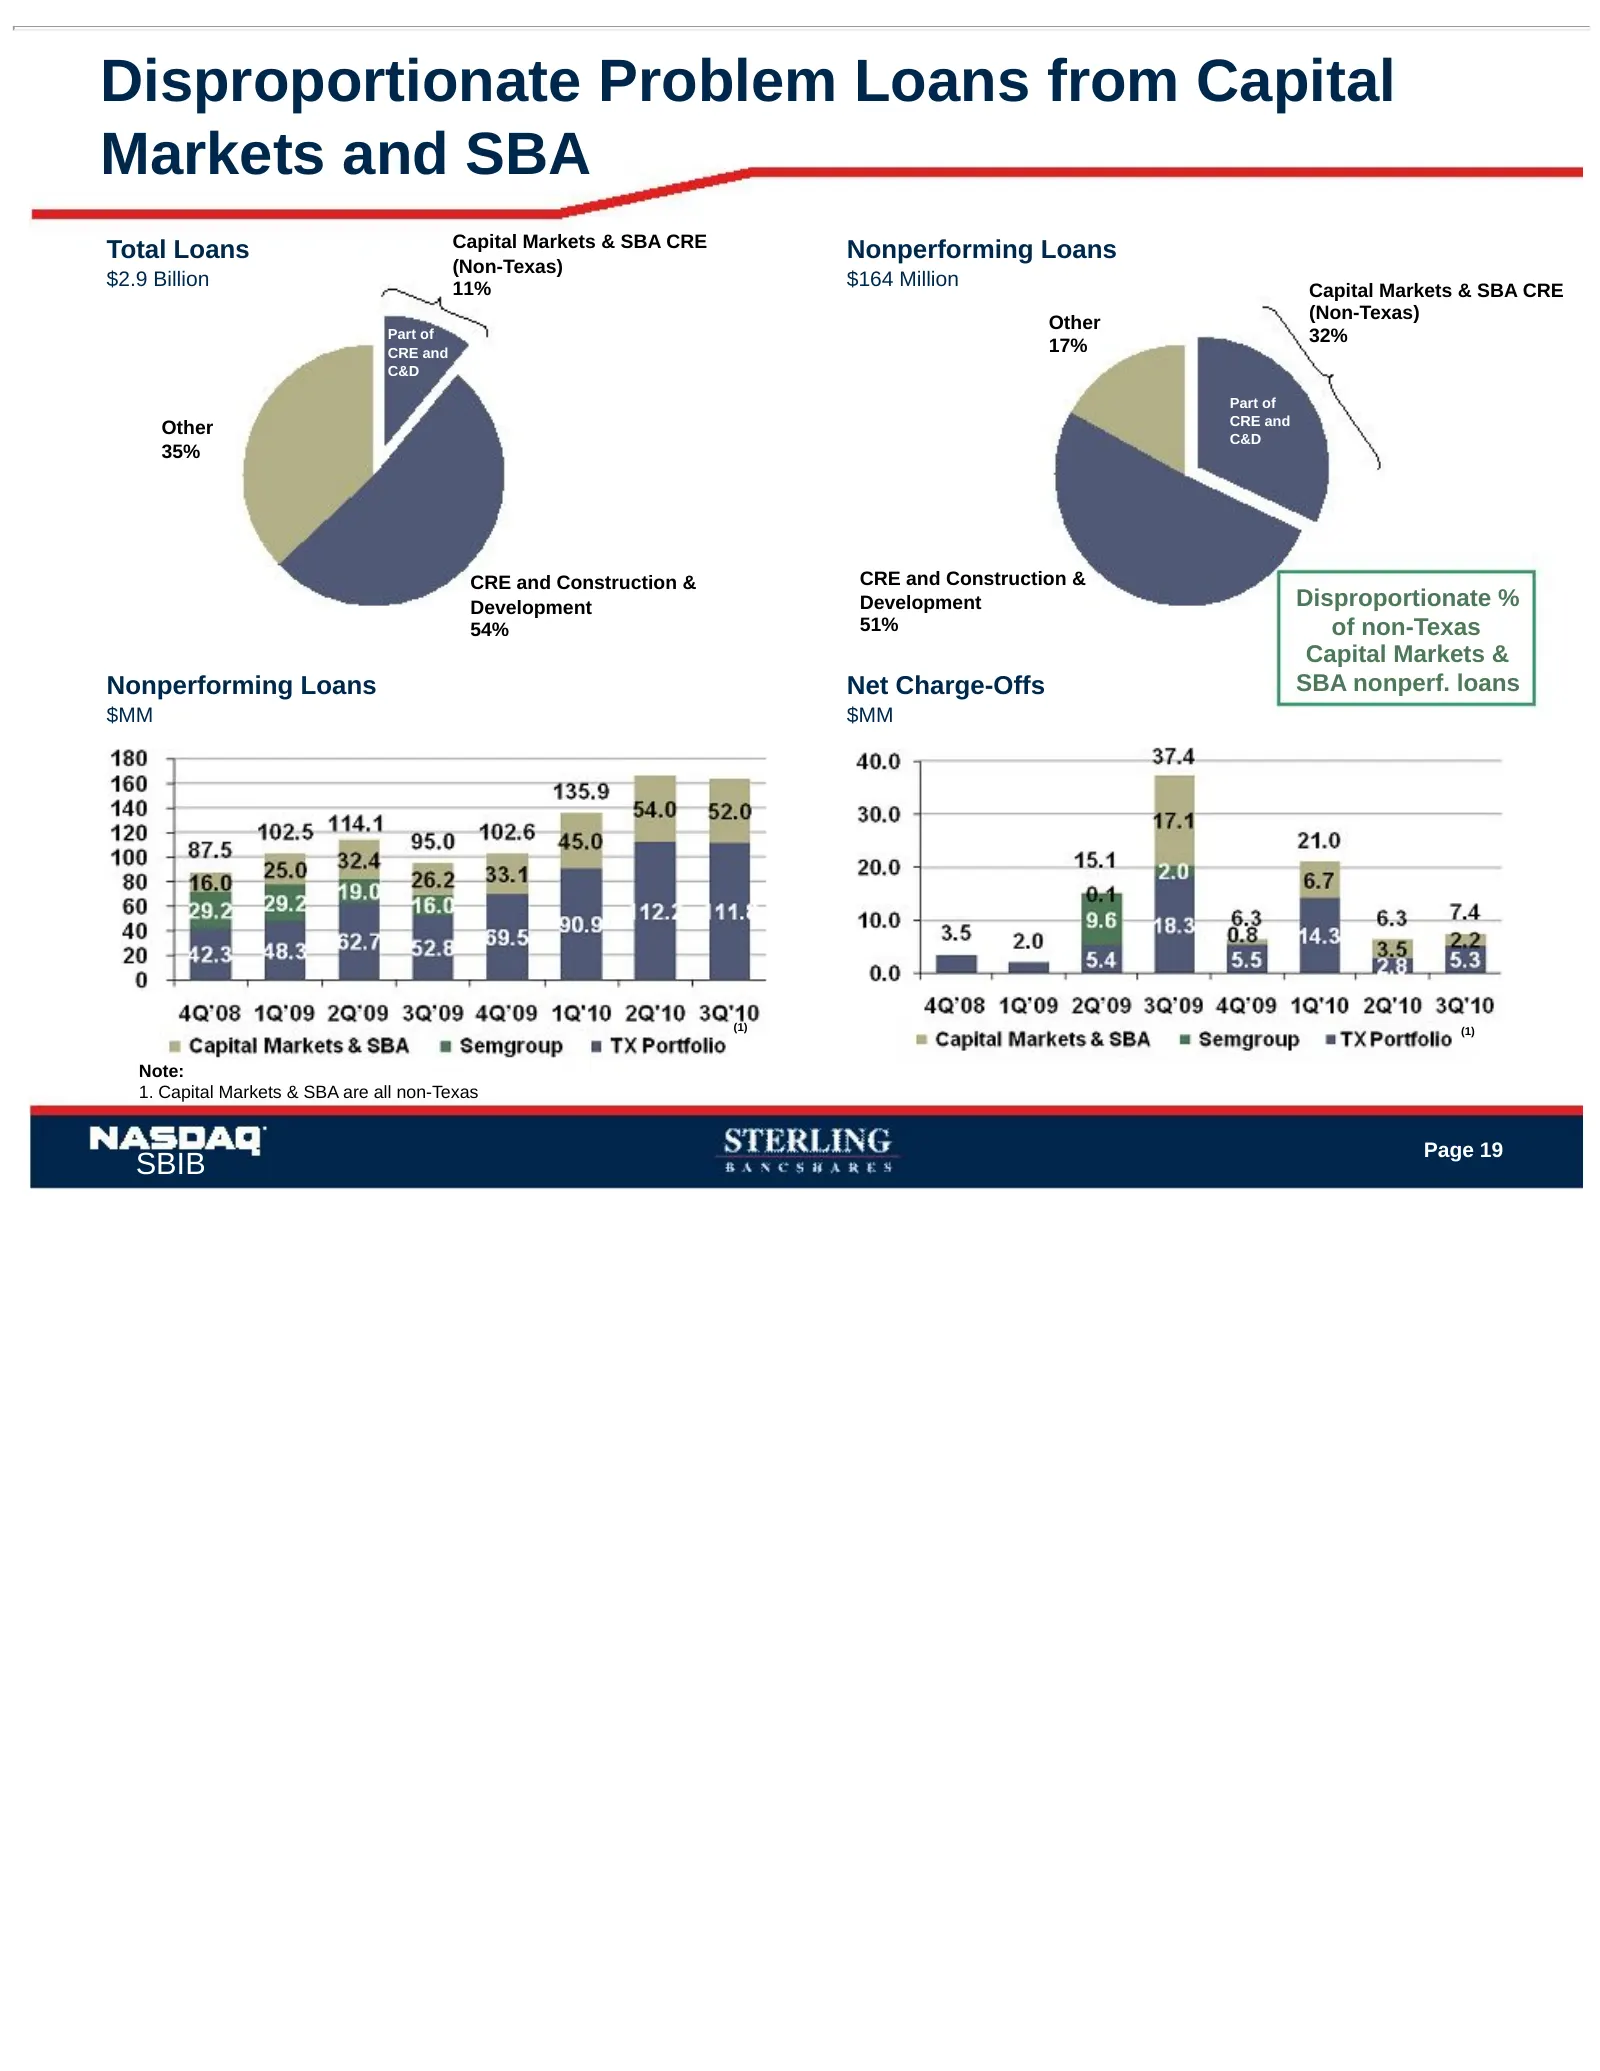
Slide 20: Disproportionate Problem Loans from Capital Markets and SBA
Disproportionate Problem Loans from Capital Markets and SBA Capital Markets & SBA CRE Total Loans Nonperforming Loans (Non-Texas) $2.9 Billion 11% $164 Million Capital Markets & SBA CRE (Non-Texas) Other Part of 32% CRE and 17% C&D Part of CRE and Other C&D 35% CRE and Construction & CRE and Constru
Slide 21: Capital
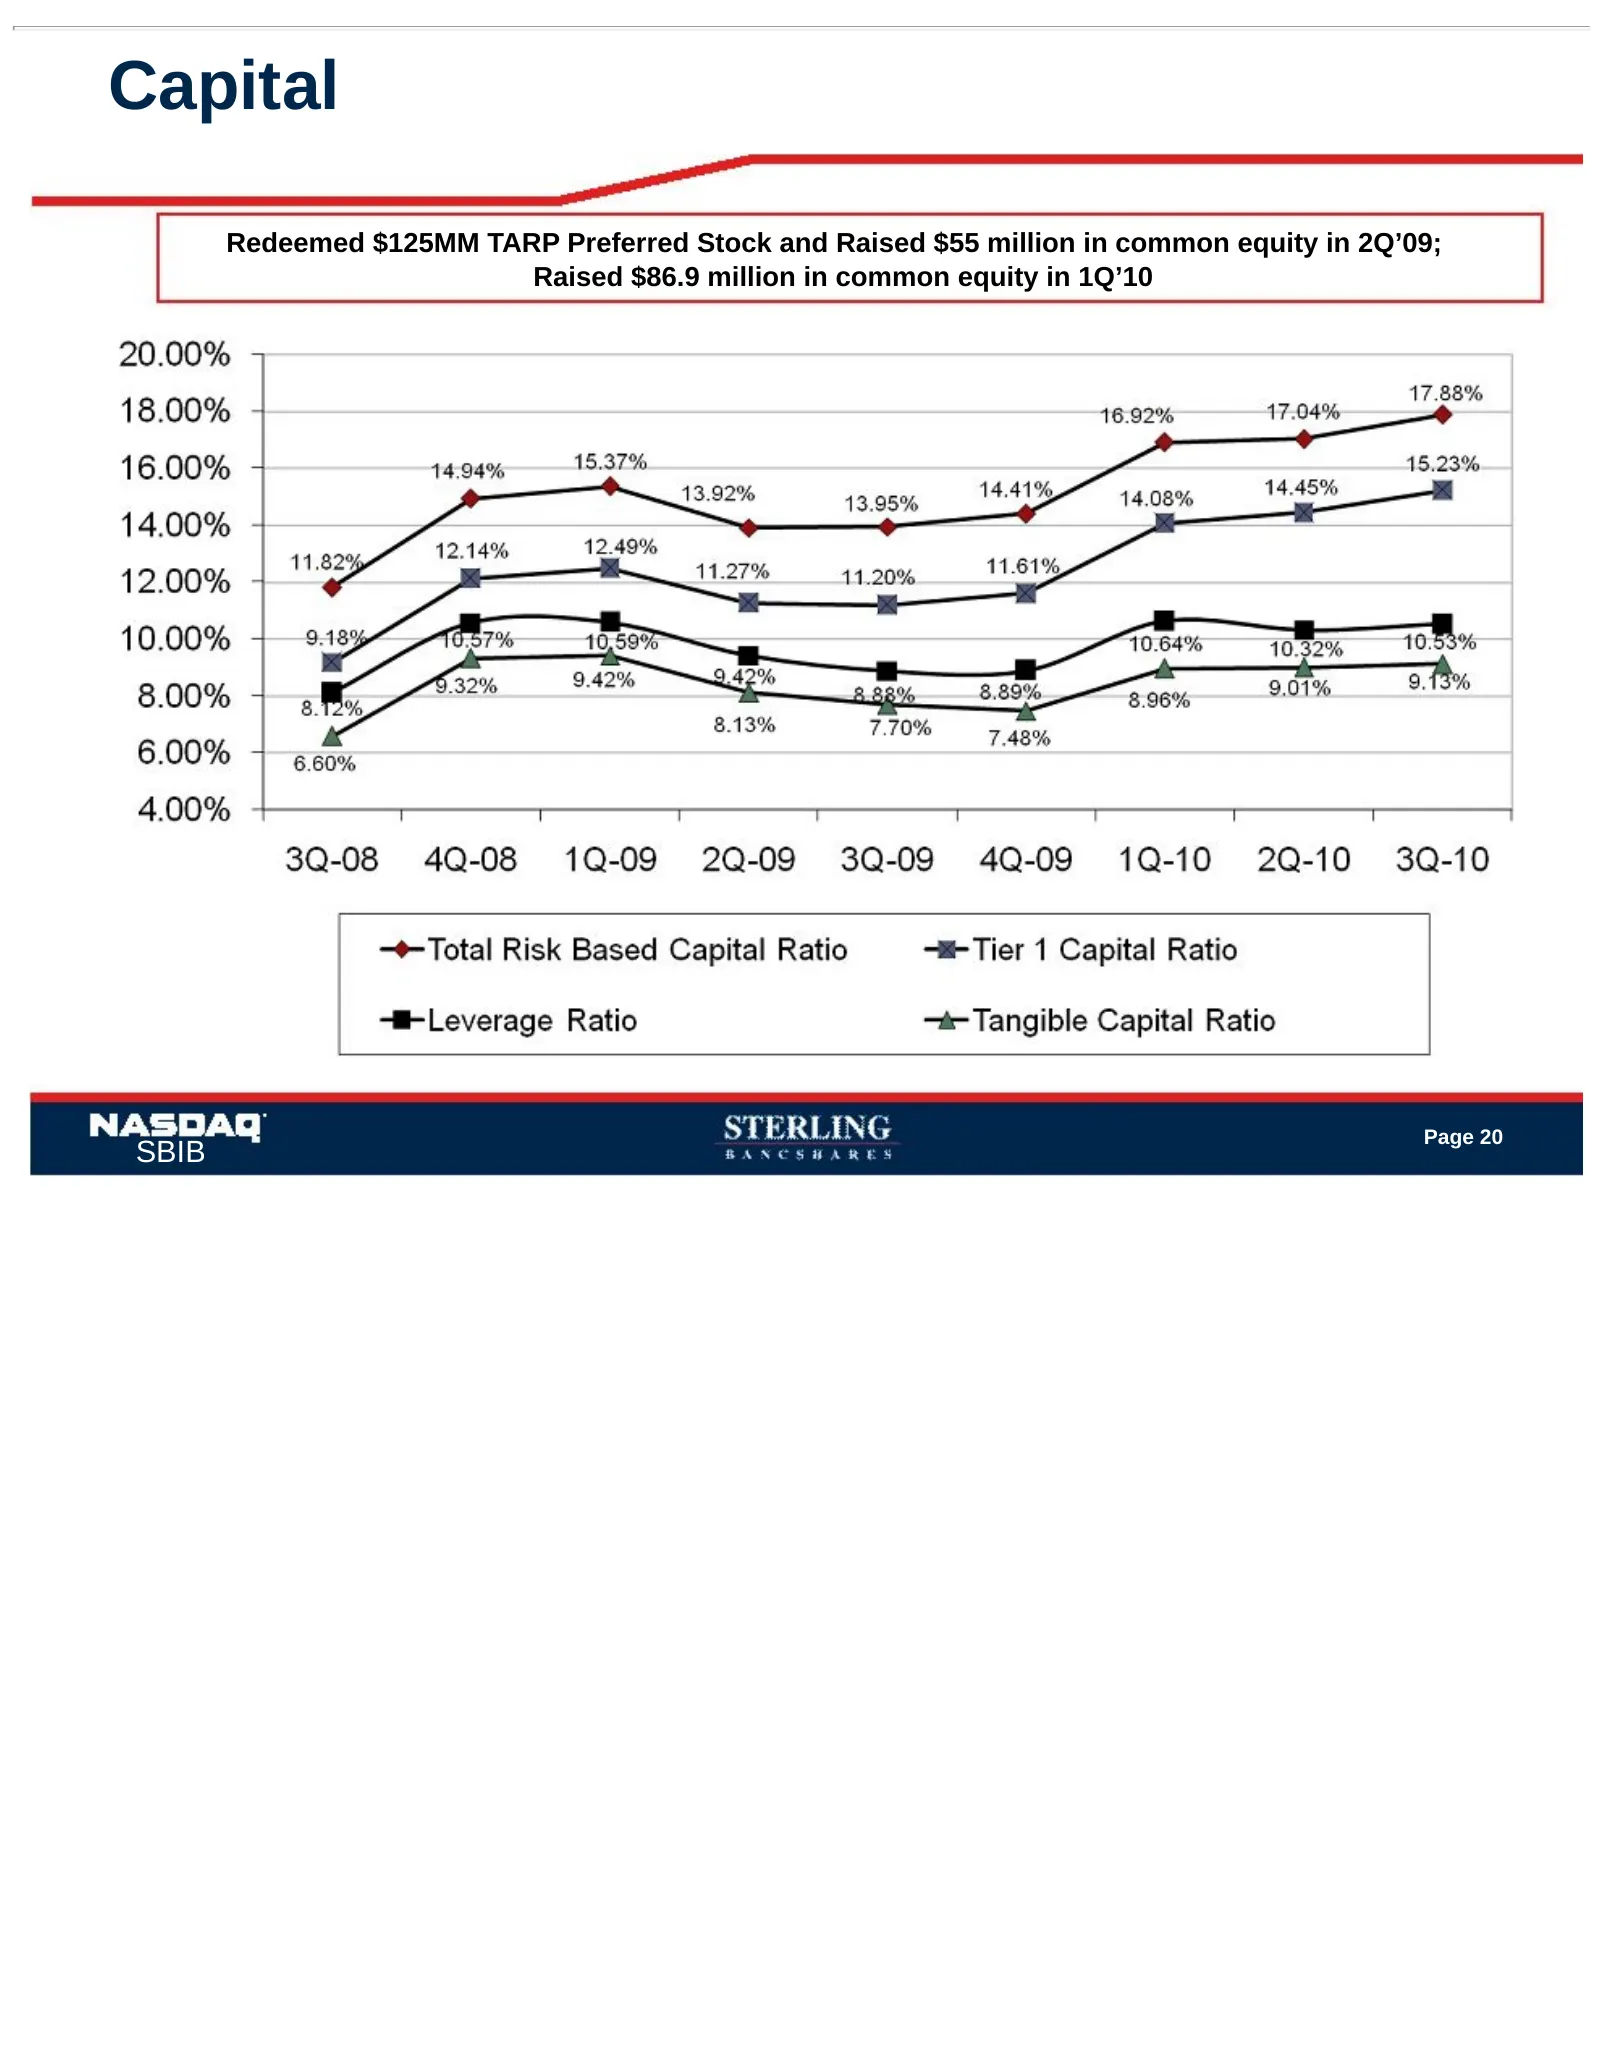
Capital Redeemed $125MM TARP Preferred Stock and Raised $55 million in common equity in 2Q’09; Raised $86.9 million in common equity in 1Q’10 Page 20 SBIB
Slide 22: Industry Capital Ratios Headed Higher
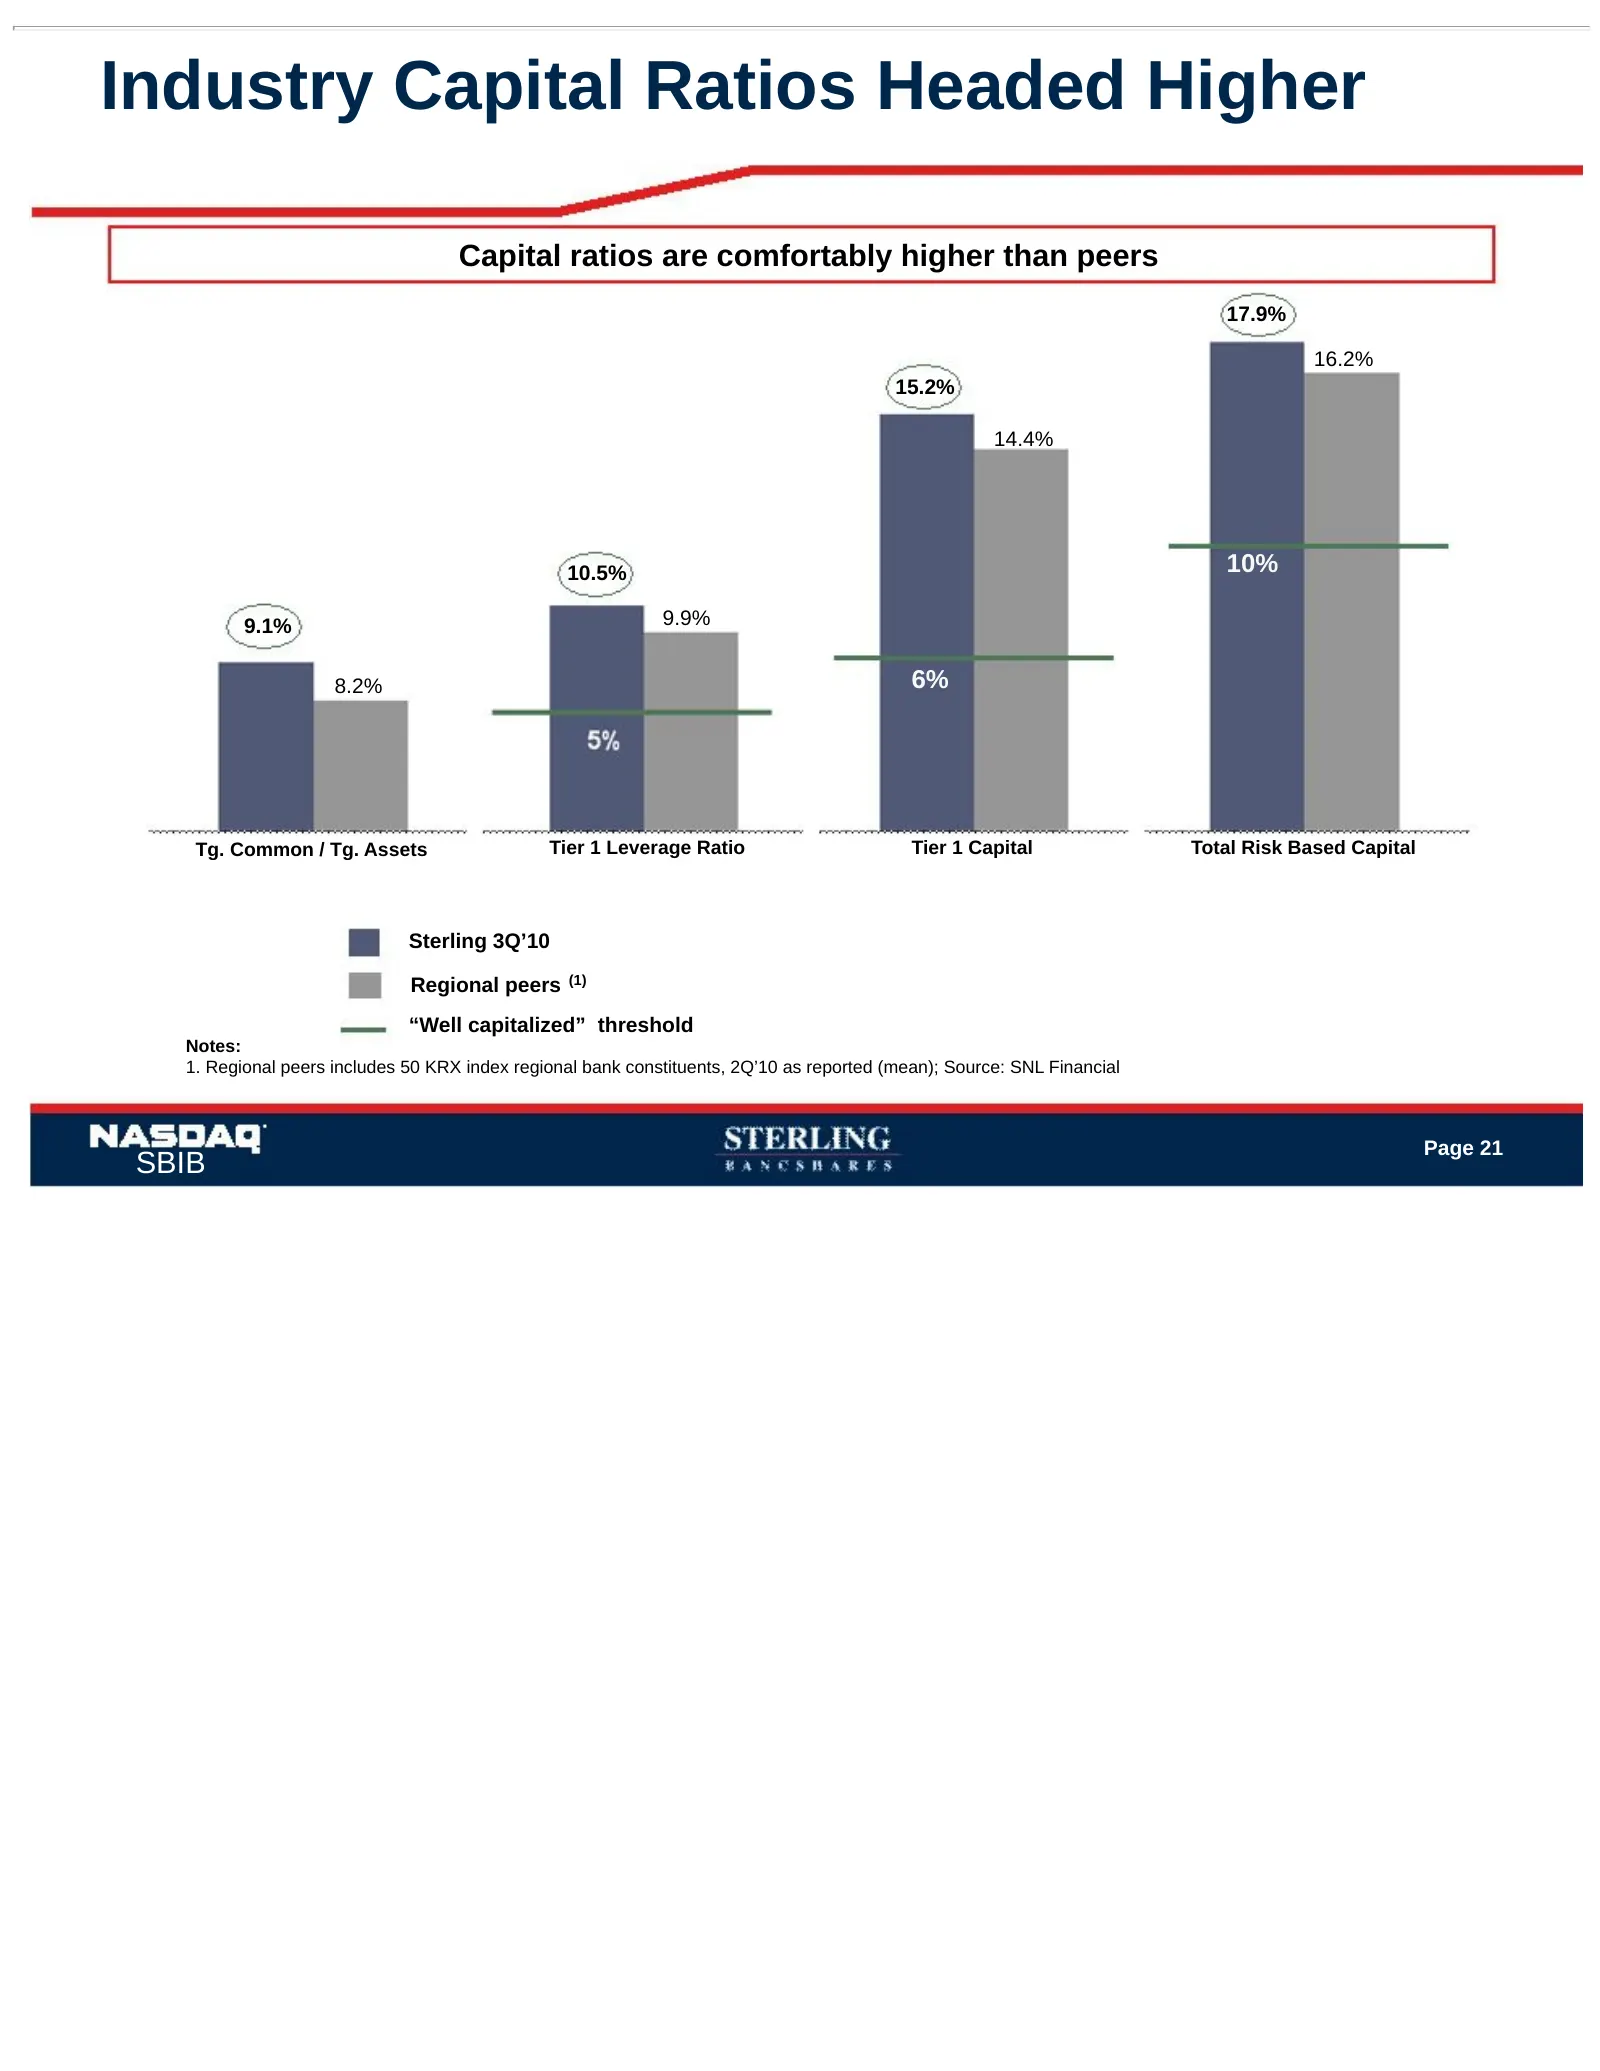
Industry Capital Ratios Headed Higher Capital ratios are comfortably higher than peers 17.9% 16.2% 15.2% 14.4% 10.5% 10% 9.1% 9.9% 8.2% 6% Tg. Common / Tg. Assets Tier 1 Leverage Ratio Tier 1 Capital Total Risk Based Capital Sterling 3Q’10 Regional peers (1) “Well capitalized” threshold Notes: 1. Re
Slide 23: Net Interest Margin
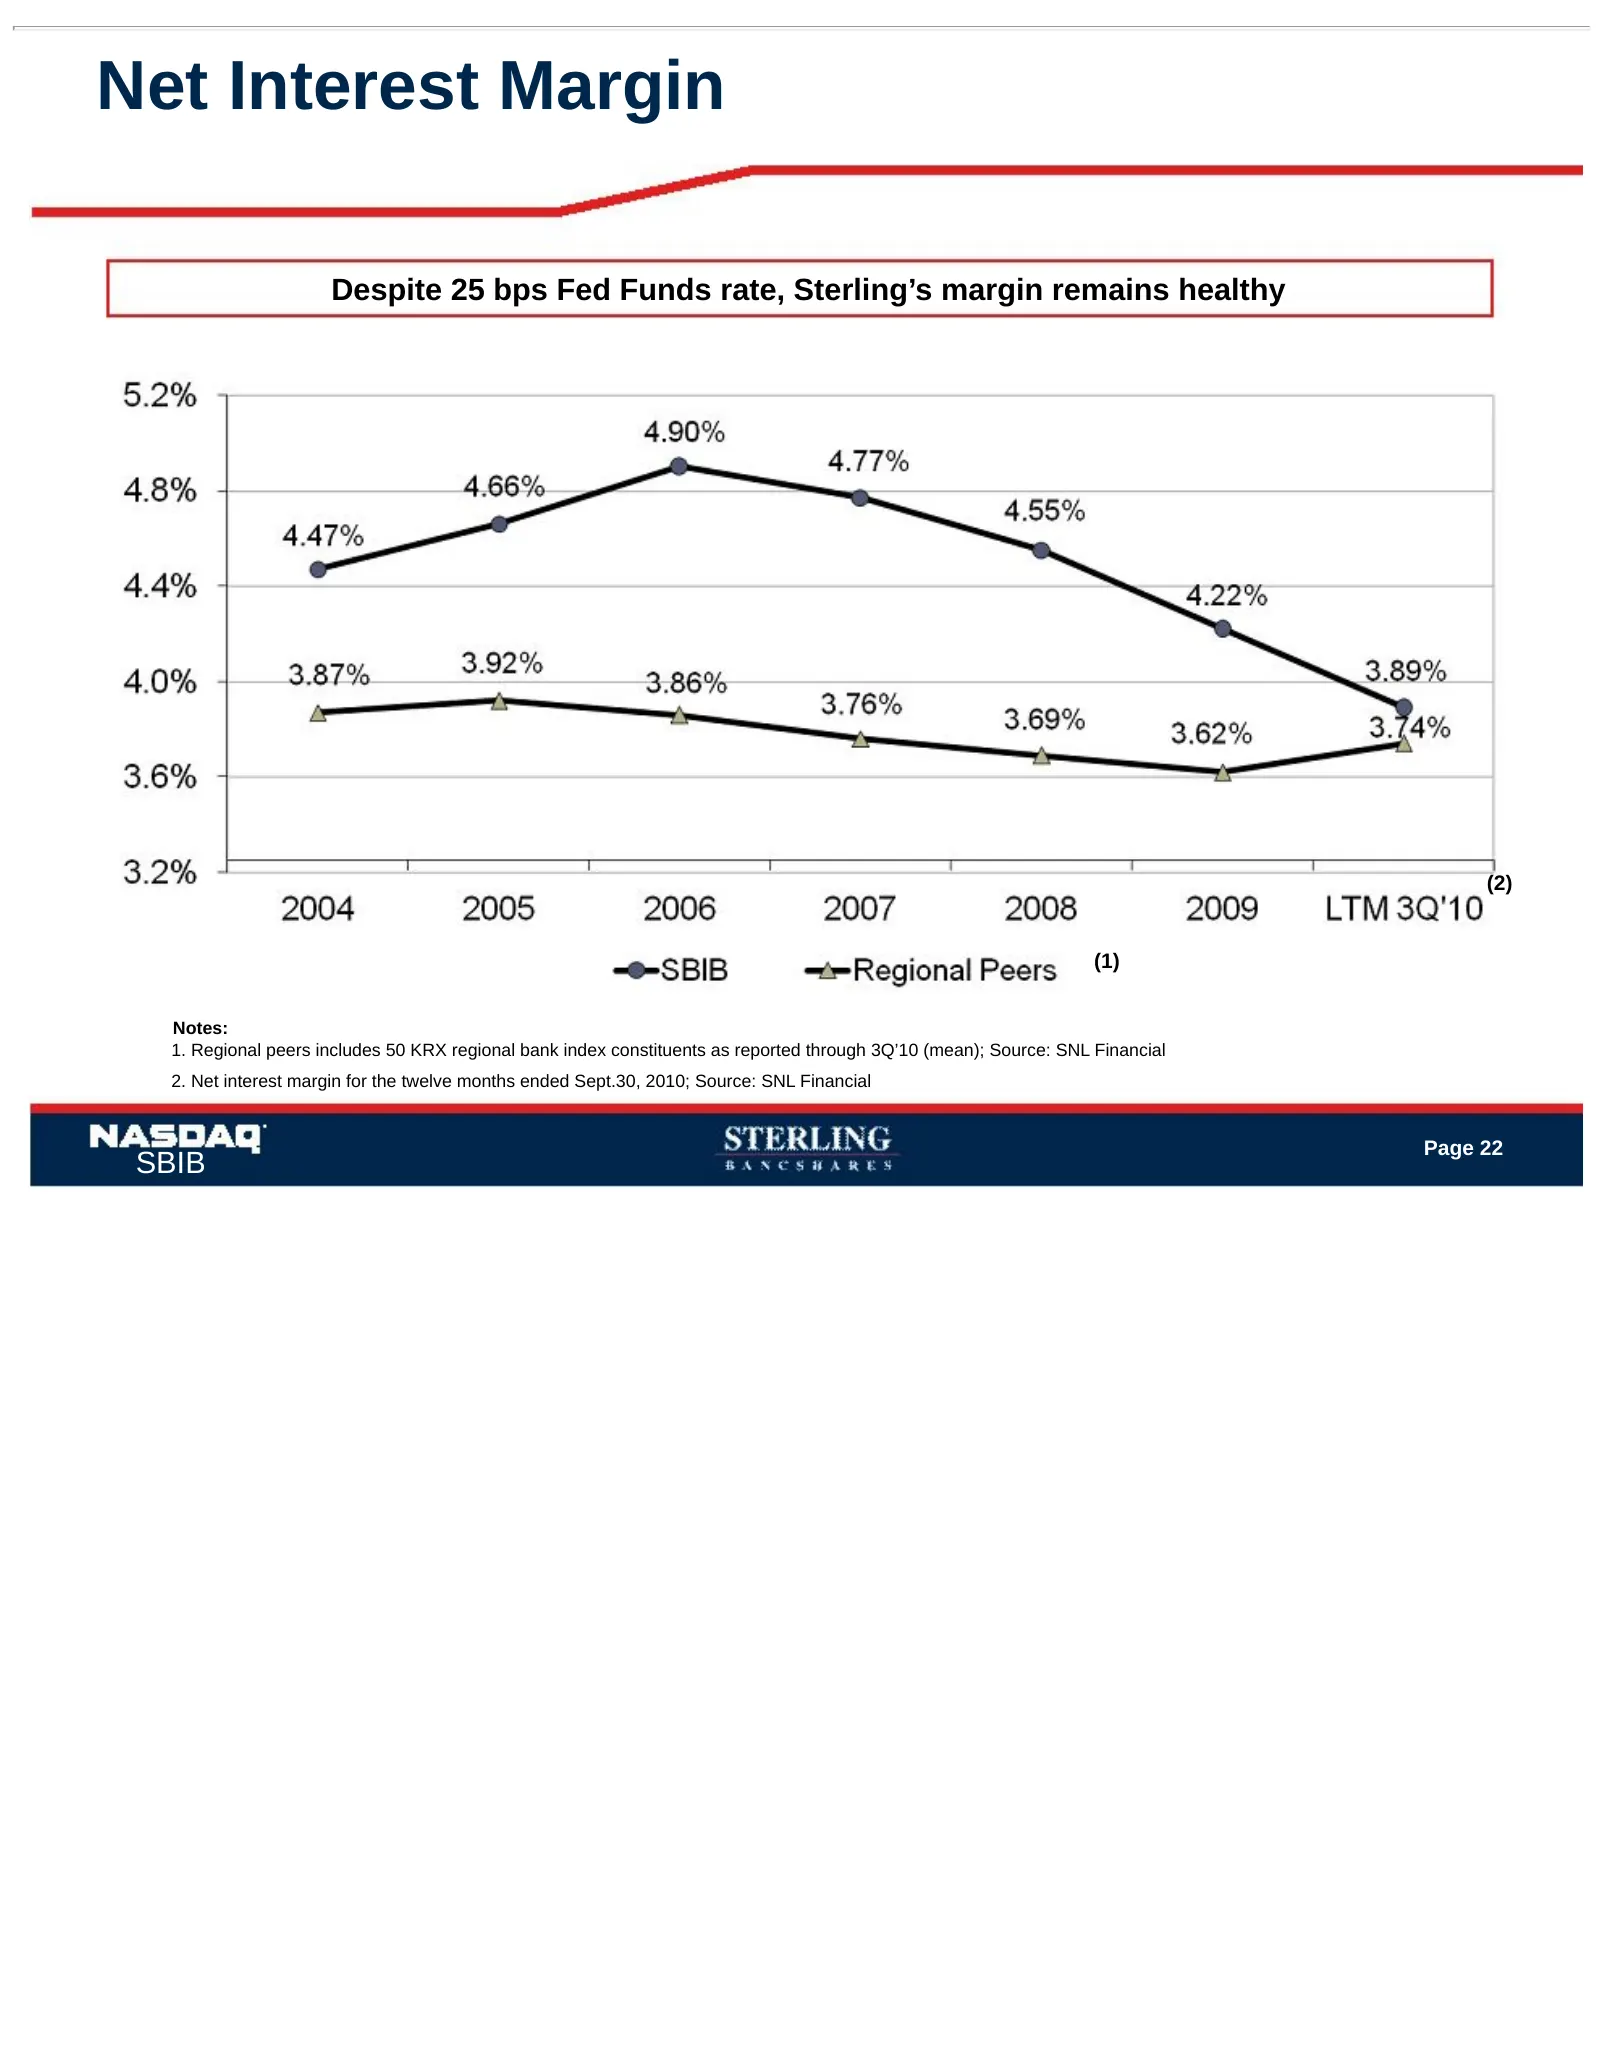
Net Interest Margin Despite 25 bps Fed Funds rate, Sterling’s margin remains healthy (2) (1) Notes: 1. Regional peers includes 50 KRX regional bank index constituents as reported through 3Q’10 (mean); Source: SNL Financial 2. Net interest margin for the twelve months ended Sept.30, 2010; Source: SNL
Slide 24: Earnings Per Share
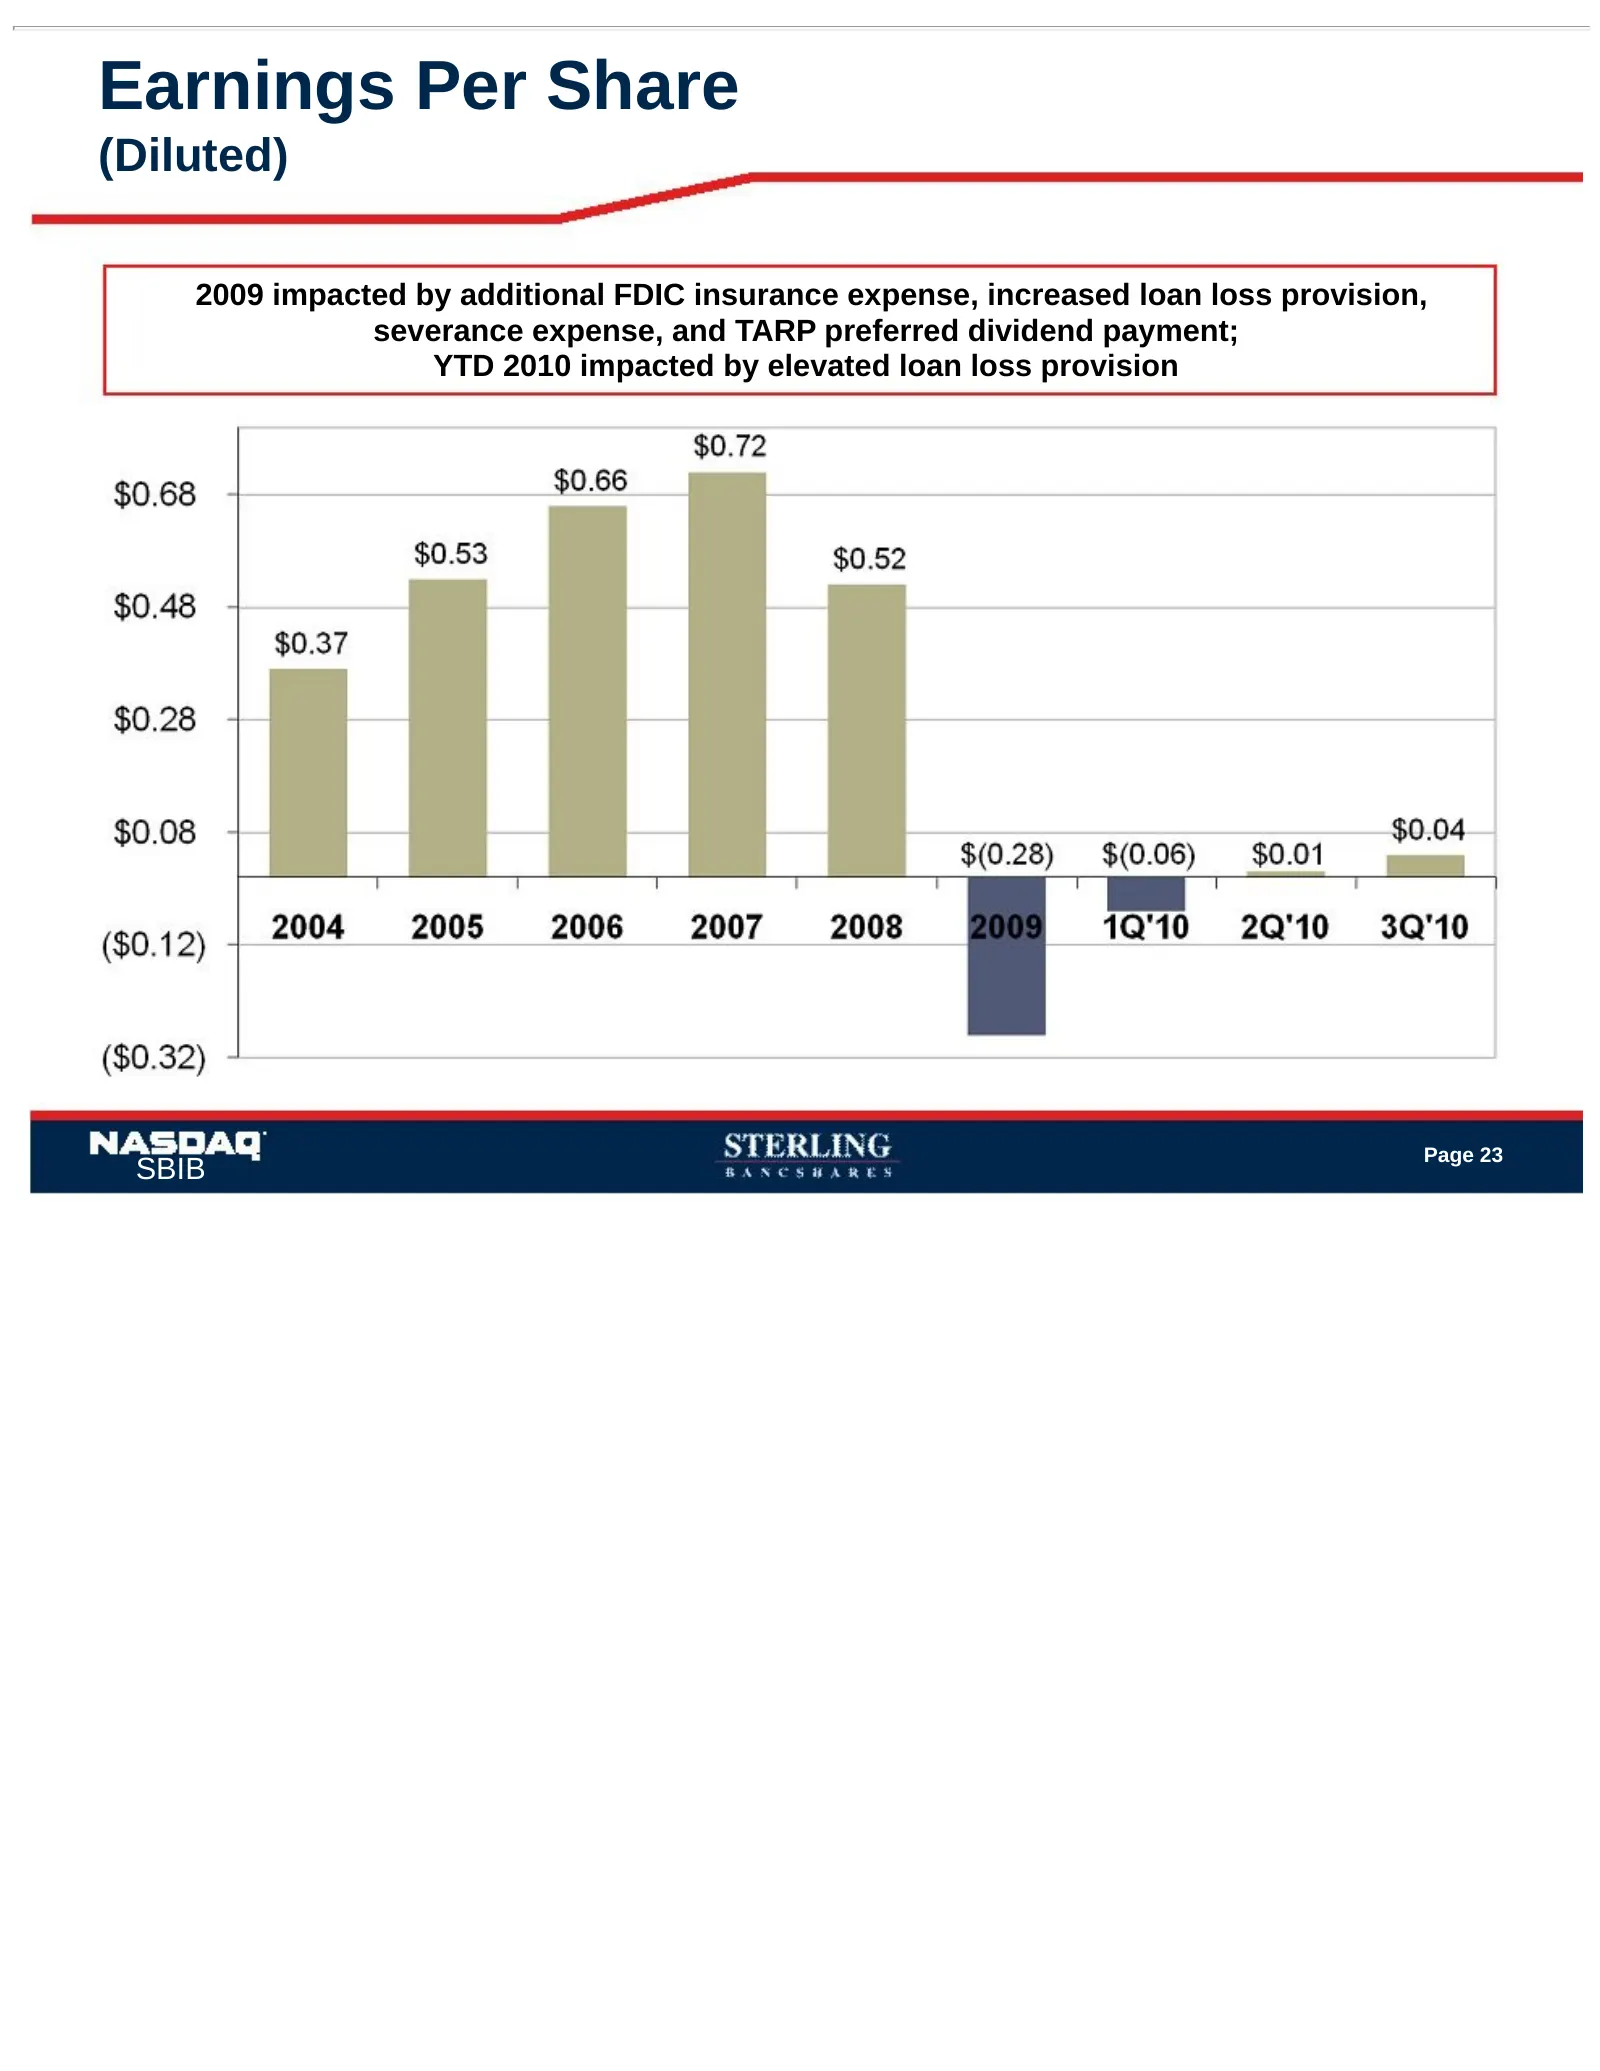
Earnings Per Share (Diluted) 2009 impacted by additional FDIC insurance expense, increased loan loss provision, severance expense, and TARP preferred dividend payment; YTD 2010 impacted by elevated loan loss provision Page 23 SBIB
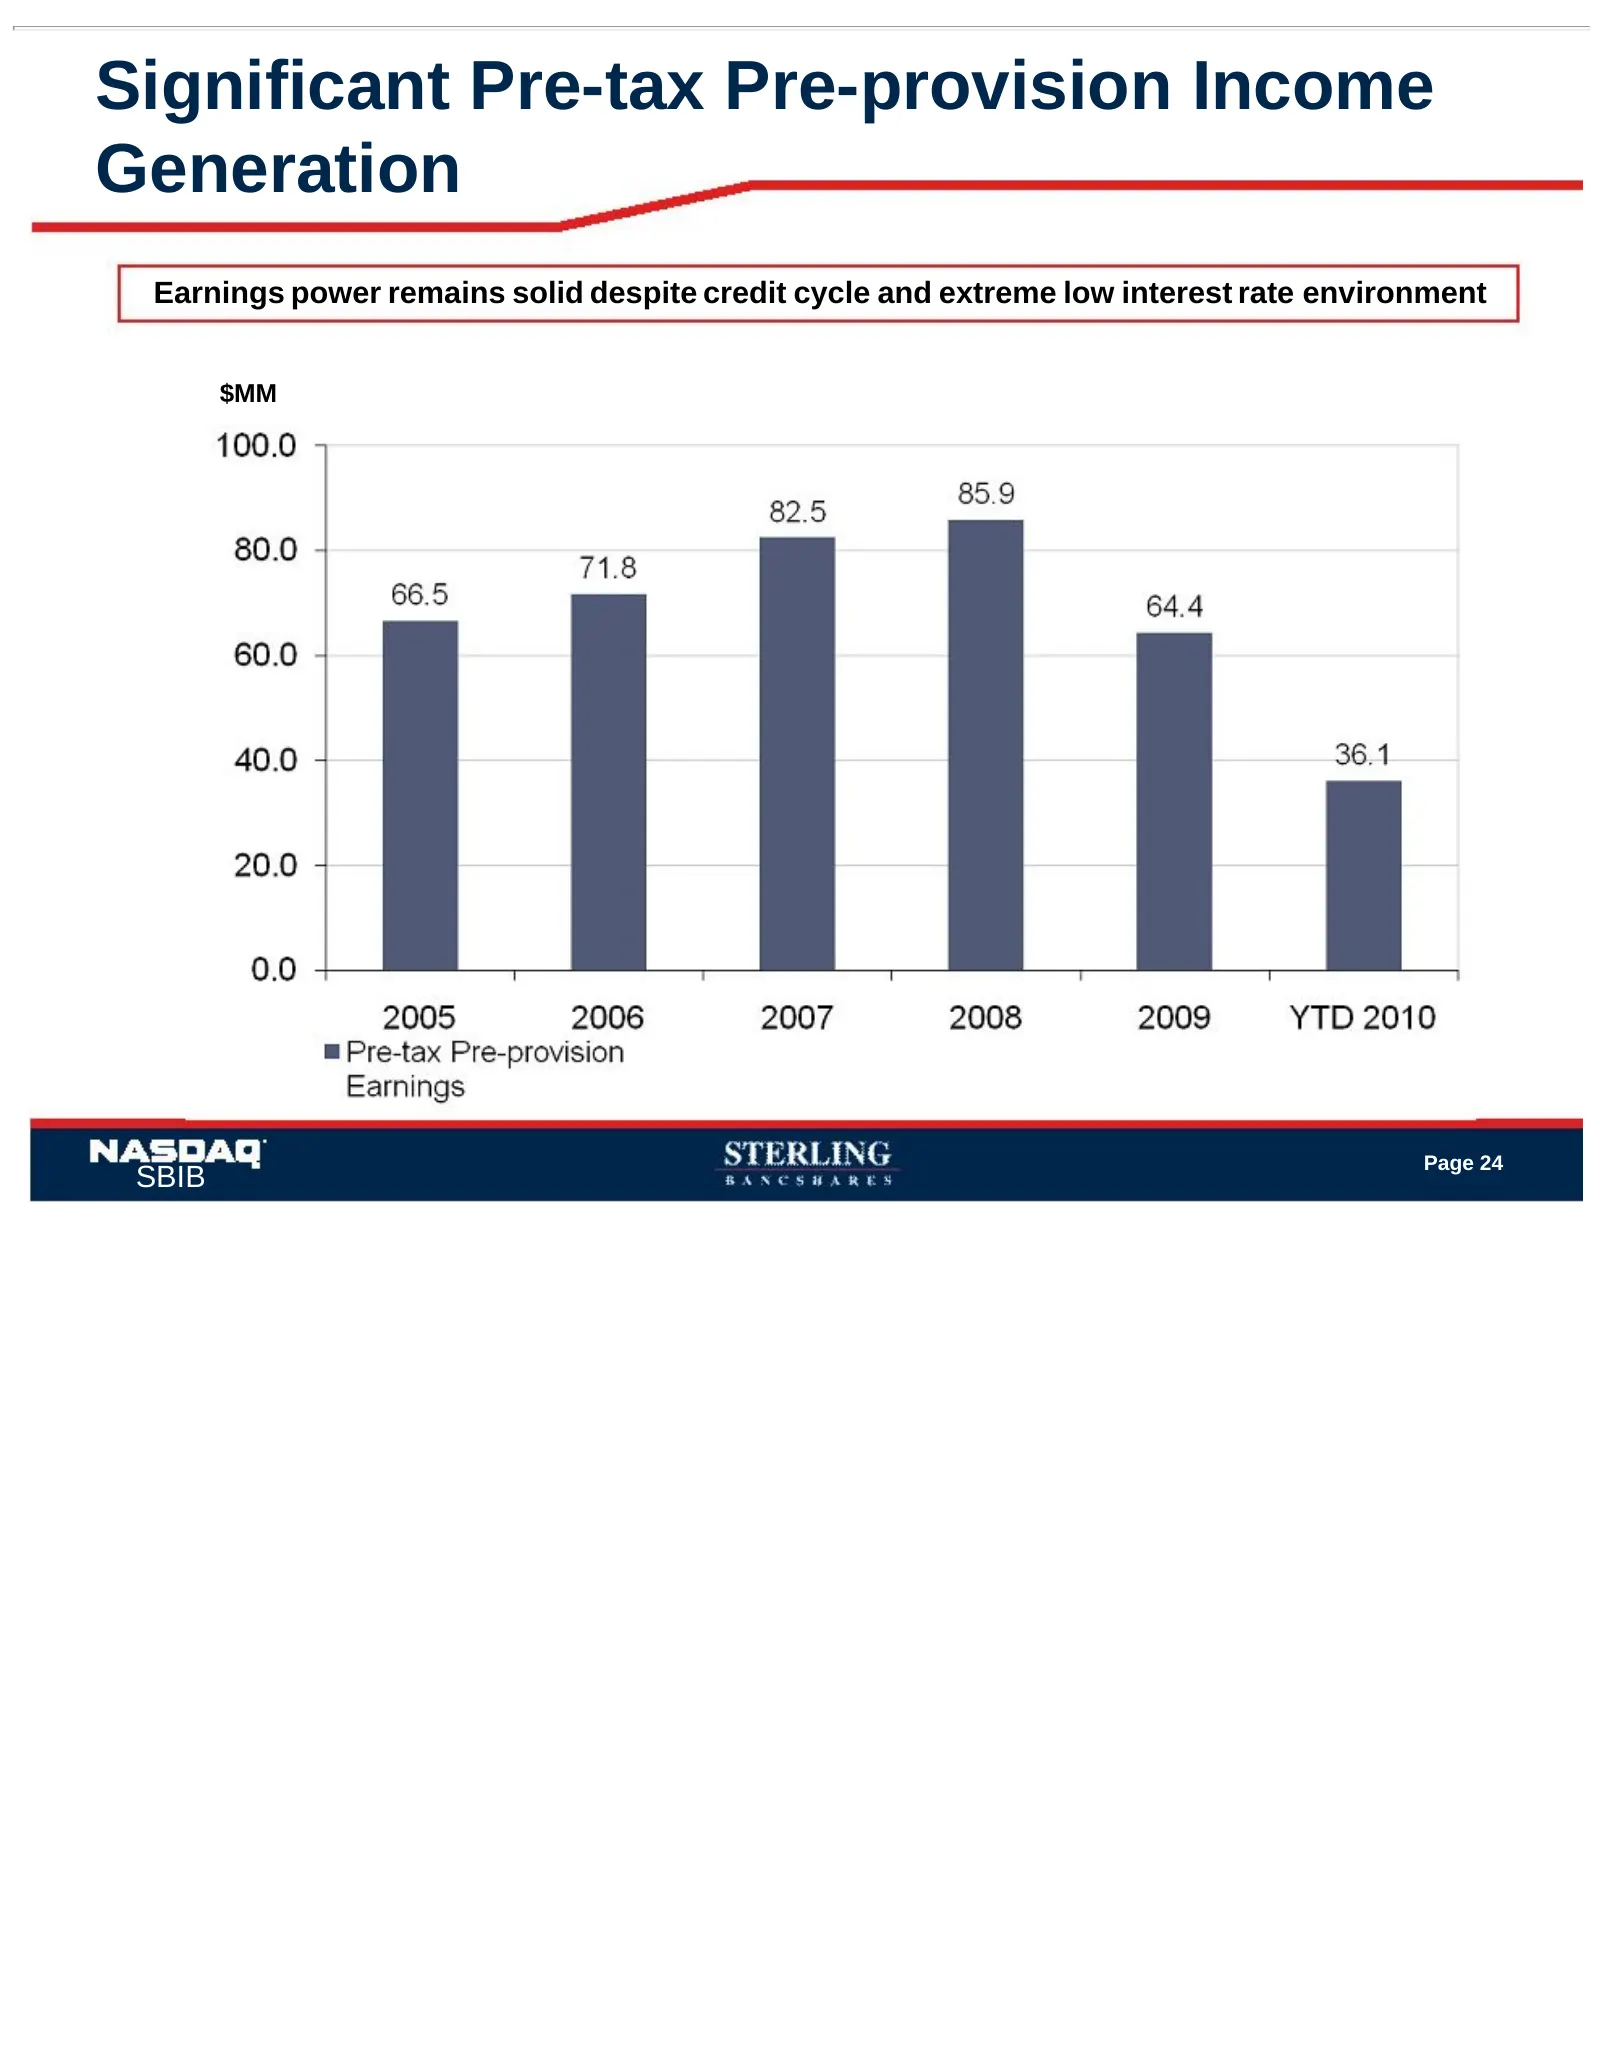
Slide 25: Significant Pre-tax Pre-provision Income Generation
Significant Pre-tax Pre-provision Income Generation Earnings power remains solid despite credit cycle and extreme low interest rate environment $MM Page 24 SBIB
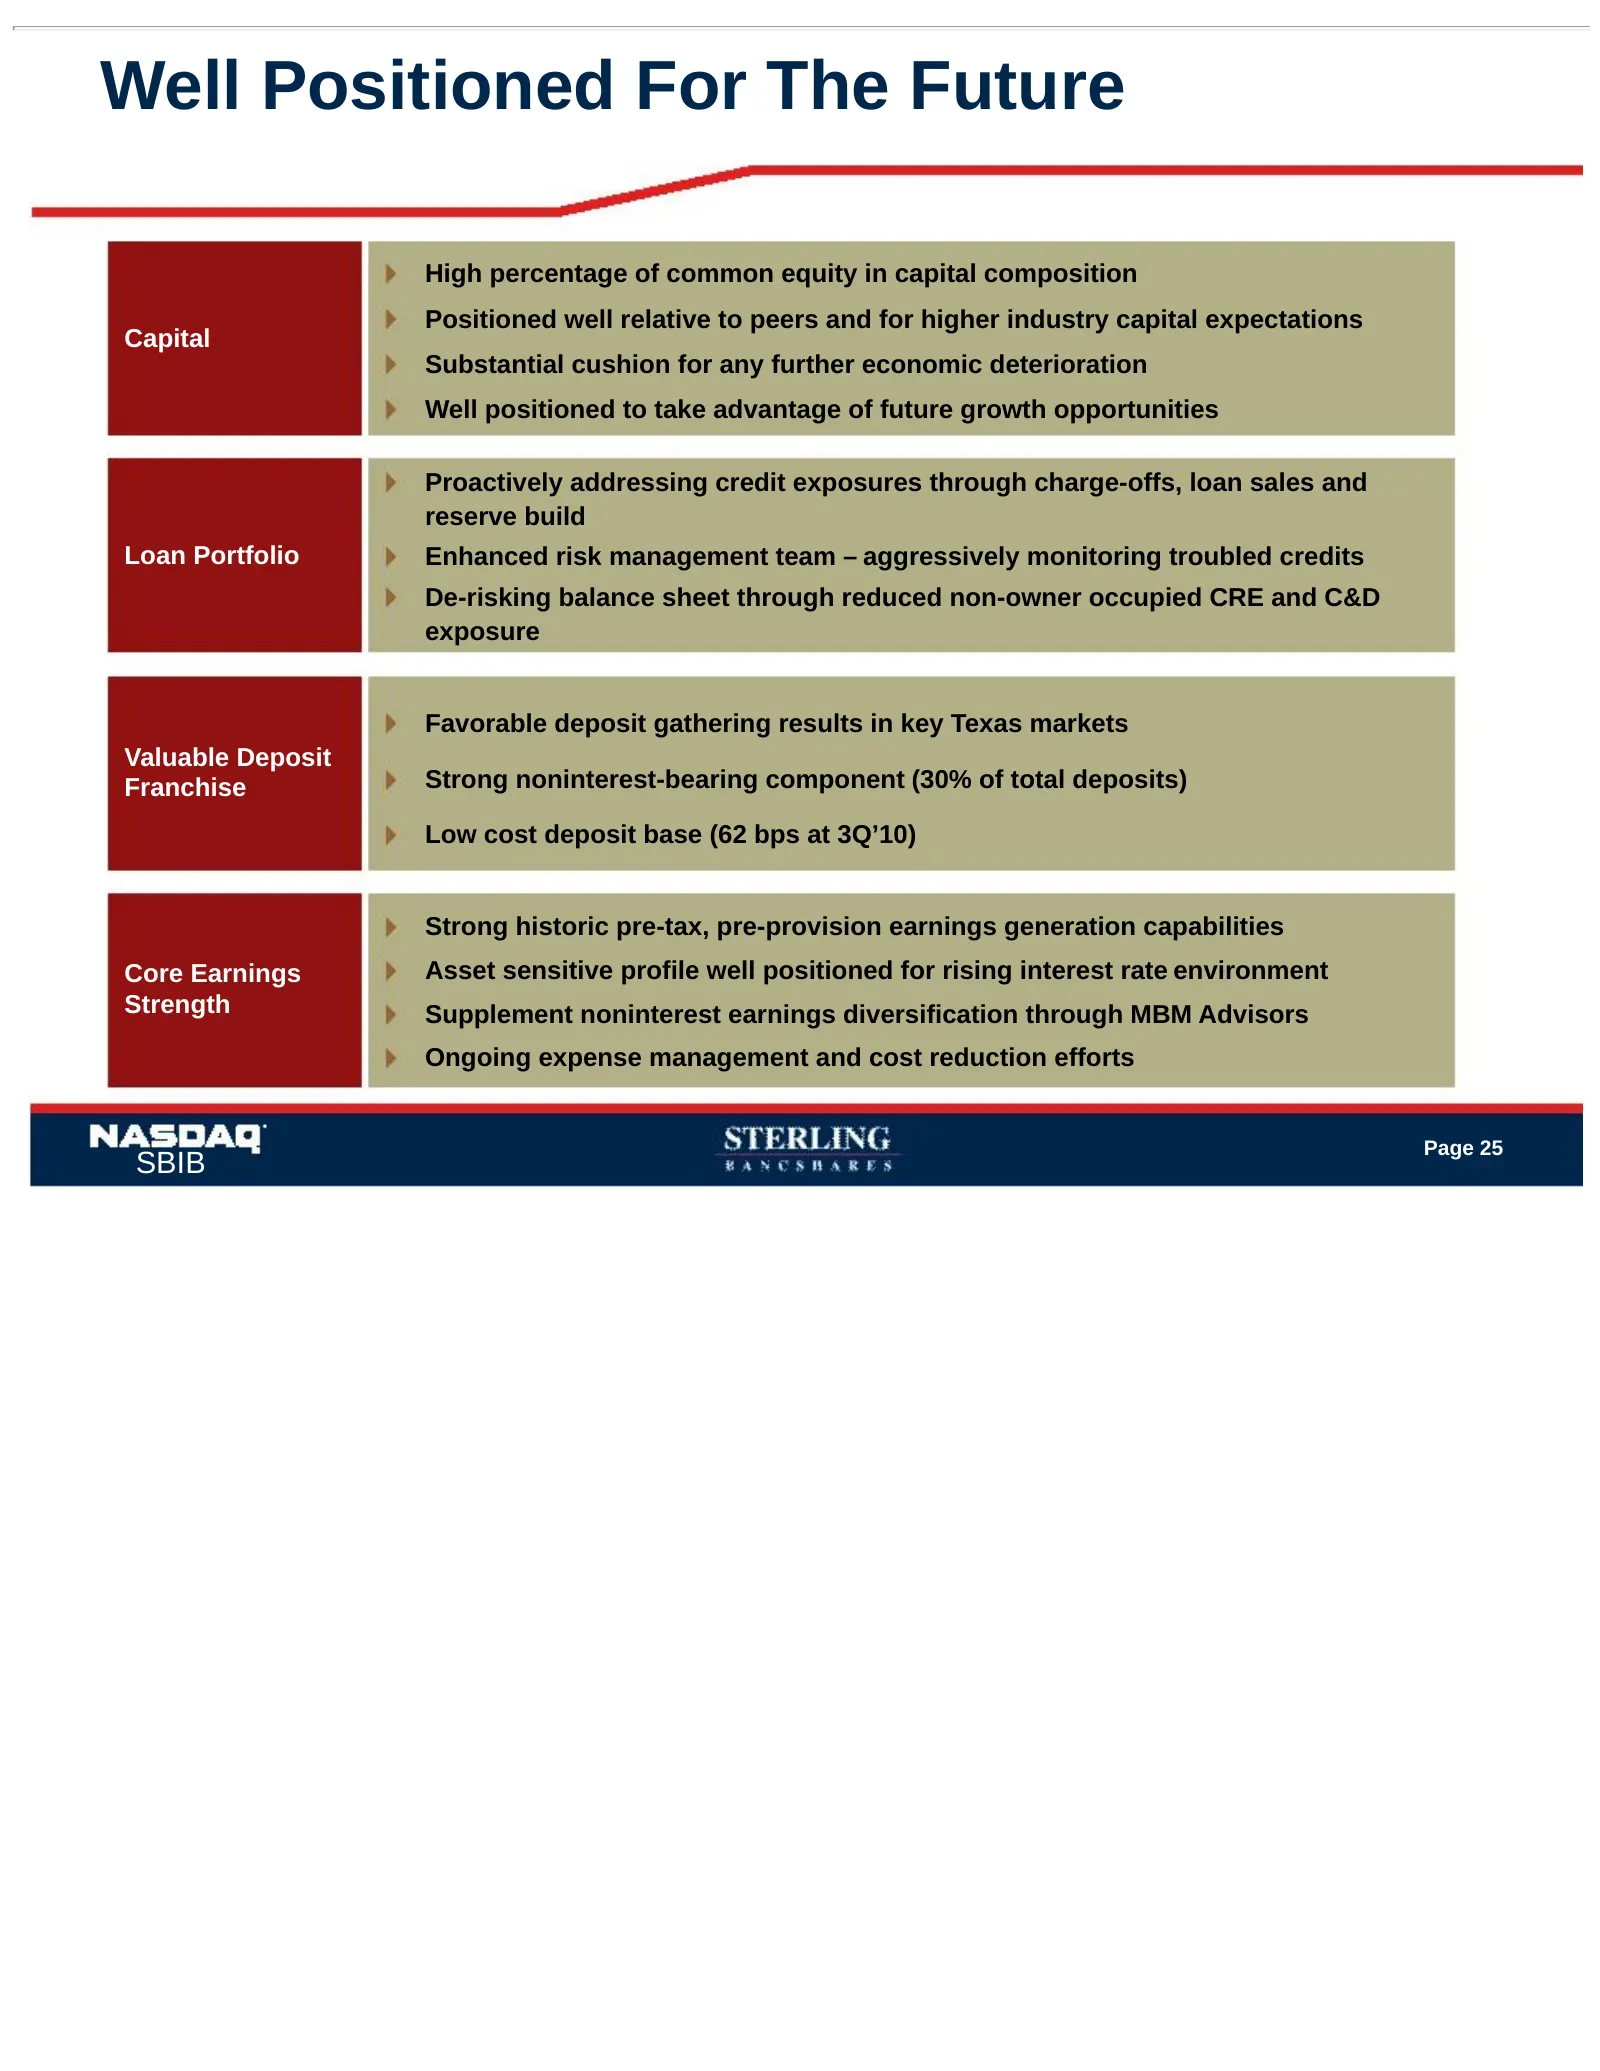
Slide 26: Well Positioned For The Future
Well Positioned For The Future High percentage of common equity in capital composition Positioned well relative to peers and for higher industry capital expectations Capital Substantial cushion for any further economic deterioration Well positioned to take advantage of future growth opportunities Pr
Slide 27: Sterling Bancshares November 4, 2010
STERLING BANCSHARES World Investor Presentation class banking. Deep Texas roots. ® Houston Dallas Fort Worth San Antonio November 4, 2010 SBIB
Slide 28: Solicitation notice
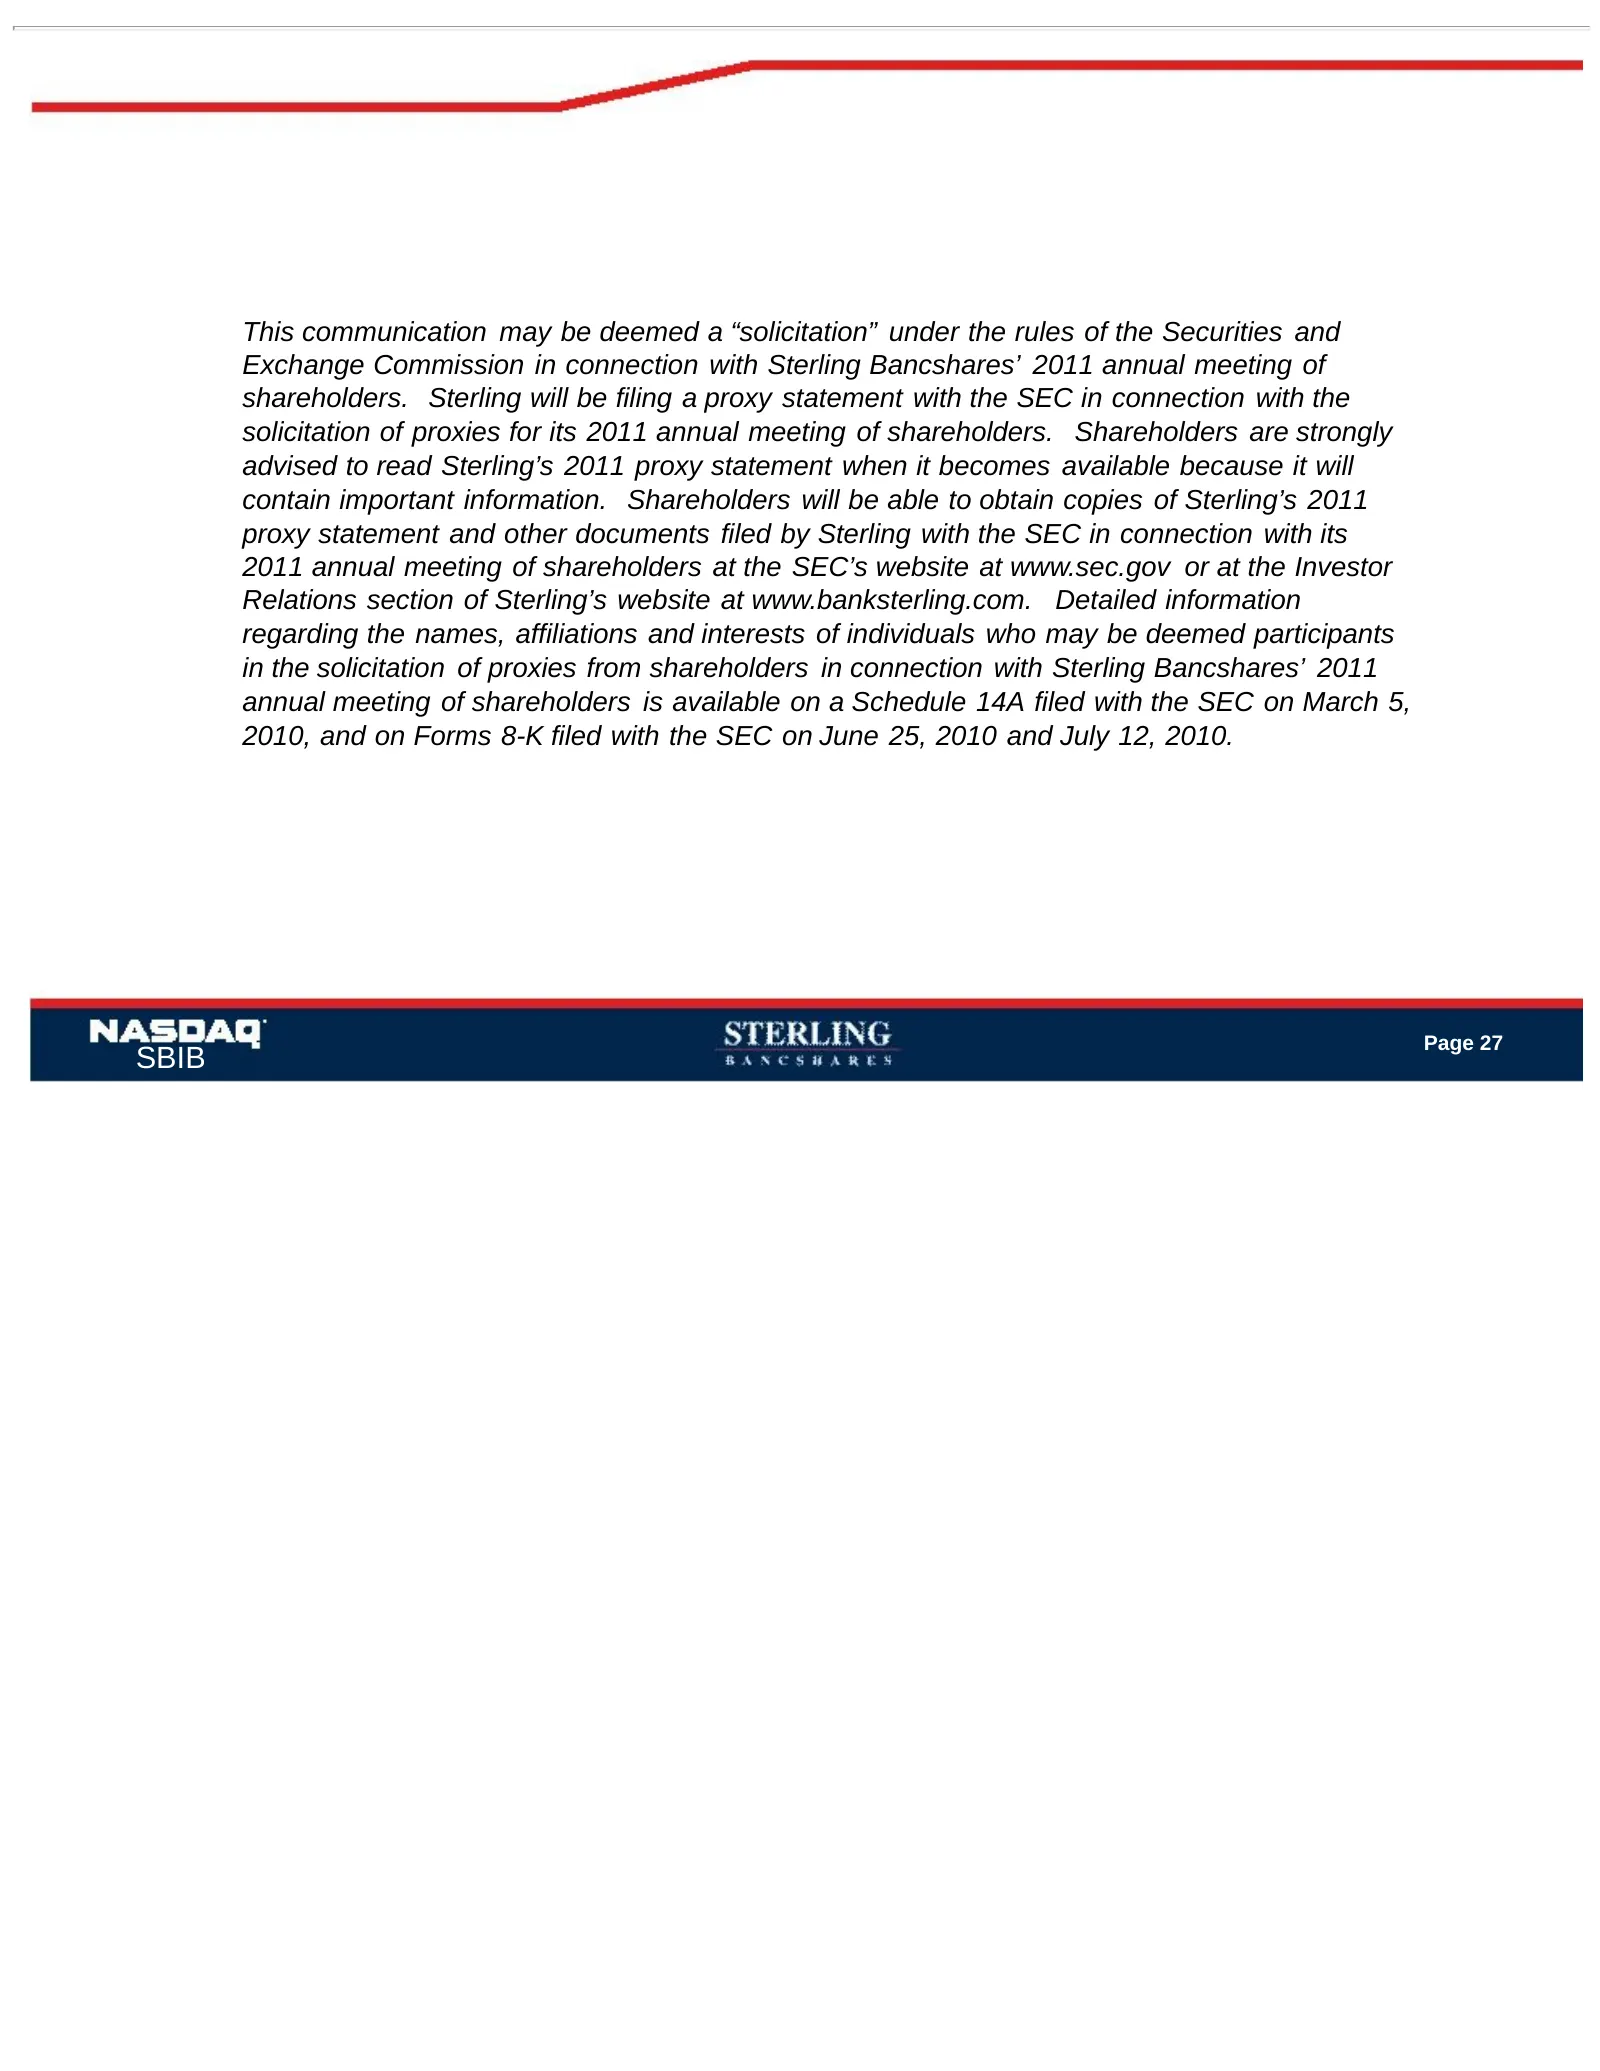
This communication may be deemed a “solicitation” under the rules of the Securities and Exchange Commission in connection with Sterling Bancshares’ 2011 annual meeting of shareholders. Sterling will be filing a proxy statement with the SEC in connection with the solicitation of proxies for its 2011
Slide 29: Appendix
Investor Presentation Appendix SBIB
Slide 30: Reconciliation of GAAP to Non-GAAP Measures
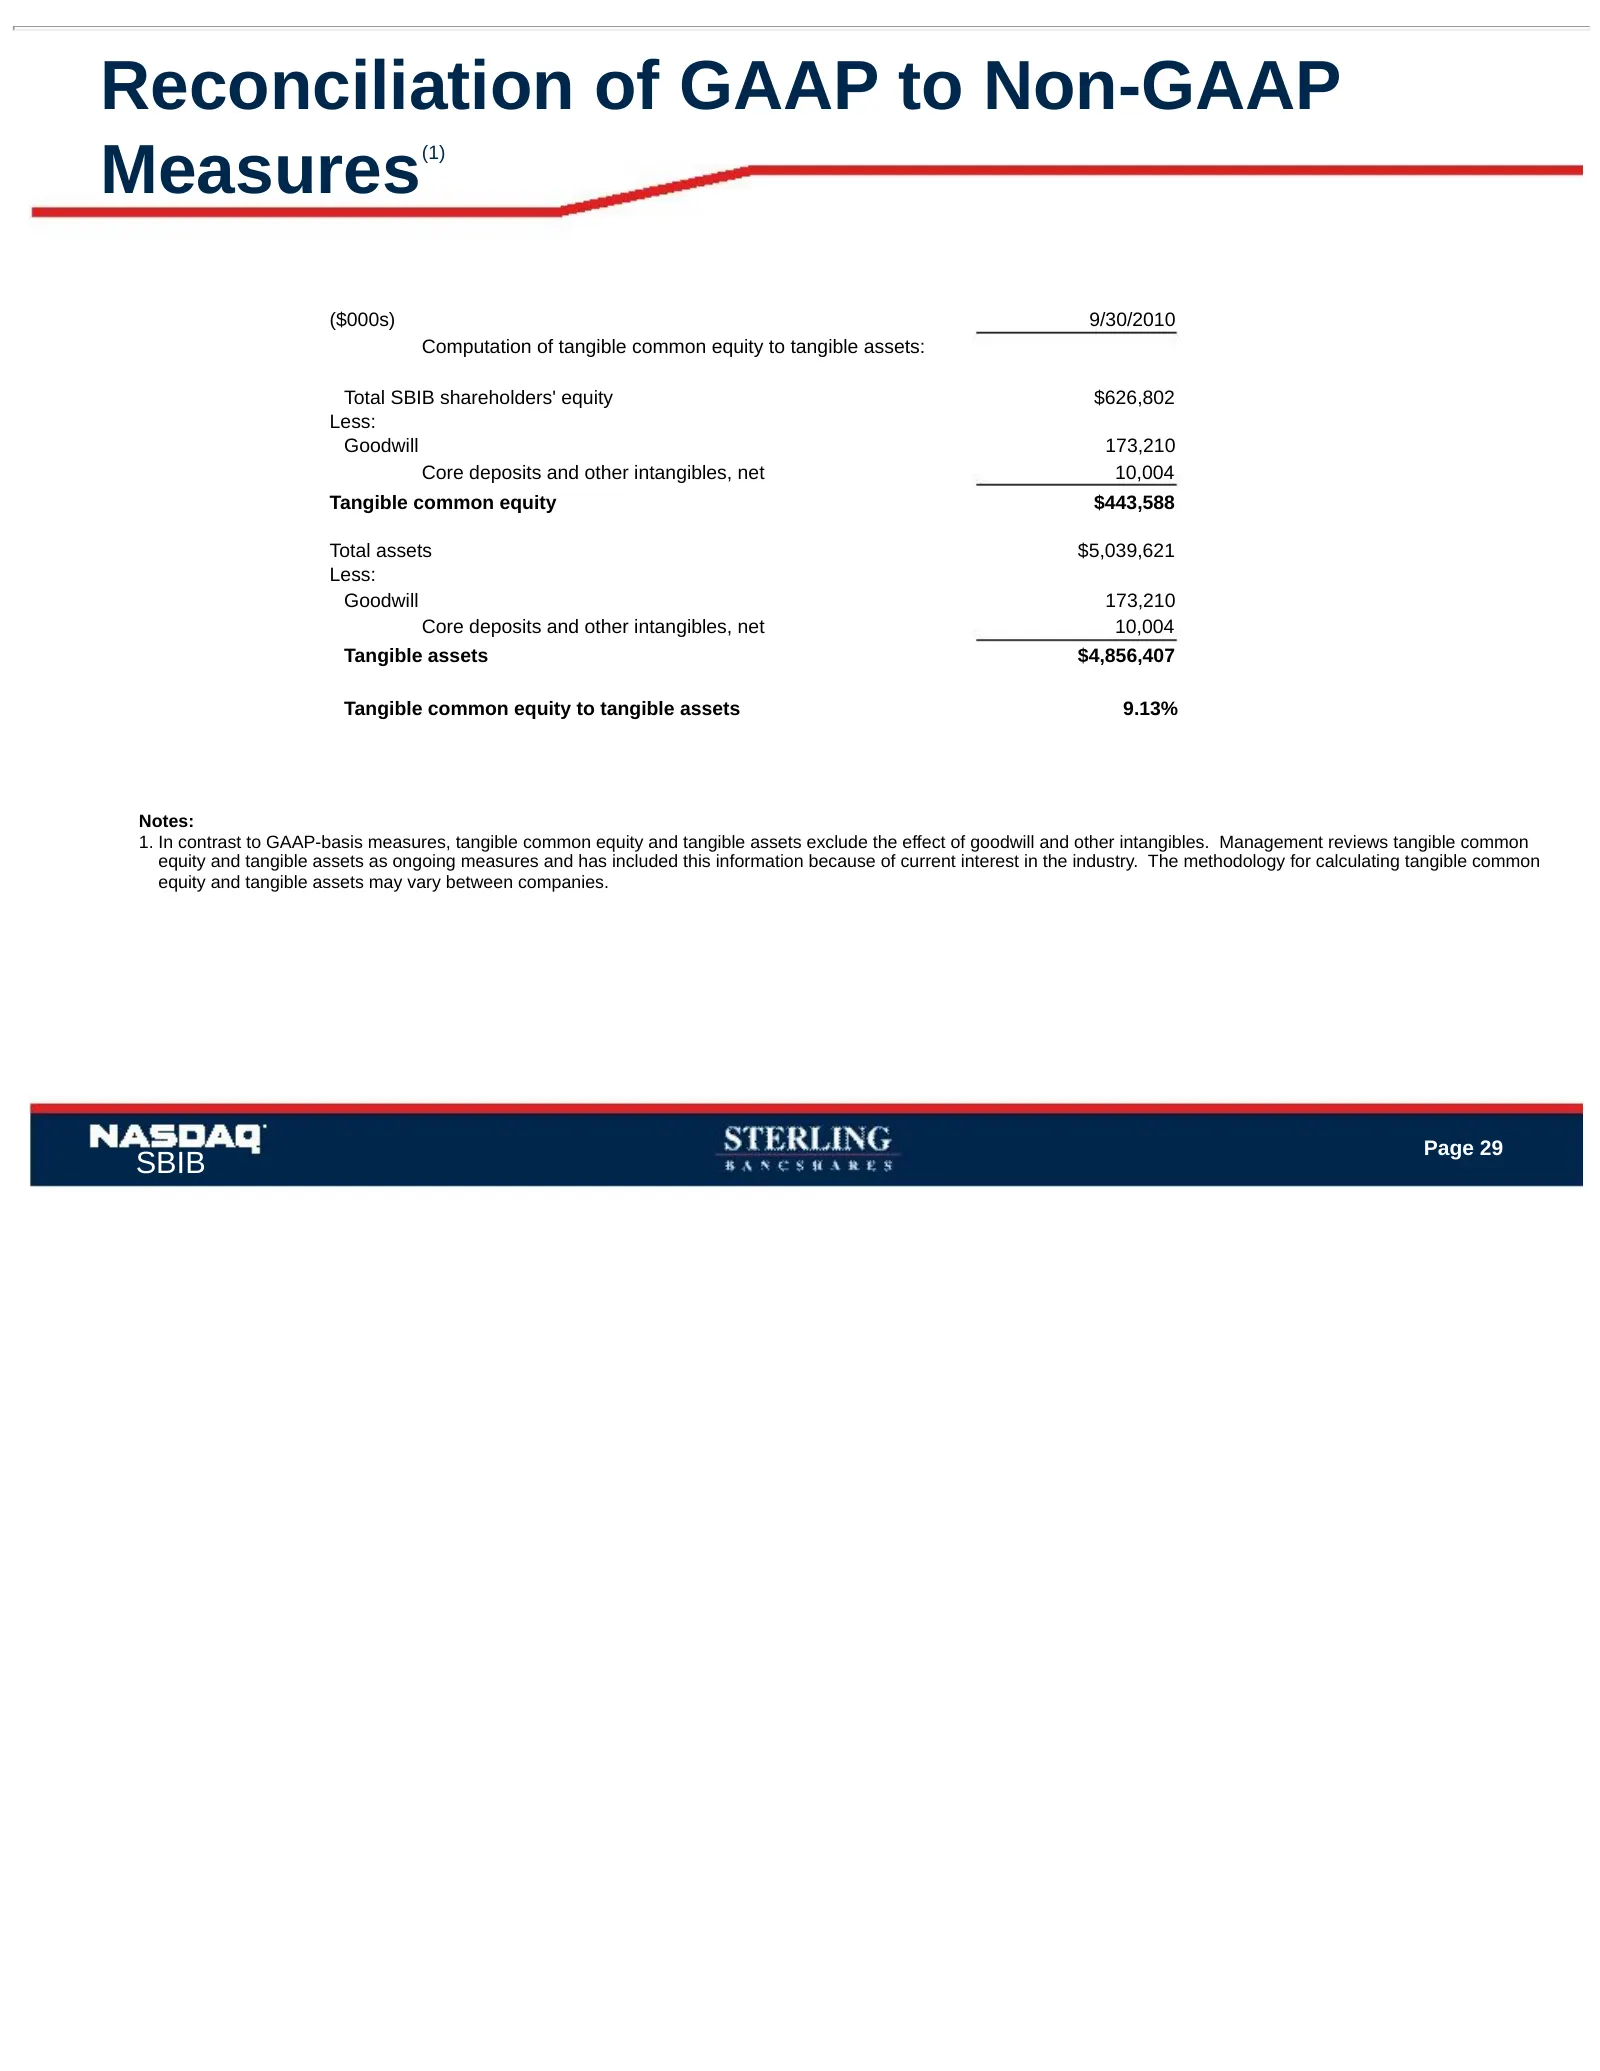
Reconciliation of GAAP to Non-GAAP Measures (1) ($000s) 9/30/2010 Computation of tangible common equity to tangible assets: Total SBIB shareholders' equity $626,802 Less: Goodwill 173,210 Core deposits and other intangibles, net 10,004 Tangible common equity $443,588 Total assets $5,039,621 Less: Go
Source: SEC EDGAR · DEFA14A filed Nov 10, 2010
More decks from Sterling Bancshares Inc
 Q2 2011 Earnings Presentation40 slides · Jul 19, 2011
 Merger or Acquisition (May 2011)48 slides · May 4, 2011
 Shareholder Meeting (April 2011)40 slides · Apr 26, 2011
 Q1 2011 Earnings Presentation43 slides · Apr 19, 2011
 Merger or Acquisition (February 2011)26 slides · Feb 22, 2011
 Merger or Acquisition (February 2011)68 slides · Feb 7, 2011