Rokmaster Resources Corp. · TSXV:RKR
Rokmaster Resources — Investor Presentation (April 2021)
57 slides from Rokmaster Resources's investor presentation, April 2021
Slide 1: Revel Ridge Project
ROKMASTER RESOURCES CORP. TSX.V: RKR OTCQB: RKMSF FSE: 1RR1 Revel Ridge Project >9 Million Tonne Gold-Polymetallic Mineral Deposit “One of the largest undeveloped precious & polymetallic deposits in B.C.” J Project Presentation - April 2021 www.rokmaster.com
Slide 2: Cautionary Statement
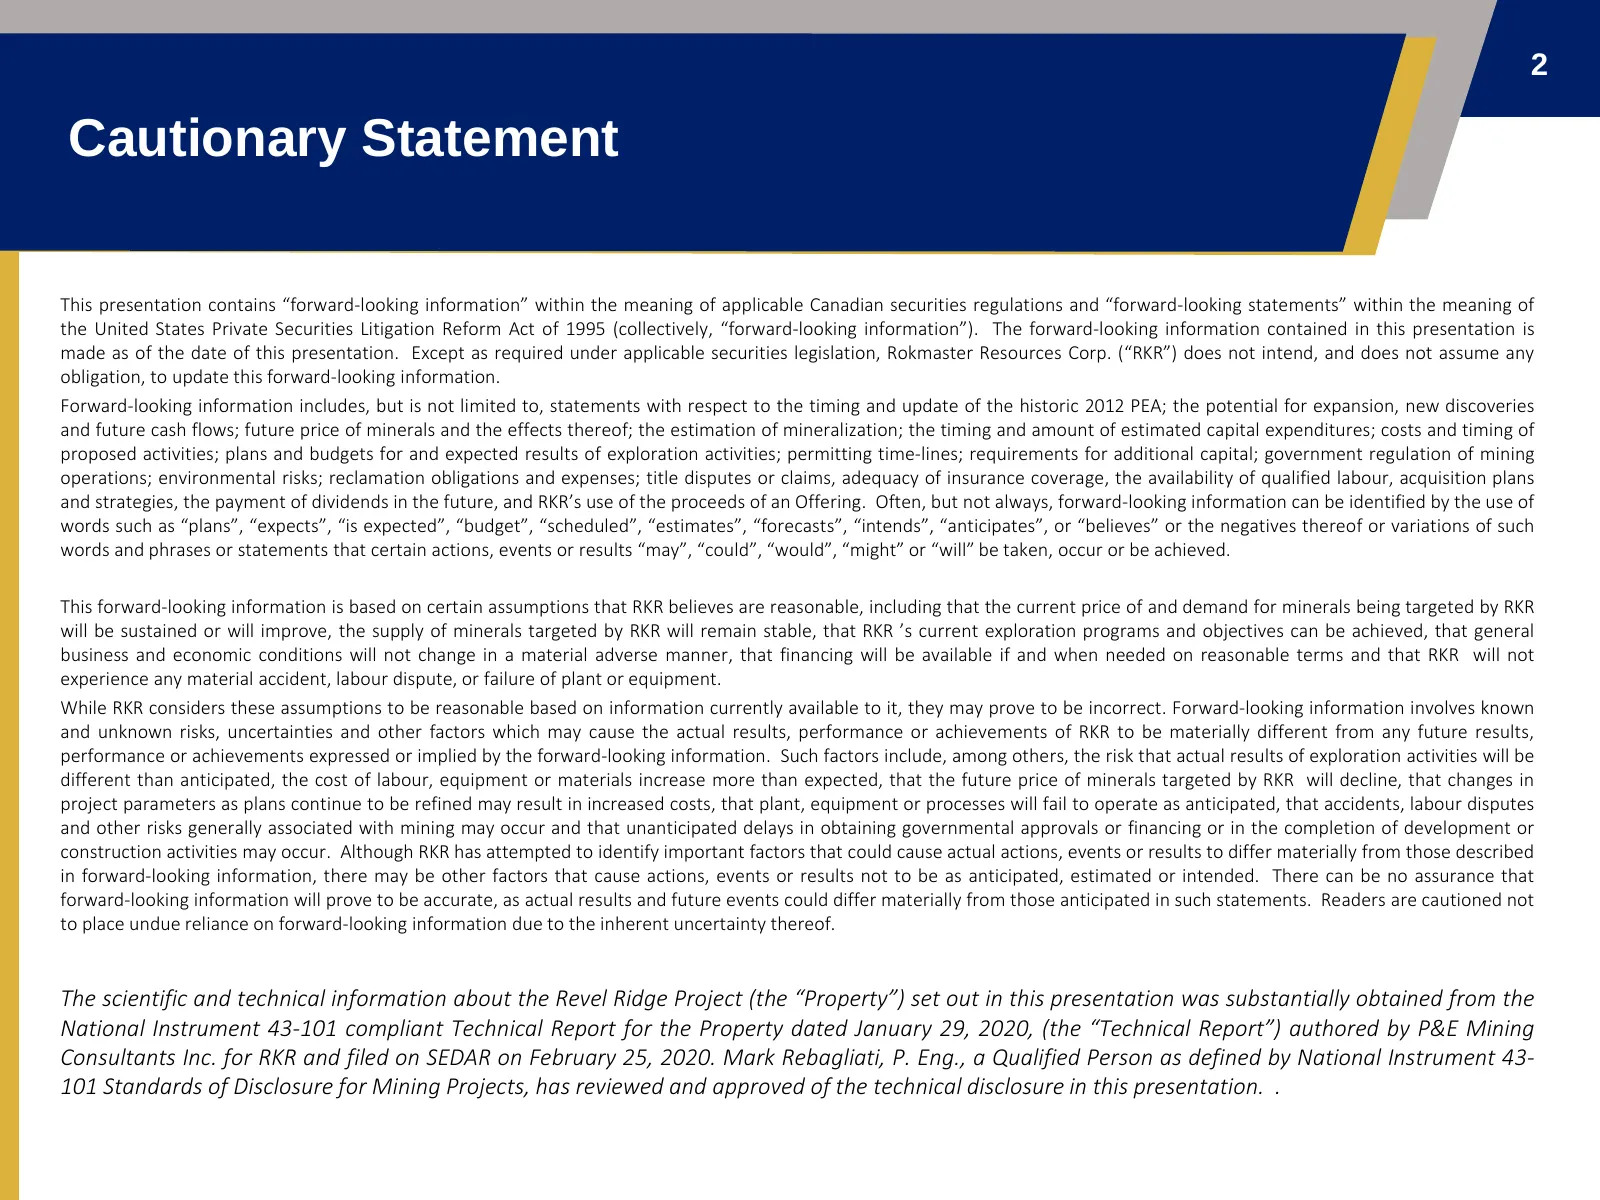
2 Cautionary Statement This presentation contains “forward-looking information” within the meaning of applicable Canadian securities regulations and “forward-looking statements” within the meaning of the United States Private Securities Litigation Reform Act of 1995 (collectively, “forward-looking i
Slide 3: Experienced Team
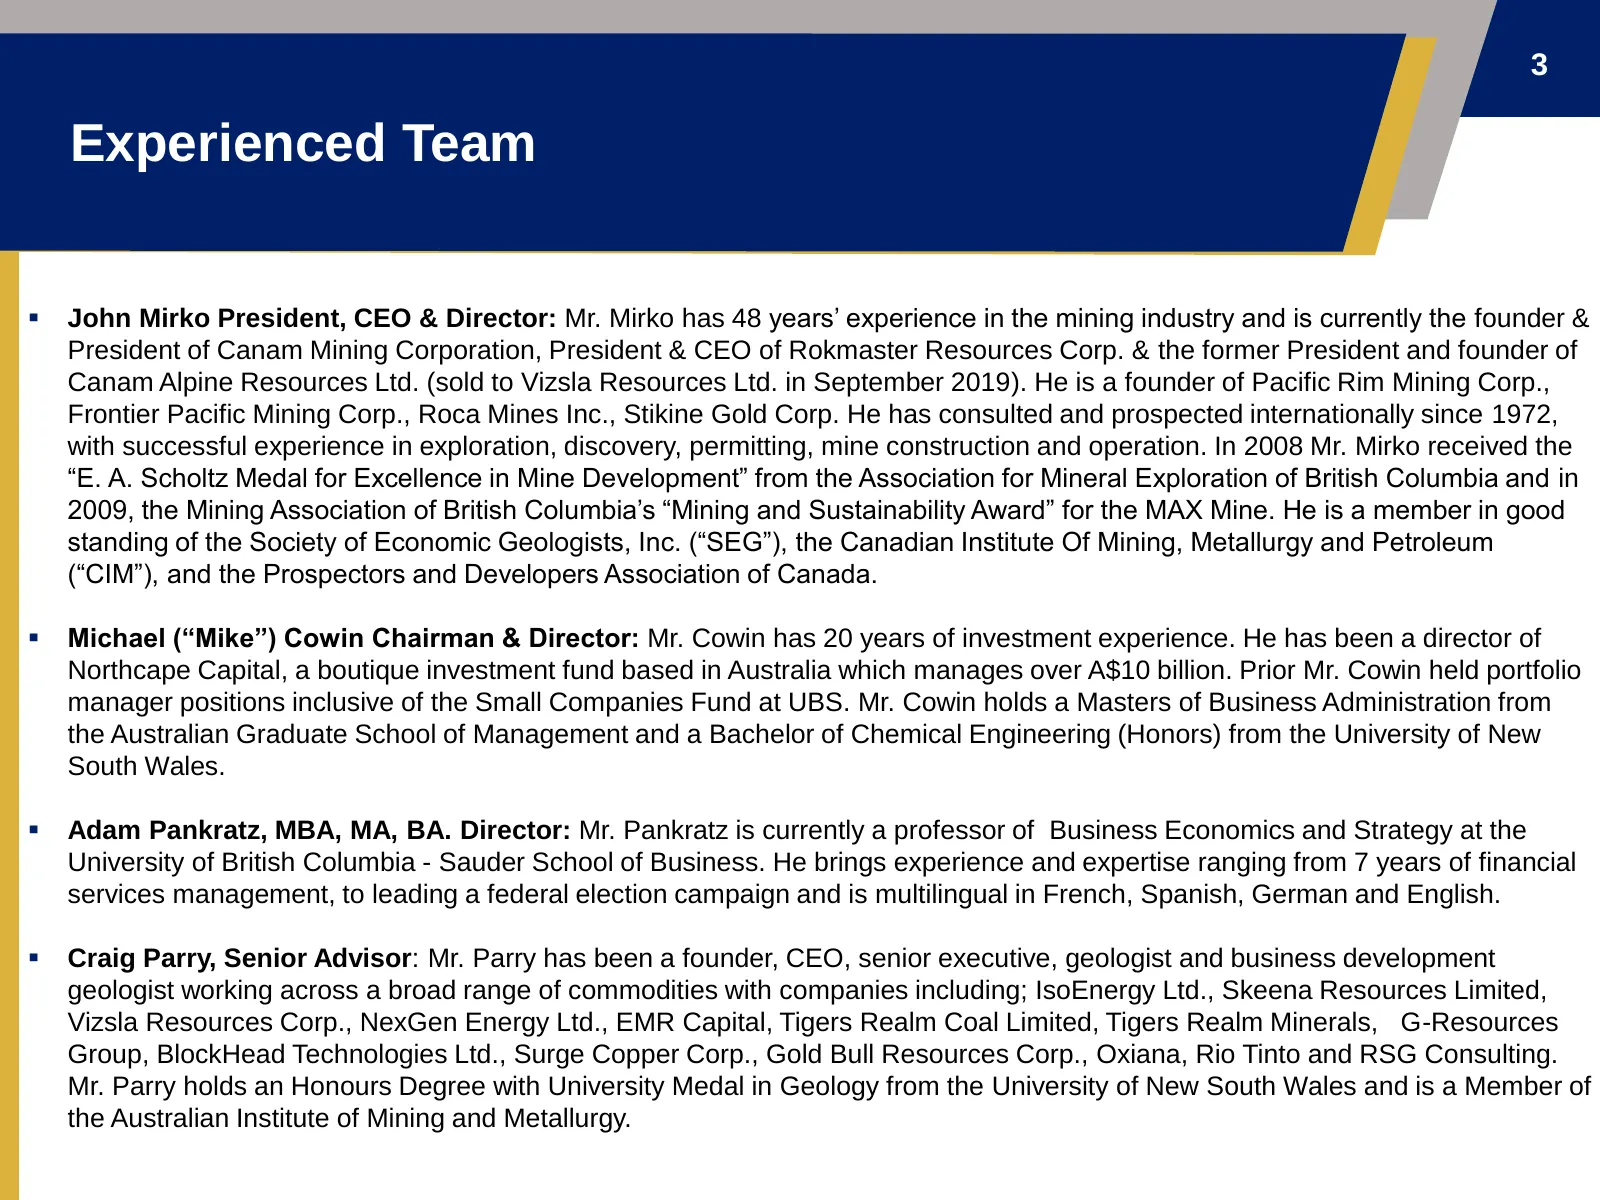
3 Experienced Team ▪ John Mirko President, CEO & Director: Mr. Mirko has 48 years’ experience in the mining industry and is currently the founder & President of Canam Mining Corporation, President & CEO of Rokmaster Resources Corp. & the former President and founder of Canam Alpine Resources Ltd. (s
Slide 4: Experienced Team Cont.
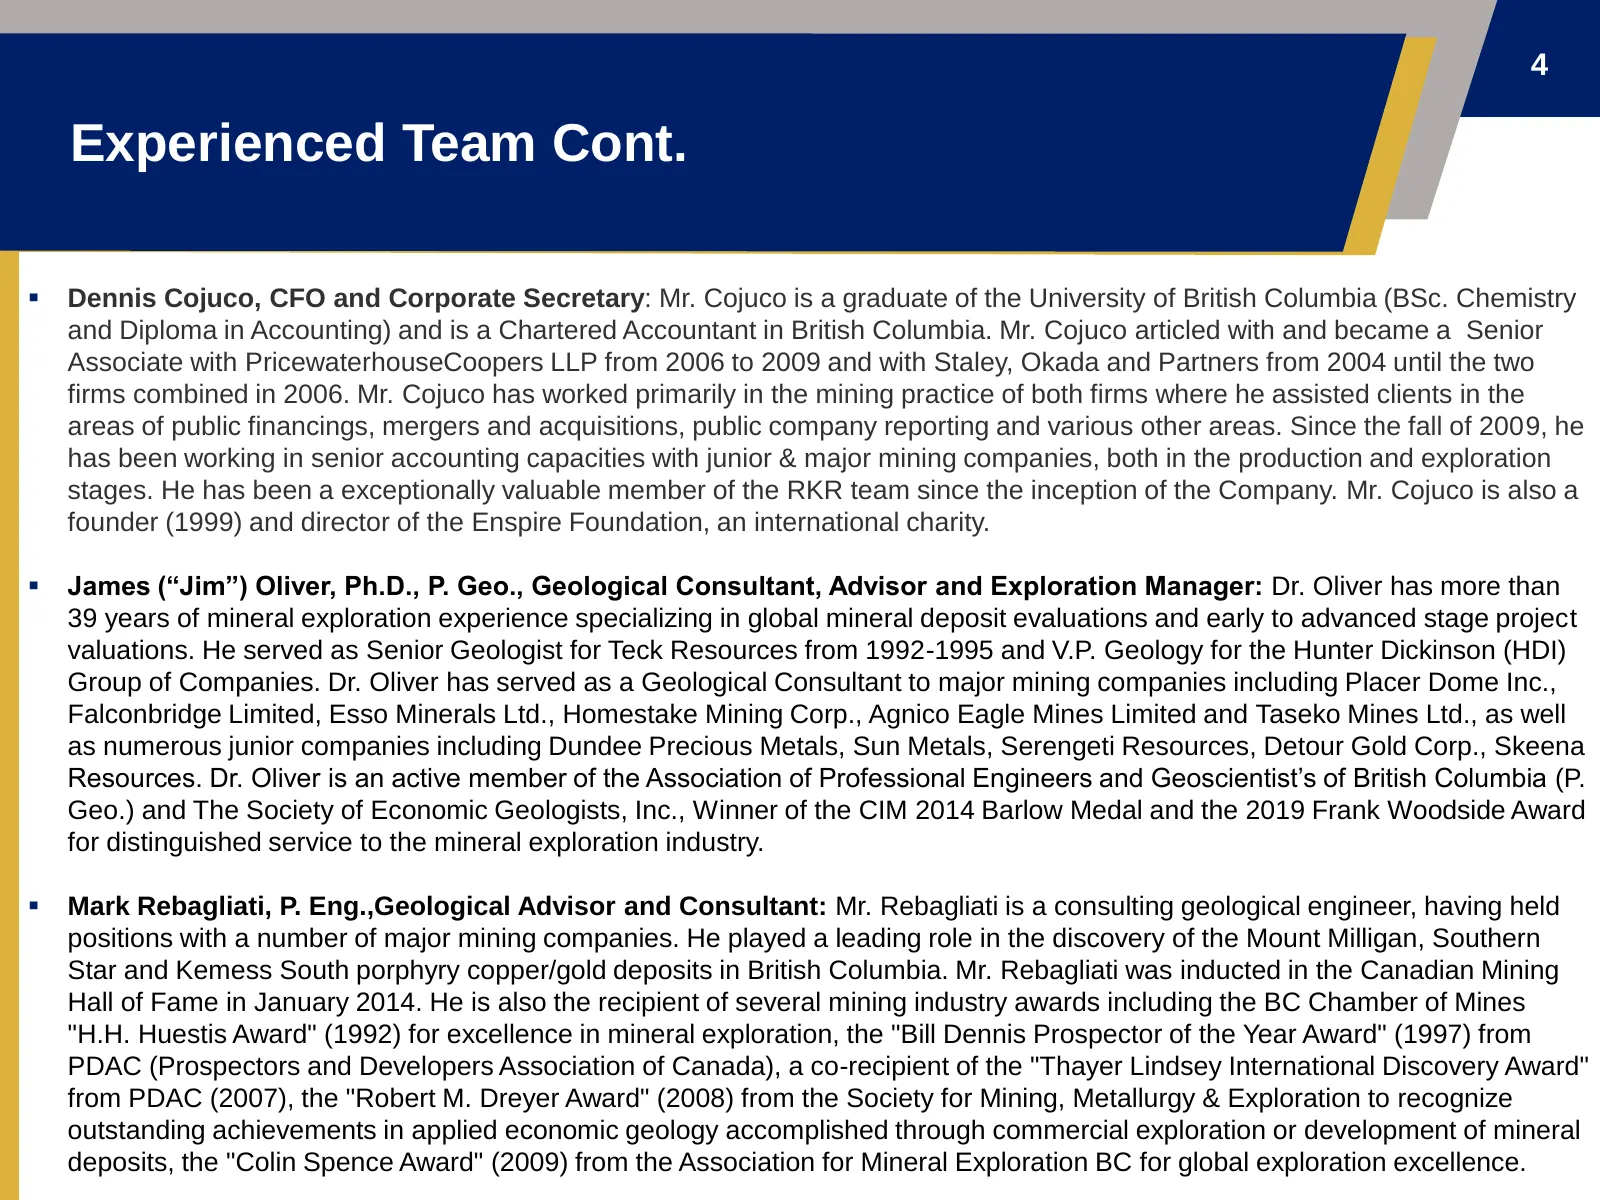
4 Experienced Team Cont. ▪ Dennis Cojuco, CFO and Corporate Secretary: Mr. Cojuco is a graduate of the University of British Columbia (BSc. Chemistry and Diploma in Accounting) and is a Chartered Accountant in British Columbia. Mr. Cojuco articled with and became a Senior Associate with Pricewaterho
Slide 5: Experienced Team Cont.
5 Experienced Team Cont. ▪ Harvey Tremblay, Drilling and Business Advisor: Mr. Tremblay is the founder and Chairman of Hy-Tech Drilling Ltd., based in Smithers, BC. In 1991 he founded Hy-Tech Drilling and built it up from a single drill operation to a fleet of 35 drills operating throughout Canada a
Slide 6: Revel Ridge Project Location – Southwest British Columbia
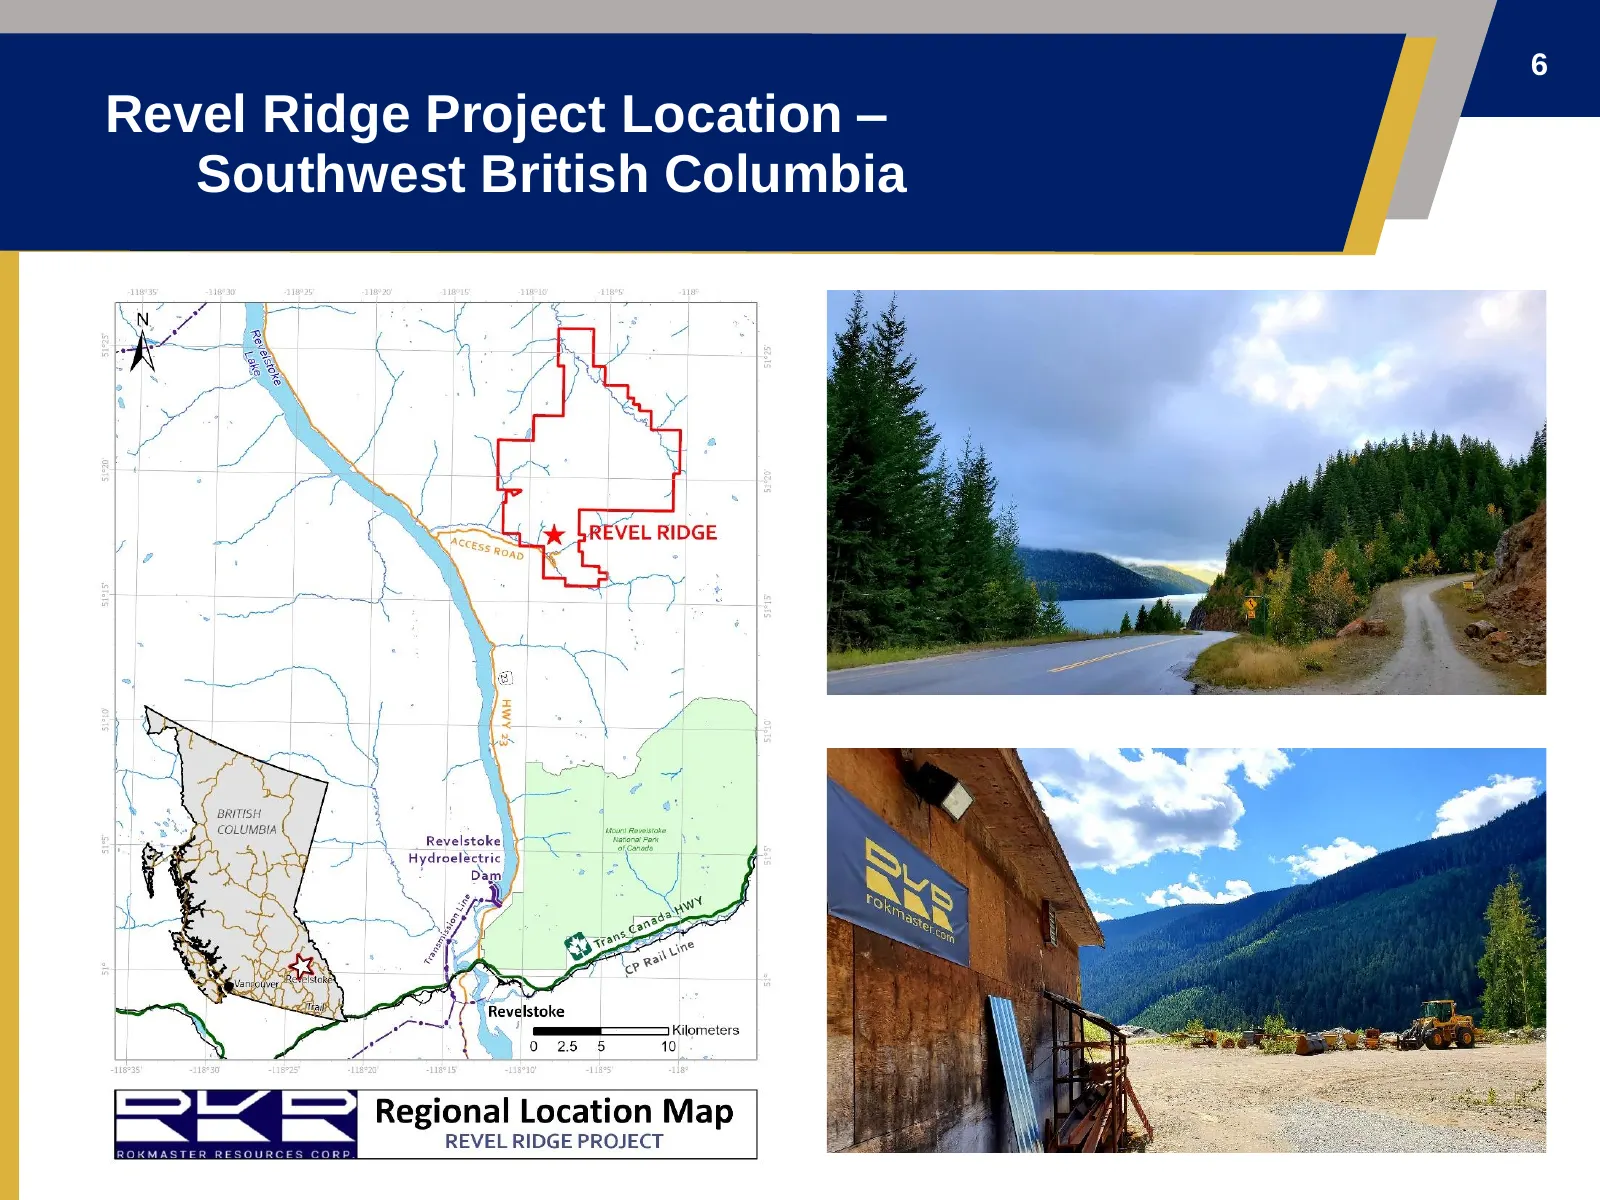
6 Revel Ridge Project Location – Southwest British Columbia
Slide 7: Revel Ridge Property - 14,277 Ha
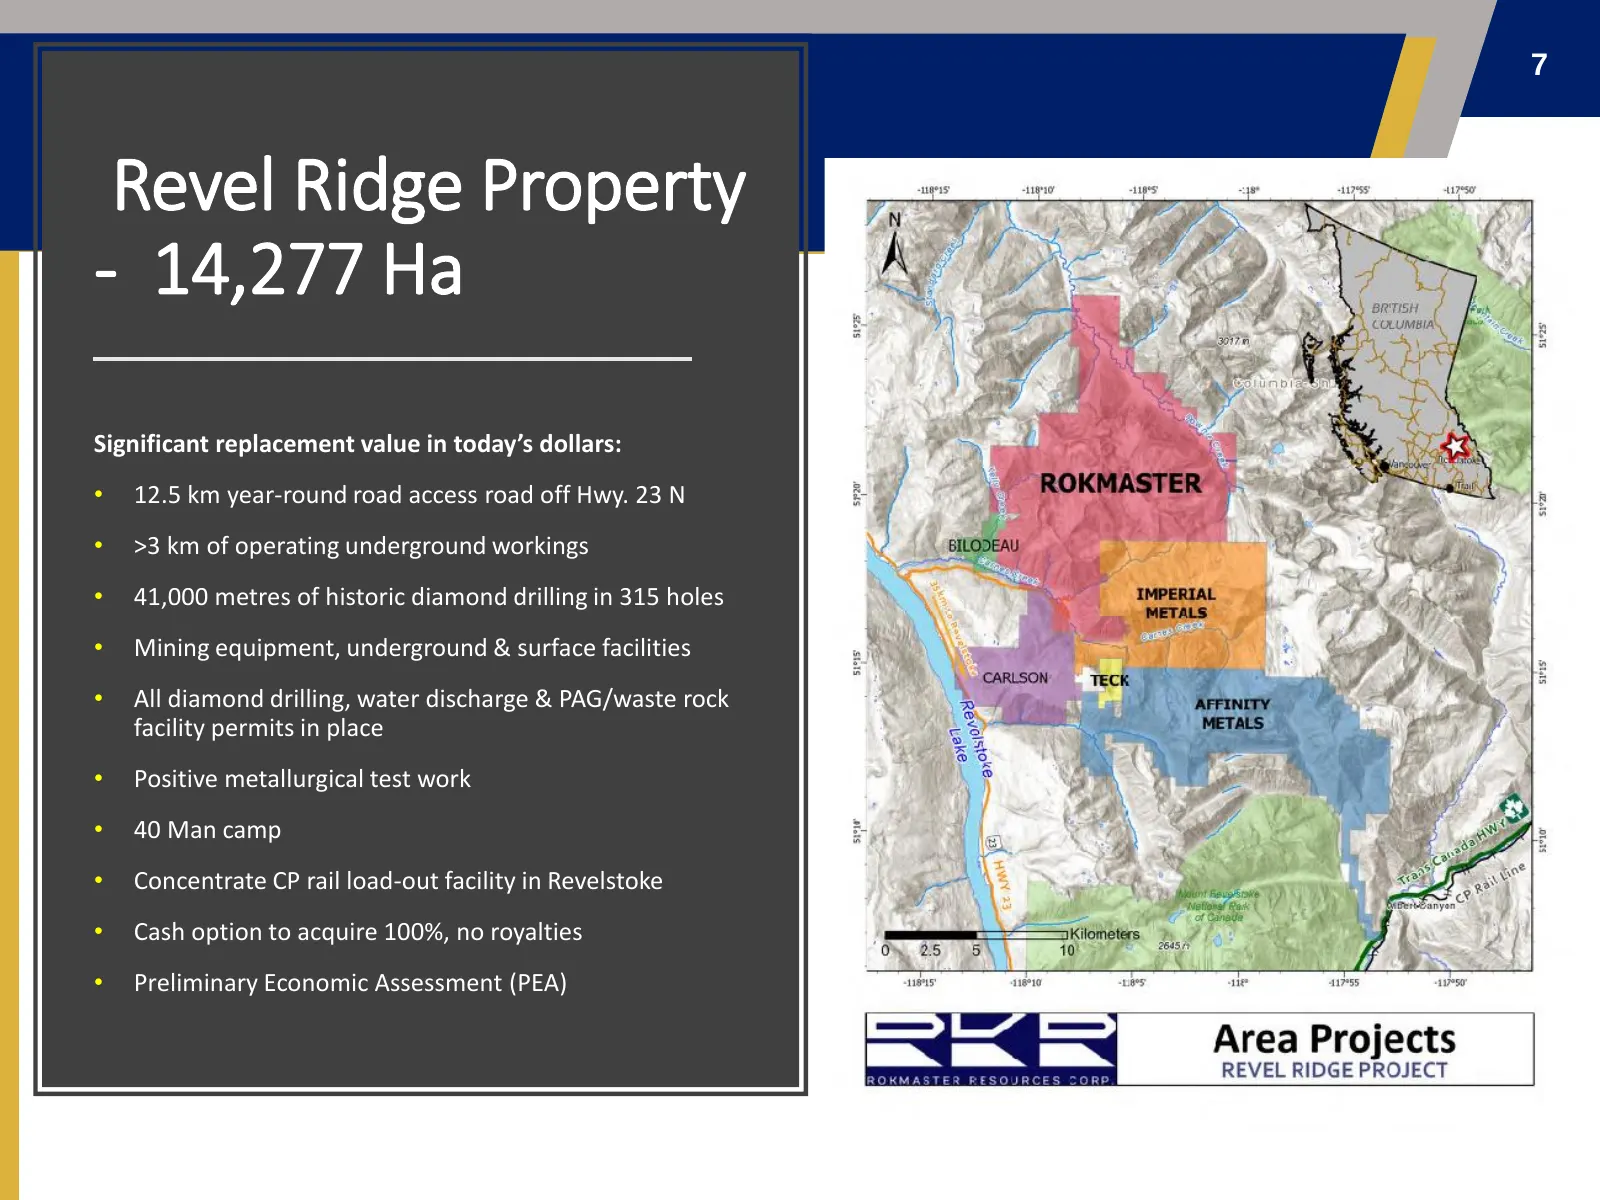
7 Revel Ridge Property - 14,277 Ha Significant replacement value in today’s dollars: • 12.5 km year-round road access road off Hwy. 23 N • >3 km of operating underground workings • 41,000 metres of historic diamond drilling in 315 holes • Mining equipment, underground & surface facilities • All diam
Slide 8: History 1865 – 1946
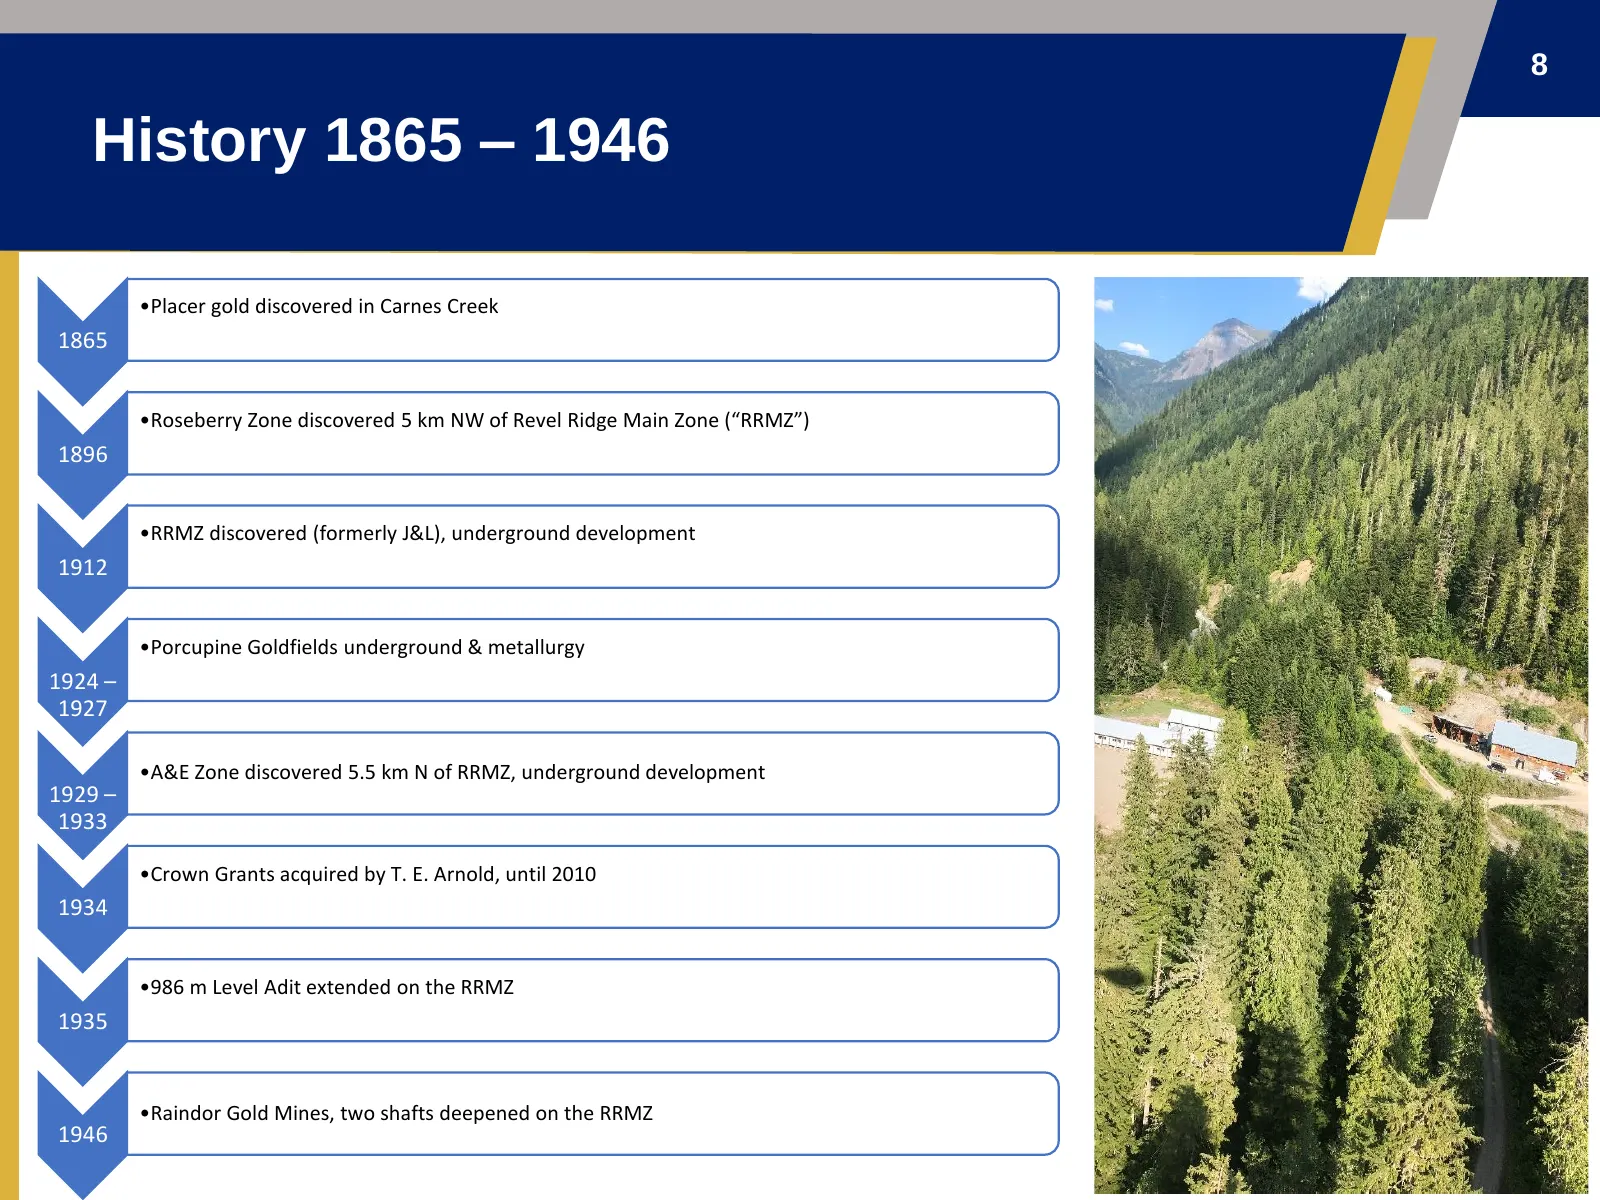
8 History 1865 – 1946 •Placer gold discovered in Carnes Creek 1865 •Roseberry Zone discovered 5 km NW of Revel Ridge Main Zone (“RRMZ”) 1896 •RRMZ discovered (formerly J&L), underground development 1912 •Porcupine Goldfields underground & metallurgy 1924 – 1927 •A&E Zone discovered 5.5 km N of RRMZ,
Slide 9: History 1952 – 2020
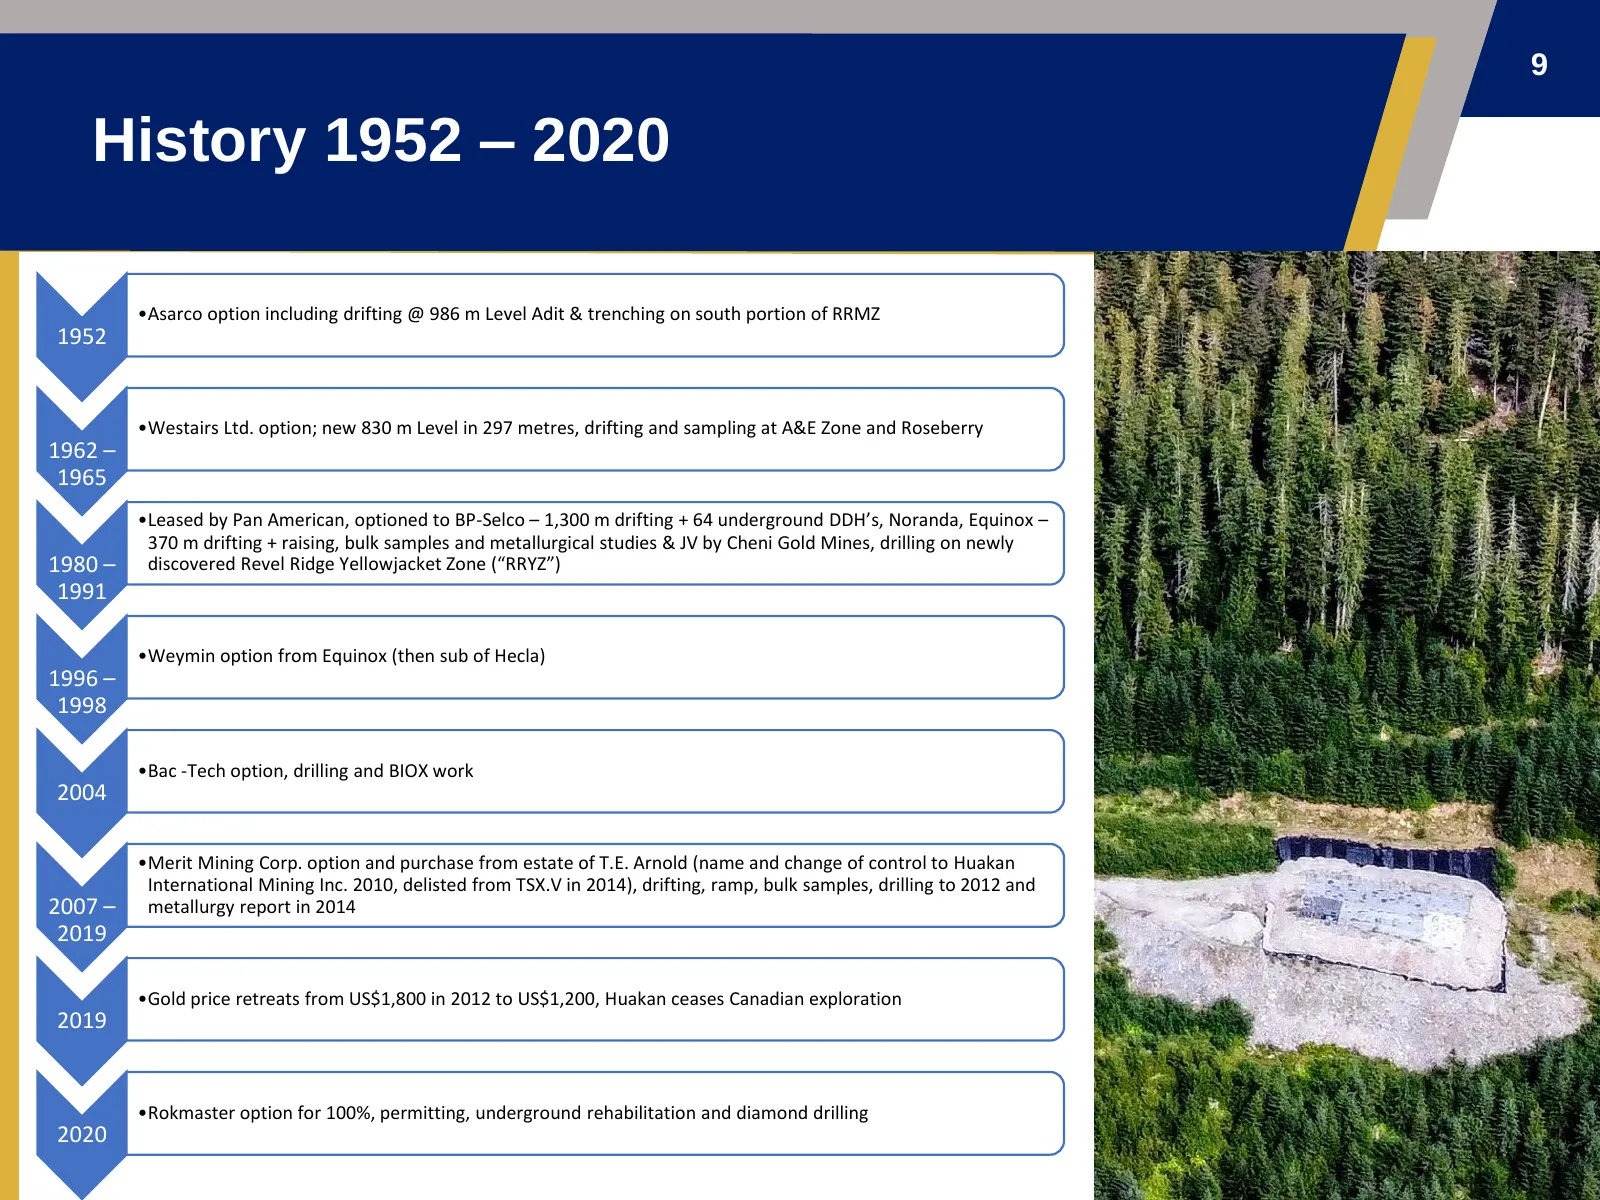
9 History 1952 – 2020 •Asarco option including drifting @ 986 m Level Adit & trenching on south portion of RRMZ 1952 •Westairs Ltd. option; new 830 m Level in 297 metres, drifting and sampling at A&E Zone and Roseberry 1962 – 1965 •Leased by Pan American, optioned to BP-Selco – 1,300 m drifting + 64
Slide 10: Merits Of The Project
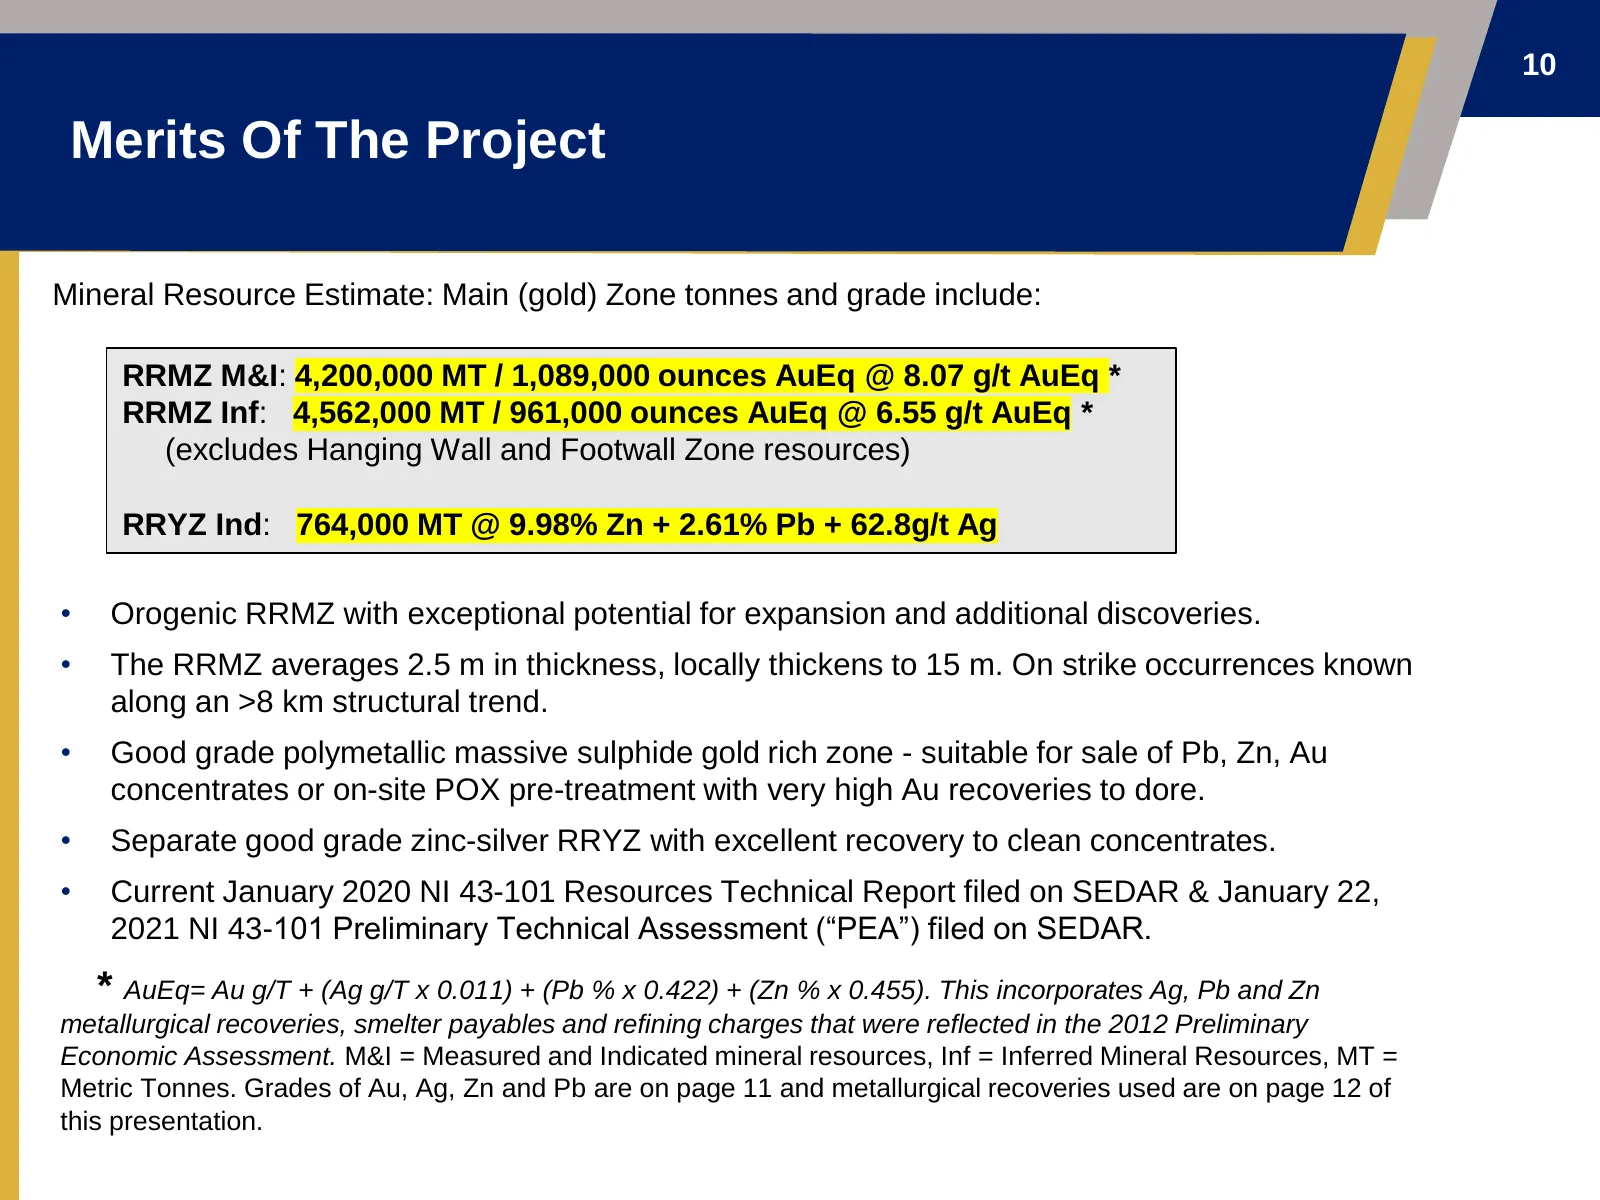
10 Merits Of The Project Mineral Resource Estimate: Main (gold) Zone tonnes and grade include: RRMZ M&I: 4,200,000 MT / 1,089,000 ounces AuEq @ 8.07 g/t AuEq * RRMZ Inf: 4,562,000 MT / 961,000 ounces AuEq @ 6.55 g/t AuEq * (excludes Hanging Wall and Footwall Zone resources) RRYZ Ind: 764,000 MT @ 9.
Slide 11: Current Resource Estimate
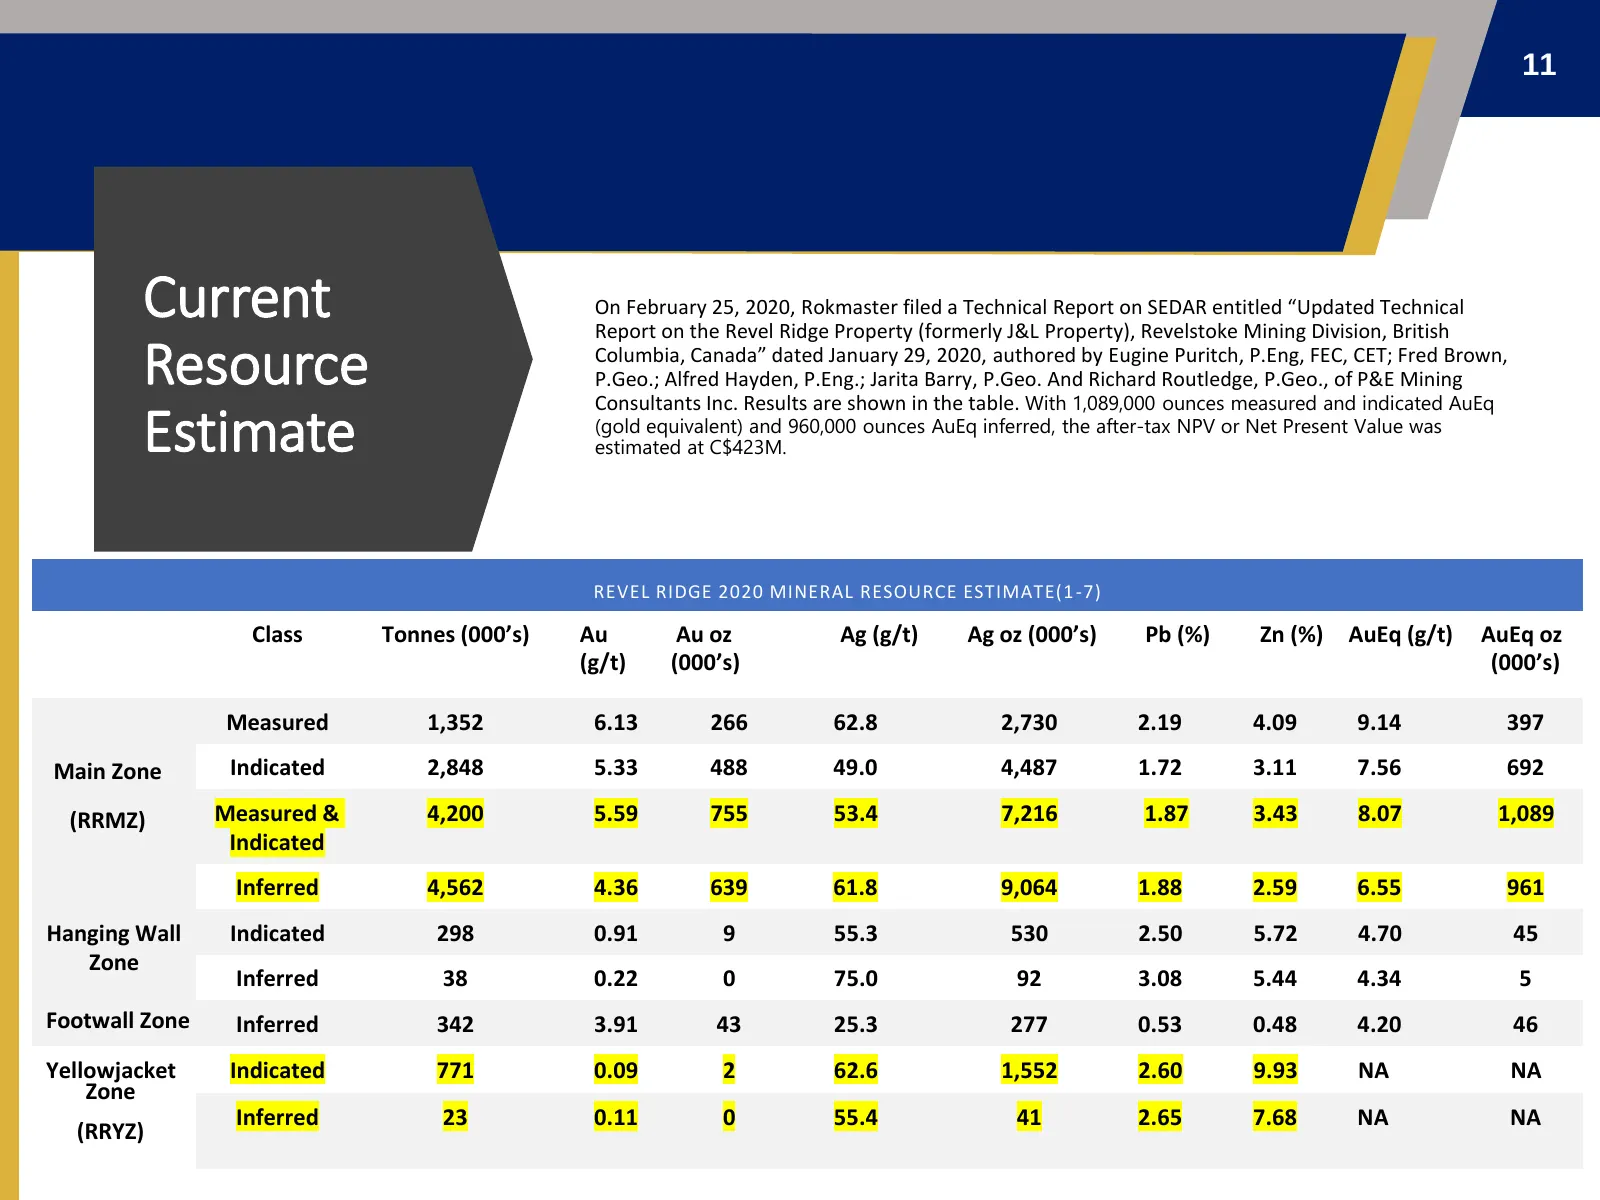
11 Current On February 25, 2020, Rokmaster filed a Technical Report on SEDAR entitled “Updated Technical Report on the Revel Ridge Property (formerly J&L Property), Revelstoke Mining Division, British Resource Columbia, Canada” dated January 29, 2020, authored by Eugine Puritch, P.Eng, FEC, CET; Fre
Slide 12: Mineral Resource Estimate Notes
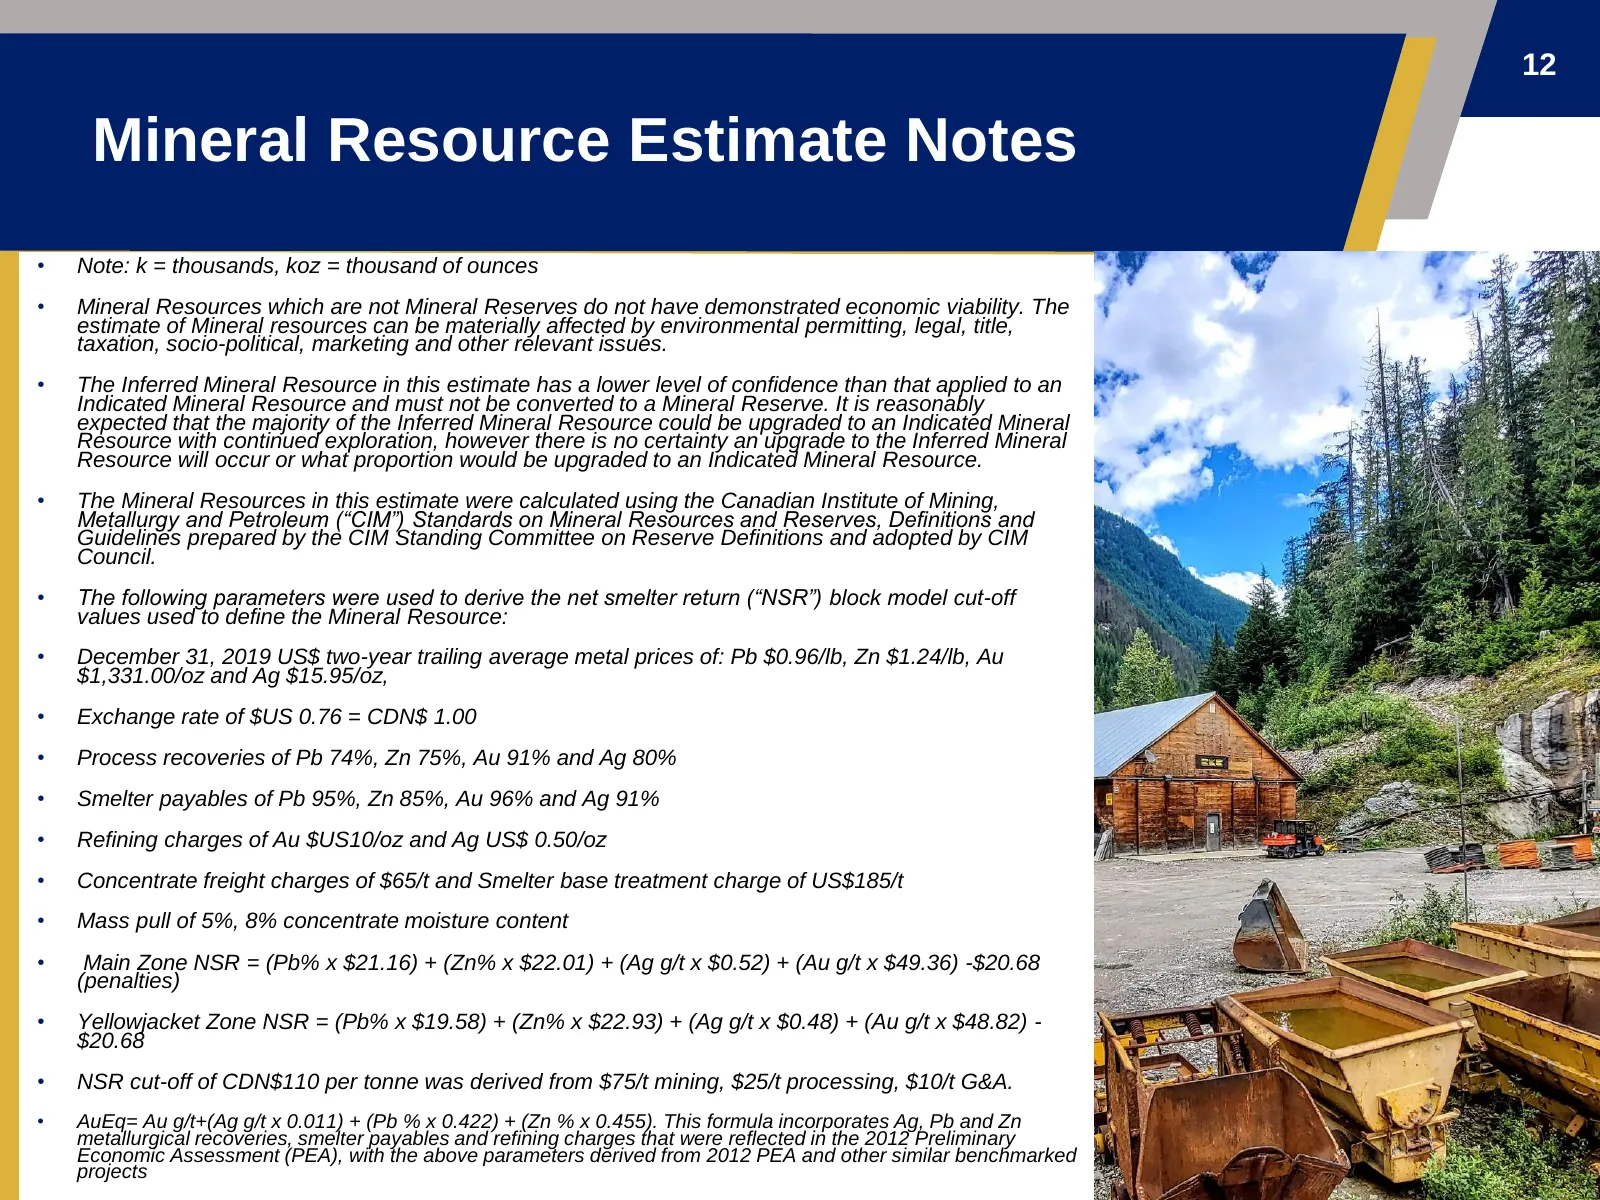
12 Mineral Resource Estimate Notes • Note: k = thousands, koz = thousand of ounces • Mineral Resources which are not Mineral Reserves do not have demonstrated economic viability. The estimate of Mineral resources can be materially affected by environmental permitting, legal, title, taxation, socio-p
Slide 13: Merits Of The 100% Option
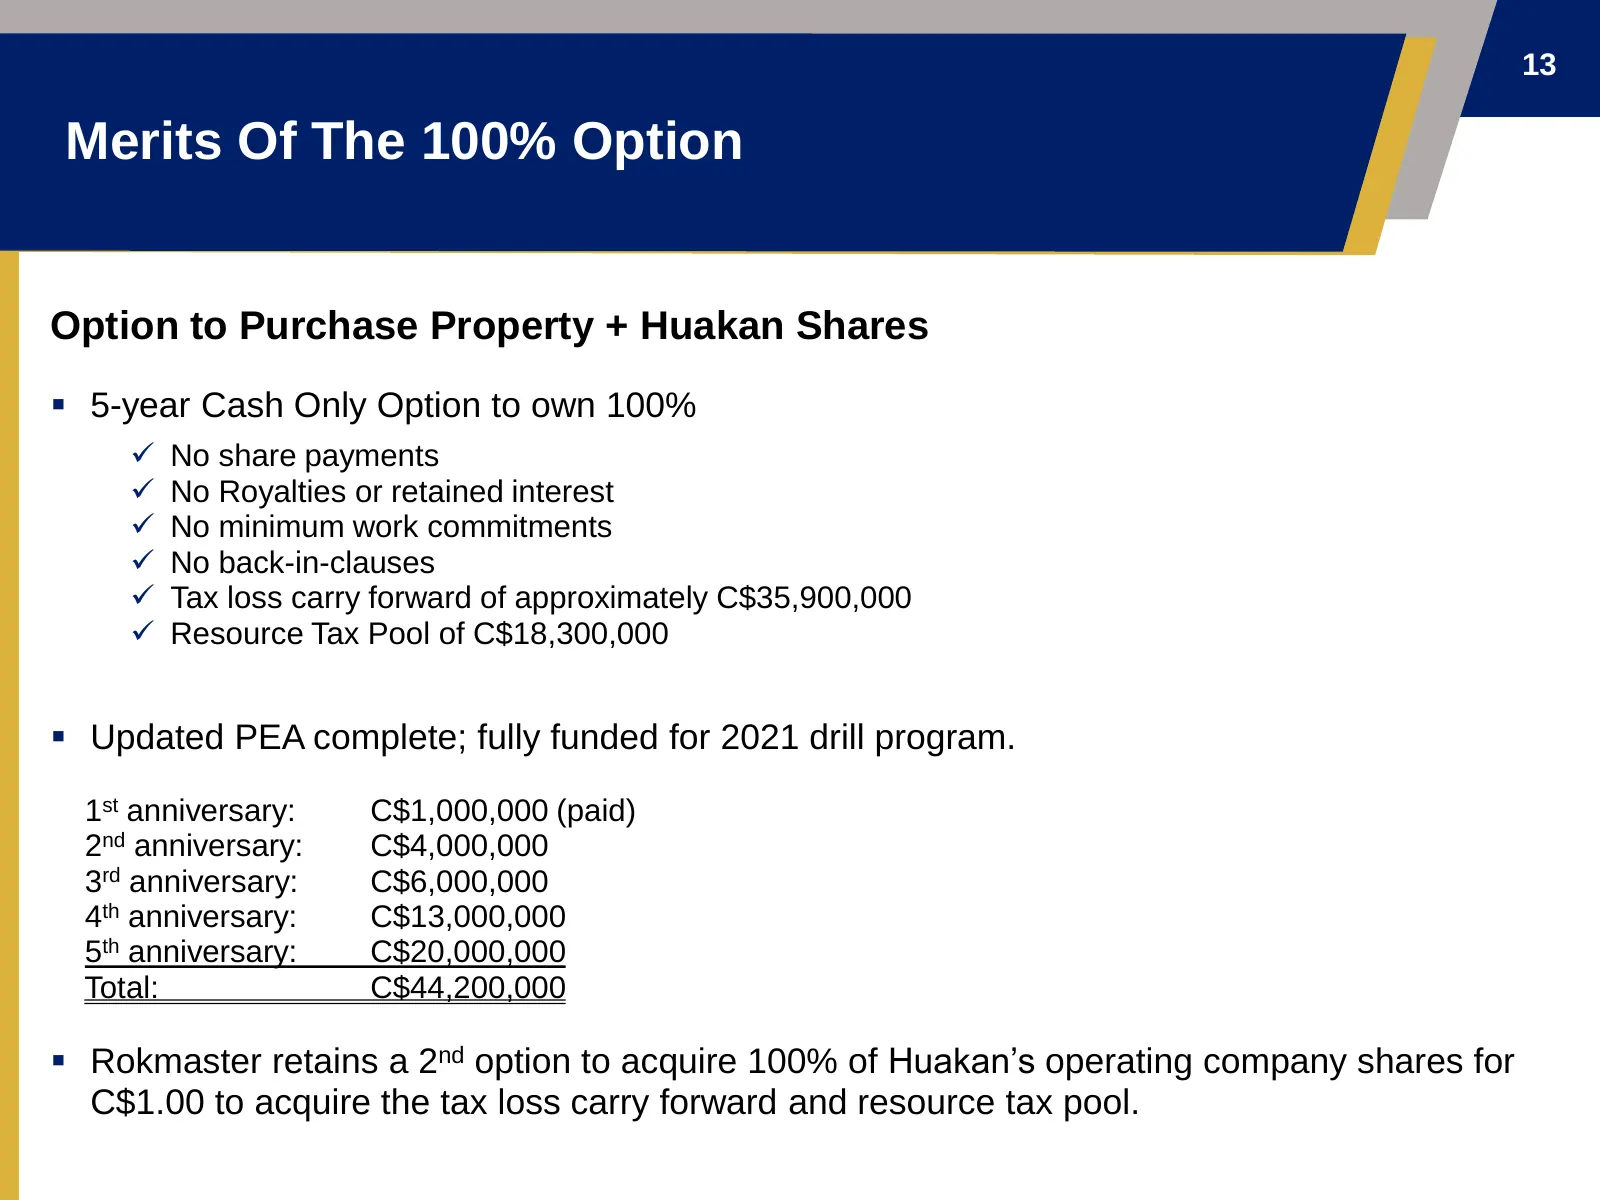
13 Merits Of The 100% Option Option to Purchase Property + Huakan Shares ▪ 5-year Cash Only Option to own 100% ✓ No share payments ✓ No Royalties or retained interest ✓ No minimum work commitments ✓ No back-in-clauses ✓ Tax loss carry forward of approximately C$35,900,000 ✓ Resource Tax Pool of C$18
Slide 14: Merits of the Deal
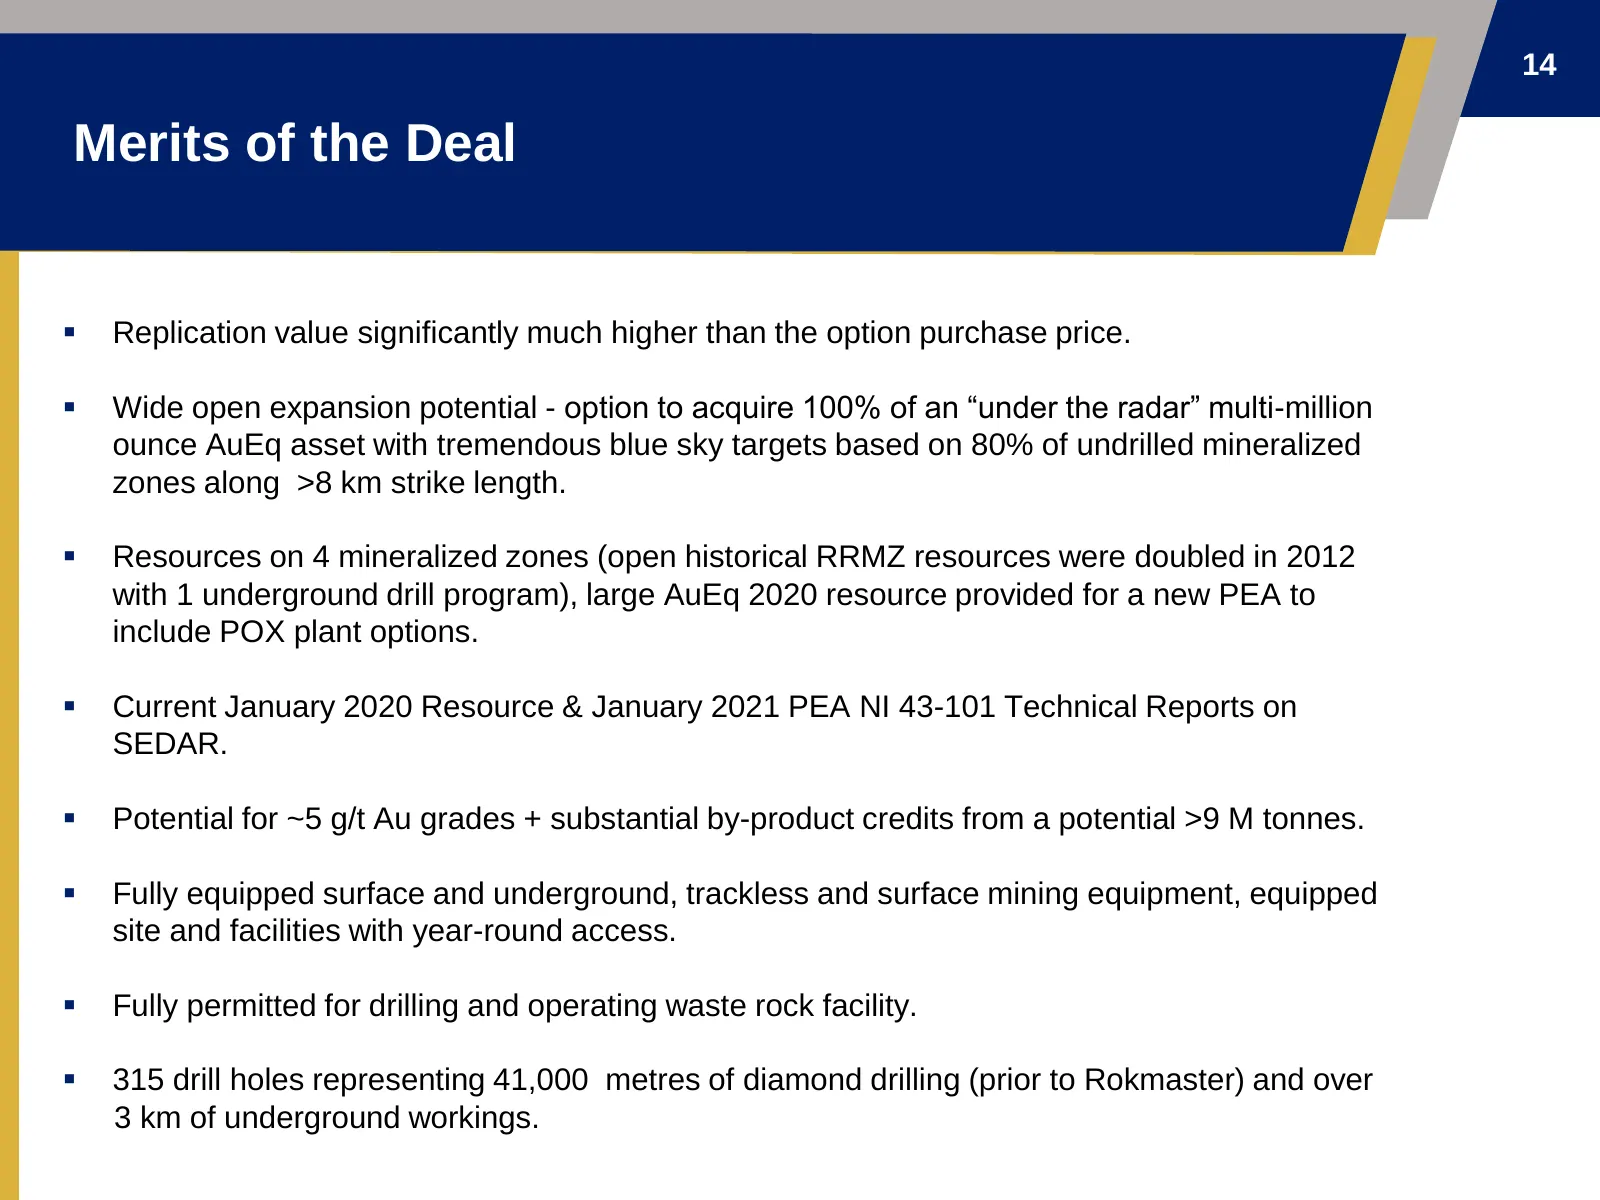
14 Merits of the Deal ▪ Replication value significantly much higher than the option purchase price. ▪ Wide open expansion potential - option to acquire 100% of an “under the radar” multi-million ounce AuEq asset with tremendous blue sky targets based on 80% of undrilled mineralized zones along >8 km
Slide 15: Geology and Mineralization
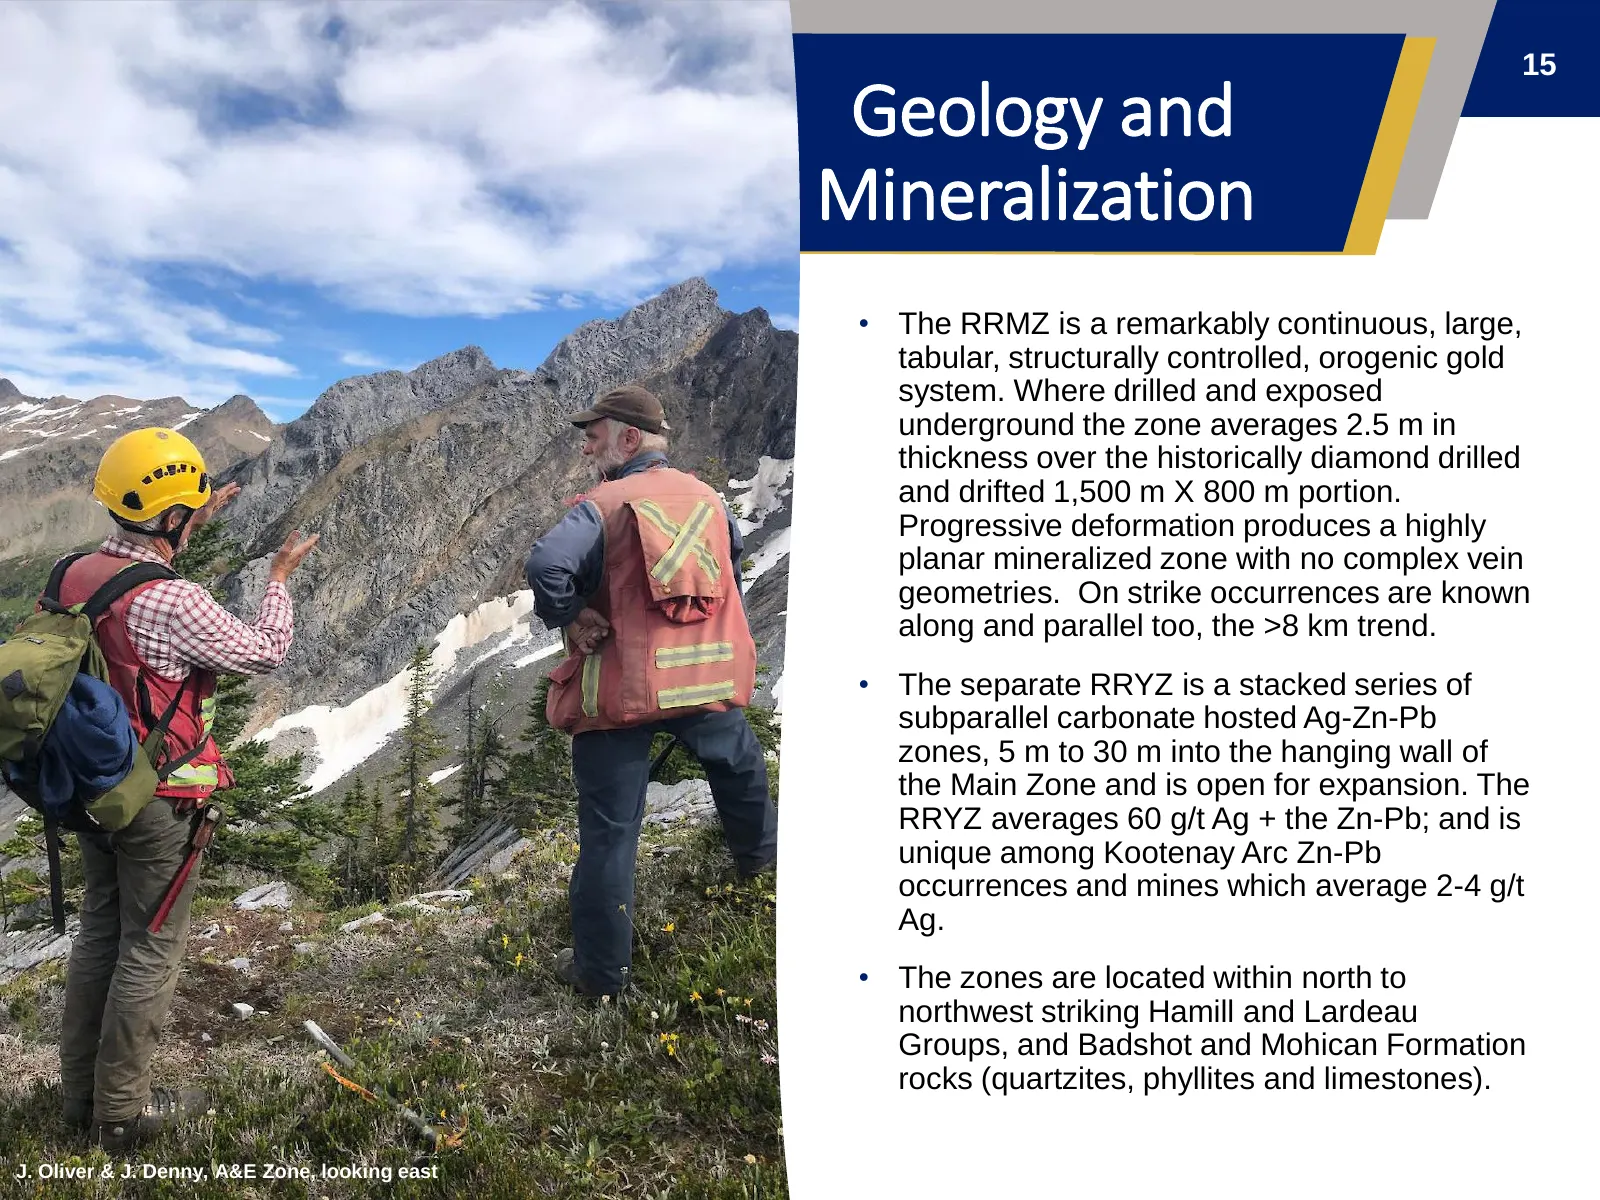
15 Geology and Mineralization • The RRMZ is a remarkably continuous, large, tabular, structurally controlled, orogenic gold system. Where drilled and exposed underground the zone averages 2.5 m in thickness over the historically diamond drilled and drifted 1,500 m X 800 m portion. Progressive deform
Slide 16: Project and Deposit Scale Geology
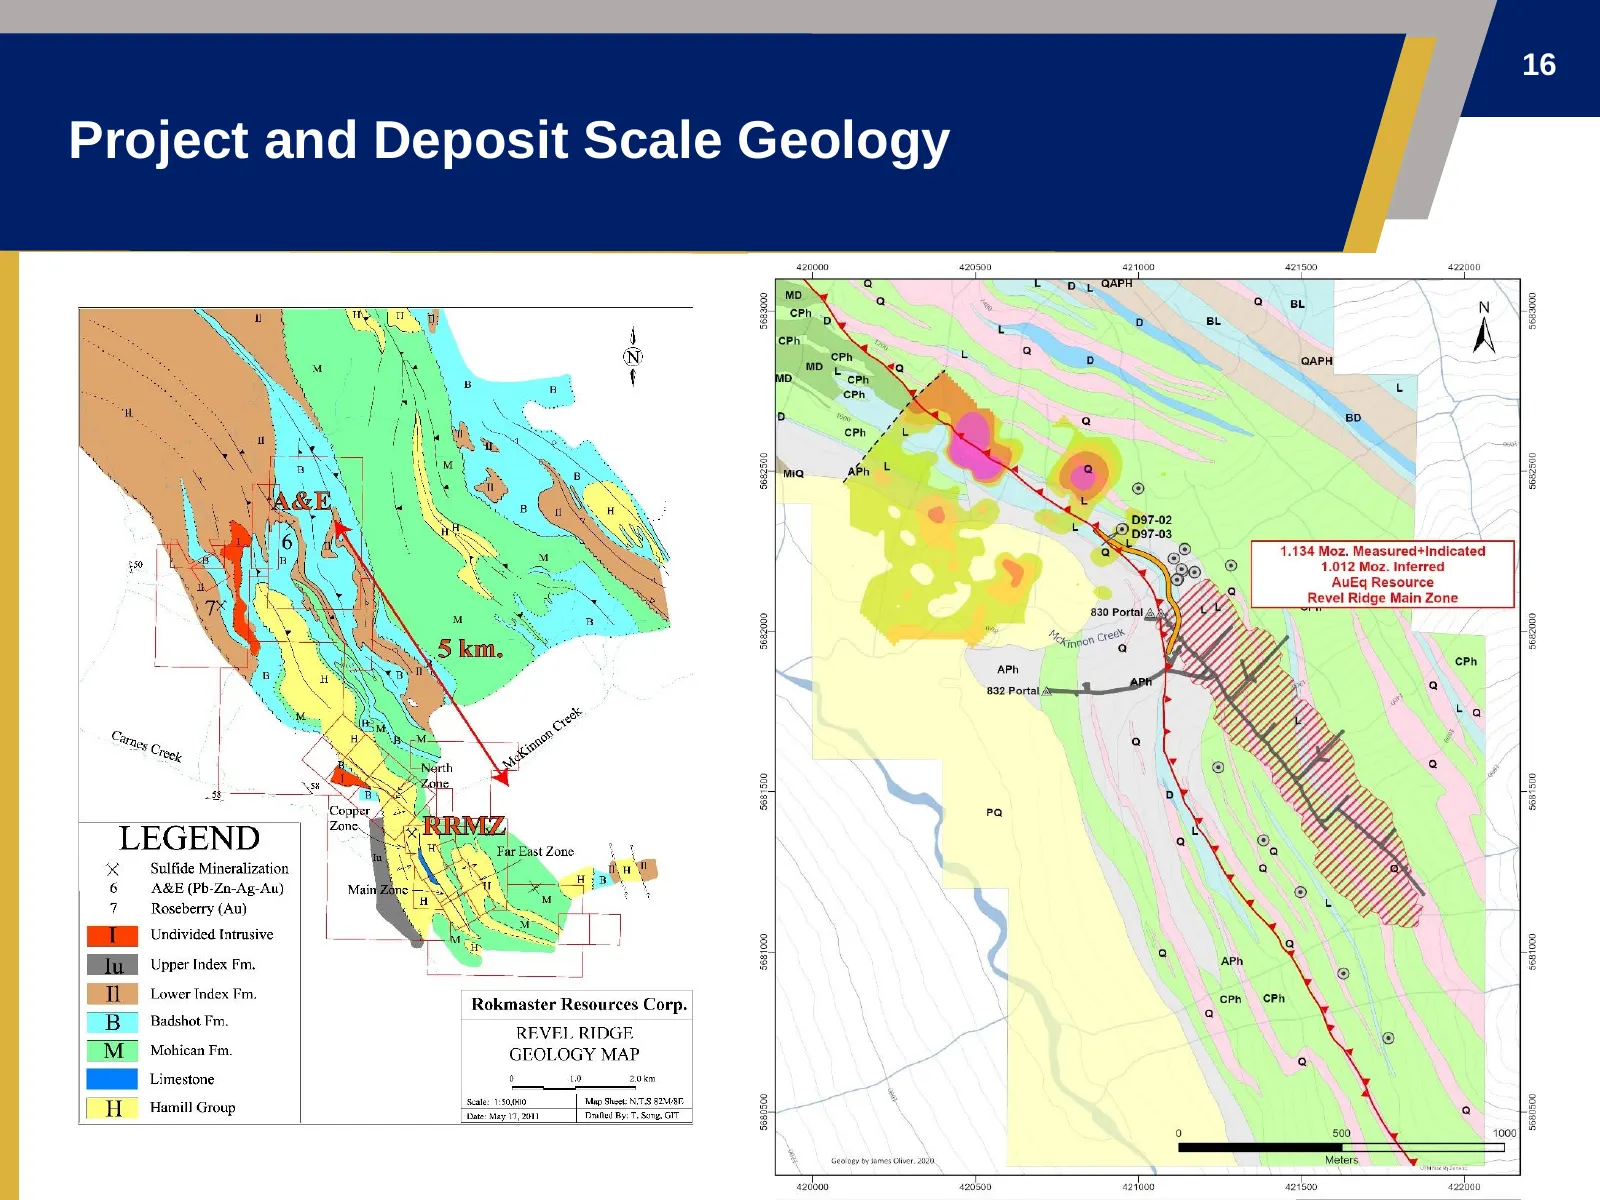
16 Project and Deposit Scale Geology
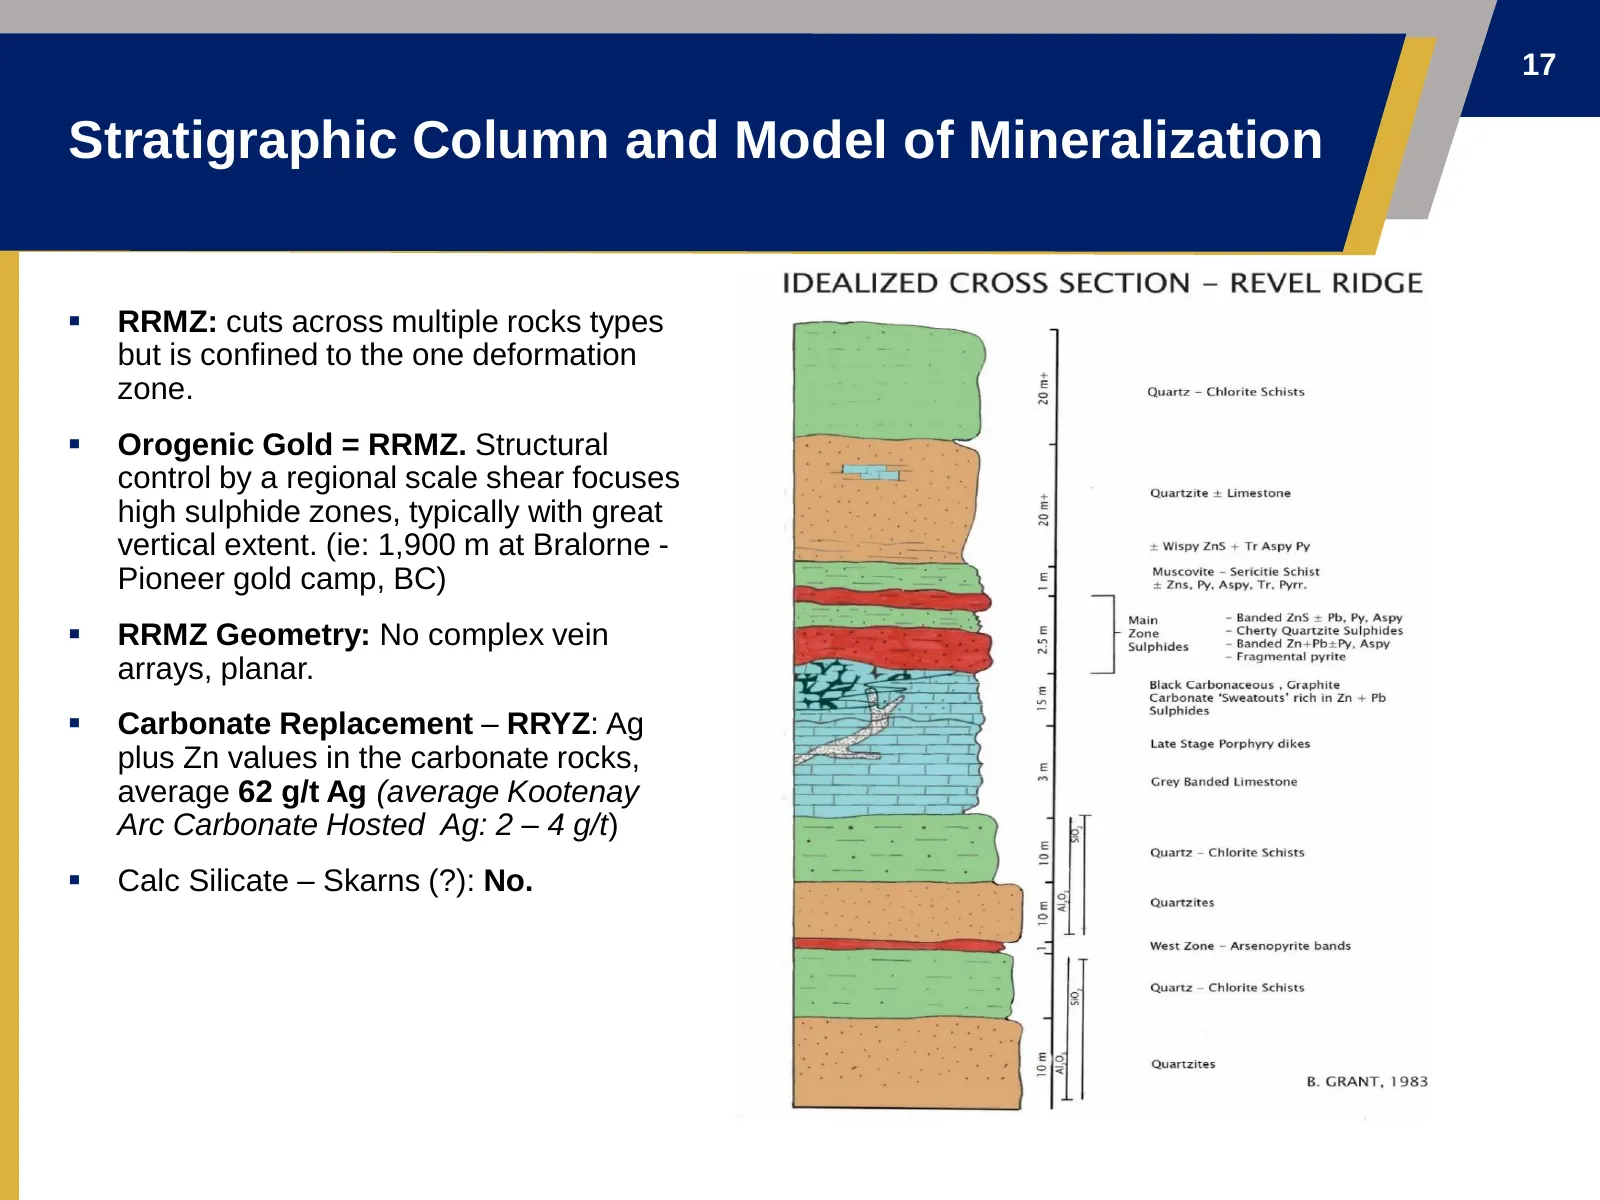
Slide 17: Stratigraphic Column and Model of Mineralization
17 Stratigraphic Column and Model of Mineralization ▪ RRMZ: cuts across multiple rocks types but is confined to the one deformation zone. ▪ Orogenic Gold = RRMZ. Structural control by a regional scale shear focuses high sulphide zones, typically with great vertical extent. (ie: 1,900 m at Bralorne -
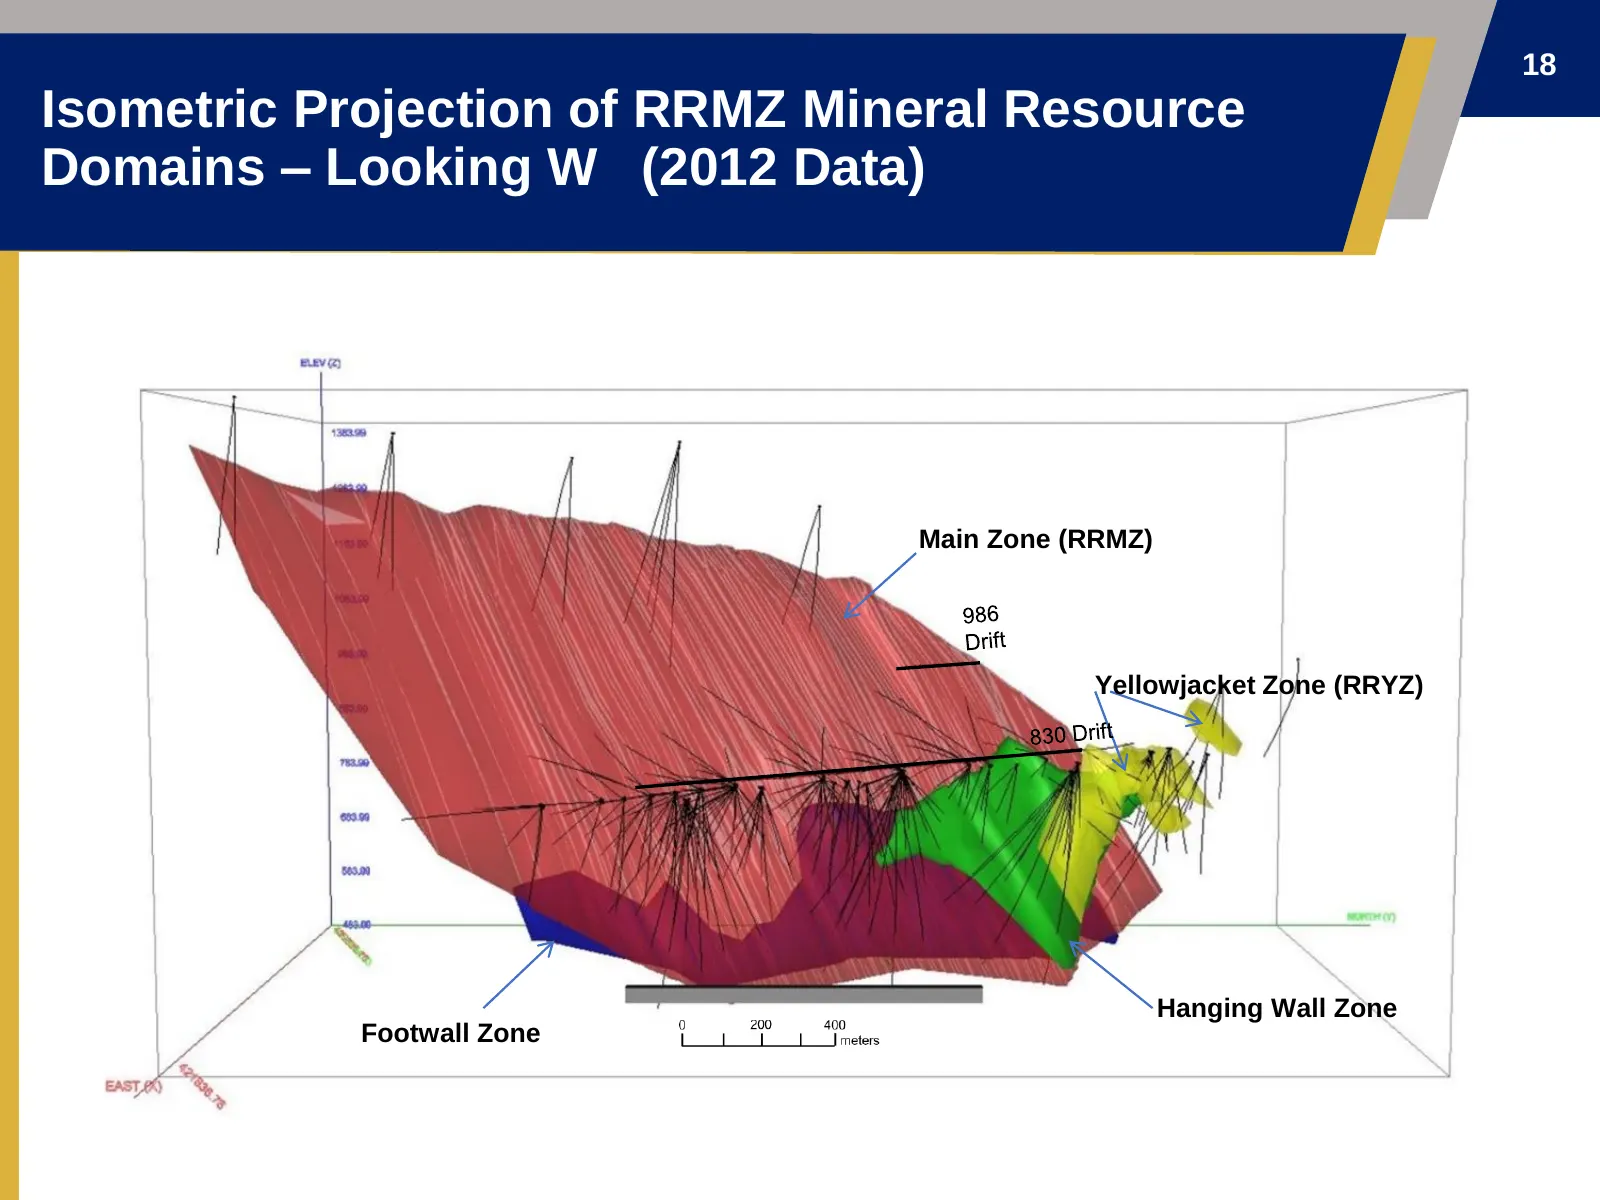
Slide 18: Isometric Projection of RRMZ Mineral Resource Domains
18 Isometric Projection of RRMZ Mineral Resource Domains – Looking W (2012 Data) Main Zone (RRMZ) Yellowjacket Zone (RRYZ) Hanging Wall Zone Footwall Zone
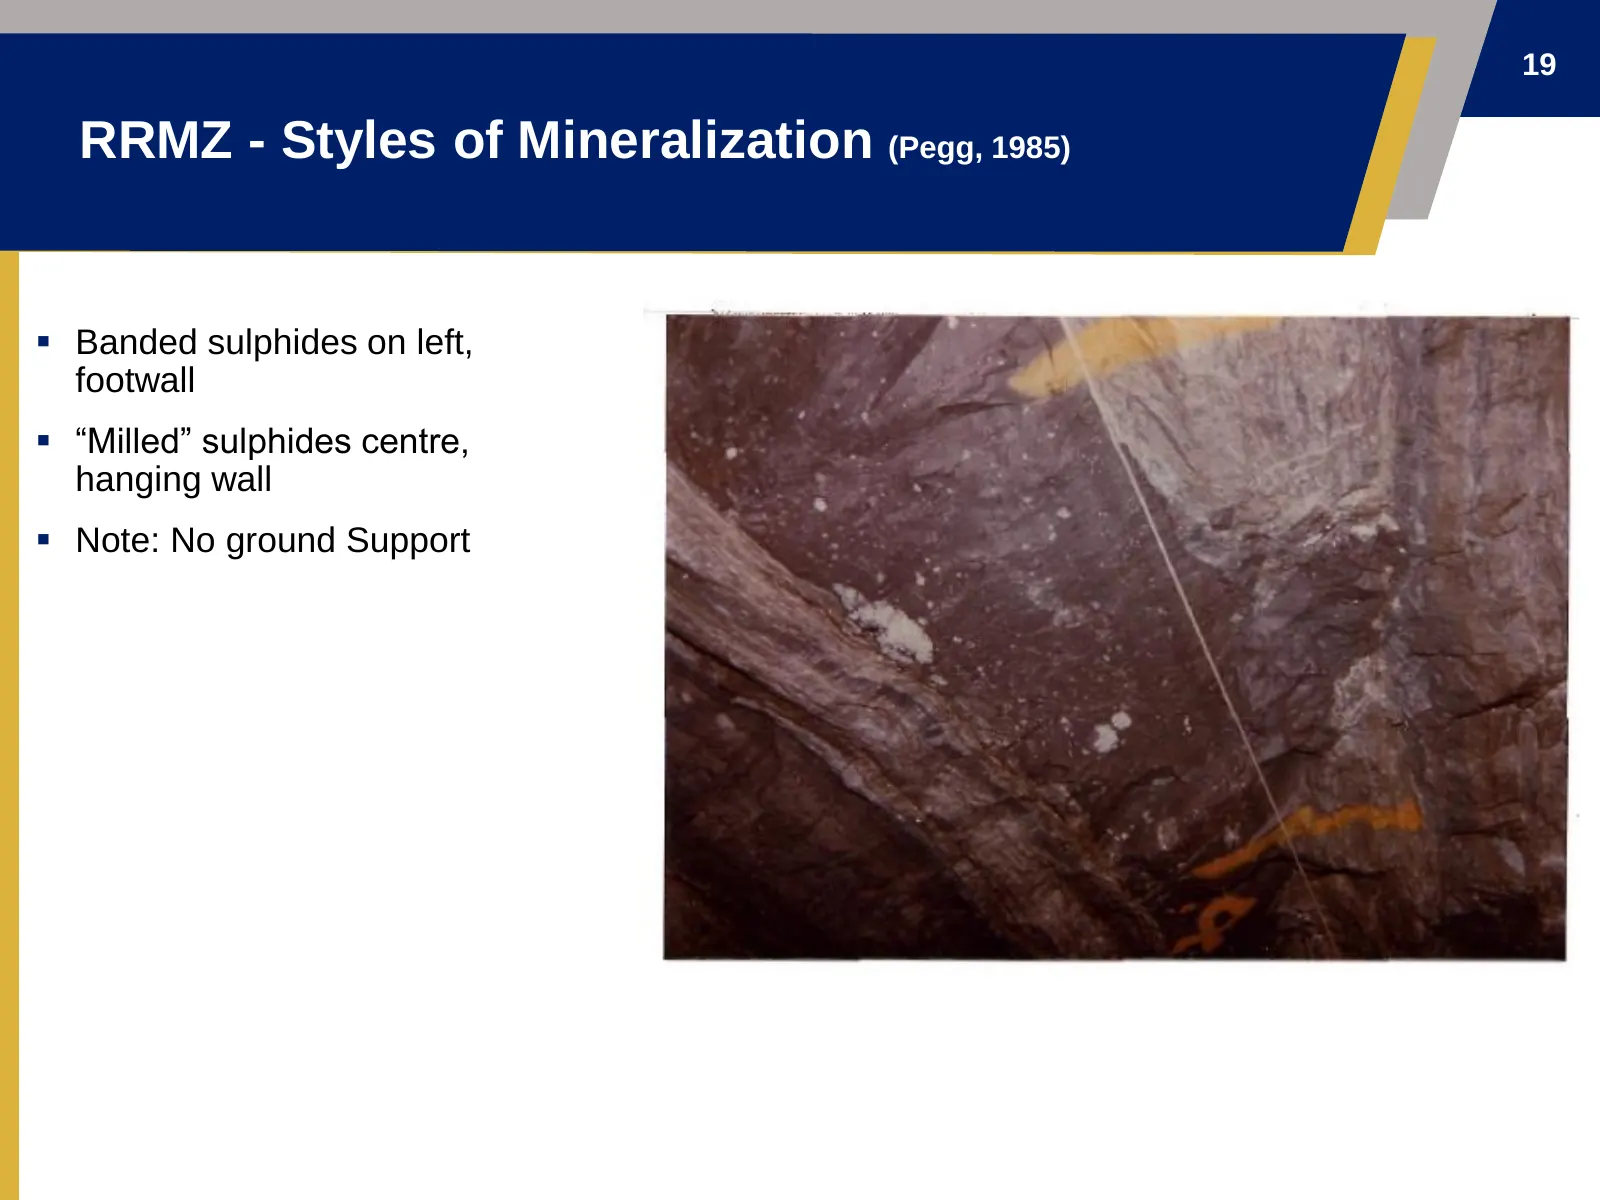
Slide 19: RRMZ - Styles of Mineralization (Pegg, 1985)
19 RRMZ - Styles of Mineralization (Pegg, 1985) ▪ Banded sulphides on left, footwall ▪ “Milled” sulphides centre, hanging wall ▪ Note: No ground Support
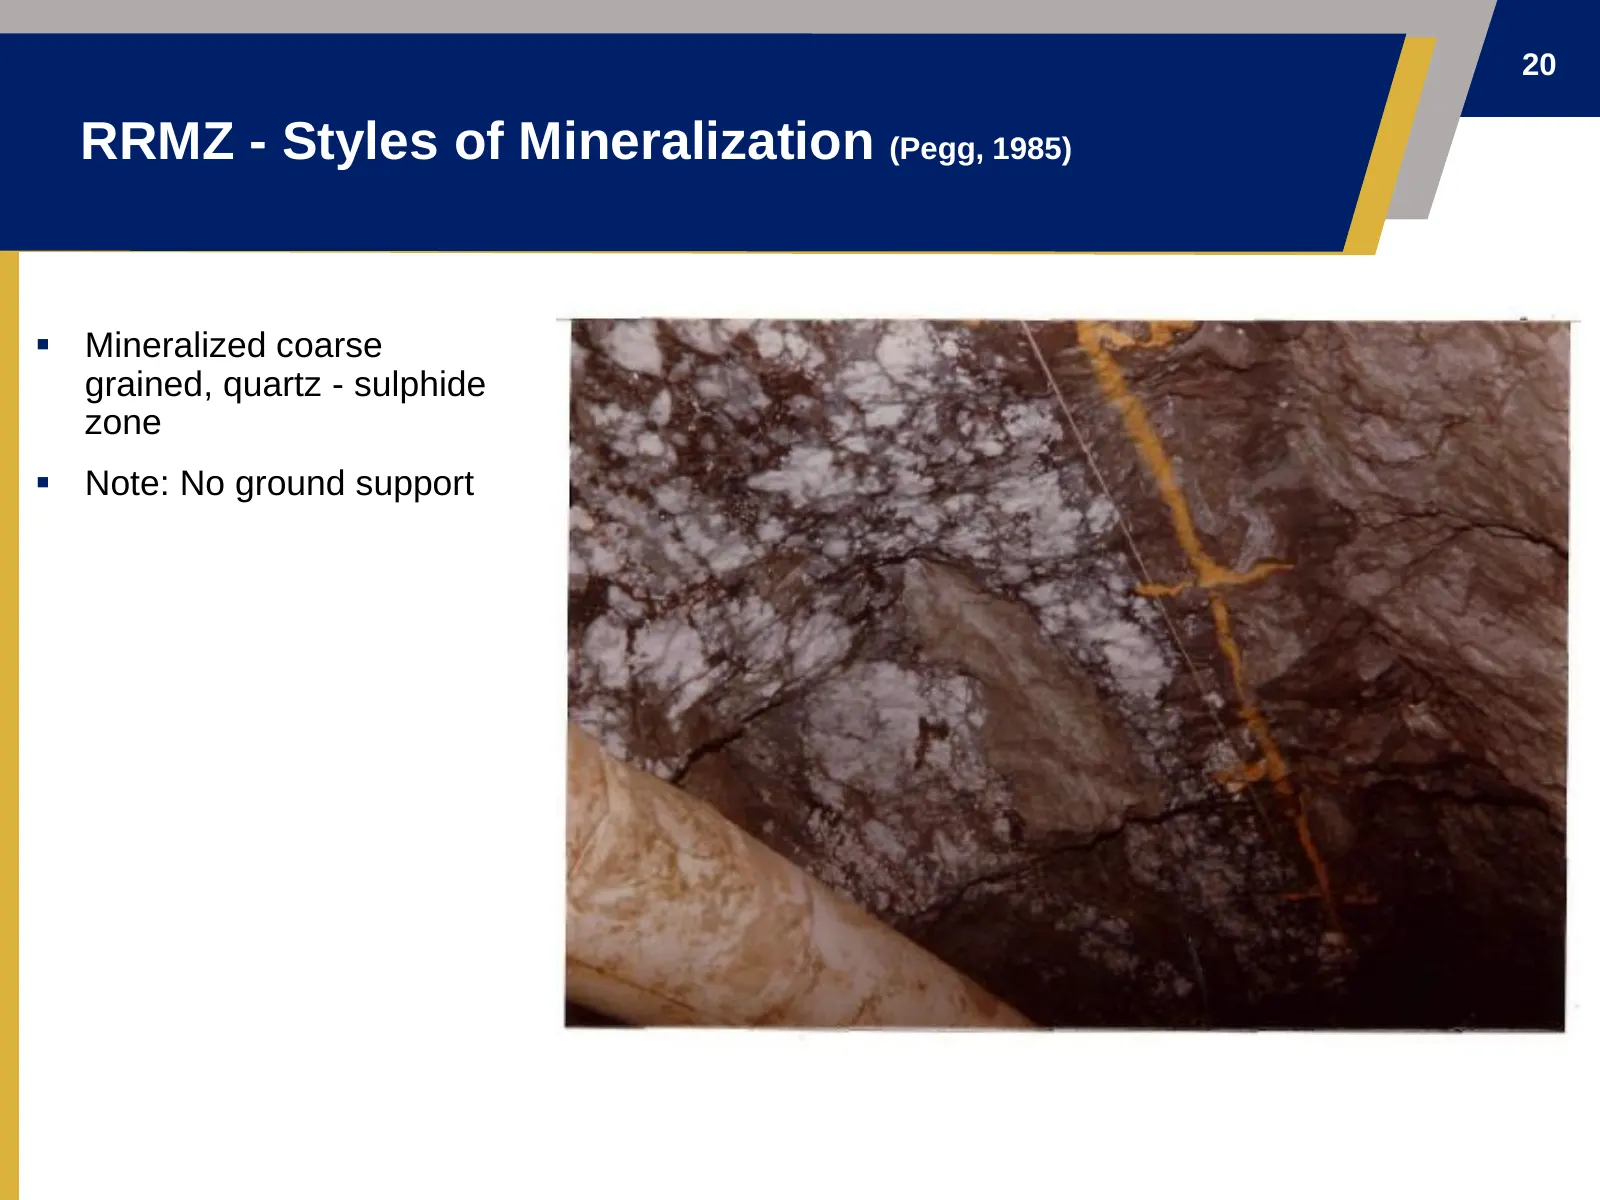
Slide 20: RRMZ - Styles of Mineralization (Pegg, 1985)
20 RRMZ - Styles of Mineralization (Pegg, 1985) ▪ Mineralized coarse grained, quartz - sulphide zone ▪ Note: No ground support
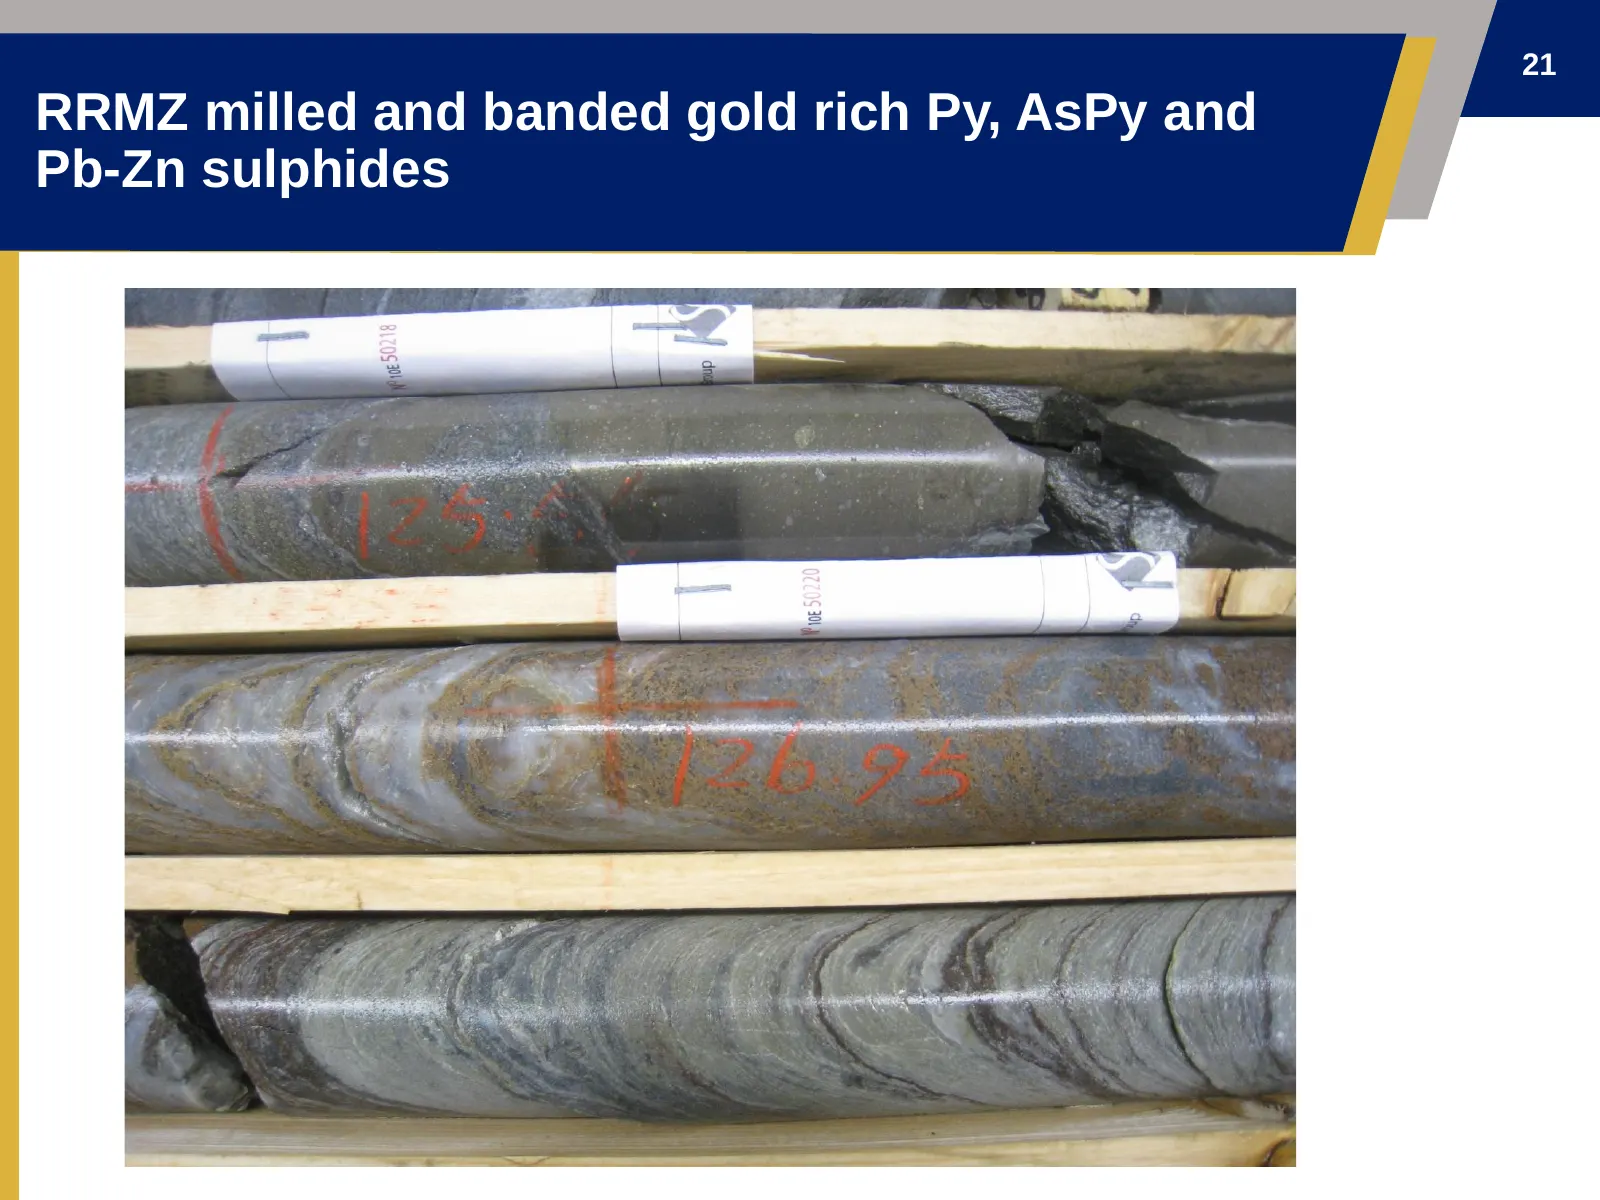
Slide 21: RRMZ milled and banded gold rich Py, AsPy and Pb-Zn sulphides
21 RRMZ milled and banded gold rich Py, AsPy and Pb-Zn sulphides
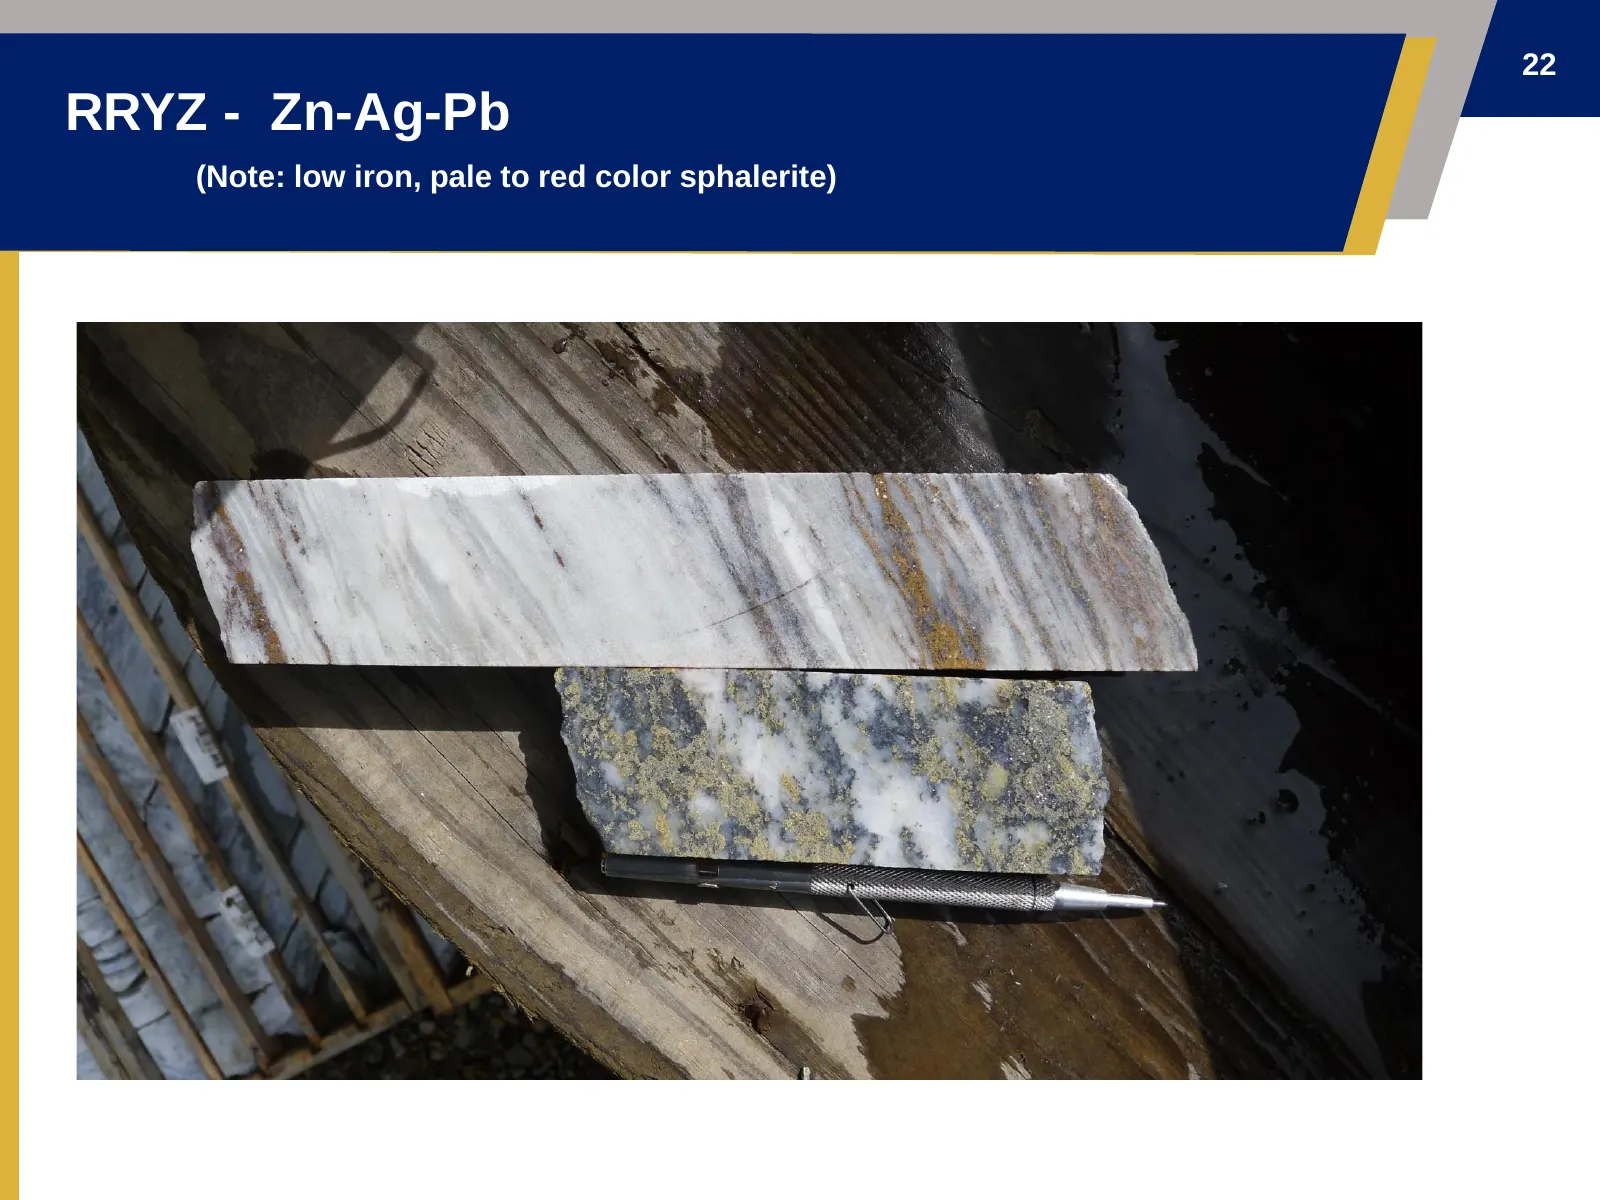
Slide 22: RRYZ - Zn-Ag-Pb
22 RRYZ - Zn-Ag-Pb (Note: low iron, pale to red color sphalerite)
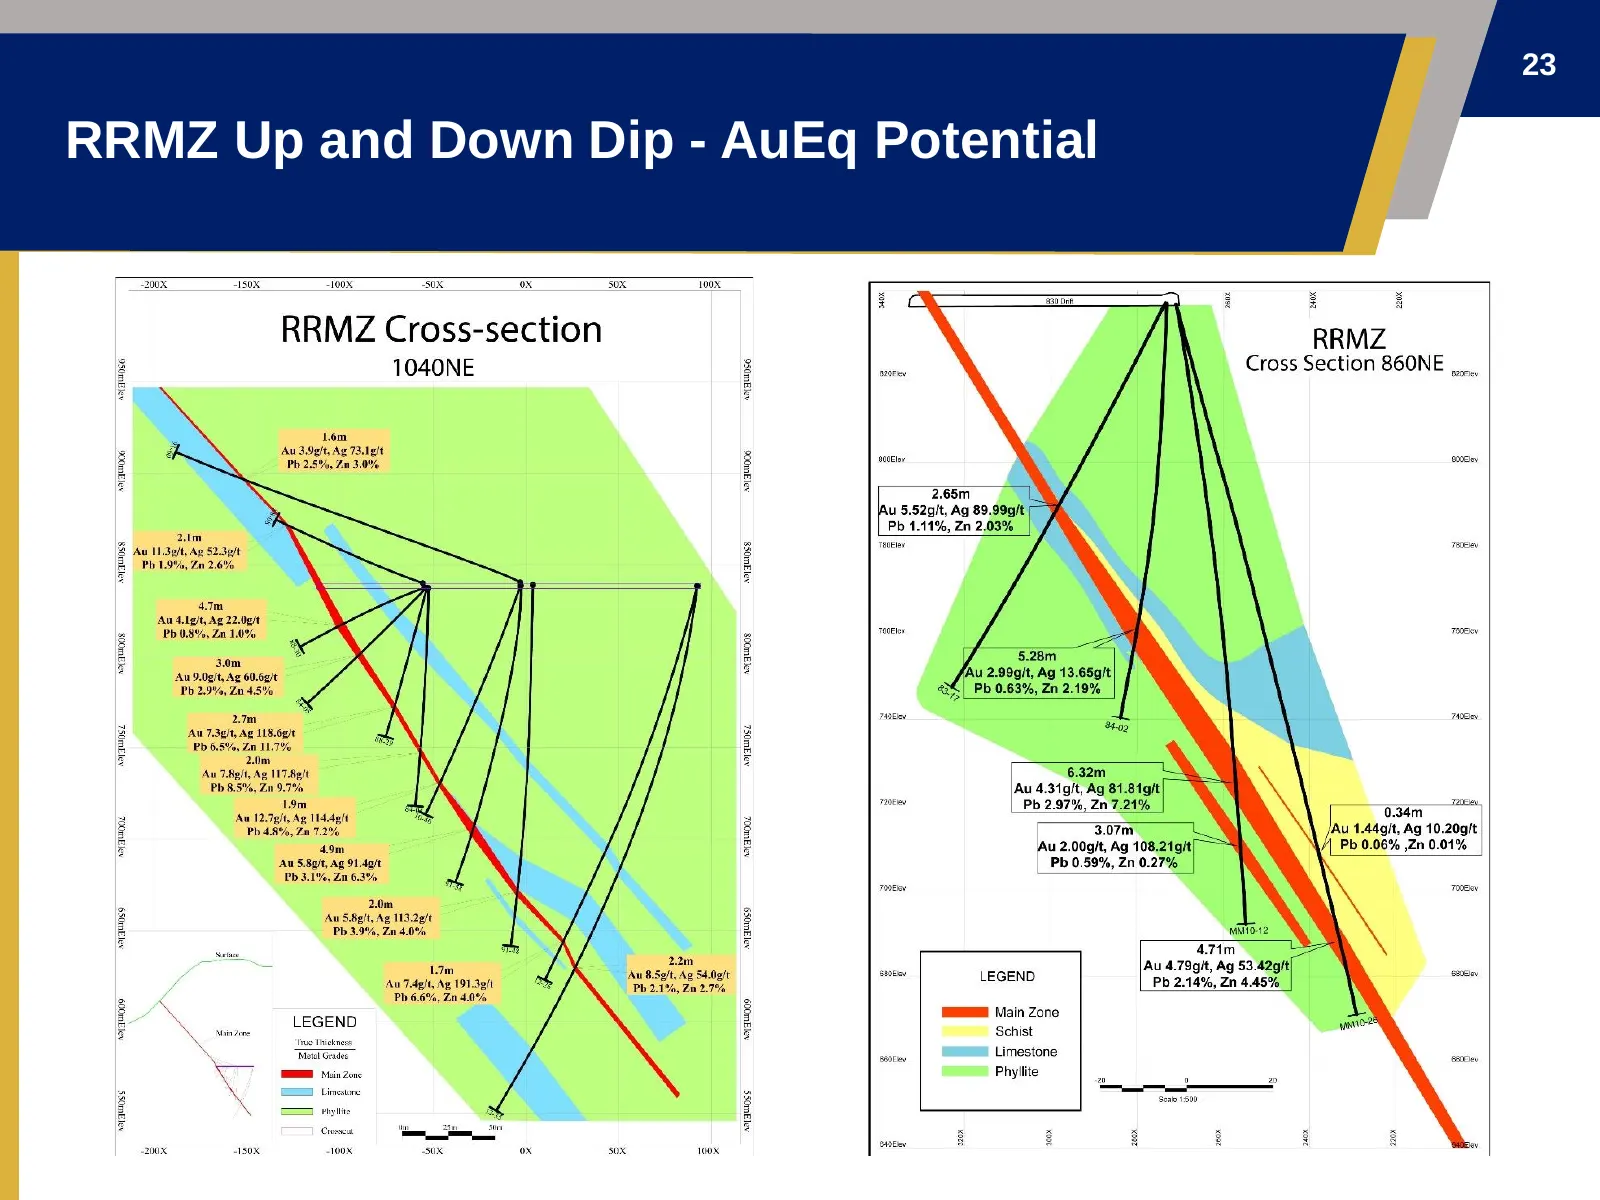
Slide 23: RRMZ Up and Down Dip - AuEq Potential
23 RRMZ Up and Down Dip - AuEq Potential
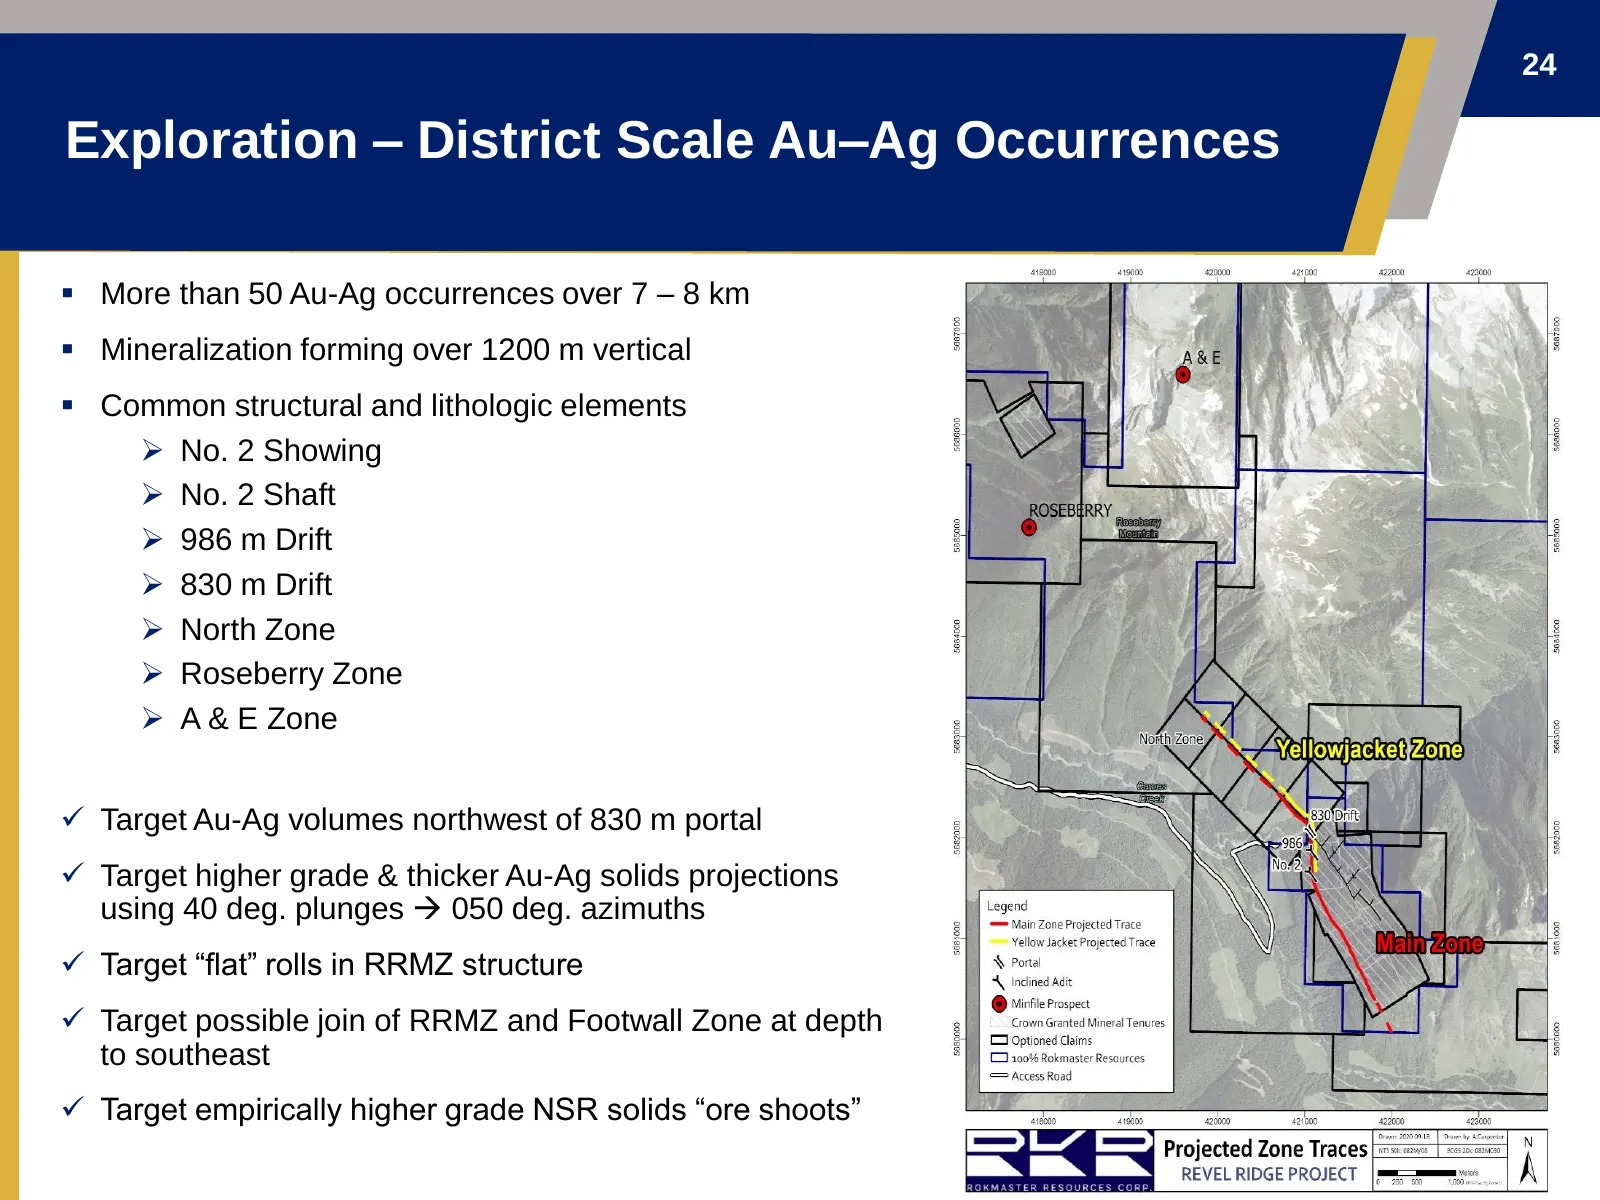
Slide 24: Exploration – District Scale Au–Ag Occurrences
24 Exploration – District Scale Au–Ag Occurrences ▪ More than 50 Au-Ag occurrences over 7 – 8 km ▪ Mineralization forming over 1200 m vertical ▪ Common structural and lithologic elements ➢ No. 2 Showing ➢ No. 2 Shaft ➢ 986 m Drift ➢ 830 m Drift ➢ North Zone ➢ Roseberry Zone ➢ A & E Zone ✓ Target Au-
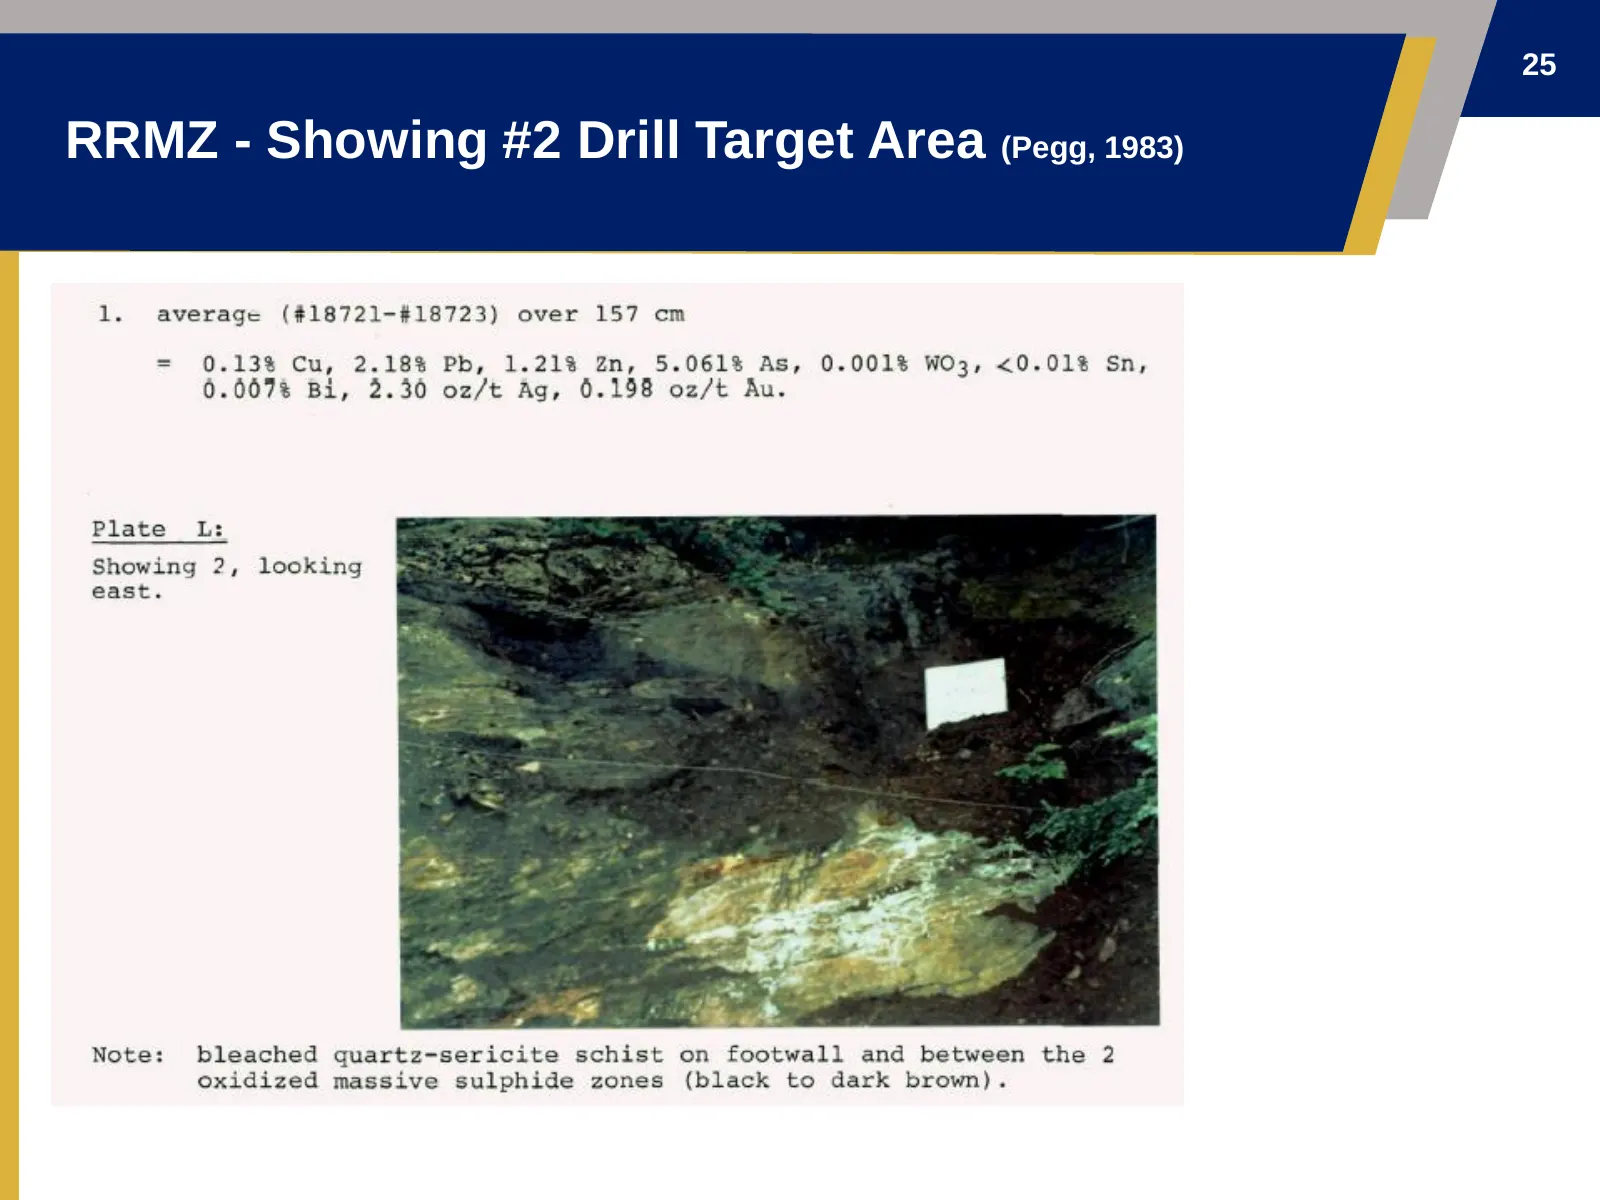
Slide 25: RRMZ - Showing #2 Drill Target Area (Pegg, 1983)
25 RRMZ - Showing #2 Drill Target Area (Pegg, 1983)
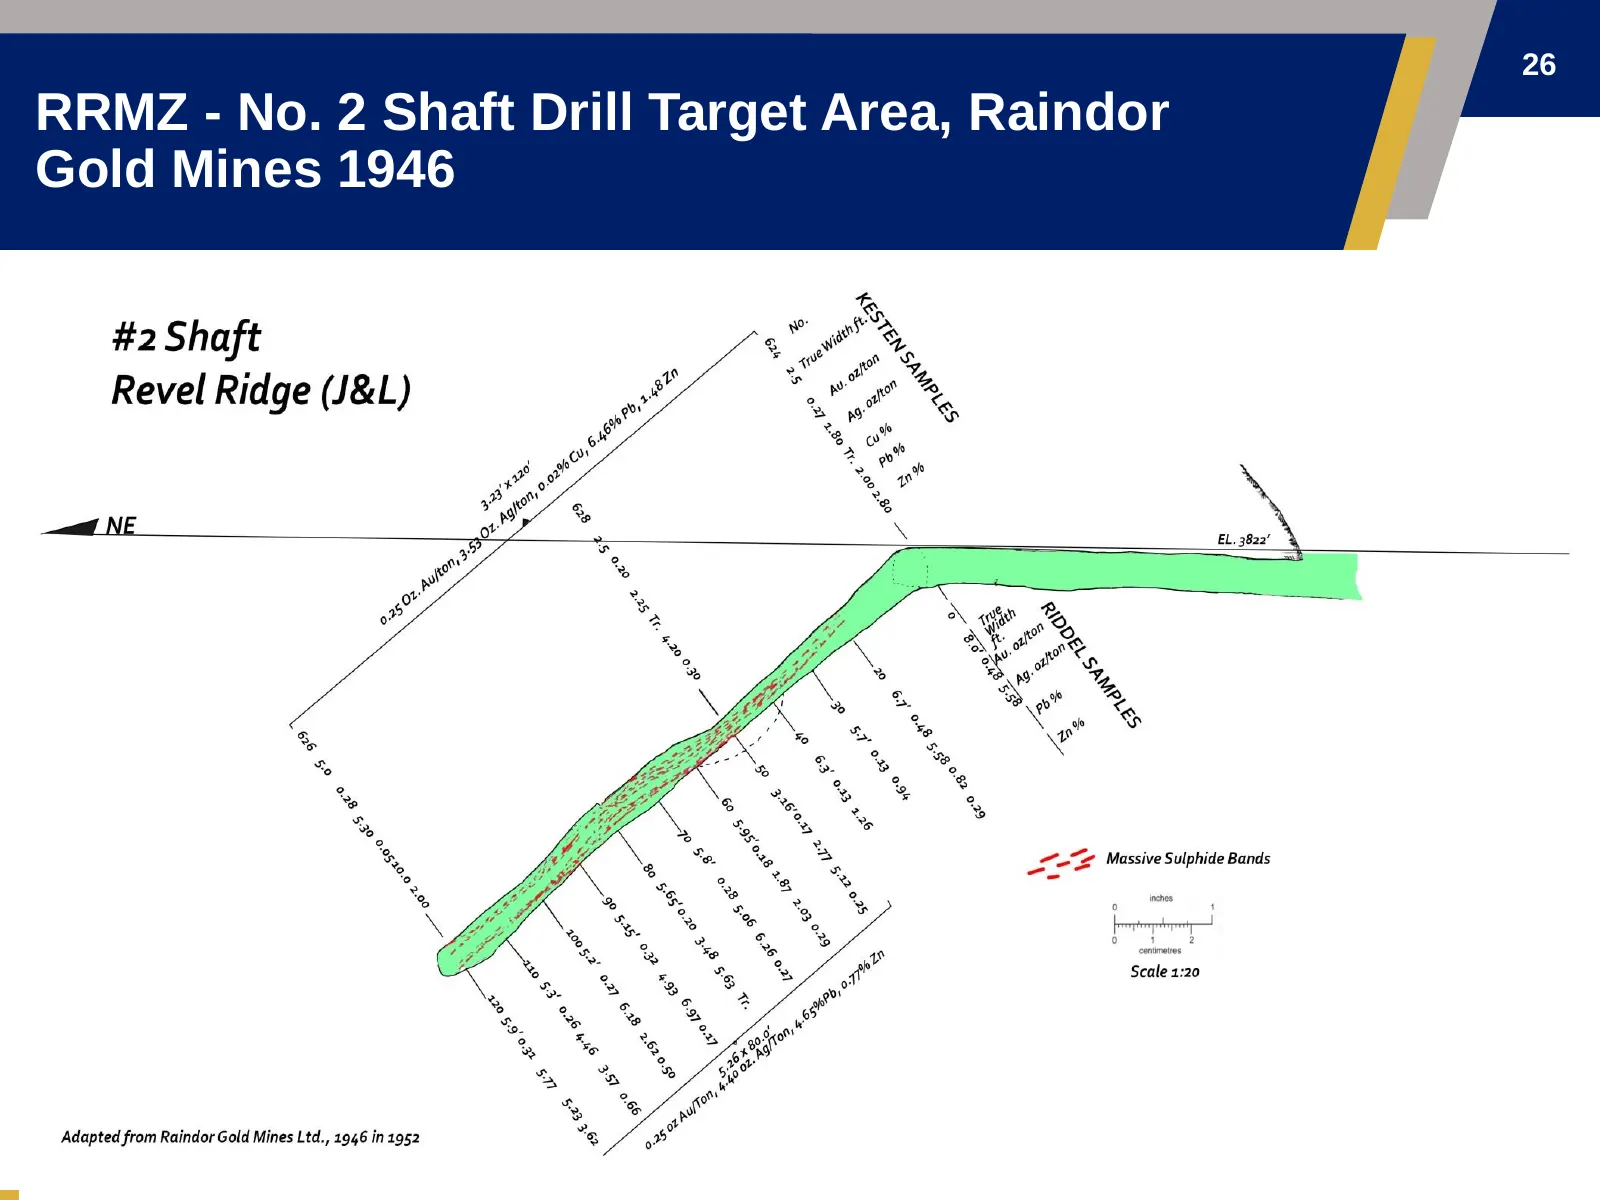
Slide 26: RRMZ - No. 2 Shaft Drill Target Area, Raindor Gold Mines 1946
26 RRMZ - No. 2 Shaft Drill Target Area, Raindor Gold Mines 1946
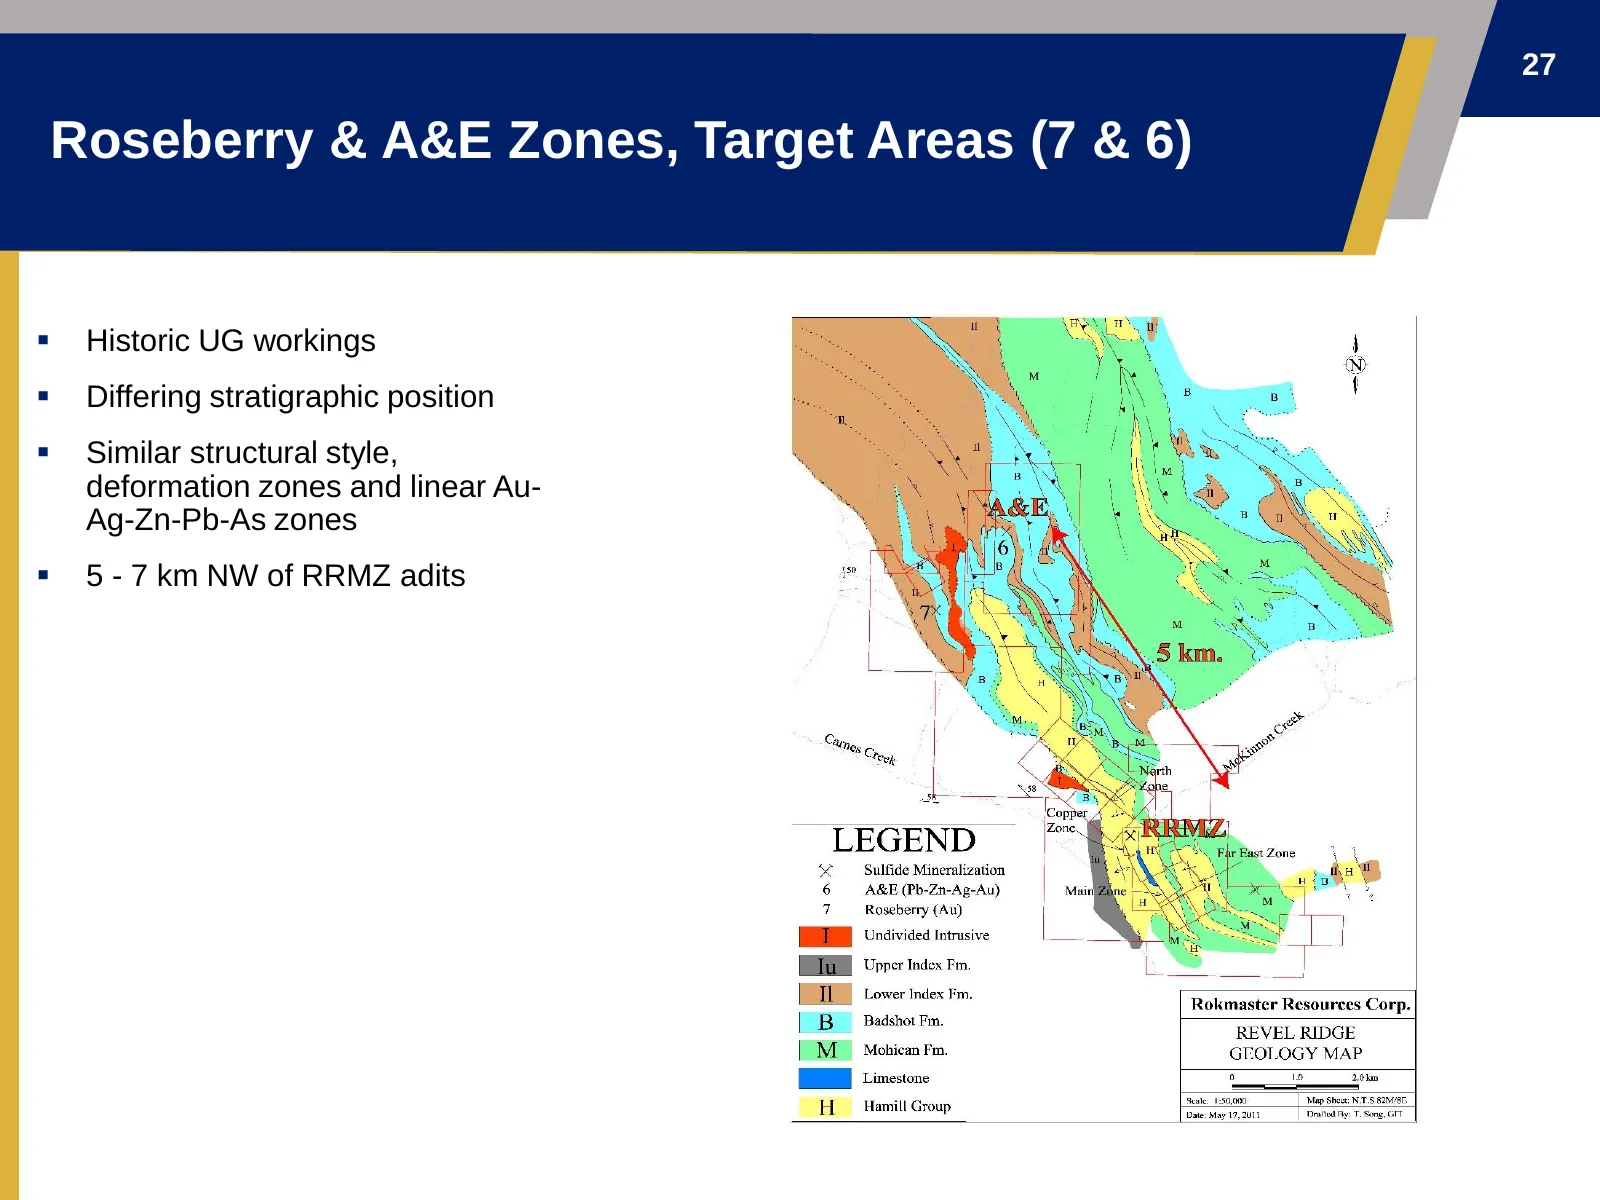
Slide 27: Roseberry & A&E Zones, Target Areas (7 & 6)
27 Roseberry & A&E Zones, Target Areas (7 & 6) ▪ Historic UG workings ▪ Differing stratigraphic position ▪ Similar structural style, deformation zones and linear Au- Ag-Zn-Pb-As zones ▪ 5 - 7 km NW of RRMZ adits
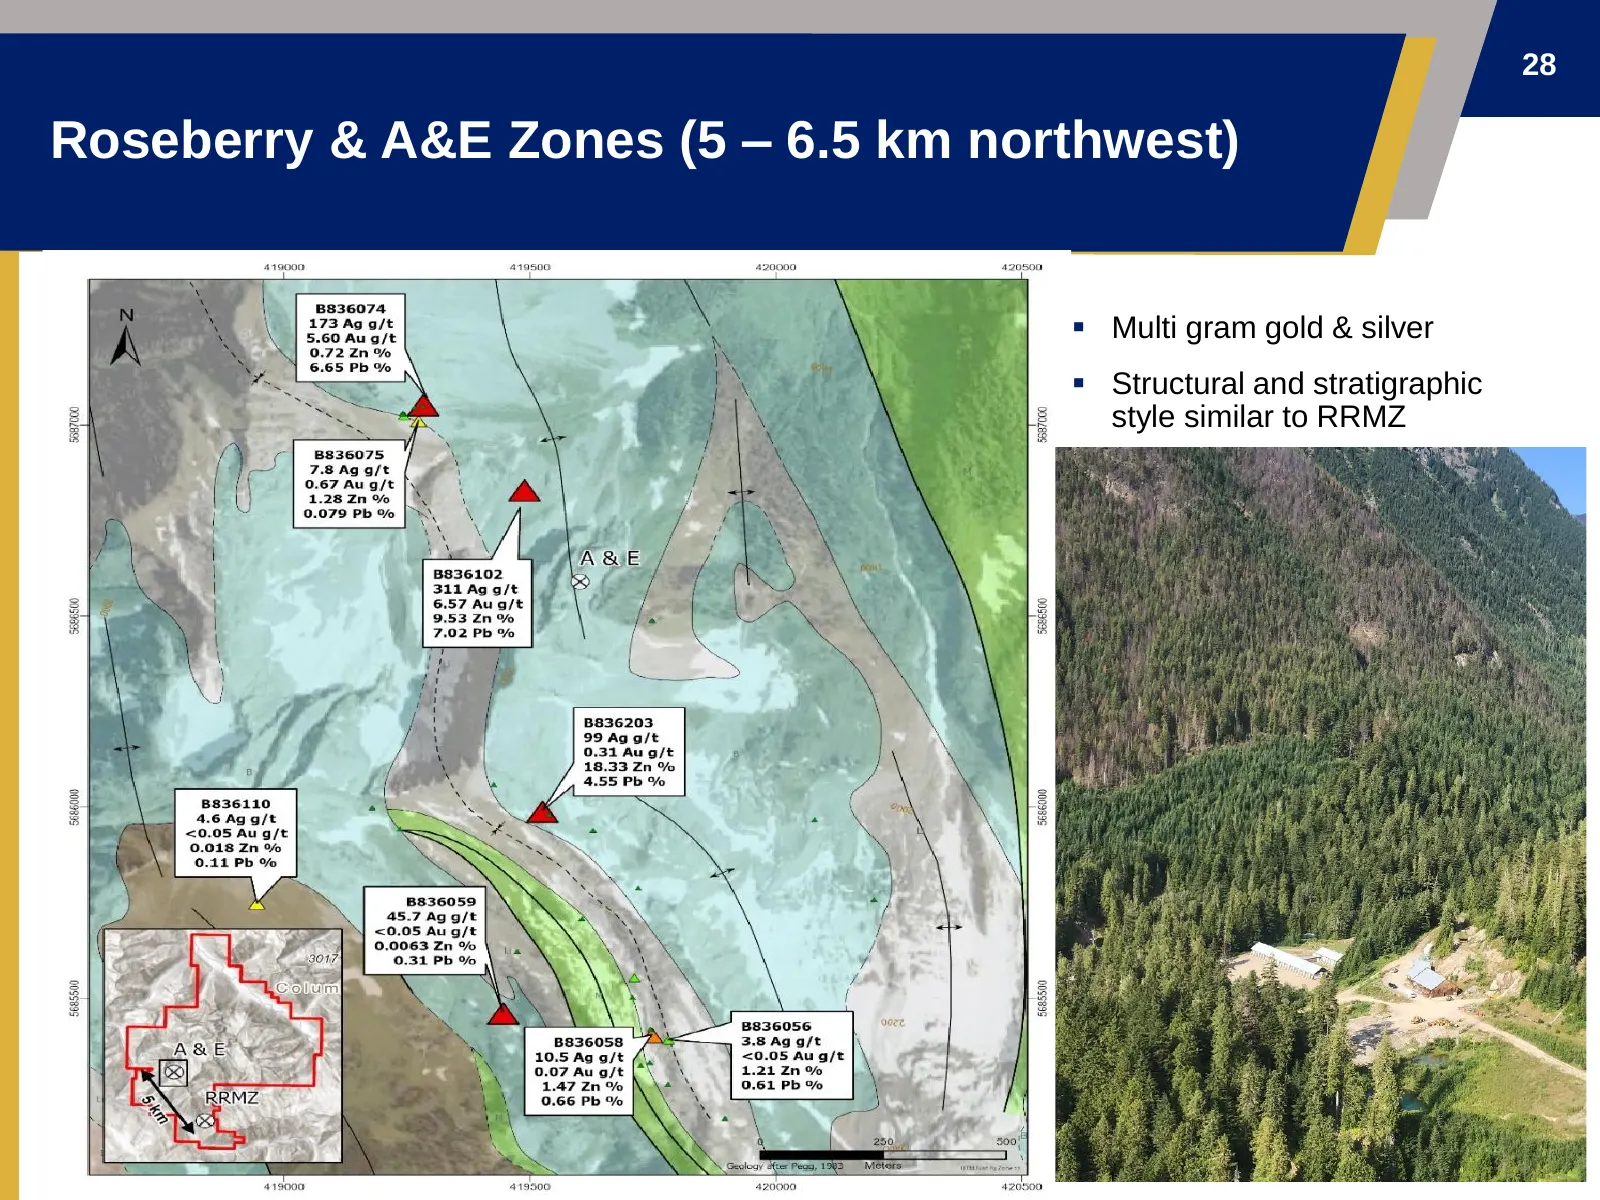
Slide 28: Roseberry & A&E Zones (5 – 6.5 km northwest)
28 Roseberry & A&E Zones (5 – 6.5 km northwest) ▪ Multi gram gold & silver ▪ Structural and stratigraphic style similar to RRMZ
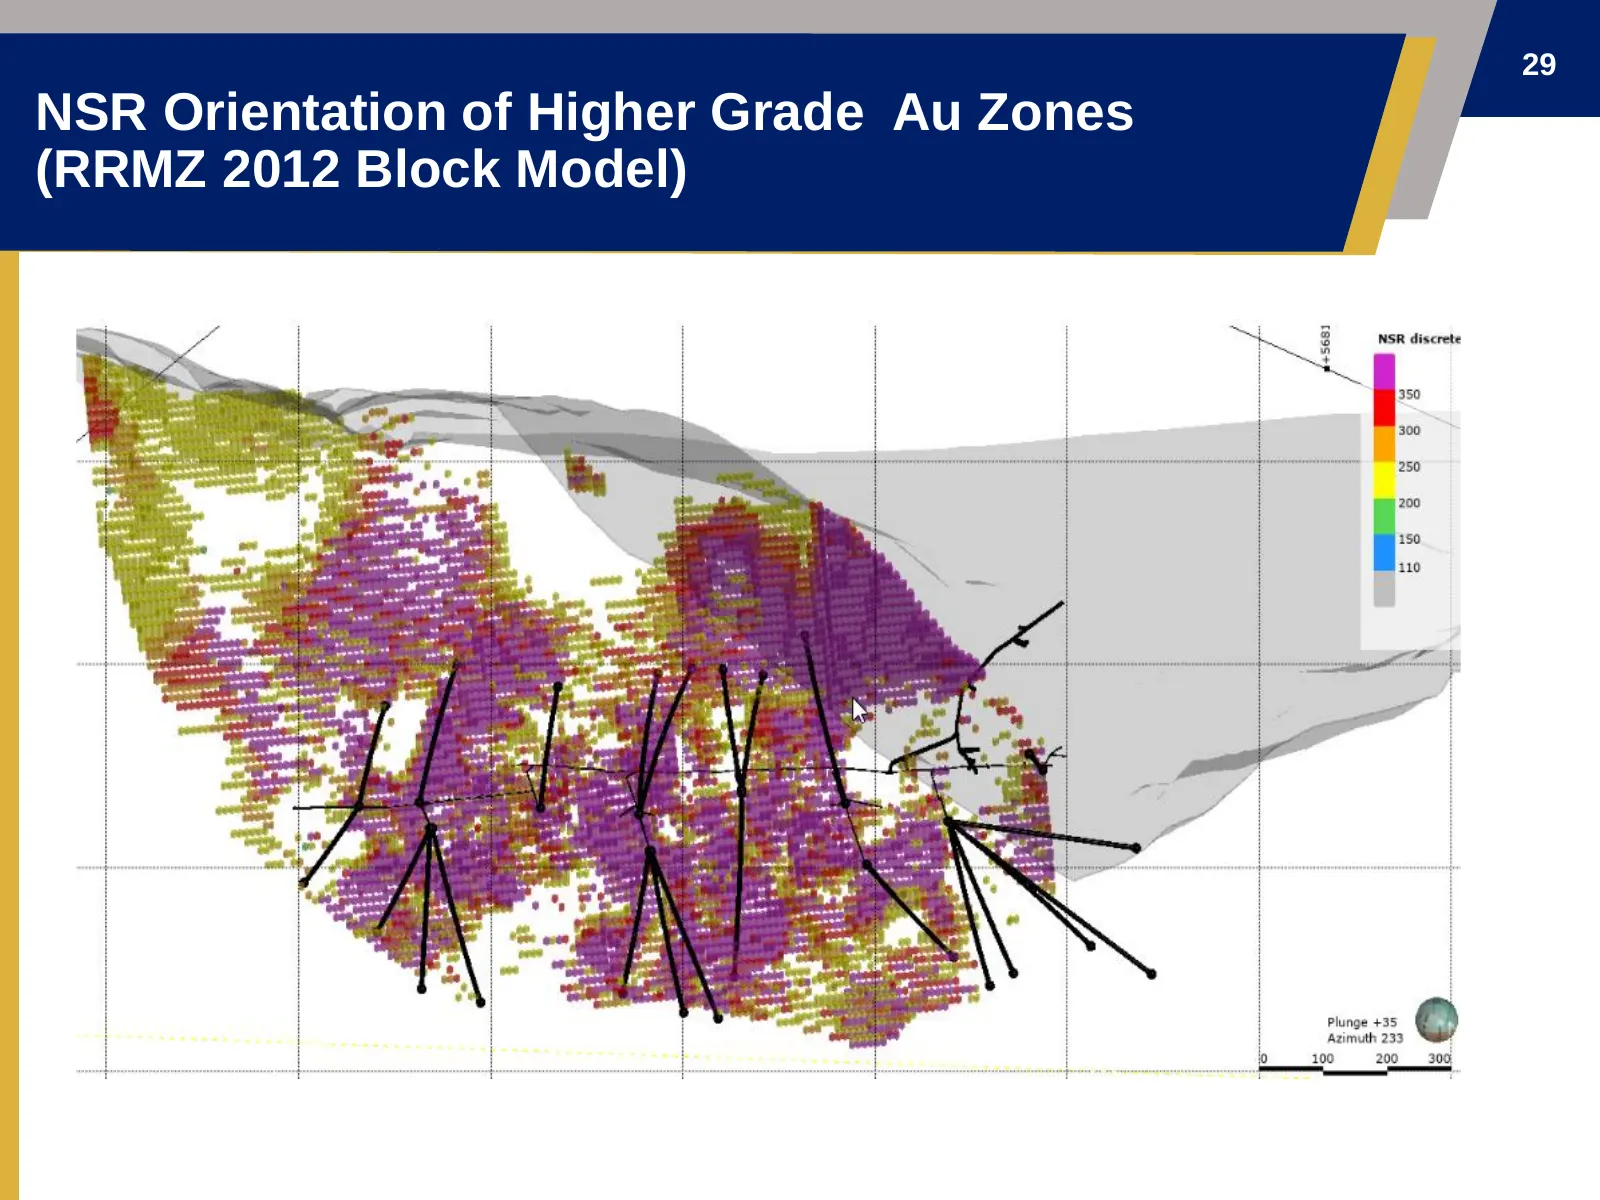
Slide 29: NSR Orientation of Higher Grade Au Zones (RRMZ 2012 Block Model)
29 NSR Orientation of Higher Grade Au Zones (RRMZ 2012 Block Model)
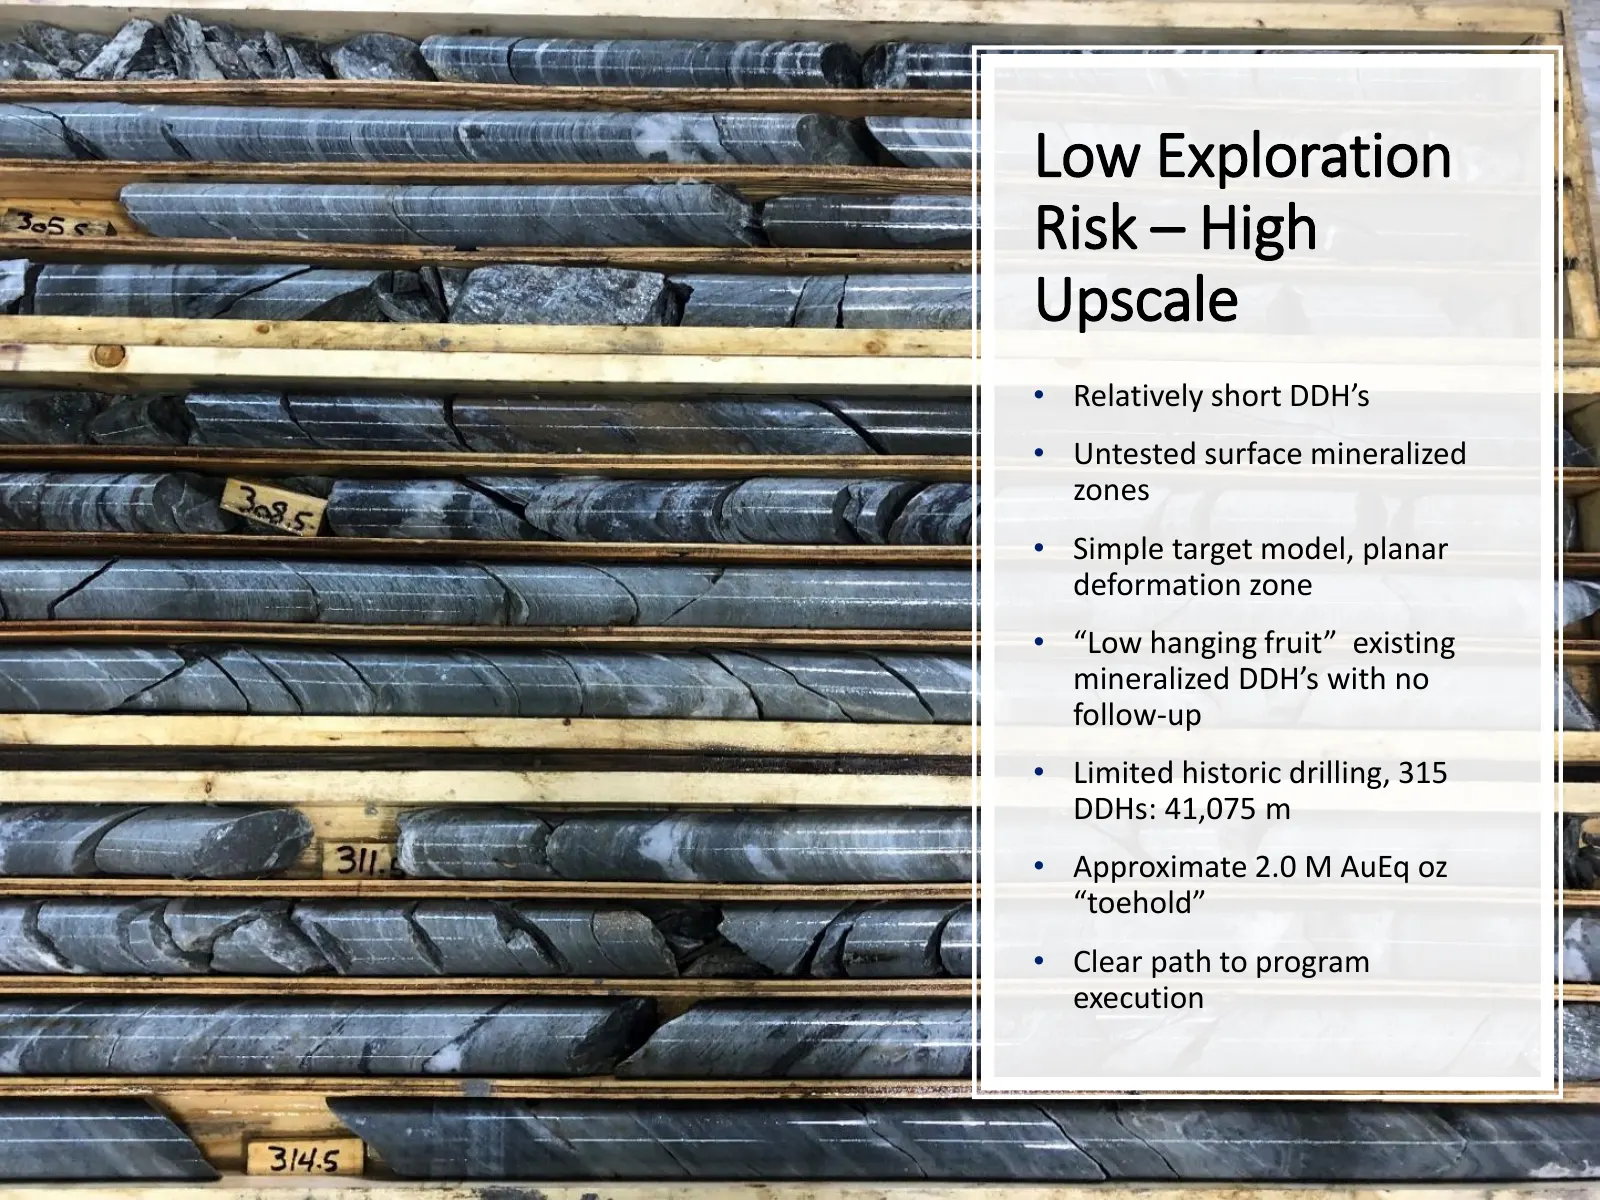
Slide 30: Low Exploration Risk – High Upscale
30 Low Exploration Risk – High Upscale • Relatively short DDH’s • Untested surface mineralized zones • Simple target model, planar deformation zone • “Low hanging fruit” existing mineralized DDH’s with no follow-up • Limited historic drilling, 315 DDHs: 41,075 m • Approximate 2.0 M AuEq oz “toehold”
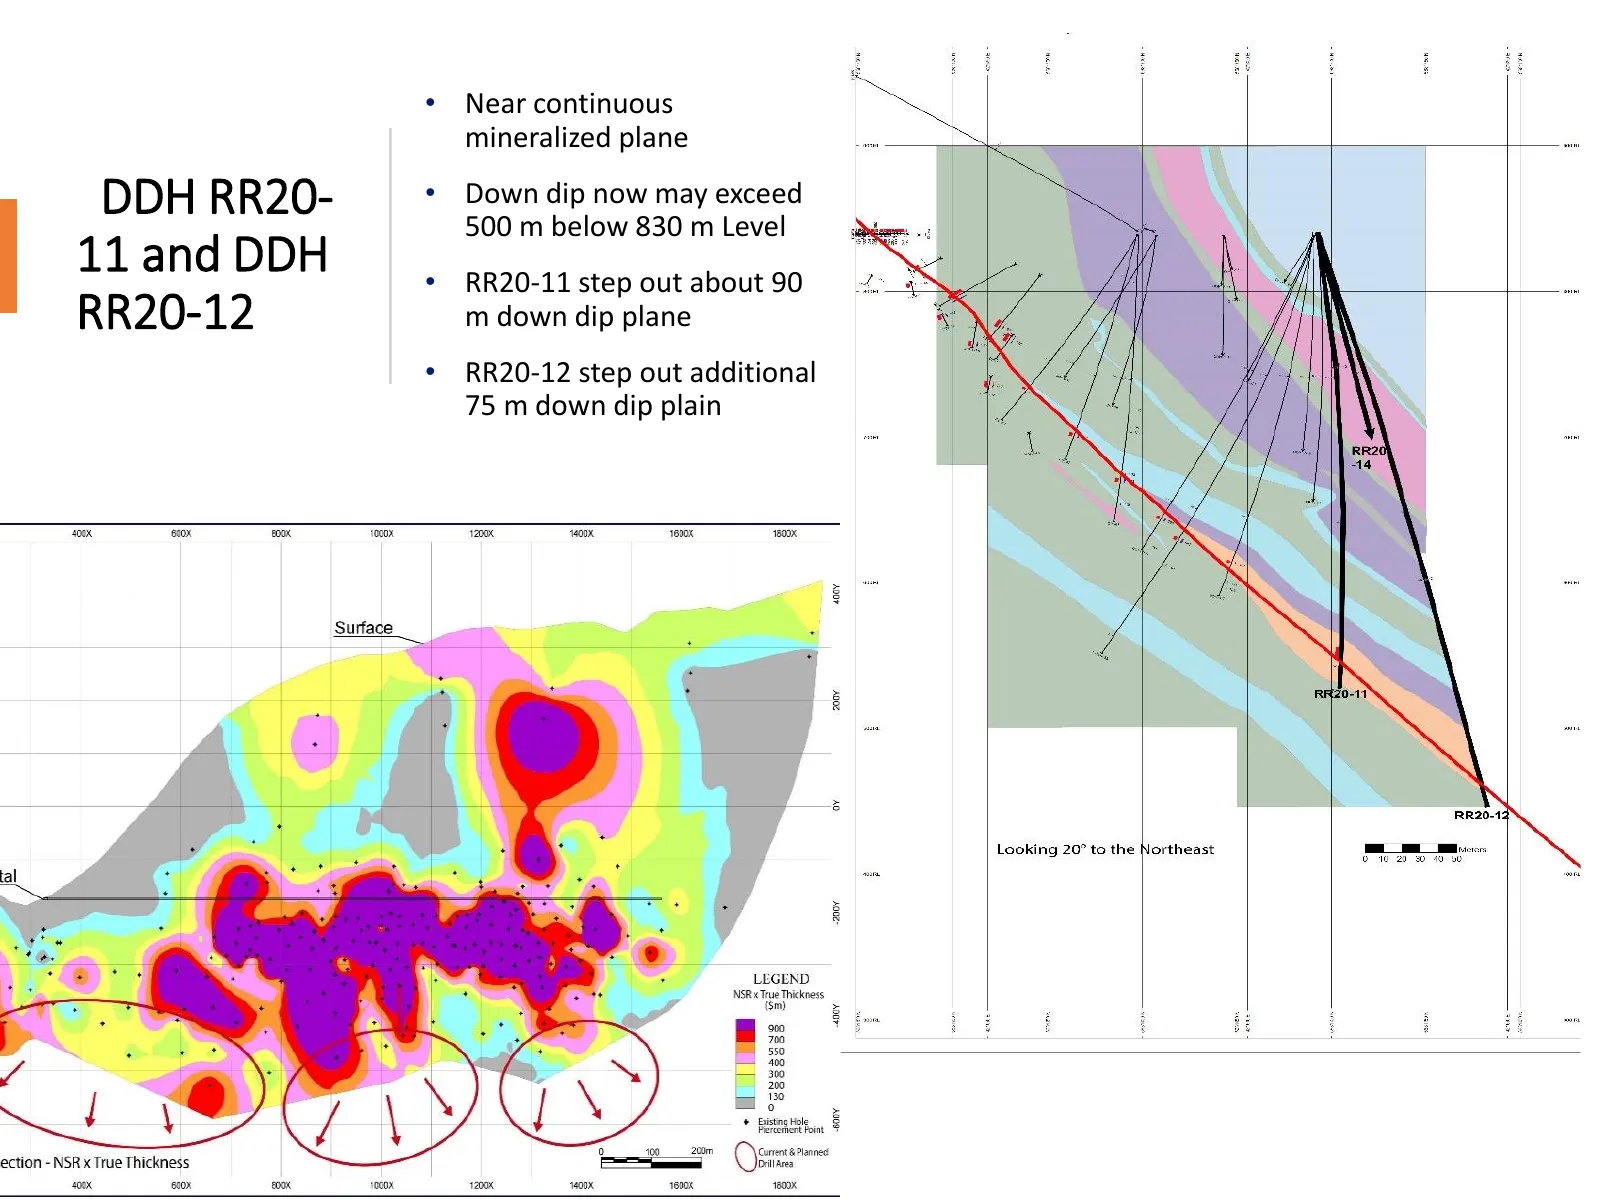
Slide 31: DDH RR20-11 and DDH RR20-12
31 • Near continuous mineralized plane DDH RR20- • Down dip now may exceed 500 m below 830 m Level 11 and DDH • RR20-11 step out about 90 RR20-12 m down dip plane • RR20-12 step out additional 75 m down dip plain
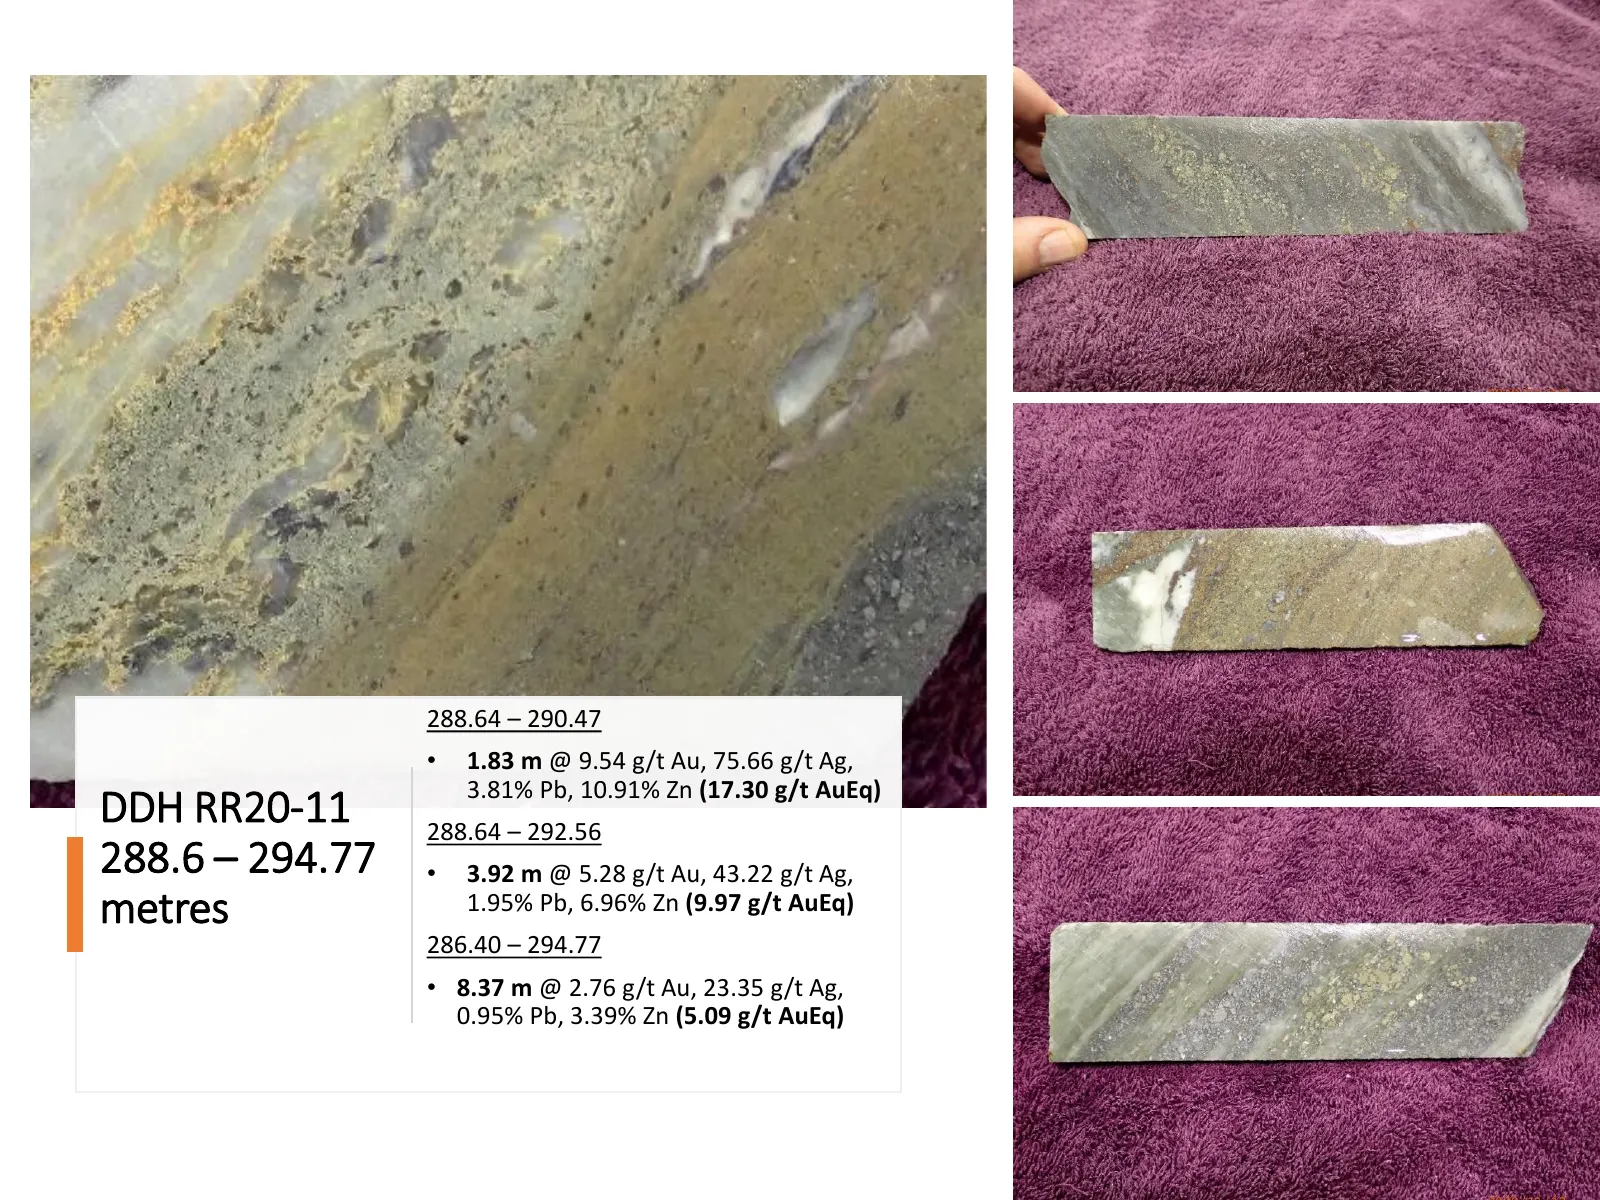
Slide 32: DDH RR20-11 intercepts
32 288.64 – 290.47 • 1.83 m @ 9.54 g/t Au, 75.66 g/t Ag, 3.81% Pb, 10.91% Zn (17.30 g/t AuEq) DDH RR20-11 288.64 – 292.56 288.6 – 294.77 • 3.92 m @ 5.28 g/t Au, 43.22 g/t Ag, metres 1.95% Pb, 6.96% Zn (9.97 g/t AuEq) 286.40 – 294.77 • 8.37 m @ 2.76 g/t Au, 23.35 g/t Ag, 0.95% Pb, 3.39% Zn (5.09 g/t
Slide 33: DDH RR20-12 340 & 340.7 m
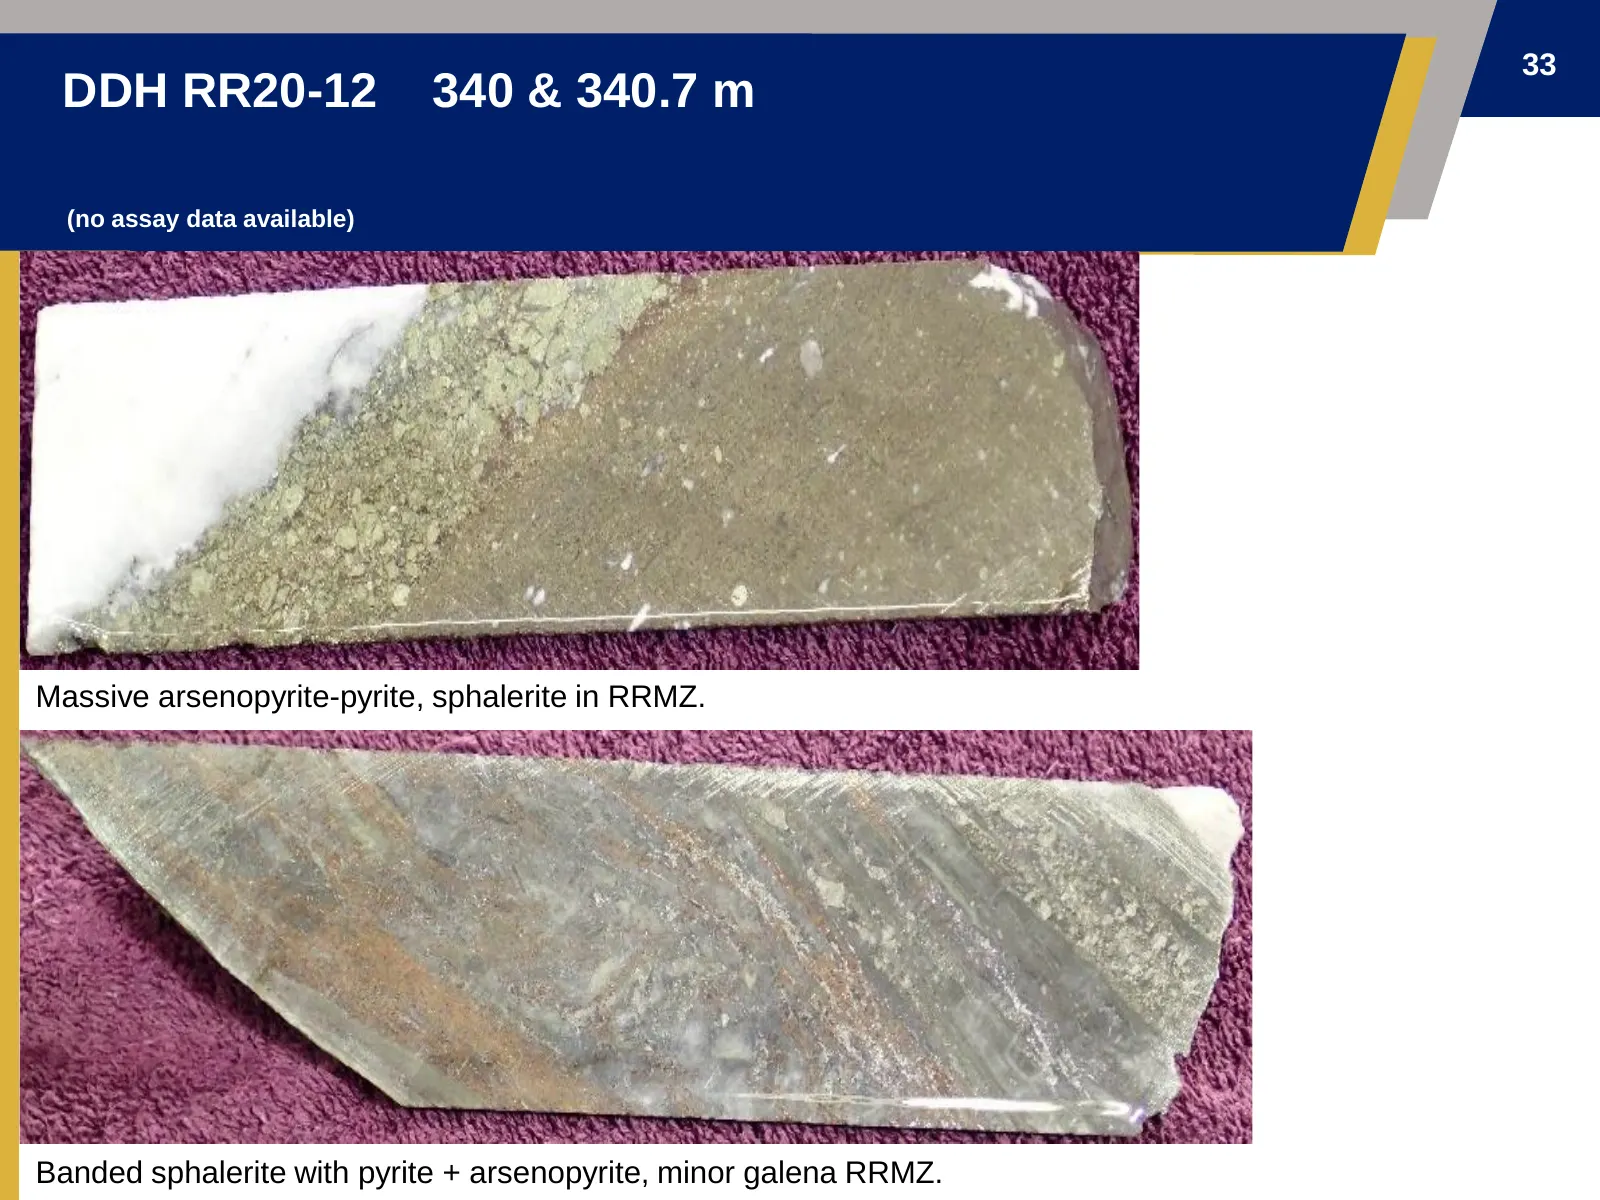
33 DDH RR20-12 340 & 340.7 m (no assay data available) Massive arsenopyrite-pyrite, sphalerite in RRMZ. Banded sphalerite with pyrite + arsenopyrite, minor galena RRMZ.
Slide 34: DDH RR20-14
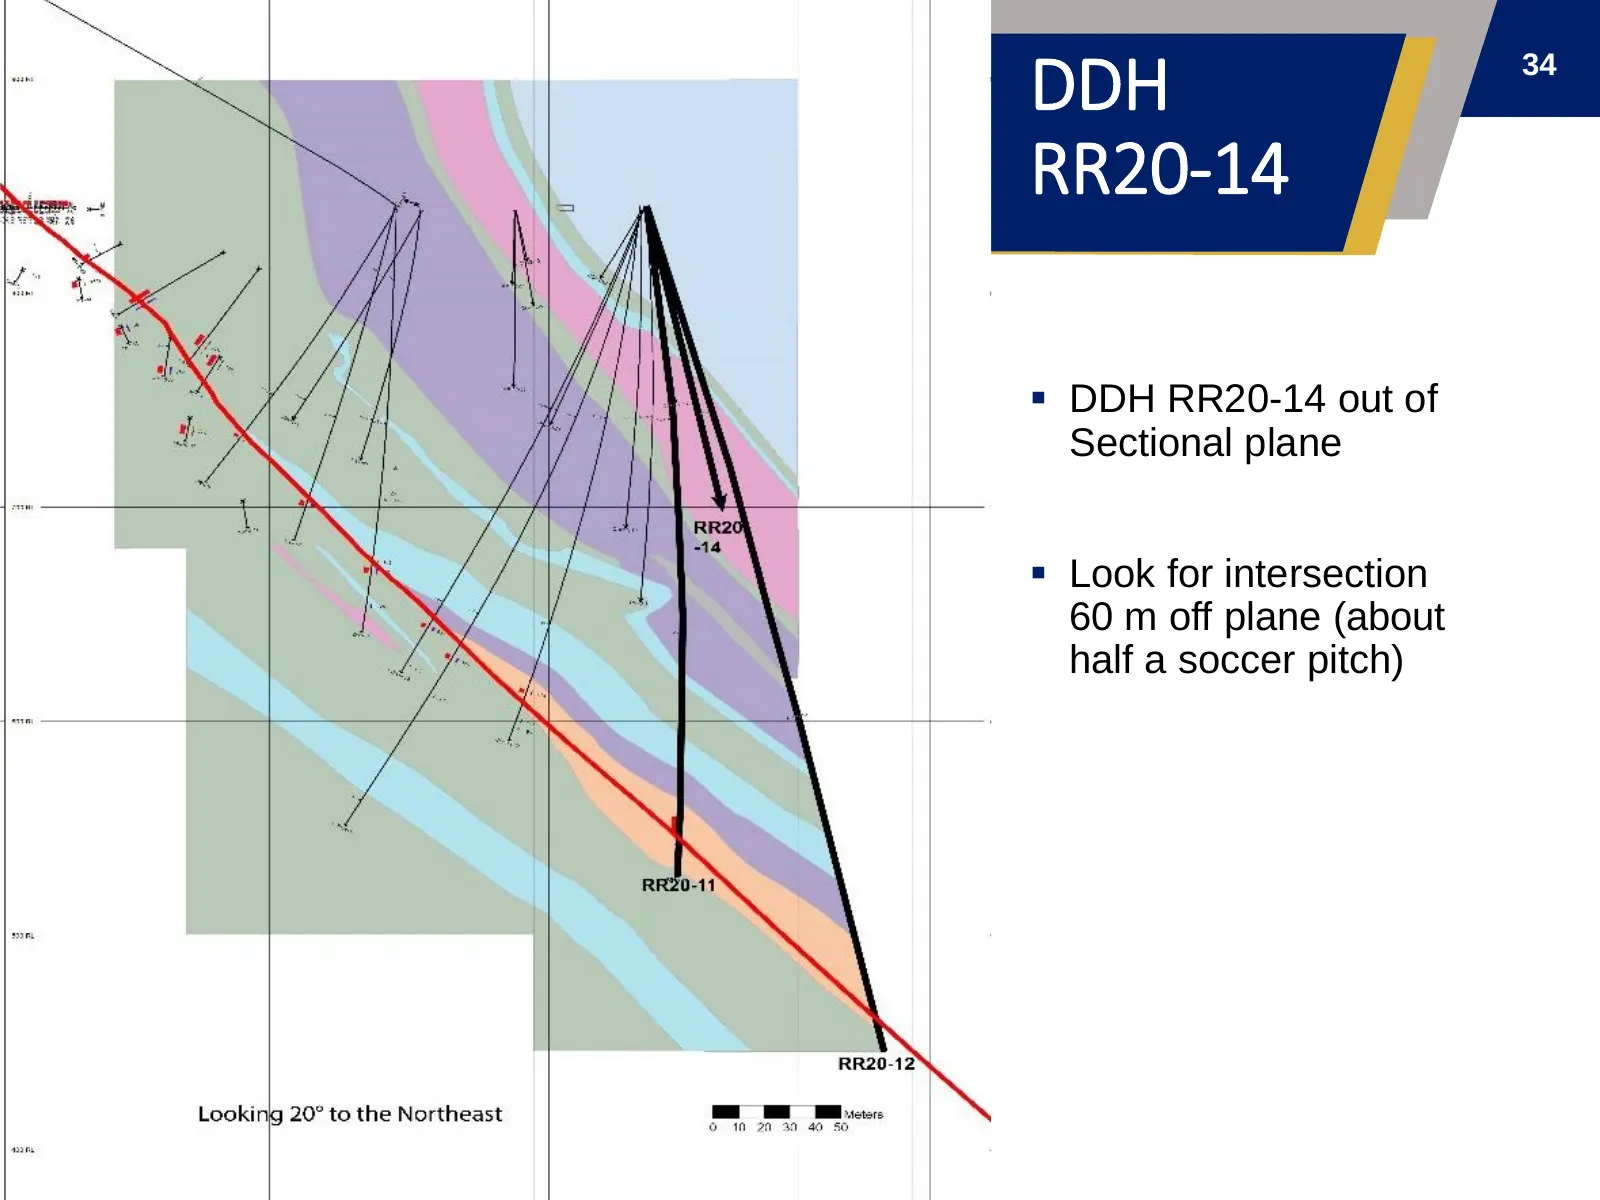
DDH 34 RR20-14 ▪ DDH RR20-14 out of Sectional plane ▪ Look for intersection 60 m off plane (about half a soccer pitch)
Slide 35: RR20-14 @ 306 & 307.75 m (no assay data available)
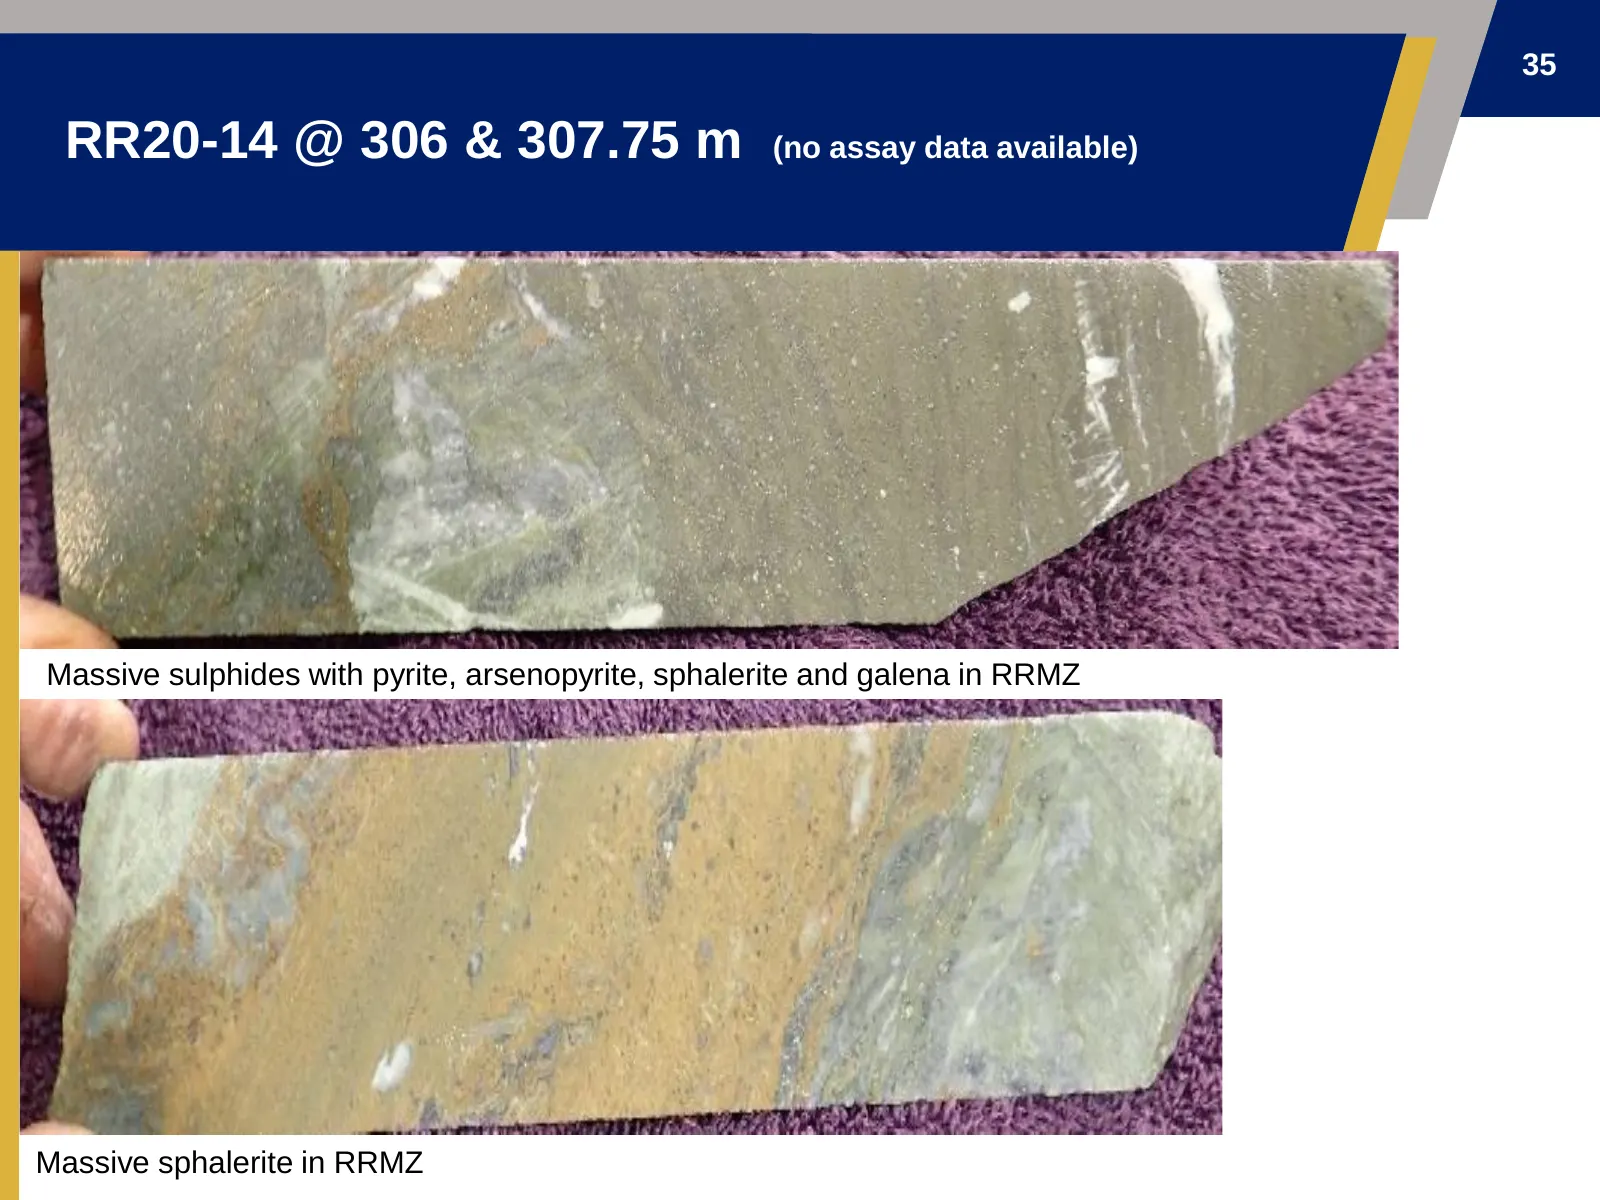
35 RR20-14 @ 306 & 307.75 m (no assay data available) Massive sulphides with pyrite, arsenopyrite, sphalerite and galena in RRMZ Massive sphalerite in RRMZ
Slide 36: Drilling “Backwards” Testing RRMZ To North East
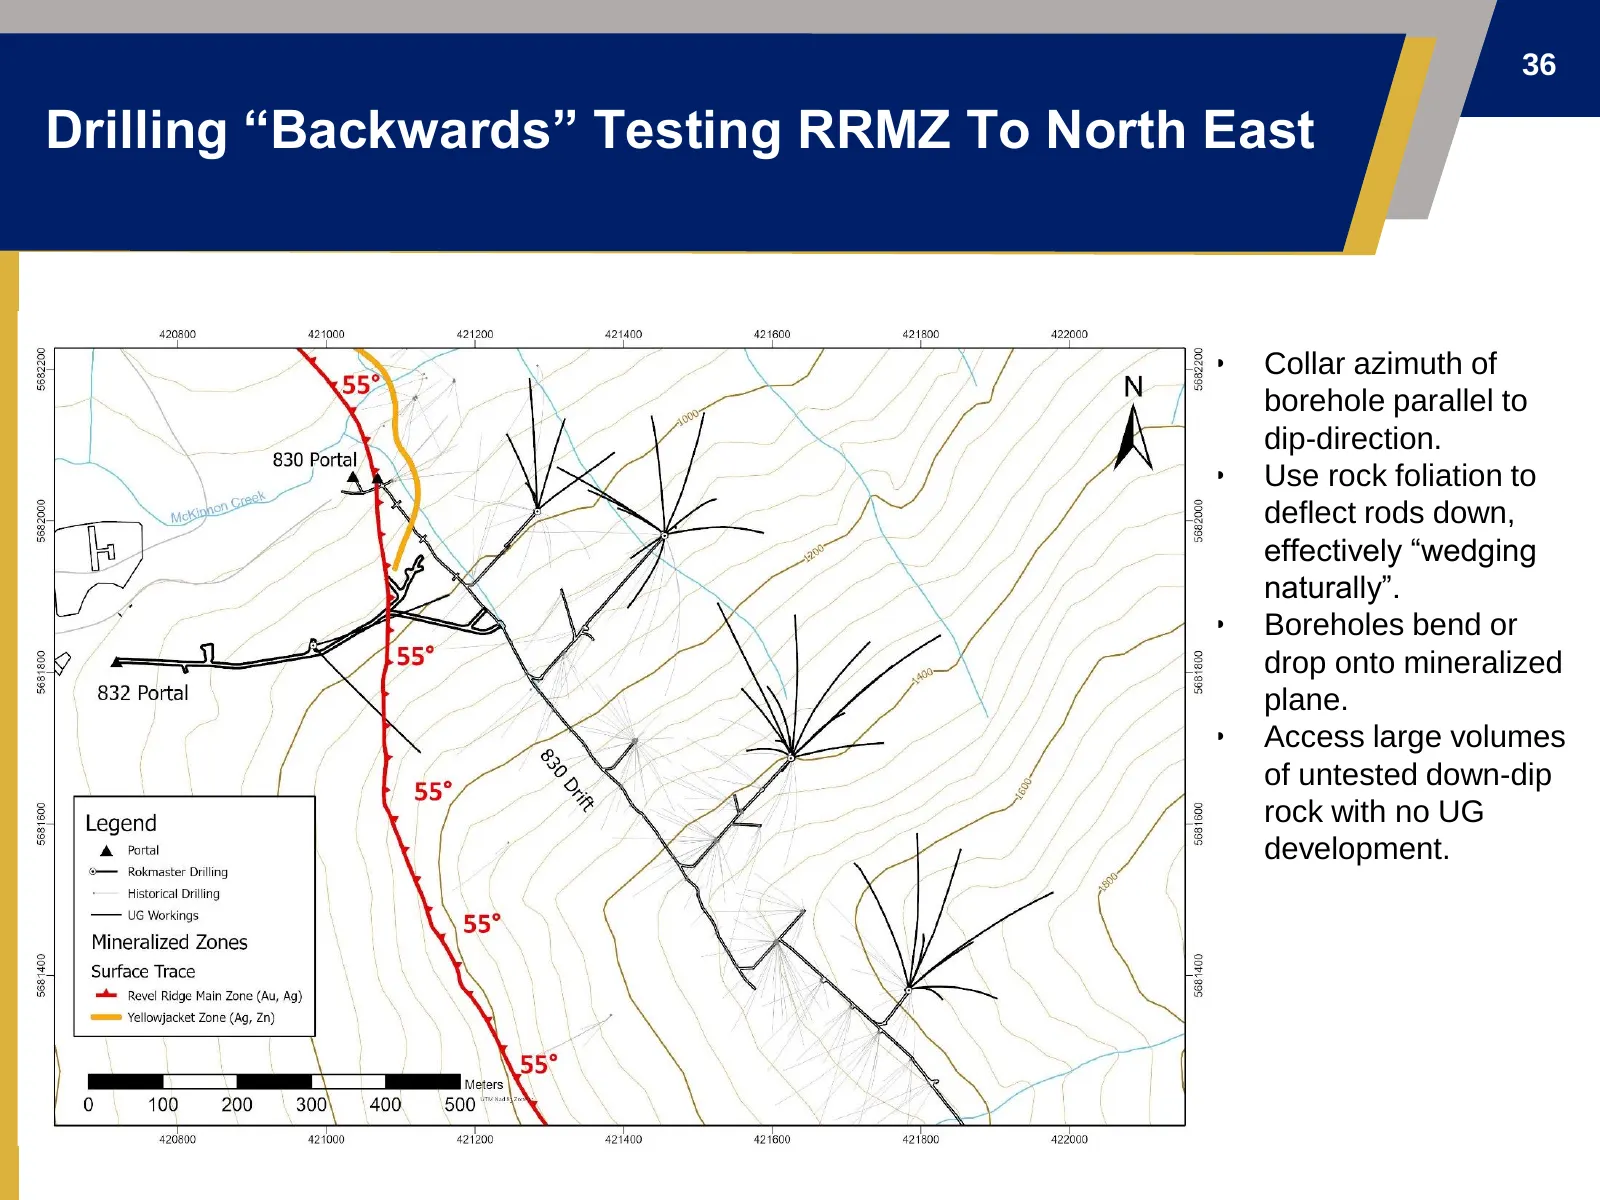
36 Drilling “Backwards” Testing RRMZ To North East • Collar azimuth of borehole parallel to dip-direction. • Use rock foliation to deflect rods down, effectively “wedging naturally”. • Boreholes bend or drop onto mineralized plane. • Access large volumes of untested down-dip rock with no UG developm
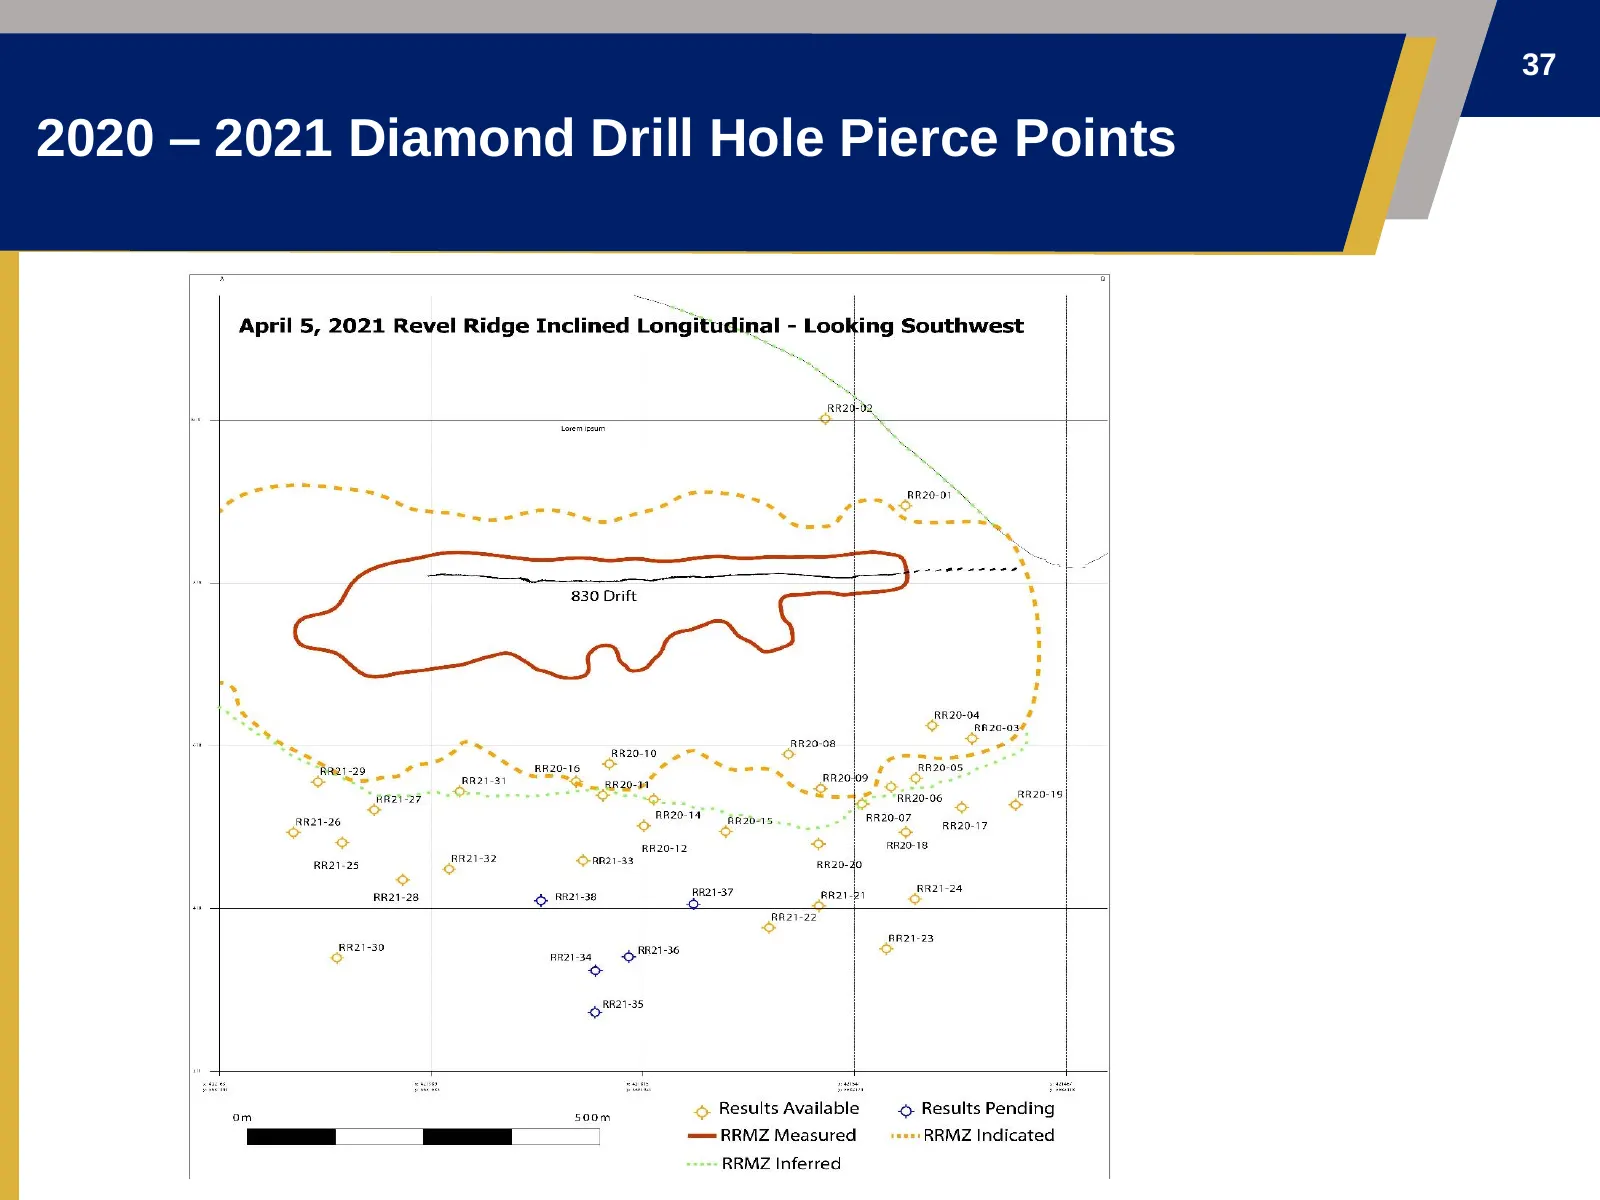
Slide 37: 2020 – 2021 Diamond Drill Hole Pierce Points
37 2020 – 2021 Diamond Drill Hole Pierce Points
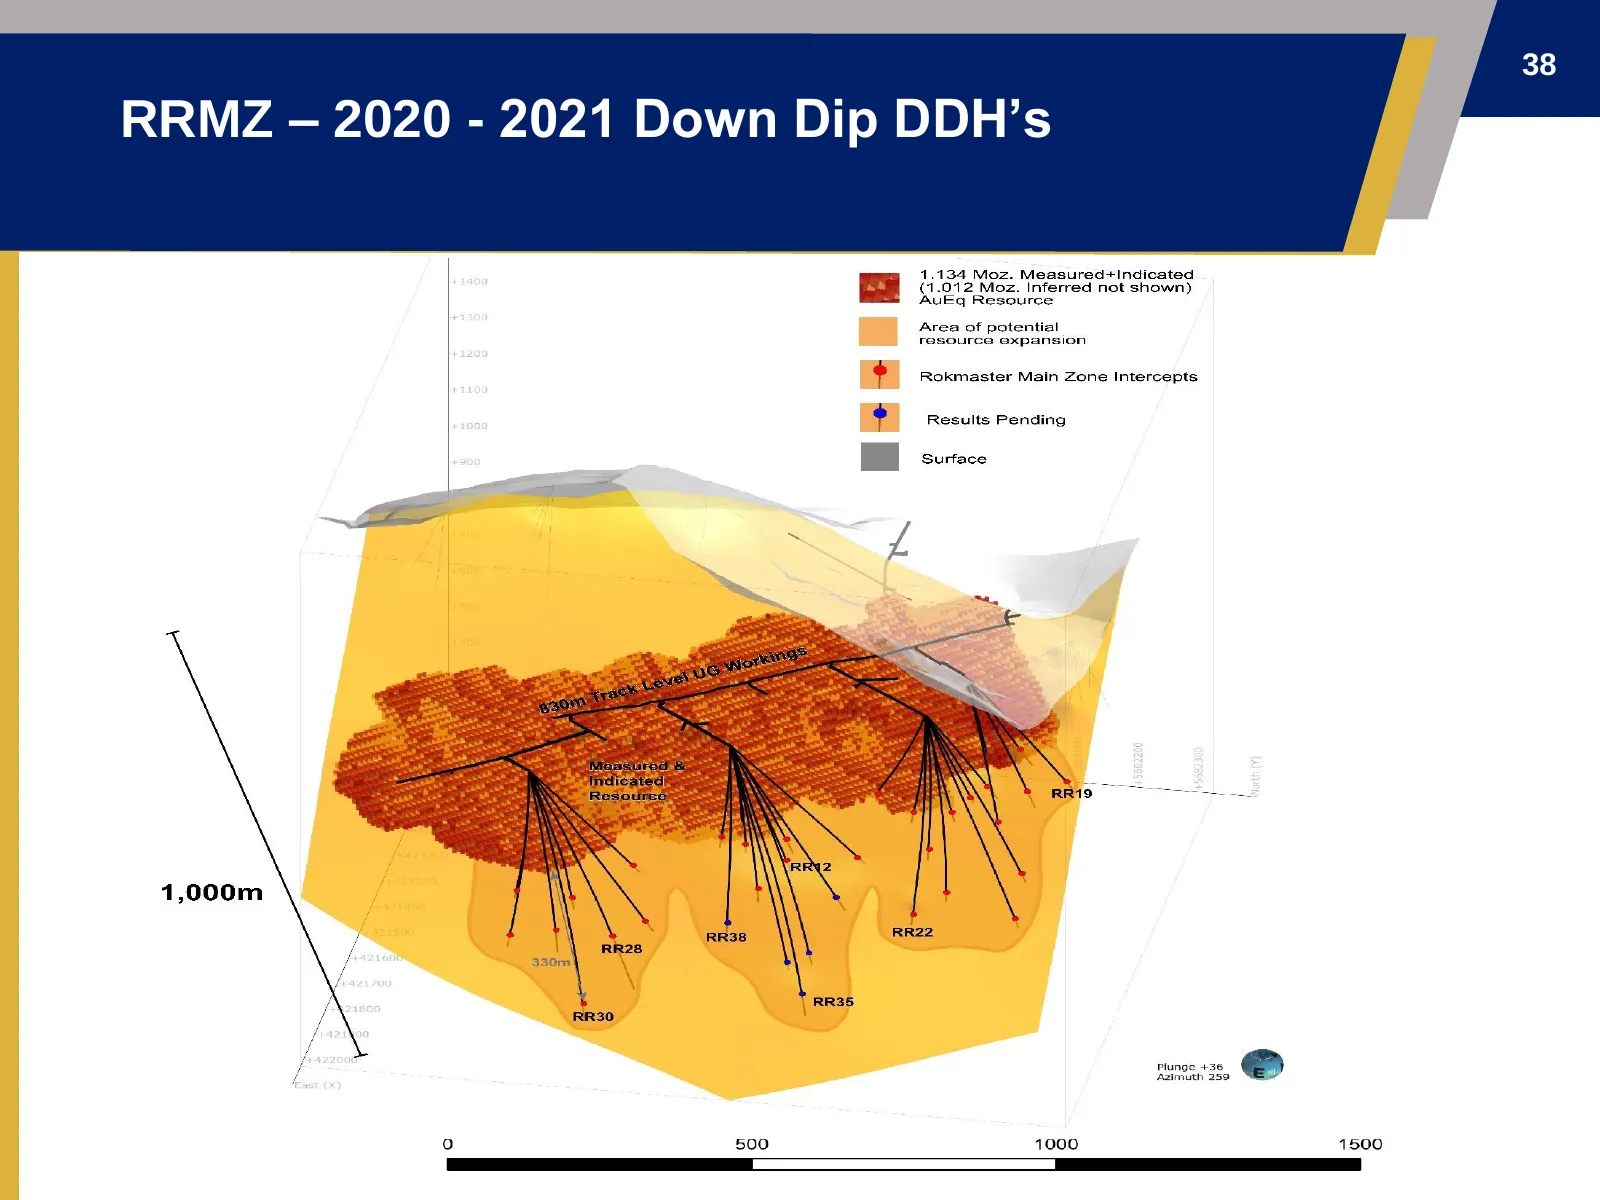
Slide 38: RRMZ – 2020 - 2021 Down Dip DDH’s
38 RRMZ – 2020 - 2021 Down Dip DDH’s
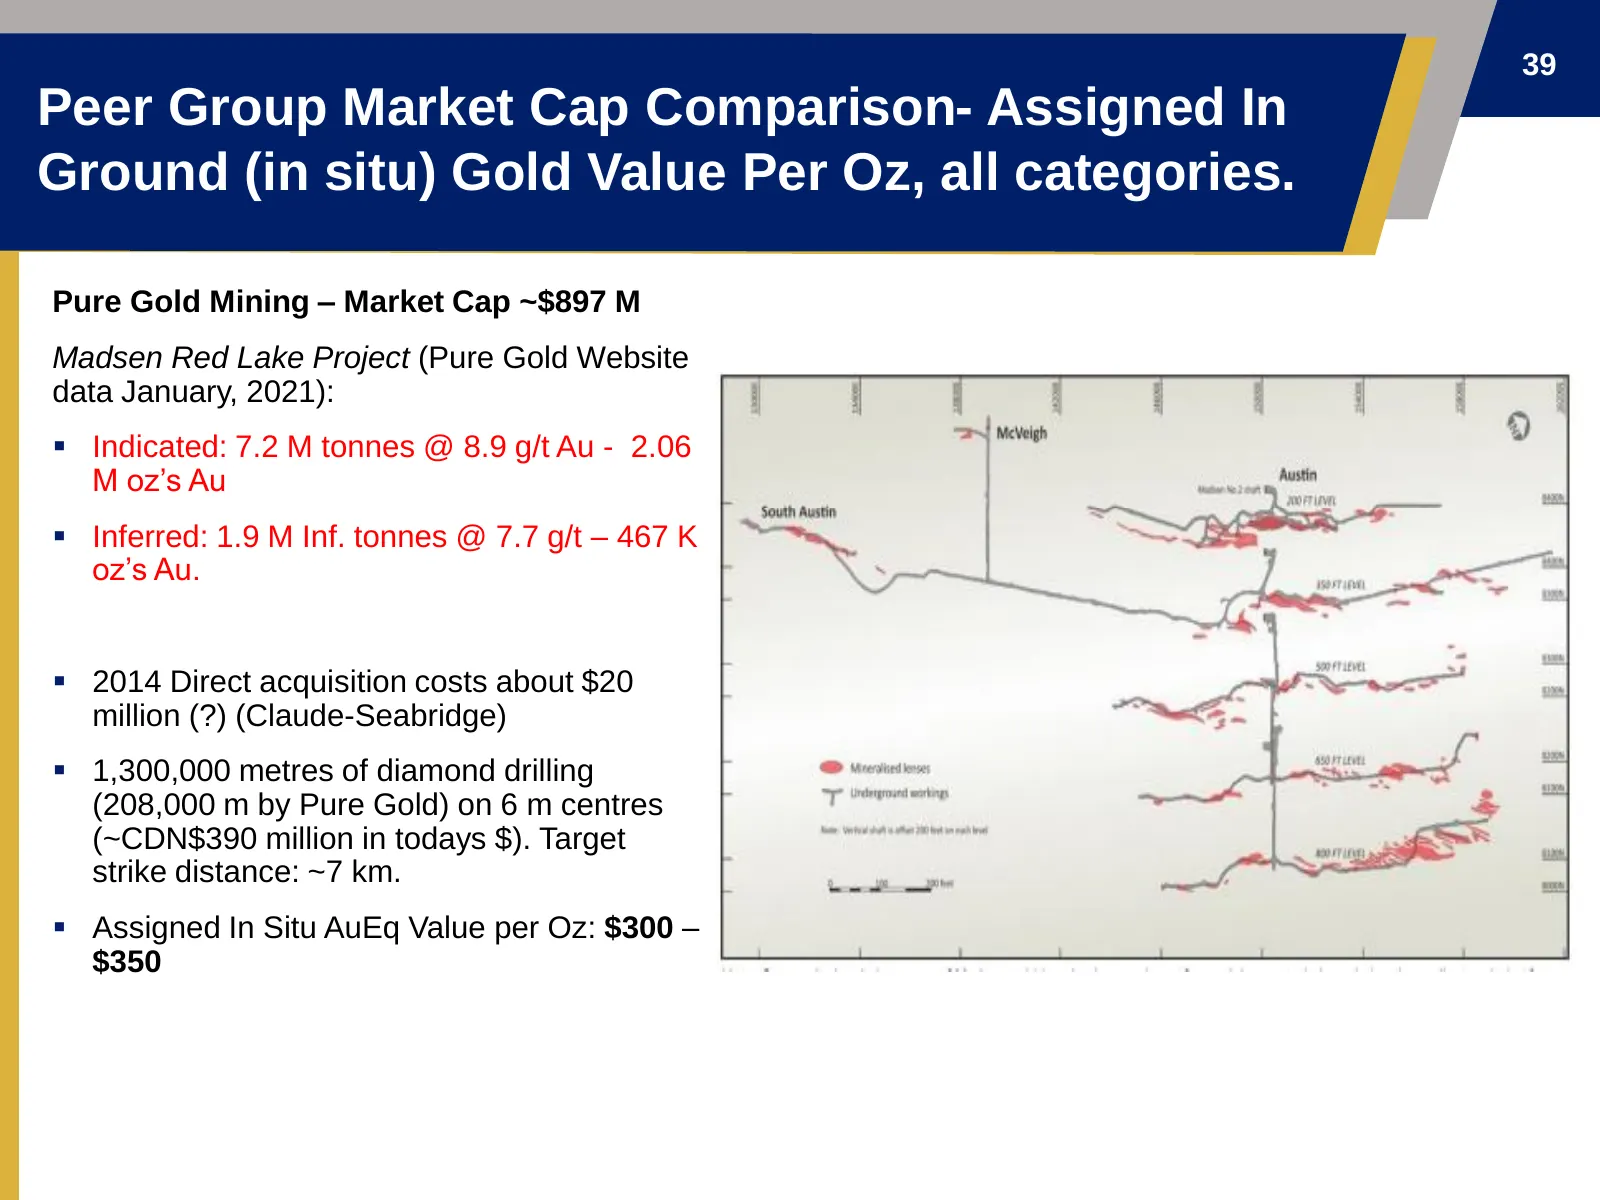
Slide 39: Peer Group Market Cap Comparison - Pure Gold Mining
39 Peer Group Market Cap Comparison- Assigned In Ground (in situ) Gold Value Per Oz, all categories. Pure Gold Mining – Market Cap ~$897 M Madsen Red Lake Project (Pure Gold Website data January, 2021): ▪ Indicated: 7.2 M tonnes @ 8.9 g/t Au - 2.06 M oz’s Au ▪ Inferred: 1.9 M Inf. tonnes @ 7.7 g/t –
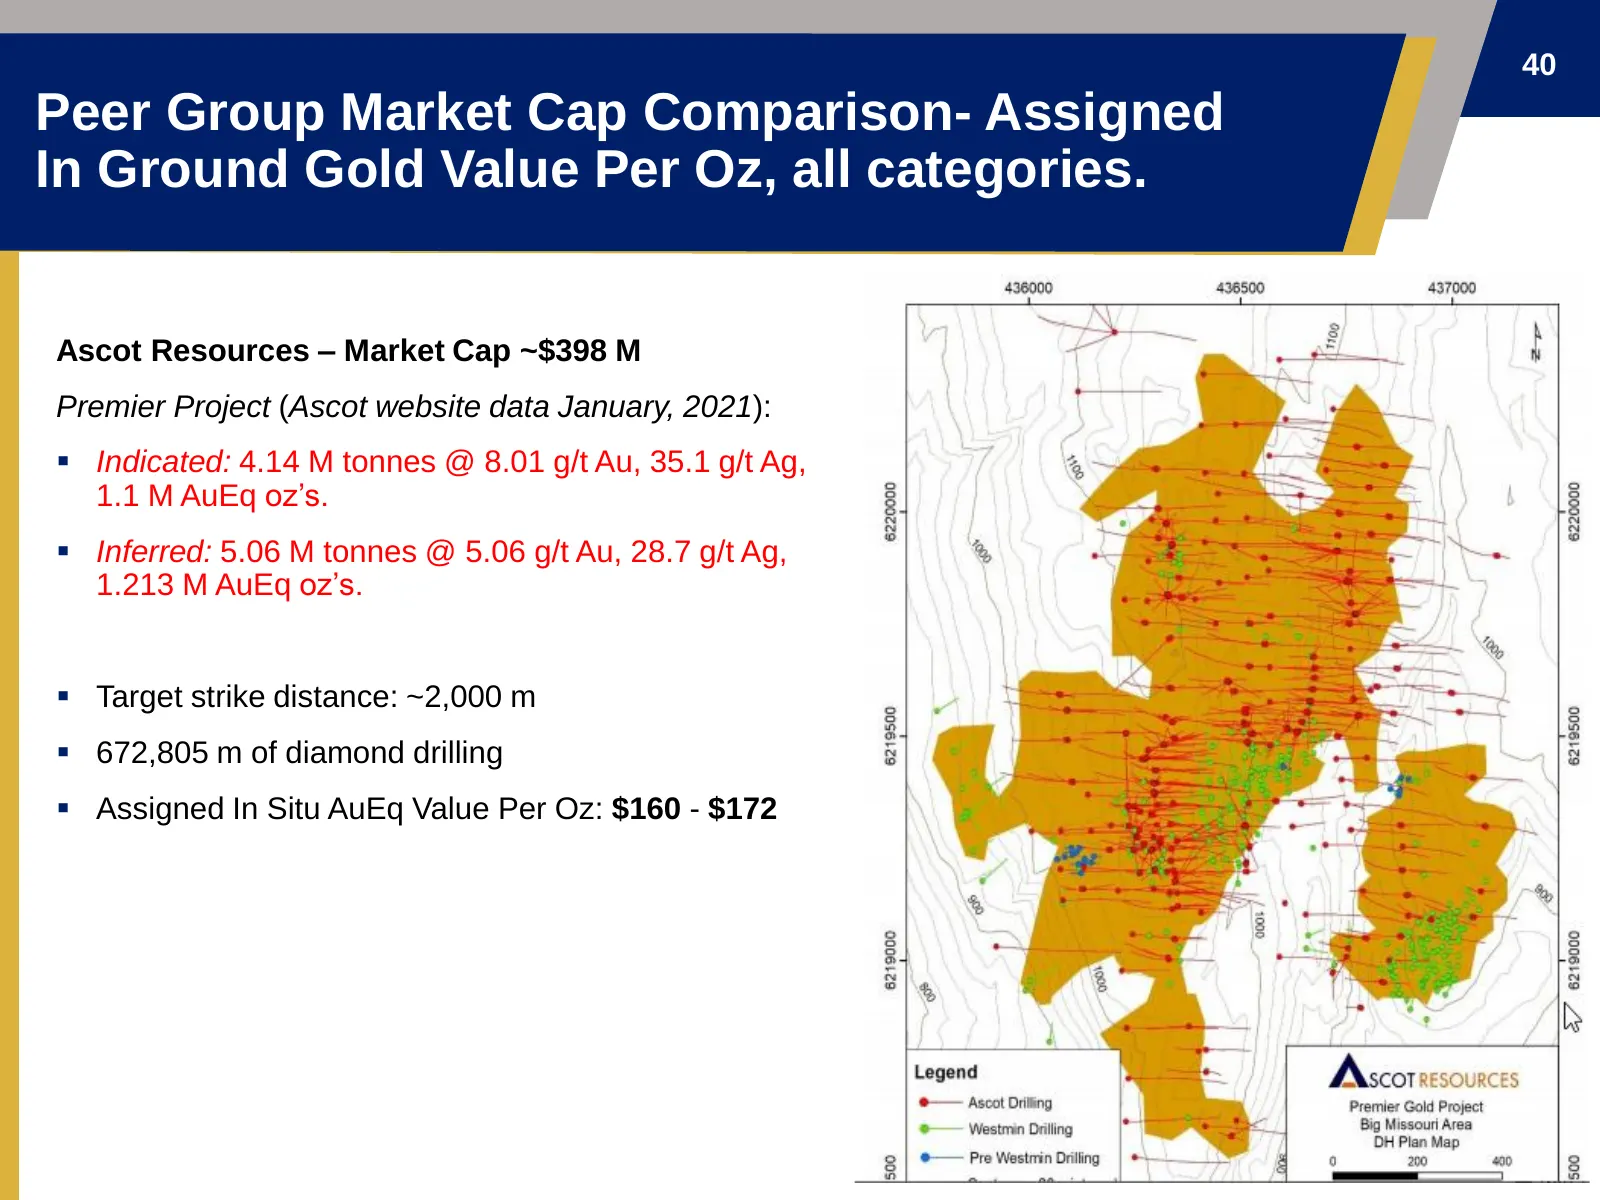
Slide 40: Peer Group Market Cap Comparison - Ascot Resources
40 Peer Group Market Cap Comparison- Assigned In Ground Gold Value Per Oz, all categories. Ascot Resources – Market Cap ~$398 M Premier Project (Ascot website data January, 2021): ▪ Indicated: 4.14 M tonnes @ 8.01 g/t Au, 35.1 g/t Ag, 1.1 M AuEq oz’s. ▪ Inferred: 5.06 M tonnes @ 5.06 g/t Au, 28.7 g/
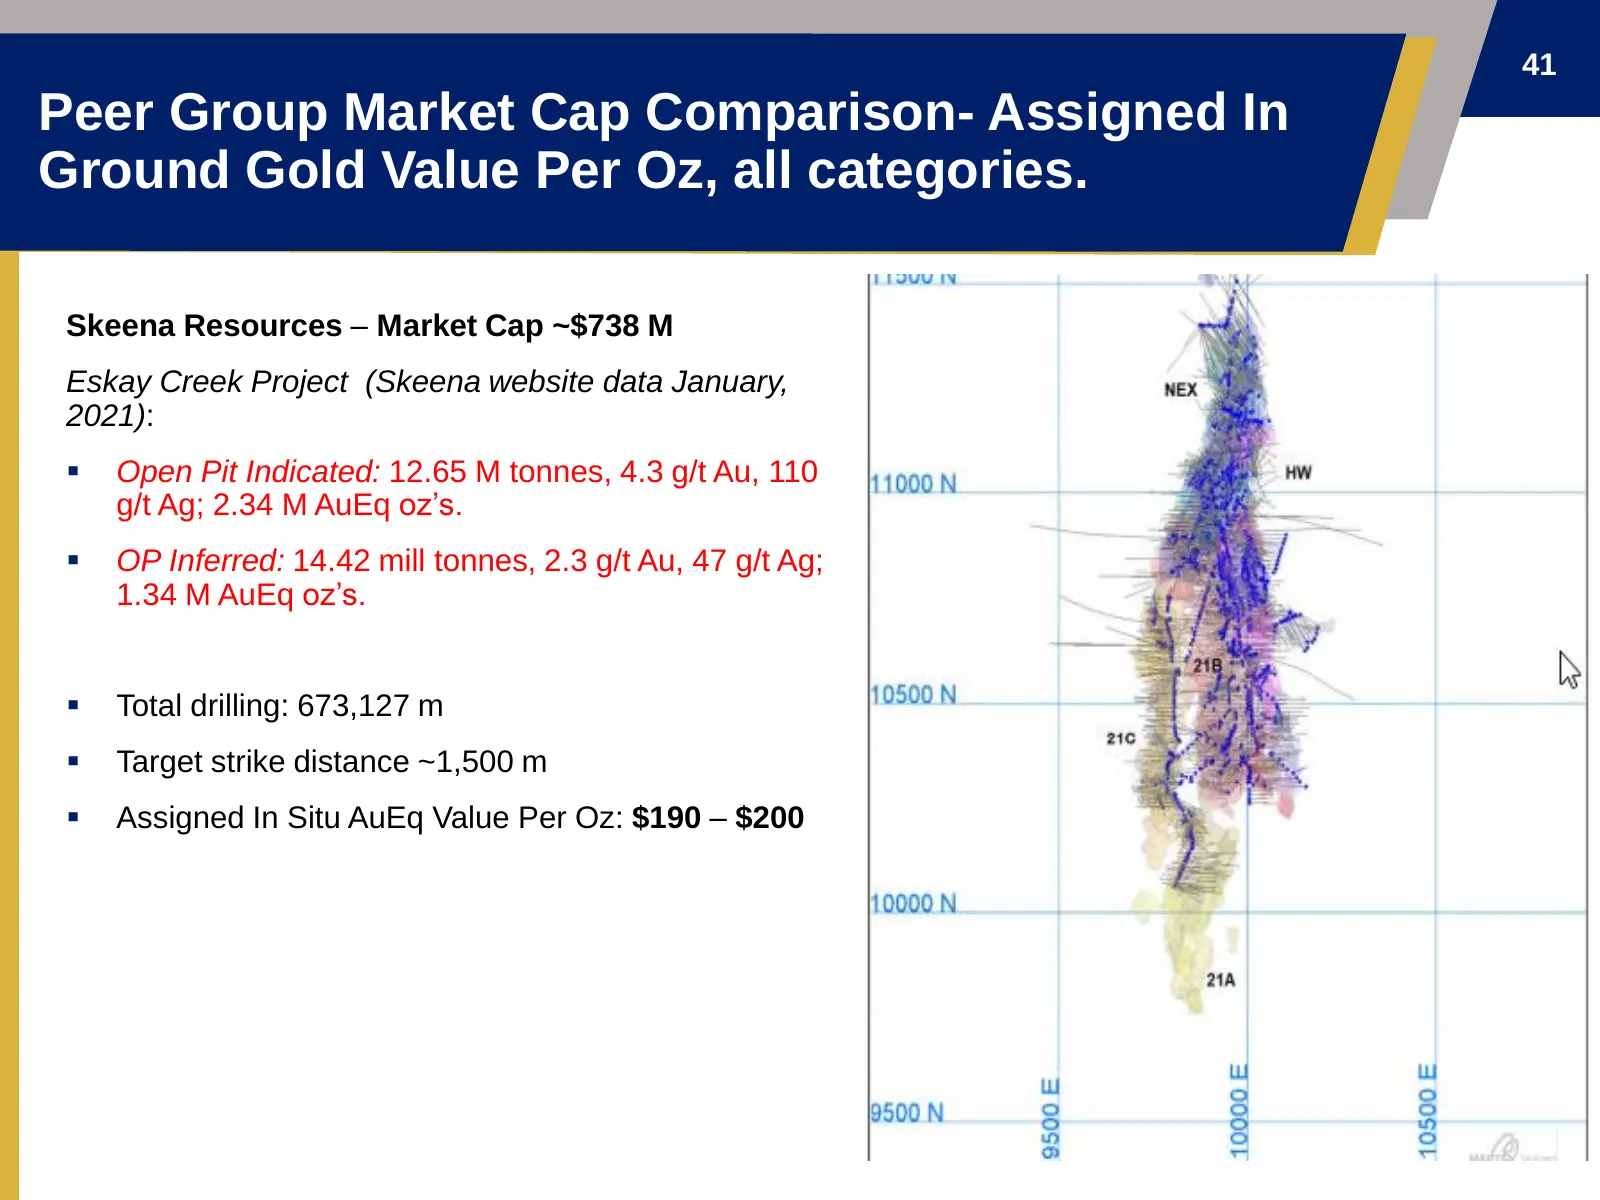
Slide 41: Peer Group Market Cap Comparison - Skeena Resources
41 Peer Group Market Cap Comparison- Assigned In Ground Gold Value Per Oz, all categories. Skeena Resources – Market Cap ~$738 M Eskay Creek Project (Skeena website data January, 2021): ▪ Open Pit Indicated: 12.65 M tonnes, 4.3 g/t Au, 110 g/t Ag; 2.34 M AuEq oz’s. ▪ OP Inferred: 14.42 mill tonnes,
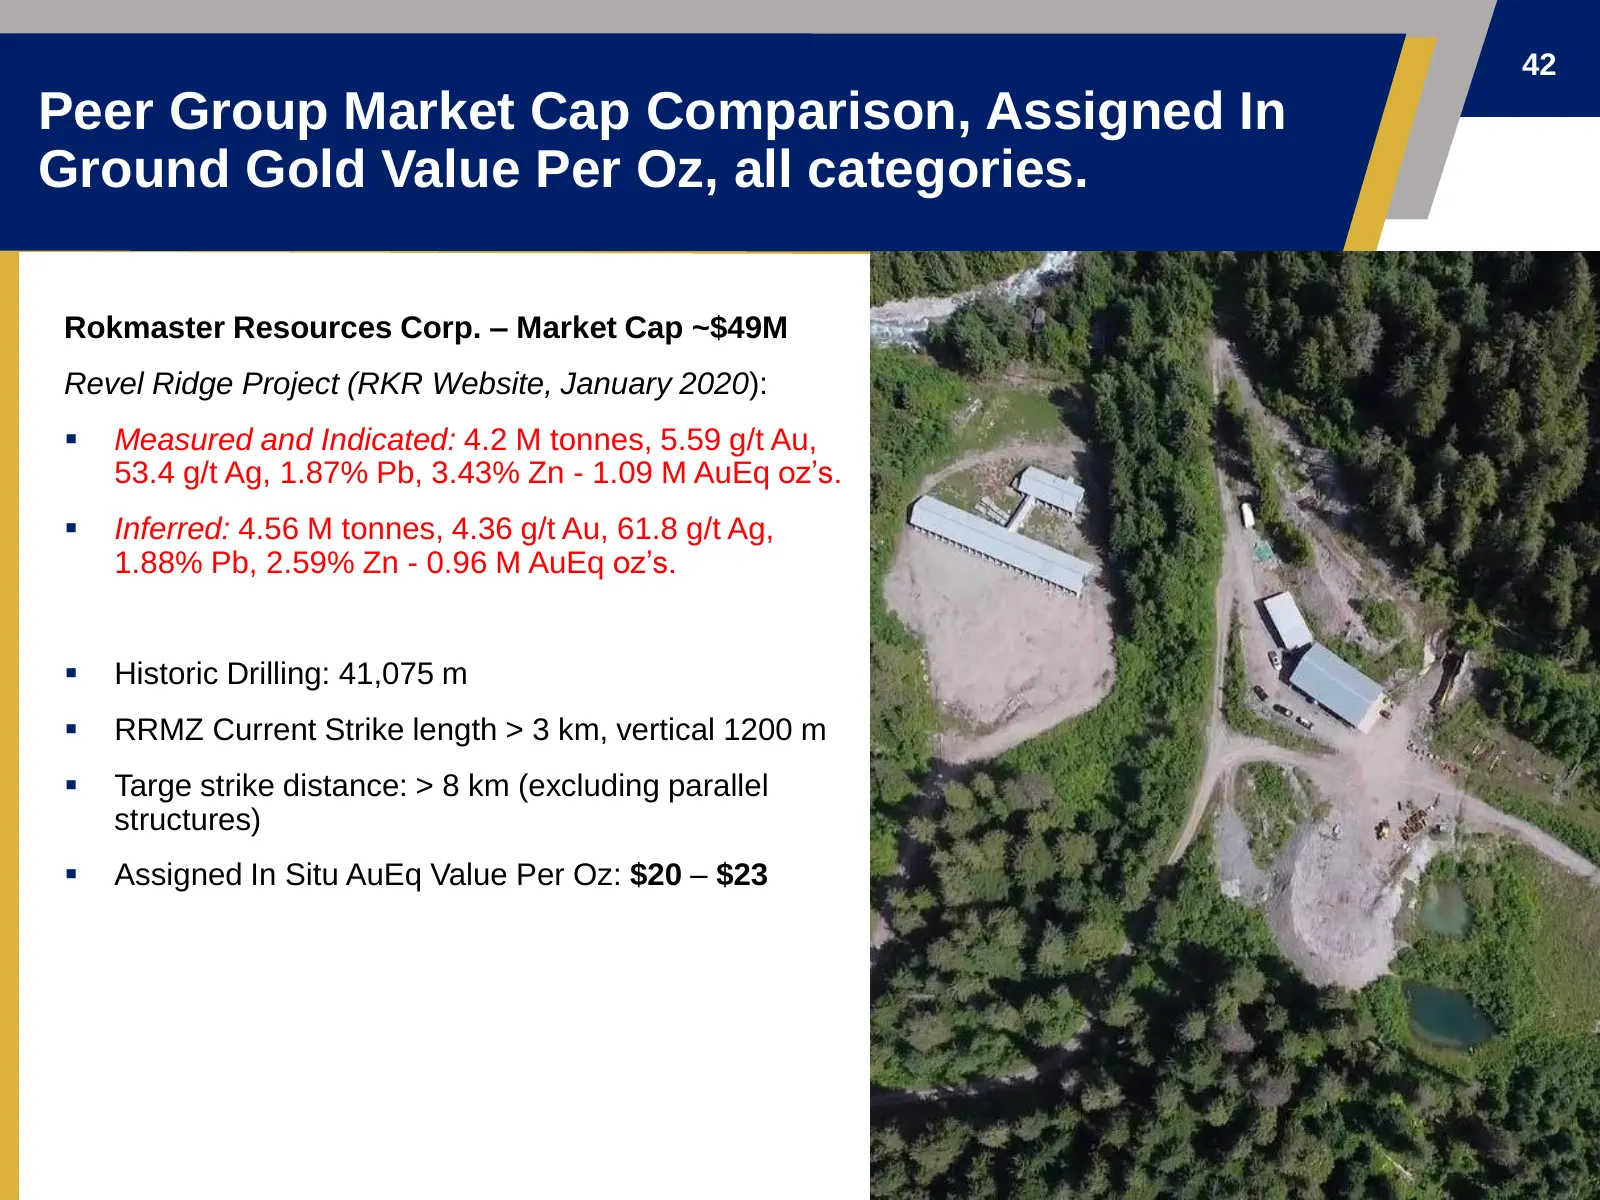
Slide 42: Peer Group Market Cap Comparison - Rokmaster Resources
42 Peer Group Market Cap Comparison, Assigned In Ground Gold Value Per Oz, all categories. Rokmaster Resources Corp. – Market Cap ~$49M Revel Ridge Project (RKR Website, January 2020): ▪ Measured and Indicated: 4.2 M tonnes, 5.59 g/t Au, 53.4 g/t Ag, 1.87% Pb, 3.43% Zn - 1.09 M AuEq oz’s. ▪ Inferred
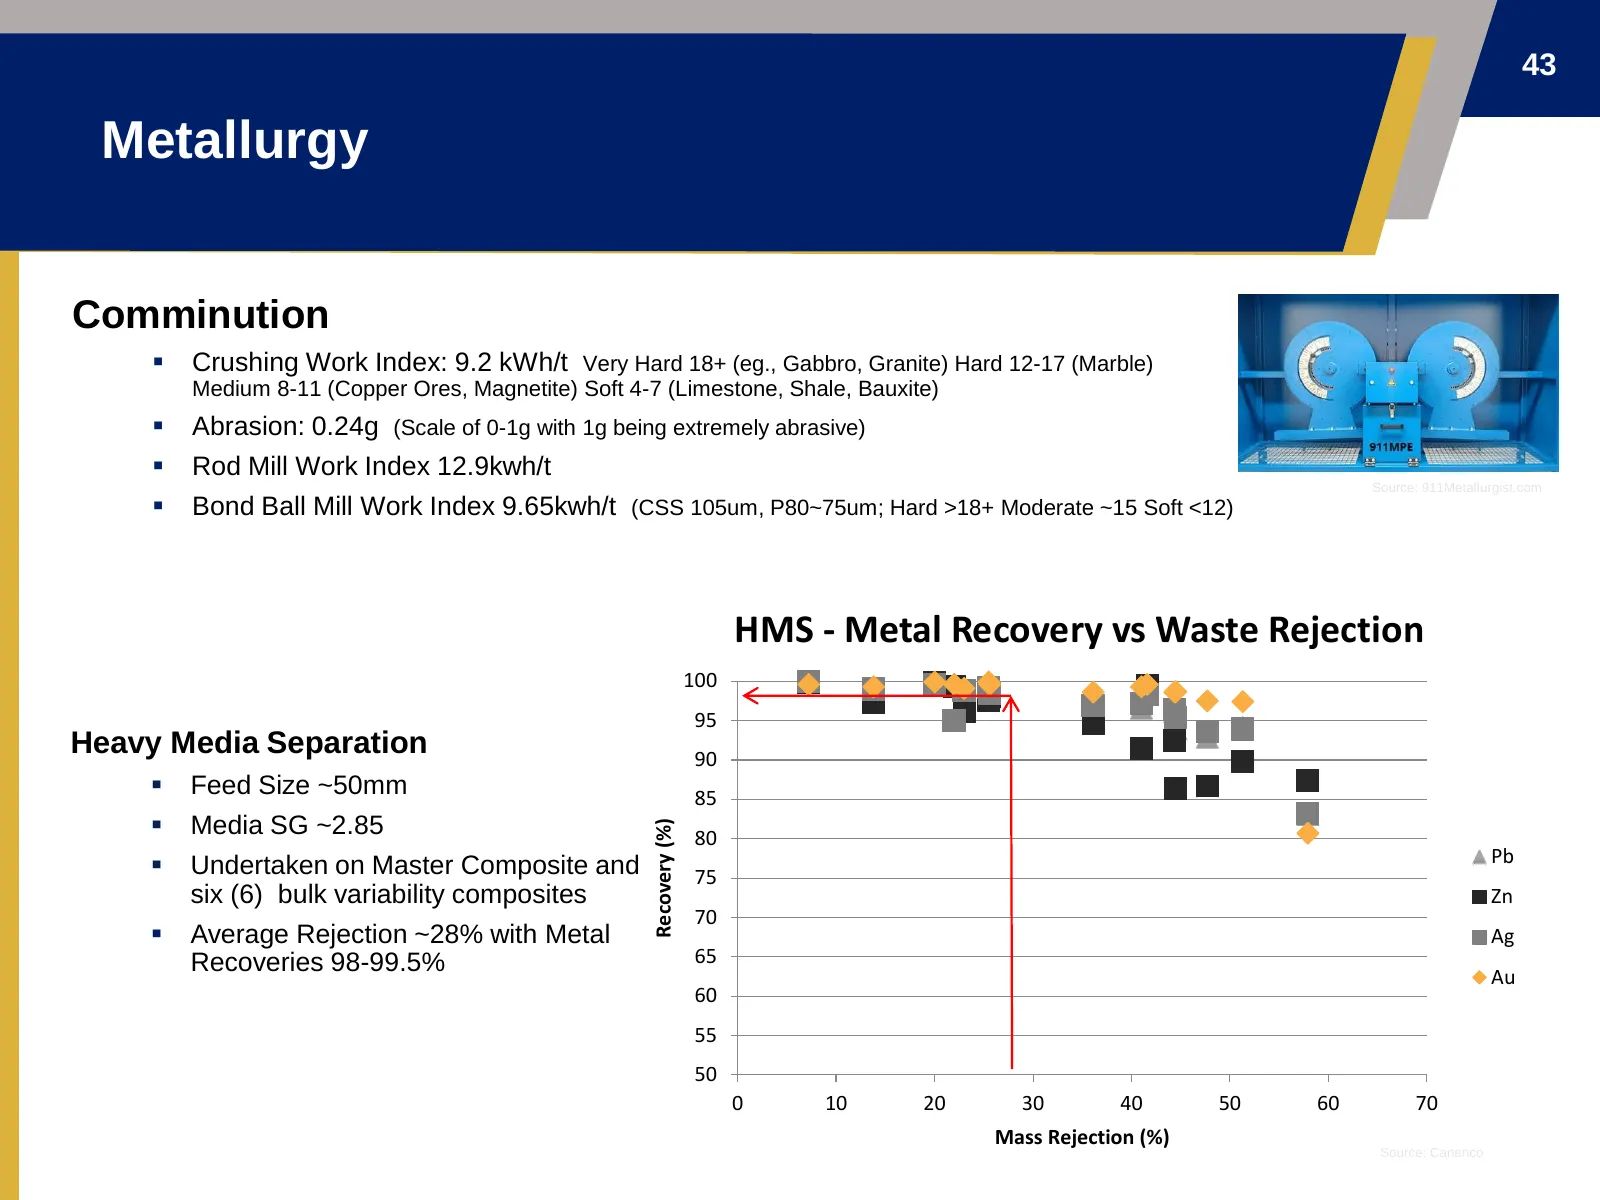
Slide 43: Metallurgy: Comminution and Heavy Media Separation
43 Metallurgy Comminution ▪ Crushing Work Index: 9.2 kWh/t Very Hard 18+ (eg., Gabbro, Granite) Hard 12-17 (Marble) Medium 8-11 (Copper Ores, Magnetite) Soft 4-7 (Limestone, Shale, Bauxite) ▪ Abrasion: 0.24g (Scale of 0-1g with 1g being extremely abrasive) ▪ Rod Mill Work Index 12.9kwh/t Source: 911
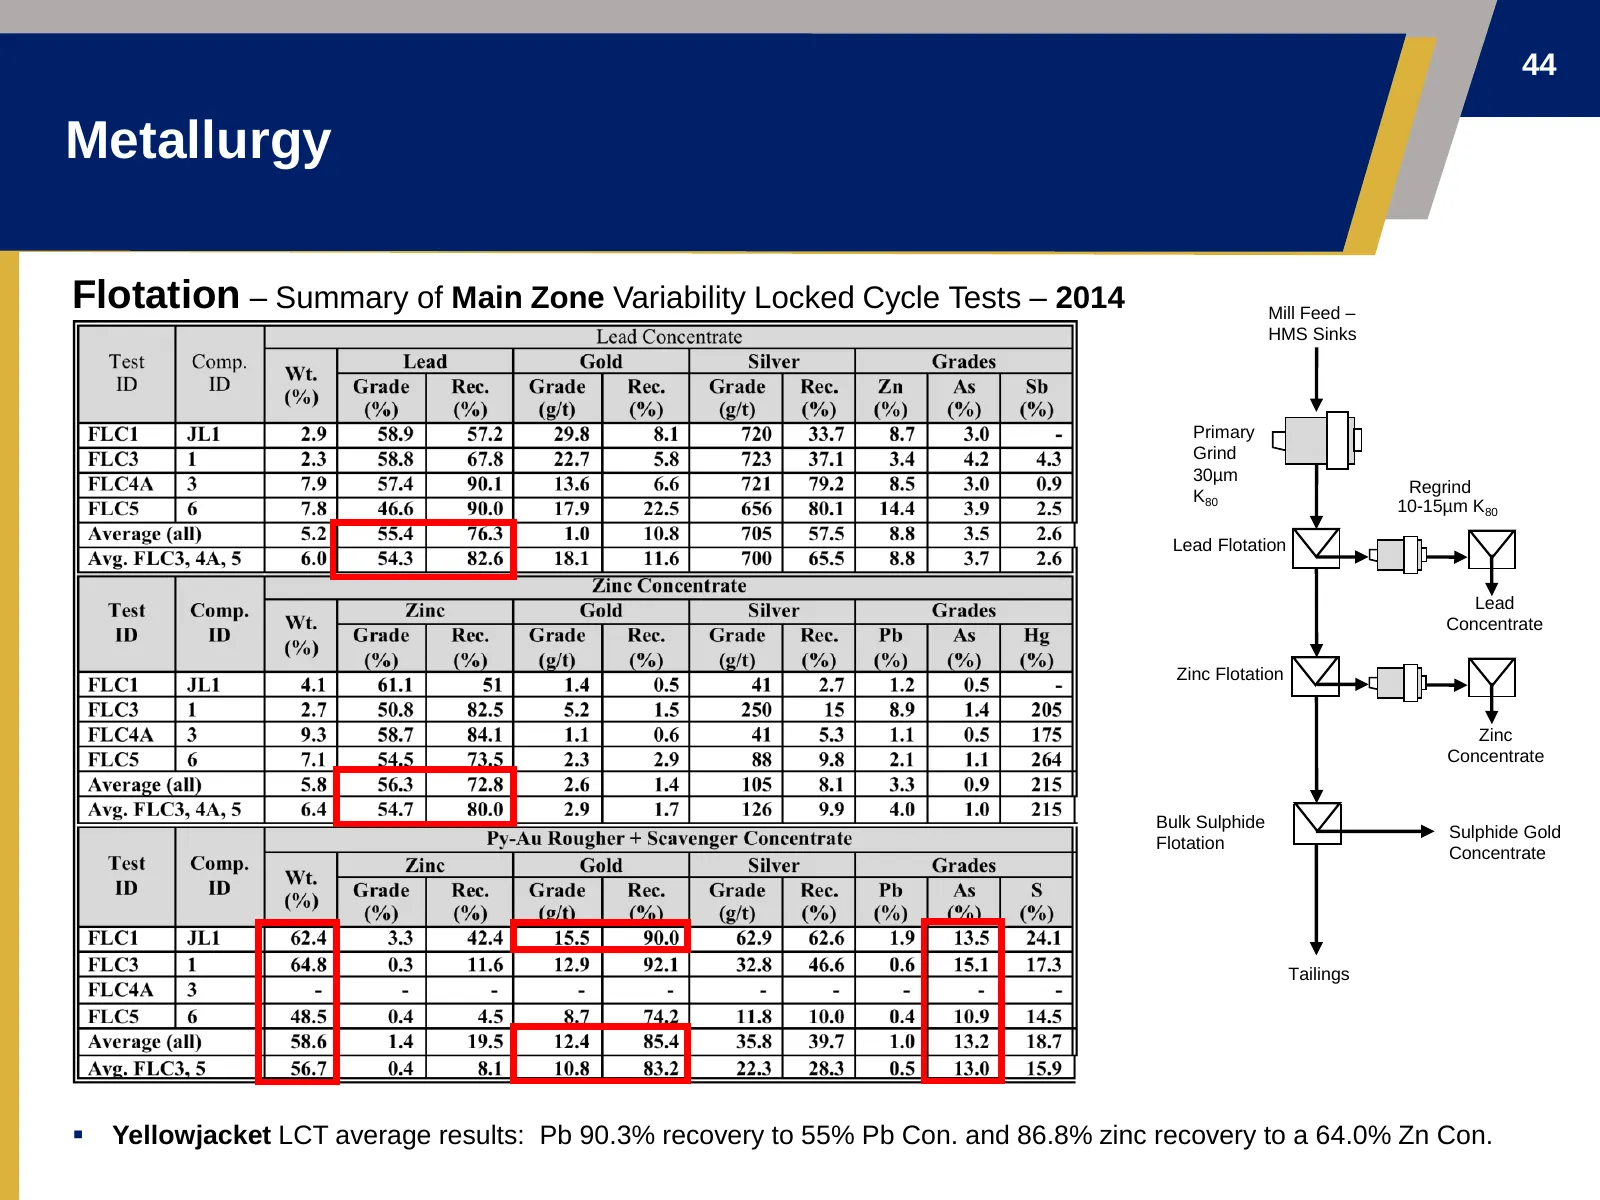
Slide 44: Metallurgy: Flotation Summary
44 Metallurgy Flotation – Summary of Main Zone Variability Locked Cycle Tests – 2014 Mill Feed – HMS Sinks Primary Grind 30µm Regrind K80 10-15µm K80 Lead Flotation Lead Concentrate Zinc Flotation Zinc Concentrate Bulk Sulphide Sulphide Gold Flotation Concentrate Tailings ▪ Yellowjacket LCT average
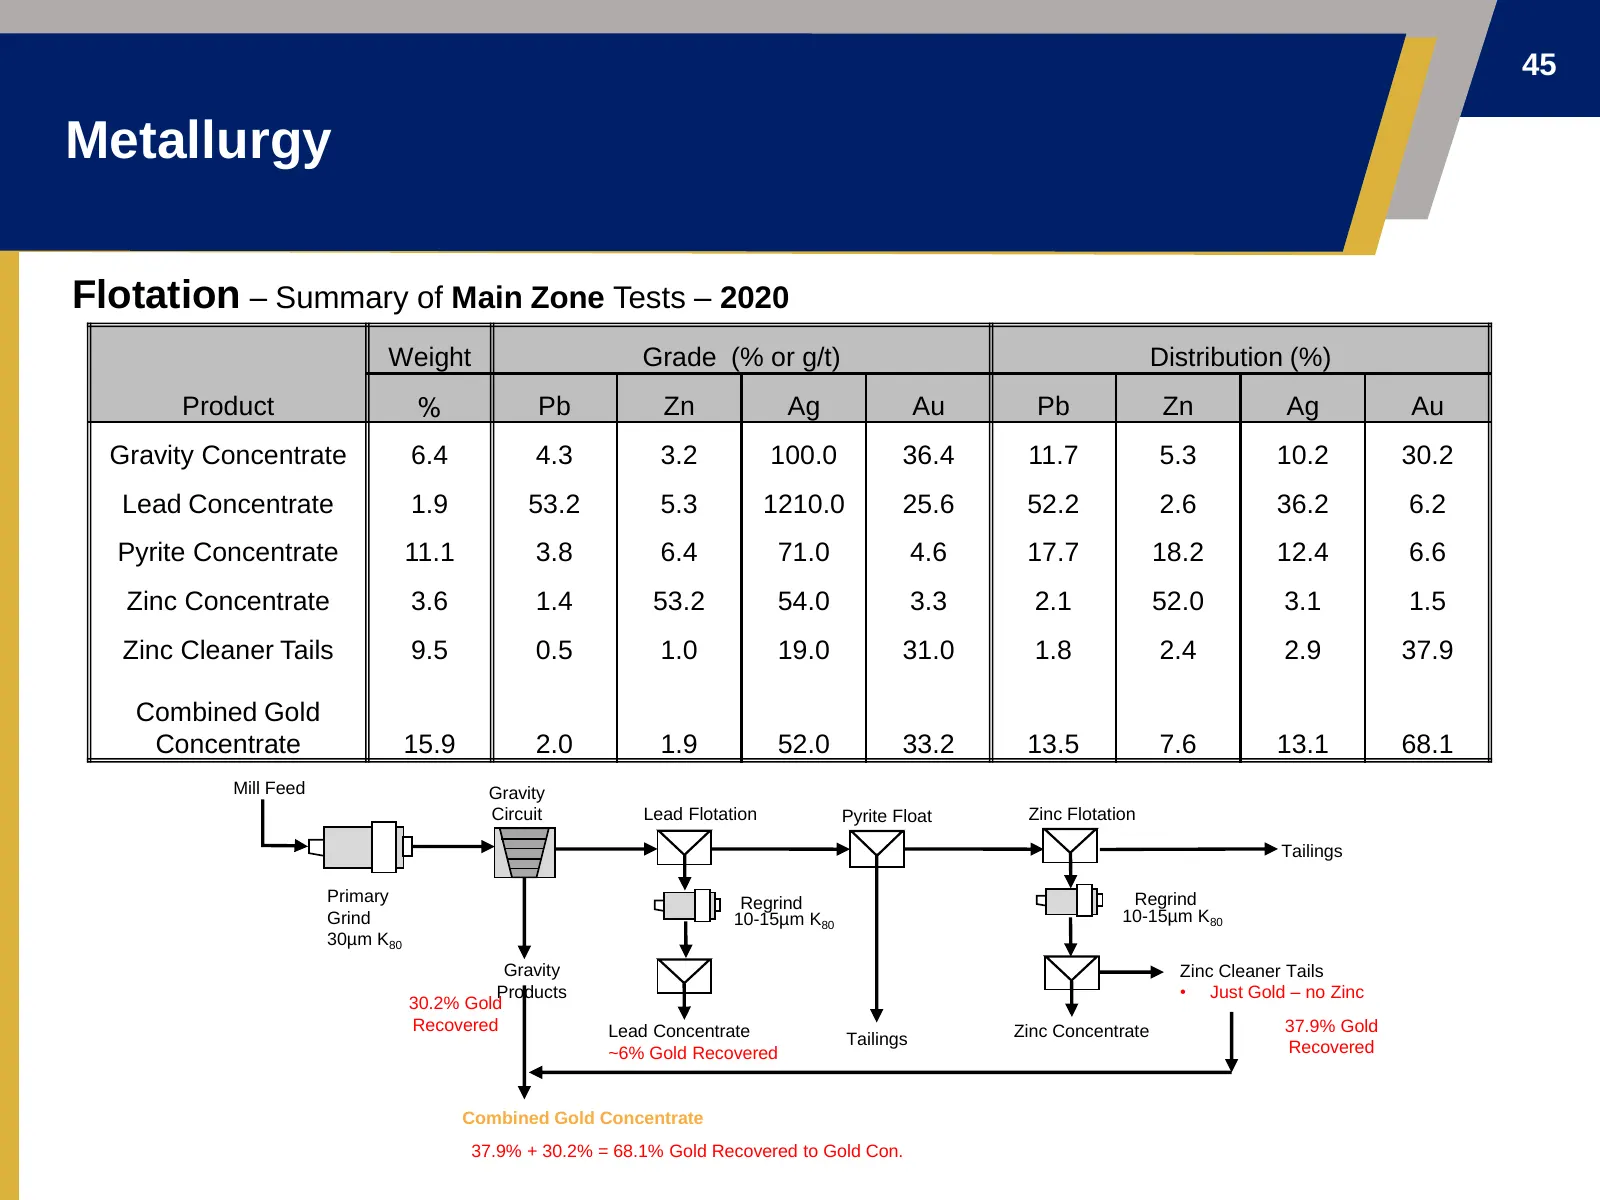
Slide 45: Metallurgy: Flotation Summary of Main Zone Tests – 2020
45 Metallurgy Flotation – Summary of Main Zone Tests – 2020 Weight Grade (% or g/t) Distribution (%) Product % Pb Zn Ag Au Pb Zn Ag Au Gravity Concentrate 6.4 4.3 3.2 100.0 36.4 11.7 5.3 10.2 30.2 Lead Concentrate 1.9 53.2 5.3 1210.0 25.6 52.2 2.6 36.2 6.2 Pyrite Concentrate 11.1 3.8 6.4 71.0 4.6 17
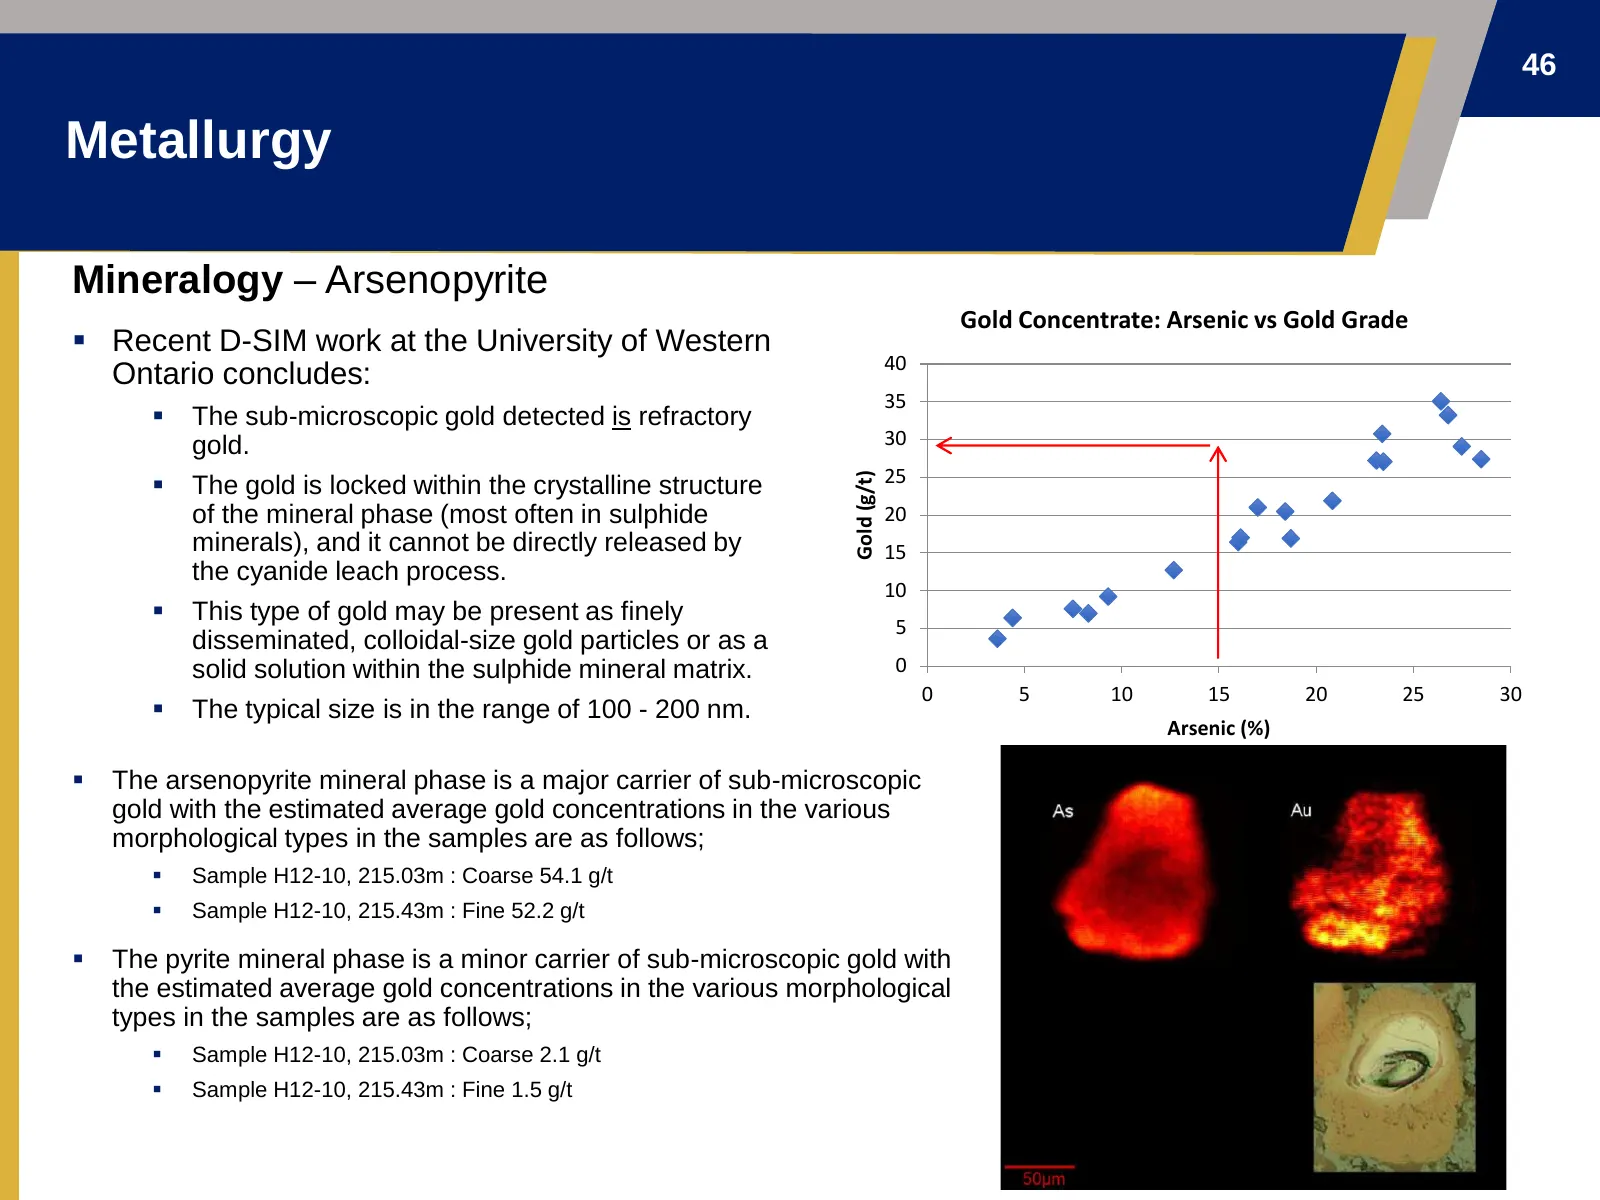
Slide 46: Metallurgy Mineralogy – Arsenopyrite
46 Metallurgy Mineralogy – Arsenopyrite Gold Concentrate: Arsenic vs Gold Grade ▪ Recent D-SIM work at the University of Western 40 Ontario concludes: 35 ▪ The sub-microscopic gold detected is refractory gold. 30 ▪ 25 Gold (g/t) The gold is locked within the crystalline structure of the mineral phas
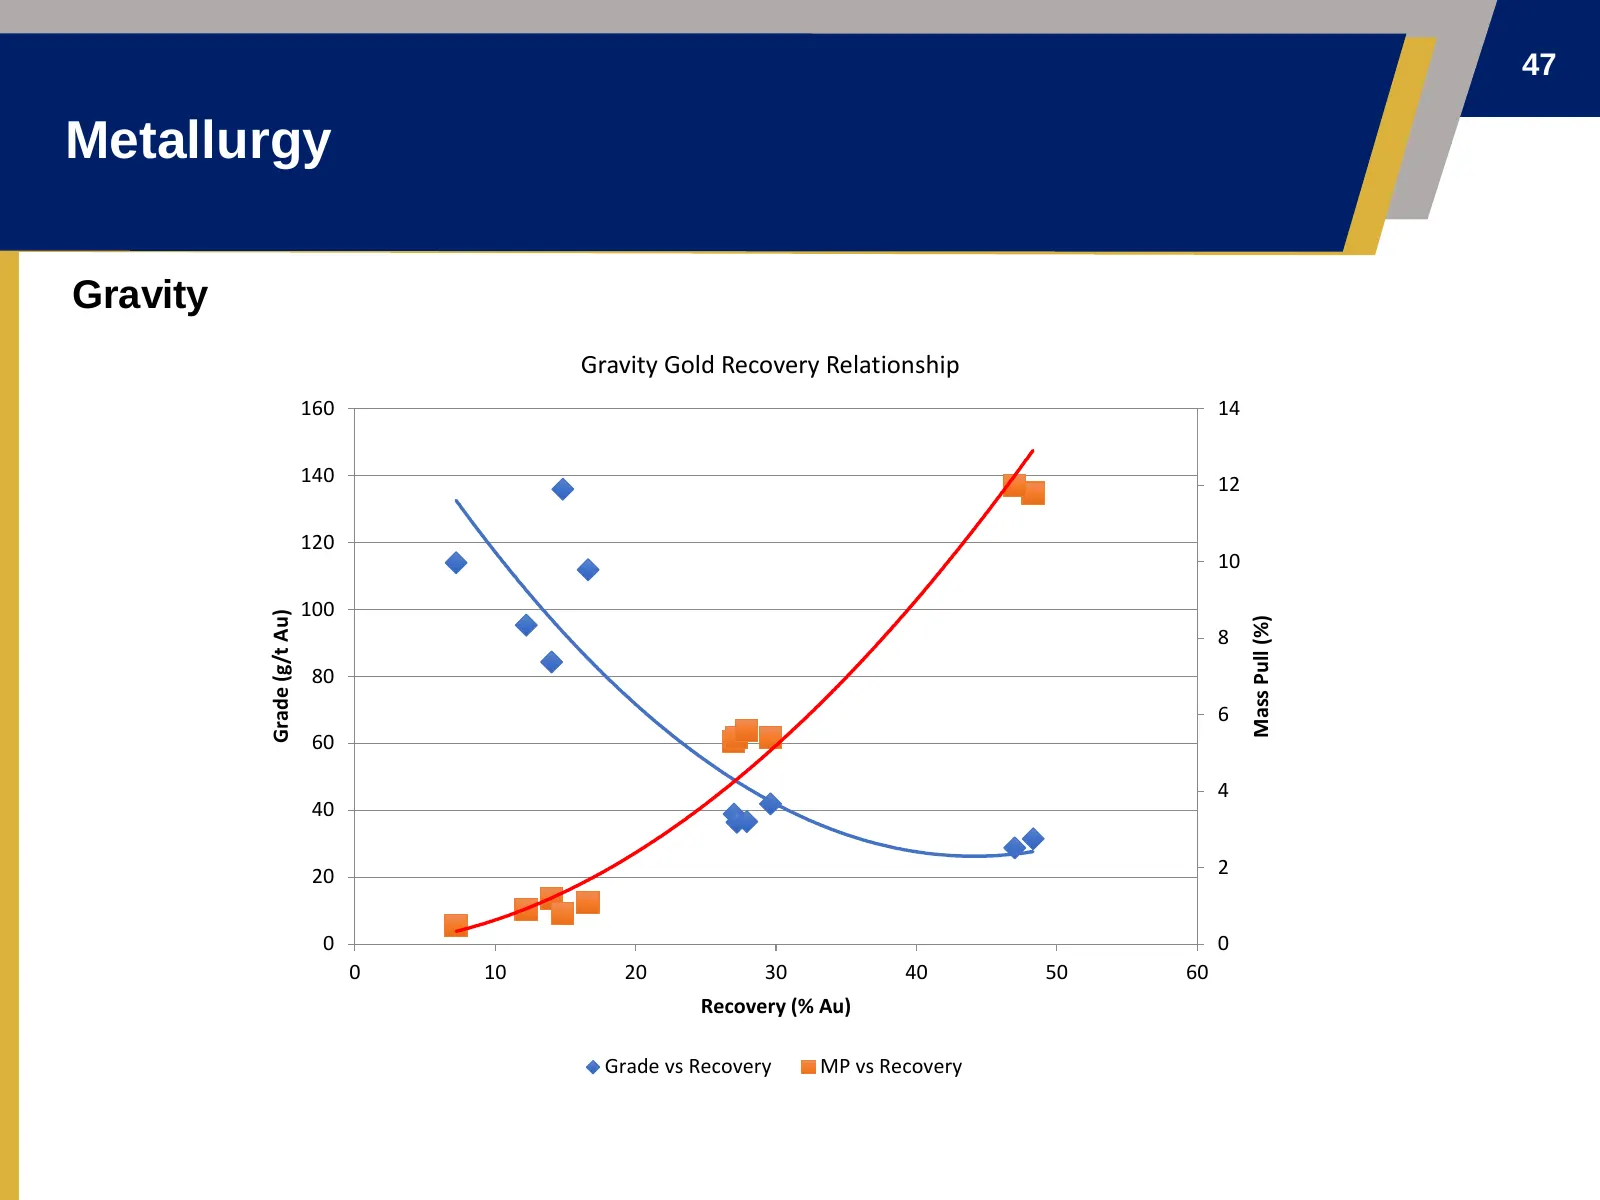
Slide 47: Metallurgy: Gravity
47 Metallurgy Gravity Gravity Gold Recovery Relationship 160 14 140 12 120 10 100 Grade (g/t Au) Mass Pull (%) 8 80 6 60 4 40 20 2 0 0 0 10 20 30 40 50 60 Recovery (% Au) Grade vs Recovery MP vs Recovery
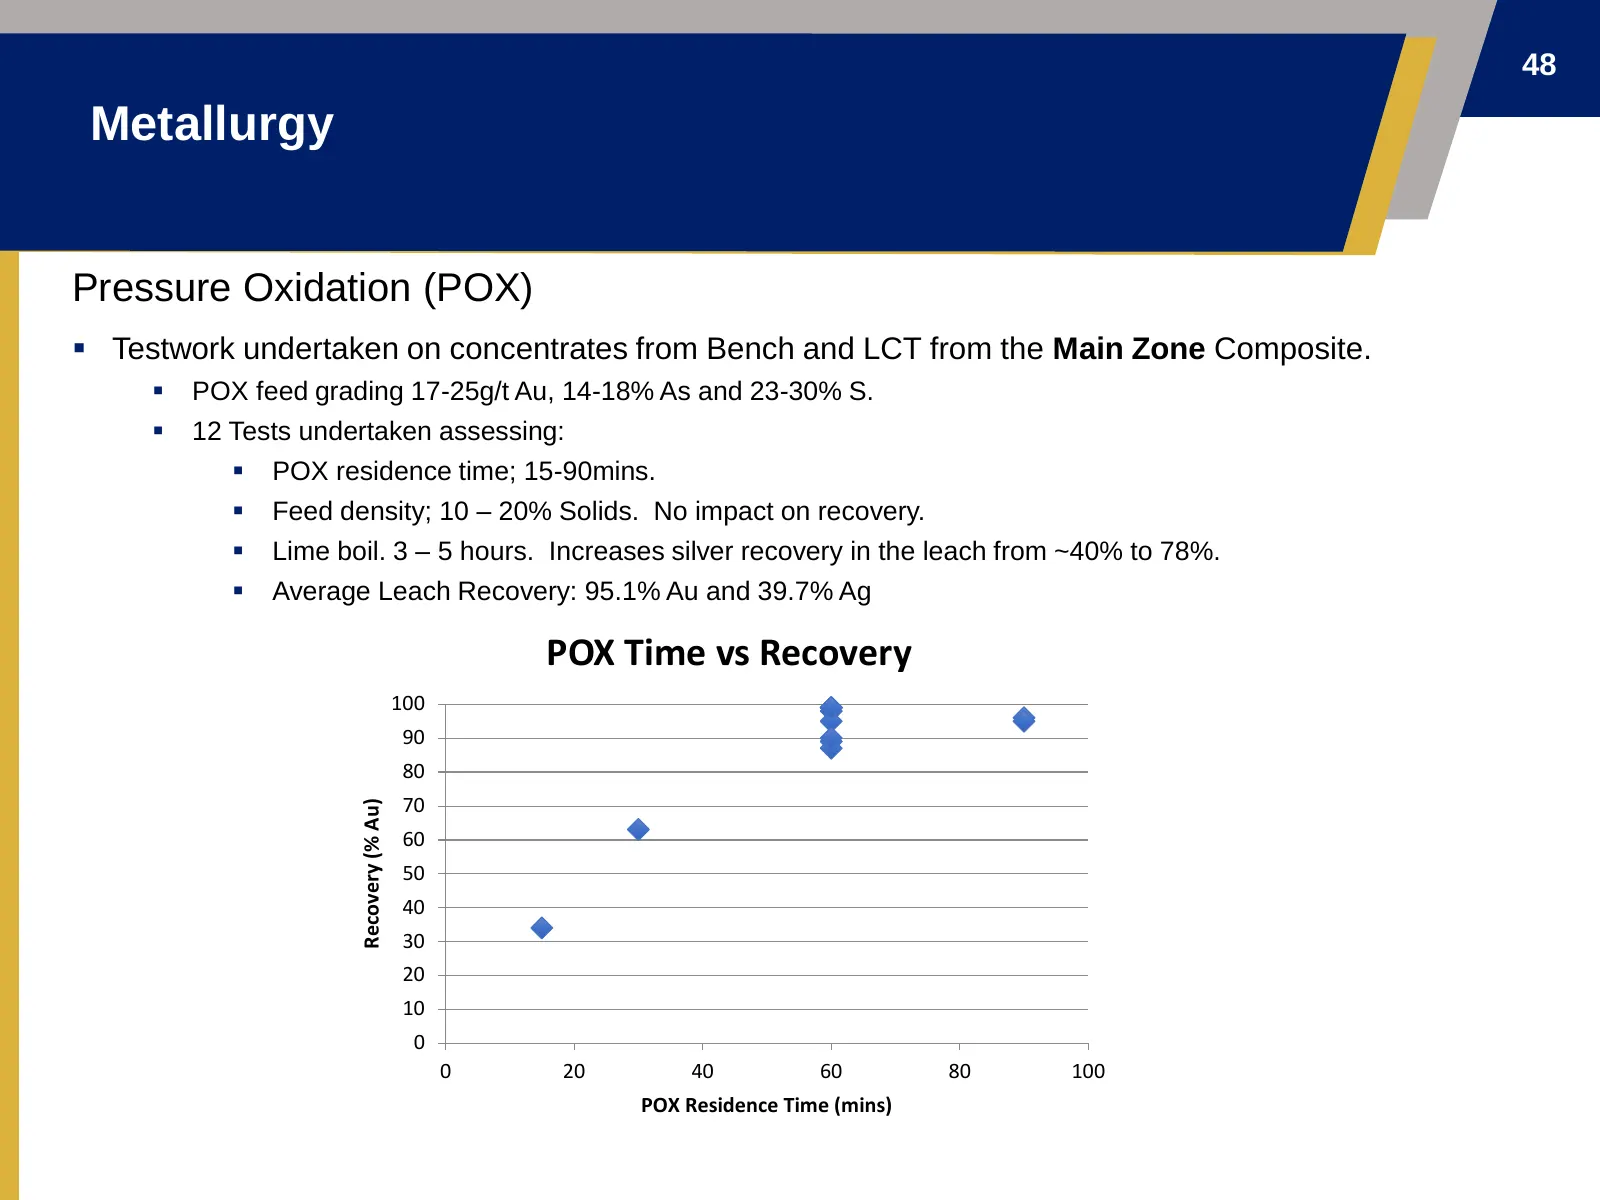
Slide 48: Metallurgy: Pressure Oxidation (POX)
48 Metallurgy Pressure Oxidation (POX) ▪ Testwork undertaken on concentrates from Bench and LCT from the Main Zone Composite. ▪ POX feed grading 17-25g/t Au, 14-18% As and 23-30% S. ▪ 12 Tests undertaken assessing: ▪ POX residence time; 15-90mins. ▪ Feed density; 10 – 20% Solids. No impact on recove
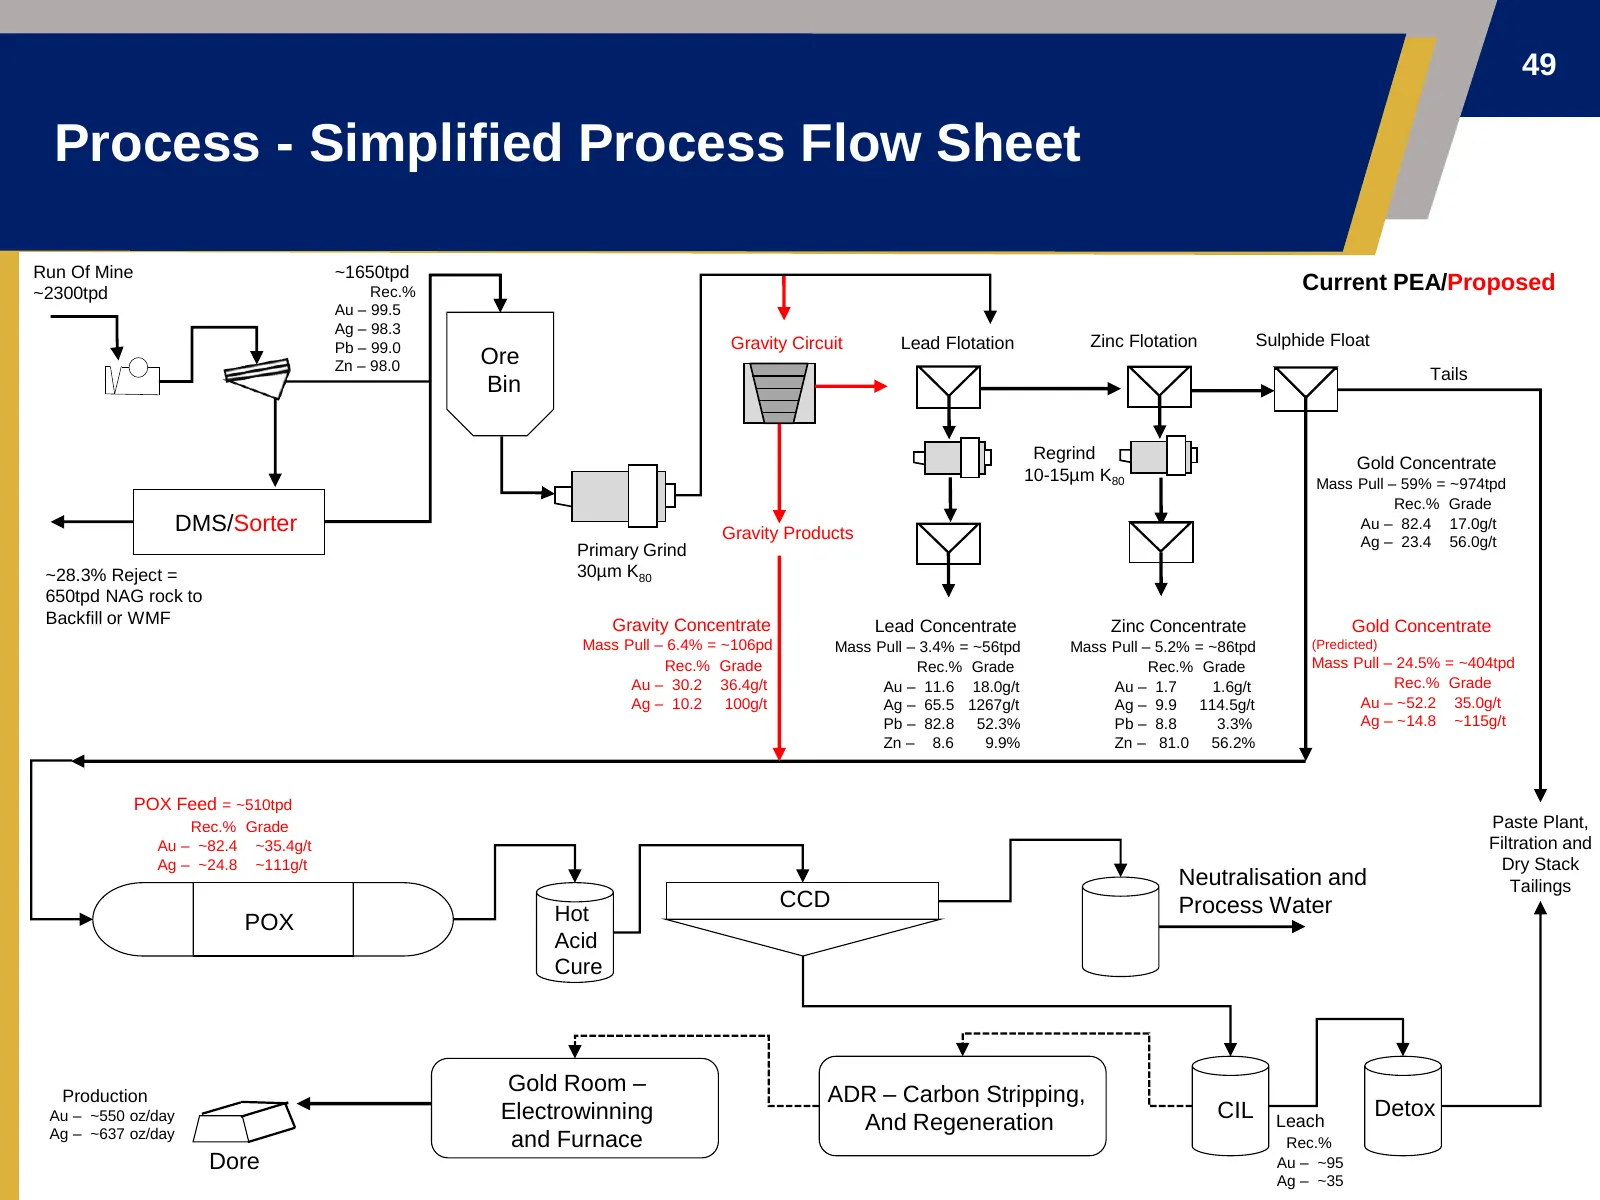
Slide 49: Process - Simplified Process Flow Sheet
49 Process - Simplified Process Flow Sheet Run Of Mine ~1650tpd ~2300tpd Rec.% Current PEA/Proposed Au – 99.5 Ag – 98.3 Pb – 99.0 Gravity Circuit Lead Flotation Zinc Flotation Sulphide Float Zn – 98.0 Ore Tails Bin Regrind Gold Concentrate 10-15µm K80 Mass Pull – 59% = ~974tpd Rec.% Grade DMS/Sorter
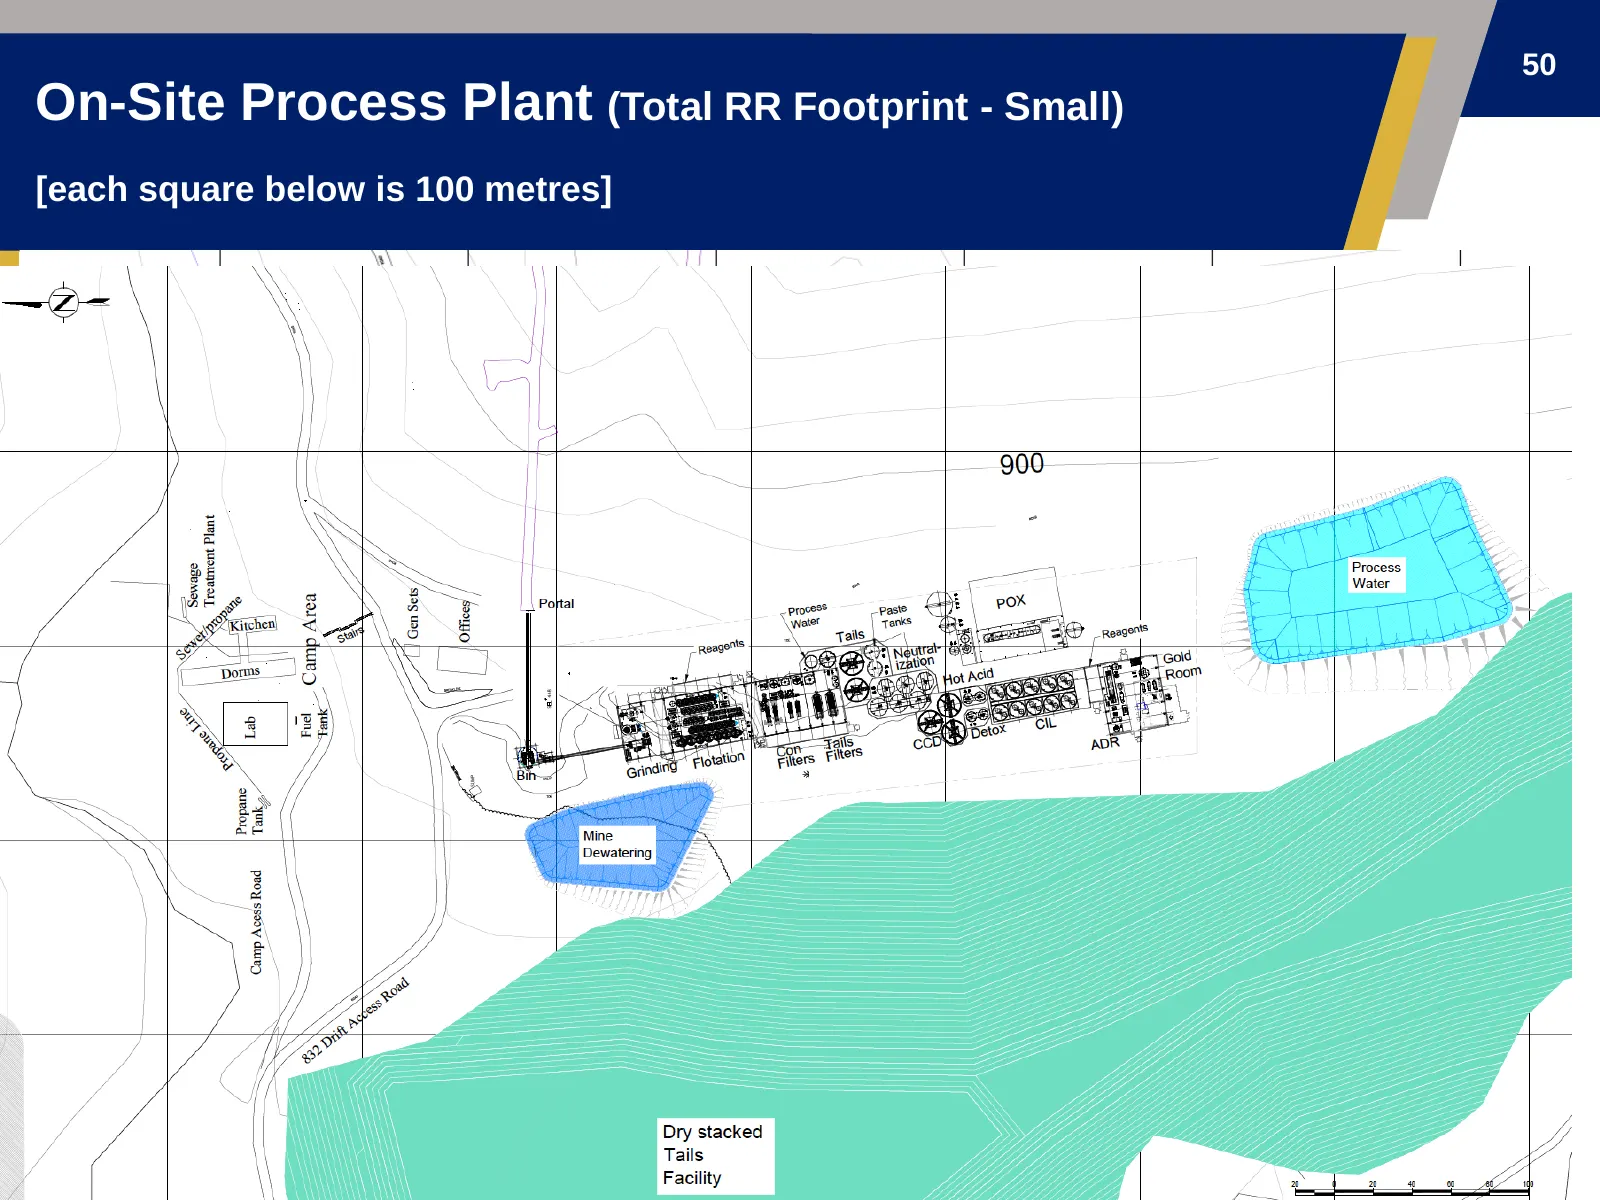
Slide 50: On-Site Process Plant (Total RR Footprint - Small)
50 On-Site Process Plant (Total RR Footprint - Small) [each square below is 100 metres]
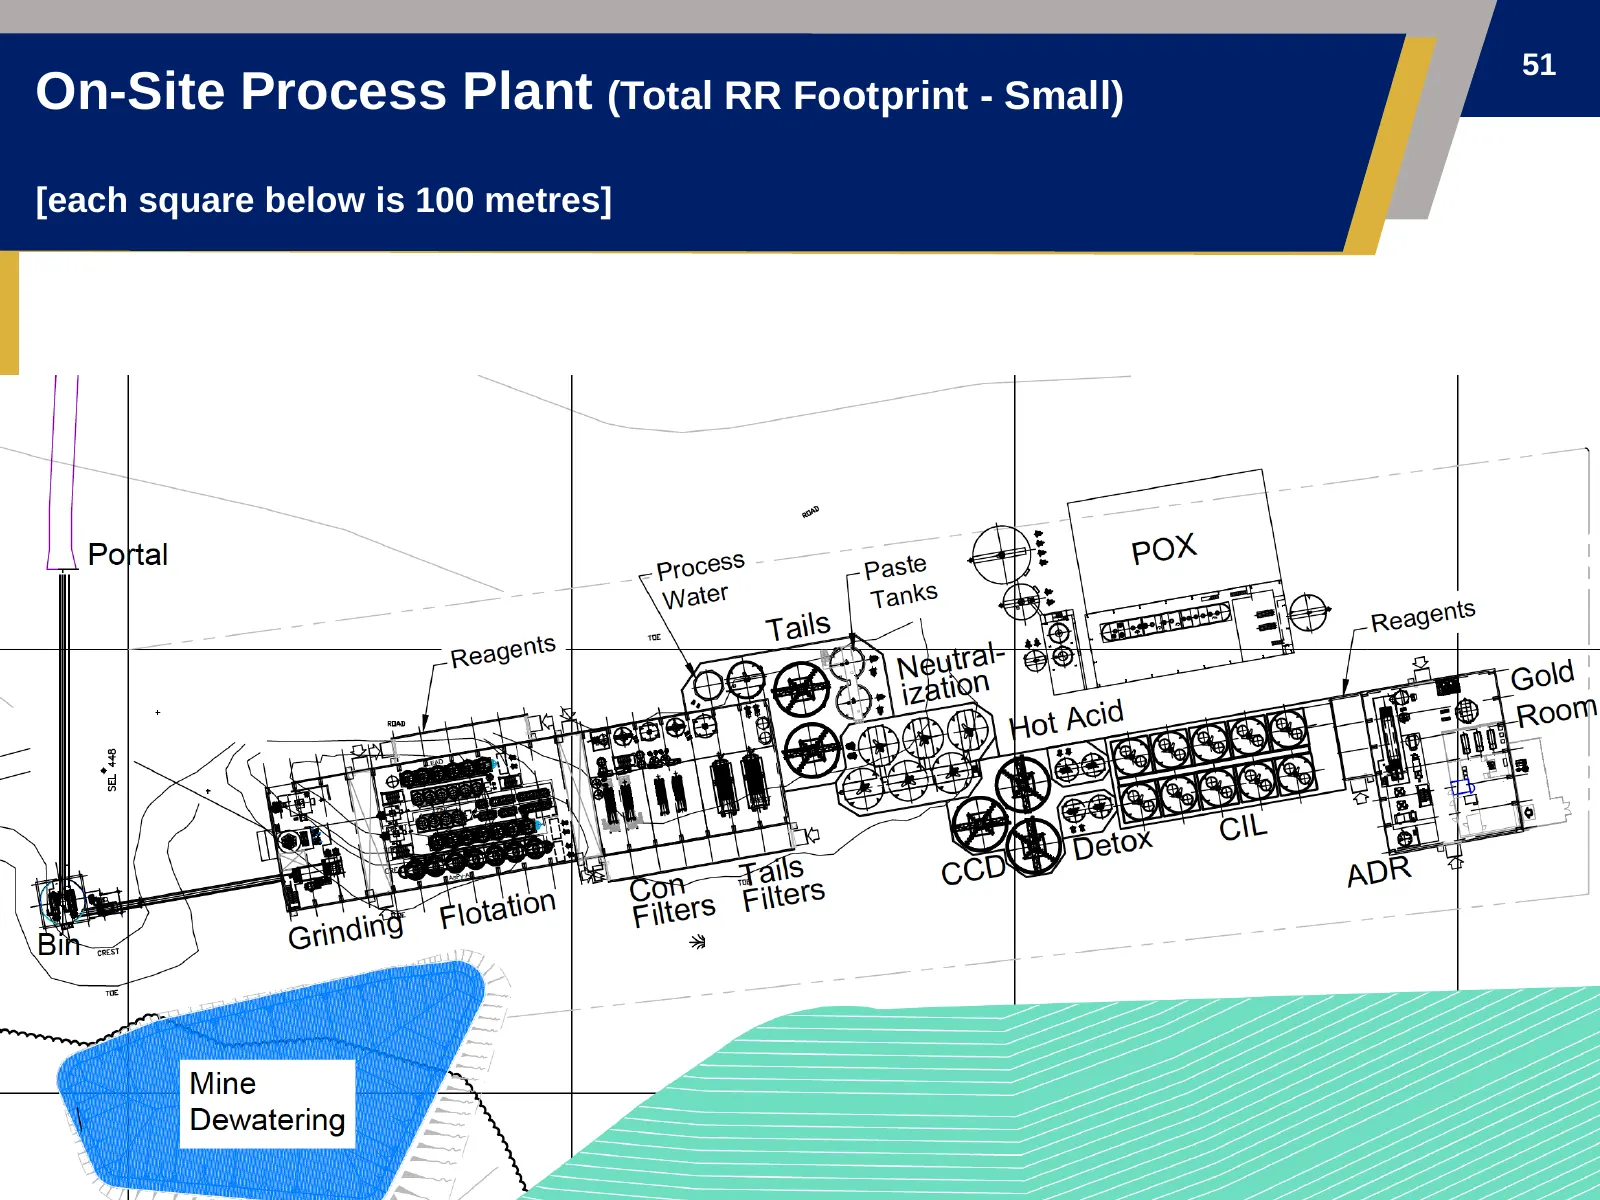
Slide 51: On-Site Process Plant (Total RR Footprint - Small)
51 On-Site Process Plant (Total RR Footprint - Small) [each square below is 100 metres]
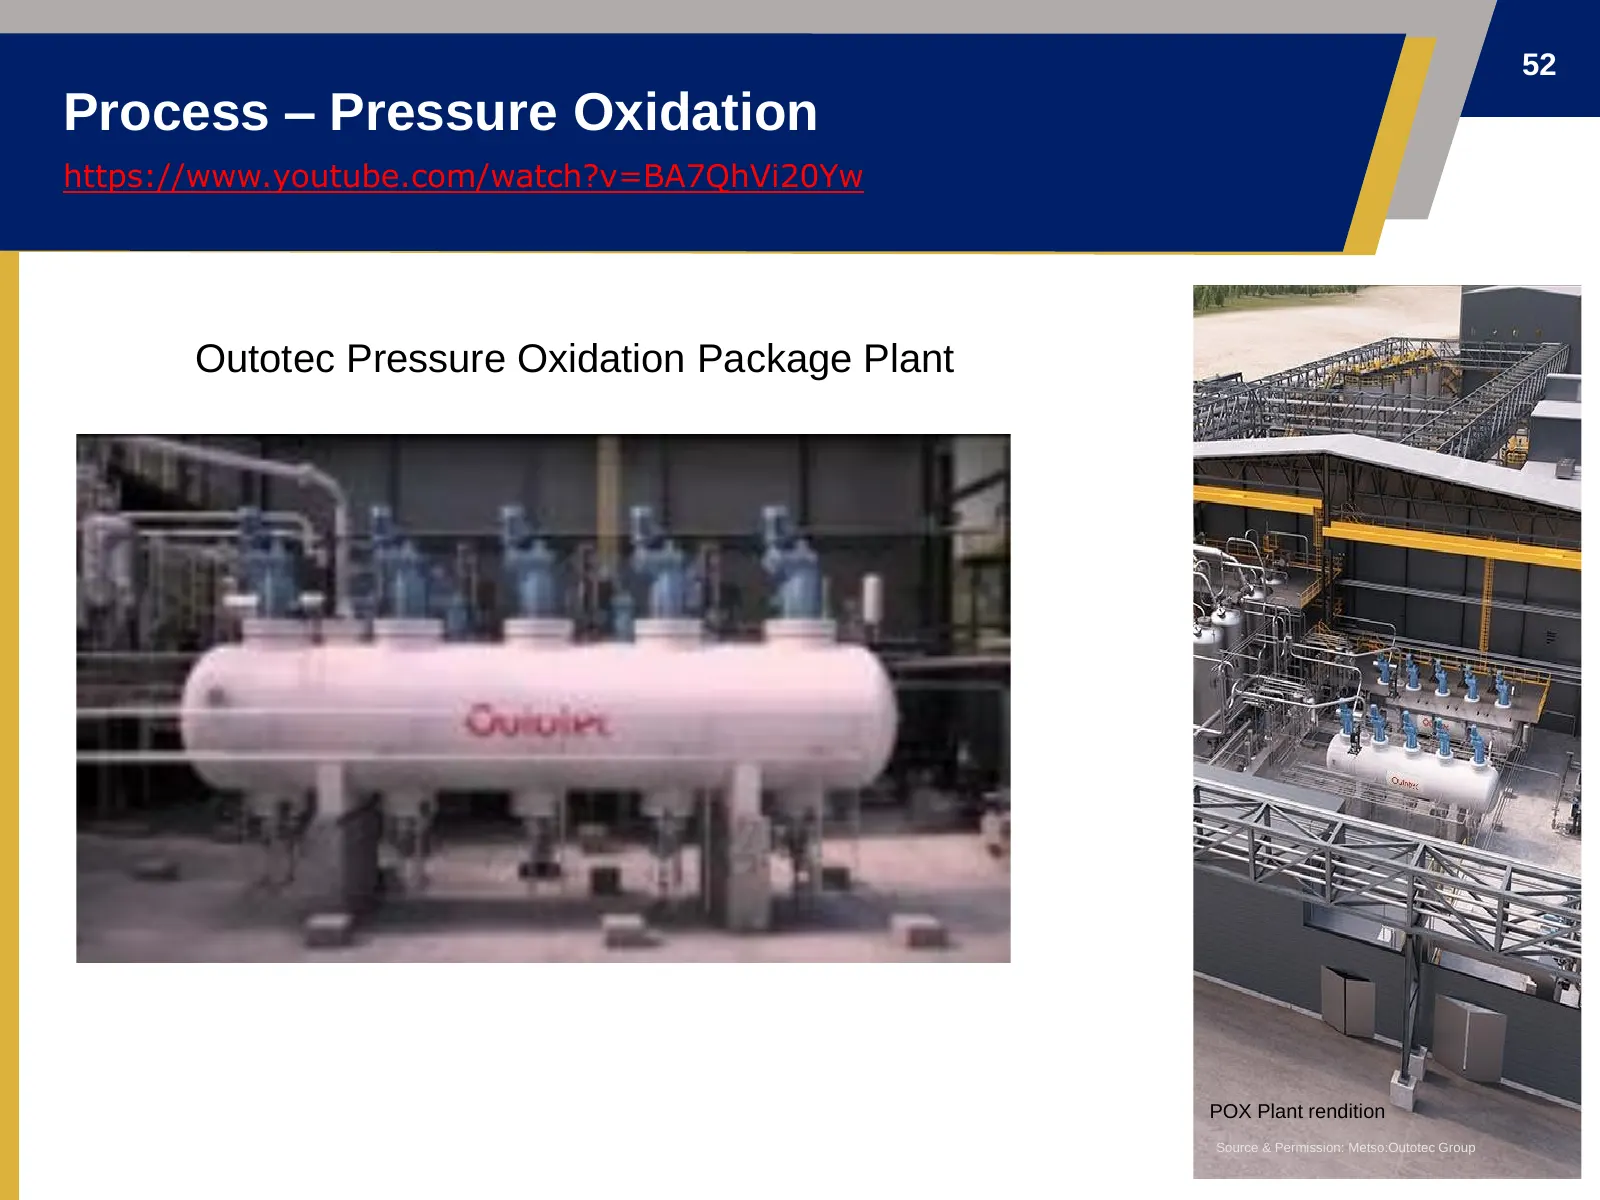
Slide 52: Process – Pressure Oxidation
52 Process – Pressure Oxidation https://www.youtube.com/watch?v=BA7QhVi20Yw Outotec Pressure Oxidation Package Plant POX Plant rendition Source & Permission: Metso:Outotec Group
Slide 53: POX Process Pressure Oxidation – What Is It?
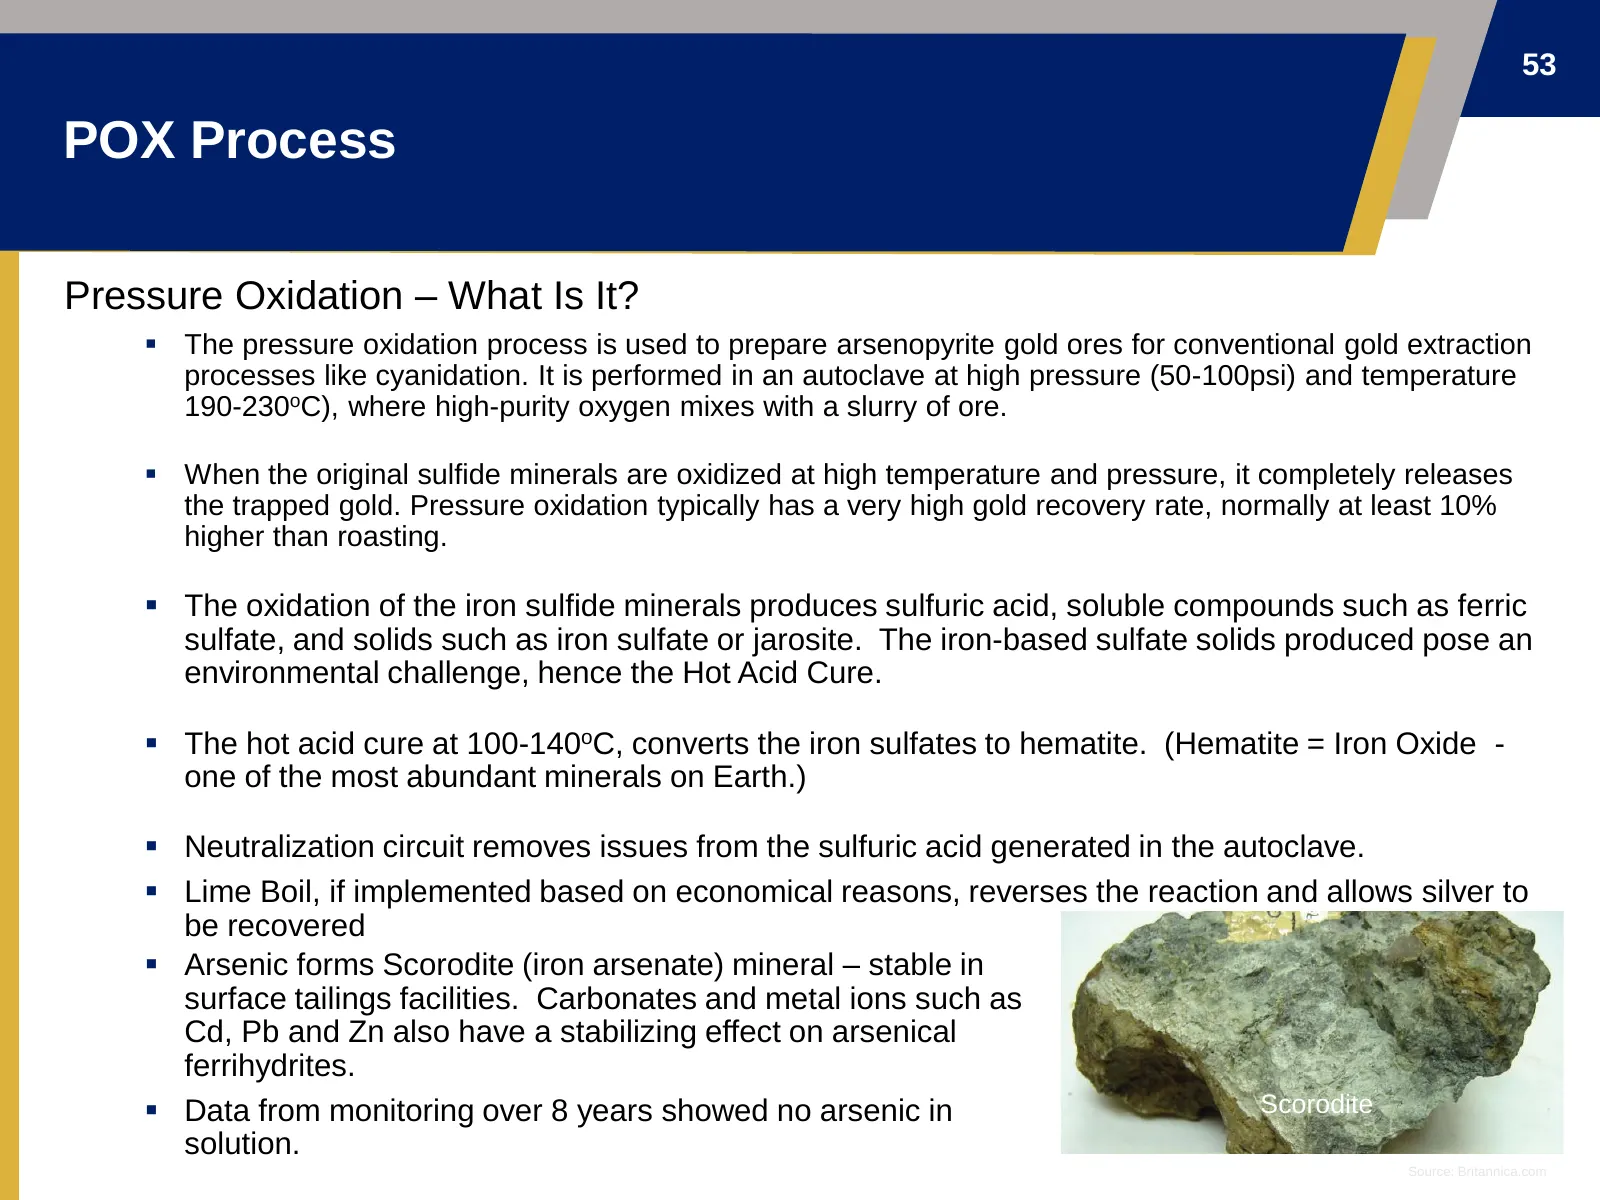
53 POX Process Pressure Oxidation – What Is It? ▪ The pressure oxidation process is used to prepare arsenopyrite gold ores for conventional gold extraction processes like cyanidation. It is performed in an autoclave at high pressure (50-100psi) and temperature 190-230oC), where high-purity oxygen mi
Slide 54: POX Process
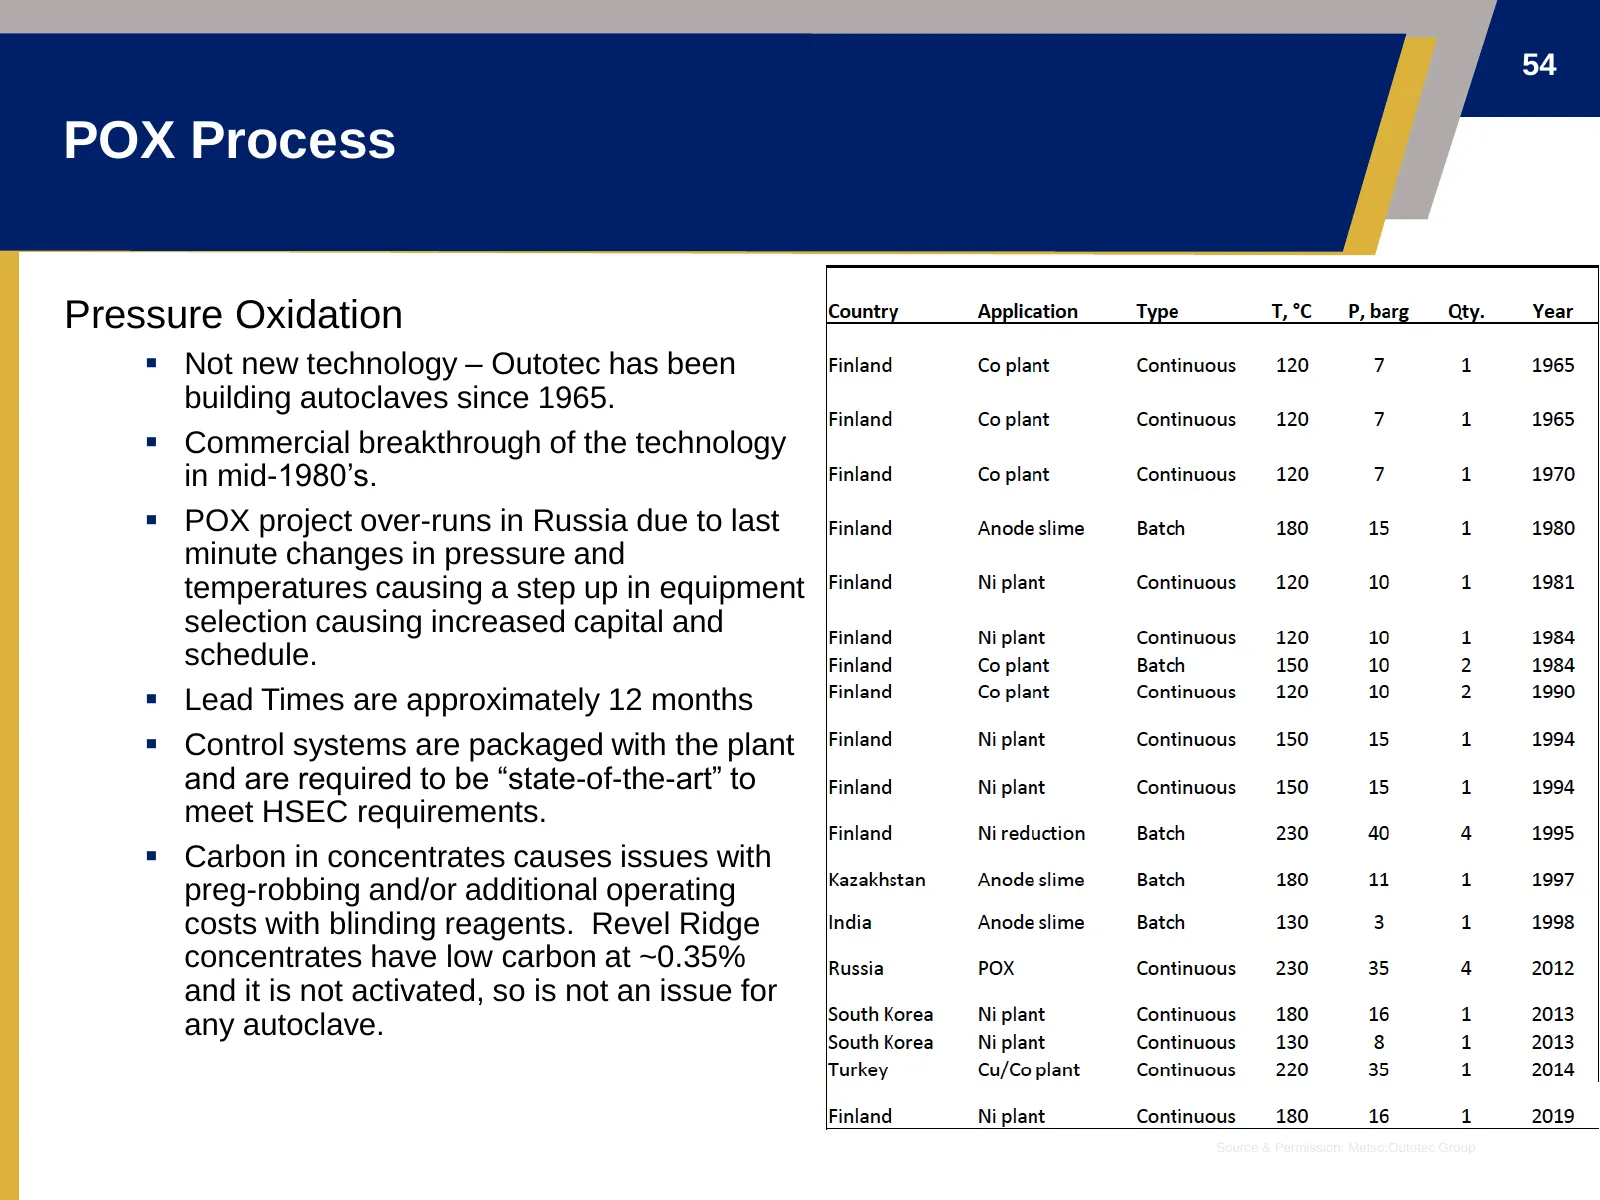
54 POX Process Pressure Oxidation ▪ Not new technology – Outotec has been building autoclaves since 1965. ▪ Commercial breakthrough of the technology in mid-1980’s. ▪ POX project over-runs in Russia due to last minute changes in pressure and temperatures causing a step up in equipment selection caus
Slide 55: 2021 Proposed Work Plan and Budget
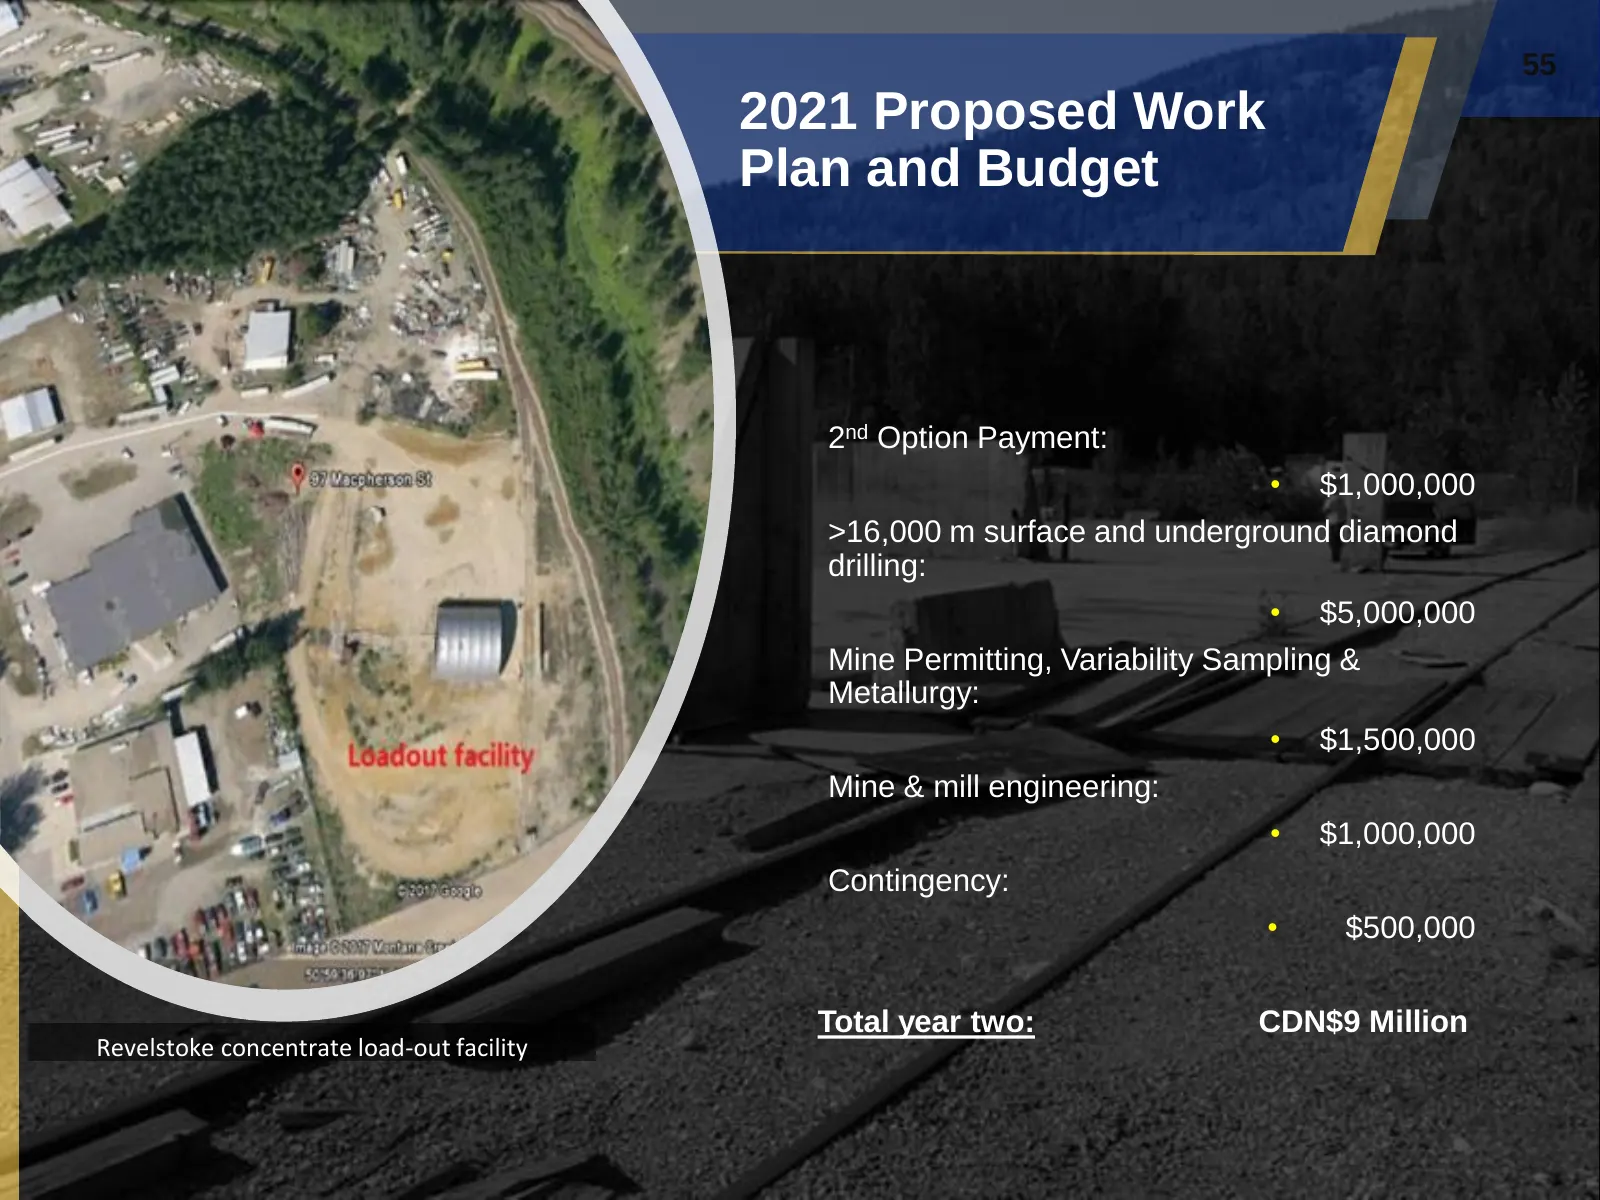
55 2021 Proposed Work Plan and Budget 2nd Option Payment: • $1,000,000 >16,000 m surface and underground diamond drilling: • $5,000,000 Mine Permitting, Variability Sampling & Metallurgy: • $1,500,000 Mine & mill engineering: • $1,000,000 Contingency: • $500,000 Total year two: CDN$9 Million Revelst
Slide 56: Summary Conclusions
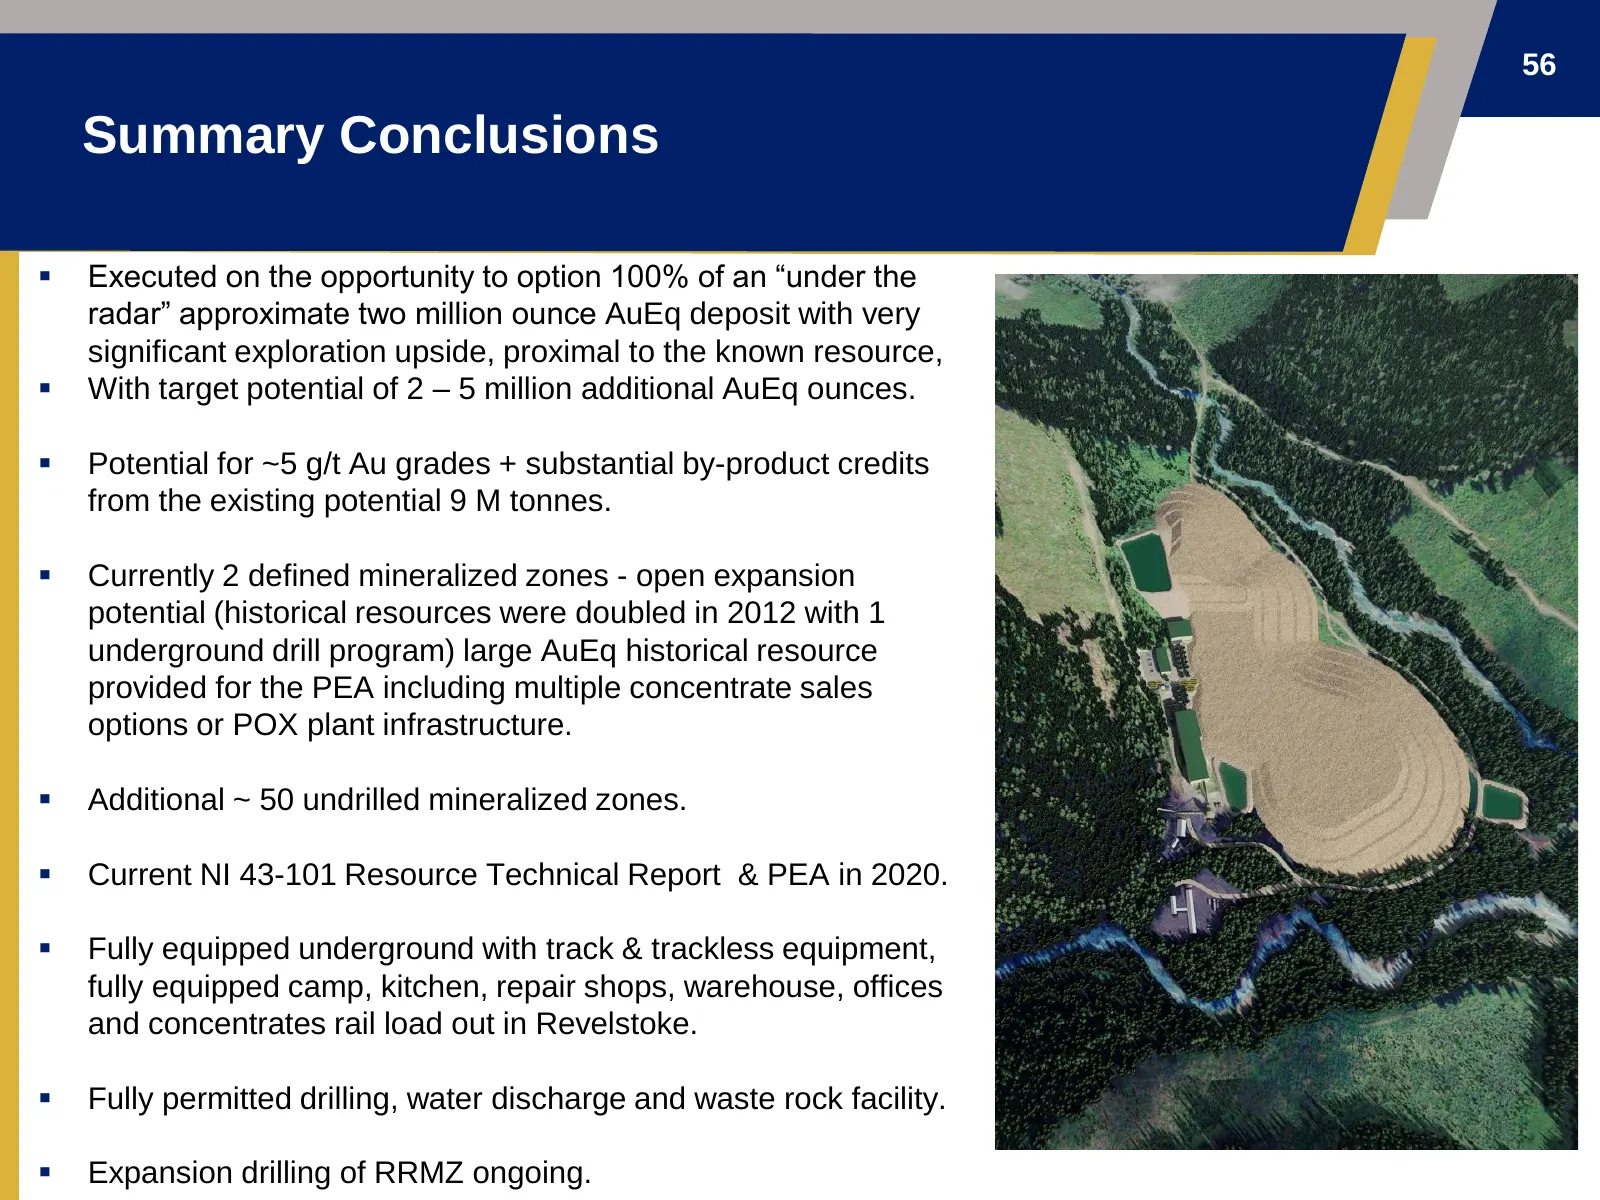
56 Summary Conclusions ▪ Executed on the opportunity to option 100% of an “under the radar” approximate two million ounce AuEq deposit with very significant exploration upside, proximal to the known resource, ▪ With target potential of 2 – 5 million additional AuEq ounces. ▪ Potential for ~5 g/t Au
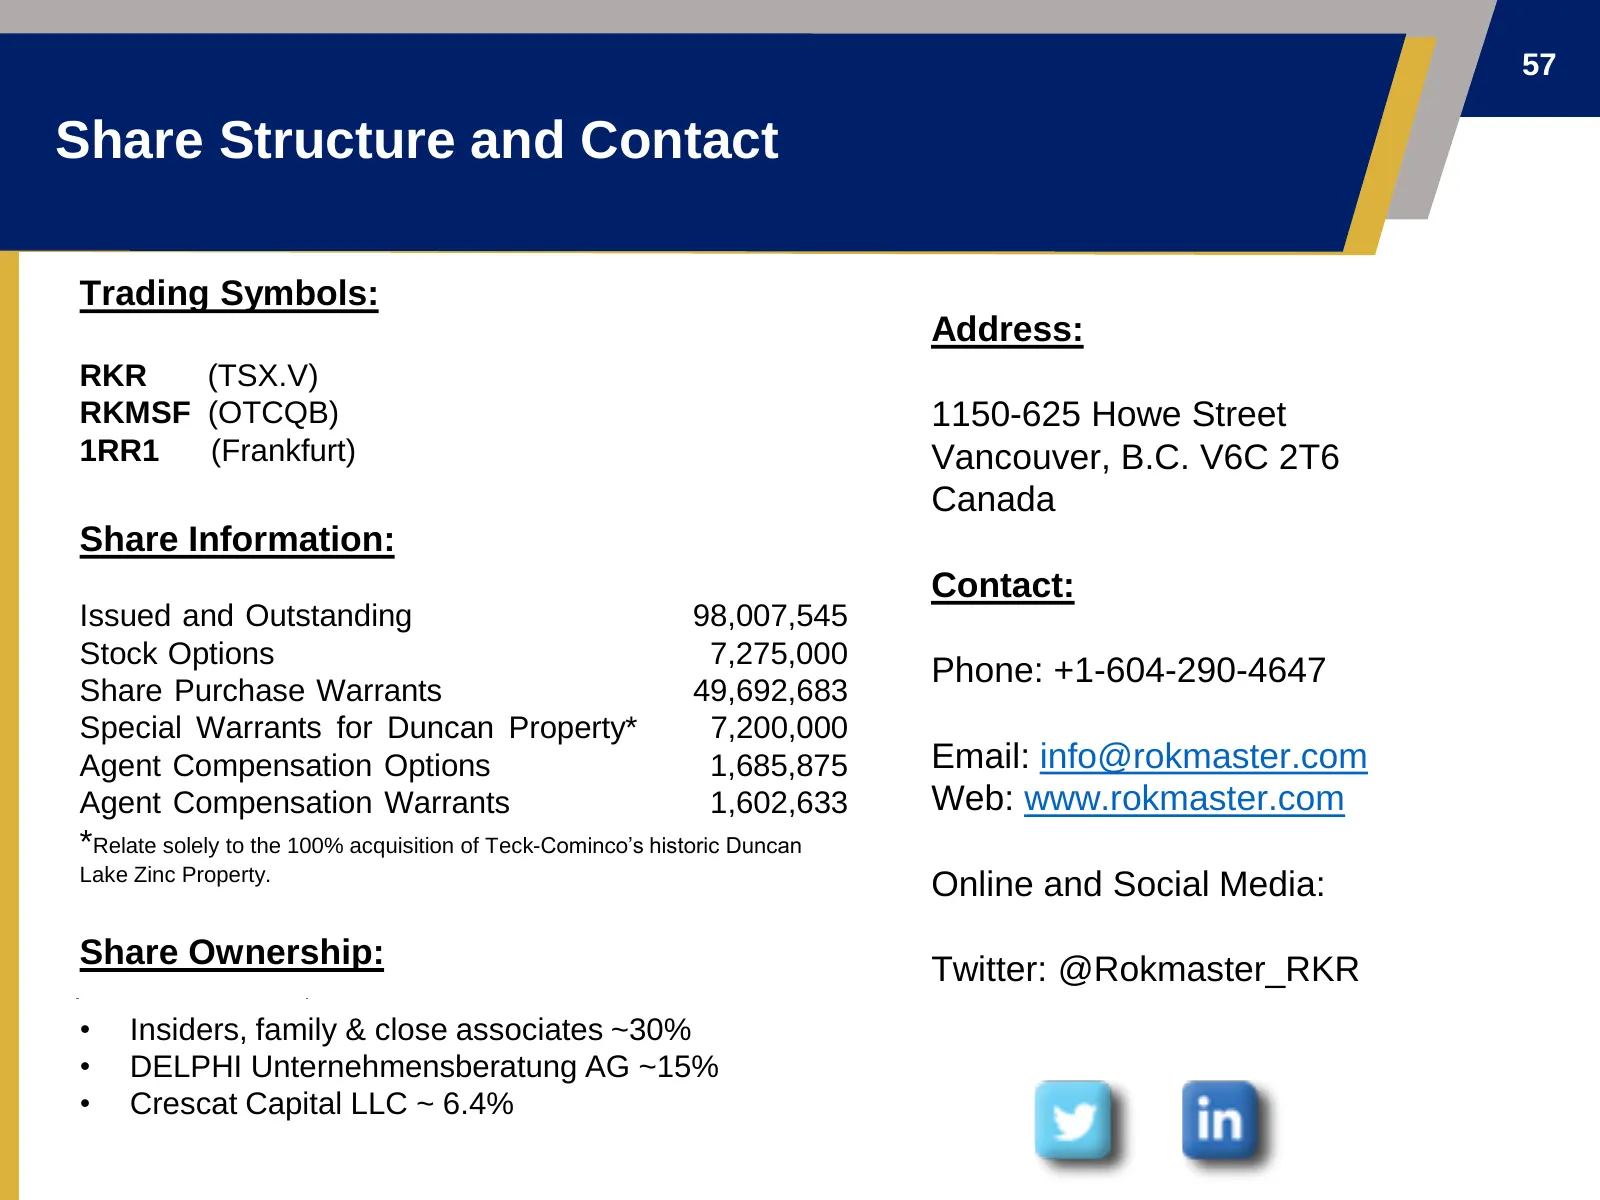
Slide 57: Share Structure and Contact
57 Share Structure and Contact Trading Symbols: Address: RKR (TSX.V) RKMSF (OTCQB) 1150-625 Howe Street 1RR1 (Frankfurt) Vancouver, B.C. V6C 2T6 Canada Share Information: Contact: Issued and Outstanding 98,007,545 Stock Options 7,275,000 Phone: +1-604-290-4647 Share Purchase Warrants 49,692,683 Spec
Source: Internet Archive copy of rokmaster.com
More decks from Rokmaster Resources Corp.
 Investor Presentation (November 2026)38 slides · November 2026
 Investor Presentation (October 2026)36 slides · October 2026
 Investor Presentation (September 2026)36 slides · September 2026
 Investor Presentation (October 2023)32 slides · October 2023
 Investor Presentation (June 2023)31 slides · June 2023
 Investor Presentation (March 2023)31 slides · March 2023