Curo — Investor Presentation (June 2018)
28 slides from Curo's investor presentation, Jun 4, 2018

Slide 1: June 2018 Investor Presentation
June 2018 :: Investor Presentation
Slide 2: Disclaimer
Disclaimer IMPORTANT: You must read the following information before continuing to the rest of the presentation. This presentation has been prepared by CURO Group Holdings Corp. and its subsidiaries (collectively, “we,” “us” or the “Company”) and is being provided to you for informational purposes o
Slide 3: Executive Leadership
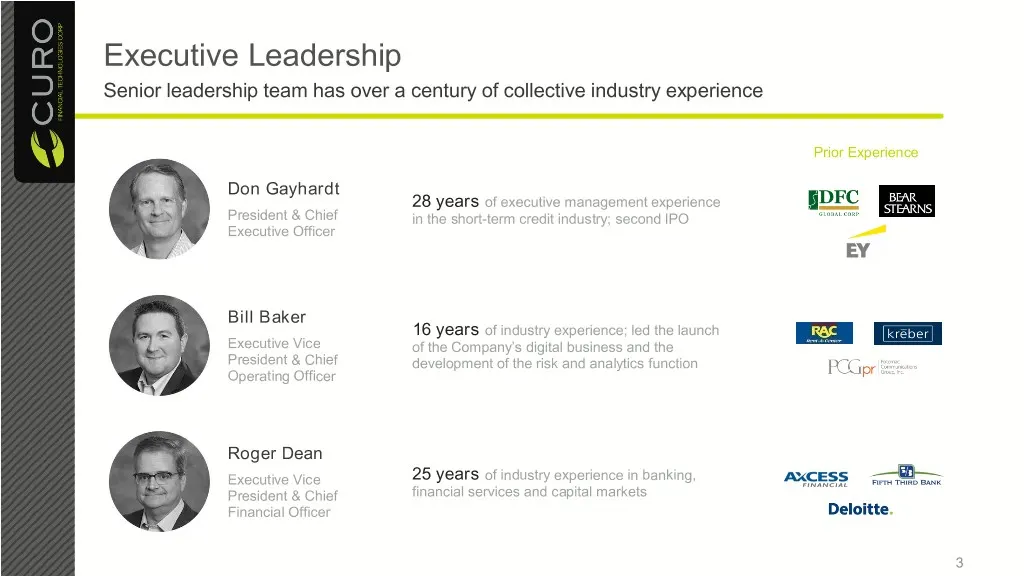
Executive Leadership Senior leadership team has over a century of collective industry experience Prior Experience Don Gayhardt 28 years of executive management experience President & Chief in the short-term credit industry; second IPO Executive Officer Bill Baker 16 years of industry experience; led
Slide 4: Recent Developments
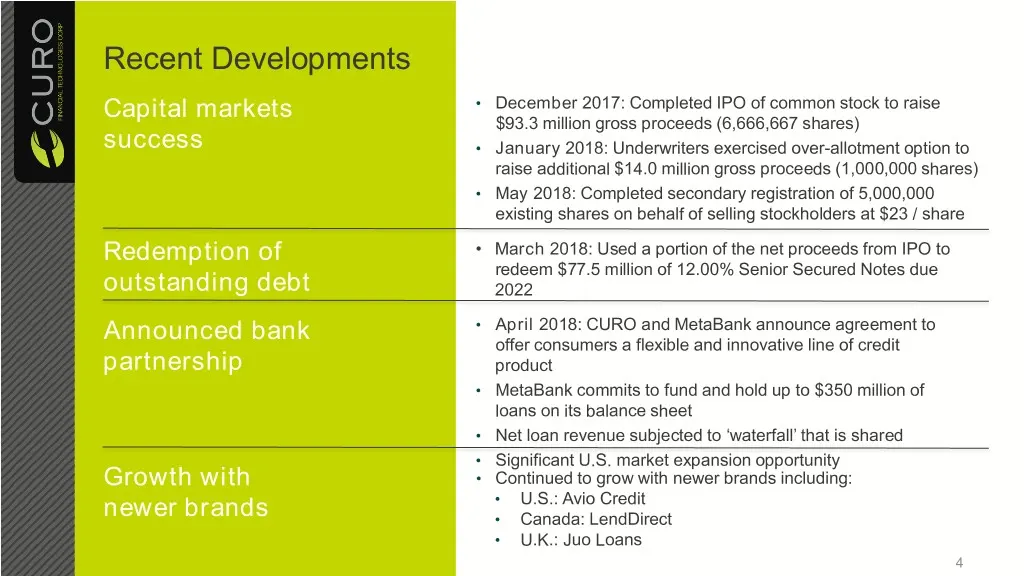
Recent Developments Capital markets • December 2017: Completed IPO of common stock to raise $93.3 million gross proceeds (6,666,667 shares) success • January 2018: Underwriters exercised over-allotment option to raise additional $14.0 million gross proceeds (1,000,000 shares) • May 2018: Completed s
Slide 5: Continued Success Since IPO
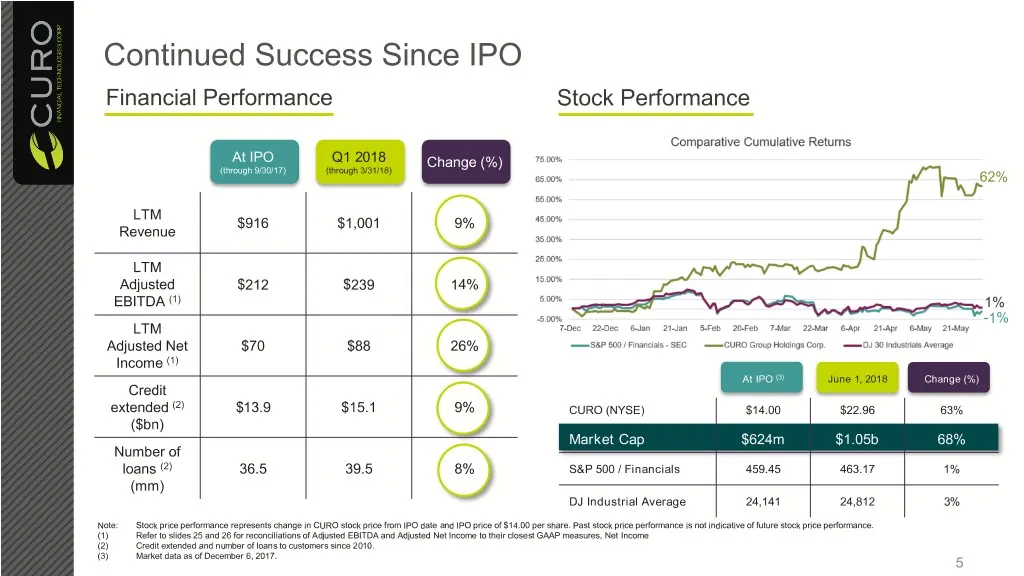
Continued Success Since IPO Financial Performance Stock Performance At IPO Q1 2018 Change (%) (through 9/30/17) (through 3/31/18) 62% LTM $916 $1,001 9% Revenue LTM Adjusted $212 $239 14% EBITDA (1) 1% -1% LTM Adjusted Net $70 $88 26% Income (1) At IPO (3) June 1, 2018 Change (%) Credit extended (2)
Slide 6: Key Investment Highlights
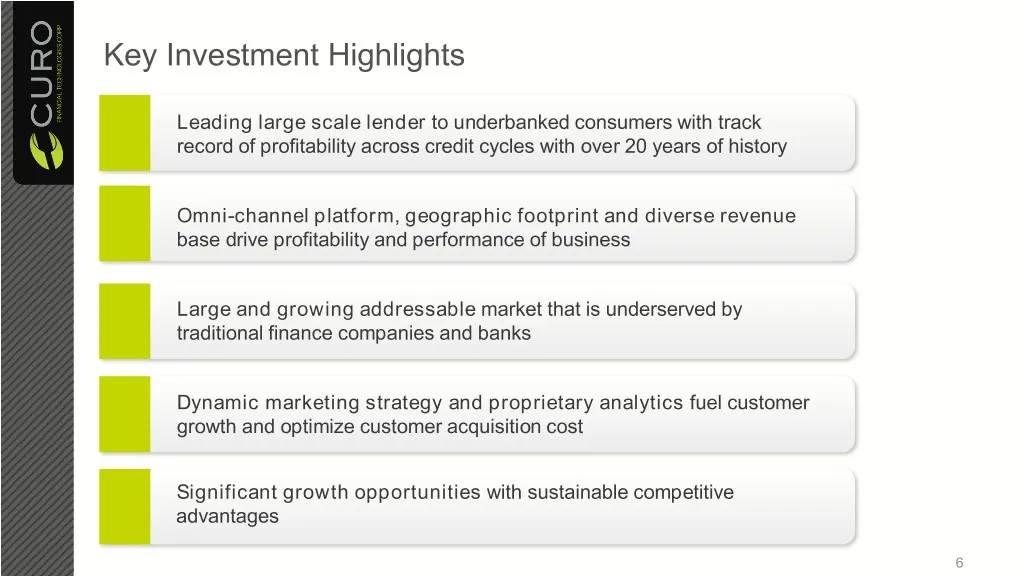
Key Investment Highlights Leading large scale lender to underbanked consumers with track record of profitability across credit cycles with over 20 years of history Omni-channel platform, geographic footprint and diverse revenue base drive profitability and performance of business Large and growing a
Slide 7: Leading Large Scale Lender To Underbanked Consumers
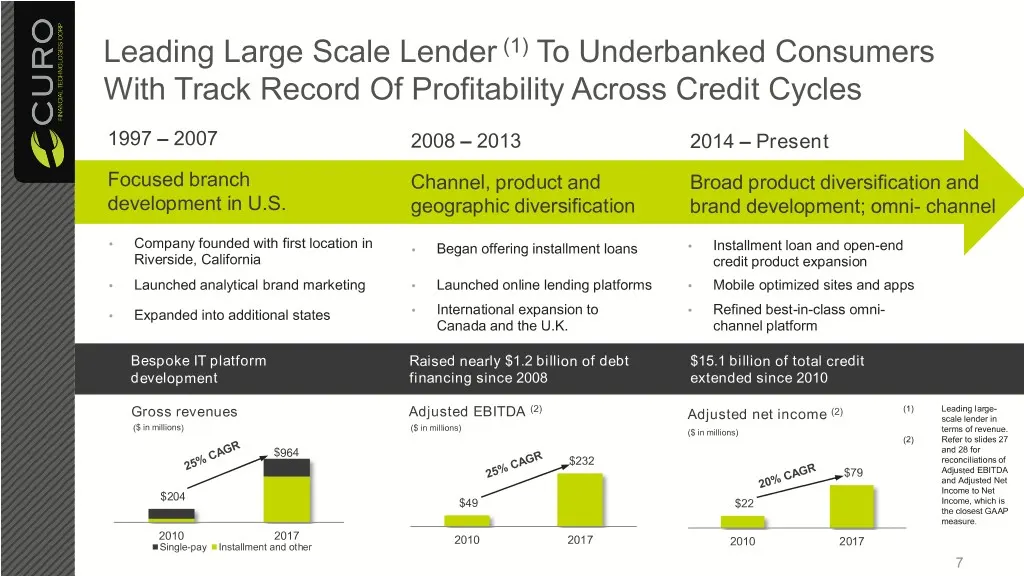
Leading Large Scale Lender (1) To Underbanked Consumers With Track Record Of Profitability Across Credit Cycles 1997 – 2007 2008 – 2013 2014 – Present Focused branch Channel, product and Broad product diversification and development in U.S. geographic diversification brand development; omni- channel
Slide 8: Omni-channel Platform Supports "Call, Click or Come-In"
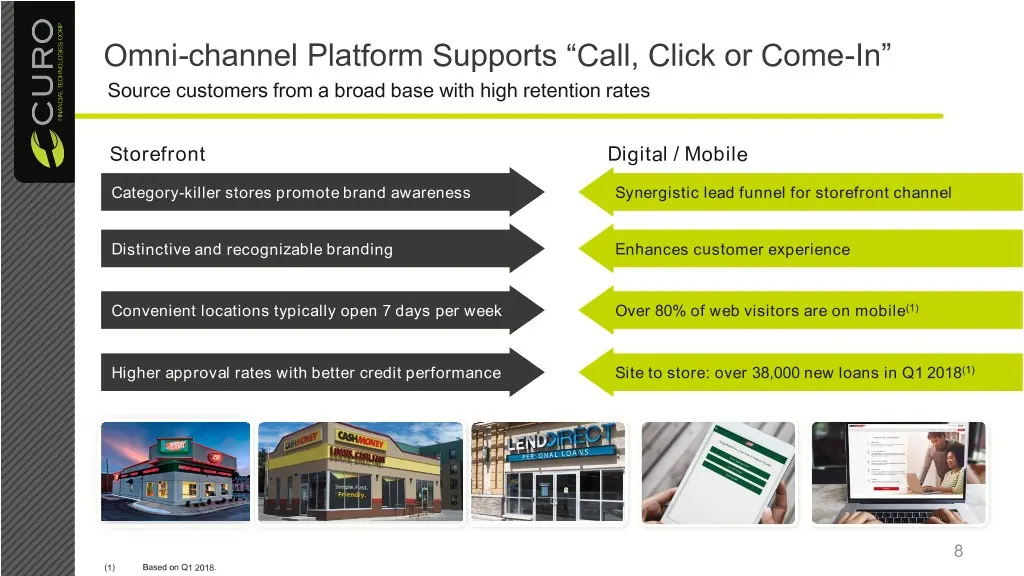
Omni-channel Platform Supports “Call, Click or Come-In” Source customers from a broad base with high retention rates Storefront Digital / Mobile Category-killer stores promote brand awareness Synergistic lead funnel for storefront channel Distinctive and recognizable branding Enhances customer exper
Slide 9: Broad geographic footprint
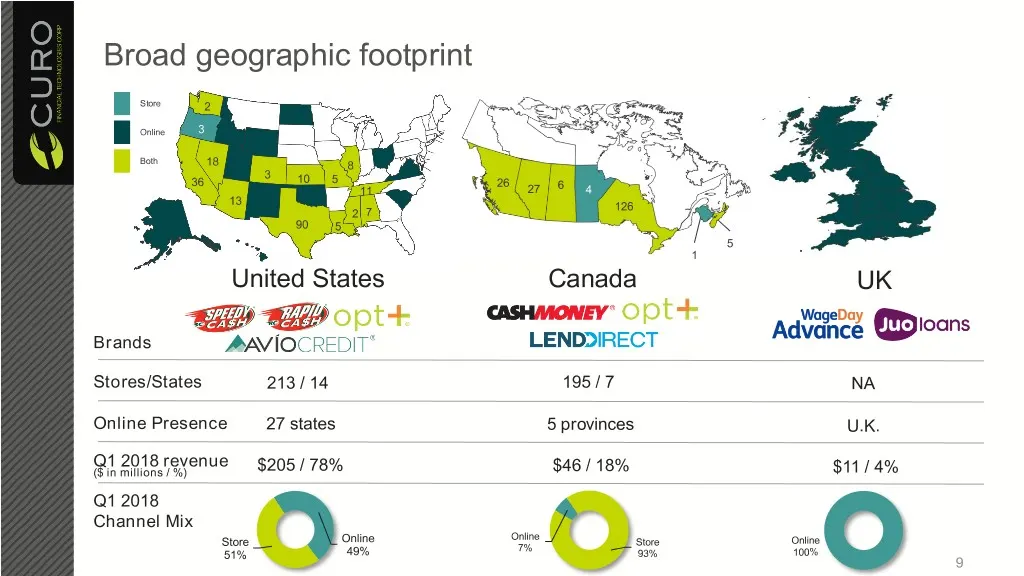
Broad geographic footprint Store 2 Online 3 Both 18 8 3 10 5 36 26 6 11 27 4 13 126 2 7 90 5 5 1 United States Canada UK Brands Stores/States 213 / 14 195 / 7 NA Online Presence 27 states 5 provinces U.K. Q1 2018 revenue ($ in millions / %) $205 / 78% $46 / 18% $11 / 4% Q1 2018 Channel Mix Online St
Slide 10: Comprehensive Product Offerings And Diversified Revenue
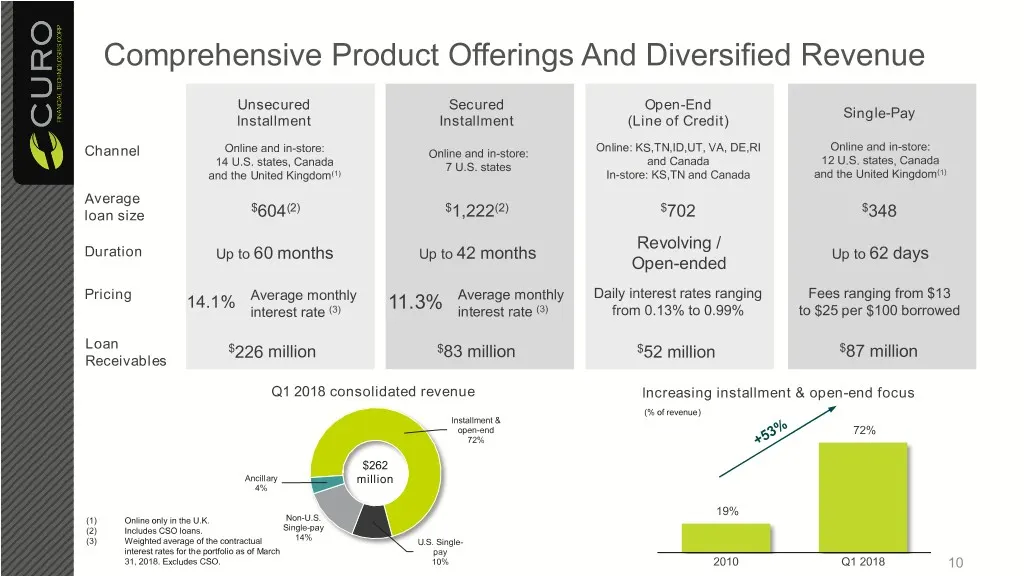
Comprehensive Product Offerings And Diversified Revenue Unsecured Secured Open-End Single-Pay Installment Installment (Line of Credit) Online: KS,TN,ID,UT, VA, DE,RI Online and in-store: Channel Online and in-store: Online and in-store: and Canada 12 U.S. states, Canada 14 U.S. states, Canada 7 U.S.
Slide 11: Large And Growing Addressable Market
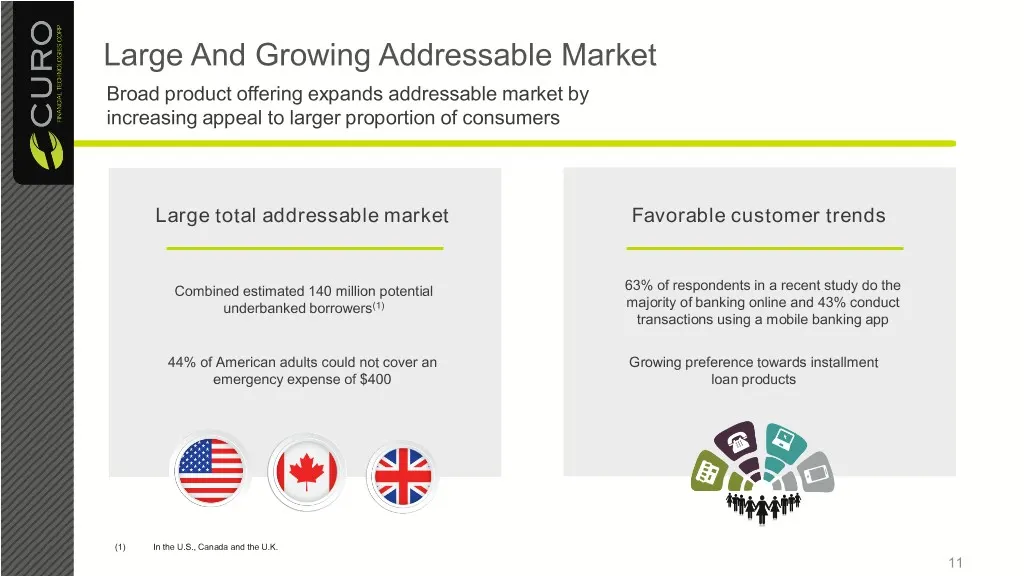
Large And Growing Addressable Market Broad product offering expands addressable market by increasing appeal to larger proportion of consumers Large total addressable market Favorable customer trends Combined estimated 140 million potential 63% of respondents in a recent study do the underbanked borr
Slide 12: Market Is Underserved By Traditional Finance Companies
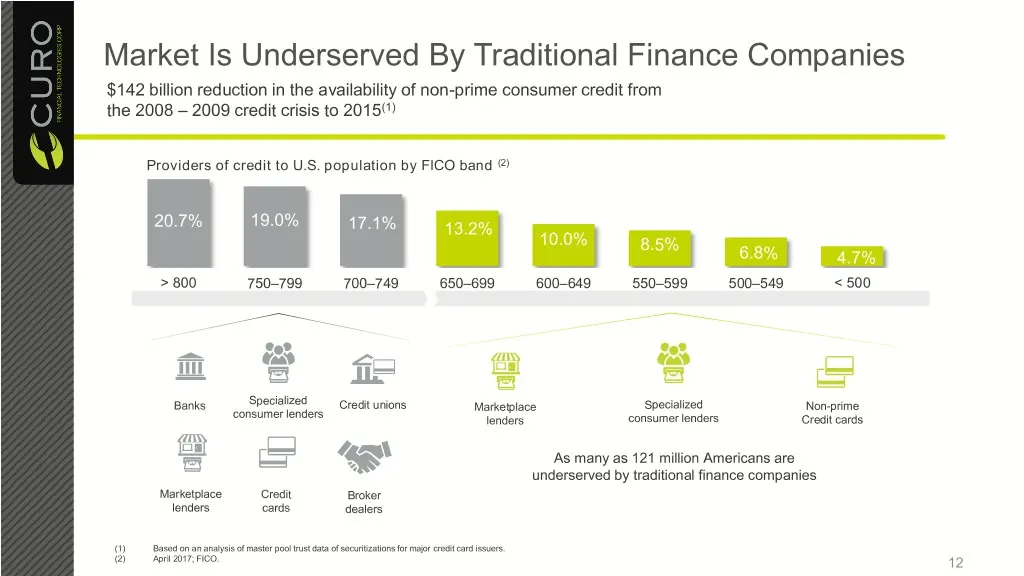
Market Is Underserved By Traditional Finance Companies $142 billion reduction in the availability of non-prime consumer credit from the 2008 – 2009 credit crisis to 2015(1) Providers of credit to U.S. population by FICO band (2) 20.7% 19.0% 17.1% 13.2% 10.0% 8.5% 6.8% 4.7% > 800 750–799 700–749 650–
Slide 13: Market Trends Favoring CURO: Shift To Online & Installment
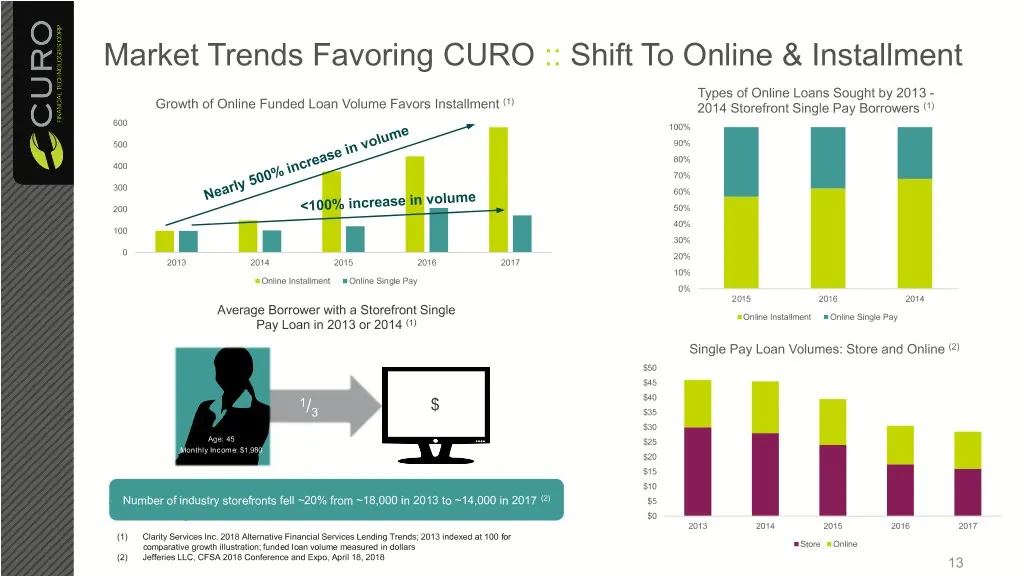
Market Trends Favoring CURO :: Shift To Online & Installment Types of Online Loans Sought by 2013 - (1) Growth of Online Funded Loan Volume Favors Installment 2014 Storefront Single Pay Borrowers (1) 600 100% 500 90% 80% 400 70% 300 60% 200 50% 40% 100 30% 0 20% 2013 2014 2015 2016 2017 10% Online I
Slide 14: Market Trends Favoring CURO: Underserved Market with Improving Financial Condition
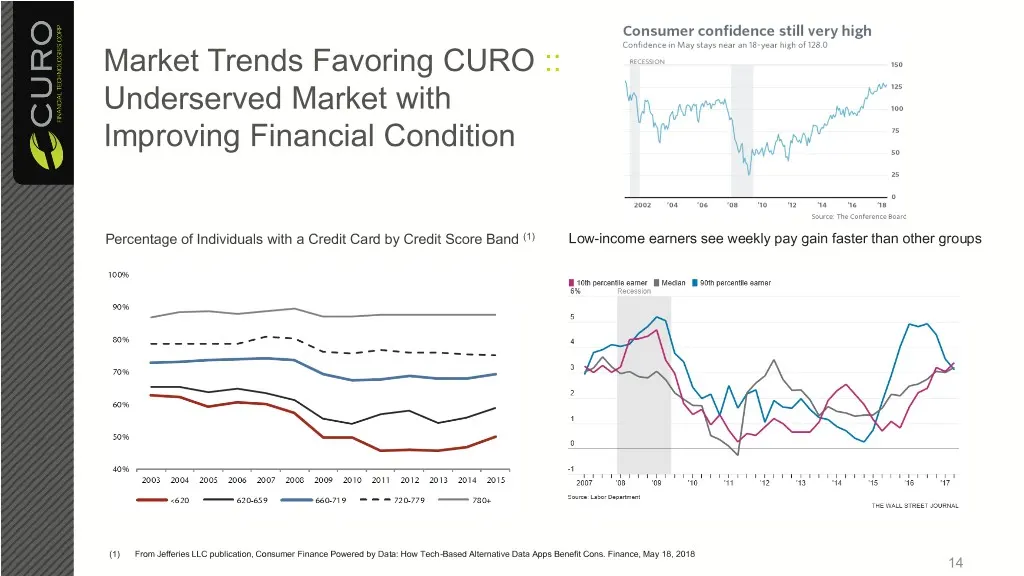
Market Trends Favoring CURO :: Underserved Market with Improving Financial Condition Percentage of Individuals with a Credit Card by Credit Score Band (1) Low-income earners see weekly pay gain faster than other groups (1) From Jefferies LLC publication, Consumer Finance Powered by Data: How Tech-Ba
Slide 15: Multi-faceted Marketing Strategy & Deep Data Analysis
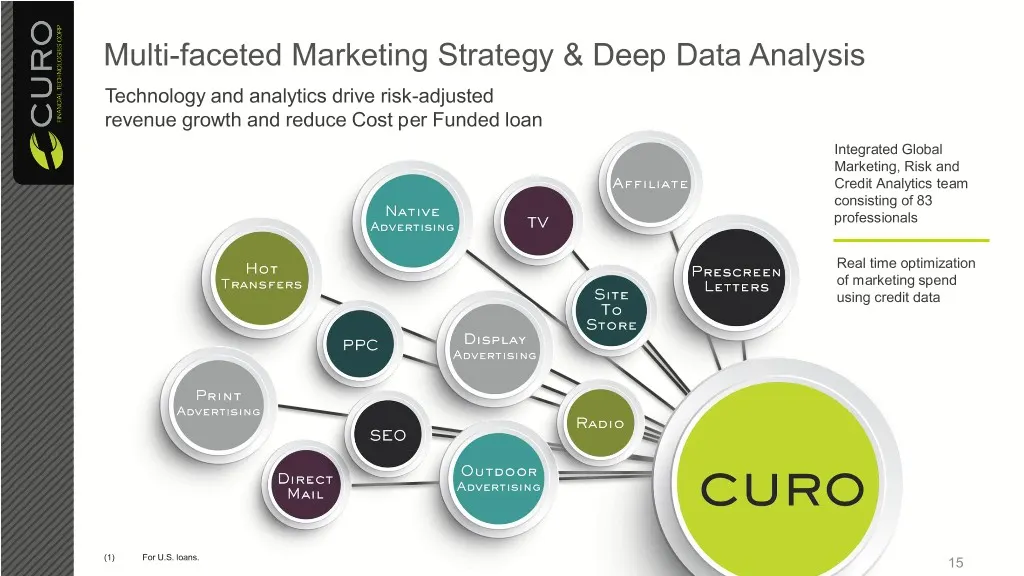
Multi-faceted Marketing Strategy & Deep Data Analysis Technology and analytics drive risk-adjusted revenue growth and reduce Cost per Funded loan Integrated Global Marketing, Risk and Credit Analytics team consisting of 83 professionals Real time optimization of marketing spend using credit data (1)
Slide 16: Centralized Analytics And IT Platform
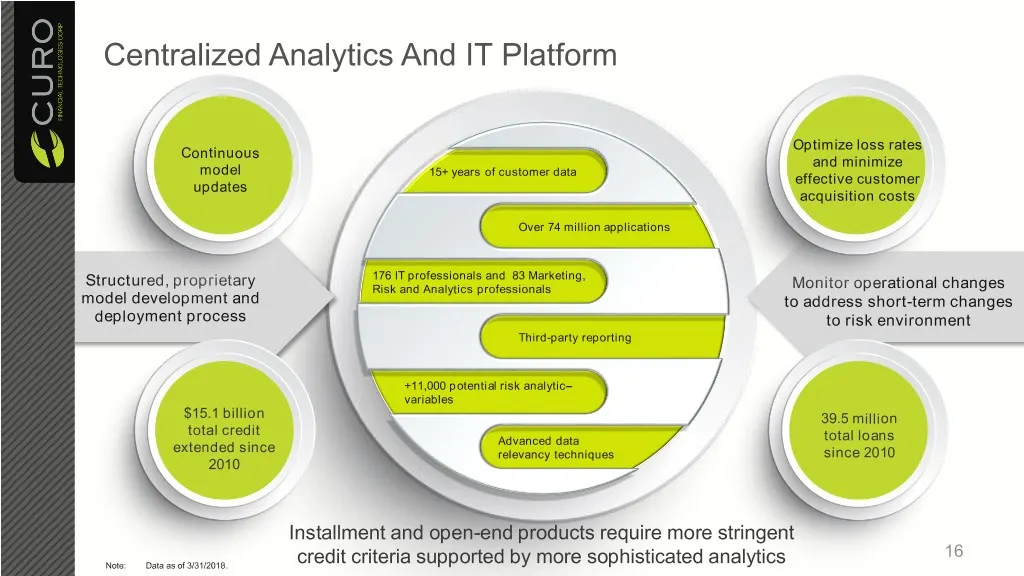
Centralized Analytics And IT Platform Optimize loss rates Continuous and minimize model 15+ years of customer data effective customer updates acquisition costs Over 74 million applications Structured, proprietary 176 IT professionals and 83 Marketing, Risk and Analytics professionals Monitor operati
Slide 17: Multiple Opportunities For Continued Growth
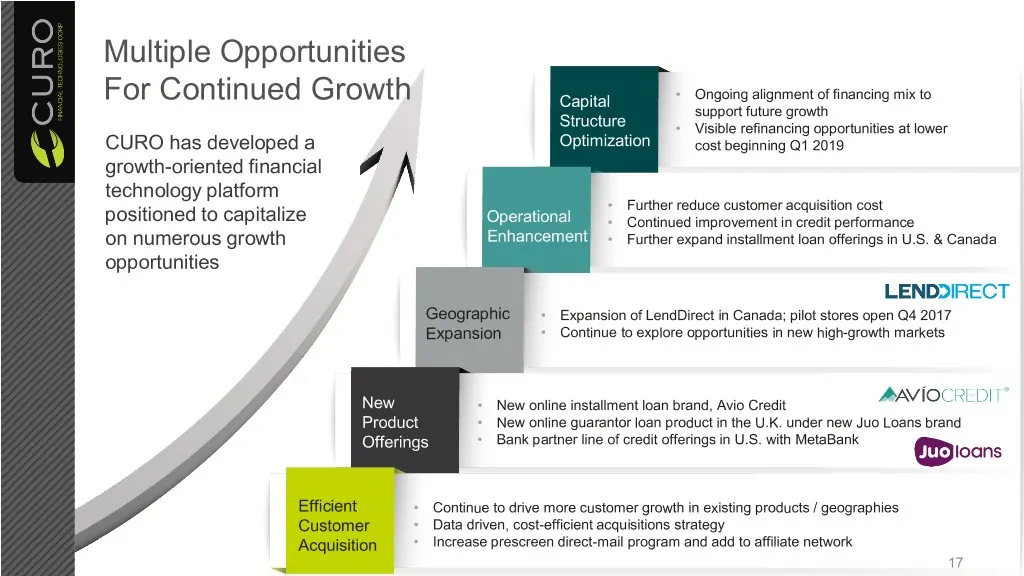
Multiple Opportunities For Continued Growth Capital • Ongoing alignment of financing mix to support future growth Structure • Visible refinancing opportunities at lower CURO has developed a Optimization cost beginning Q1 2019 growth-oriented financial technology platform • Further reduce customer ac
Slide 18: Financial Summary
Financial Summary 18
Slide 19: CURO's Operating Leverage
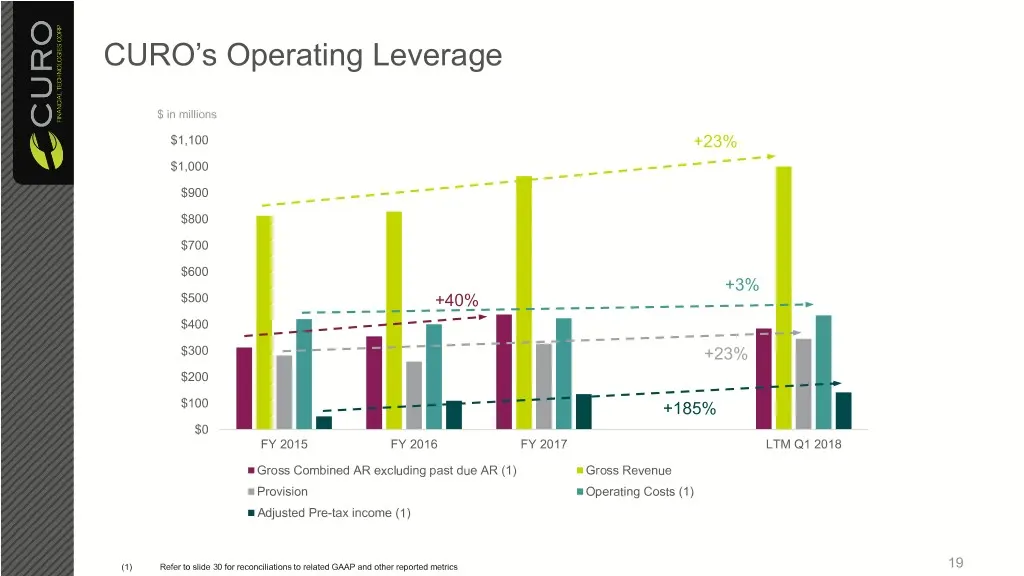
CURO’s Operating Leverage $ in millions $1,100 +23% $1,000 $900 $800 $700 $600 +3% $500 +40% $400 $300 +23% $200 $100 +185% $0 FY 2015 FY 2016 FY 2017 LTM Q1 2018 Gross Combined AR excluding past due AR (1) Gross Revenue Provision Operating Costs (1) Adjusted Pre-tax income (1) (1) Refer to slide 30
Slide 20: Continued Growth And Profitability
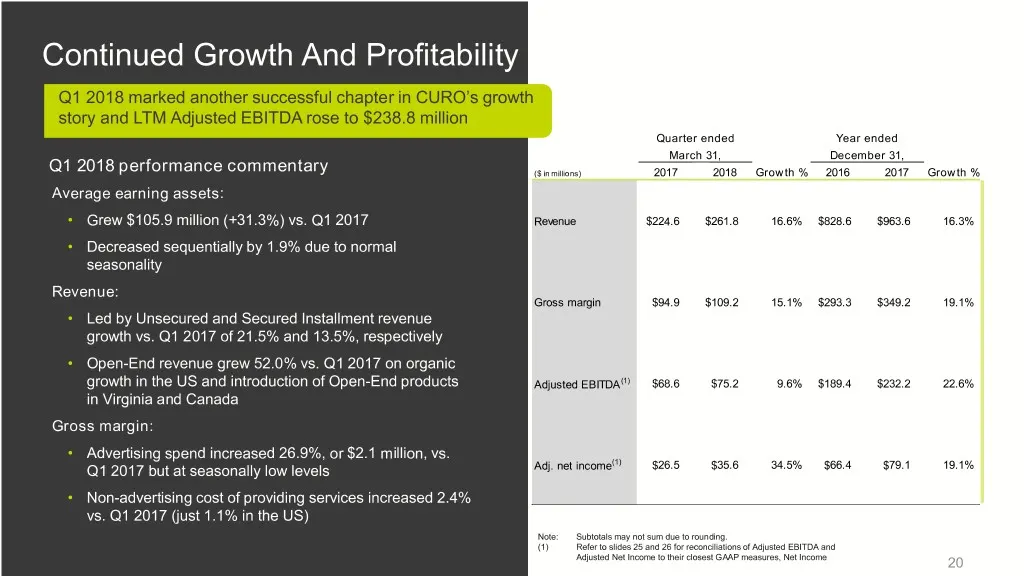
Continued Growth And Profitability Q1 2018 marked another successful chapter in CURO’s growth story and LTM Adjusted EBITDA rose to $238.8 million Quarter ended Year ended March 31, December 31, Q1 2018 performance commentary ($ in millions) 2017 2018 Growth % 2016 2017 Growth % Average earning asse
Slide 21: Historical Financial Summary: Gross Combined Loans Receivable
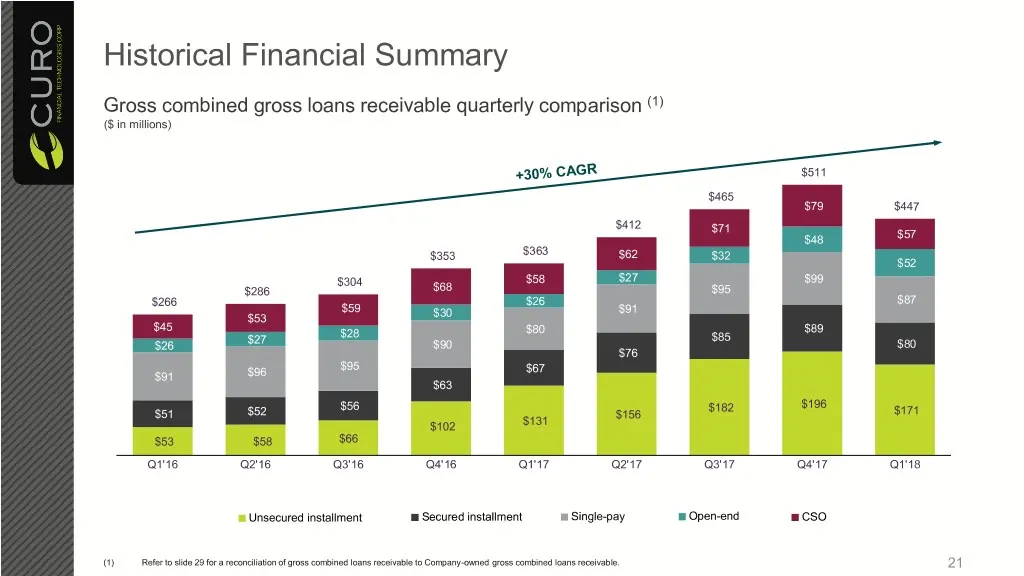
Historical Financial Summary Gross combined gross loans receivable quarterly comparison (1) ($ in millions) $511 $465 $79 $447 $412 $71 $48 $57 $353 $363 $62 $32 $52 $304 $58 $27 $99 $286 $68 $95 $266 $26 $87 $59 $91 $53 $30 $45 $28 $80 $89 $27 $85 $26 $90 $80 $76 $95 $67 $91 $96 $63 $56 $182 $196 $
Slide 22: Historical Financial Summary
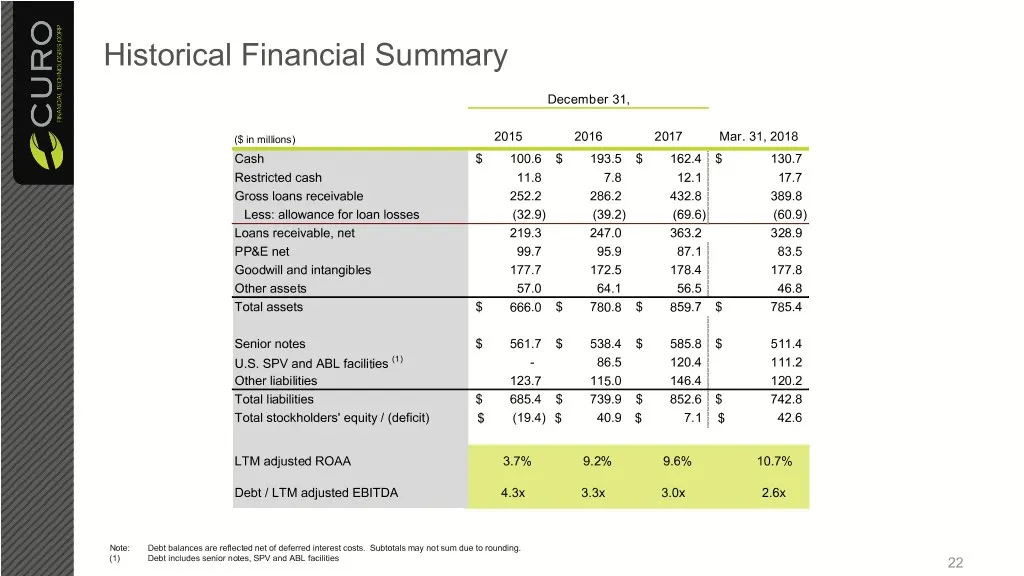
Historical Financial Summary December 31, ($ in millions) 2015 2016 2017 Mar. 31, 2018 Cash $ 100.6 $ 193.5 $ 162.4 $ 130.7 Restricted cash 11.8 7.8 12.1 17.7 Gross loans receivable 252.2 286.2 432.8 389.8 Less: allowance for loan losses (32.9) (39.2) (69.6) (60.9) Loans receivable, net 219.3 247.0
Slide 23: Key Investment Highlights
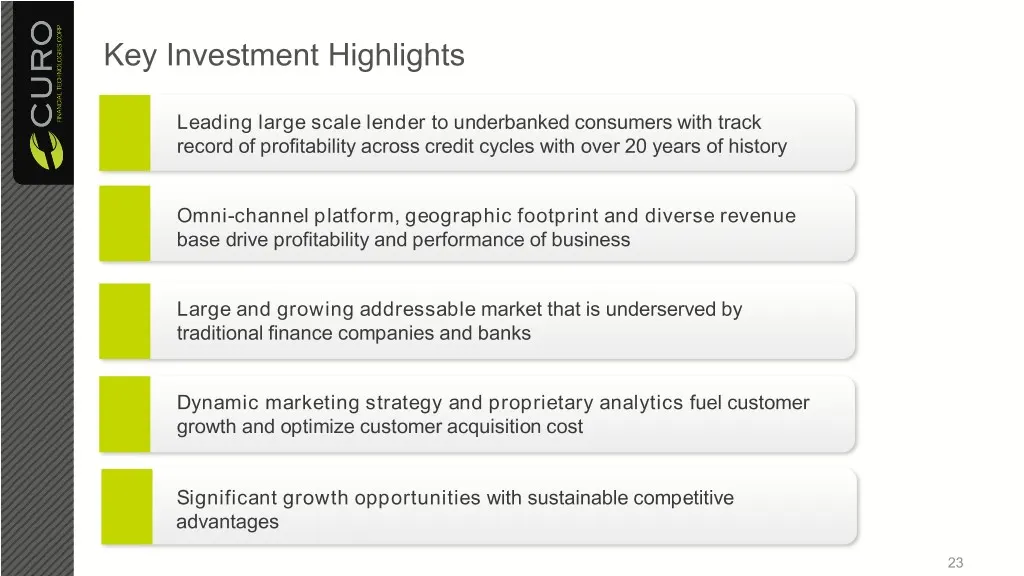
Key Investment Highlights Leading large scale lender to underbanked consumers with track record of profitability across credit cycles with over 20 years of history Omni-channel platform, geographic footprint and diverse revenue base drive profitability and performance of business Large and growing a
Slide 24: Appendix
Appendix
Slide 25: Historical Consolidated Adjusted EBITDA Reconciliation
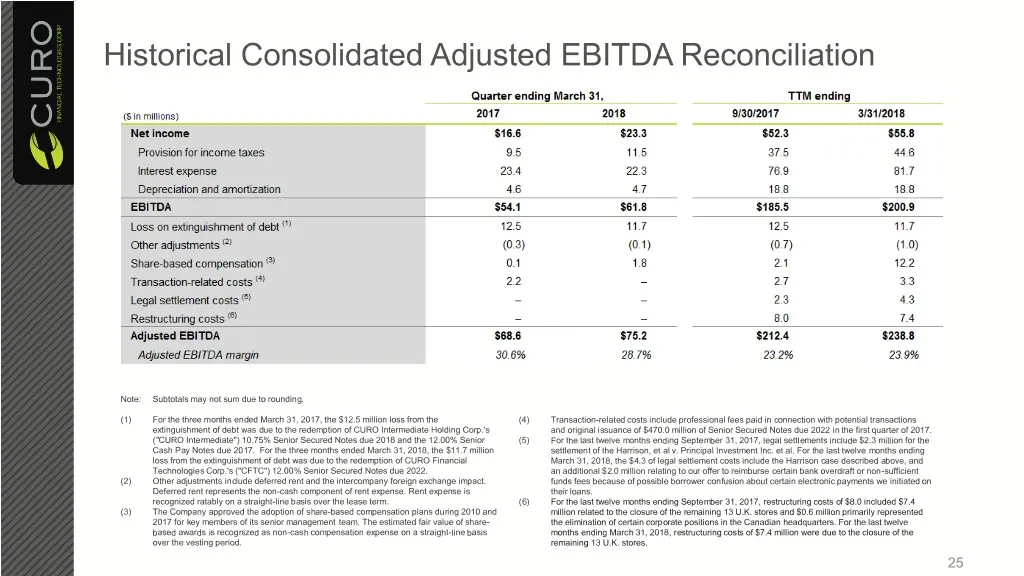
Historical Consolidated Adjusted EBITDA Reconciliation Note: Subtotals may not sum due to rounding. (1) For the three months ended March 31, 2017, the $12.5 million loss from the (4) Transaction-related costs include professional fees paid in connection with potential transactions extinguishment of
Slide 26: Historical Consolidated Adjusted Net Income Reconciliation
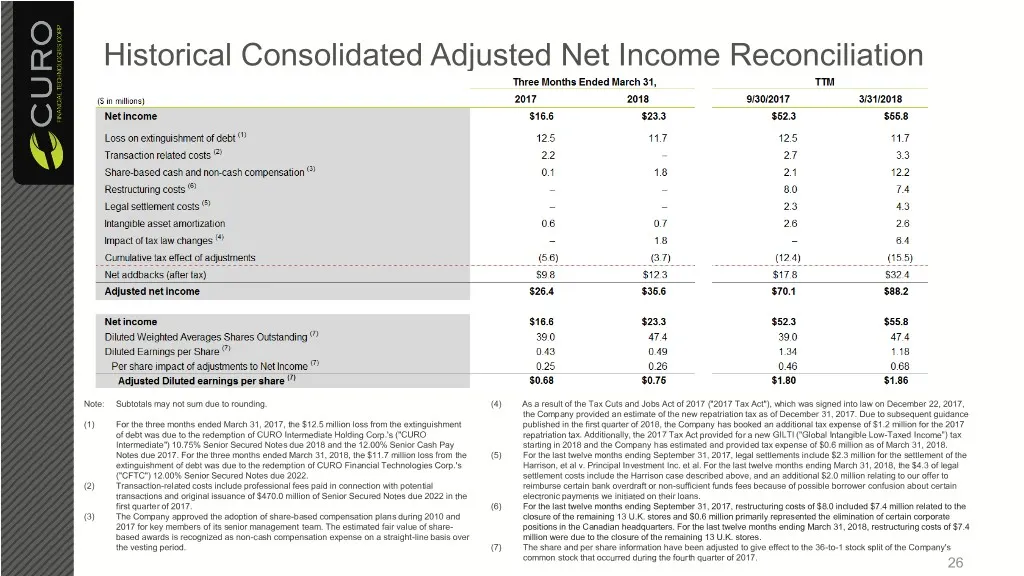
Historical Consolidated Adjusted Net Income Reconciliation Note: Subtotals may not sum due to rounding. (4) As a result of the Tax Cuts and Jobs Act of 2017 ("2017 Tax Act"), which was signed into law on December 22, 2017, the Company provided an estimate of the new repatriation tax as of December 3
Slide 27: Historical Gross Combined Loan Receivables & Adjusted ROAA Reconciliations
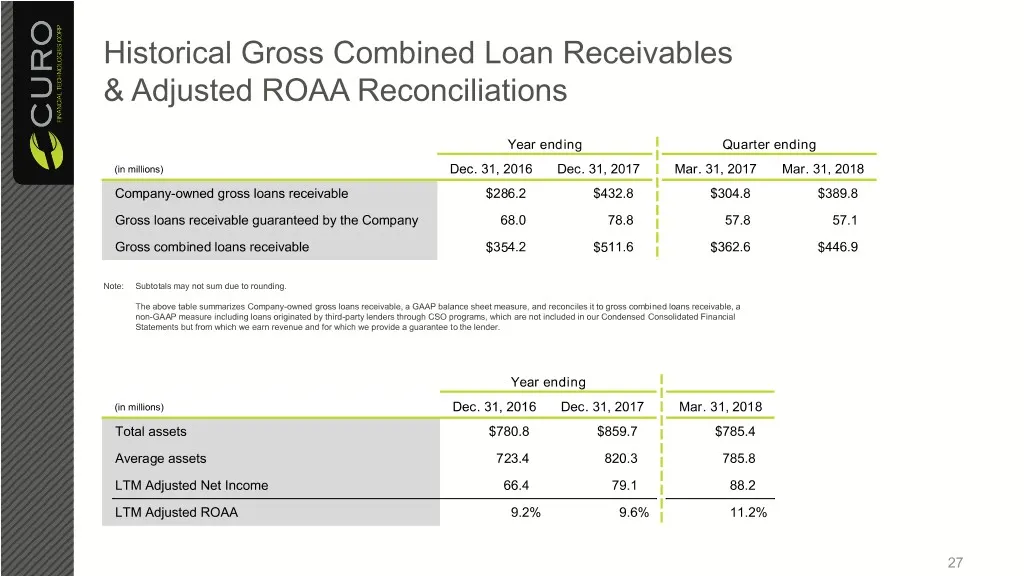
Historical Gross Combined Loan Receivables & Adjusted ROAA Reconciliations Year ending Quarter ending (in millions) Dec. 31, 2016 Dec. 31, 2017 Mar. 31, 2017 Mar. 31, 2018 Company-owned gross loans receivable $286.2 $432.8 $304.8 $389.8 Gross loans receivable guaranteed by the Company 68.0 78.8 57.8
Slide 28: Historical Operating Leverage Metrics
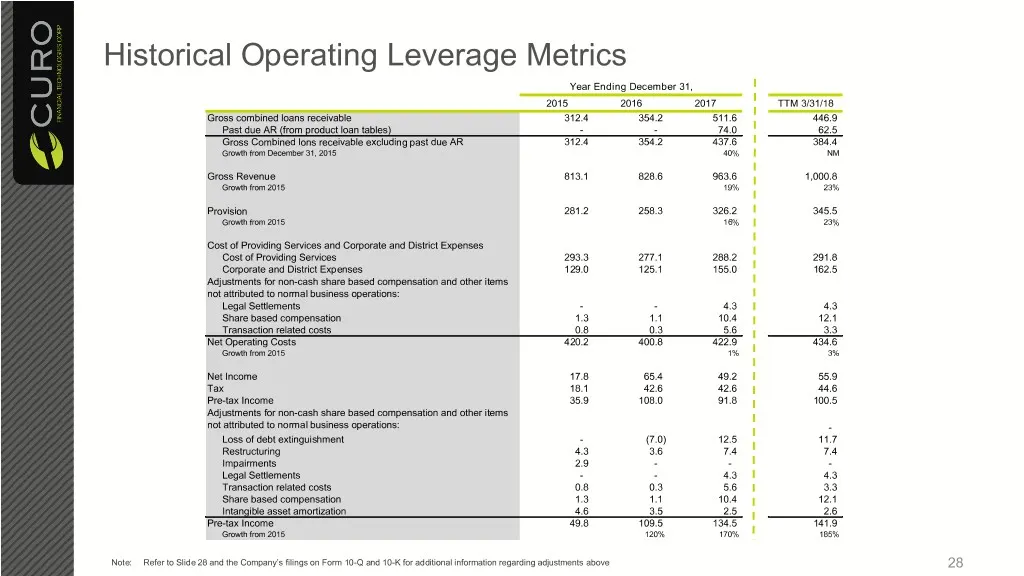
Historical Operating Leverage Metrics Year Ending December 31, 2015 2016 2017 TTM 3/31/18 Gross combined loans receivable 312.4 354.2 511.6 446.9 Past due AR (from product loan tables) - - 74.0 62.5 Gross Combined lons receivable excluding past due AR 312.4 354.2 437.6 384.4 Growth from December 31,
Source: SEC EDGAR · 8-K filed Jun 4, 2018
More decks from Curo Group Holdings Corp
 Q4 2023 Earnings Presentation21 slides · Feb 12, 2024
 Investor Presentation (November 2023)15 slides · Nov 13, 2023
 Q3 2023 Earnings Presentation20 slides · Nov 2, 2023
 Debt Investor Presentation (October 2023)21 slides · Oct 23, 2023
 Investor Presentation (September 2023)15 slides · Sep 25, 2023
 Q2 2023 Earnings Presentation21 slides · Aug 3, 2023