PFISTERER Holding SE · XETR:PFSE
PFISTERER — Q3 2026 Earnings Presentation
22 slides from PFISTERER's earnings presentation, Nov 18, 2026
Slide 1: Q3 Key figures and business performance
Q3 Key figures and business performance November 18, 2026
Slide 2: Agenda
Agenda 1 Key Highlights 2 Market Update 3 Financial Performance Q3 2026 4 Business update & Outlook

Slide 3: Key Highlights
> 1 PFISTERER Key Highlights
Slide 4: Investments translate into stronger earnings, record order visibility and confidence in guidance
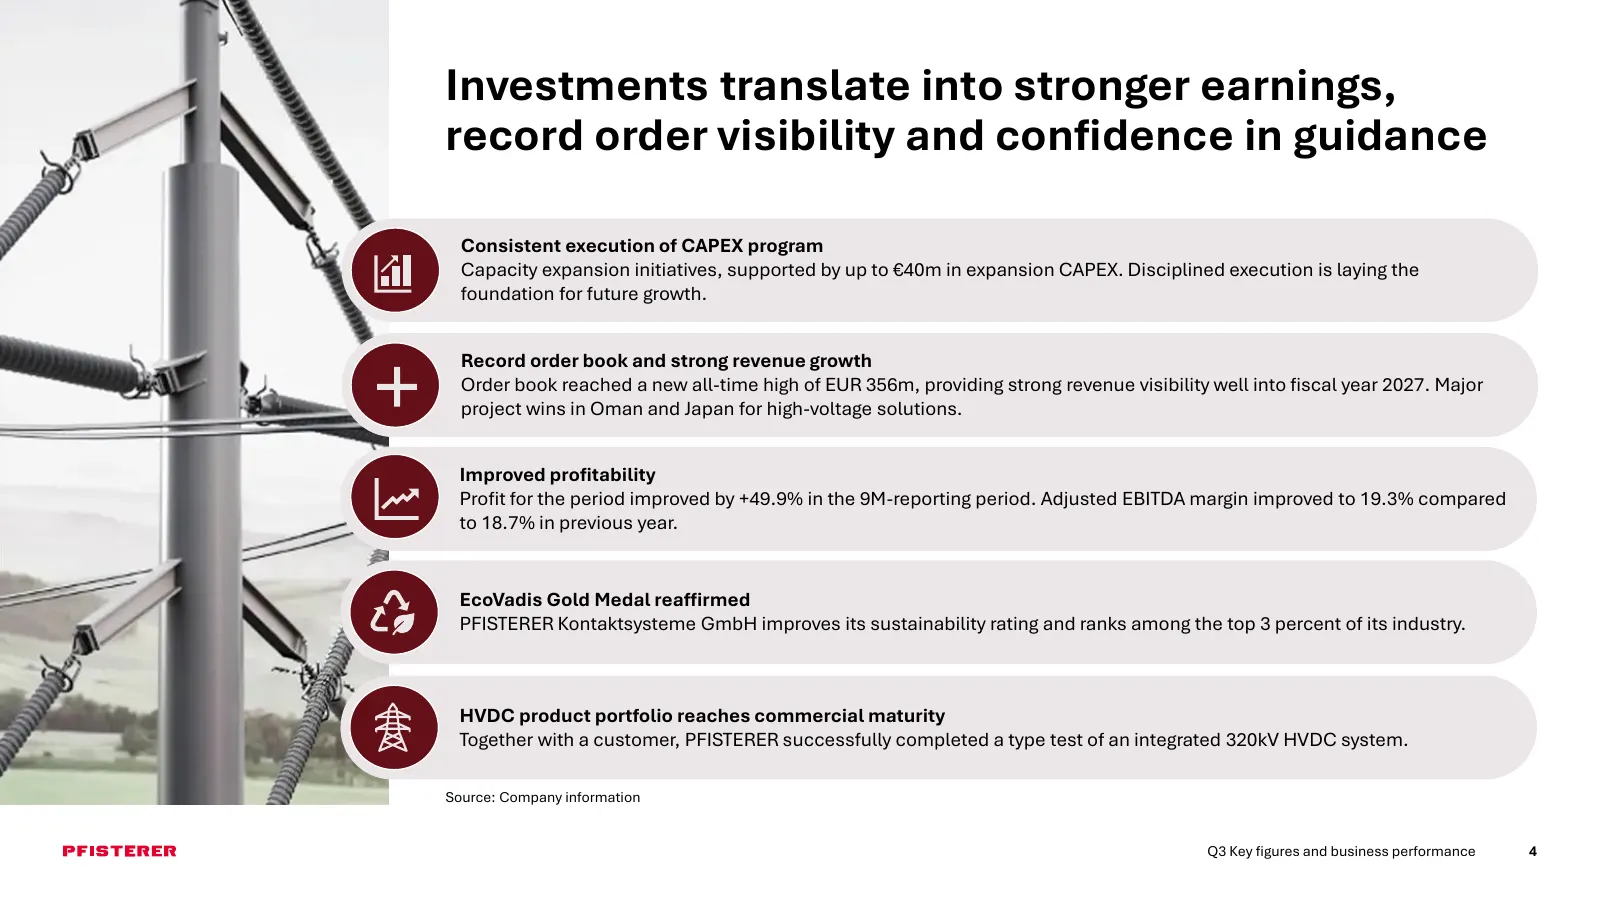
Investments translate into stronger earnings, record order visibility and confidence in guidance Consistent execution of CAPEX program Capacity expansion initiatives, supported by up to €40m in expansion CAPEX. Disciplined execution is laying the foundation for future growth. Record order book and s
Slide 5: Market Update
2 Market Update PFISTERER
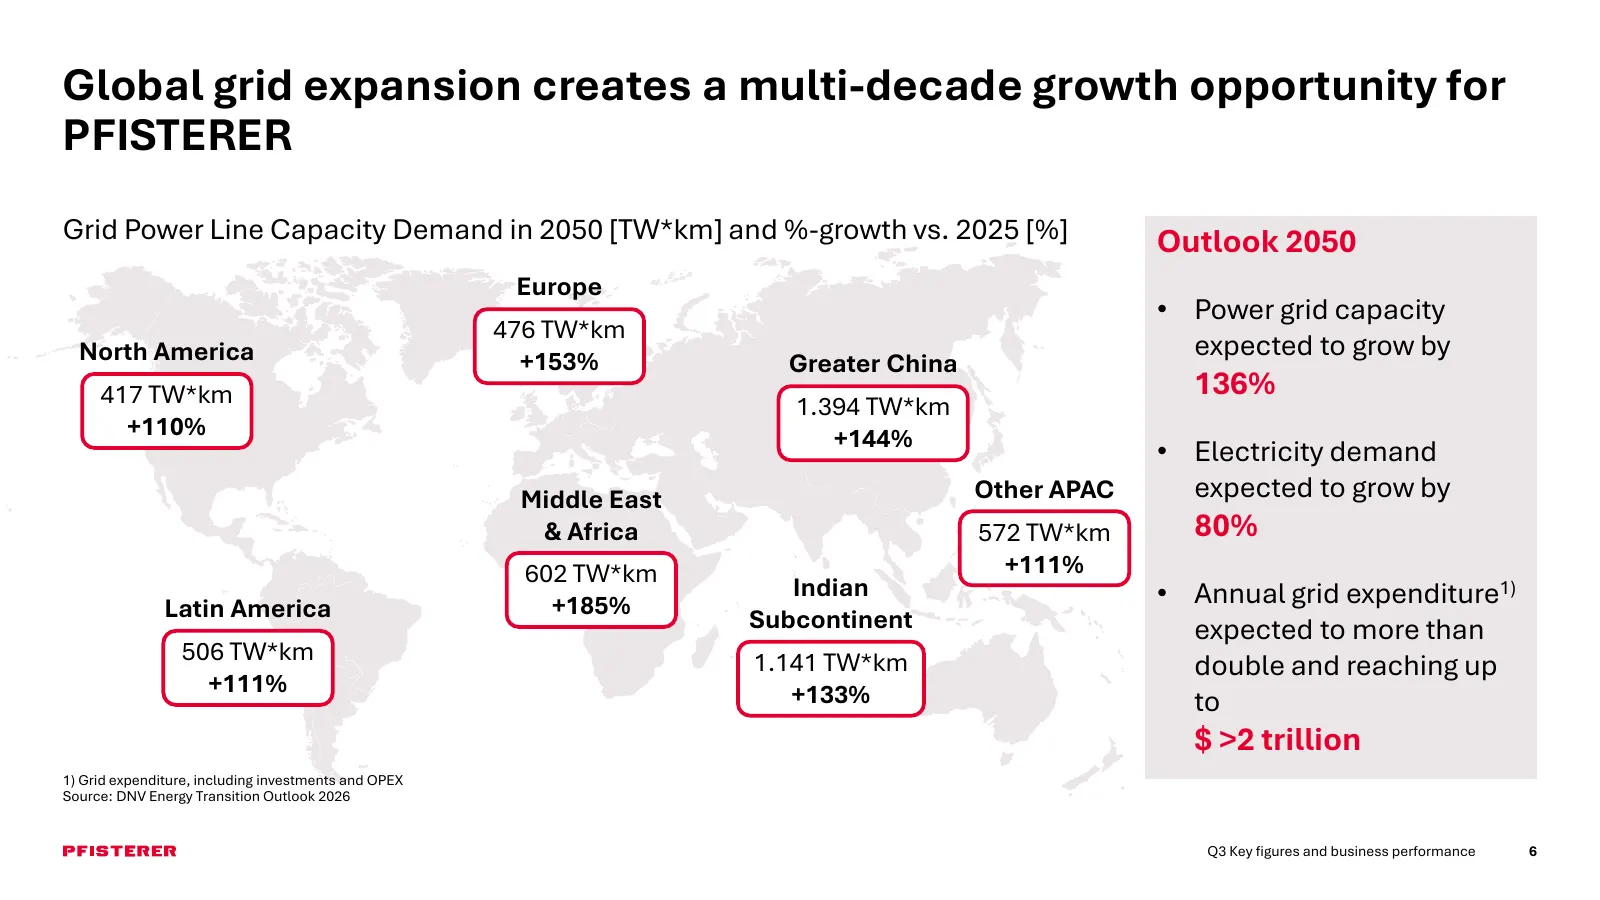
Slide 6: Global grid expansion creates a multi-decade growth opportunity for PFISTERER
Global grid expansion creates a multi-decade growth opportunity for PFISTERER Grid Power Line Capacity Demand in 2050 [TW*km] and %-growth vs. 2025 [%] Outlook 2050 Europe • Power grid capacity 476 TW*km North America expected to grow by +153% Greater China 417 TW*km 136% 1.394 TW*km +110% +144% • E
Slide 7: Financial Performance Q3 2026
3 Financial Performance Q3 2026
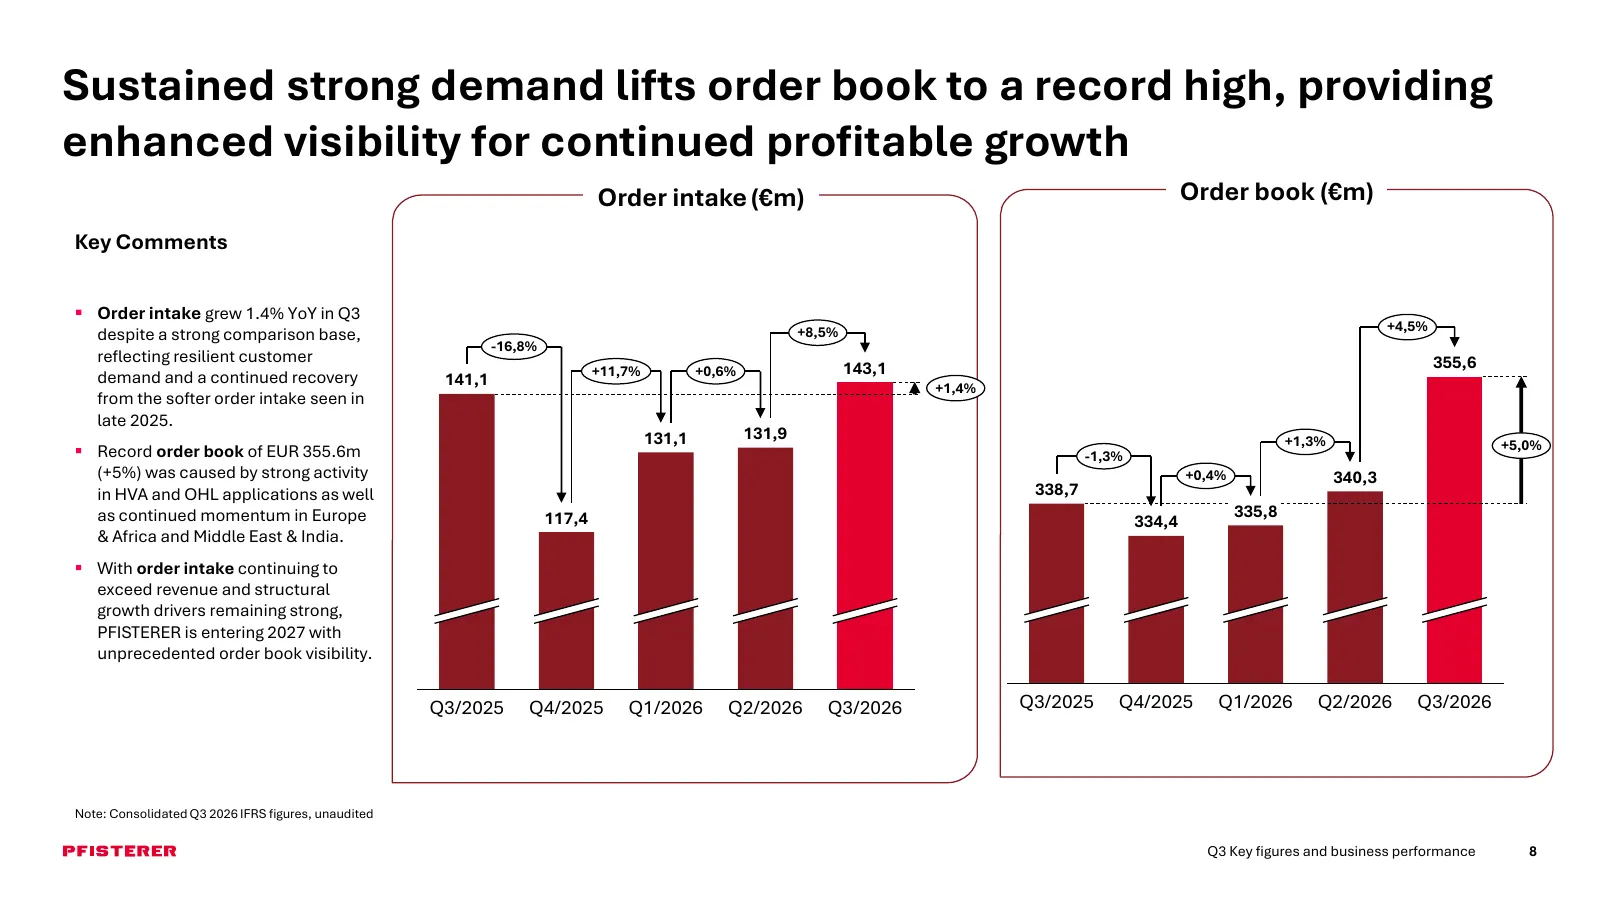
Slide 8: Sustained strong demand lifts order book to a record high
Sustained strong demand lifts order book to a record high, providing enhanced visibility for continued profitable growth Order intake (€m) Order book (€m) Key Comments ▪ Order intake grew 1.4% YoY in Q3 +8,5% +4,5% despite a strong comparison base, -16,8% reflecting resilient customer 355,6 +11,7% +
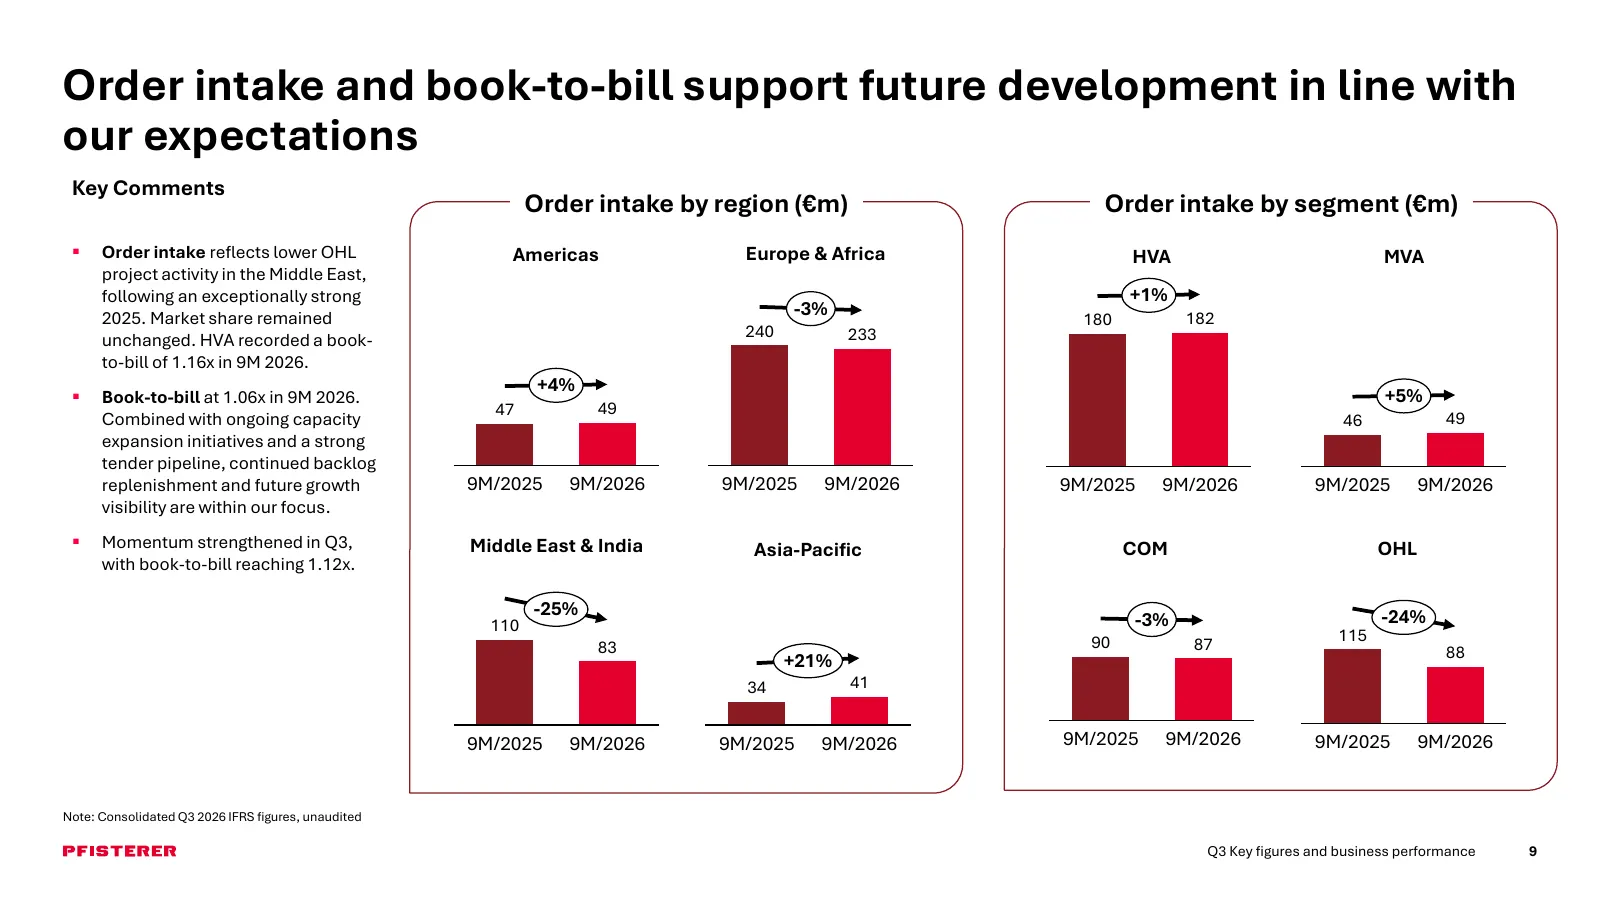
Slide 9: Order intake and book-to-bill support future development in line with our expectations
Order intake and book-to-bill support future development in line with our expectations Key Comments Order intake by region (€m) Order intake by segment (€m) ▪ Order intake reflects lower OHL Americas Europe & Africa HVA MVA project activity in the Middle East, following an exceptionally strong +1% 2
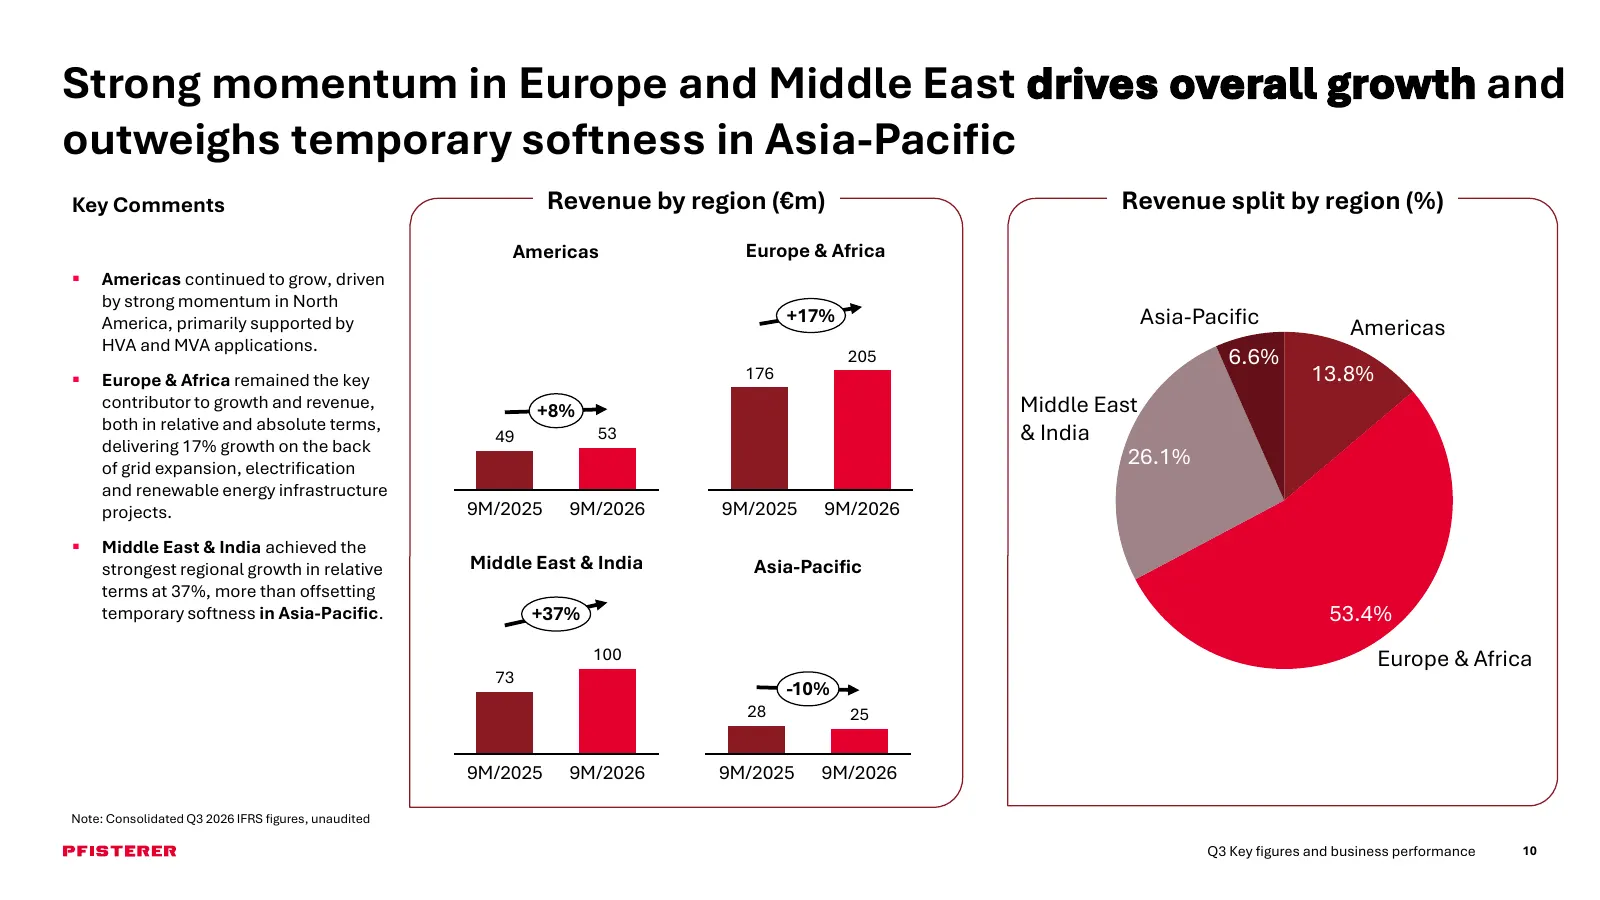
Slide 10: Strong momentum in Europe and Middle East drives overall growth
Strong momentum in Europe and Middle East drives overall growth and outweighs temporary softness in Asia-Pacific Key Comments Revenue by region (€m) Revenue split by region (%) Americas Europe & Africa ▪ Americas continued to grow, driven by strong momentum in North America, primarily supported by +
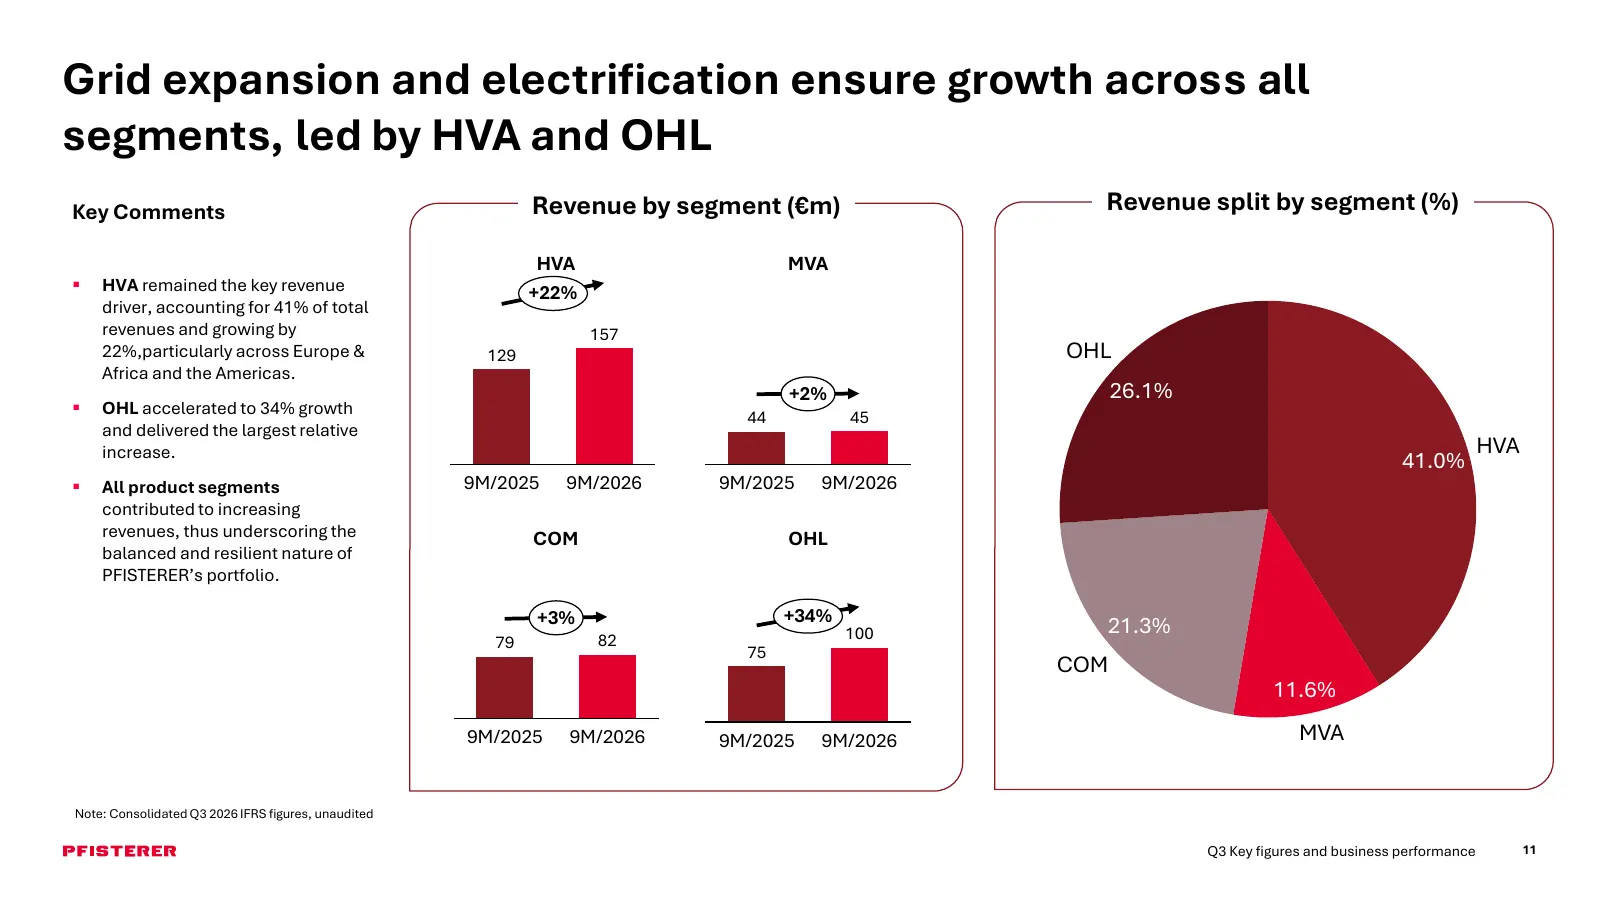
Slide 11: Grid expansion and electrification ensure growth across all segments, led by HVA and OHL
Grid expansion and electrification ensure growth across all segments, led by HVA and OHL Key Comments Revenue by segment (€m) Revenue split by segment (%) HVA MVA ▪ HVA remained the key revenue +22% driver, accounting for 41% of total revenues and growing by 157 22%,particularly across Europe & 129
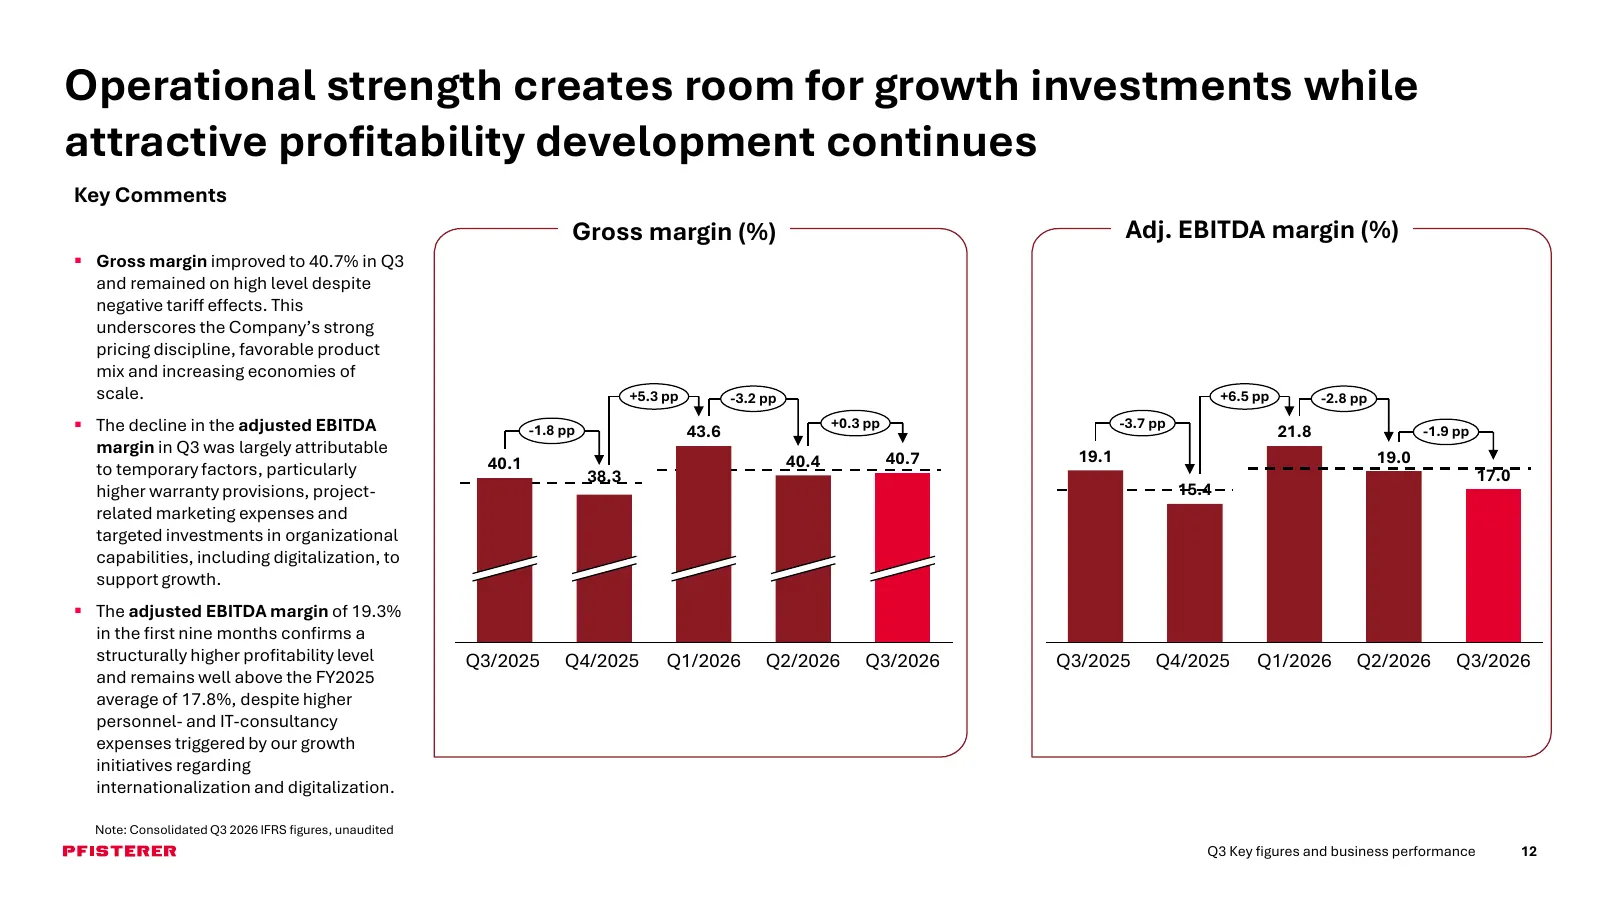
Slide 12: Operational strength creates room for growth investments while profitability development continues
Operational strength creates room for growth investments while attractive profitability development continues Key Comments Gross margin (%) Adj. EBITDA margin (%) ▪ Gross margin improved to 40.7% in Q3 and remained on high level despite negative tariff effects. This underscores the Company’s strong
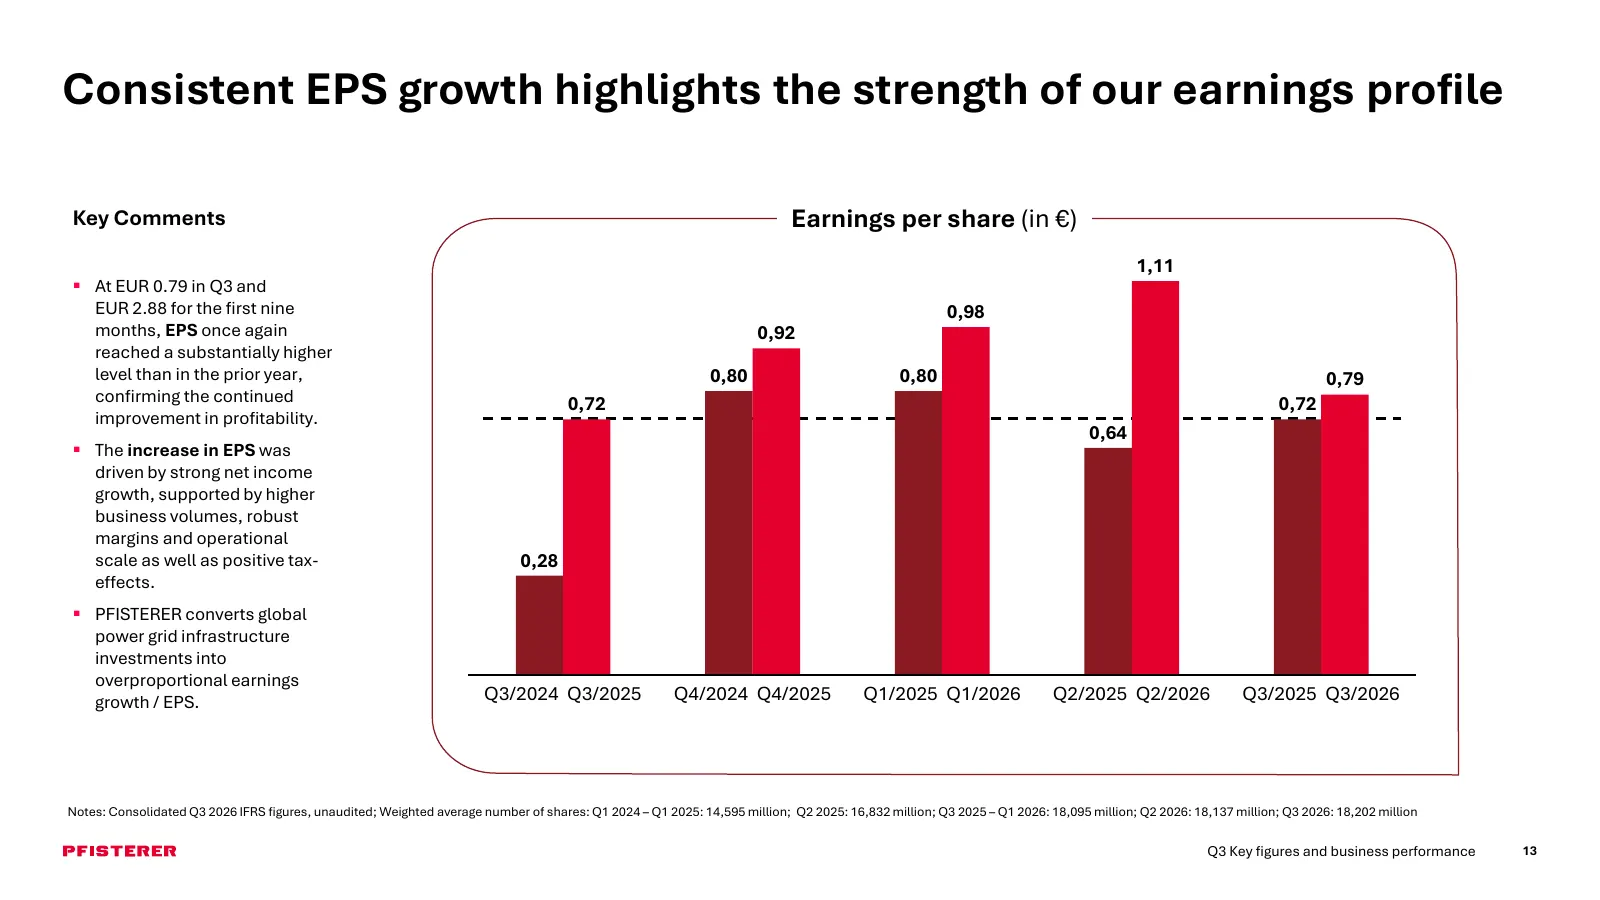
Slide 13: Consistent EPS growth highlights the strength of our earnings profile
Consistent EPS growth highlights the strength of our earnings profile Key Comments Earnings per share (in €) 1,11 ▪ At EUR 0.79 in Q3 and EUR 2.88 for the first nine 0,98 months, EPS once again 0,92 reached a substantially higher level than in the prior year, 0,80 0,80 0,79 confirming the continued
Slide 14: 9M 2026 – Scale effects and margin strength translate strong revenue growth into earnings
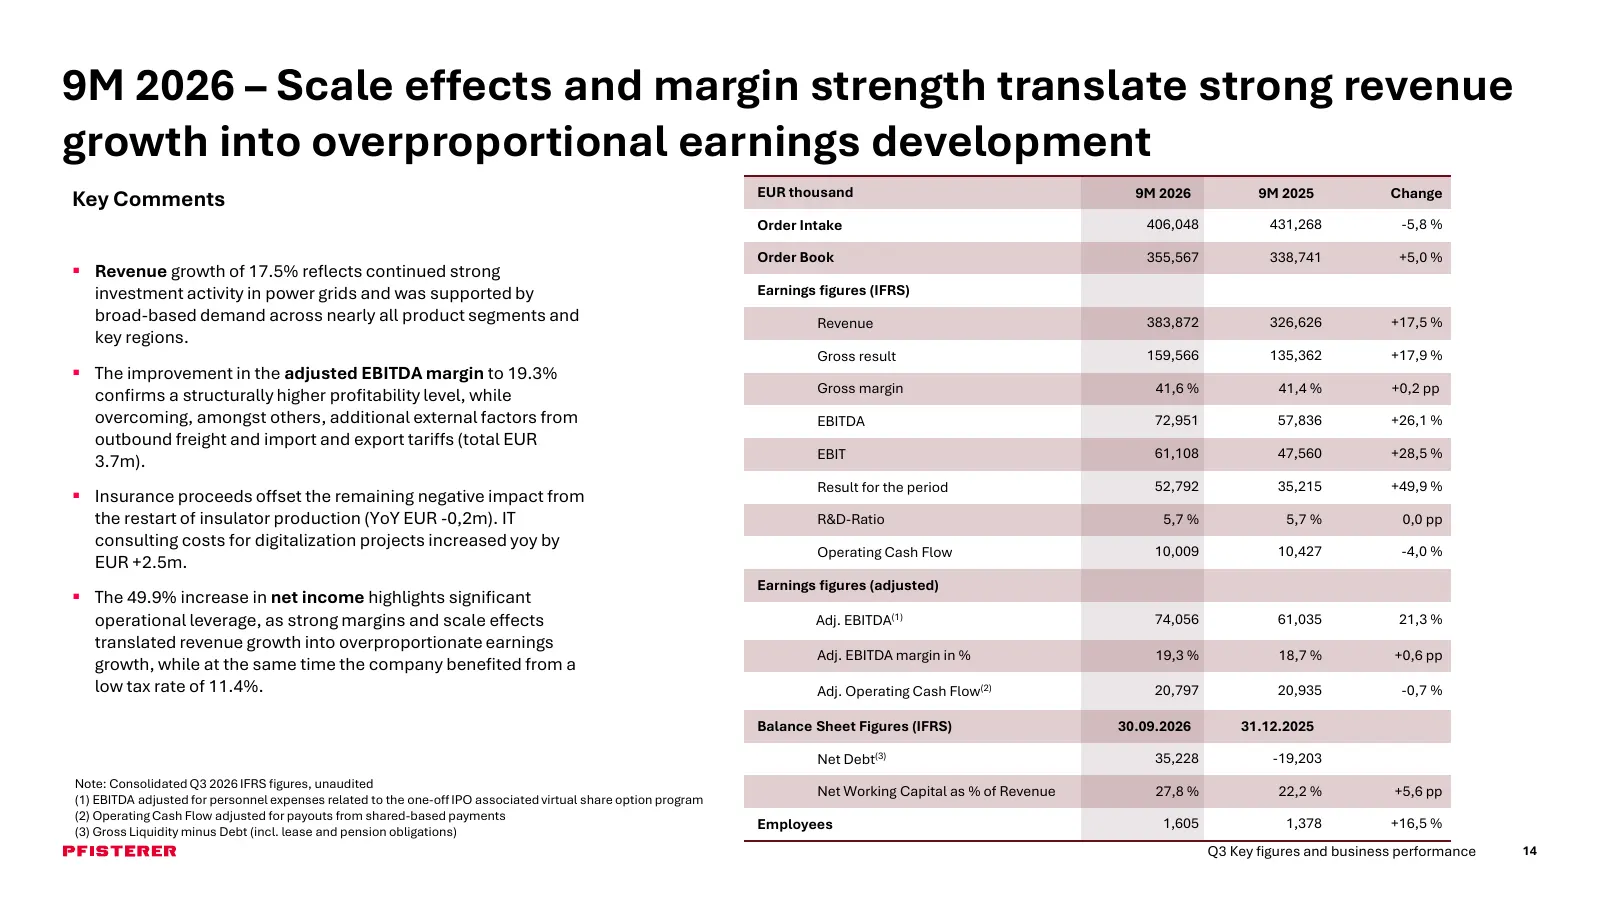
9M 2026 – Scale effects and margin strength translate strong revenue growth into overproportional earnings development EUR thousand 9M 2026 9M 2025 Change Key Comments Order Intake 406,048 431,268 -5,8 % Order Book 355,567 338,741 +5,0 % ▪ Revenue growth of 17.5% reflects continued strong investment
Slide 15: Q3 2026 – Record order book and sustained strong demand provide high visibility
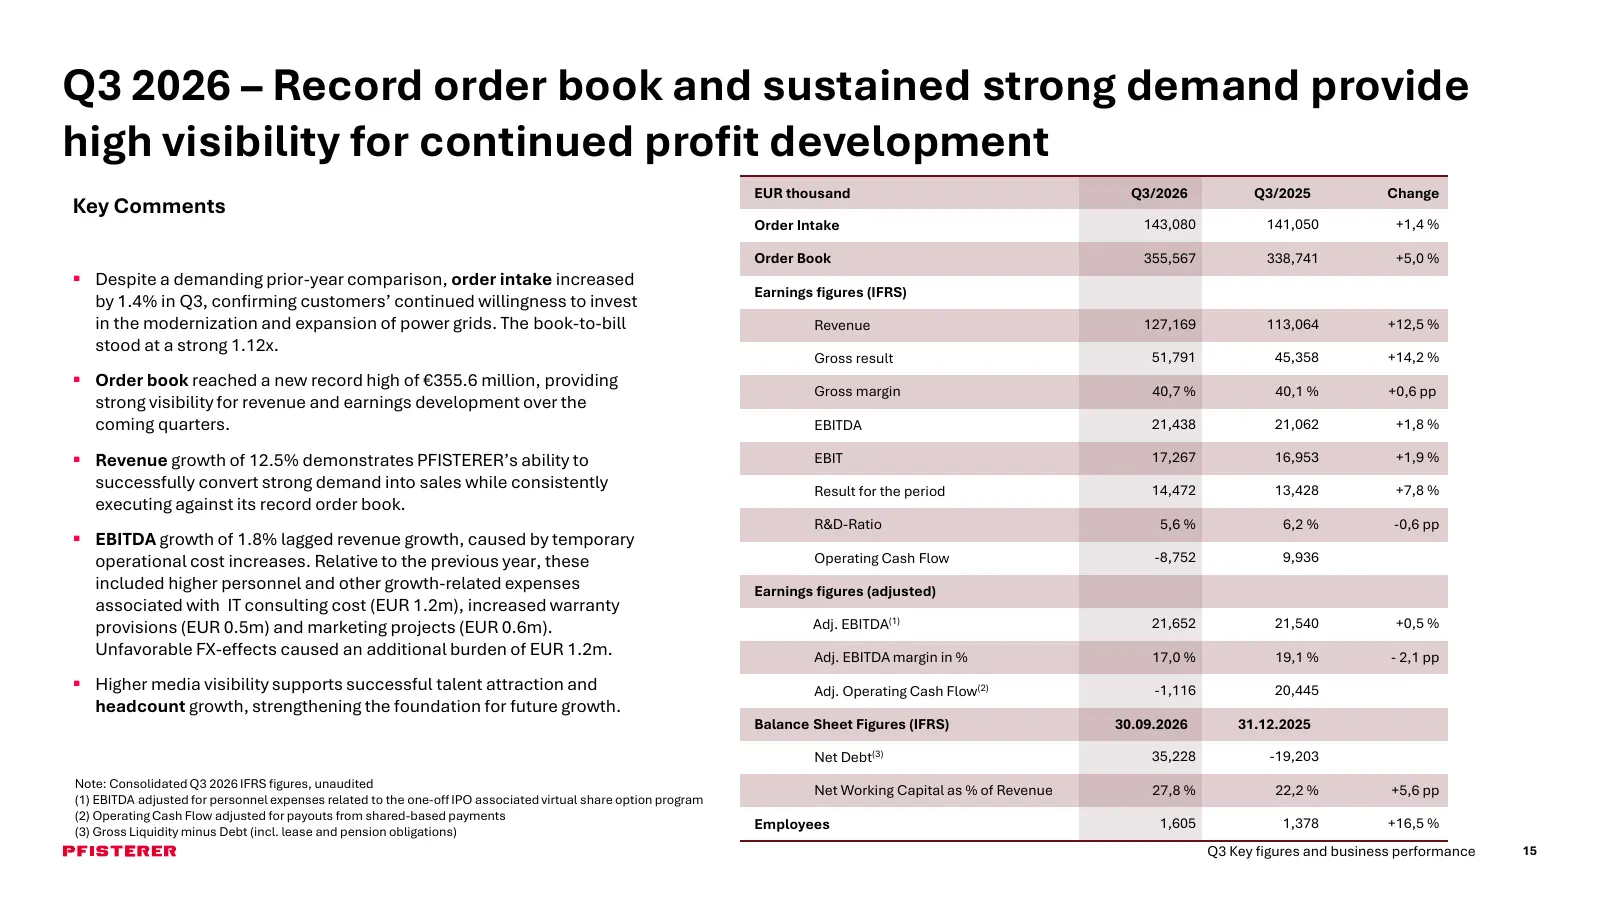
Q3 2026 – Record order book and sustained strong demand provide high visibility for continued profit development EUR thousand Q3/2026 Q3/2025 Change Key Comments Order Intake 143,080 141,050 +1,4 % Order Book 355,567 338,741 +5,0 % ▪ Despite a demanding prior-year comparison, order intake increased

Slide 16: Business update and Outlook
4 Business update and Outlook
Slide 17: Consistent execution across our strategic pillars supports long-term growth ambitions
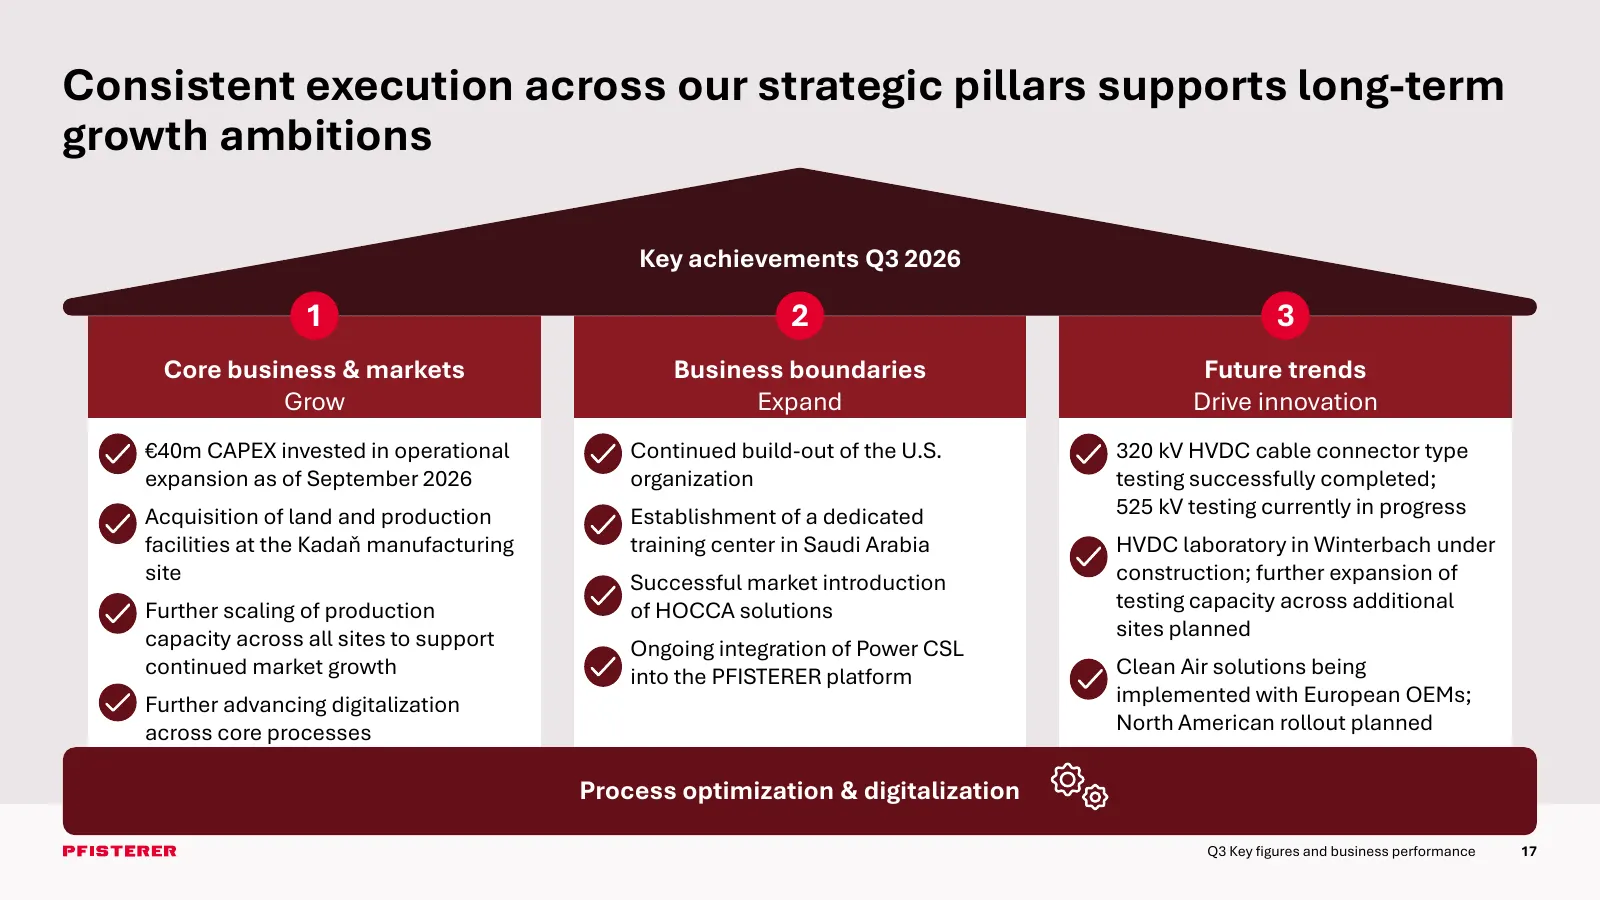
Consistent execution across our strategic pillars supports long-term growth ambitions Key achievements Q3 2026 1 2 3 Core business & markets Business boundaries Future trends Grow Expand Drive innovation €40m CAPEX invested in operational Continued build-out of the U.S. 320 kV HVDC cable connector t
Slide 18: Capacity expansion initiatives translate into higher output and secure future increase in business
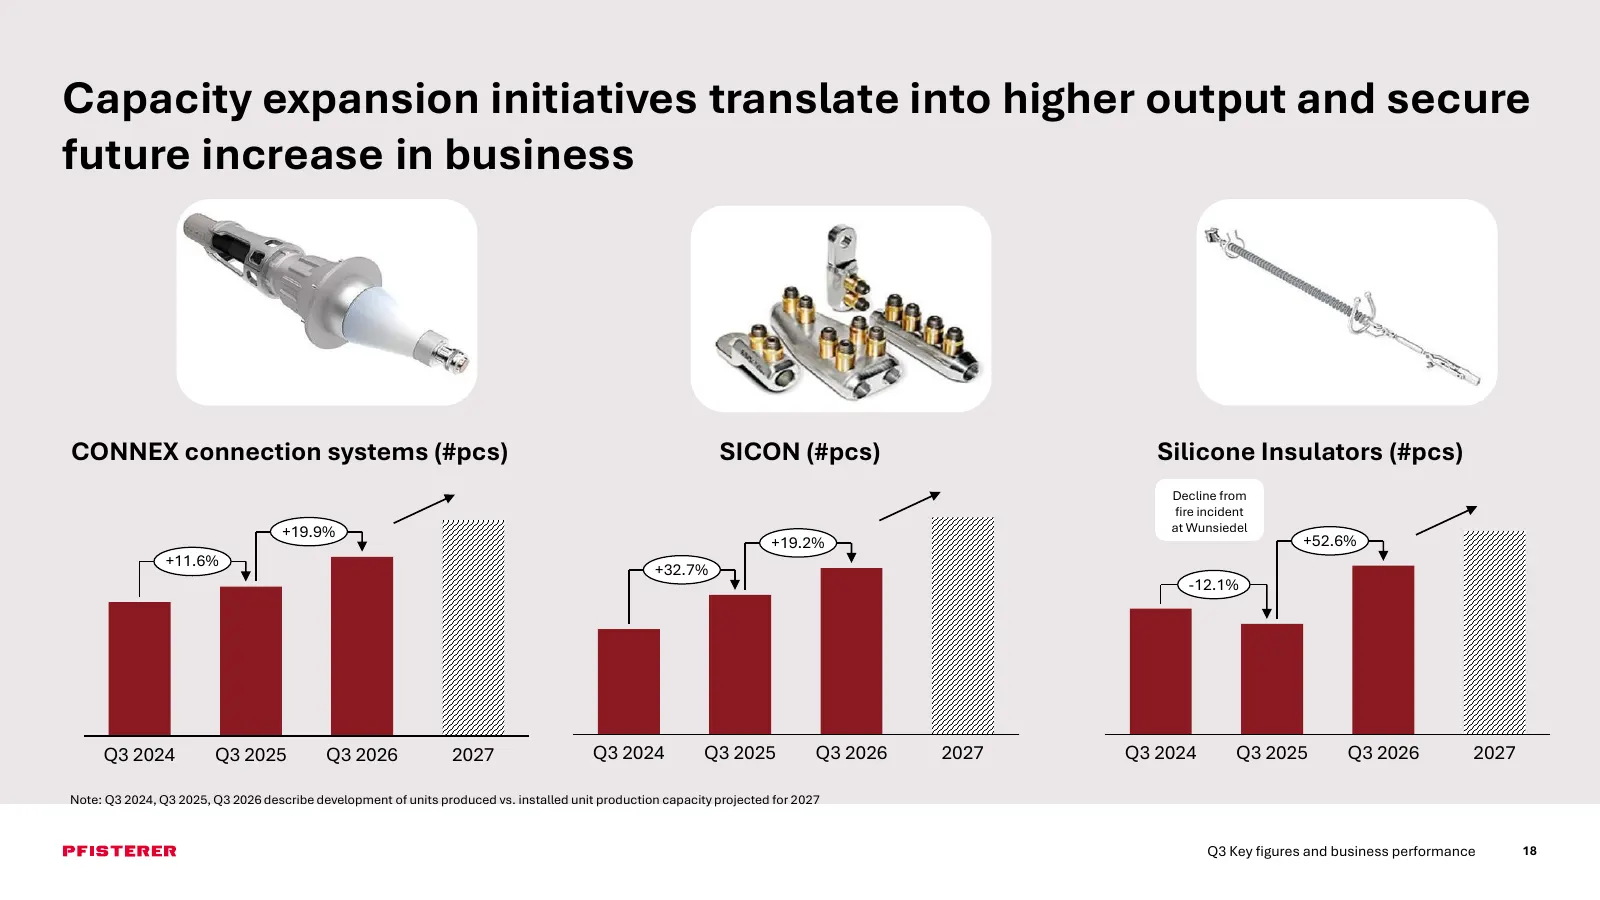
Capacity expansion initiatives translate into higher output and secure future increase in business CONNEX connection systems (#pcs) SICON (#pcs) Silicone Insulators (#pcs) Decline from fire incident +19.9% at Wunsiedel +19.2% +52.6% +11.6% +32.7% -12.1% Q3 2024 Q3 2025 Q3 2026 2027 Q3 2024 Q3 2025 Q
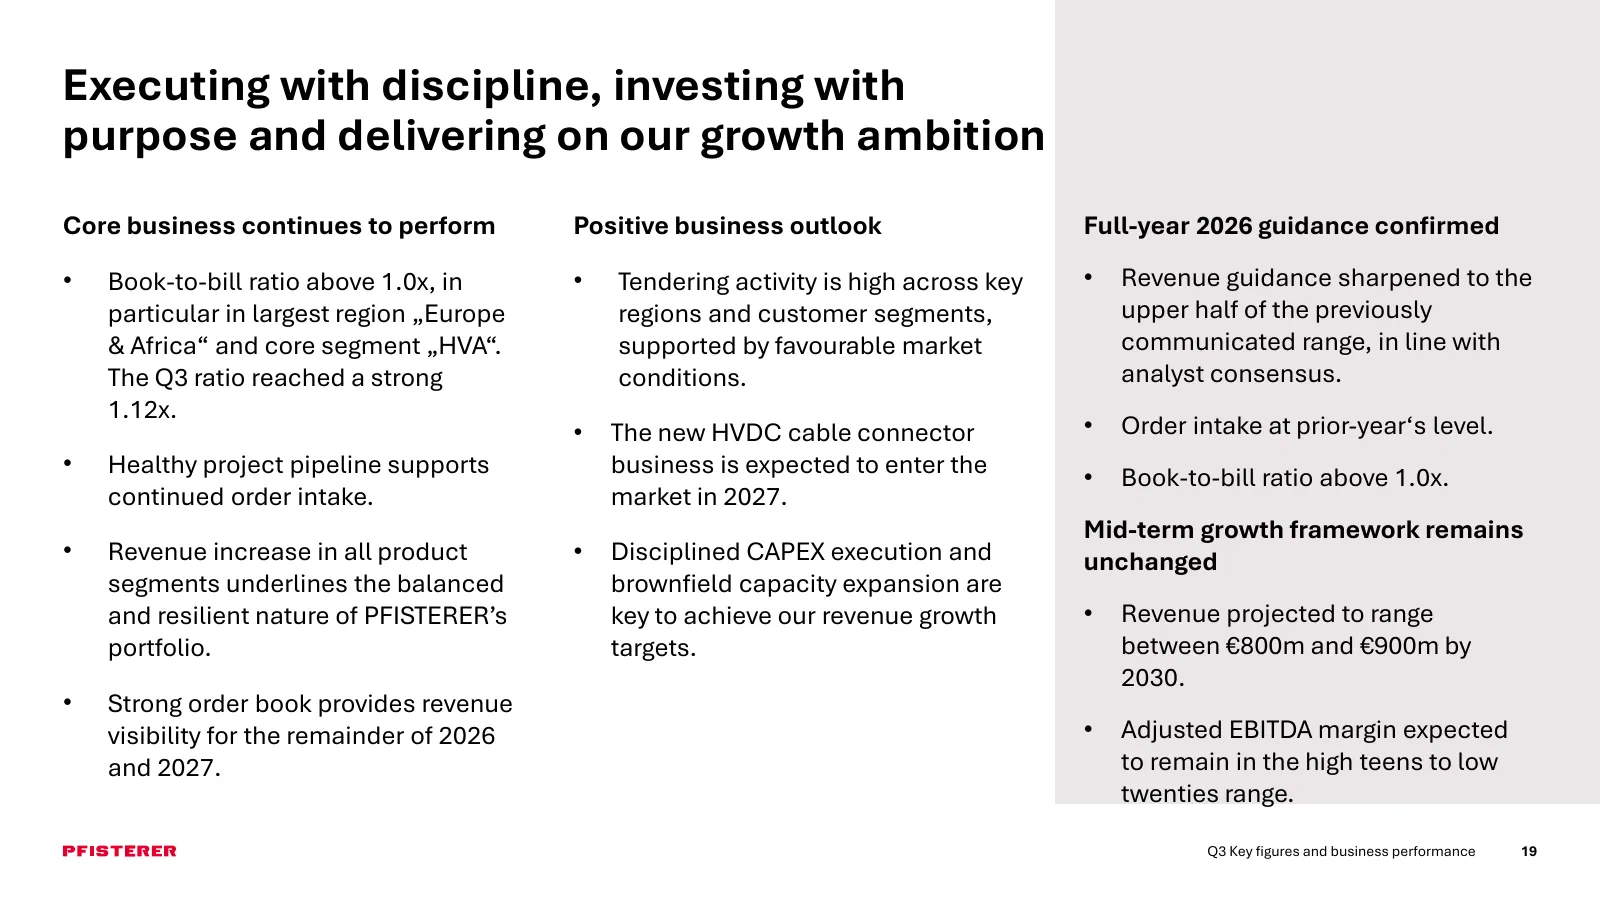
Slide 19: Executing with discipline, investing with purpose and delivering on our growth ambition
Executing with discipline, investing with purpose and delivering on our growth ambition Core business continues to perform Positive business outlook Full-year 2026 guidance confirmed • Book-to-bill ratio above 1.0x, in • Tendering activity is high across key • Revenue guidance sharpened to the parti

Slide 20: Q&A
Q&A Q3 Key figures and business performance 20

Slide 21: Thank you for your attention.
Thank you for your attention. Q3 Key figures and business performance 21
Slide 22: PFISTERER Holding SE
PFISTERER Holding SE Rosenstraße 44 73650 Winterbach Deutschland Investor-Relations@pfisterer.com +49 7181 7005-149 All rights to the above content are the exclusive property of PFISTERER. This document has been prepared by PFISTERER solely for the recipient.
Source: company website
More decks from PFISTERER Holding SE
 Investor Presentation (September 2026)25 slides · September 2026
 HY1 2026 Earnings Presentation23 slides · Aug 19, 2026
 Q1 2026 Earnings Presentation21 slides · May 19, 2026
 FY2025 Earnings Presentation24 slides · Apr 15, 2026
 Q3 2025 Earnings Presentation22 slides · Nov 19, 2025
 Investor Presentation (September 2025)23 slides · September 2025