Great Western Bancorp — IPO Roadshow (June 2020)
41 slides from Great Western Bancorp's IPO roadshow presentation, Jun 1, 2020
Slide 1: Subordinated Notes Offering Investor Presentation June 2020
FiledFiled Pursuant to Rule 433 Issuer Free Writing Prospectus, dated June 1, 2020 Supplementing the Preliminary Prospectus Supplement, dated June 1, 2020 Registration No. 333-238843 Subordinated Notes Offering Investor Presentation June 2020
Slide 2: Disclosures
Disclosures Forward-Looking Statements: This presentation contains forward-looking statements within the meaning of the Private Securities Litigation Reform Act of 1995. Statements about Great Western Bancorp, Inc.’s expectations, beliefs, plans, strategies, predictions, forecasts, objectives, assum
Slide 3: Offering Disclaimer
Offering Disclaimer We have filed a registration statement (including a prospectus) (File No. 333-238843) and a preliminary prospectus supplement with the SEC for the offering to which this presentation relates. Before you invest, you should read the prospectus in that registration statement, the pr
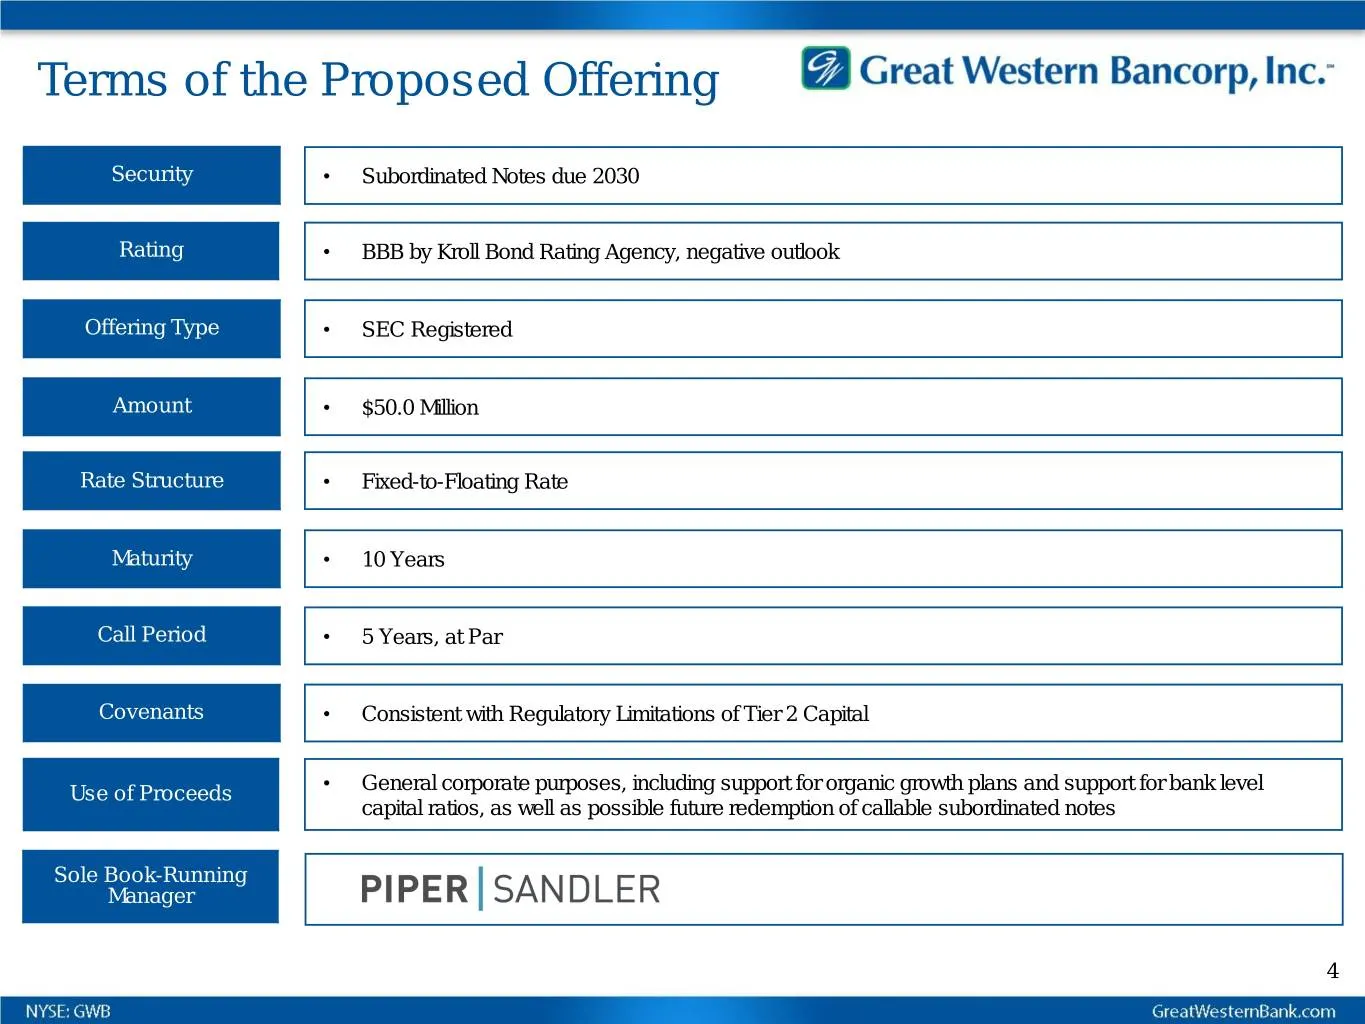
Slide 4: Terms of the Proposed Offering
Terms of the Proposed Offering Security • Subordinated Notes due 2030 Rating • BBB by Kroll Bond Rating Agency, negative outlook Offering Type • SEC Registered Amount • $50.0 Million Rate Structure • Fixed-to-Floating Rate Maturity • 10 Years Call Period • 5 Years, at Par Covenants • Consistent with
Slide 5: About Great Western Bancorp, Inc.
About Great Western Bancorp, Inc.
Slide 6: Company Snapshot
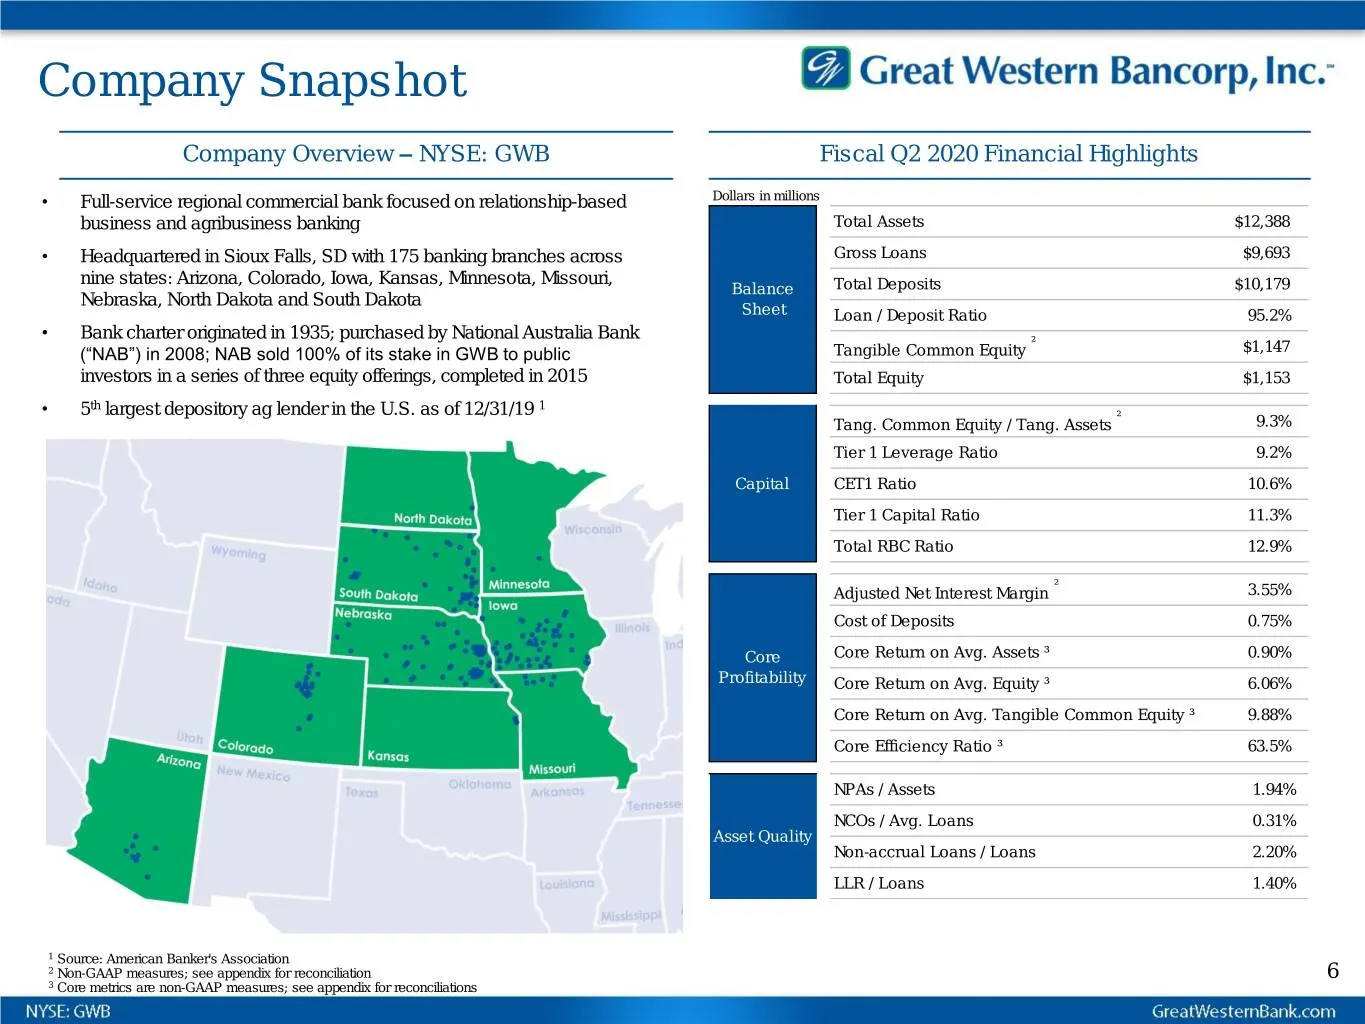
Company Snapshot Company Overview – NYSE: GWB Fiscal Q2 2020 Financial Highlights • Full-service regional commercial bank focused on relationship-based Dollars in millions business and agribusiness banking Total Assets $12,388 • Headquartered in Sioux Falls, SD with 175 banking branches across Gross
Slide 7: Experienced Management Team
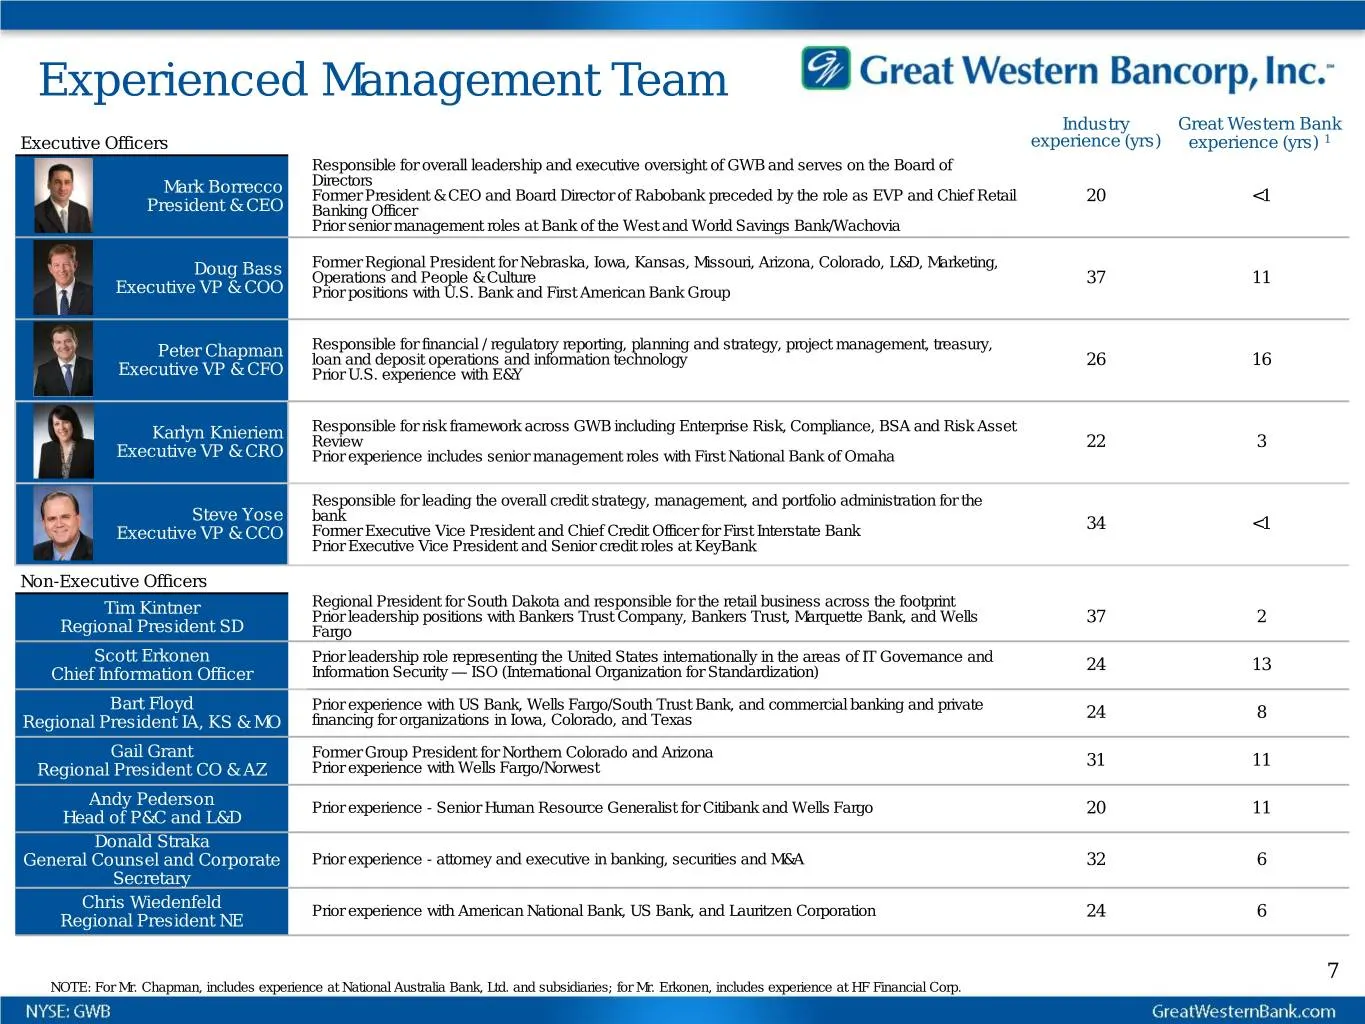
Experienced Management Team Great Western Bank x x Industry Executive Officers experience (yrs) experience (yrs) 1 x Responsible for overall leadership and executive oversight of GWB and serves on the Board of Mark Borrecco Directors Former President & CEO and Board Director of Rabobank preceded by
Slide 8: Operating Markets
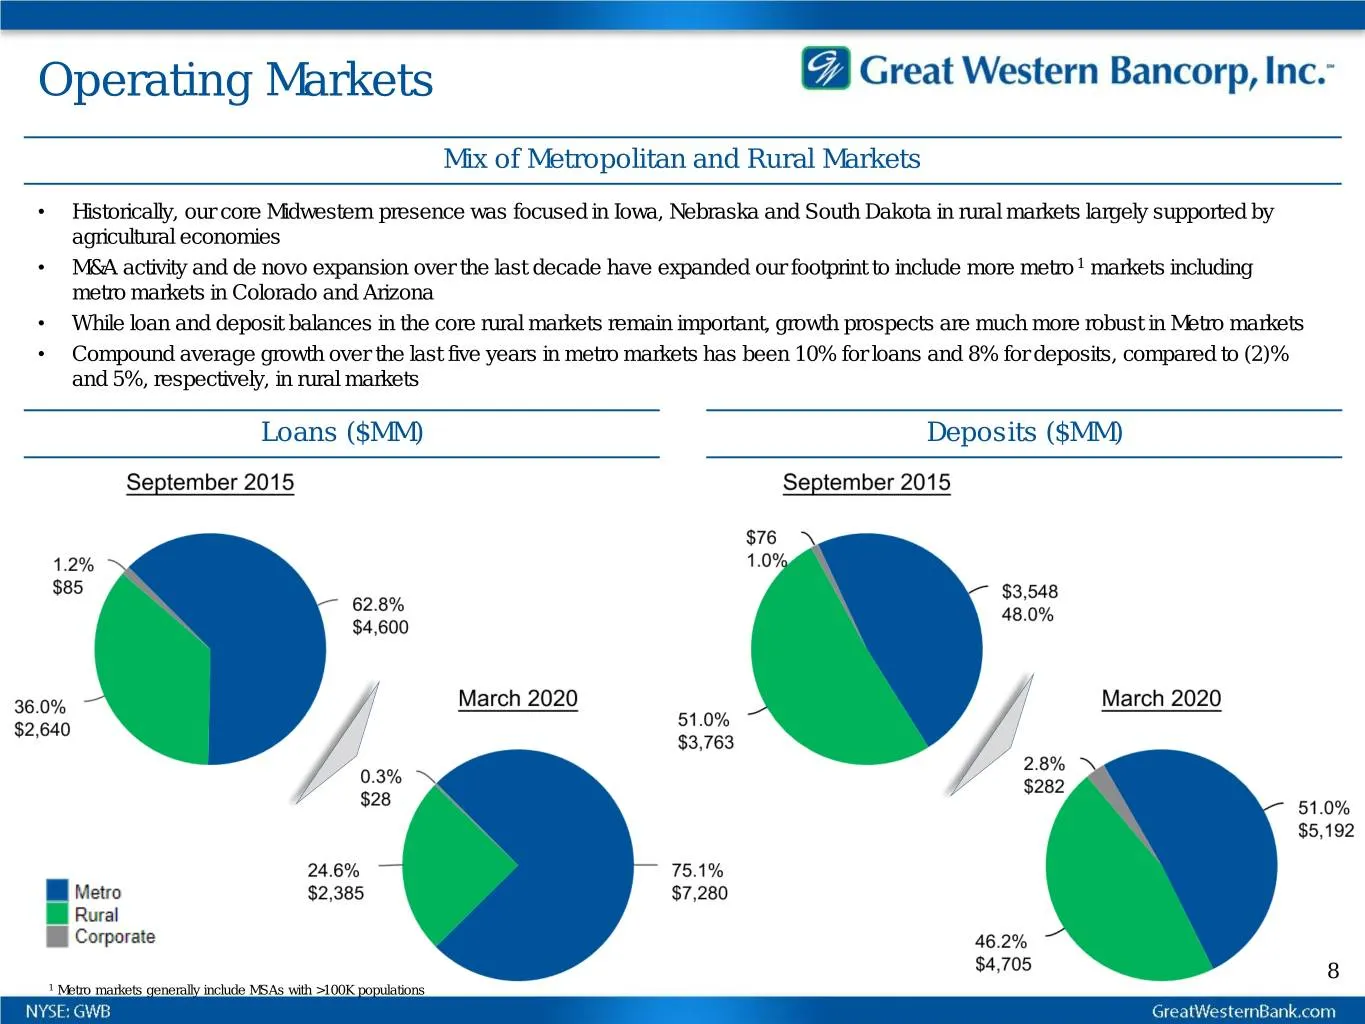
Operating Markets Mix of Metropolitan and Rural Markets • Historically, our core Midwestern presence was focused in Iowa, Nebraska and South Dakota in rural markets largely supported by agricultural economies • M&A activity and de novo expansion over the last decade have expanded our footprint to in
Slide 9: COVID-19 Response
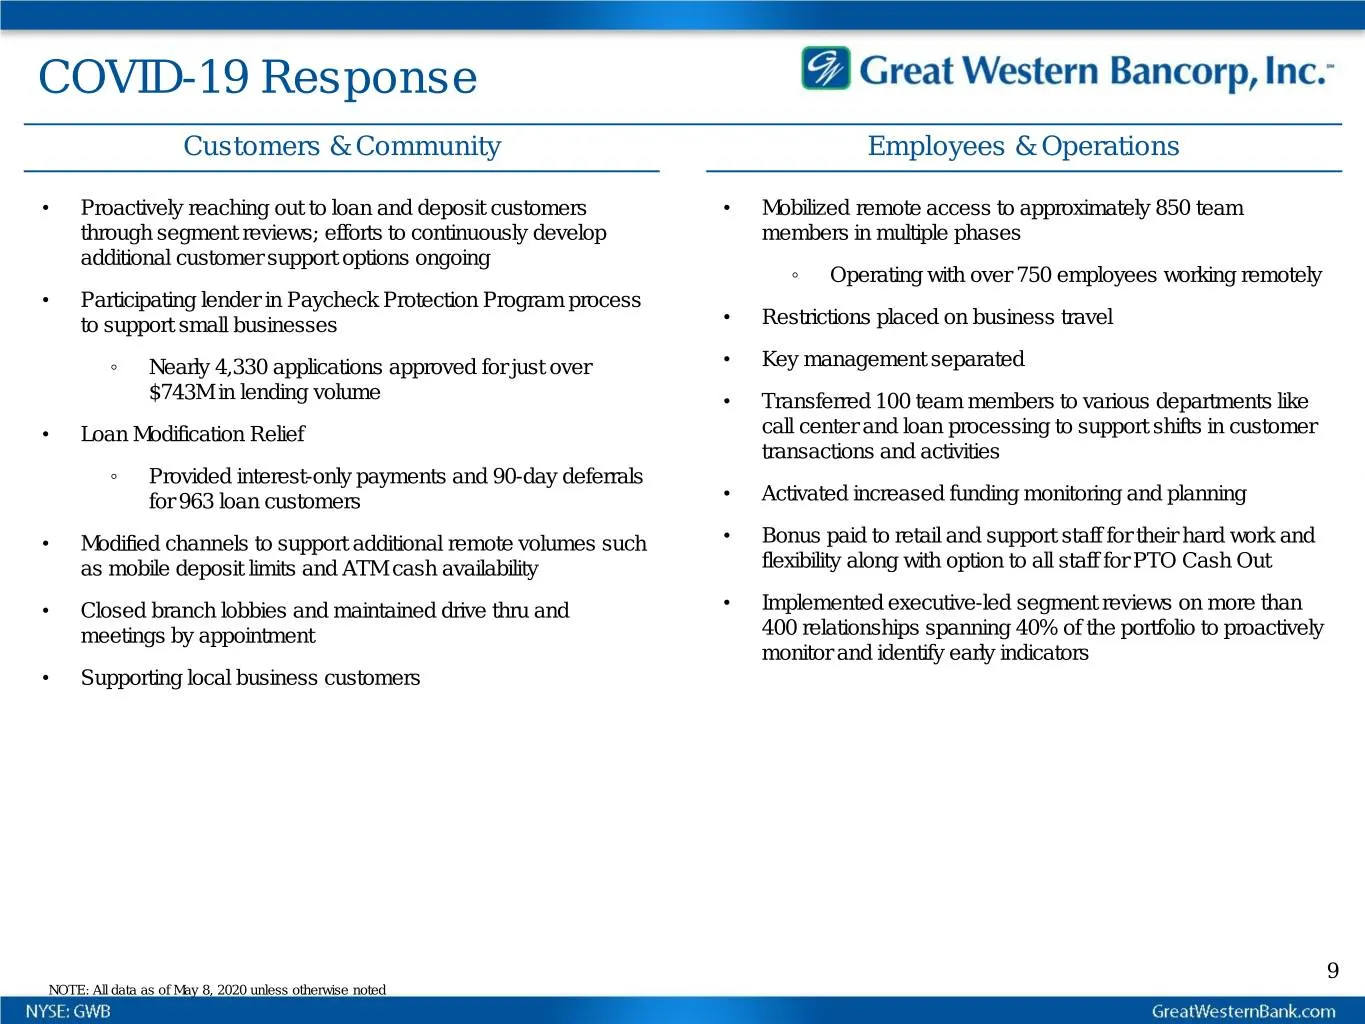
COVID-19 Response Customers & Community Employees & Operations • Proactively reaching out to loan and deposit customers • Mobilized remote access to approximately 850 team through segment reviews; efforts to continuously develop members in multiple phases additional customer support options ongoing
Slide 10: Financial Summary
Great Western Bancorp, Inc.” Financial Summary
Slide 11: Selected GAAP & Non-GAAP Results: March 31, 2020
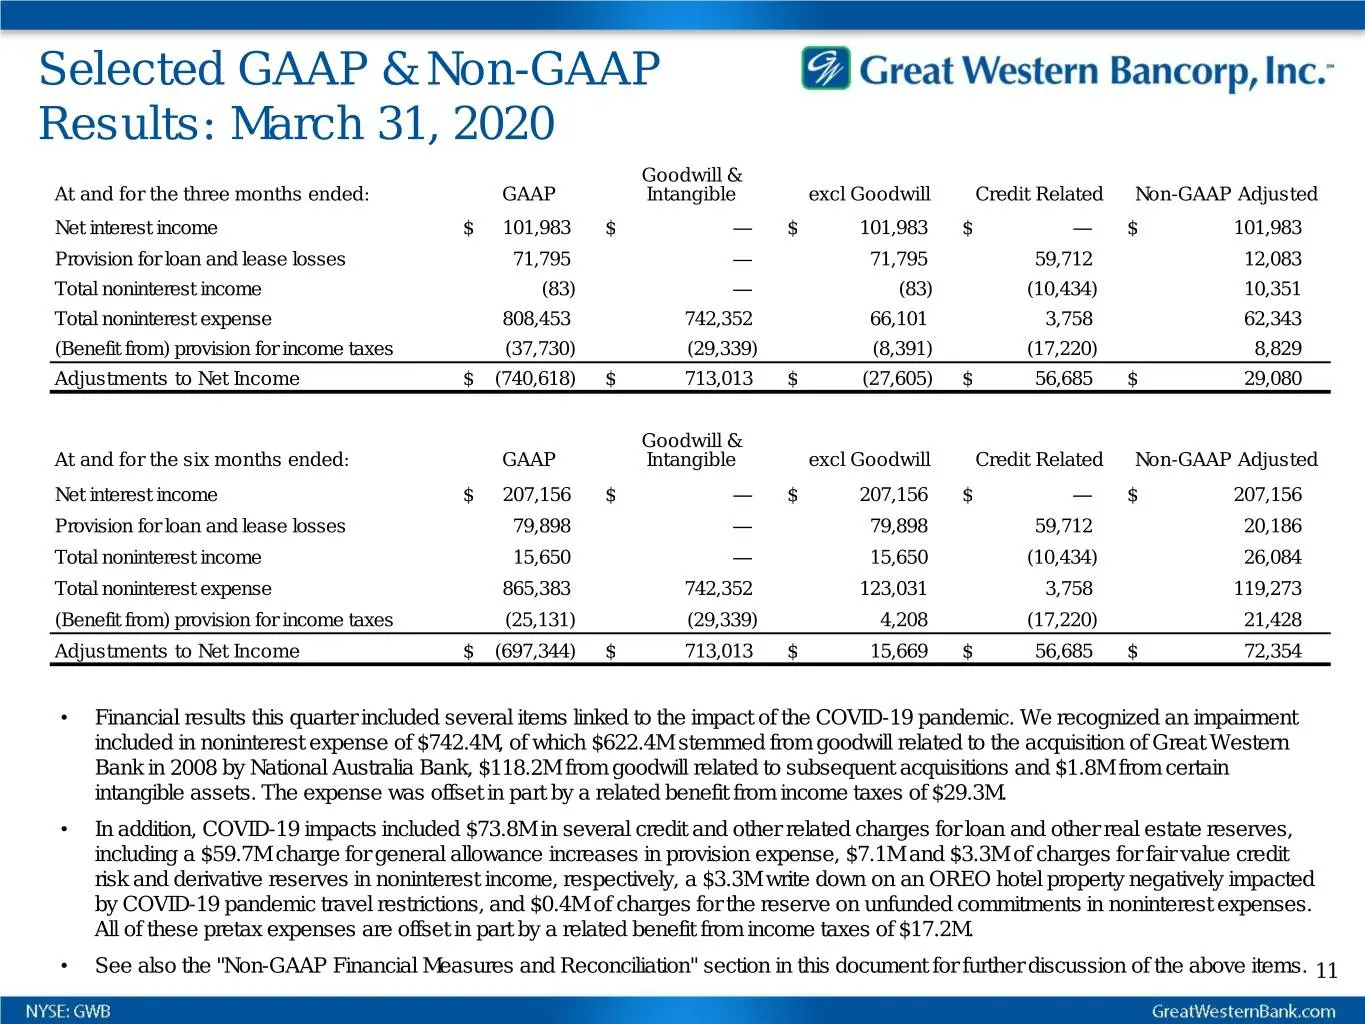
Selected GAAP & Non-GAAP Results: March 31, 2020 Goodwill & At and for the three months ended: GAAP Intangible excl Goodwill Credit Related Non-GAAP Adjusted Net interest income $ 101,983 $ — $ 101,983 $ — $ 101,983 Provision for loan and lease losses 71,795 — 71,795 59,712 12,083 Total noninterest
Slide 12: Summary Balance Sheet Items
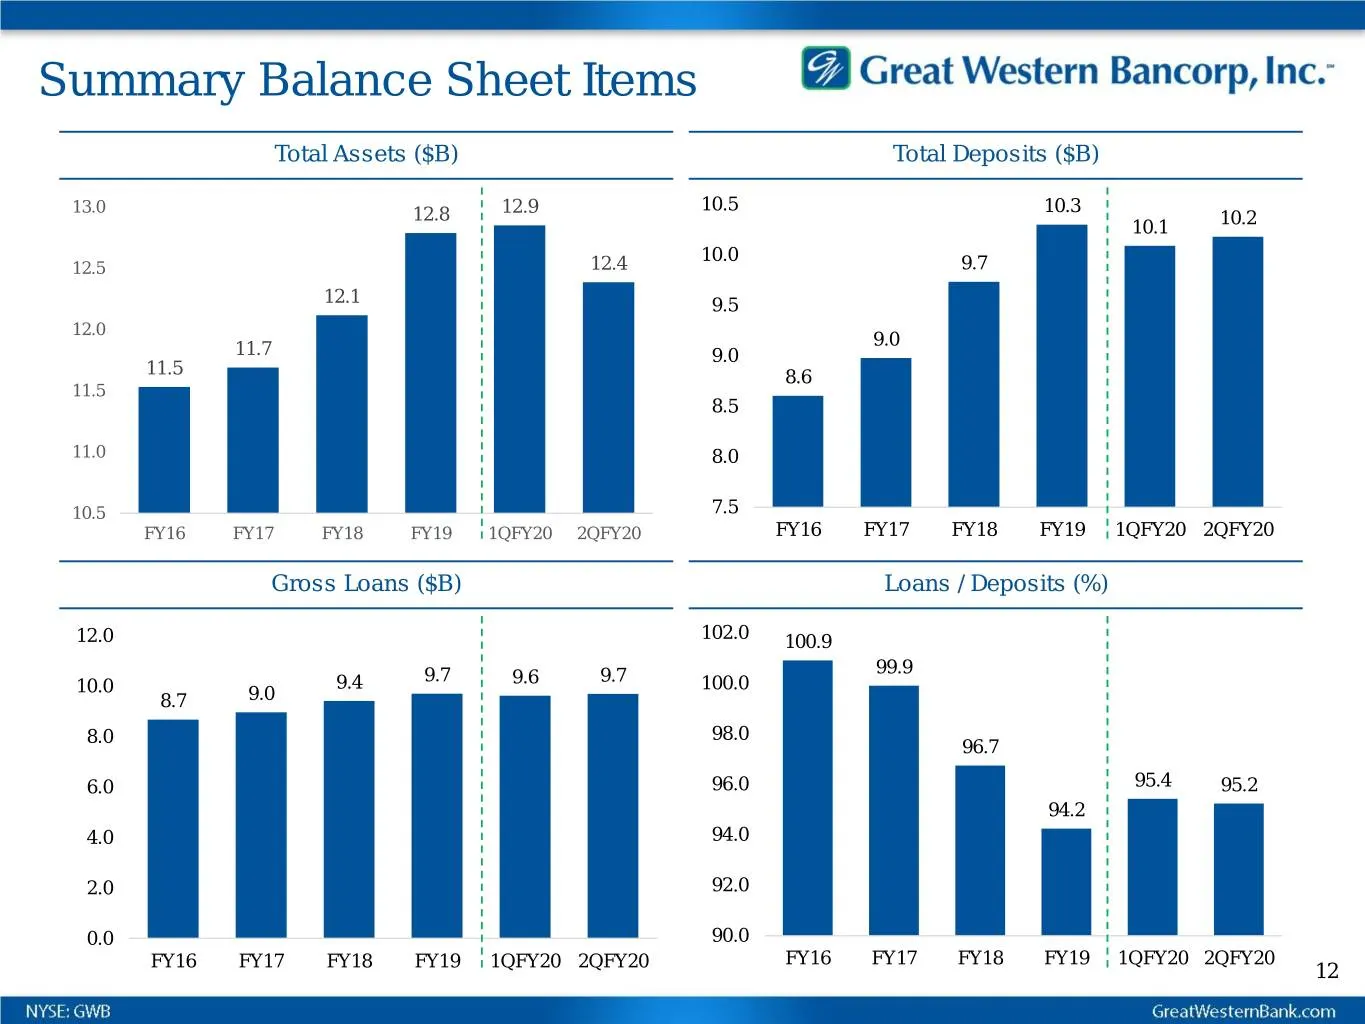
Summary Balance Sheet Items Total Assets ($B) Total Deposits ($B) 10.5 13.0 12.8 12.9 10.3 10.1 10.2 10.0 12.5 12.4 9.7 12.1 9.5 12.0 9.0 11.7 9.0 11.5 8.6 11.5 8.5 11.0 8.0 10.5 7.5 FY16 FY17 FY18 FY19 1QFY20 2QFY20 FY16 FY17 FY18 FY19 1QFY20 2QFY20 Gross Loans ($B) Loans / Deposits (%) 12.0 102.0
Slide 13: Summary Profitability Metrics
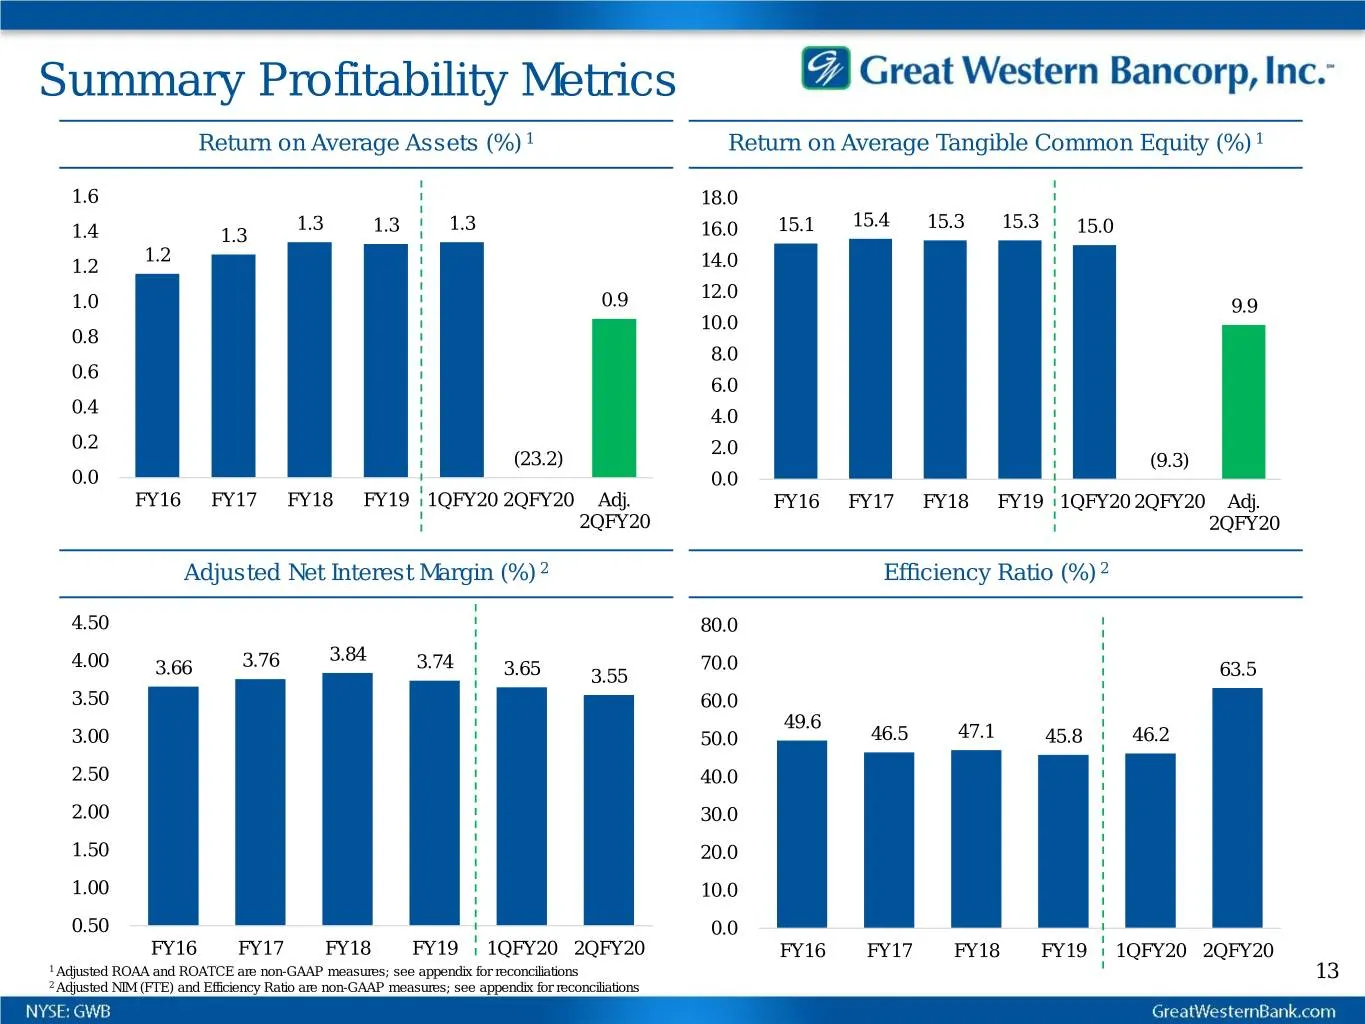
Summary Profitability Metrics Return on Average Assets (%) 1 Return on Average Tangible Common Equity (%) 1 1.6 18.0 1.3 1.3 1.3 15.1 15.4 15.3 15.3 1.4 1.3 16.0 15.0 1.2 1.2 14.0 12.0 1.0 0.9 9.9 10.0 0.8 8.0 0.6 6.0 0.4 4.0 0.2 2.0 (23.2) (9.3) 0.0 0.0 FY16 FY17 FY18 FY19 1QFY20 2QFY20 Adj. FY16 F
Slide 14: Non-interest Income and Expense
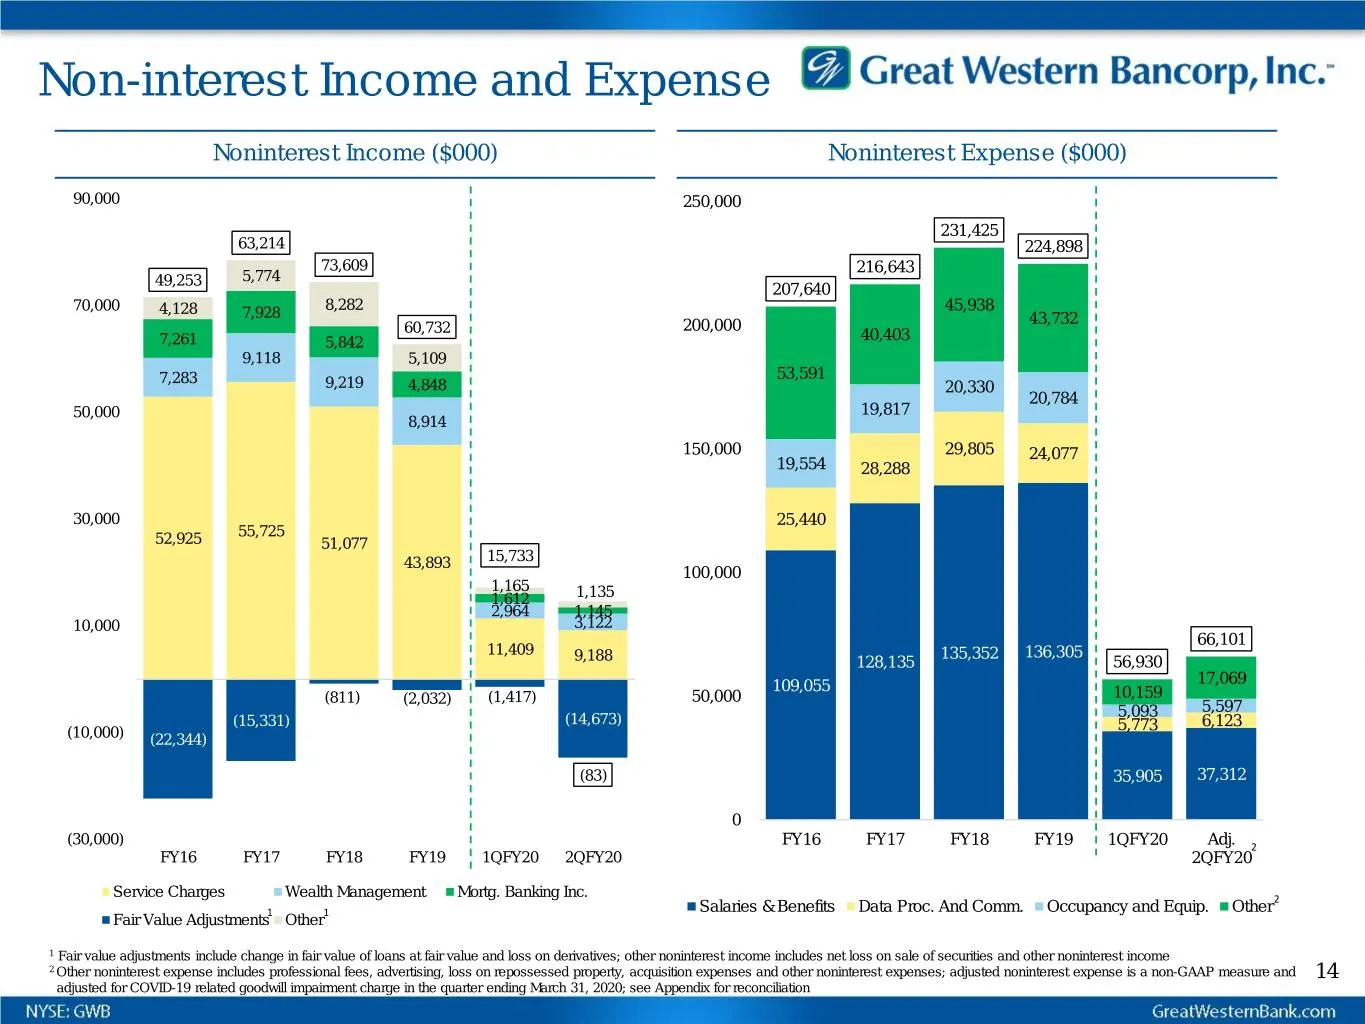
Non-interest Income and Expense Noninterest Income ($000) Noninterest Expense ($000) 90,000 250,000 231,425 63,214 224,898 73,609 216,643 49,253 5,774 207,640 70,000 4,128 8,282 45,938 7,928 43,732 60,732 200,000 7,261 5,842 40,403 9,118 5,109 7,283 53,591 9,219 4,848 20,330 20,784 50,000 19,817 8,9
Slide 15: Historical Capital Ratios
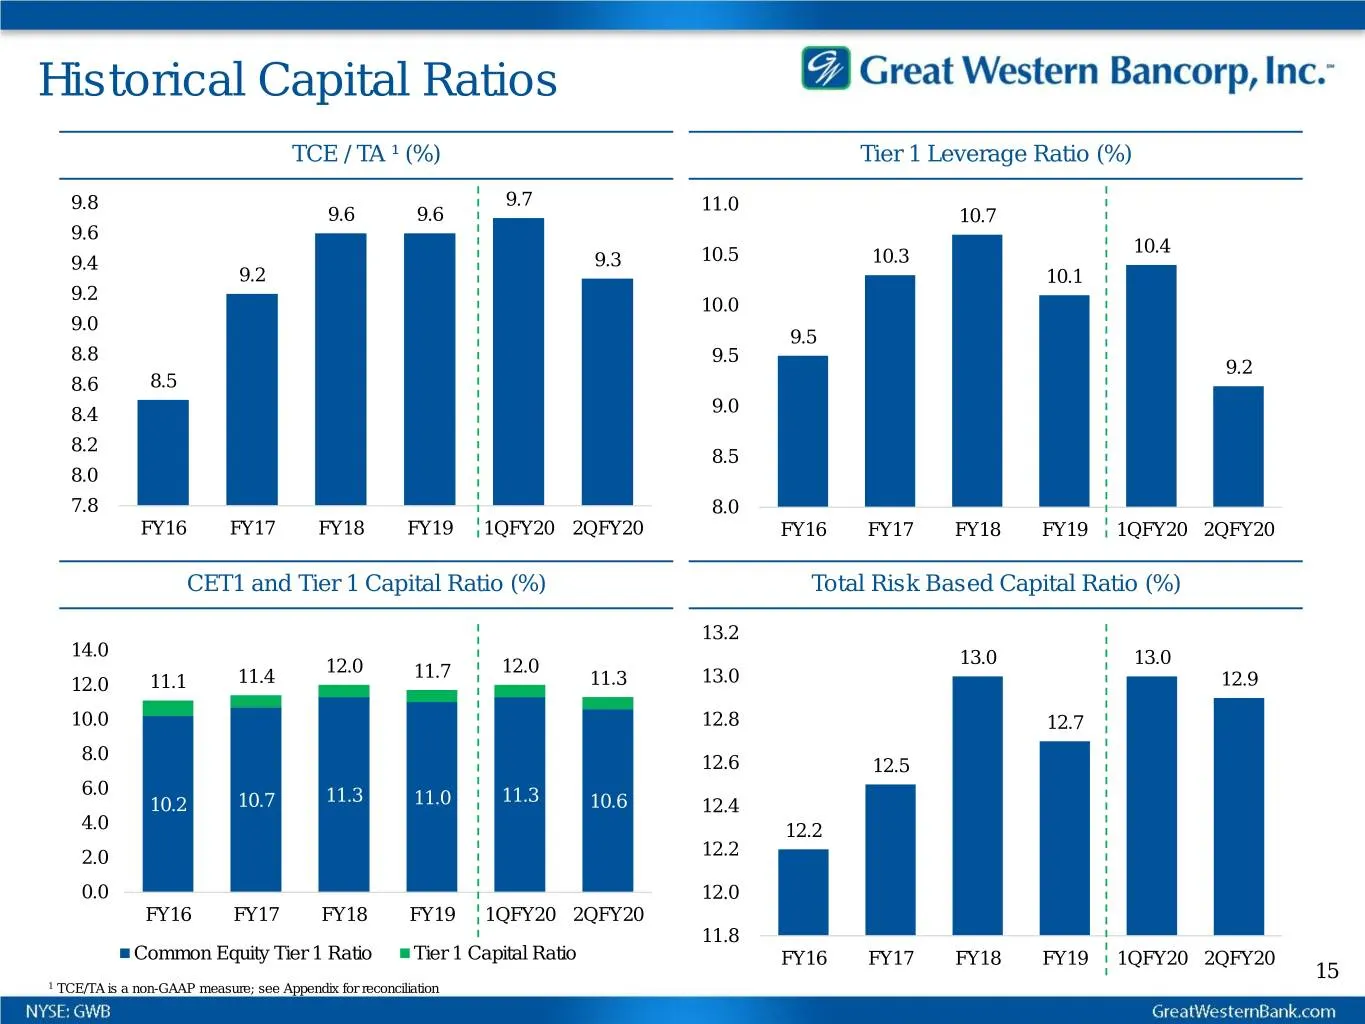
Historical Capital Ratios TCE / TA ¹ (%) Tier 1 Leverage Ratio (%) 9.8 9.7 11.0 9.6 9.6 10.7 9.6 10.4 9.4 9.3 10.5 10.3 9.2 10.1 9.2 10.0 9.0 9.5 8.8 9.5 9.2 8.6 8.5 8.4 9.0 8.2 8.5 8.0 7.8 8.0 FY16 FY17 FY18 FY19 1QFY20 2QFY20 FY16 FY17 FY18 FY19 1QFY20 2QFY20 CET1 and Tier 1 Capital Ratio (%) Tota
Slide 16: Loan Portfolio and Asset Quality
Loan Portfolio and Asset Quality
Slide 17: Loan Portfolio Composition
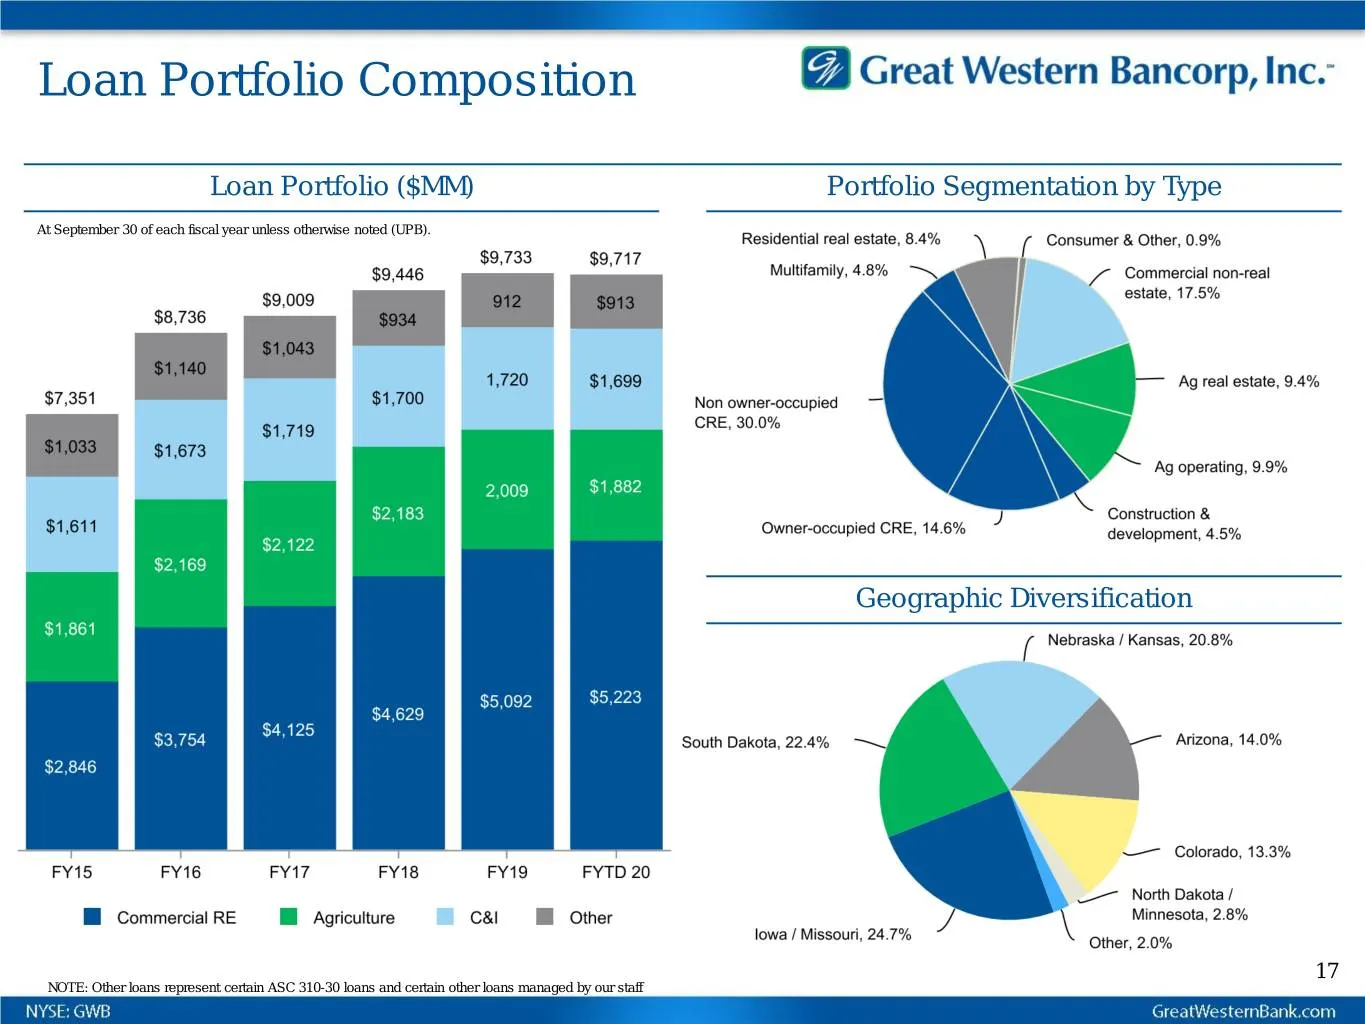
Loan Portfolio Composition Loan Portfolio ($MM) Portfolio Segmentation by Type At September 30 of each fiscal year unless otherwise noted (UPB). Geographic Diversification 17 NOTE: Other loans represent certain ASC 310-30 loans and certain other loans managed by our staff
Slide 18: Commercial Loans
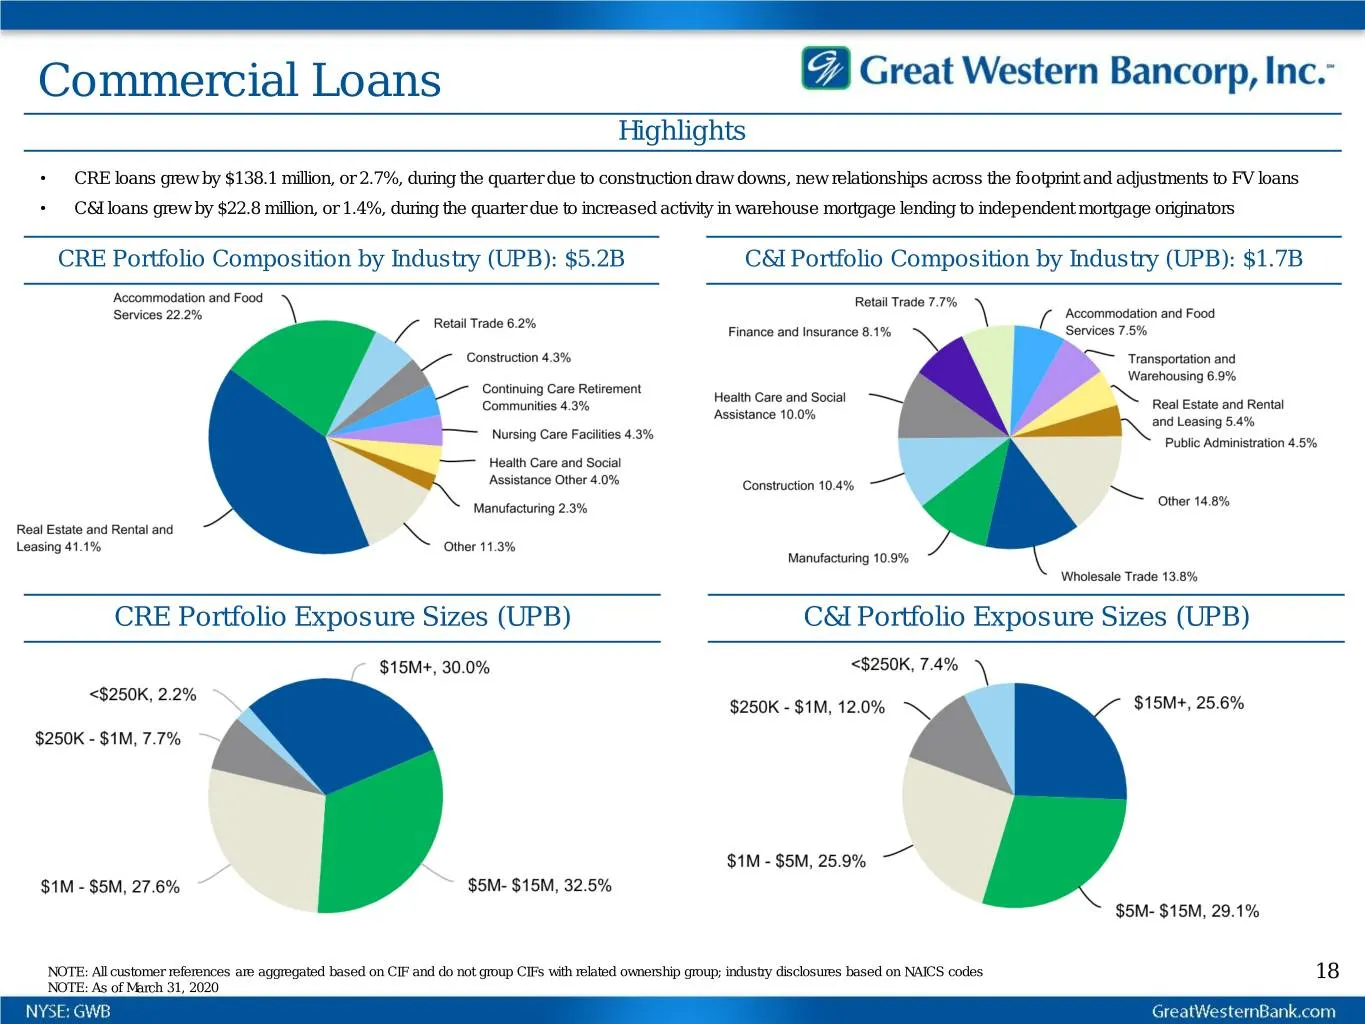
Commercial Loans Highlights • CRE loans grew by $138.1 million, or 2.7%, during the quarter due to construction draw downs, new relationships across the footprint and adjustments to FV loans • C&I loans grew by $22.8 million, or 1.4%, during the quarter due to increased activity in warehouse mortgag
Slide 19: Accommodation / Food Services
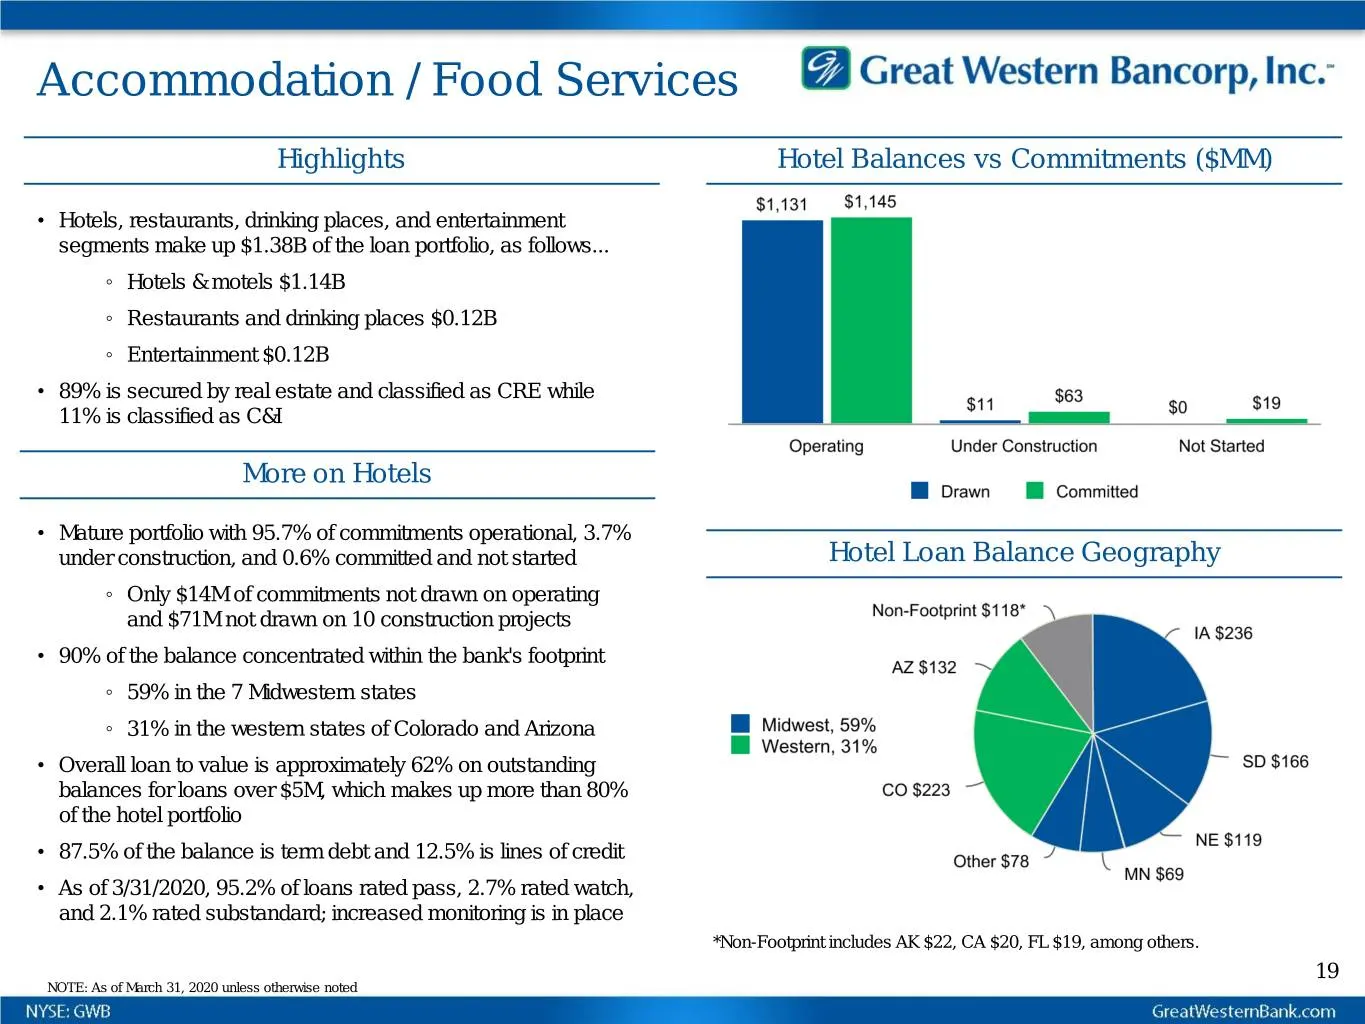
Accommodation / Food Services Highlights Hotel Balances vs Commitments ($MM) • Hotels, restaurants, drinking places, and entertainment segments make up $1.38B of the loan portfolio, as follows... ◦ Hotels & motels $1.14B ◦ Restaurants and drinking places $0.12B ◦ Entertainment $0.12B • 89% is secure
Slide 20: Hotel Portfolio Highlights
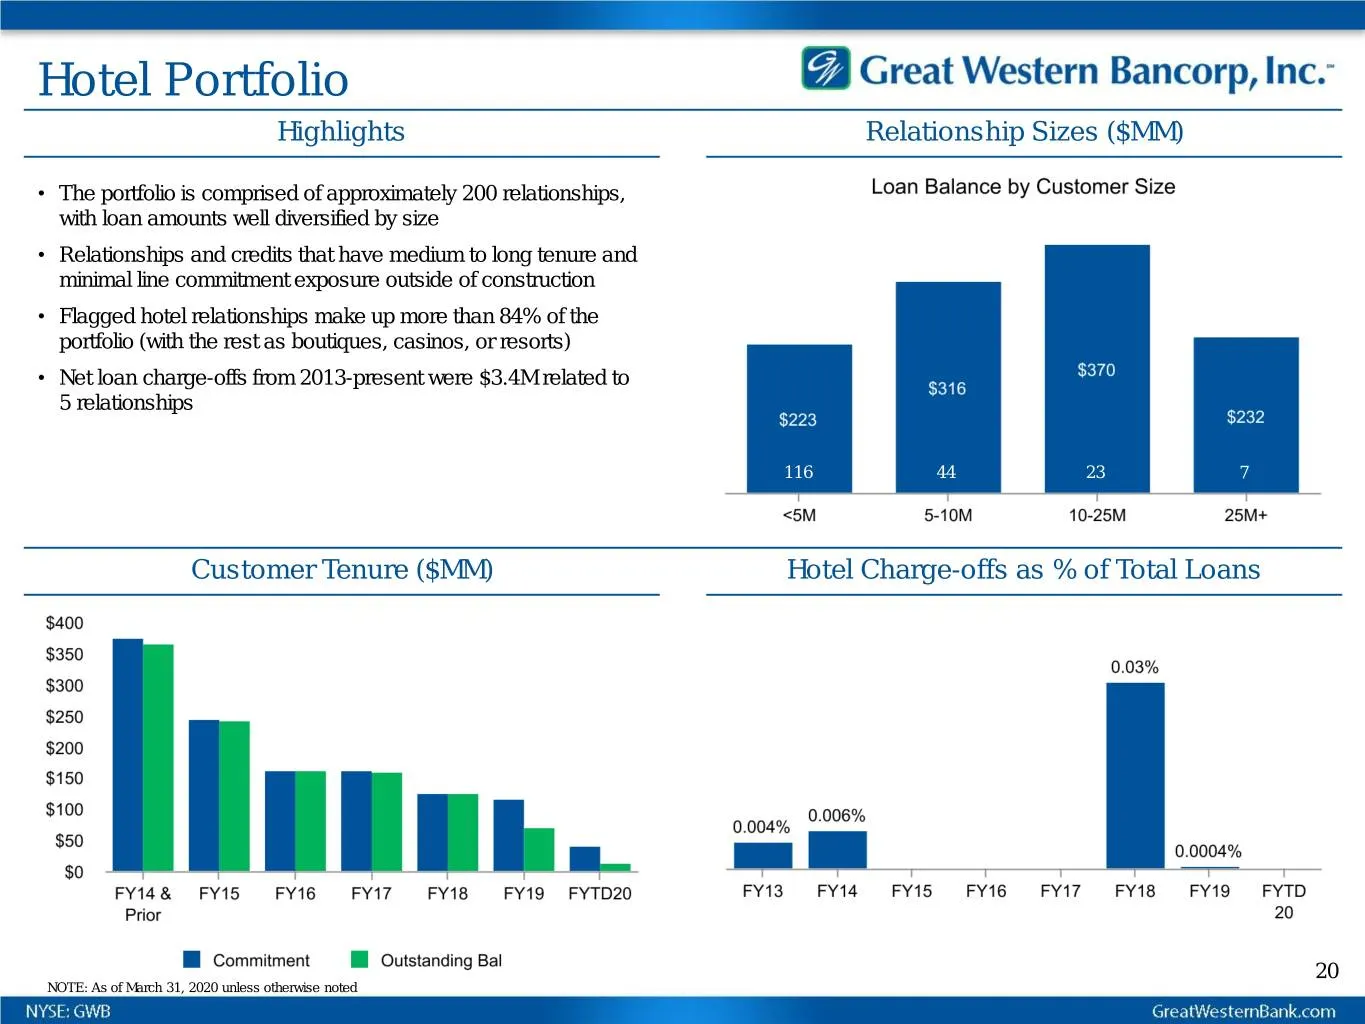
Hotel Portfolio Highlights Relationship Sizes ($MM) • The portfolio is comprised of approximately 200 relationships, with loan amounts well diversified by size • Relationships and credits that have medium to long tenure and minimal line commitment exposure outside of construction • Flagged hotel rel
Slide 21: AG Loan Portfolio Highlights
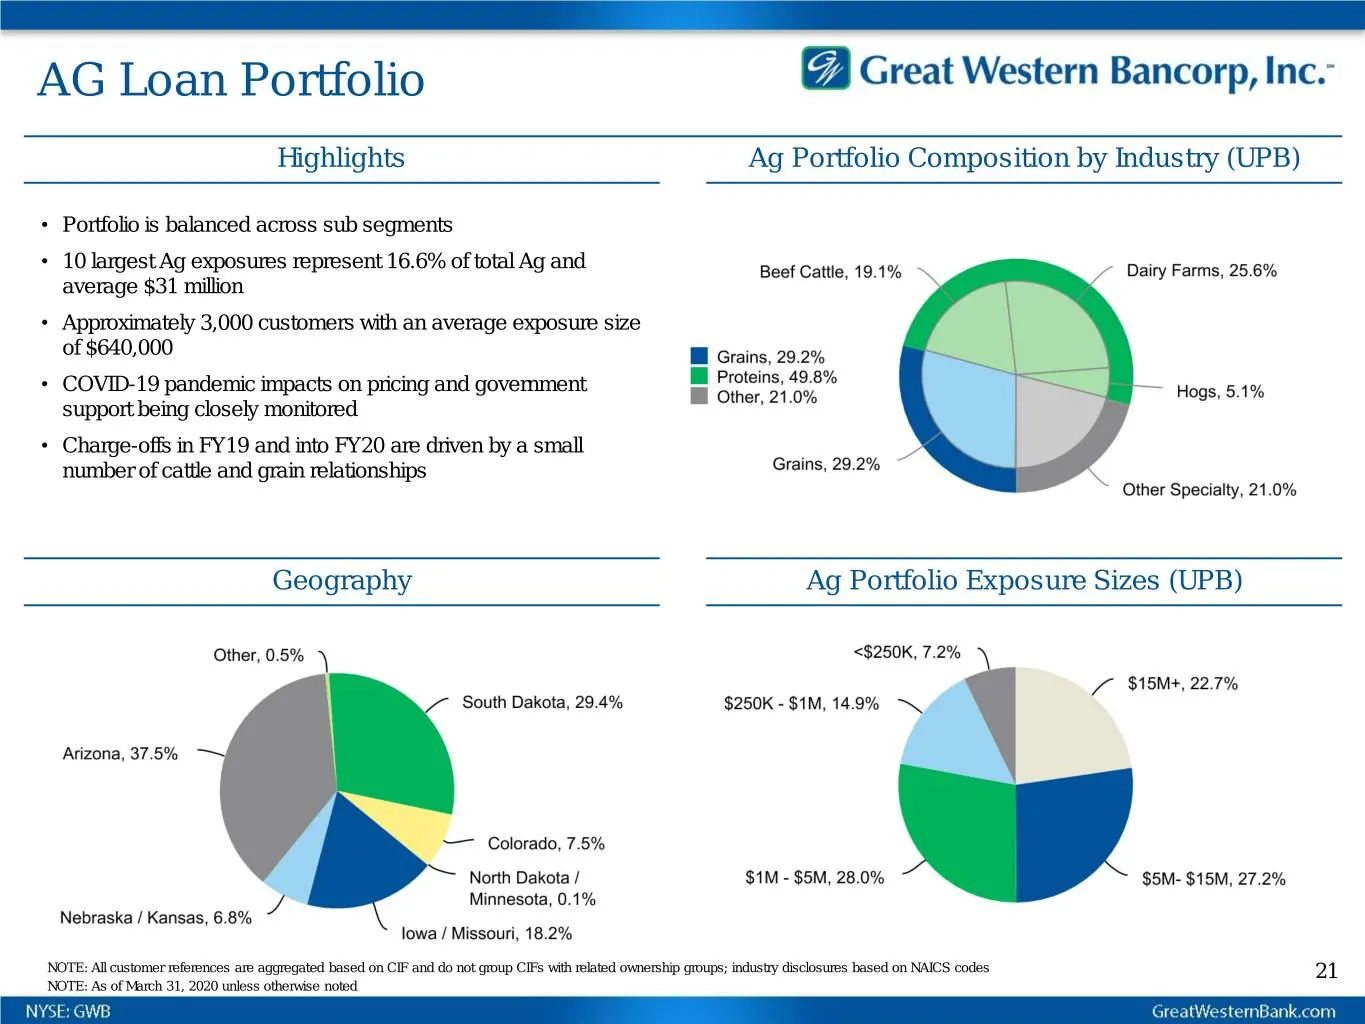
AG Loan Portfolio Highlights Ag Portfolio Composition by Industry (UPB) • Portfolio is balanced across sub segments • 10 largest Ag exposures represent 16.6% of total Ag and average $31 million • Approximately 3,000 customers with an average exposure size of $640,000 • COVID-19 pandemic impacts on p
Slide 22: Asset Quality Summary
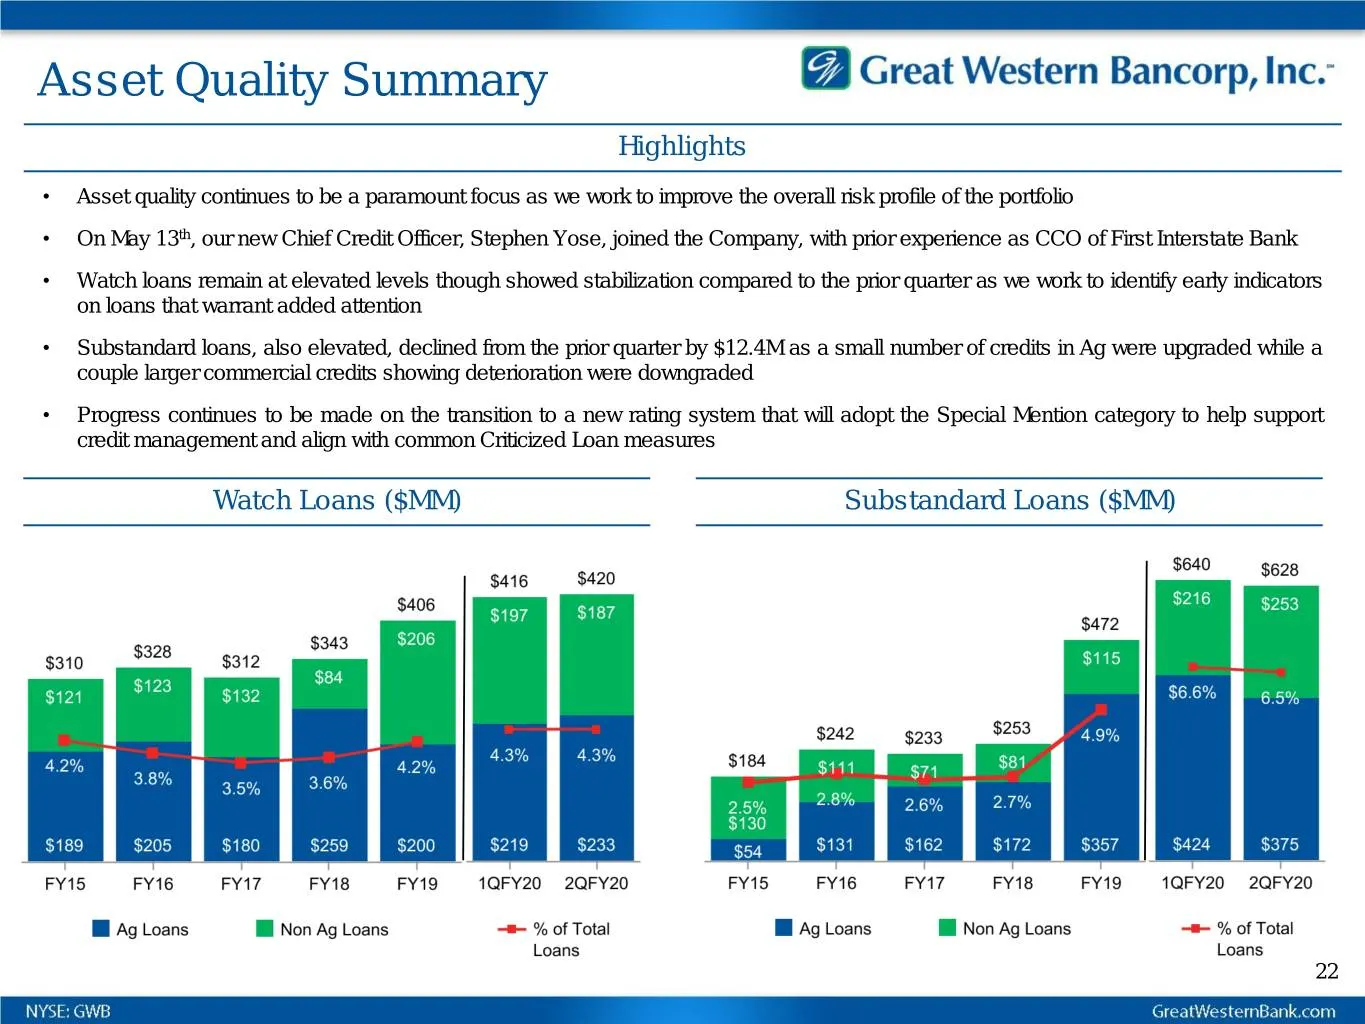
Asset Quality Summary Highlights • Asset quality continues to be a paramount focus as we work to improve the overall risk profile of the portfolio • On May 13th, our new Chief Credit Officer, Stephen Yose, joined the Company, with prior experience as CCO of First Interstate Bank • Watch loans remain
Slide 23: Summary Asset Quality Metrics
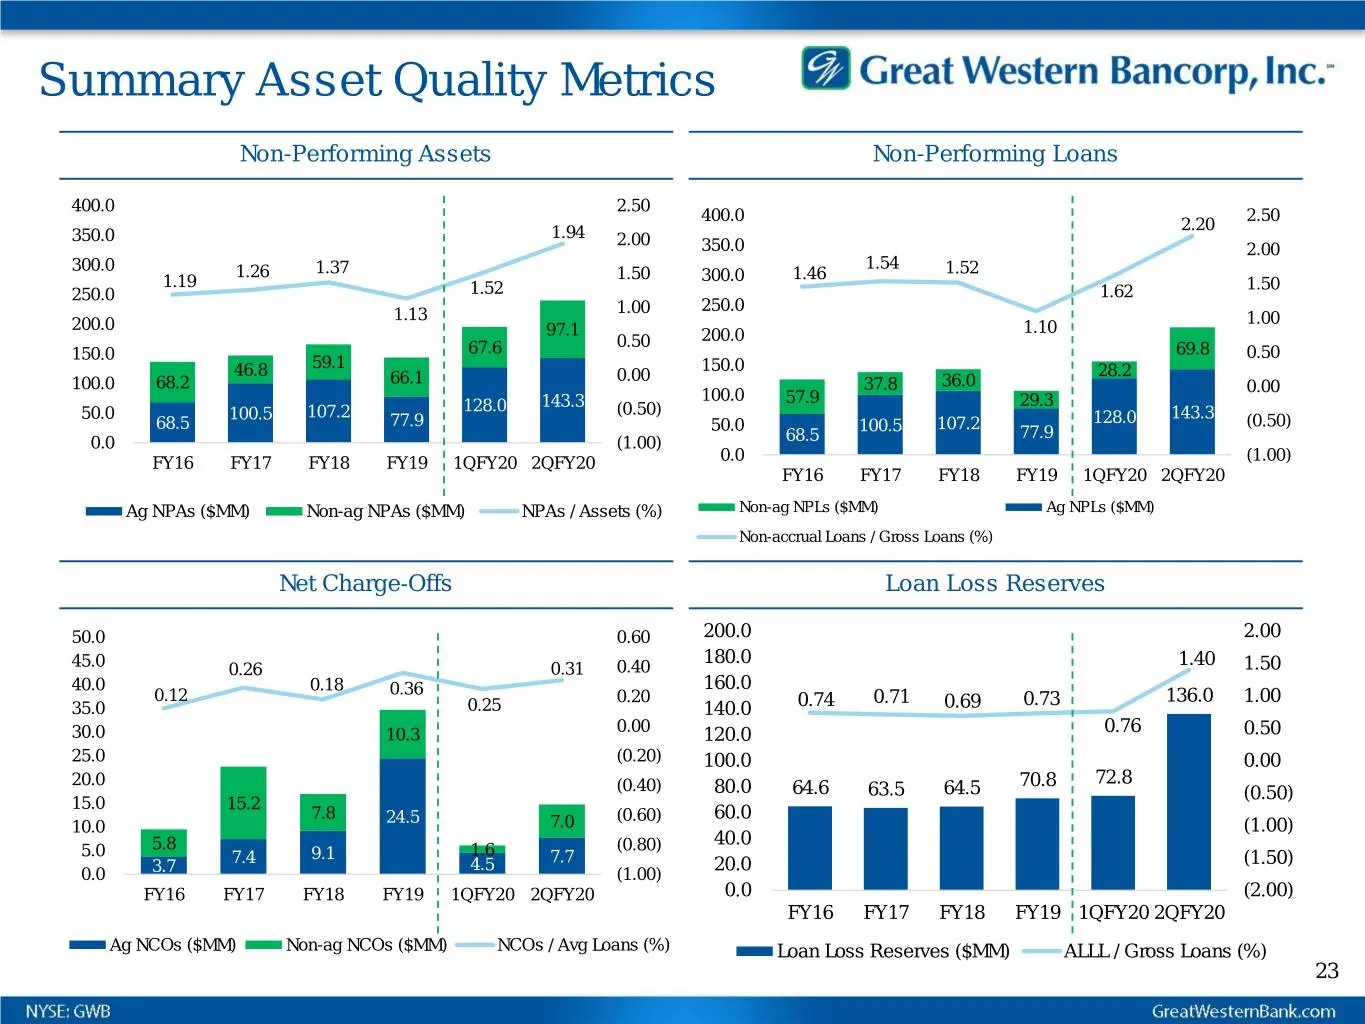
Summary Asset Quality Metrics Non-Performing Assets Non-Performing Loans 400.0 2.50 400.0 2.50 2.20 350.0 1.94 2.00 350.0 2.00 300.0 1.54 1.26 1.37 1.50 300.0 1.46 1.52 1.19 1.50 250.0 1.52 1.62 1.00 250.0 1.13 1.00 200.0 97.1 1.10 0.50 200.0 150.0 67.6 69.8 0.50 59.1 150.0 46.8 66.1 0.00 28.2 100.0
Slide 24: Asset Quality Metrics
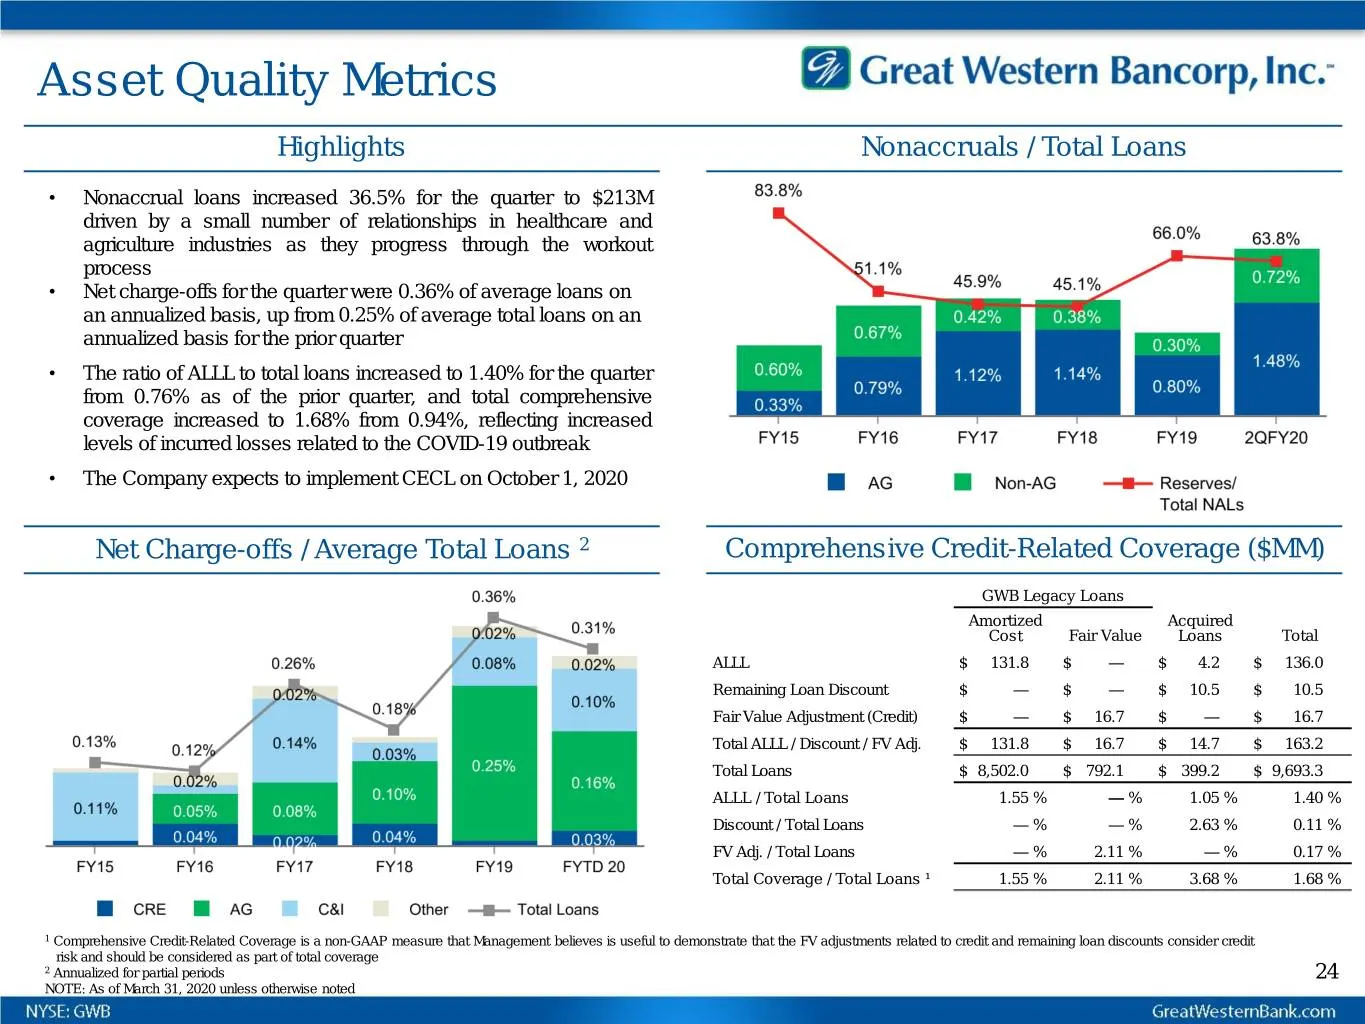
Asset Quality Metrics Highlights Nonaccruals / Total Loans • Nonaccrual loans increased 36.5% for the quarter to $213M driven by a small number of relationships in healthcare and agriculture industries as they progress through the workout process • Net charge-offs for the quarter were 0.36% of avera
Slide 25: AG Loan Asset Quality Commentary
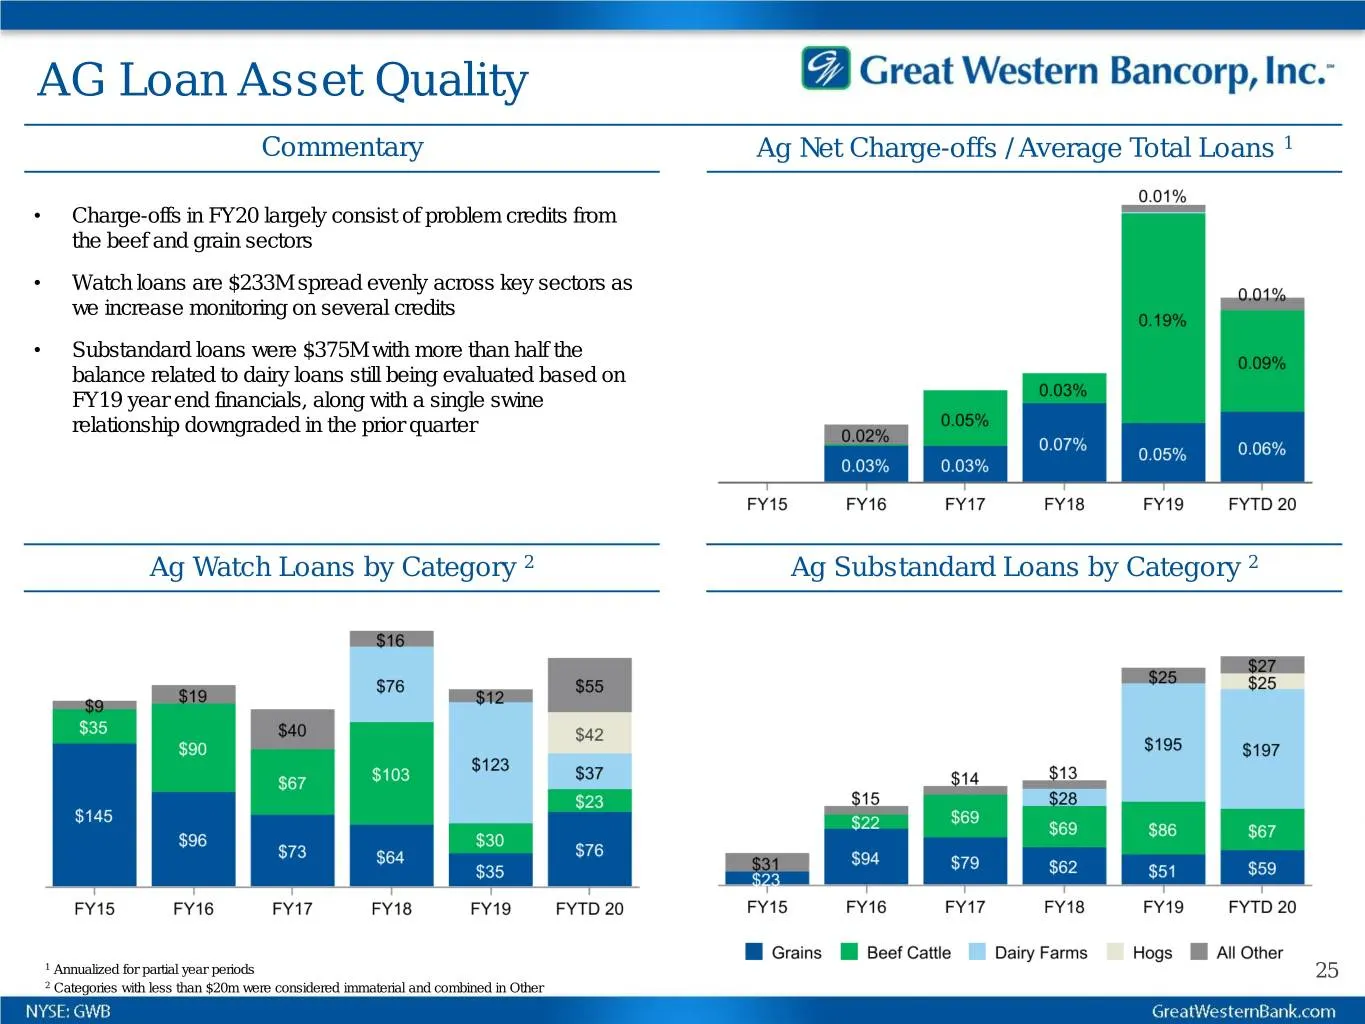
AG Loan Asset Quality Commentary Ag Net Charge-offs / Average Total Loans 1 • Charge-offs in FY20 largely consist of problem credits from the beef and grain sectors • Watch loans are $233M spread evenly across key sectors as we increase monitoring on several credits • Substandard loans were $375M wi
Slide 26: Investments, Liquidity, Funding and Capital
Investments, Liquidity, Funding and Capital
Slide 27: Investments and Borrowings
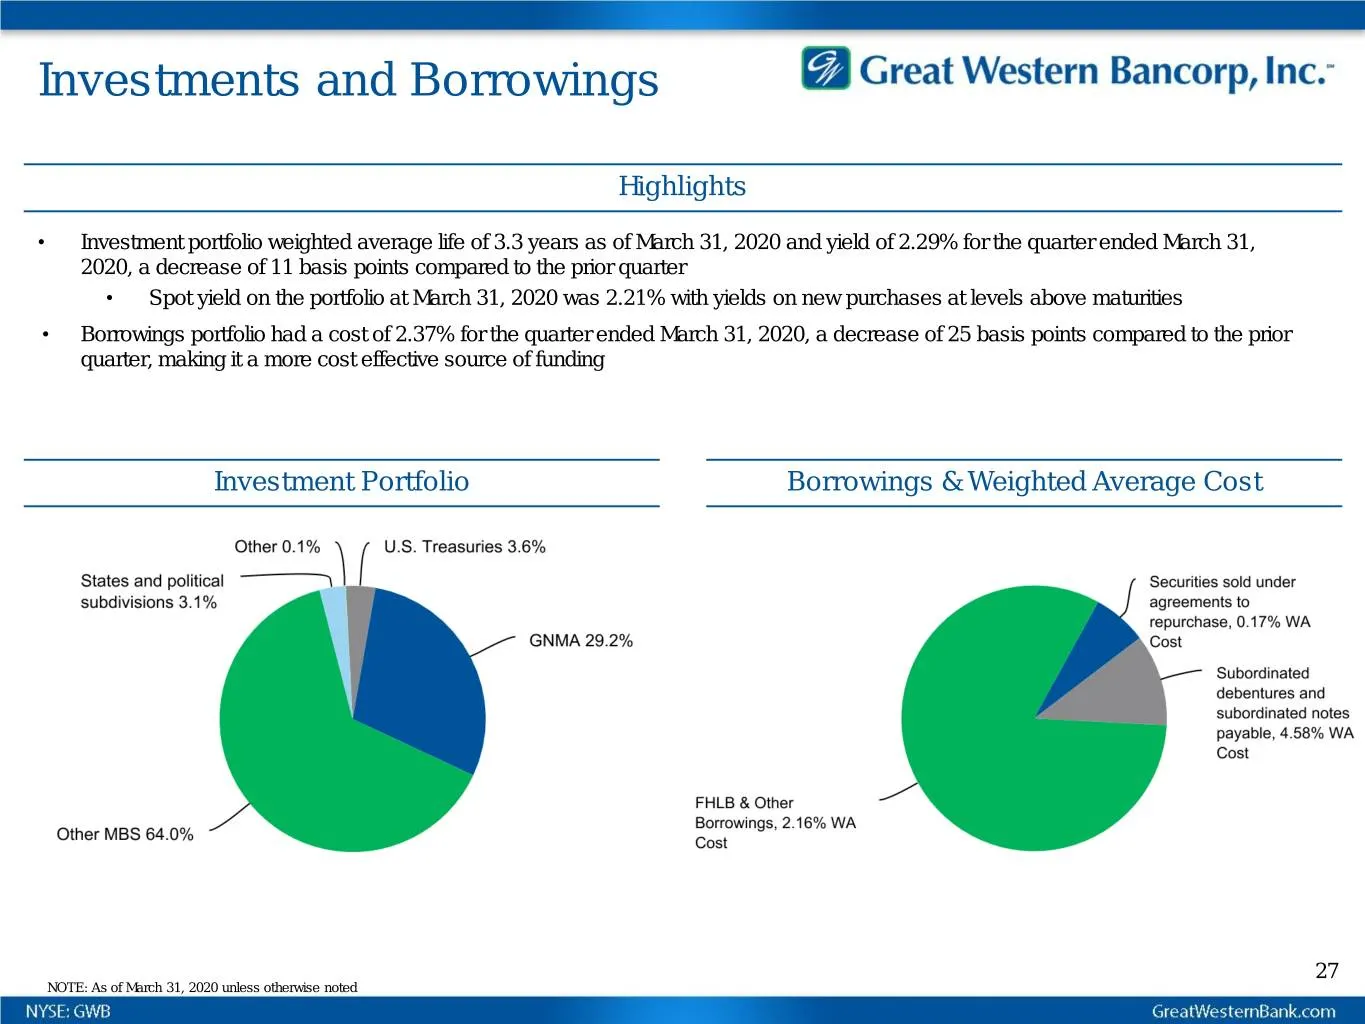
Investments and Borrowings Highlights • Investment portfolio weighted average life of 3.3 years as of March 31, 2020 and yield of 2.29% for the quarter ended March 31, 2020, a decrease of 11 basis points compared to the prior quarter • Spot yield on the portfolio at March 31, 2020 was 2.21% with yie
Slide 28: Liquidity Detail
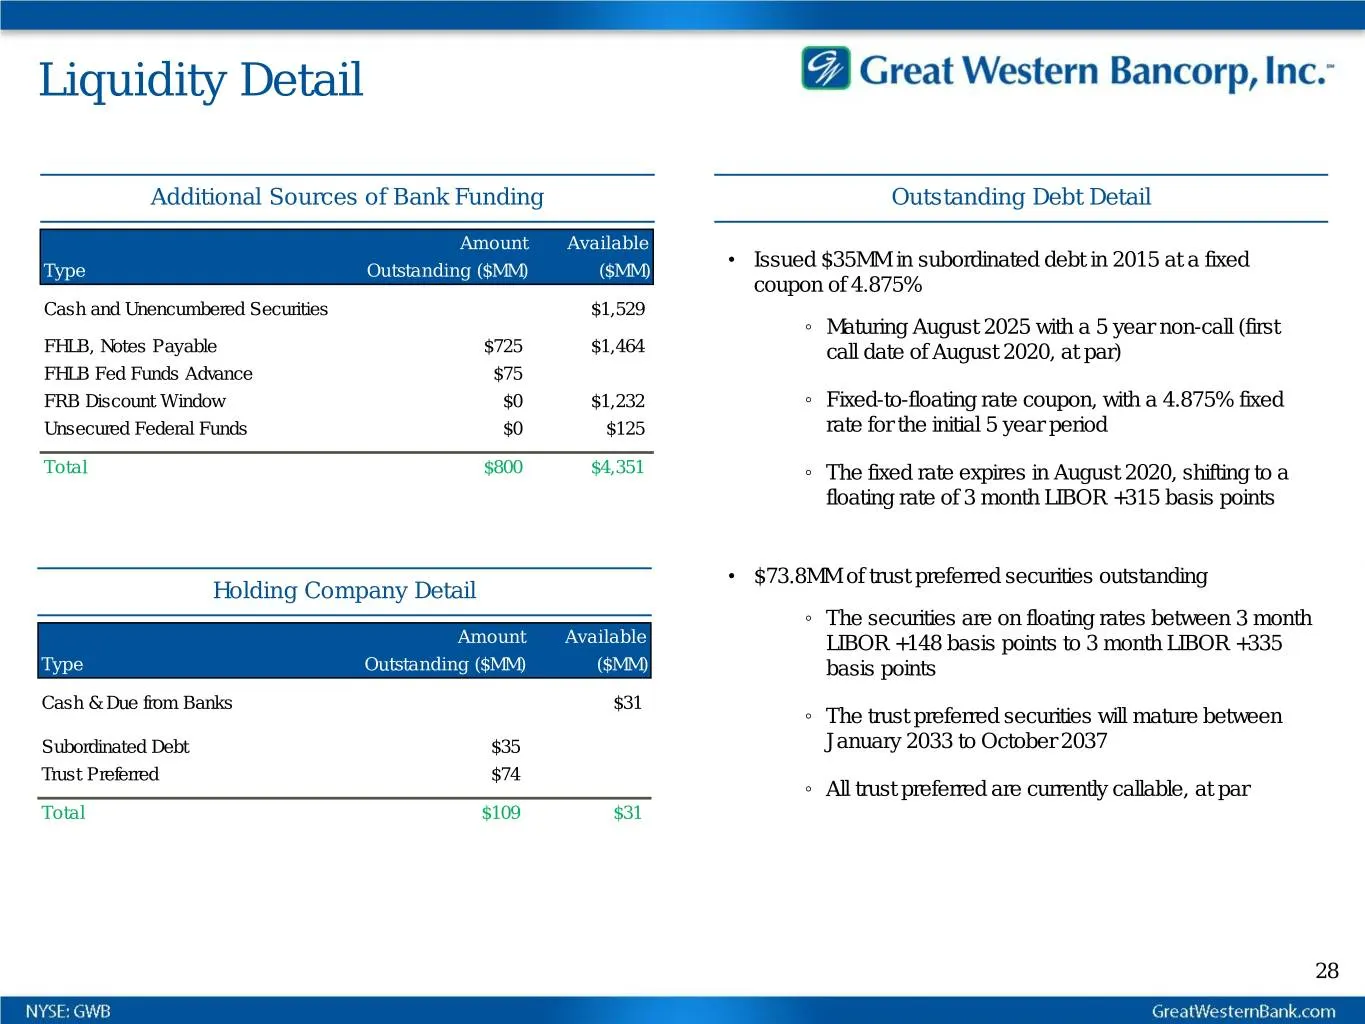
Liquidity Detail Additional Sources of Bank Funding Outstanding Debt Detail Amount Available • Issued $35MM in subordinated debt in 2015 at a fixed Type Outstanding ($MM) ($MM) coupon of 4.875% Cash and Unencumbered Securities $1,529 ◦ Maturing August 2025 with a 5 year non-call (first FHLB, Notes P
Slide 29: Deposits
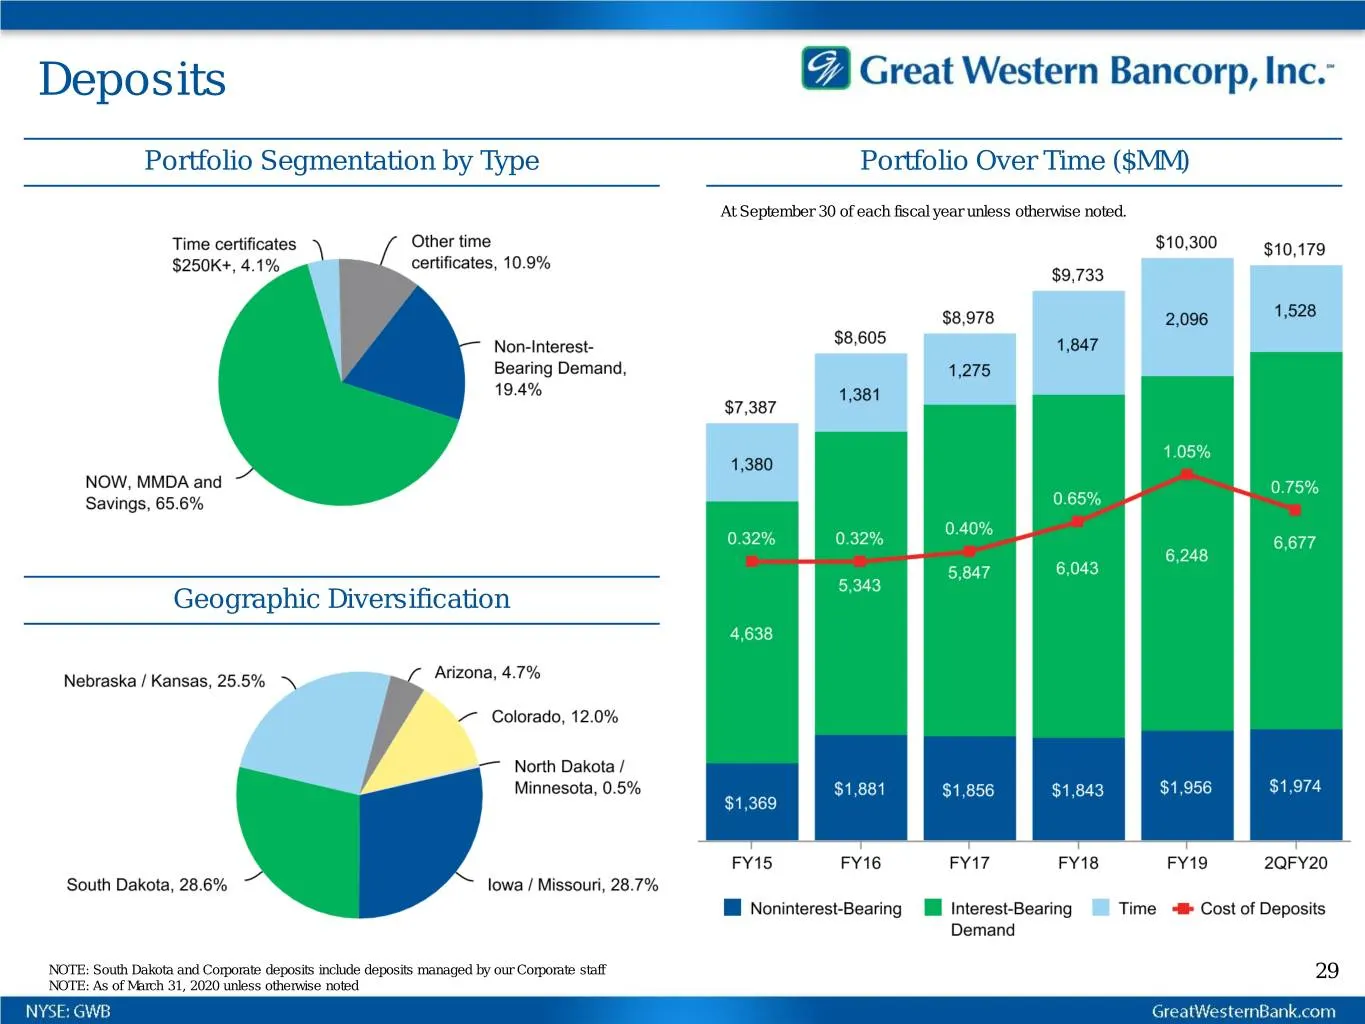
Deposits Portfolio Segmentation by Type Portfolio Over Time ($MM) At September 30 of each fiscal year unless otherwise noted. Geographic Diversification NOTE: South Dakota and Corporate deposits include deposits managed by our Corporate staff 29 NOTE: As of March 31, 2020 unless otherwise noted
Slide 30: Interest Rate Sensitivity Summary
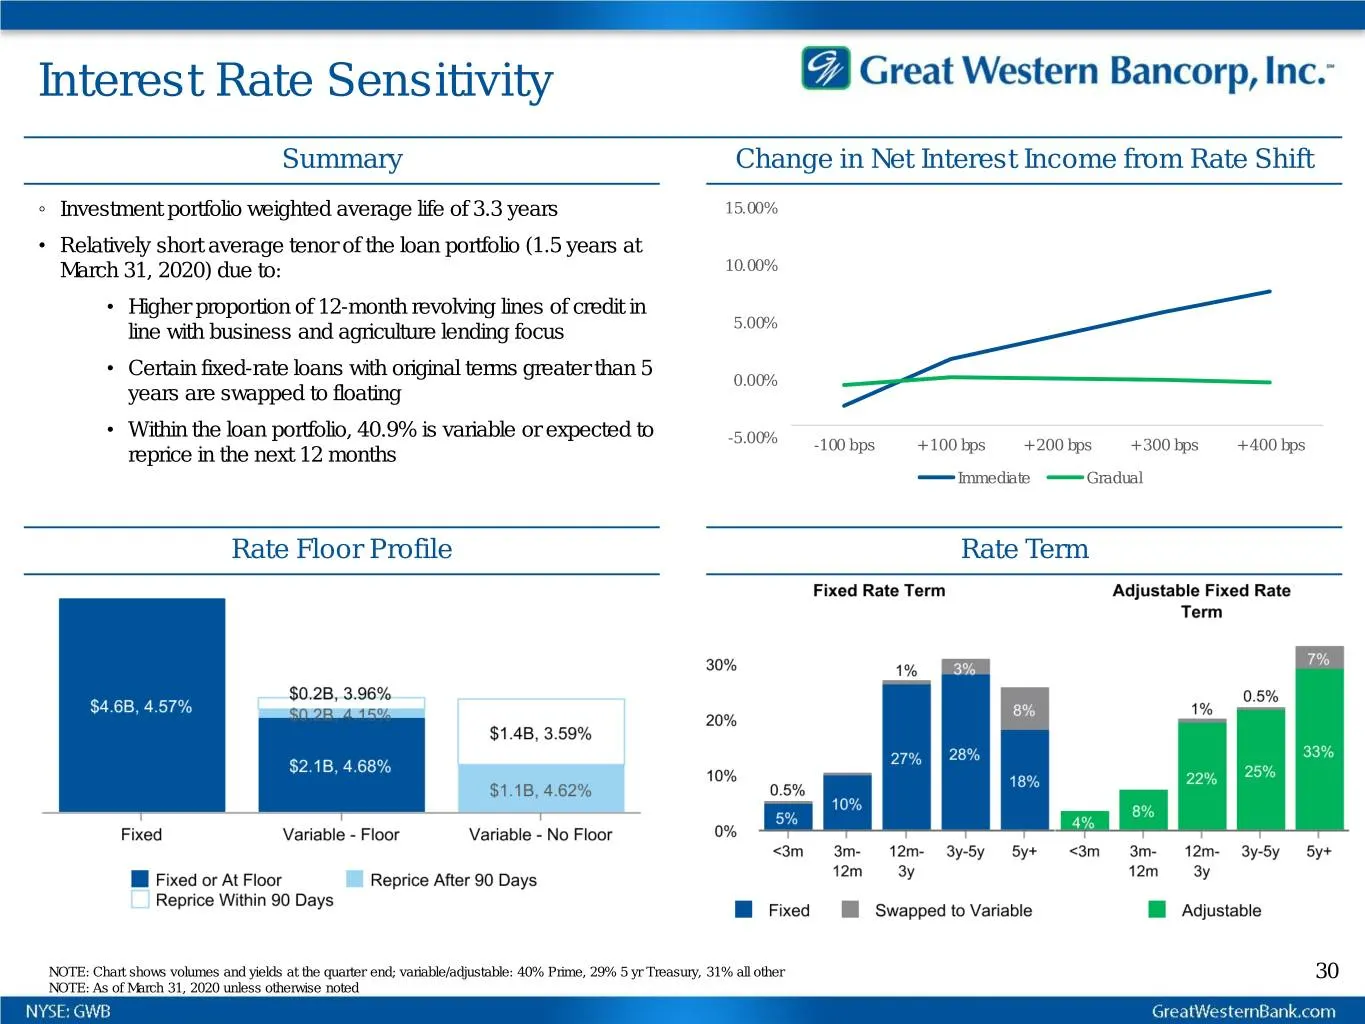
Interest Rate Sensitivity Summary Change in Net Interest Income from Rate Shift ◦ Investment portfolio weighted average life of 3.3 years 15.00% • Relatively short average tenor of the loan portfolio (1.5 years at March 31, 2020) due to: 10.00% • Higher proportion of 12-month revolving lines of cred
Slide 31: Capital Summary
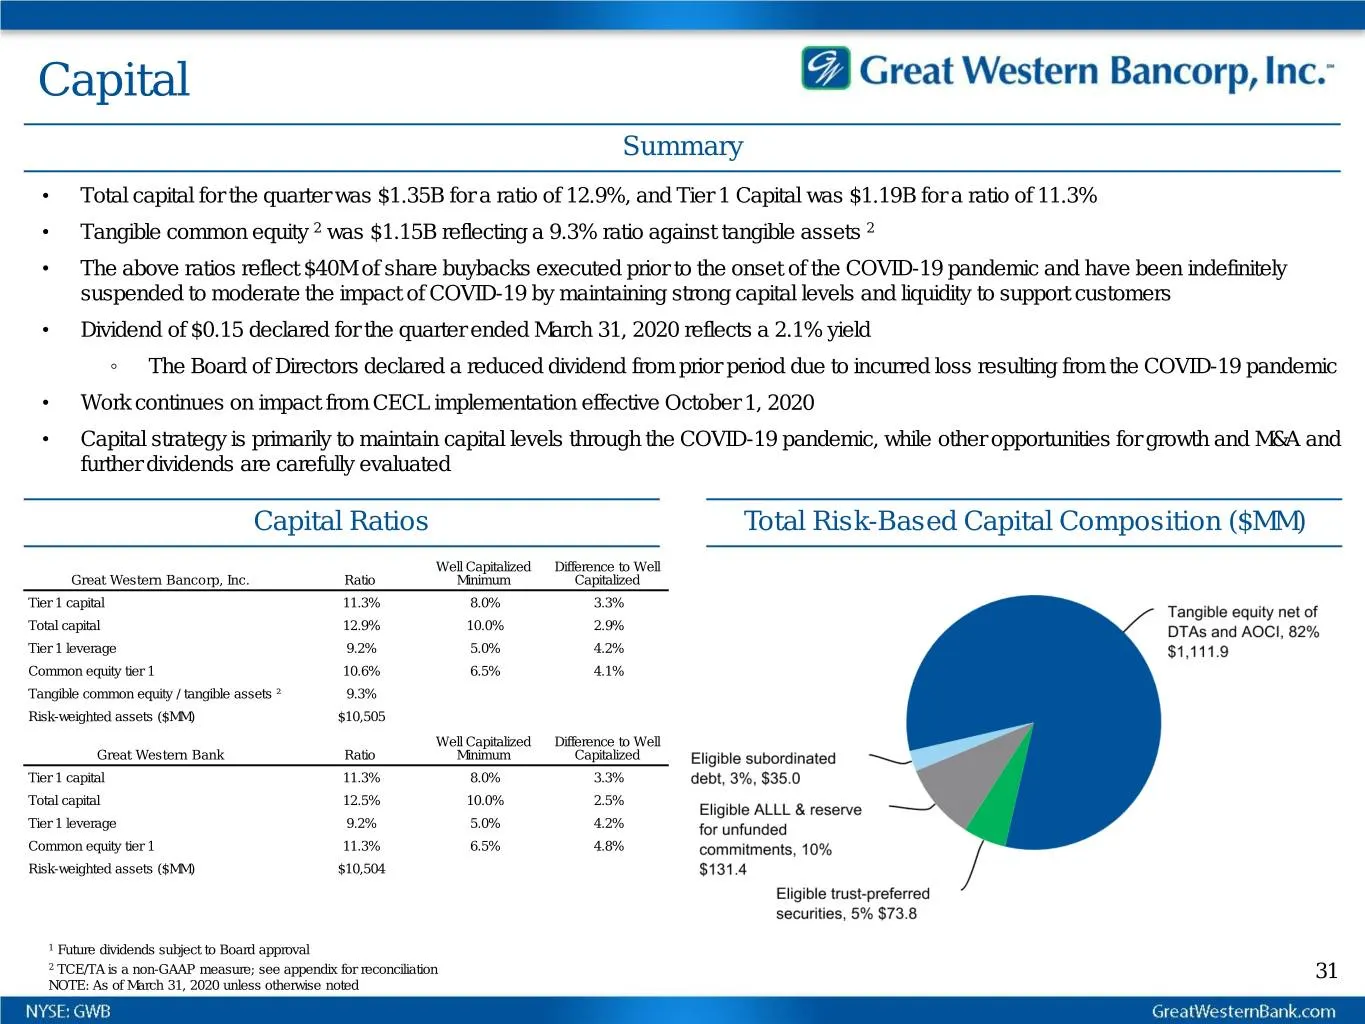
Capital Summary • Total capital for the quarter was $1.35B for a ratio of 12.9%, and Tier 1 Capital was $1.19B for a ratio of 11.3% • Tangible common equity 2 was $1.15B reflecting a 9.3% ratio against tangible assets 2 • The above ratios reflect $40M of share buybacks executed prior to the onset of
Slide 32: Pro Forma Capital
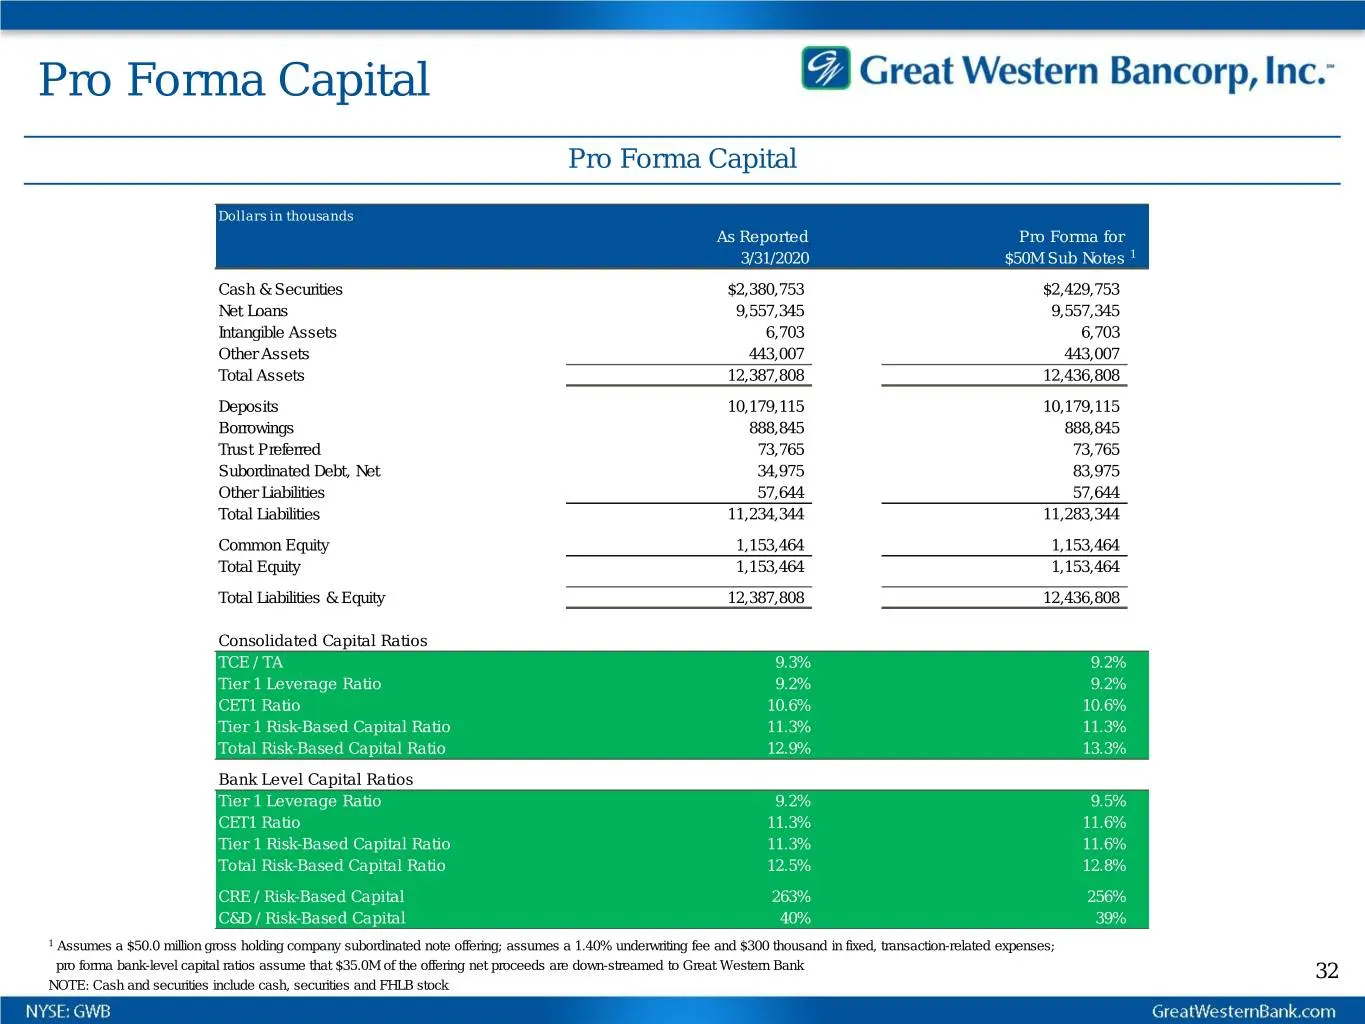
Pro Forma Capital Pro Forma Capital Dollars in thousands As Reported Pro Forma for 3/31/2020 $50M Sub Notes 1 Cash & Securities $2,380,753 $2,429,753 Net Loans 9,557,345 9,557,345 Intangible Assets 6,703 6,703 Other Assets 443,007 443,007 Total Assets 12,387,808 12,436,808 Deposits 10,179,115 10,179
Slide 33: Double Leverage & Interest Coverage
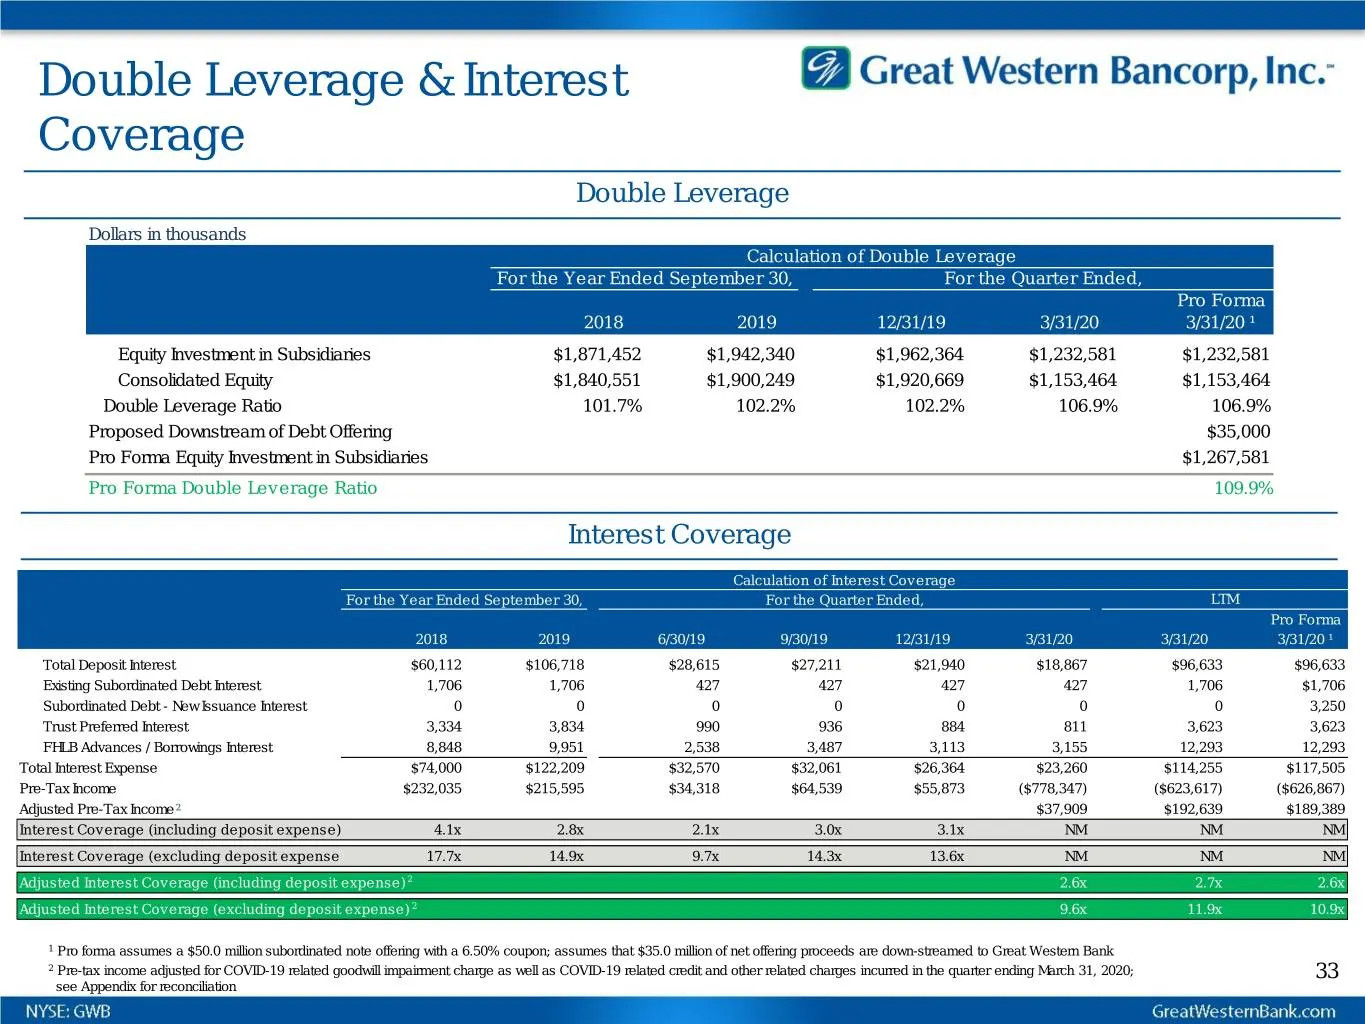
Double Leverage & Interest Coverage Double Leverage Dollars in thousands Calculation of Double Leverage For the Year Ended September 30, For the Quarter Ended, Pro Forma 2018 2019 12/31/19 3/31/20 3/31/20 ¹ Equity Investment in Subsidiaries $1,871,452 $1,942,340 $1,962,364 $1,232,581 $1,232,581 Cons
Slide 34: Summary
Great Western Bancorp, Inc.” Summaty
Slide 35: Summary
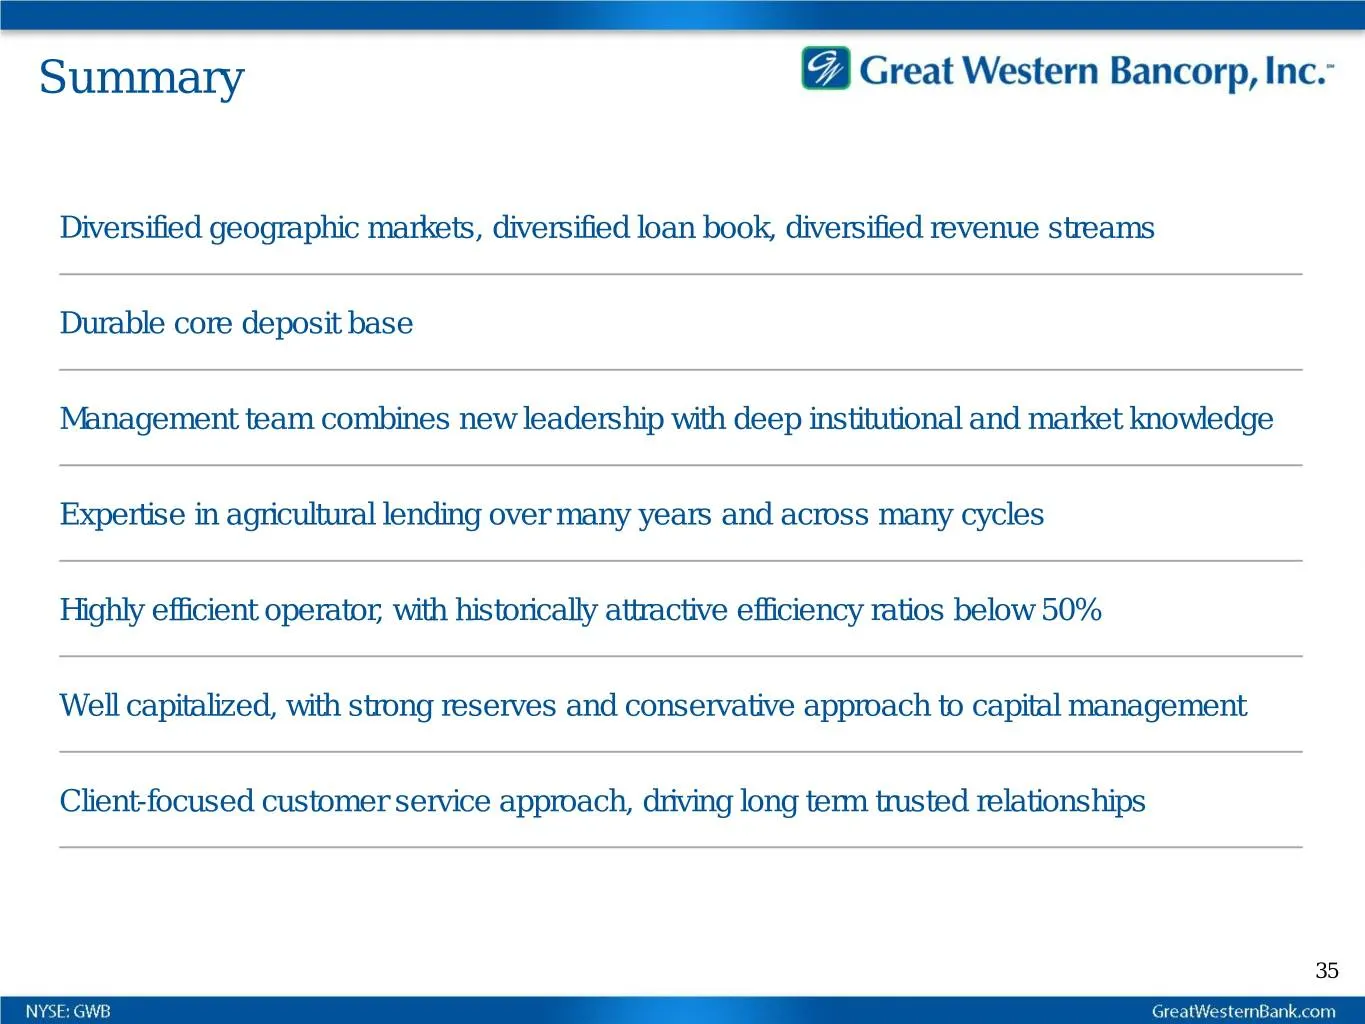
Summary Diversified geographic markets, diversified loan book, diversified revenue streams Durable core deposit base Management team combines new leadership with deep institutional and market knowledge Expertise in agricultural lending over many years and across many cycles Highly efficient operator
Slide 36: Appendix: Other Financial Information and Non-GAAP Measures
Appendix Other Financial Information and Non-GAAP Measures
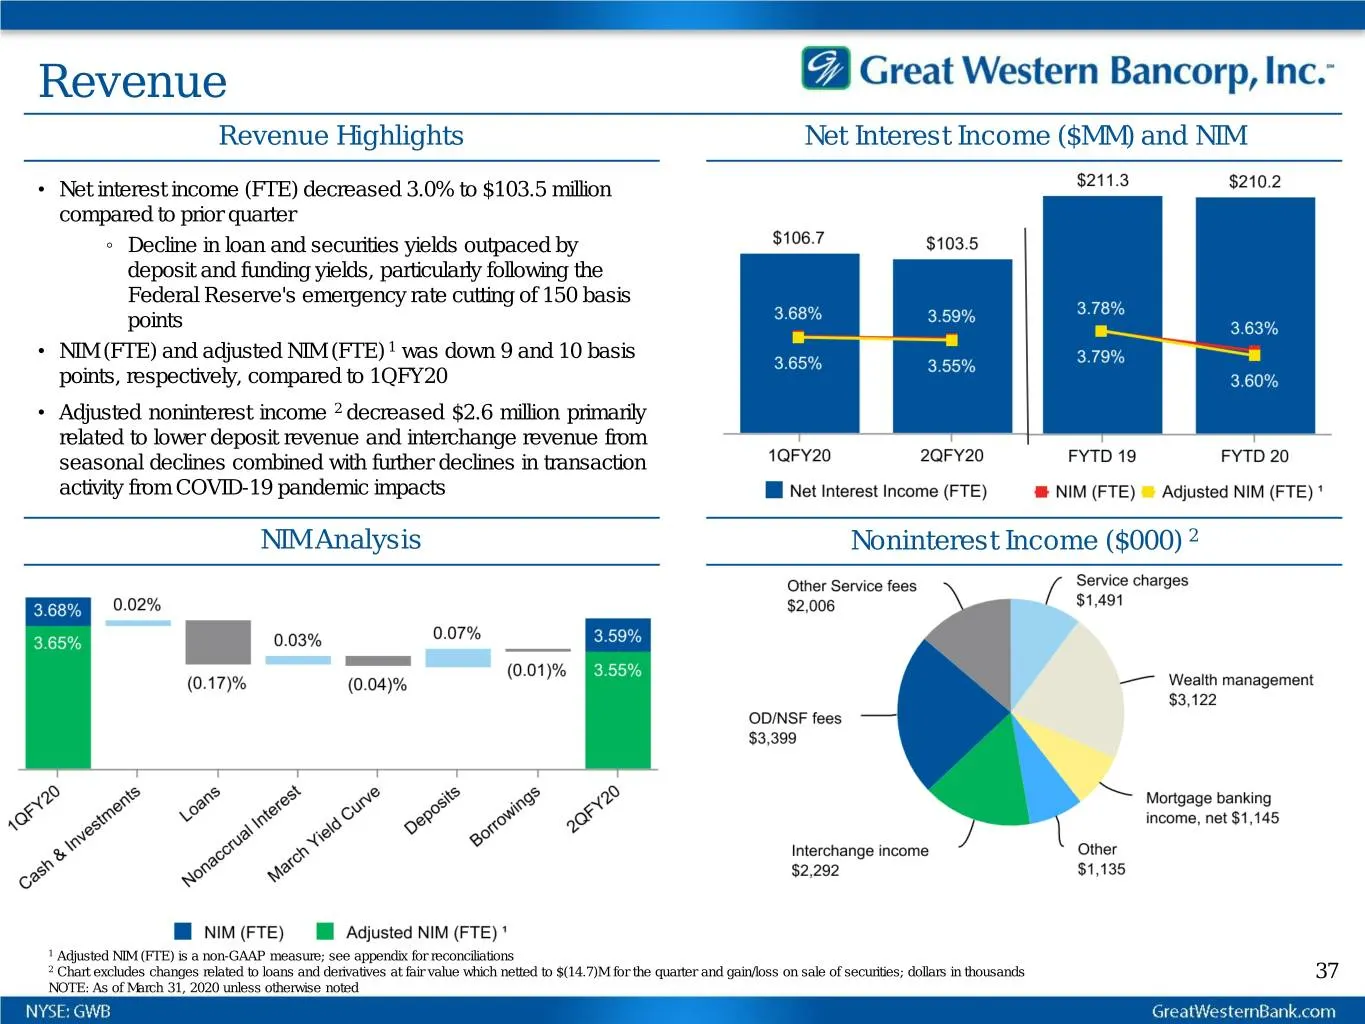
Slide 37: Revenue
Revenue Revenue Highlights Net Interest Income ($MM) and NIM • Net interest income (FTE) decreased 3.0% to $103.5 million compared to prior quarter ◦ Decline in loan and securities yields outpaced by deposit and funding yields, particularly following the Federal Reserve's emergency rate cutting of 1
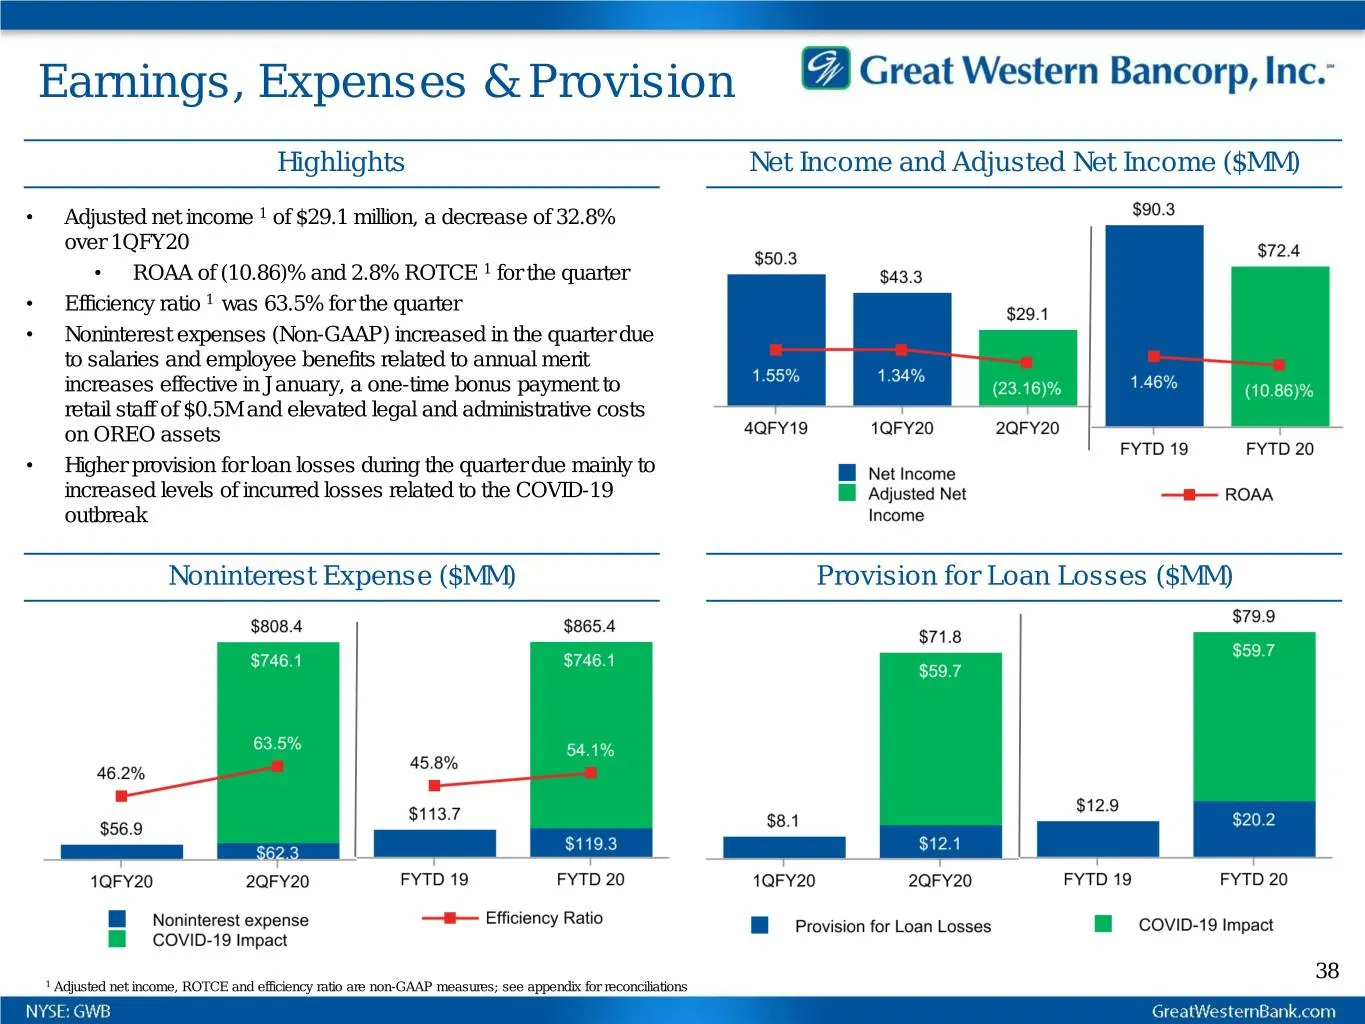
Slide 38: Earnings, Expenses & Provision
Earnings, Expenses & Provision Highlights Net Income and Adjusted Net Income ($MM) • Adjusted net income 1 of $29.1 million, a decrease of 32.8% over 1QFY20 • ROAA of (10.86)% and 2.8% ROTCE 1 for the quarter • Efficiency ratio 1 was 63.5% for the quarter • Noninterest expenses (Non-GAAP) increased
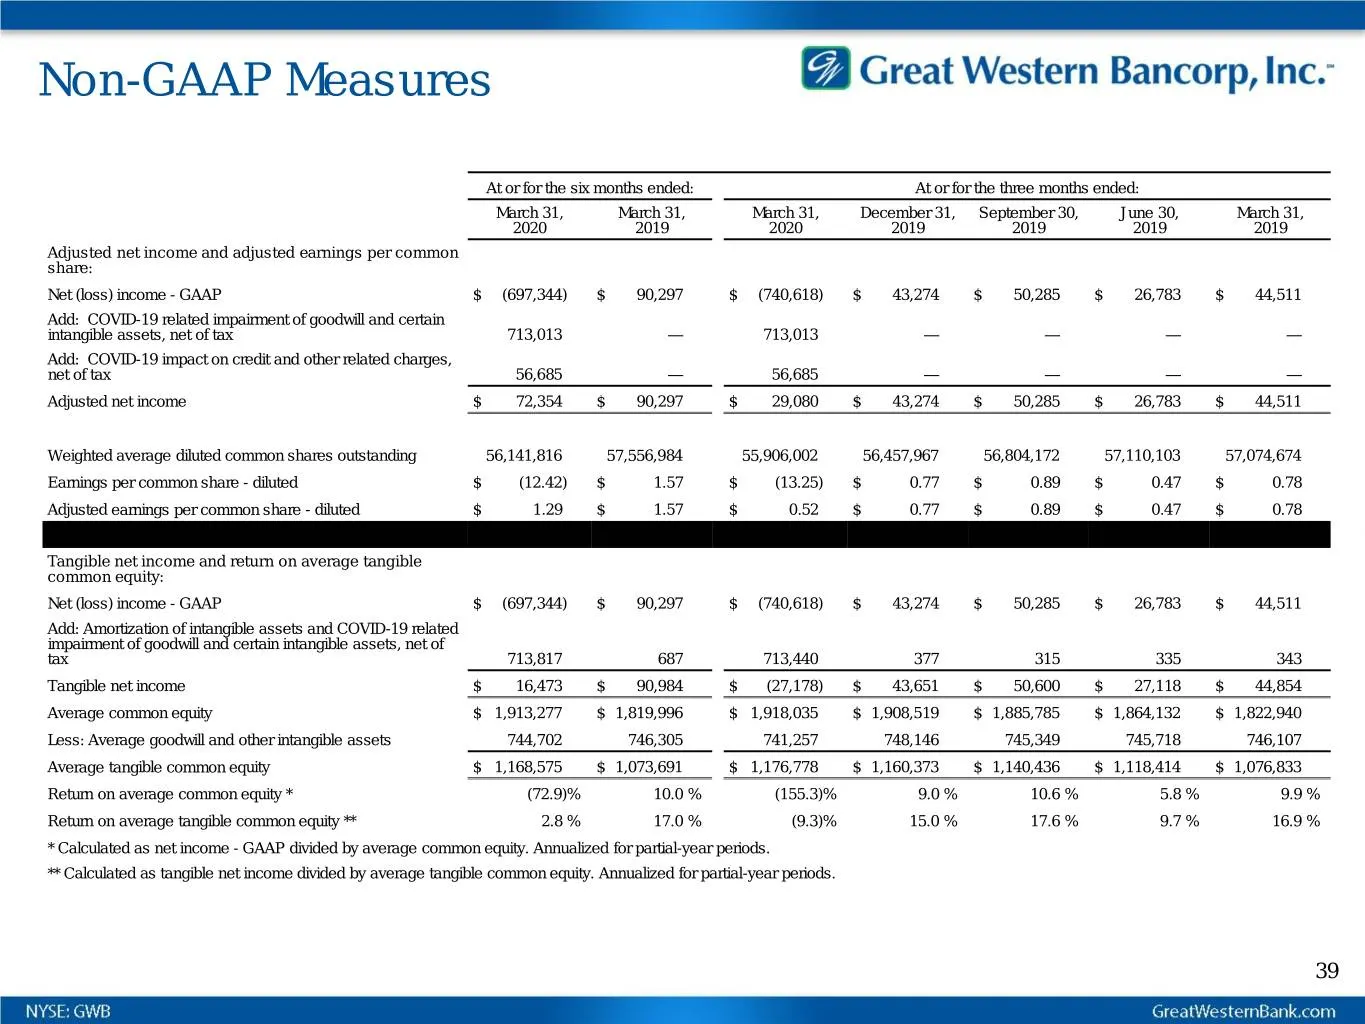
Slide 39: Non-GAAP Measures
Non-GAAP Measures At or for the six months ended: At or for the three months ended: March 31, March 31, March 31, December 31, September 30, June 30, March 31, 2020 2019 2020 2019 2019 2019 2019 Adjusted net income and adjusted earnings per common share: Net (loss) income - GAAP $ (697,344) $ 90,297
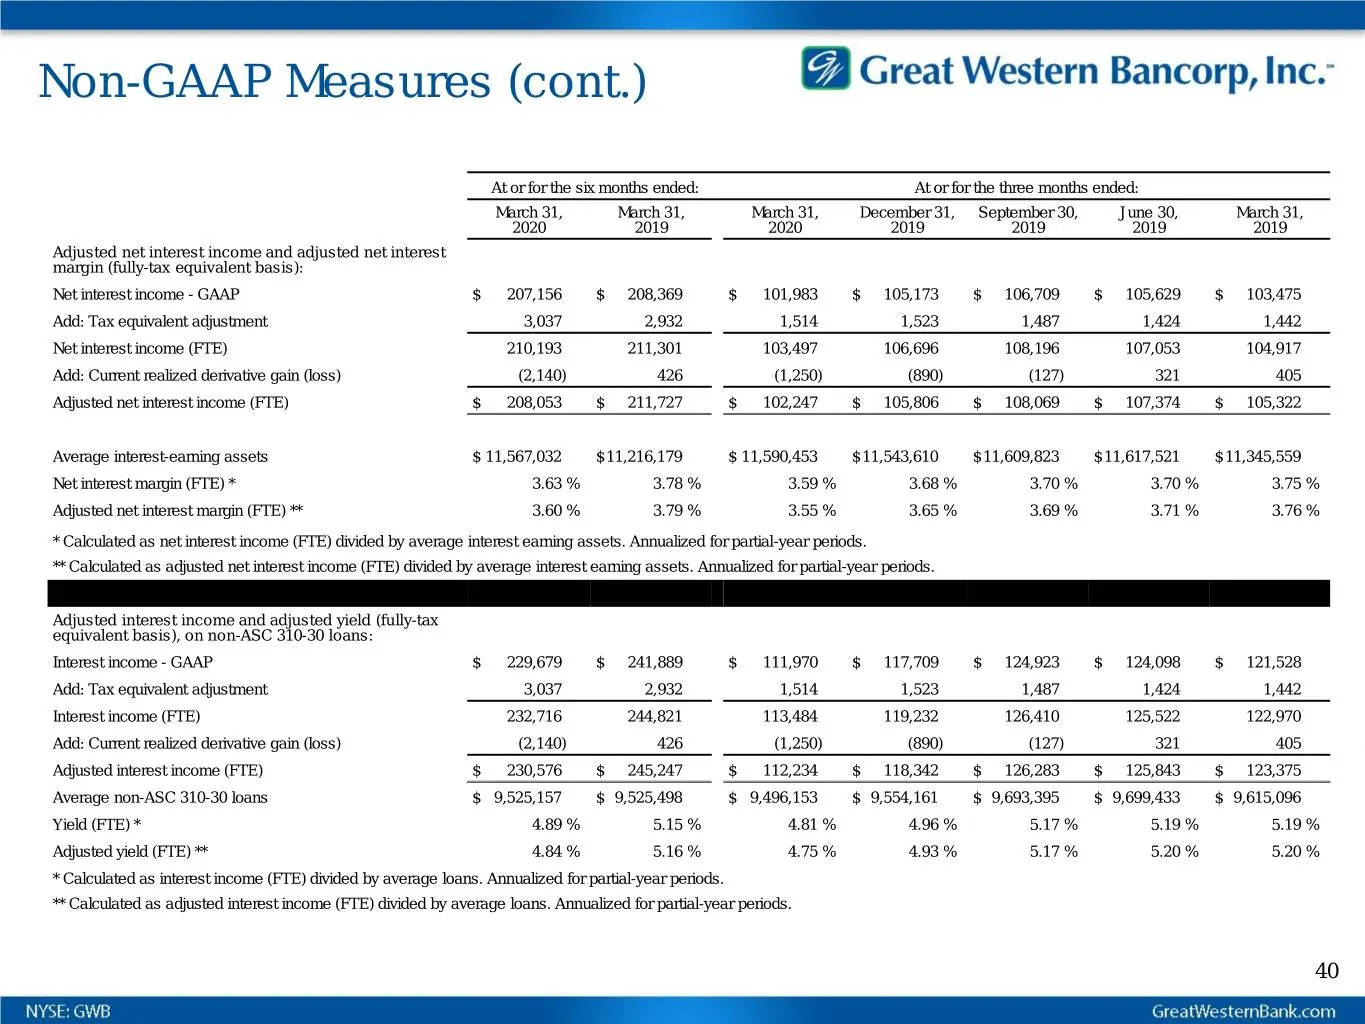
Slide 40: Non-GAAP Measures (cont.)
Non-GAAP Measures (cont.) At or for the six months ended: At or for the three months ended: March 31, March 31, March 31, December 31, September 30, June 30, March 31, 2020 2019 2020 2019 2019 2019 2019 Adjusted net interest income and adjusted net interest margin (fully-tax equivalent basis): Net i
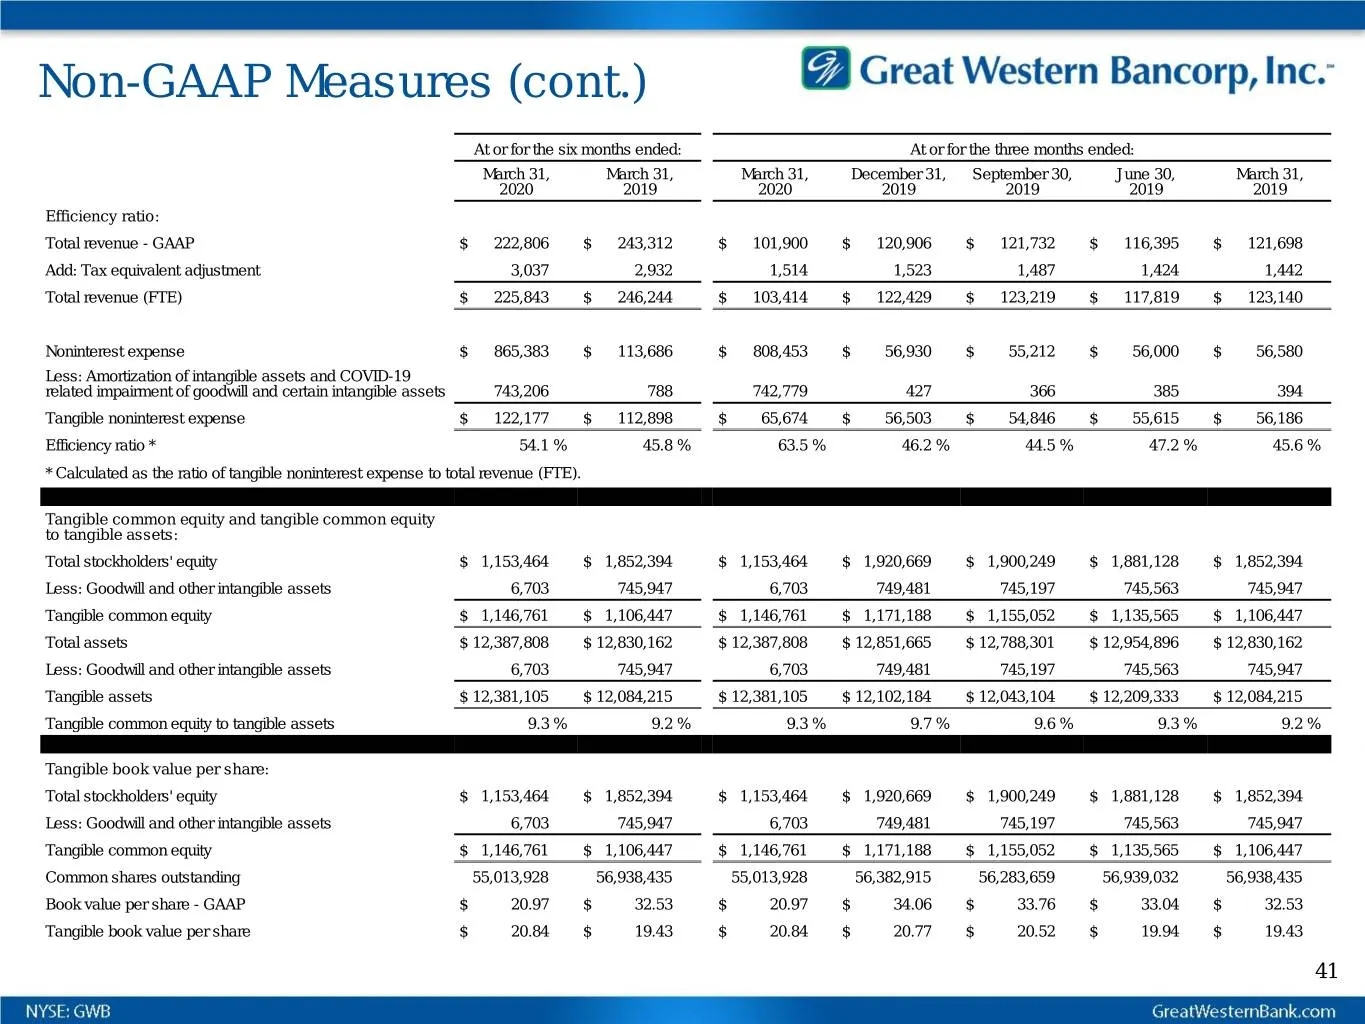
Slide 41: Non-GAAP Measures (cont.)
Non-GAAP Measures (cont.) At or for the six months ended: At or for the three months ended: March 31, March 31, March 31, December 31, September 30, June 30, March 31, 2020 2019 2020 2019 2019 2019 2019 Efficiency ratio: Total revenue - GAAP $ 222,806 $ 243,312 $ 101,900 $ 120,906 $ 121,732 $ 116,39
Source: SEC EDGAR · FWP filed Jun 1, 2020
More decks from Great Western Bancorp Inc
 Q1 FY2022 Earnings Presentation27 slides · Jan 27, 2022
 Merger or Acquisition (October 2021)55 slides · Oct 29, 2021
 Q4 2021 Earnings Presentation28 slides · Oct 26, 2021
 Merger or Acquisition (September 2021)14 slides · Sep 21, 2021
 Merger or Acquisition (September 2021)28 slides · Sep 16, 2021
 Q3 FY2021 Earnings Presentation32 slides · Jul 29, 2021