RFA Financial Inc. · TSX:RFA
RFA Financial — Artis Real Estate Investment Trust — Q2 2012 Earnings Presentation
18 slides from RFA Financial's earnings presentation, September 2012
Slide 1: Properties of Success - Q2-12 Investor Presentation
PROPERTIES OF SUCCESS Q2-12 INVESTOR PRESENTATION
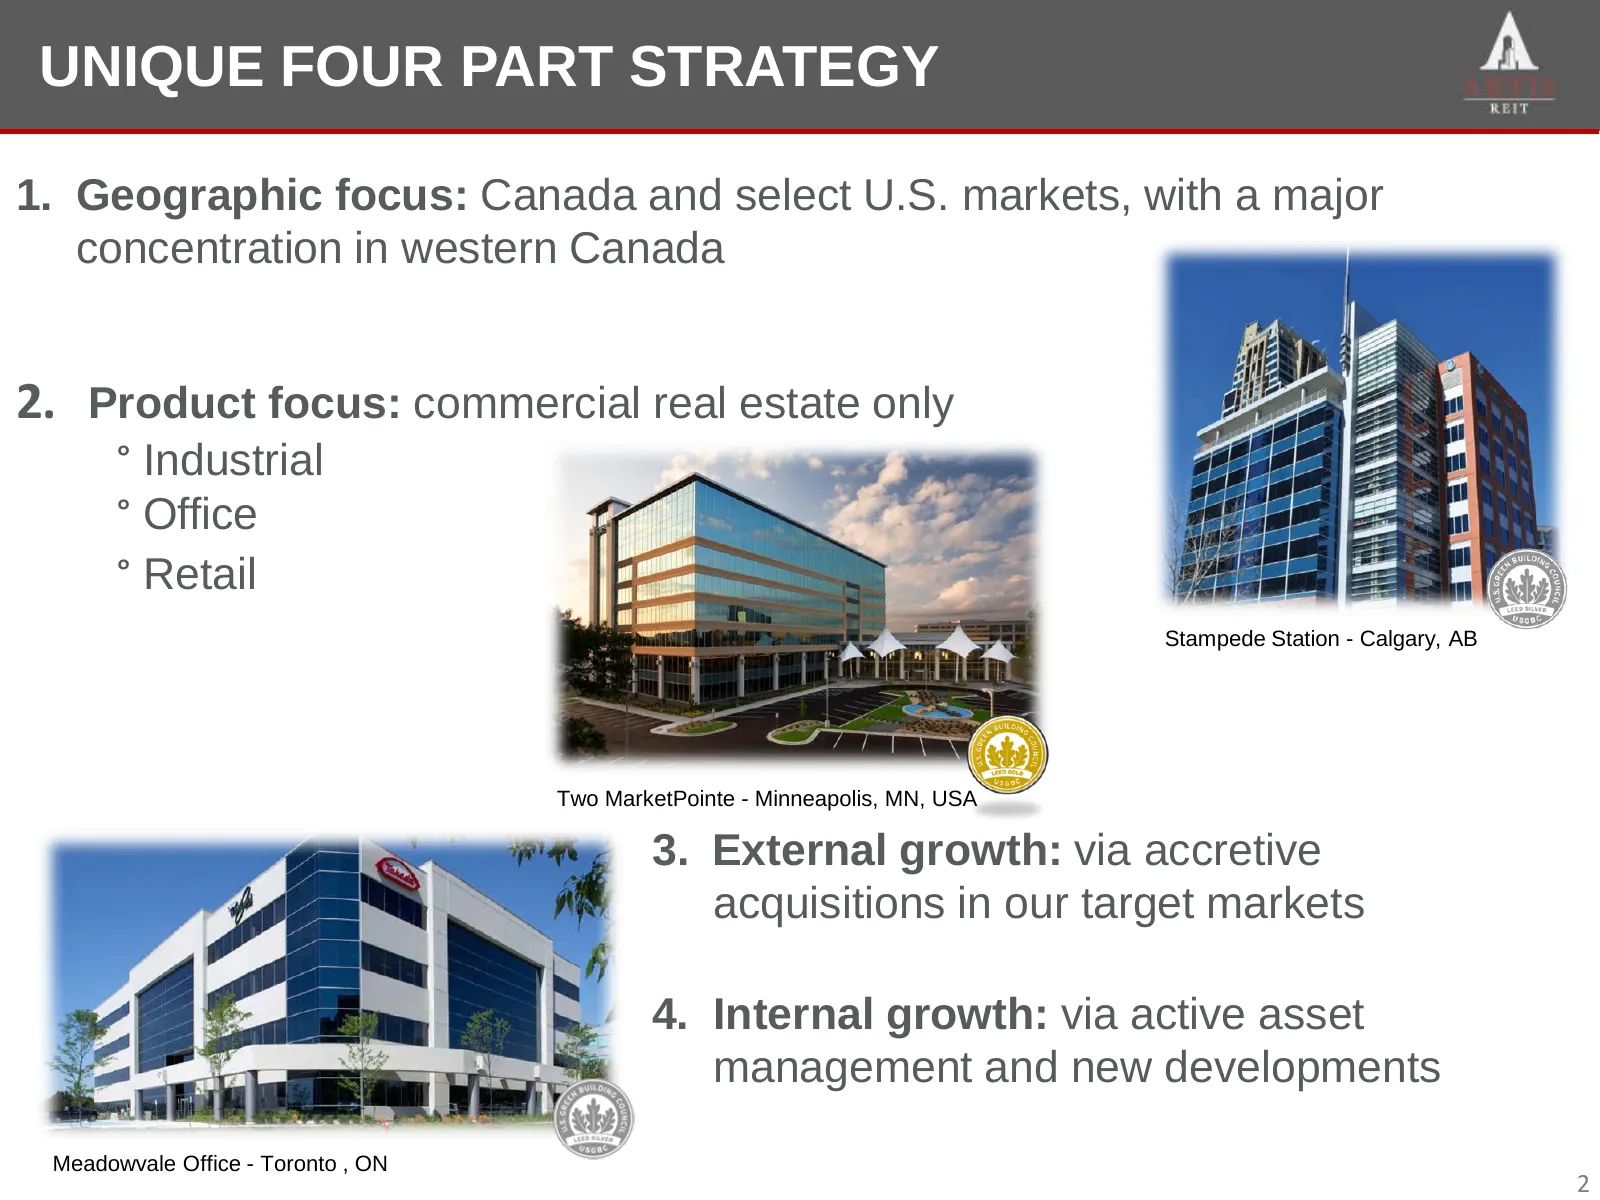
Slide 2: Unique Four Part Strategy
UNIQUEFOUR UNIQUE FOURPART PARTSTRATEGY STRATEGY 1. Geographic focus: Canada and select U.S. markets, with a major concentration in western Canada 2. Product focus: commercial real estate only ° Industrial ° Office ° Retail Stampede Station - Calgary, AB Two MarketPointe - Minneapolis, MN, USA 3. Ex
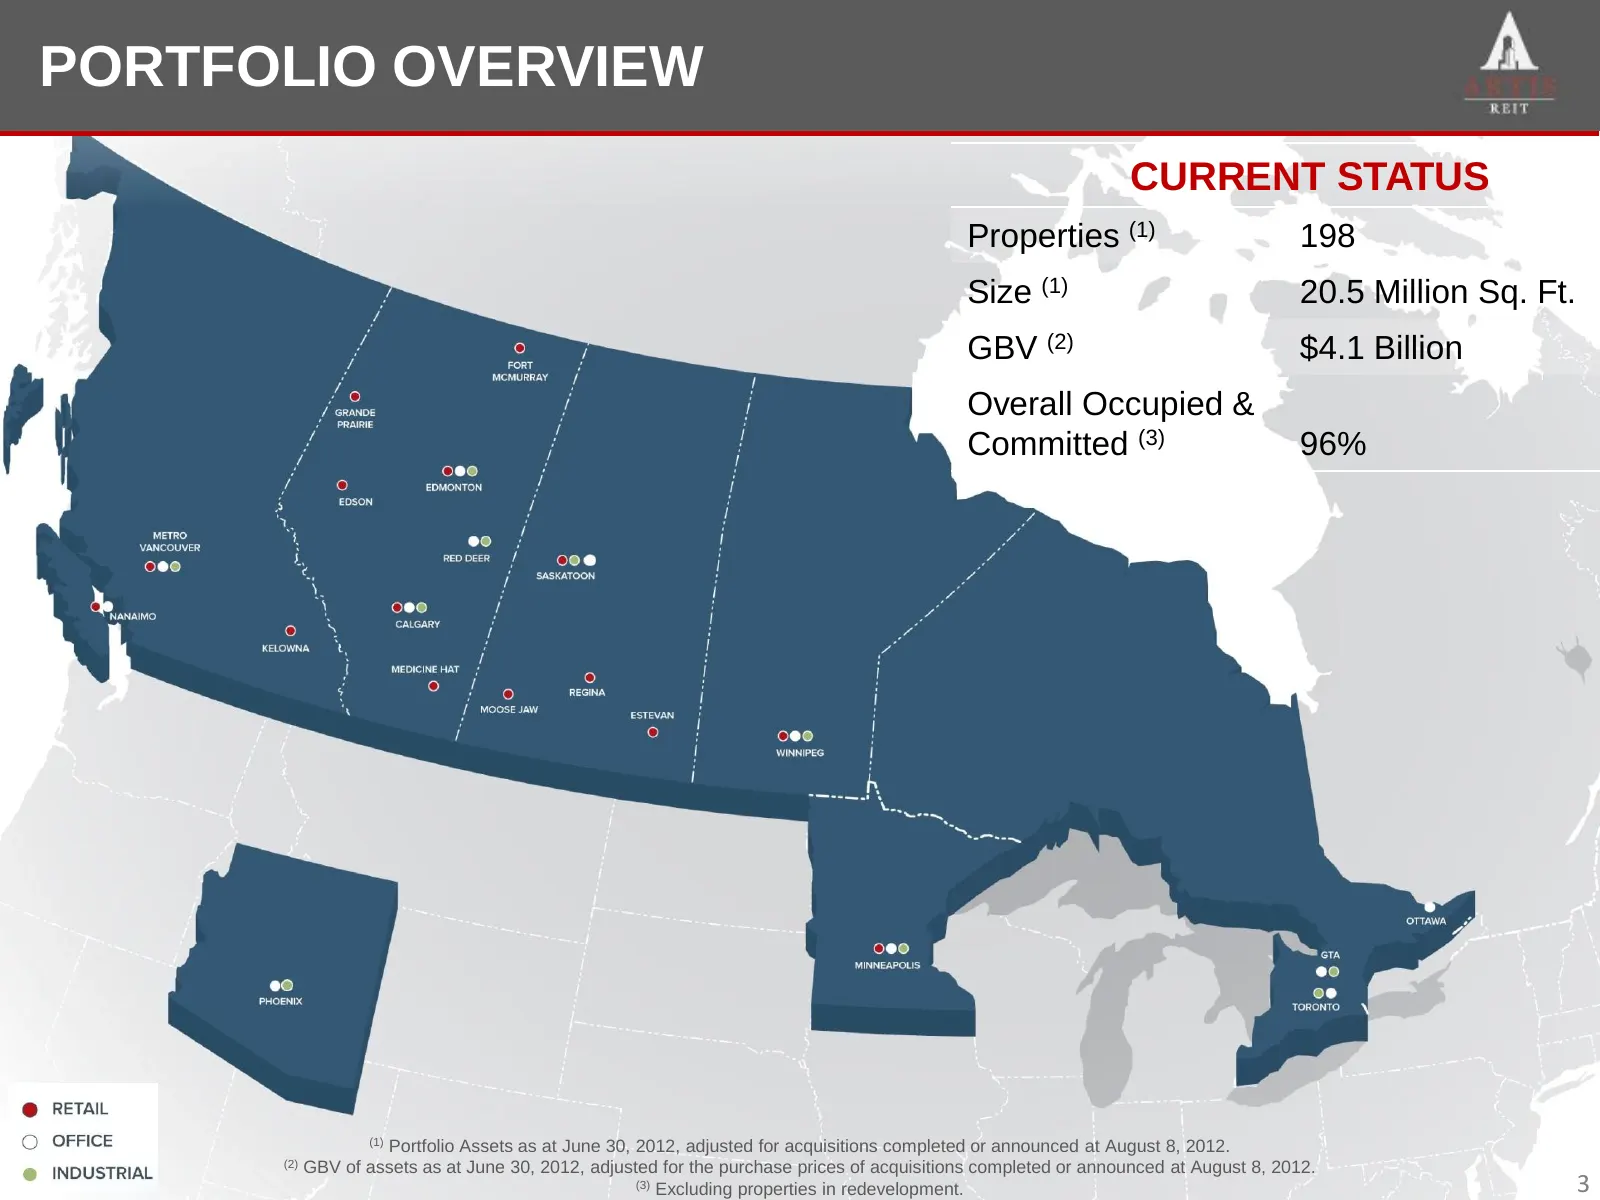
Slide 3: Portfolio Overview
PORTFOLIOOVERVIEW PORTFOLIO OVERVIEW CURRENT STATUS Properties (1) 198 Size (1) 20.5 Million Sq. Ft. GBV (2) $4.1 Billion Overall Occupied & Committed (3) 96% (1) Portfolio Assets as at June 30, 2012, adjusted for acquisitions completed or announced at August 8, 2012. (2) GBV of assets as at June 30
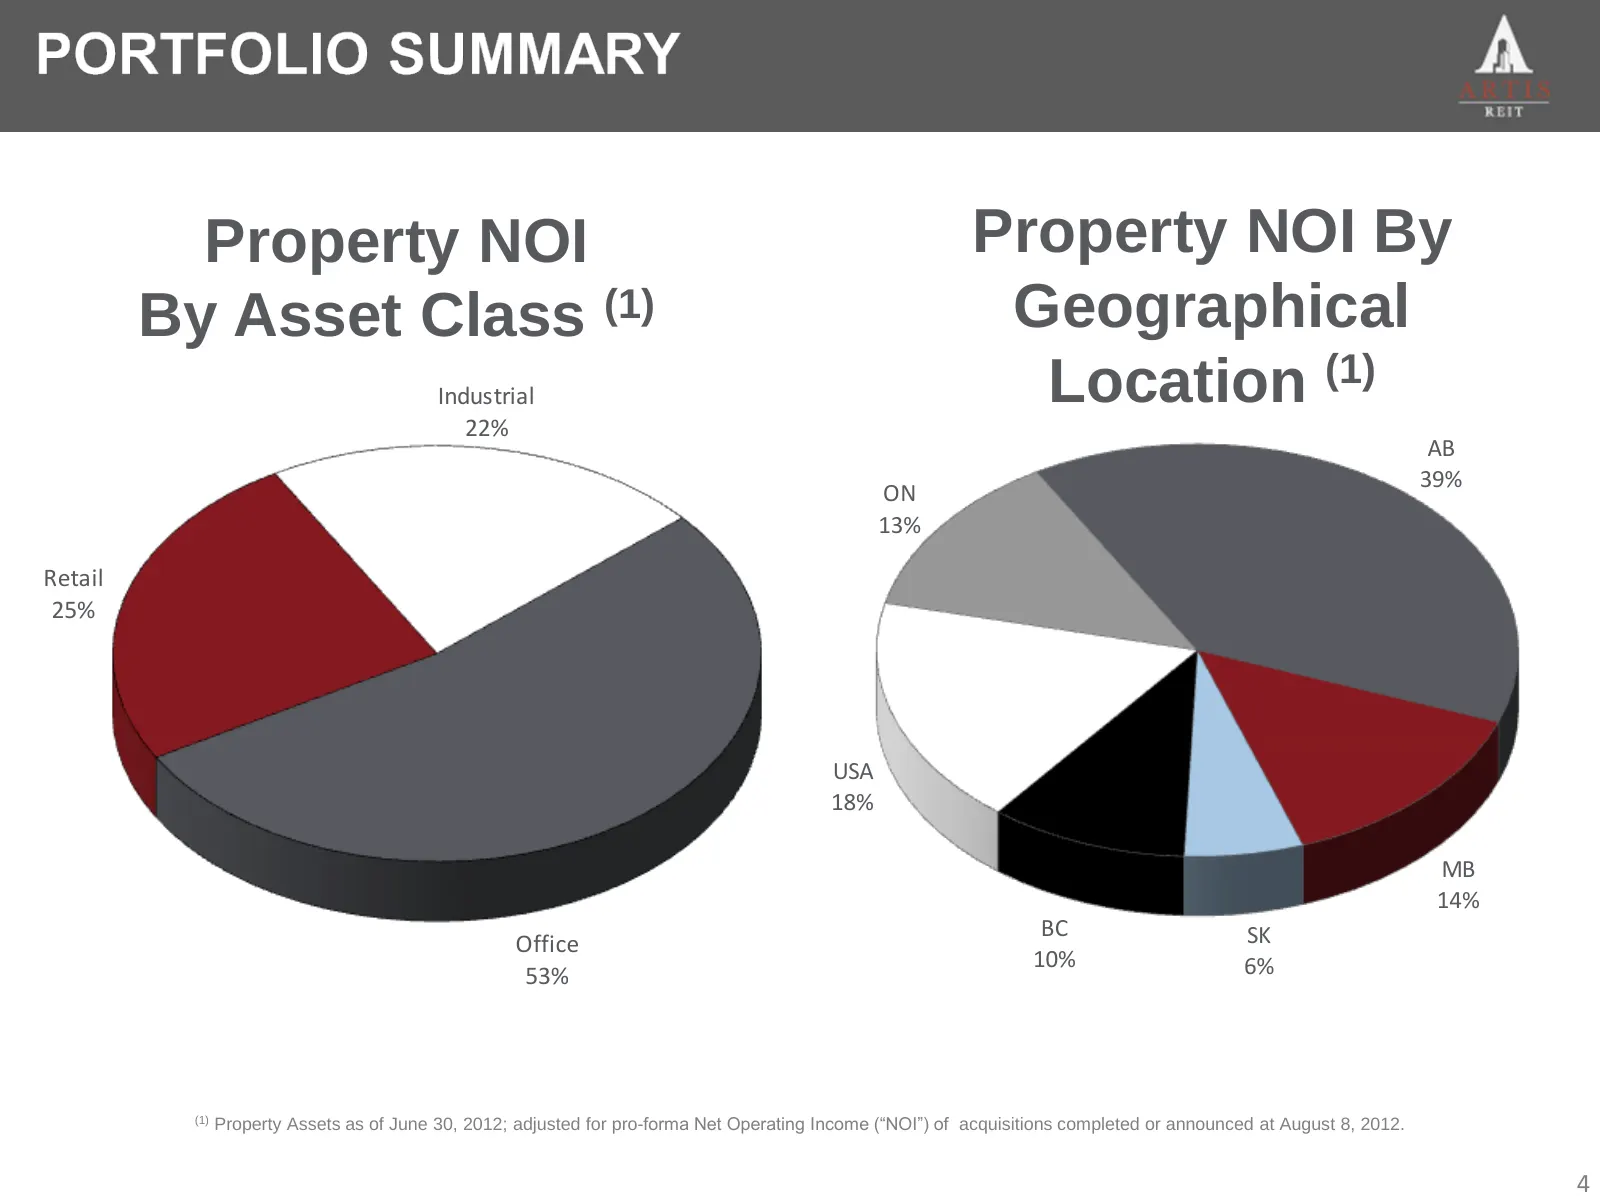
Slide 4: Portfolio Summary: Property NOI by Asset Class and Geography
PORTFOLIO SUMMARY Property NOI Property NOI By By Asset Class (1) Geographical Industrial Location (1) 22% AB 39% ON 13% Retail 25% USA 18% MB 14% BC SK Office 10% 6% 53% (1) Property Assets as of June 30, 2012; adjusted for pro-forma Net Operating Income (“NOI”) of acquisitions completed or announc
Slide 5: Diversification by Tenant GLA
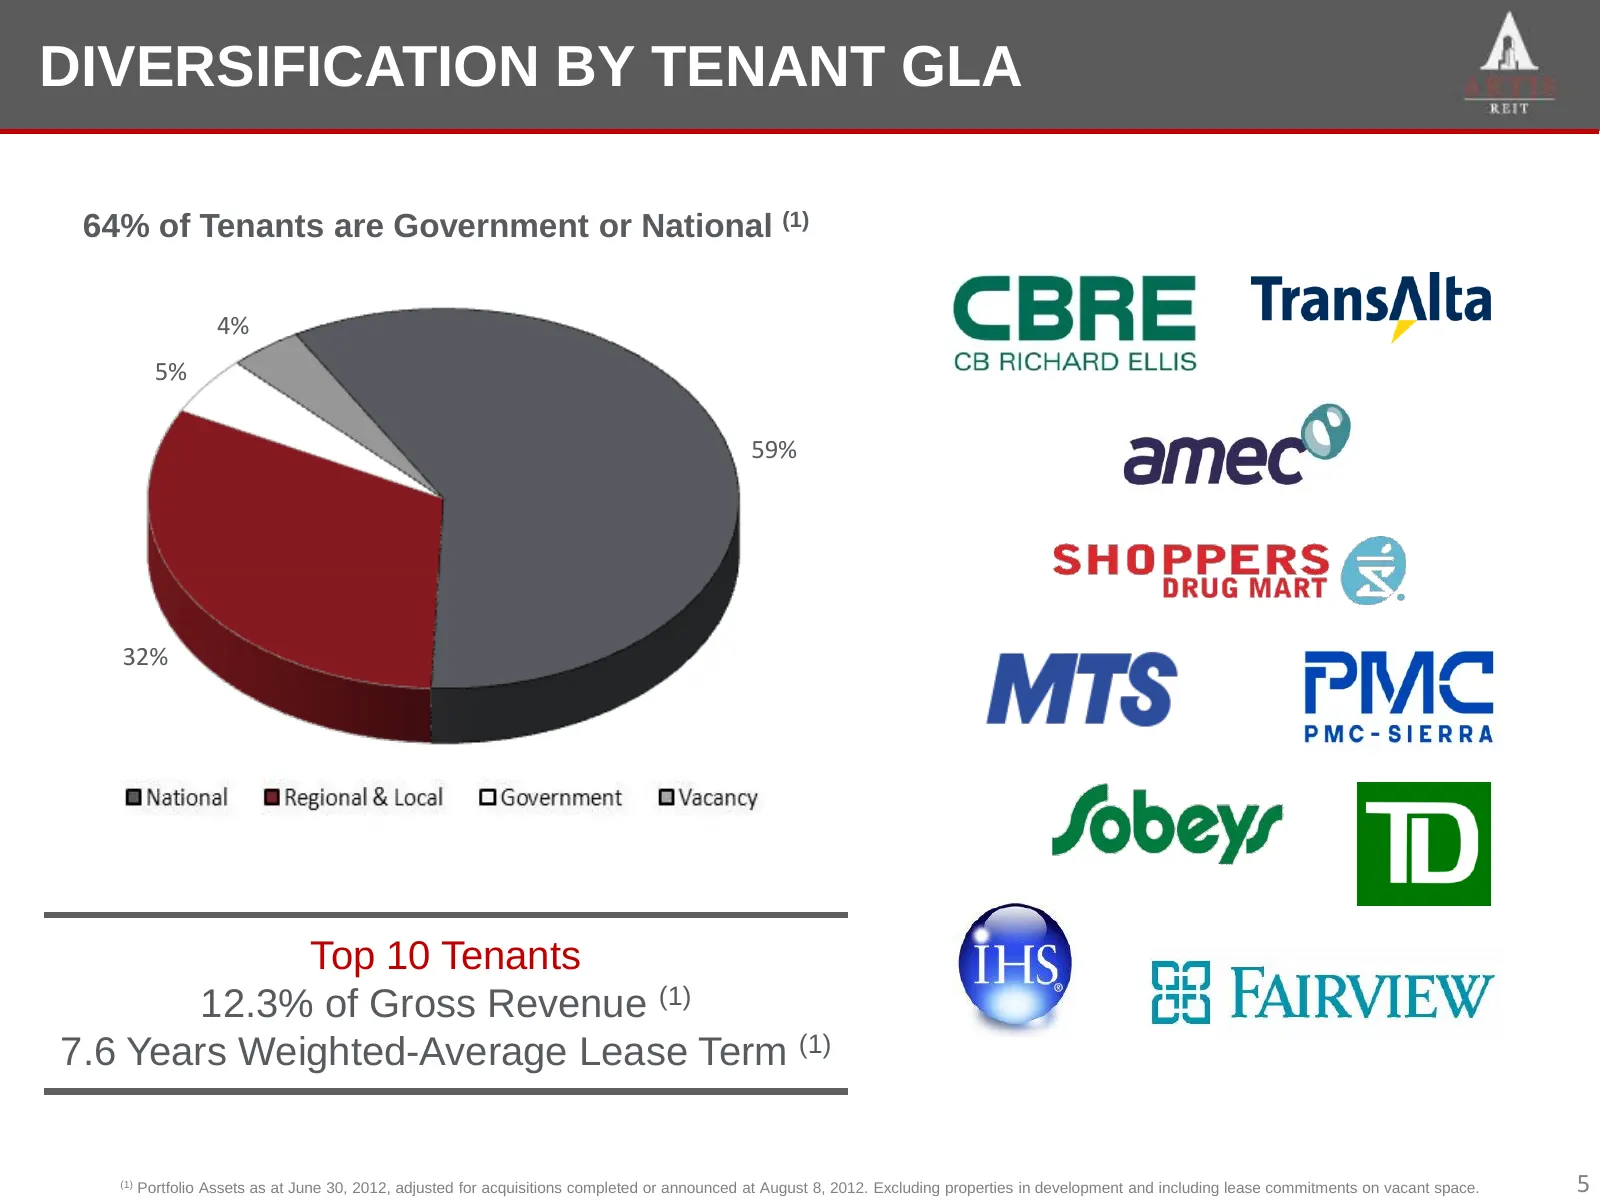
DIVERSIFICATIONBY DIVERSIFICATION BYTENANT TENANTGLA GLA 64% of Tenants are Government or National (1) 4% 5% 59% 32% Top 10 Tenants 12.3% of Gross Revenue (1) 7.6 Years Weighted-Average Lease Term (1) (1) Portfolio Assets as at June 30, 2012, adjusted for acquisitions completed or announced at Augus
Slide 6: Lease Expiration Schedule
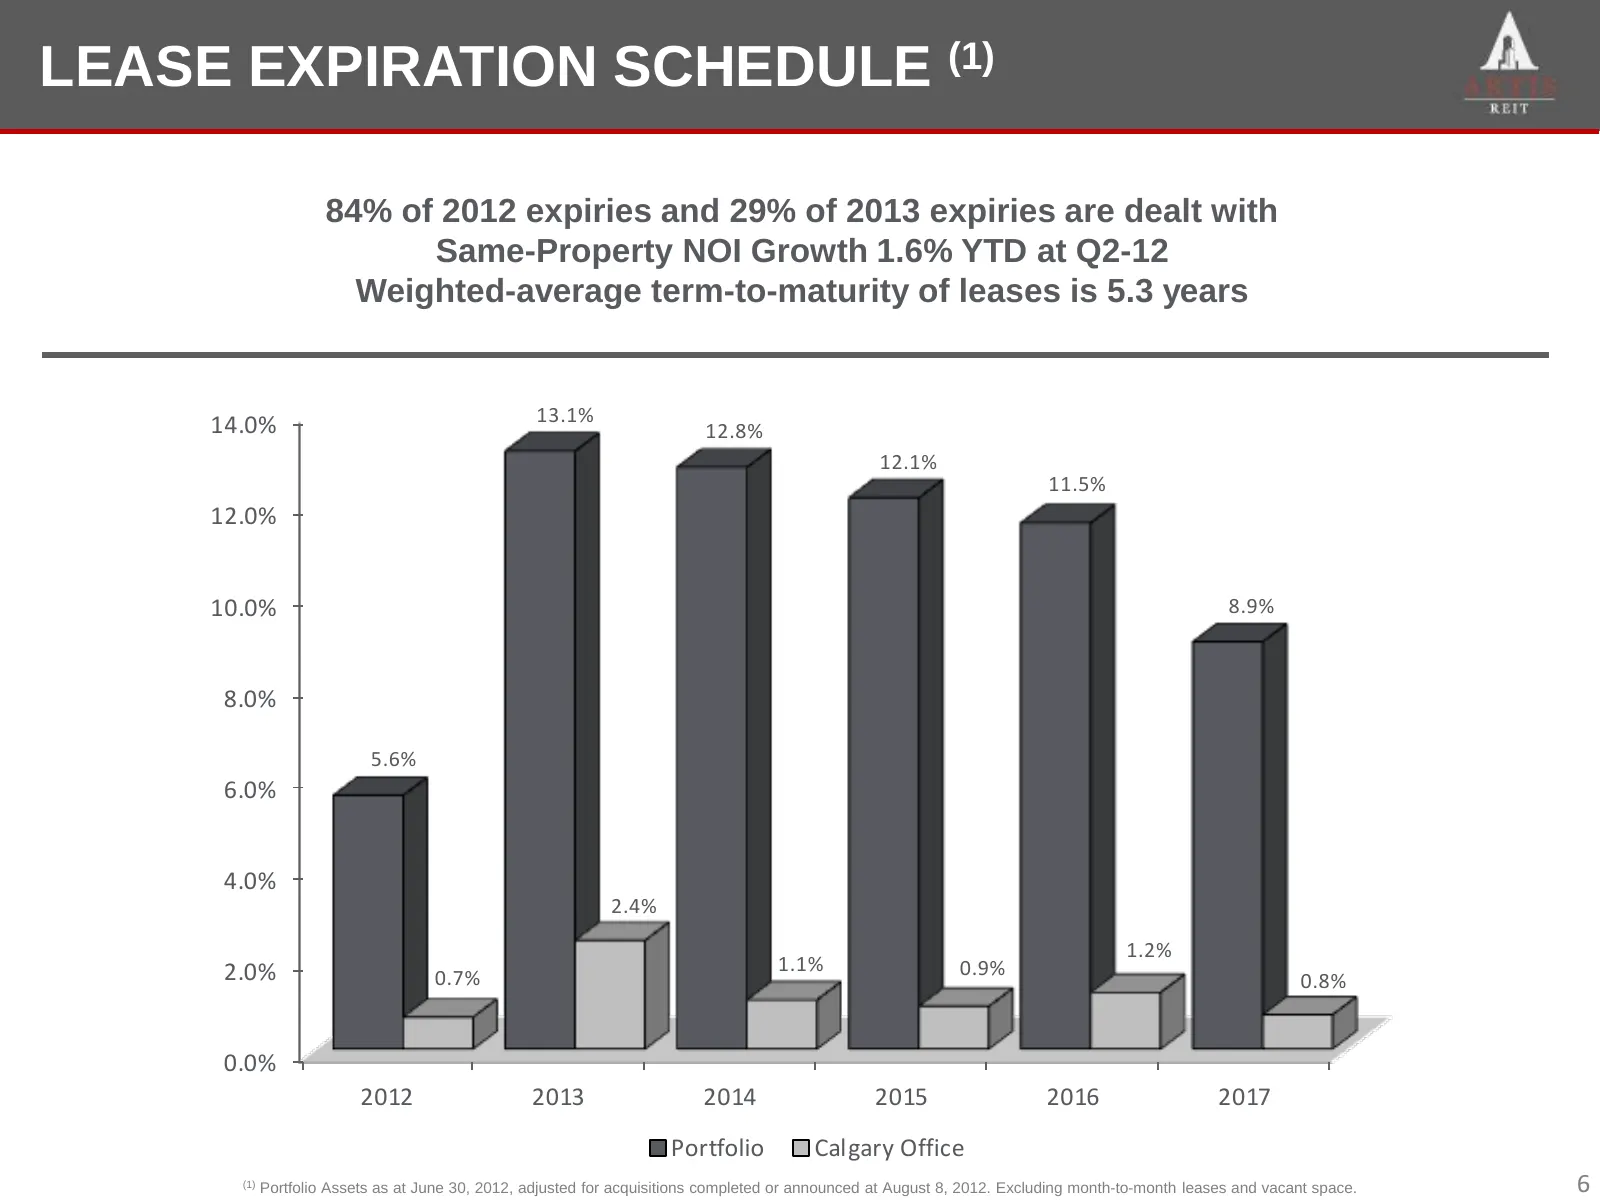
LEASEEXPIRATION LEASE SCHEDULE(1)(1) EXPIRATIONSCHEDULE 84% of 2012 expiries and 29% of 2013 expiries are dealt with Same-Property NOI Growth 1.6% YTD at Q2-12 Weighted-average term-to-maturity of leases is 5.3 years 13.1% 14.0% 12.8% 12.1% 11.5% 12.0% 10.0% 8.9% 8.0% 5.6% 6.0% 4.0% 2.4% 1.2% 2.0% 1
Slide 7: Schedule of Mortgages Maturing
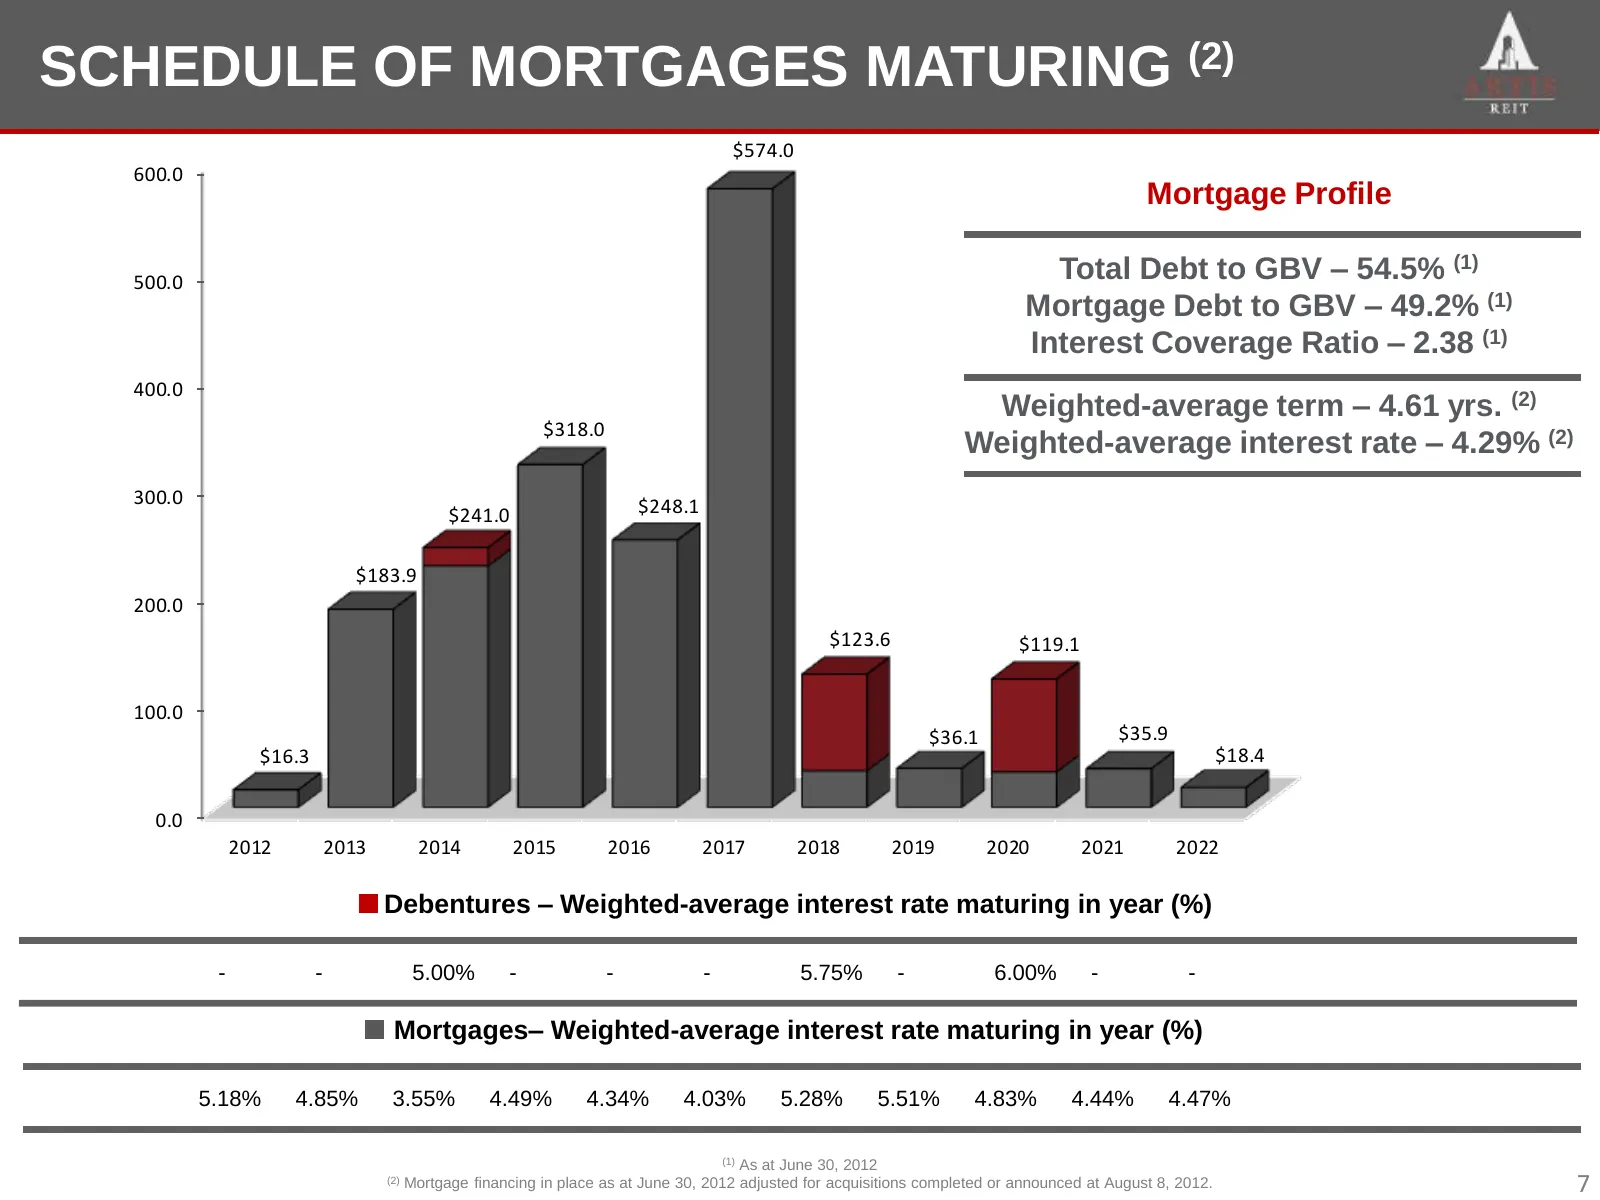
SCHEDULEOF SCHEDULE OFMORTGAGES MATURING(2)(2) MORTGAGESMATURING $574.0 600.0 Mortgage Profile 500.0 Total Debt to GBV – 54.5% (1) Mortgage Debt to GBV – 49.2% (1) Interest Coverage Ratio – 2.38 (1) 400.0 Weighted-average term – 4.61 yrs. (2) $318.0 Weighted-average interest rate – 4.29% (2) 300.0 $
Slide 8: Q2-12 Selected Financial Information
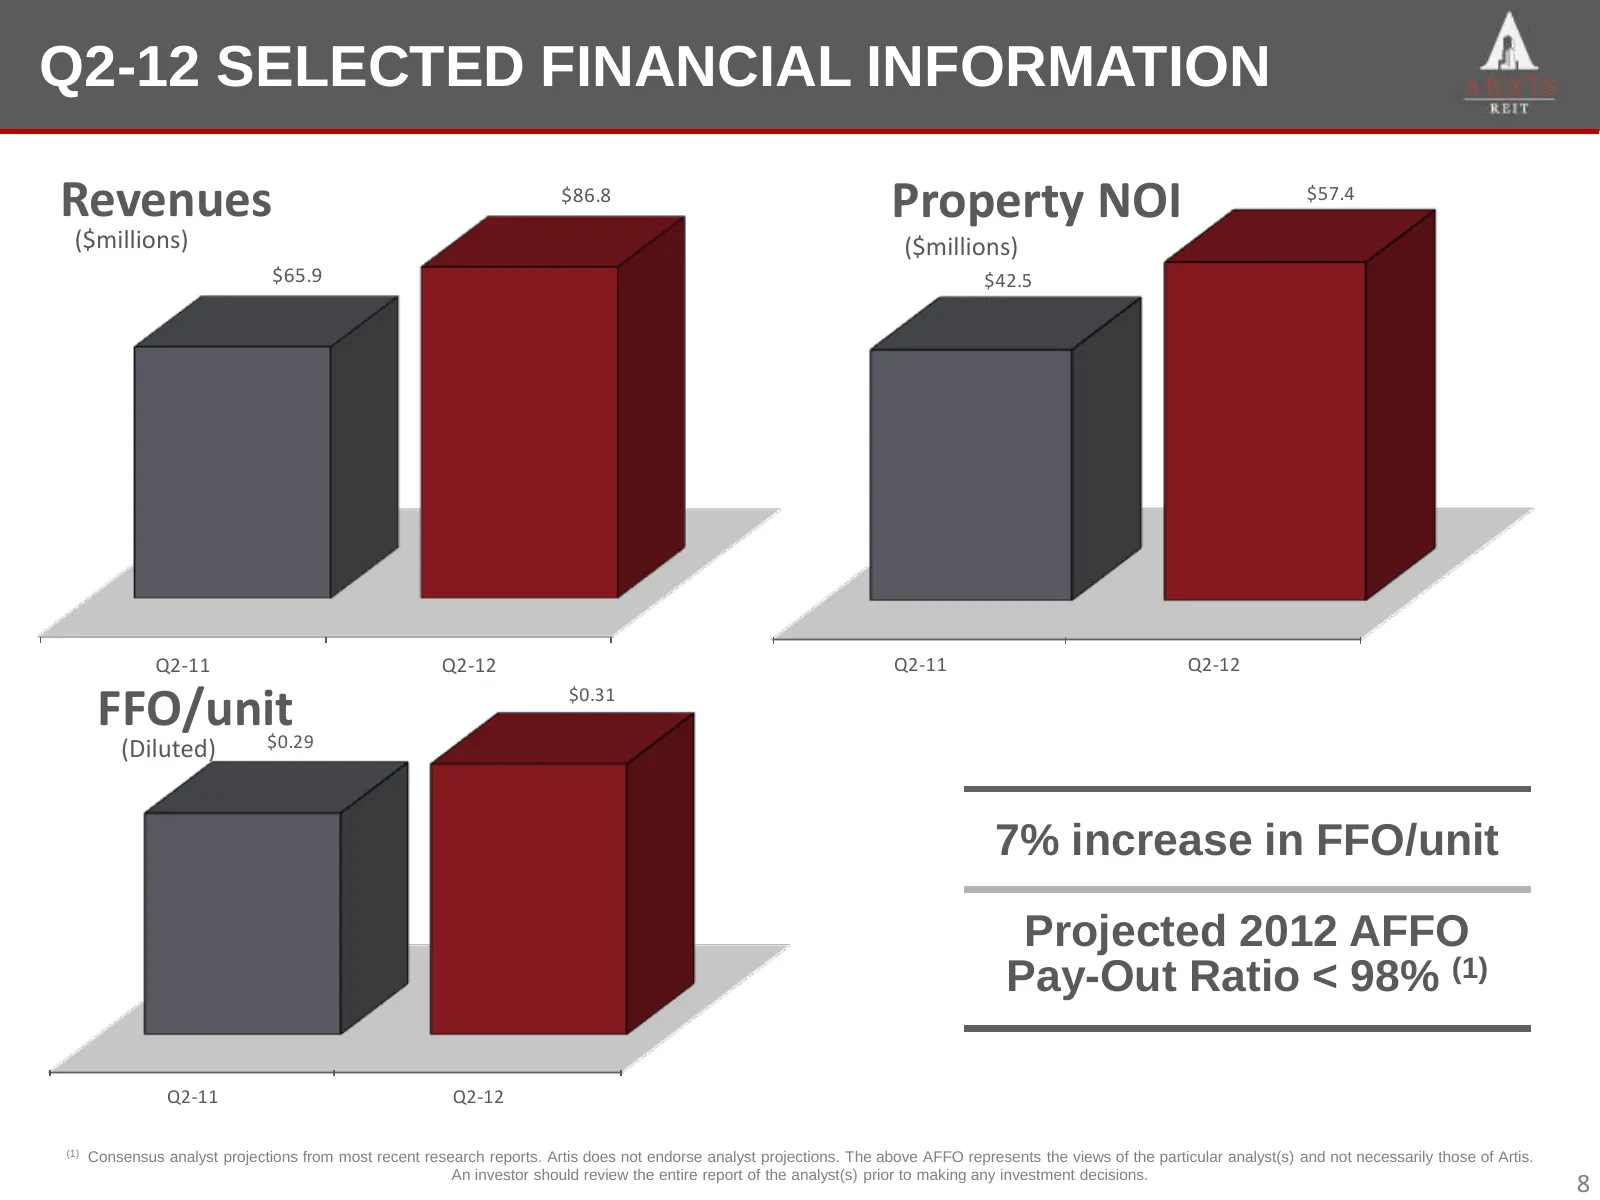
Q2-12 2012 SELECTED FINANCIAL YEAR-TO-DATE INFORMATION INFORMATION Q2-12 Revenues $86.8 Property NOI $57.4 ($millions) ($millions) $65.9 $42.5 Q2-11 Q2-12 Q2-11 Q2-12 FFO/unit $0.29 $0.31 (Diluted) 7% increase in FFO/unit Projected 2012 AFFO Pay-Out Ratio < 98% (1) Q2-11 Q2-12 (1) Consensus analyst
Slide 9: Internal Growth Strategy
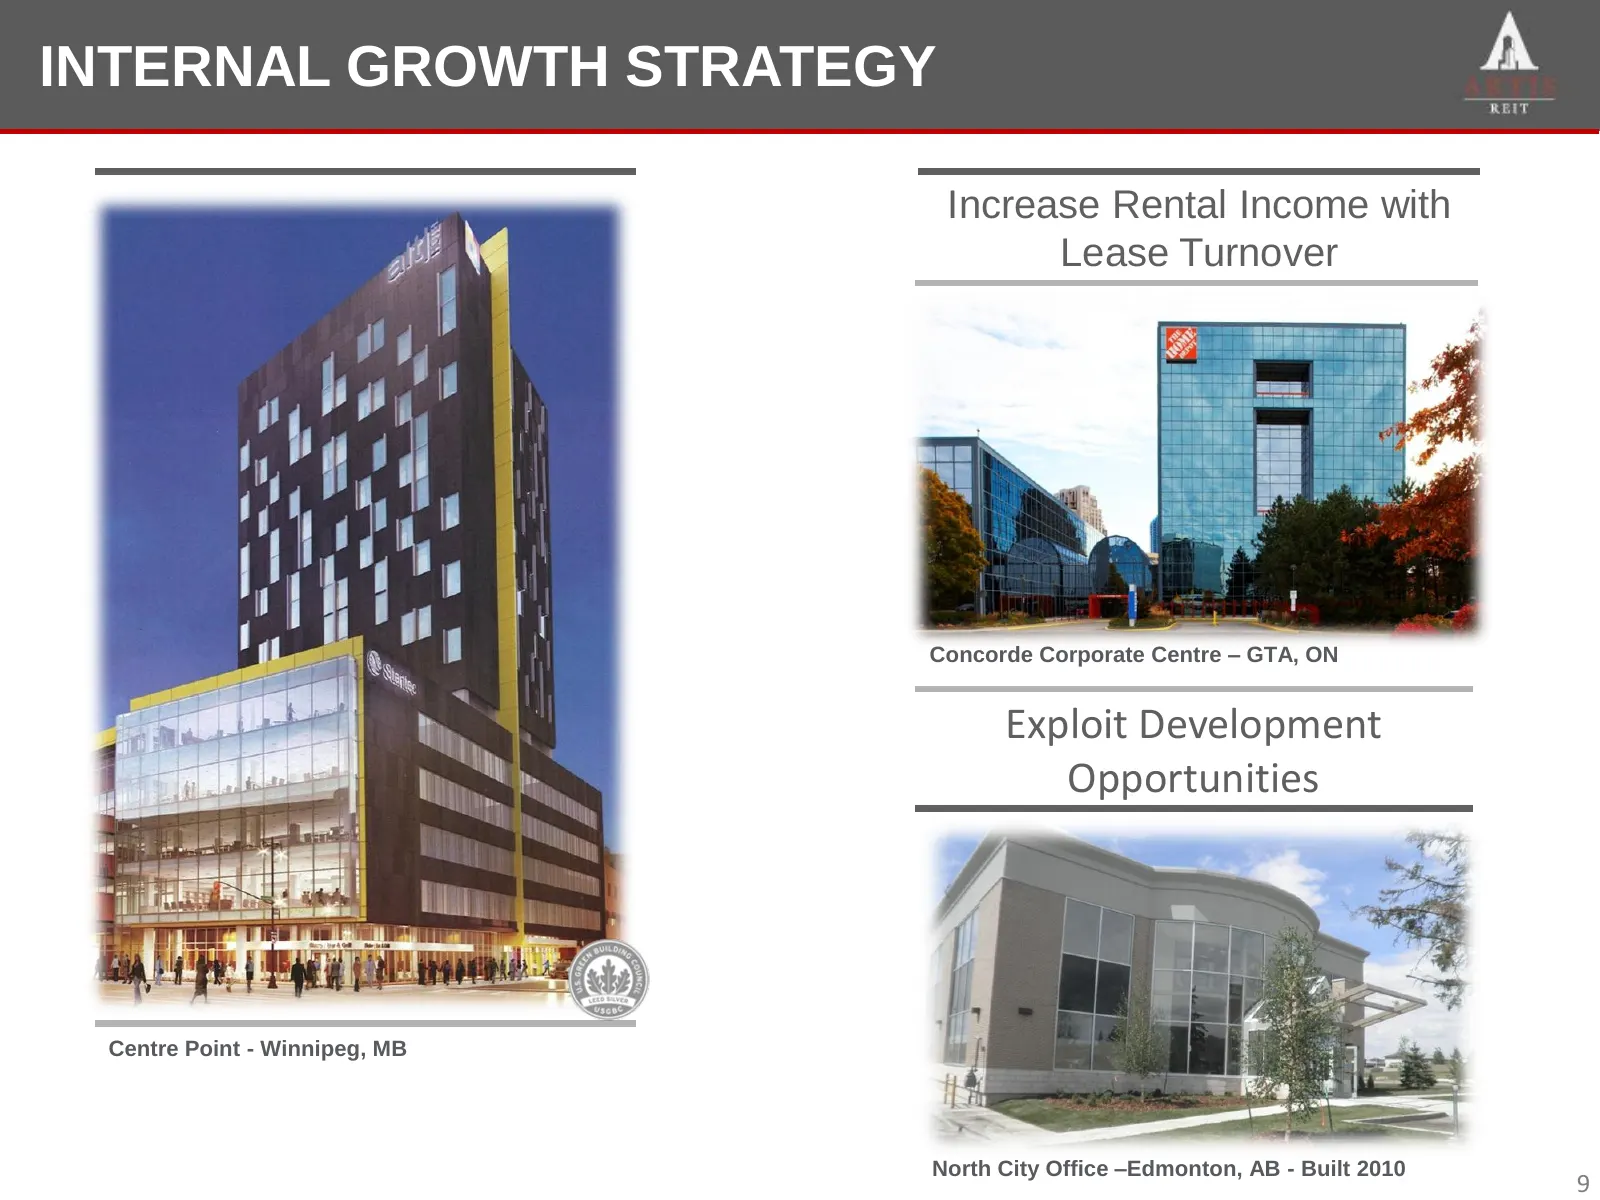
INTERNALGROWTH INTERNAL GROWTHSTRATEGY STRATEGY Increase Rental Income with Lease Turnover Home Depot - Minneapolis, MN, USA Concorde Corporate Centre – GTA, ON Exploit Development Opportunities Centre Point - Winnipeg, MB North City Office –Edmonton, AB - Built 2010 9
Slide 10: External Growth Strategy
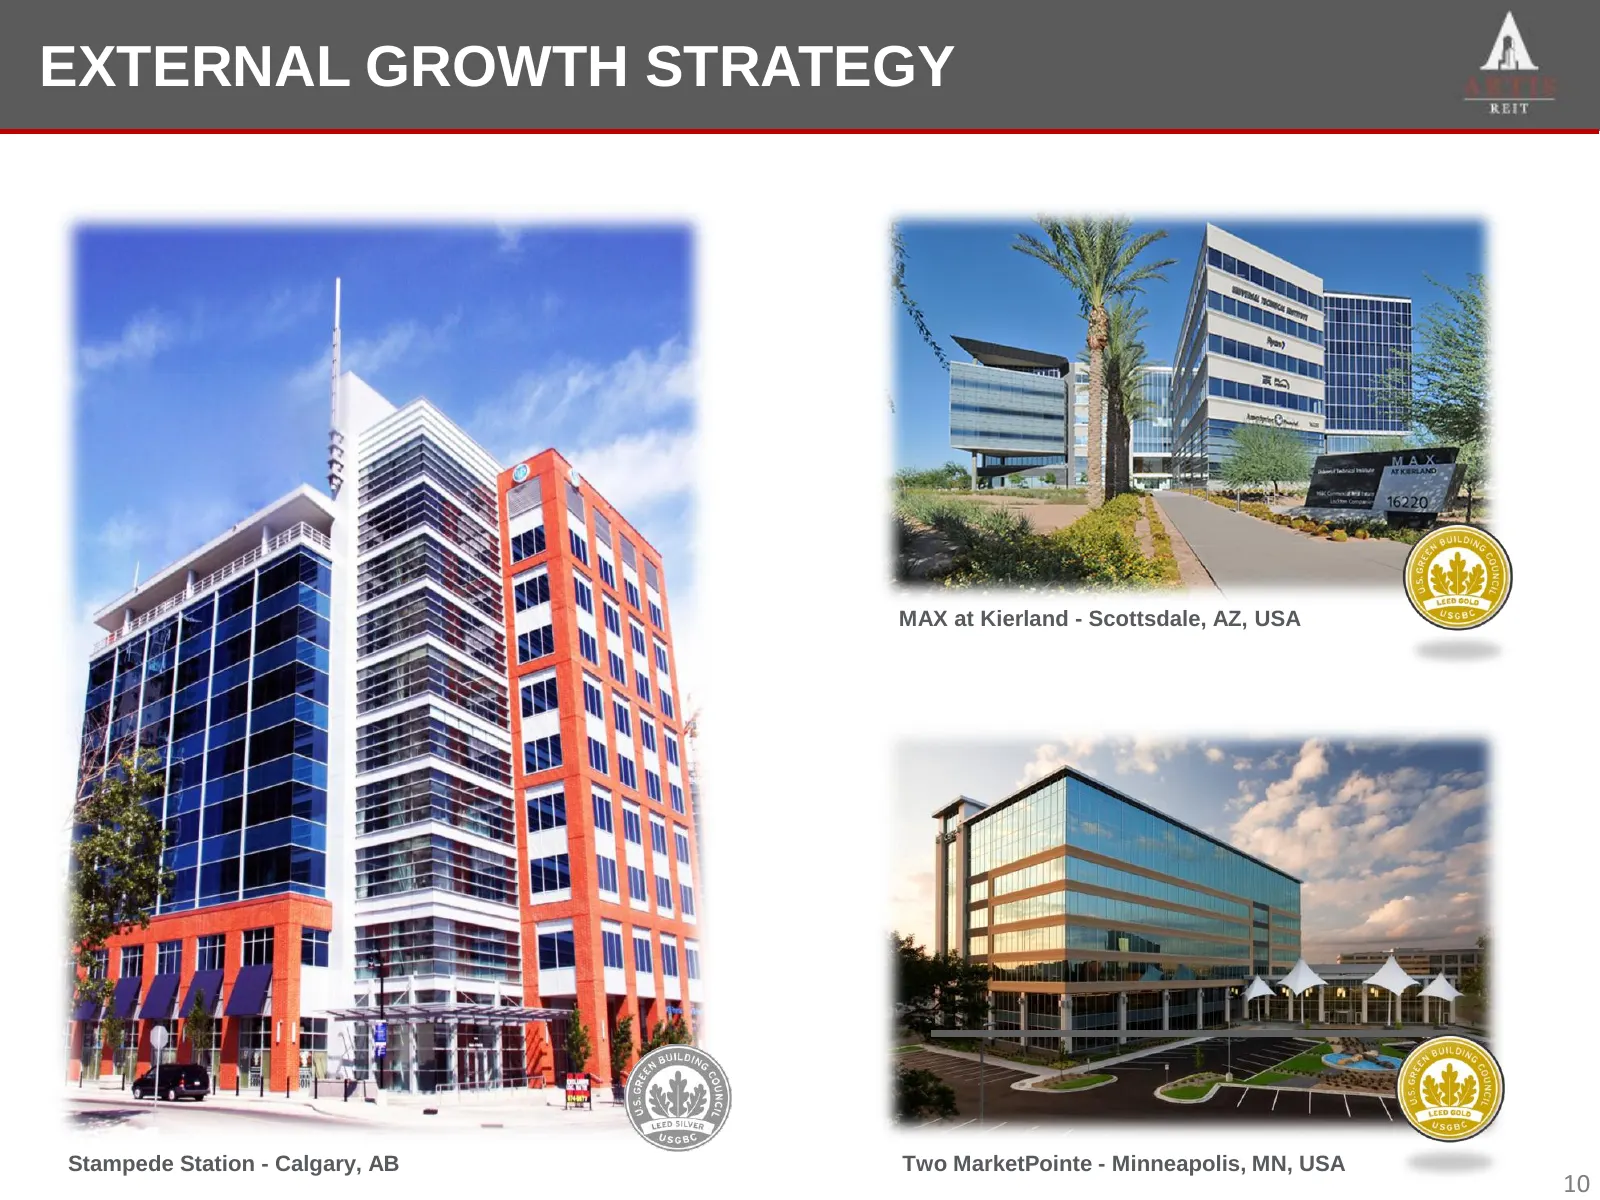
EXTERNALGROWTH EXTERNAL GROWTHSTRATEGY STRATEGY MAX at Kierland - Scottsdale, AZ, USA Stampede Station - Calgary, AB Two MarketPointe - Minneapolis, MN, USA 10
Slide 11: External Growth Strategy: Ontario and Minneapolis Acquisitions
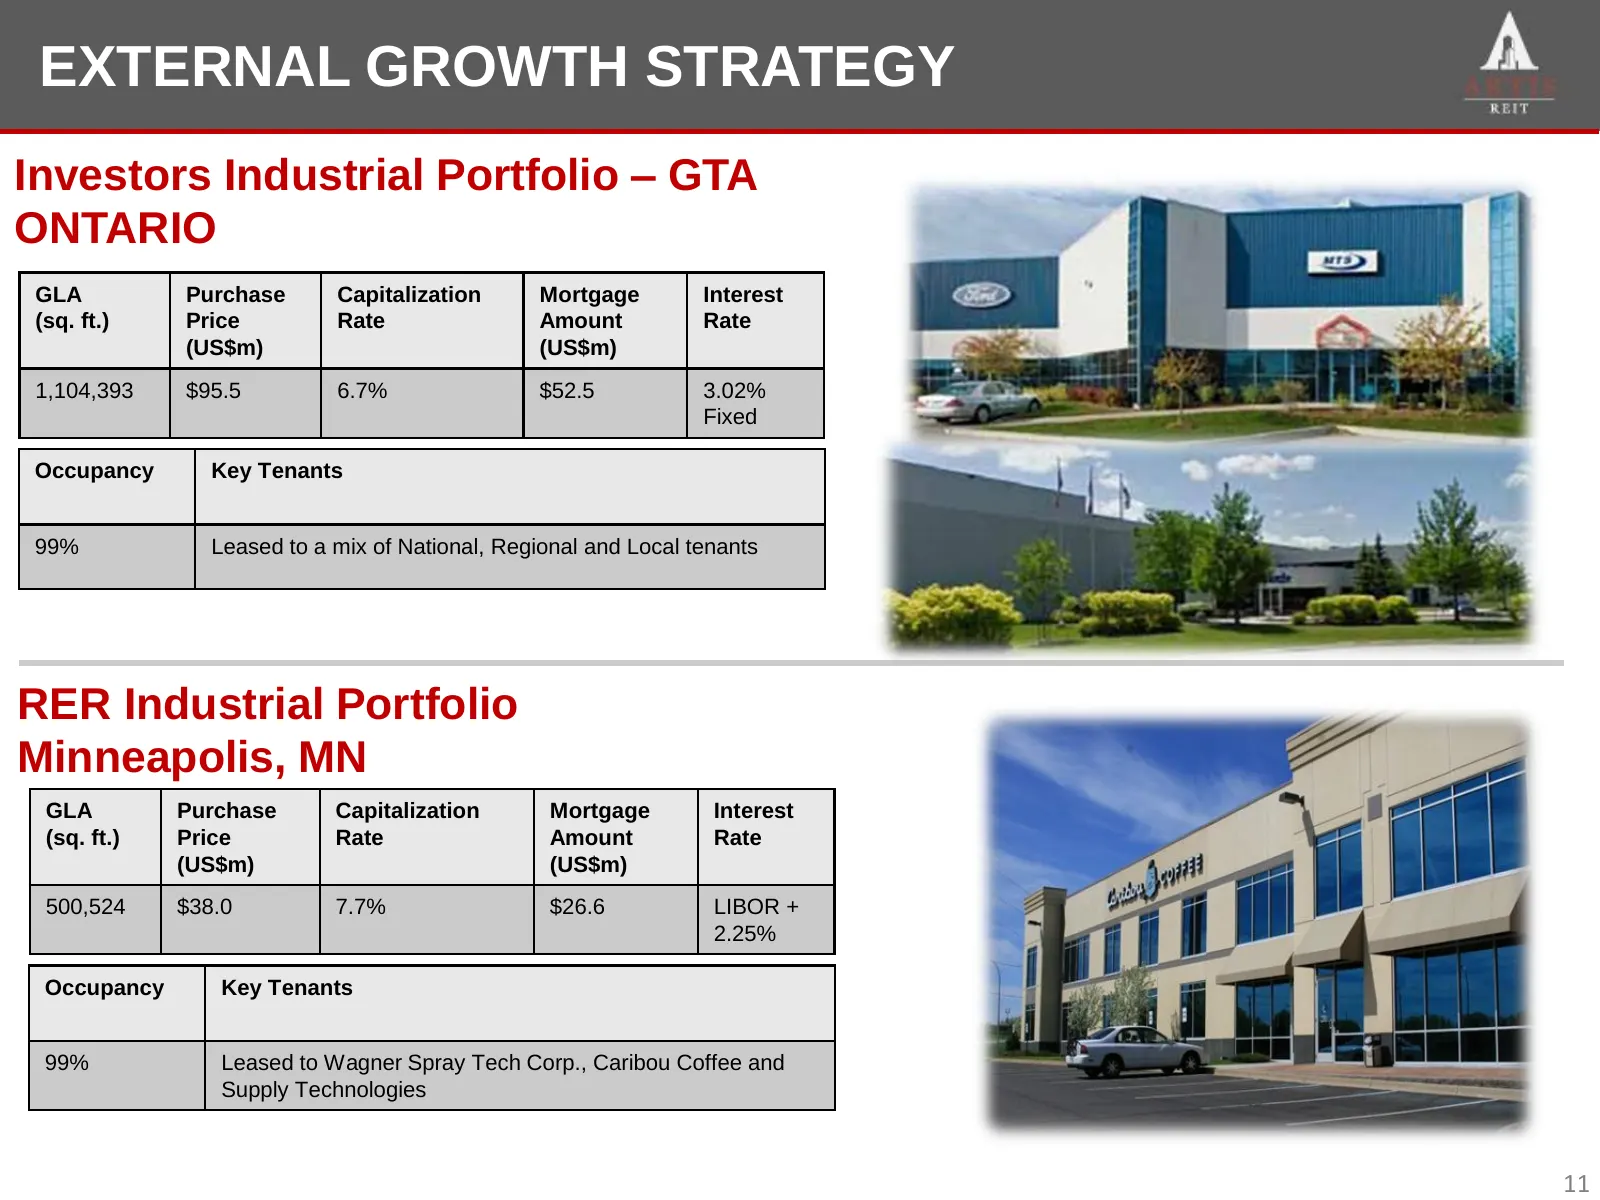
EXTERNALGROWTH EXTERNAL GROWTHSTRATEGY STRATEGY Investors Industrial Portfolio – GTA ONTARIO GLA Purchase Capitalization Mortgage Interest (sq. ft.) Price Rate Amount Rate (US$m) (US$m) 1,104,393 $95.5 6.7% $52.5 3.02% Fixed Occupancy Key Tenants 99% Leased to a mix of National, Regional and Local t
Slide 12: External Growth Strategy: Kelowna and Saskatoon Acquisitions
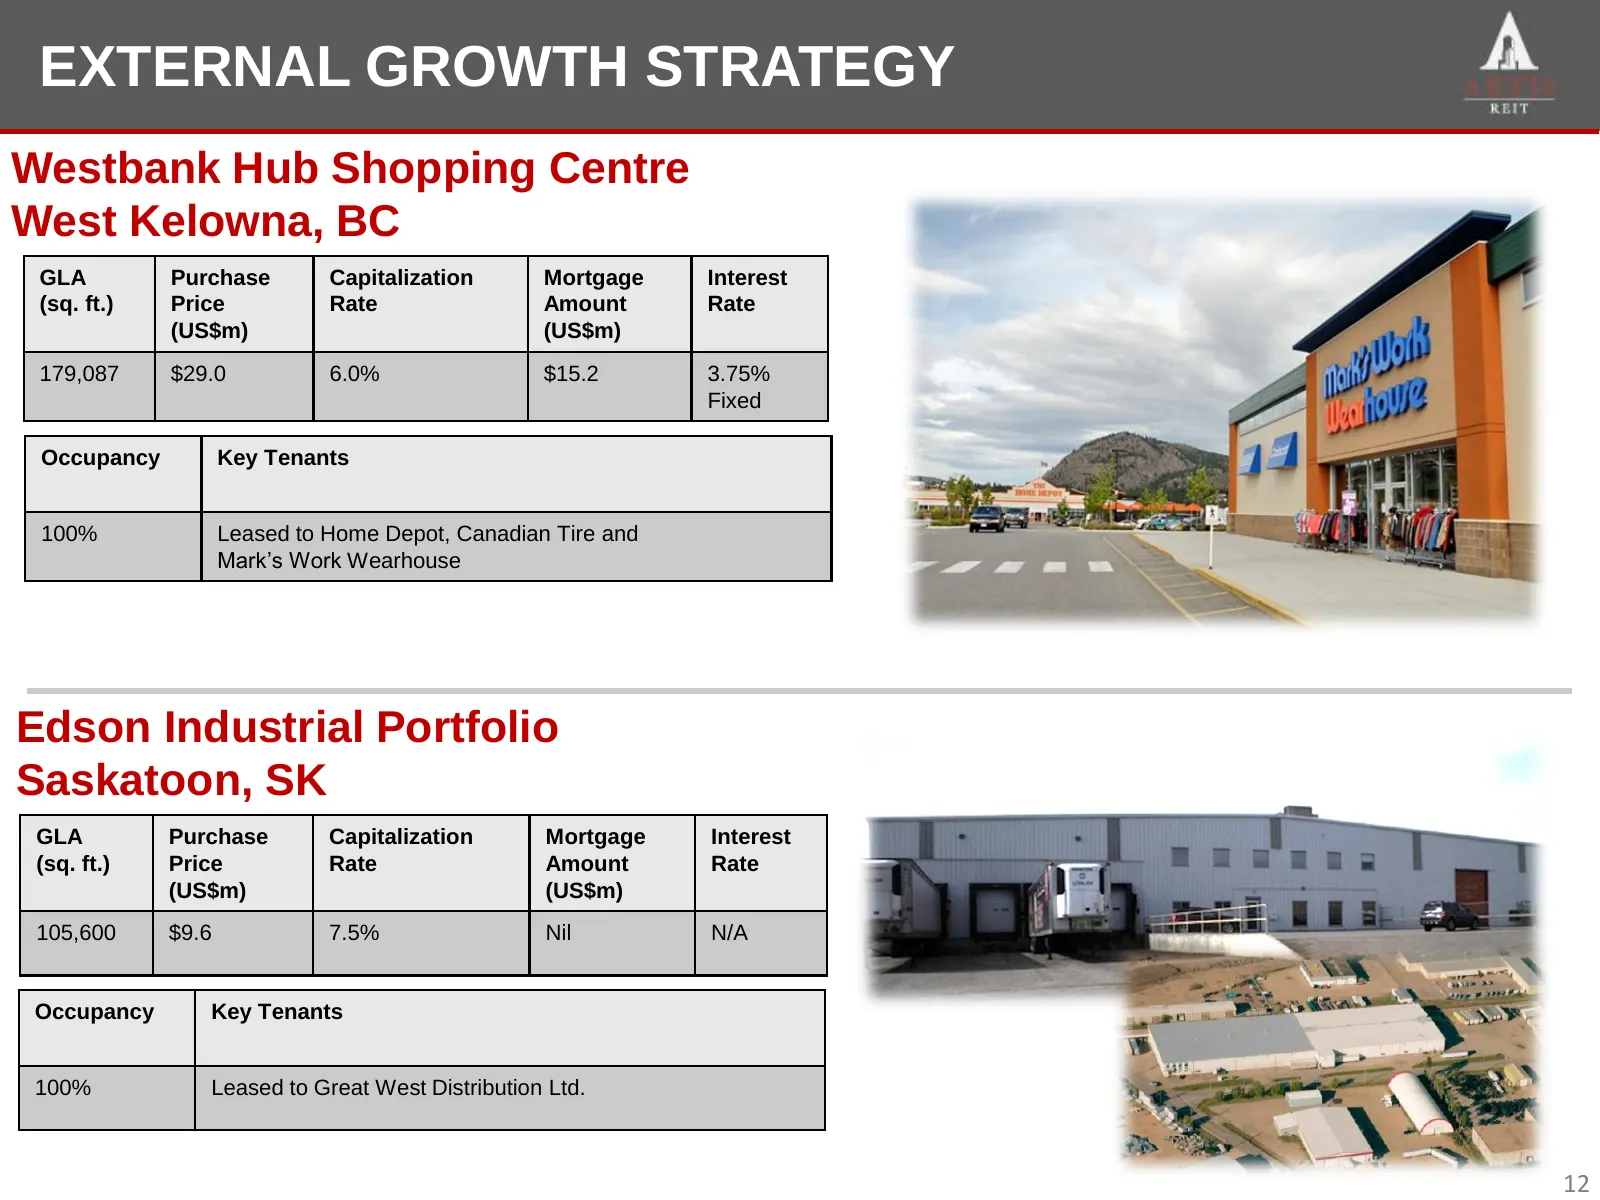
EXTERNALGROWTH EXTERNAL GROWTHSTRATEGY STRATEGY Westbank Hub Shopping Centre West Kelowna, BC GLA Purchase Capitalization Mortgage Interest (sq. ft.) Price Rate Amount Rate (US$m) (US$m) 179,087 $29.0 6.0% $15.2 3.75% Fixed Occupancy Key Tenants 100% Leased to Home Depot, Canadian Tire and Mark’s Wo
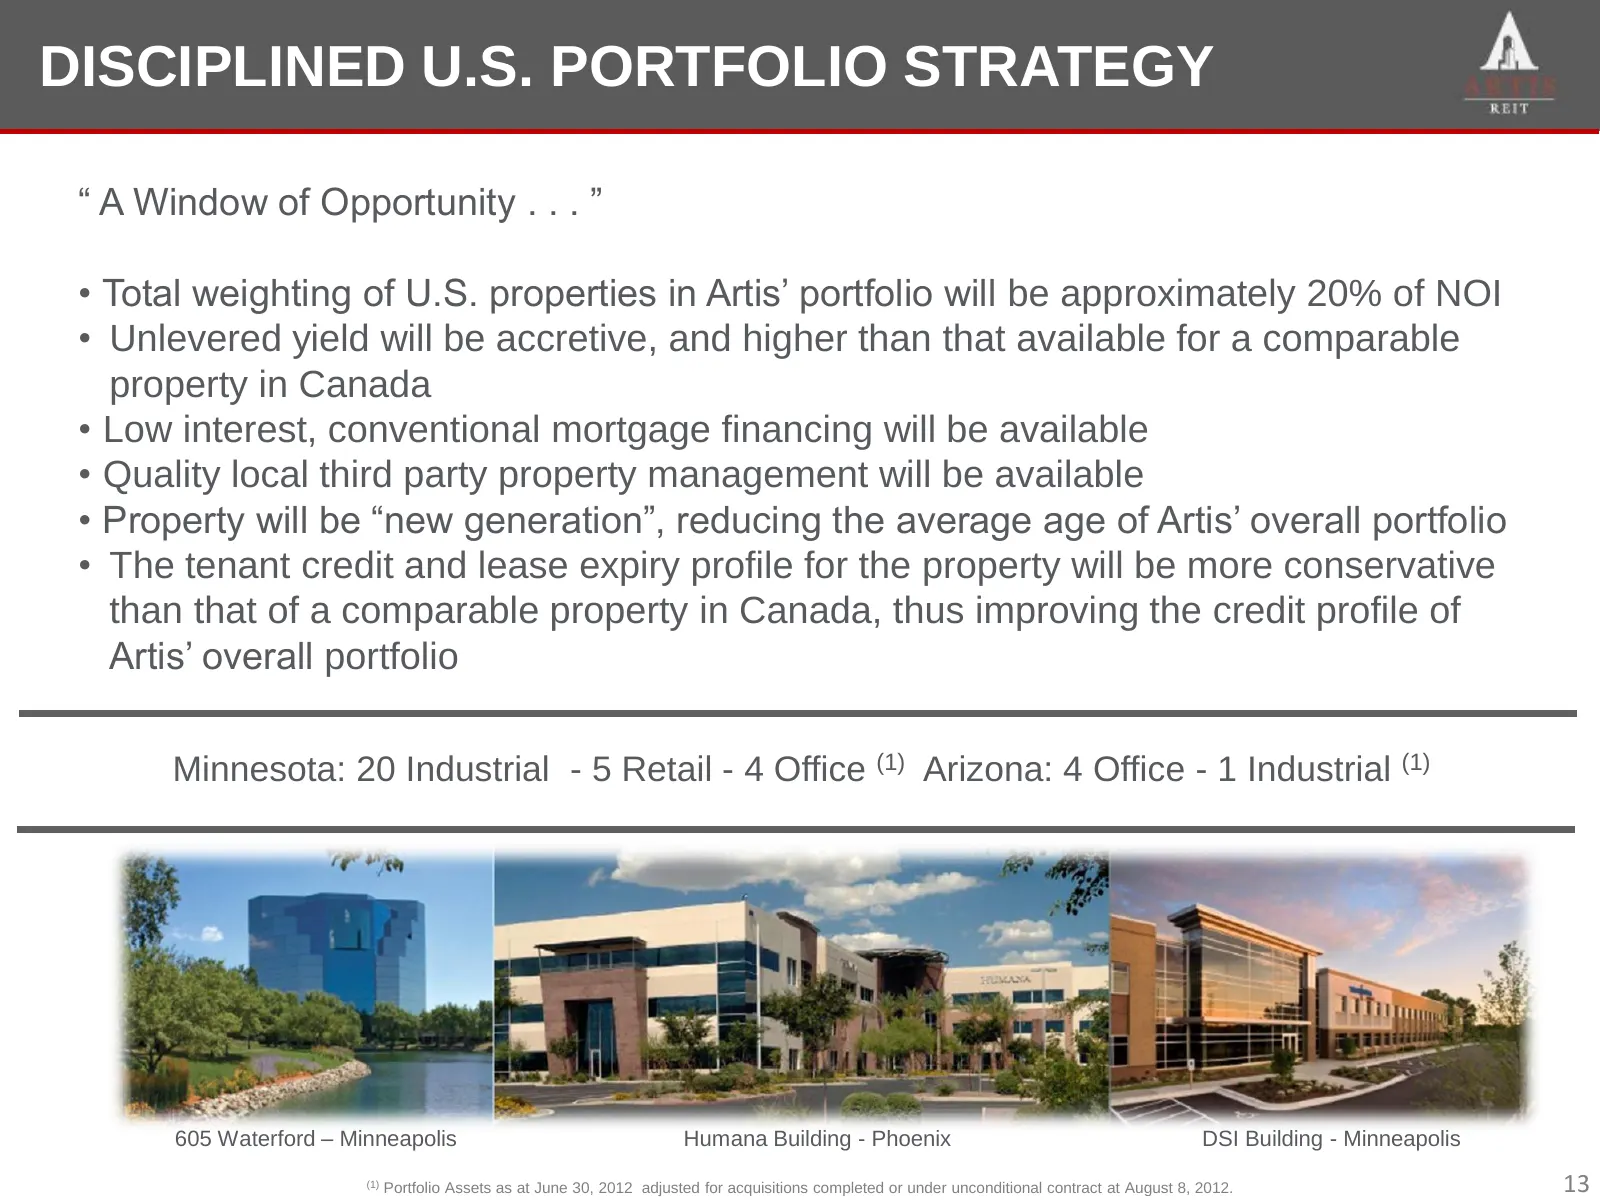
Slide 13: Disciplined U.S. Portfolio Strategy
DISCIPLINED ARTIS U.S. PORTFOLIO REIT PROGRESS STRATEGY HIGHLIGHTS “ A Window of Opportunity . . . ” • Total weighting of U.S. properties in Artis’ portfolio will be approximately 20% of NOI • Unlevered yield will be accretive, and higher than that available for a comparable property in Canada • Low
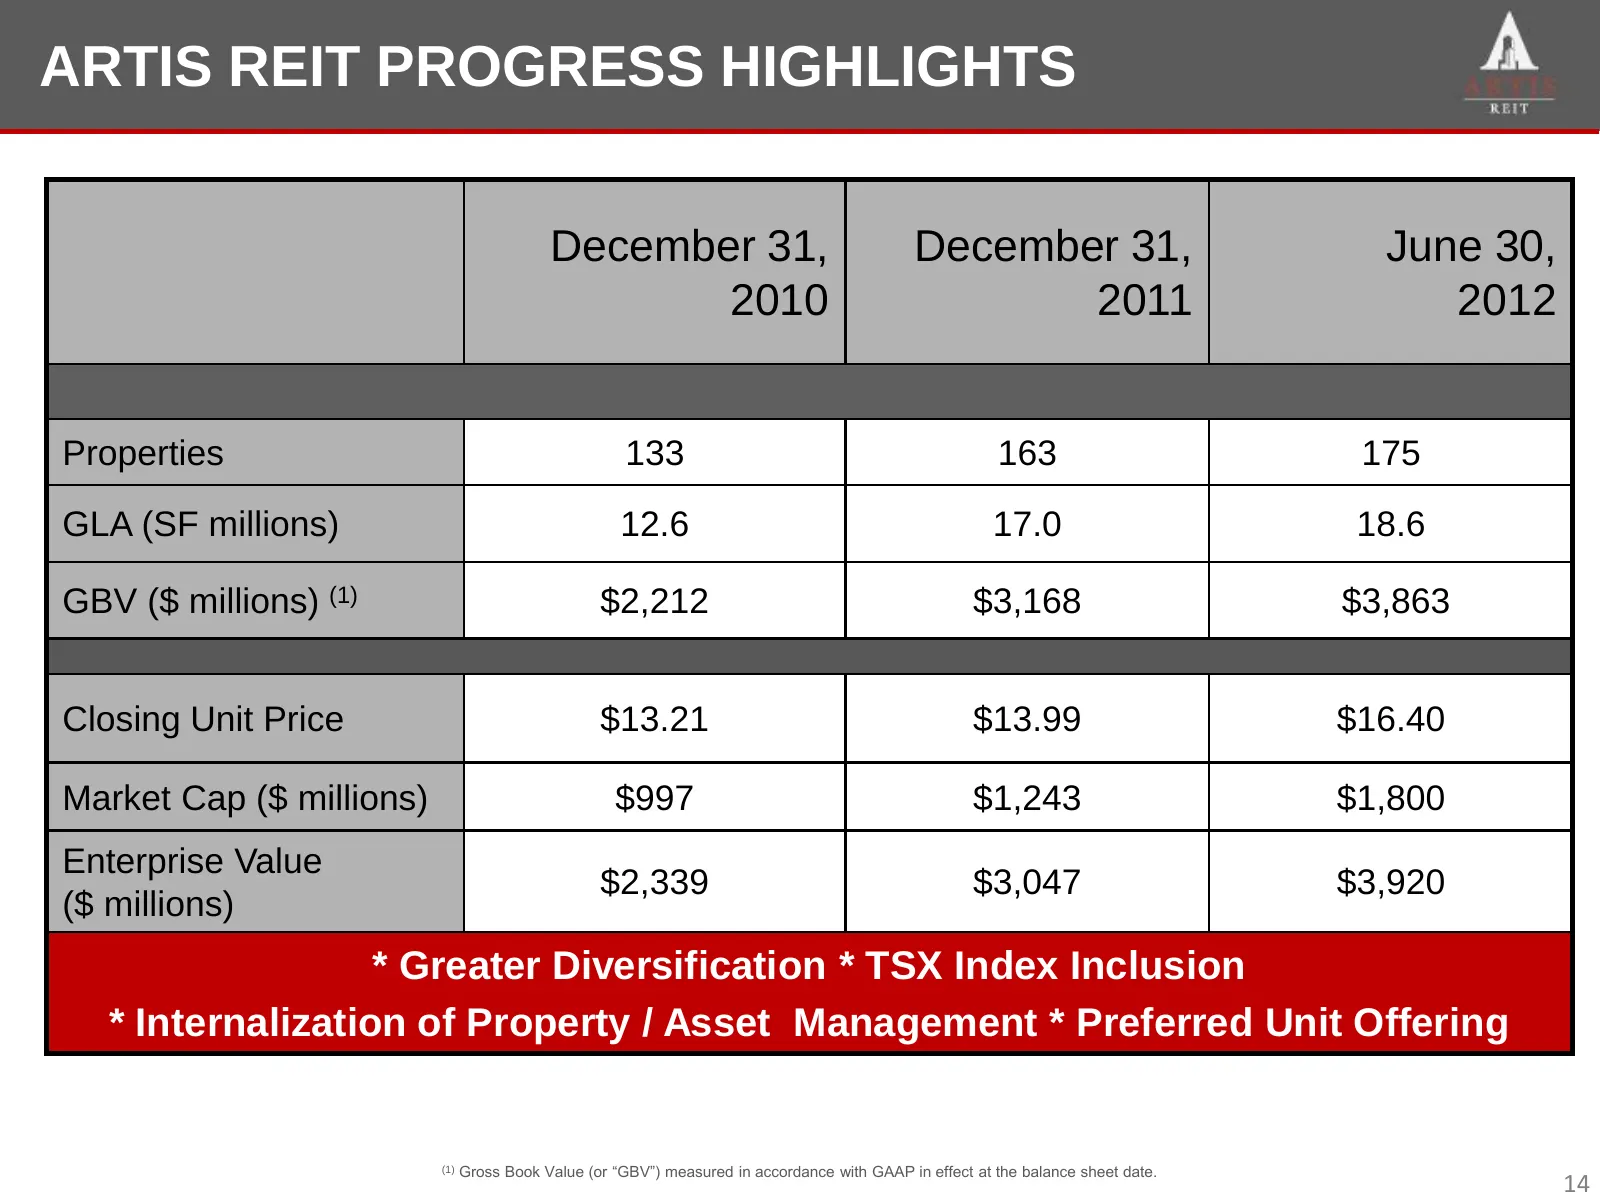
Slide 14: Artis REIT Progress Highlights
ARTISREIT ARTIS REITPROGRESS PROGRESSHIGHLIGHTS HIGHLIGHTS December 31, December 31, June 30, 2010 2011 2012 Properties 133 163 175 GLA (SF millions) 12.6 17.0 18.6 GBV ($ millions) (1) $2,212 $3,168 $3,863 Closing Unit Price $13.21 $13.99 $16.40 Market Cap ($ millions) $997 $1,243 $1,800 Enterprise
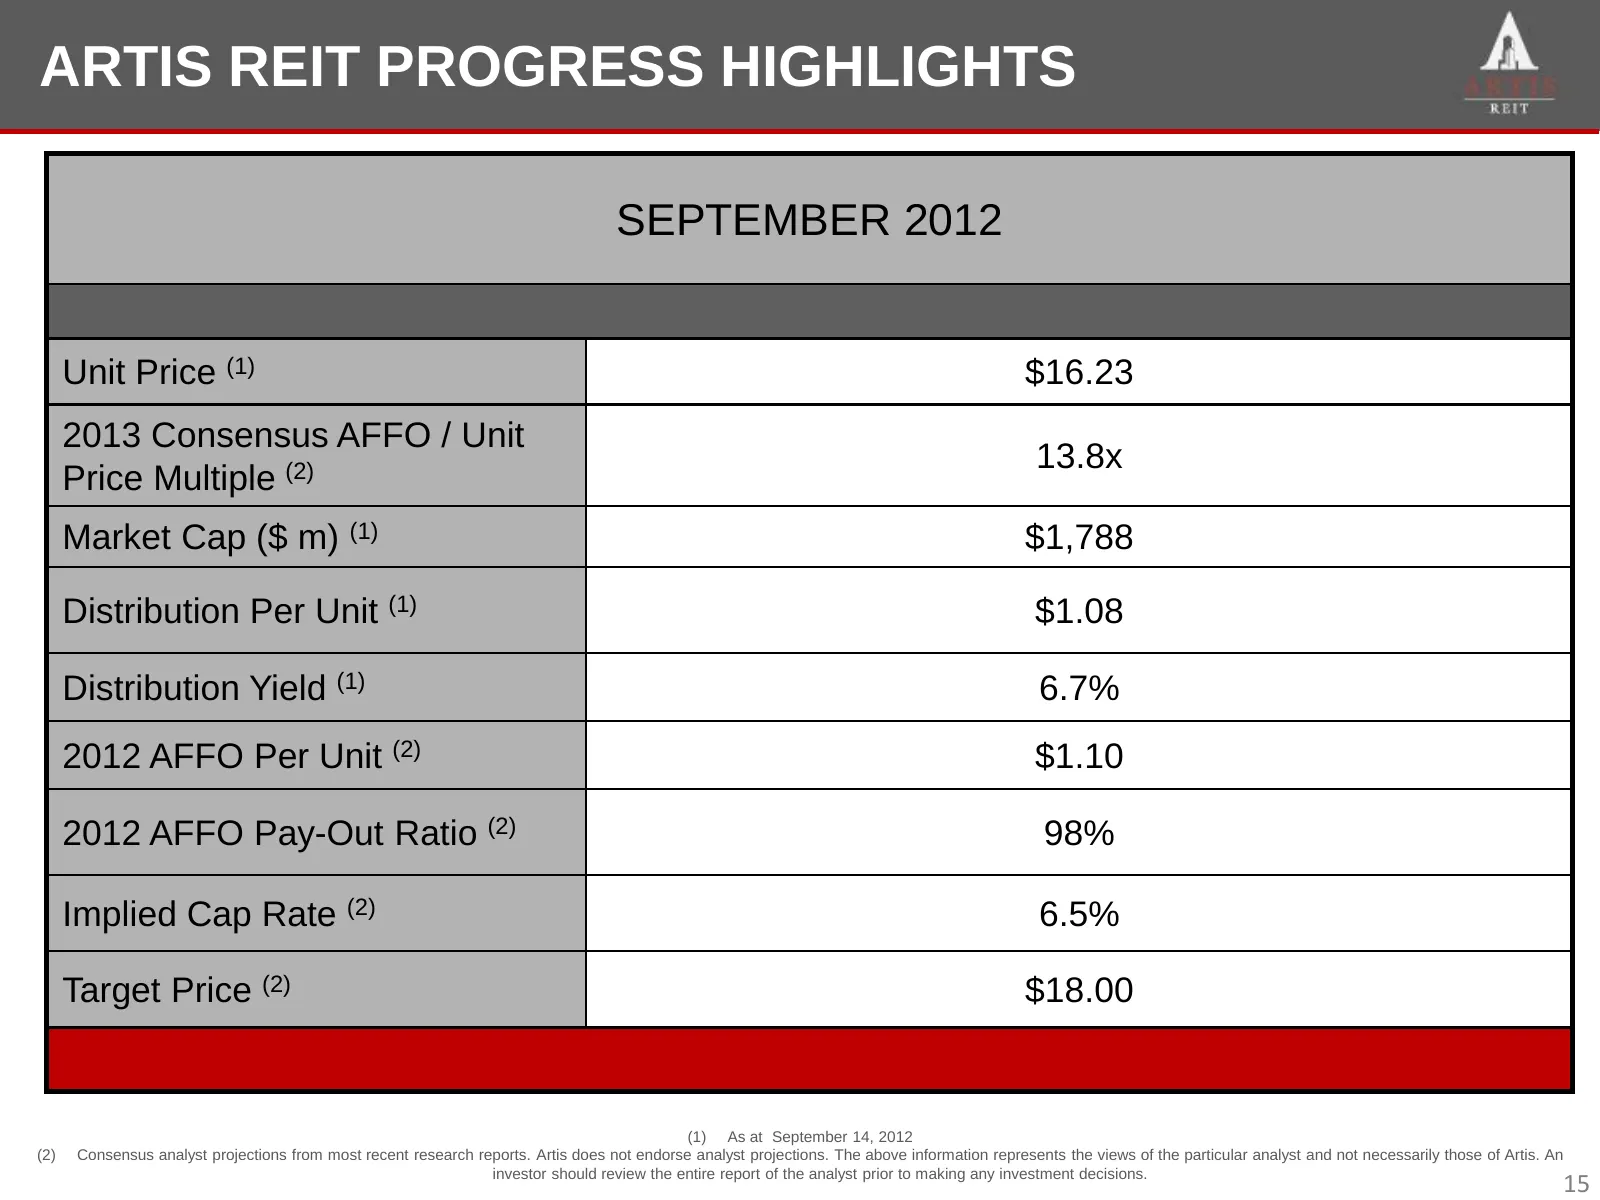
Slide 15: Artis REIT Progress Highlights - September 2012
ARTISREIT ARTIS REITPROGRESS PROGRESSHIGHLIGHTS HIGHLIGHTS SEPTEMBER 2012 Unit Price (1) $16.23 2013 Consensus AFFO / Unit 13.8x Price Multiple (2) Market Cap ($ m) (1) $1,788 Distribution Per Unit (1) $1.08 Distribution Yield (1) 6.7% 2012 AFFO Per Unit (2) $1.10 2012 AFFO Pay-Out Ratio (2) 98% Imp
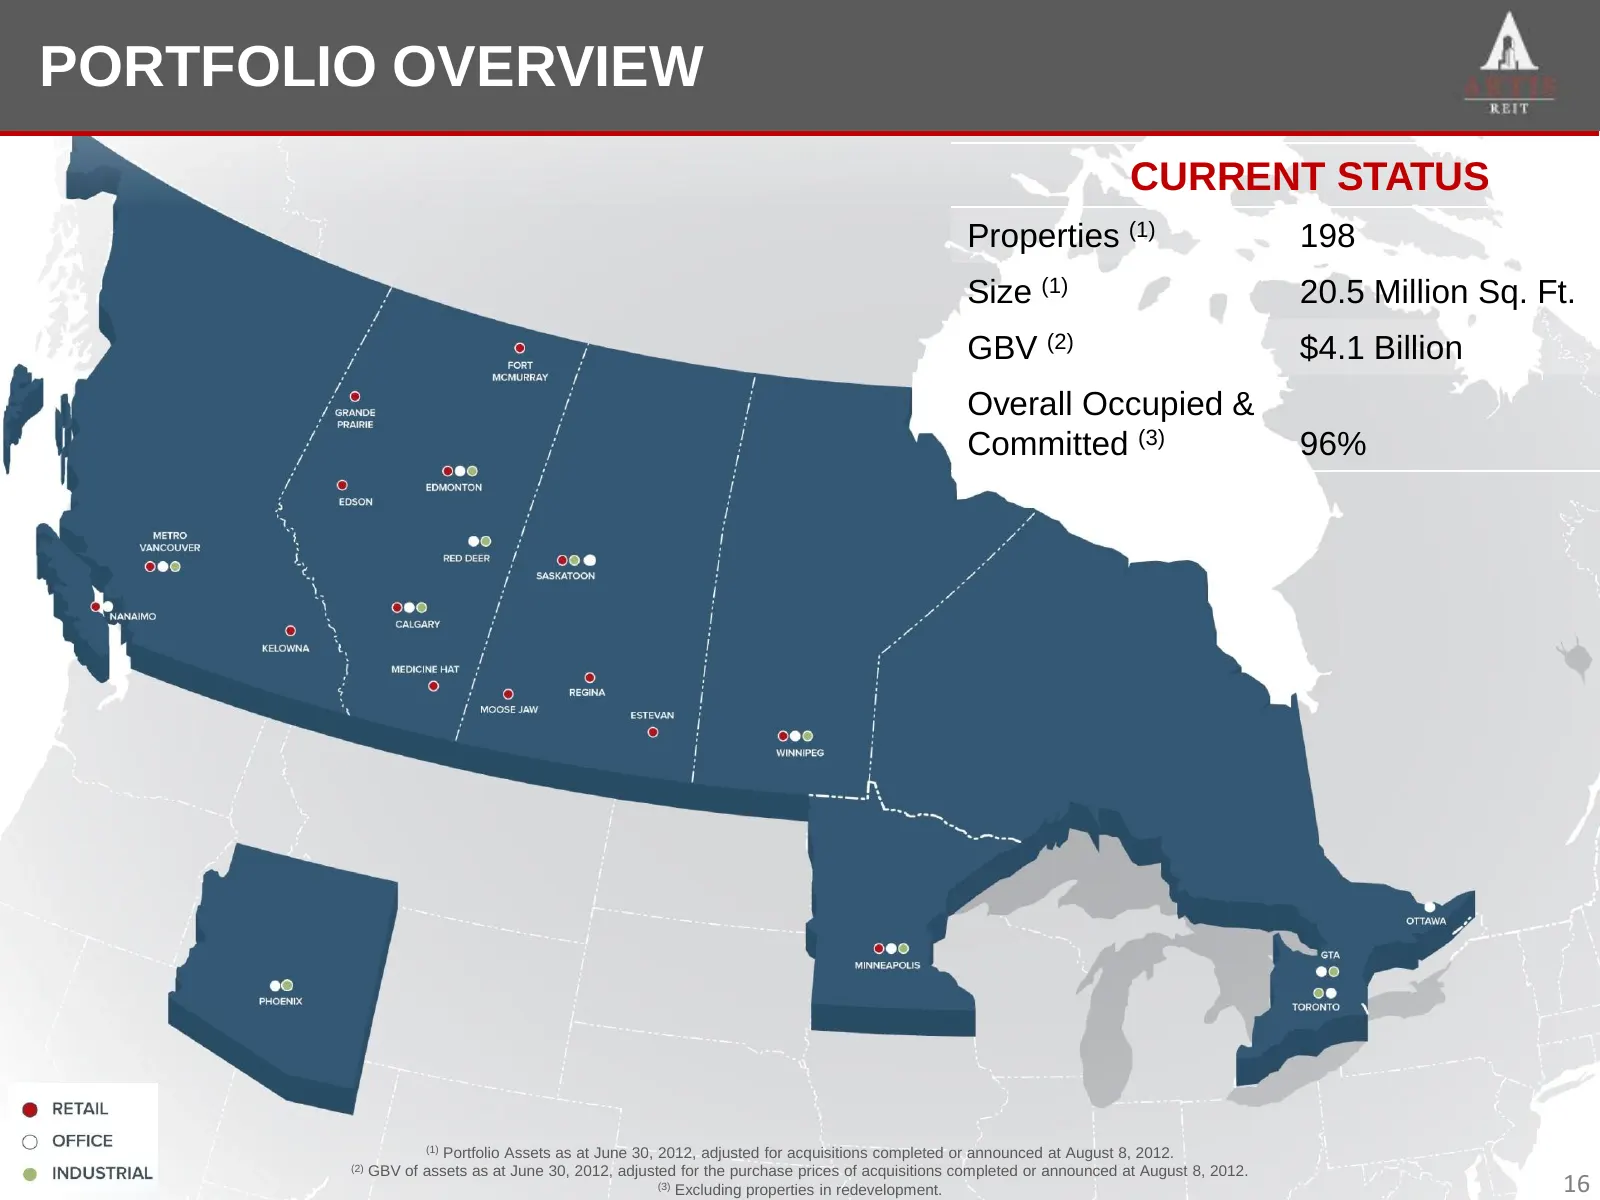
Slide 16: Portfolio Overview
PORTFOLIOOVERVIEW PORTFOLIO OVERVIEW CURRENT STATUS Properties (1) 198 Size (1) 20.5 Million Sq. Ft. GBV (2) $4.1 Billion Overall Occupied & Committed (3) 96% (1) Portfolio Assets as at June 30, 2012, adjusted for acquisitions completed or announced at August 8, 2012. (2) GBV of assets as at June 30
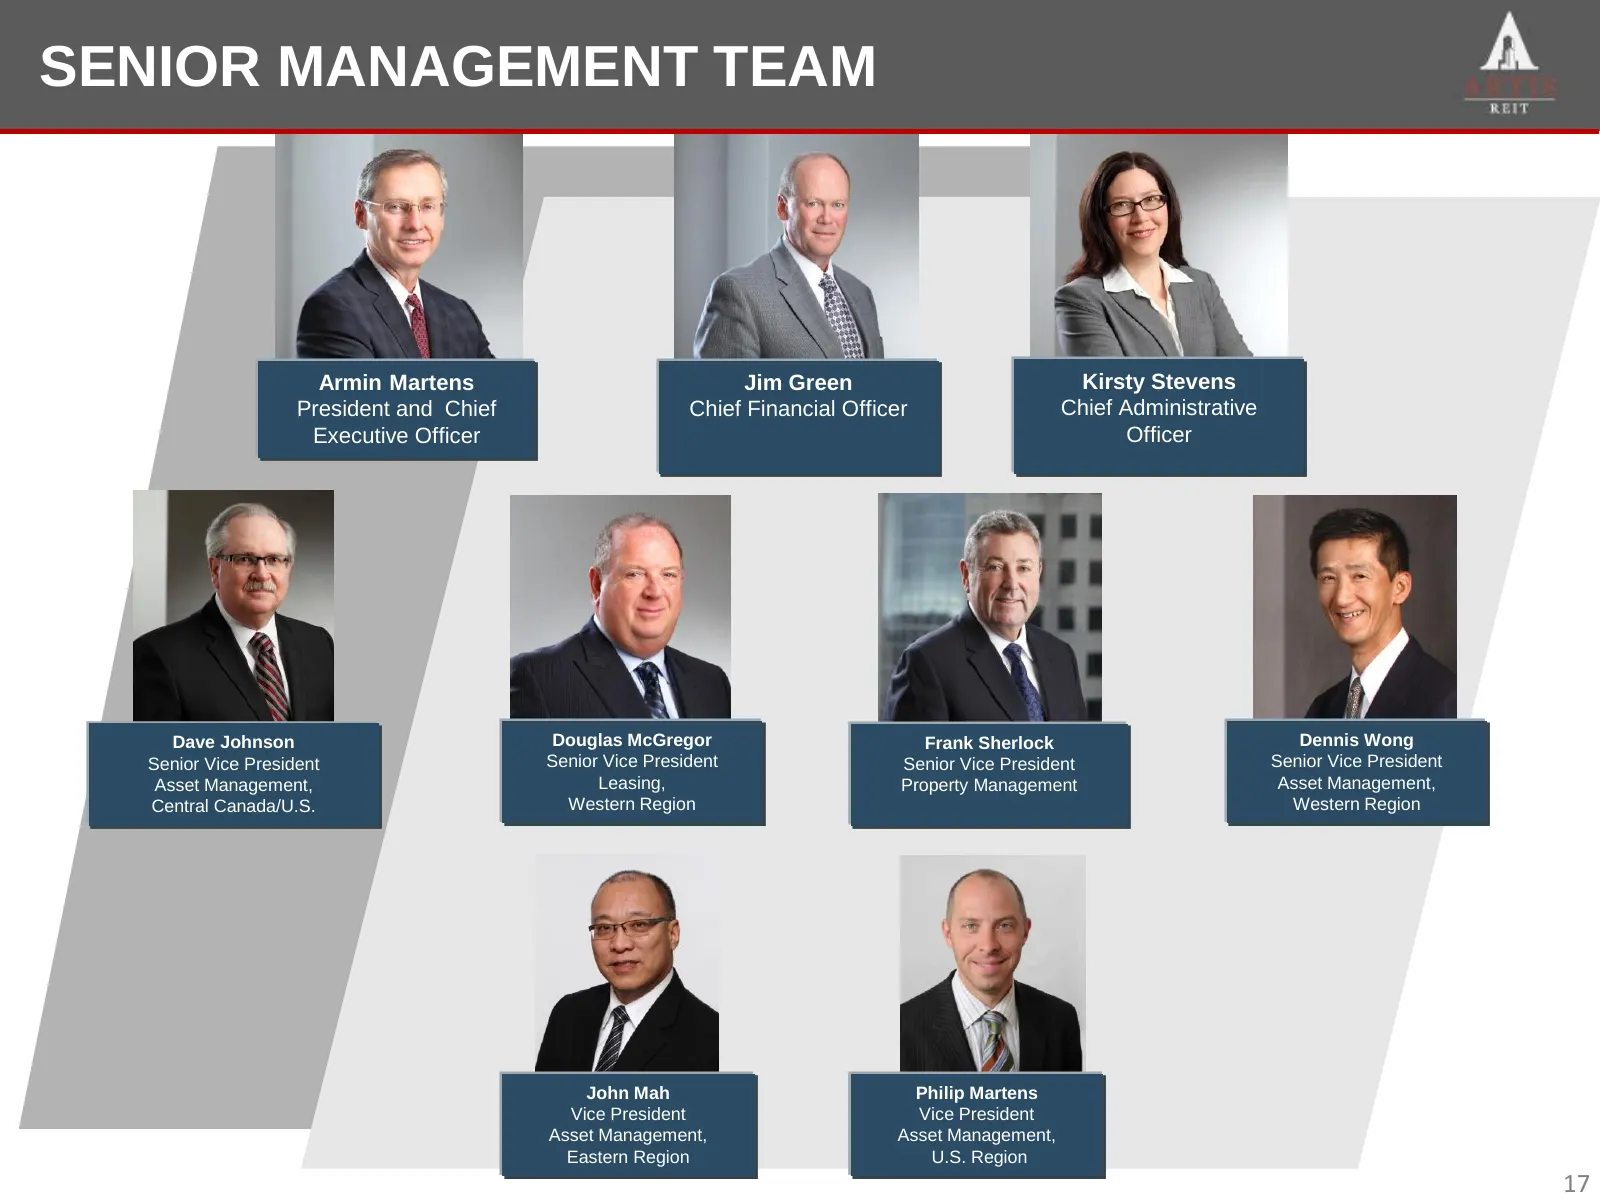
Slide 17: Senior Management Team
SENIORMANAGEMENT SENIOR MANAGEMENTTEAM TEAM Armin Martens Jim Green Kirsty Stevens President and Chief Chief Financial Officer Chief Administrative Executive Officer Officer Dave Johnson Douglas McGregor Frank Sherlock Dennis Wong Senior Vice President Senior Vice President Senior Vice President Sen
Slide 18: Diversification, Value Creation, Growth
DIVERSIFICATION VALUE CREATION GROWTH 18
Source: Internet Archive copy of arwebstore.blob.core.windows.net
More decks from RFA Financial Inc.
 Q3 2026 Earnings Presentation19 slides · Nov 11, 2026
 Q2 2026 Earnings Presentation21 slides · Aug 14, 2026
 Q1 2026 Earnings Presentation28 slides · May 13, 2026
 Merger or Acquisition (September 2025)18 slides · Sep 15, 2025
 Artis Real Estate Investment Trust — Q2 2025 Earnings Presentation22 slides · Aug 7, 2025
 Artis Real Estate Investment Trust — Q1 2025 Earnings Presentation22 slides · May 8, 2025