Billerud AB · OMXSTO:BILL
Billerud AB — Q3 2005 Earnings Presentation
24 slides from Billerud AB's earnings presentation, Nov 9, 2005
Slide 1: Billerud January – September 2005
Billerud January – September 2005 Stockholm, November 9 Per Lindberg, CEO Nils Lindholm, CFO Sid 1
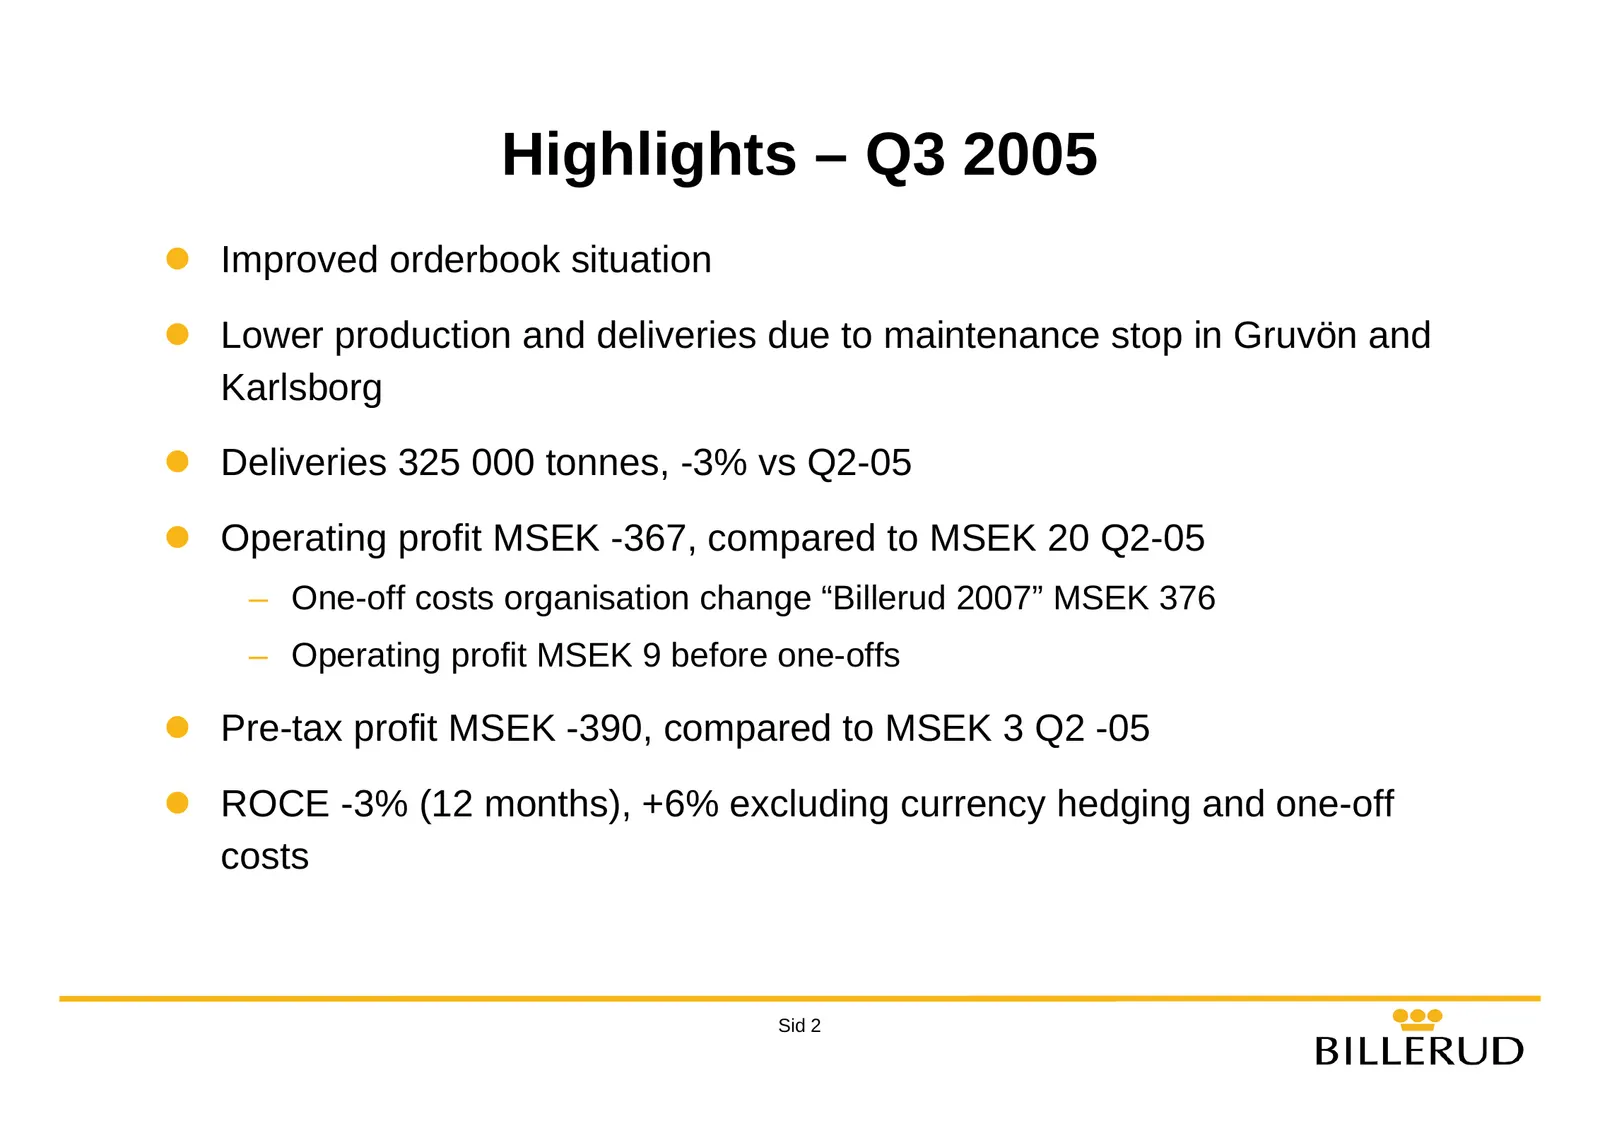
Slide 2: Highlights – Q3 2005
Highlights – Q3 2005 z Improved orderbook situation z Lower production and deliveries due to maintenance stop in Gruvön and Karlsborg z Deliveries 325 000 tonnes, -3% vs Q2-05 z Operating profit MSEK -367, compared to MSEK 20 Q2-05 – One-off costs organisation change “Billerud 2007” MSEK 376 – Opera
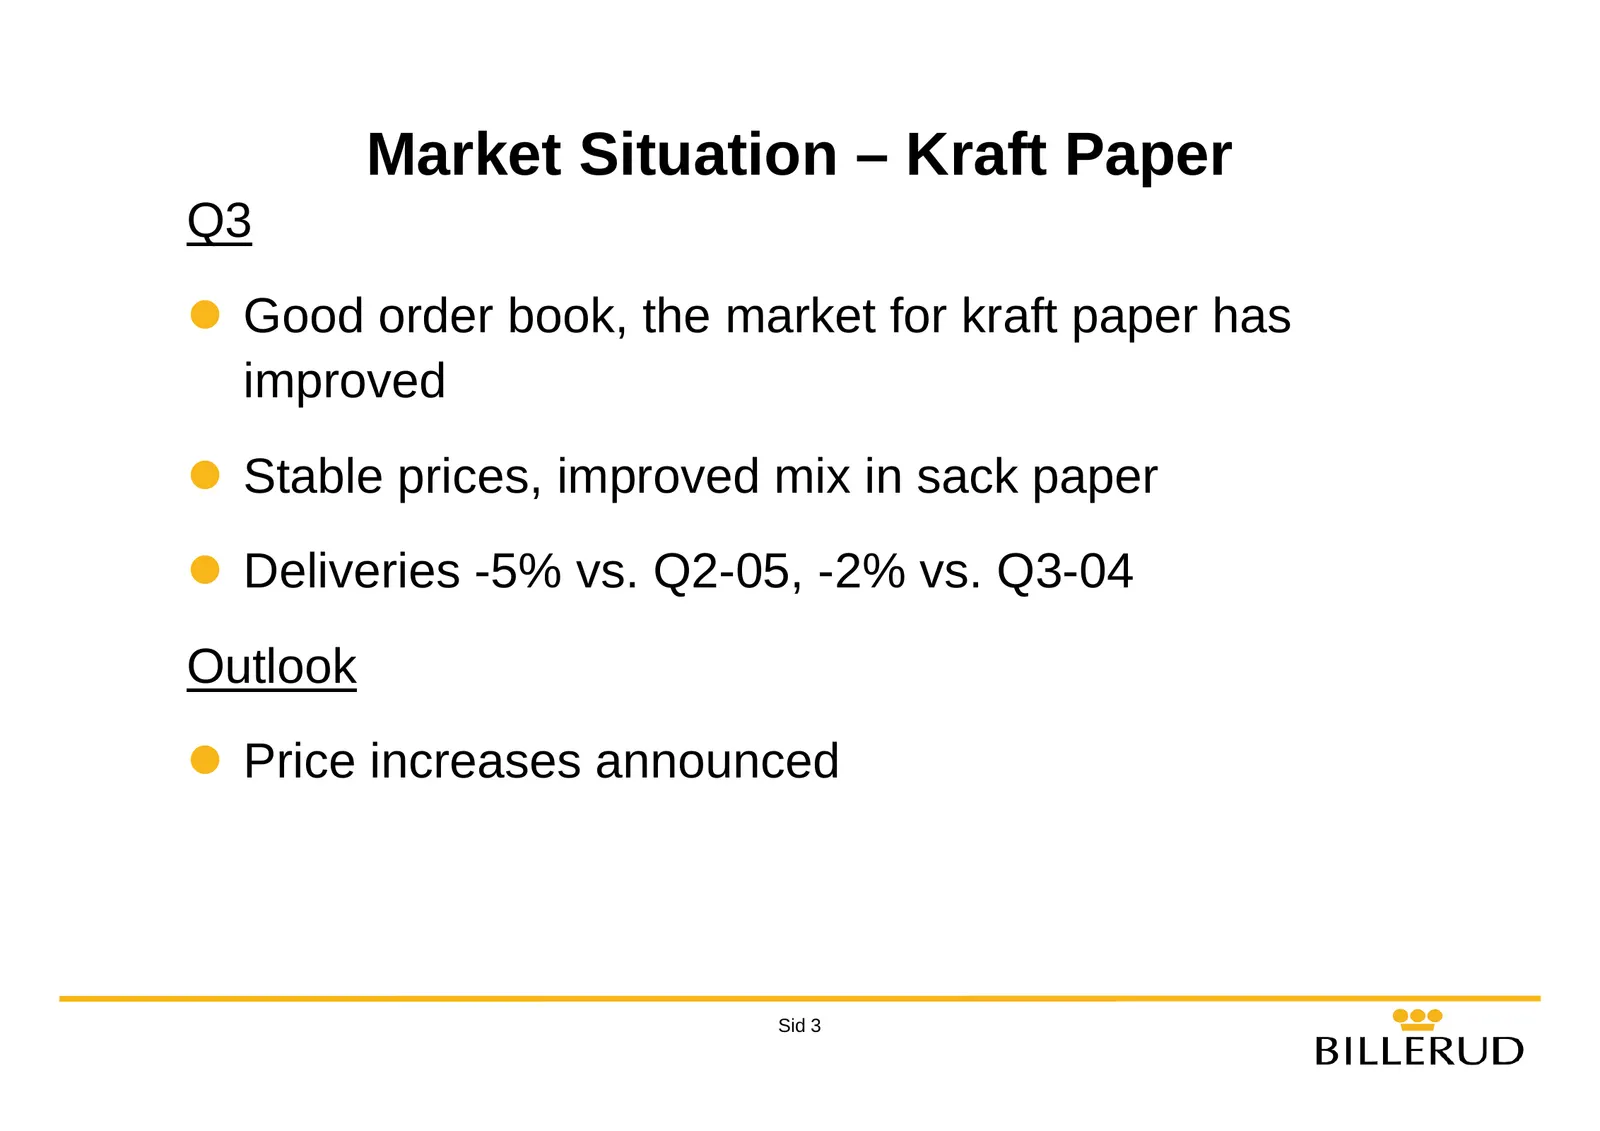
Slide 3: Market Situation – Kraft Paper
Market Situation – Kraft Paper Q3 z Good order book, the market for kraft paper has improved z Stable prices, improved mix in sack paper z Deliveries -5% vs. Q2-05, -2% vs. Q3-04 Outlook z Price increases announced Sid 3
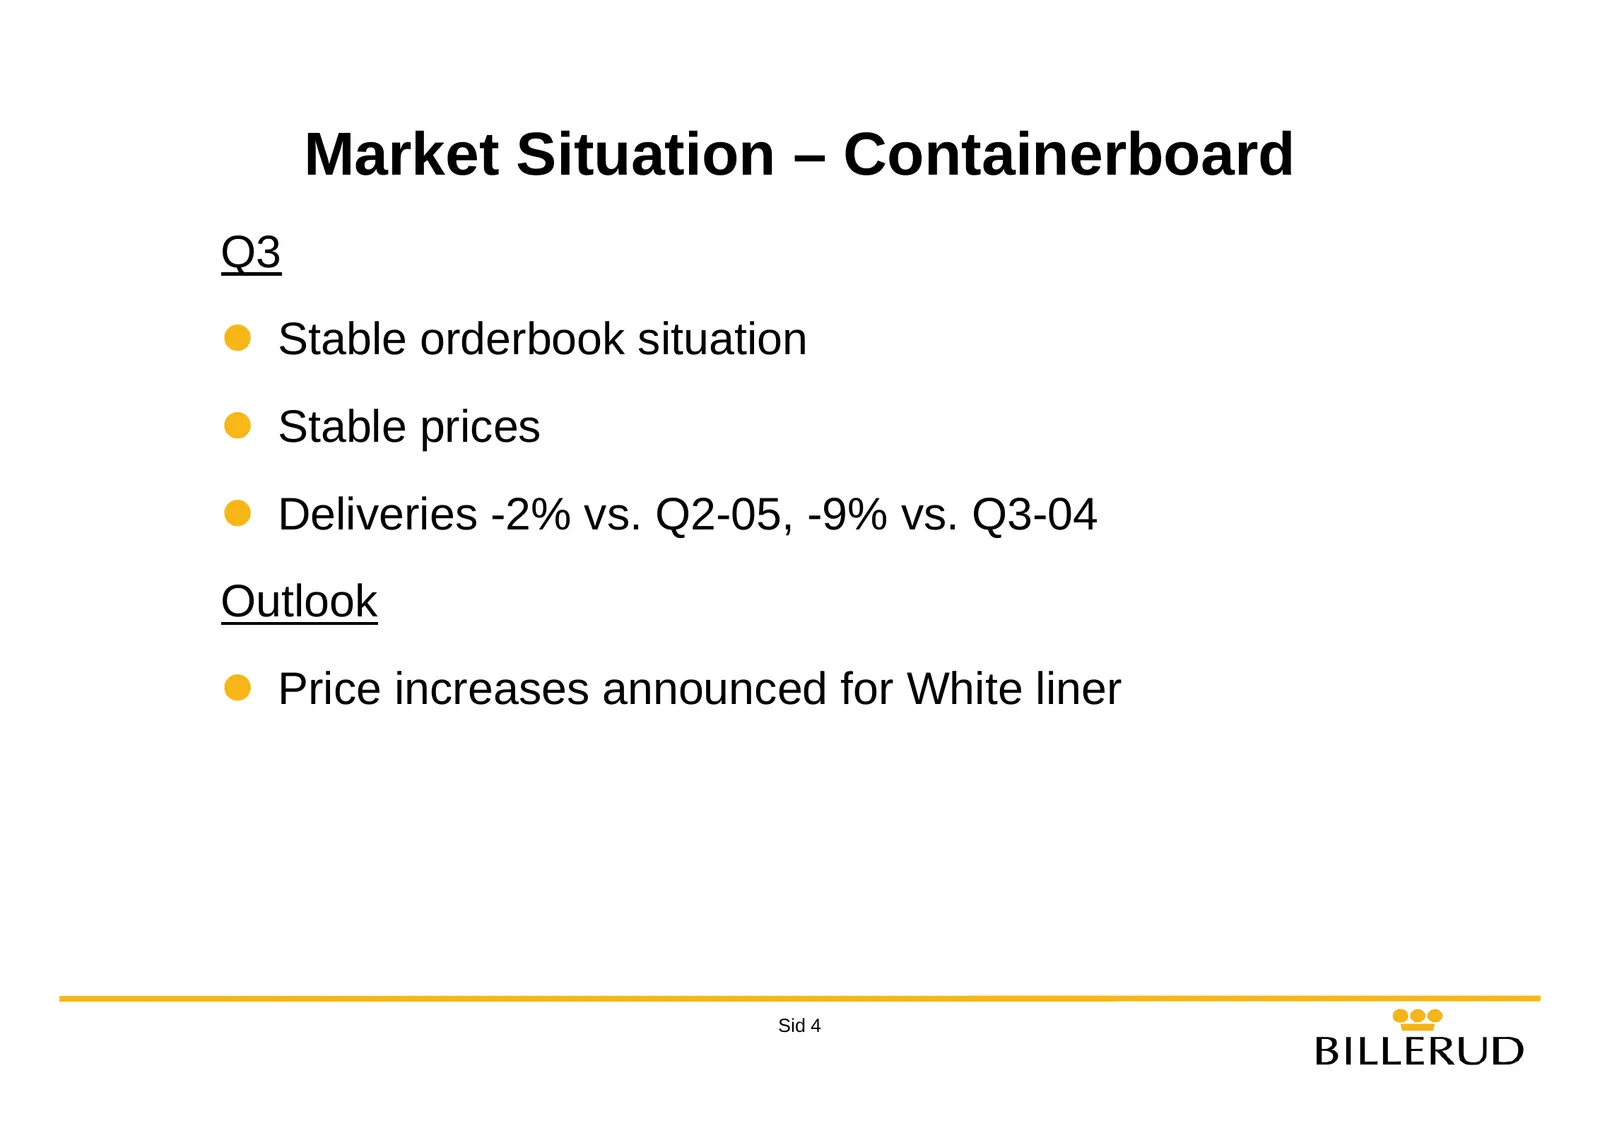
Slide 4: Market Situation – Containerboard
Market Situation – Containerboard Q3 z Stable orderbook situation z Stable prices z Deliveries -2% vs. Q2-05, -9% vs. Q3-04 Outlook z Price increases announced for White liner Sid 4
Slide 5: Market Situation – Market Pulp
Market Situation – Market Pulp Q3 z Market price for NBSK increased during the quarter from USD 590/tonne to USD 600/tonne z External deliveries -3% vs. Q2-05, +-0% vs. Q3-04 Outlook z Price increase during rest of the year. USD 620/tonne from November Sid 5
Slide 6: Organisation cost reduction programme
Organisation cost reduction programme z Organisation cost will be cut by at least MSEK 250 per year z Reduction of 450 employees z The programme will come into immediate effect and should be completed by the end of 2006. The full effects will be noted in 2007 z One-off costs for the programme are MS
Slide 7: Energy cost reduction programme
Energy cost reduction programme z Decision to invest around MSEK 1 050. On stream gradually from the second half of 2005 up to the end of 2006 z Includes new turbines for backpressure power and rebuilt bark boilers and new electricity supply at Gruvön z Payback period of less than five years – Highe
Slide 8: Financials
Financials BILLERUD Sid 8
Slide 9: Key Figures Q3 2005
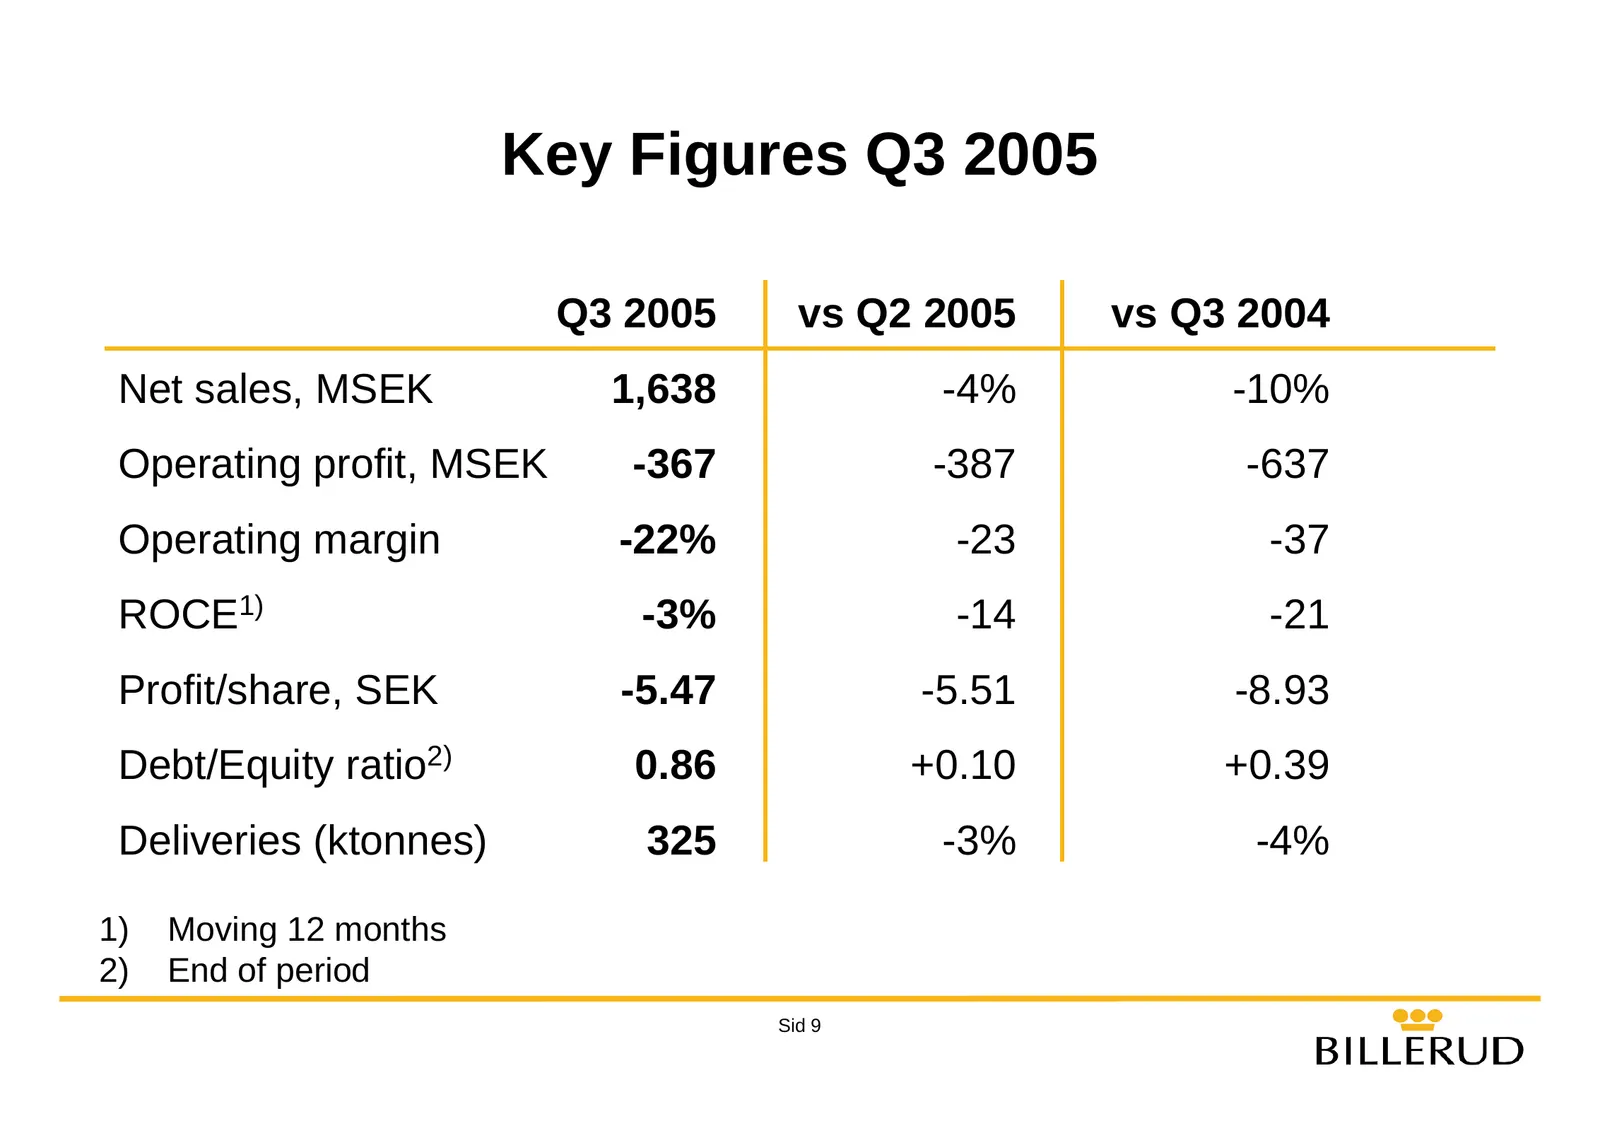
Key Figures Q3 2005 Q3 2005 vs Q2 2005 vs Q3 2004 Net sales, MSEK 1,638 -4% -10% Operating profit, MSEK -367 -387 -637 Operating margin -22% -23 -37 ROCE1) -3% -14 -21 Profit/share, SEK -5.47 -5.51 -8.93 Debt/Equity ratio2) 0.86 +0.10 +0.39 Deliveries (ktonnes) 325 -3% -4% 1) Moving 12 months 2) End
Slide 10: Excluding effects from hedging and “Billerud 2007”
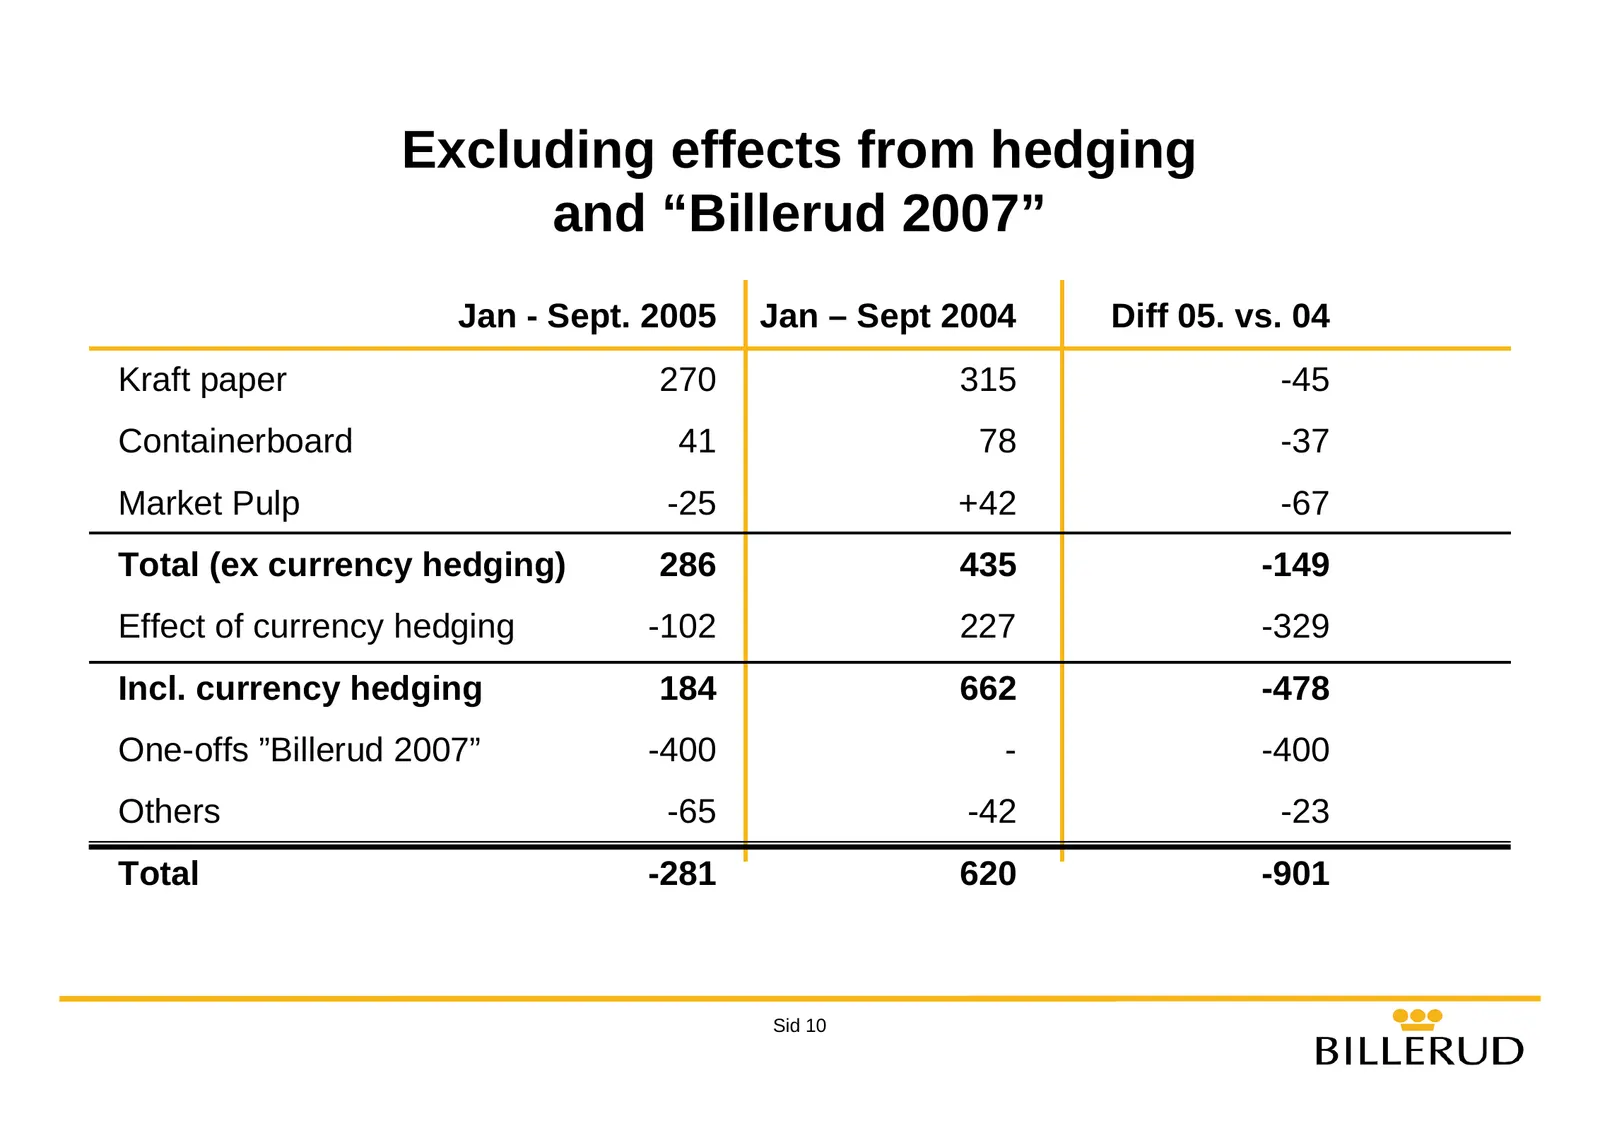
Excluding effects from hedging and “Billerud 2007” Jan - Sept. 2005 Jan – Sept 2004 Diff 05. vs. 04 Kraft paper 270 315 -45 Containerboard 41 78 -37 Market Pulp -25 +42 -67 Total (ex currency hedging) 286 435 -149 Effect of currency hedging -102 227 -329 Incl. currency hedging 184 662 -478 One-offs
Slide 11: Operating Margin Development
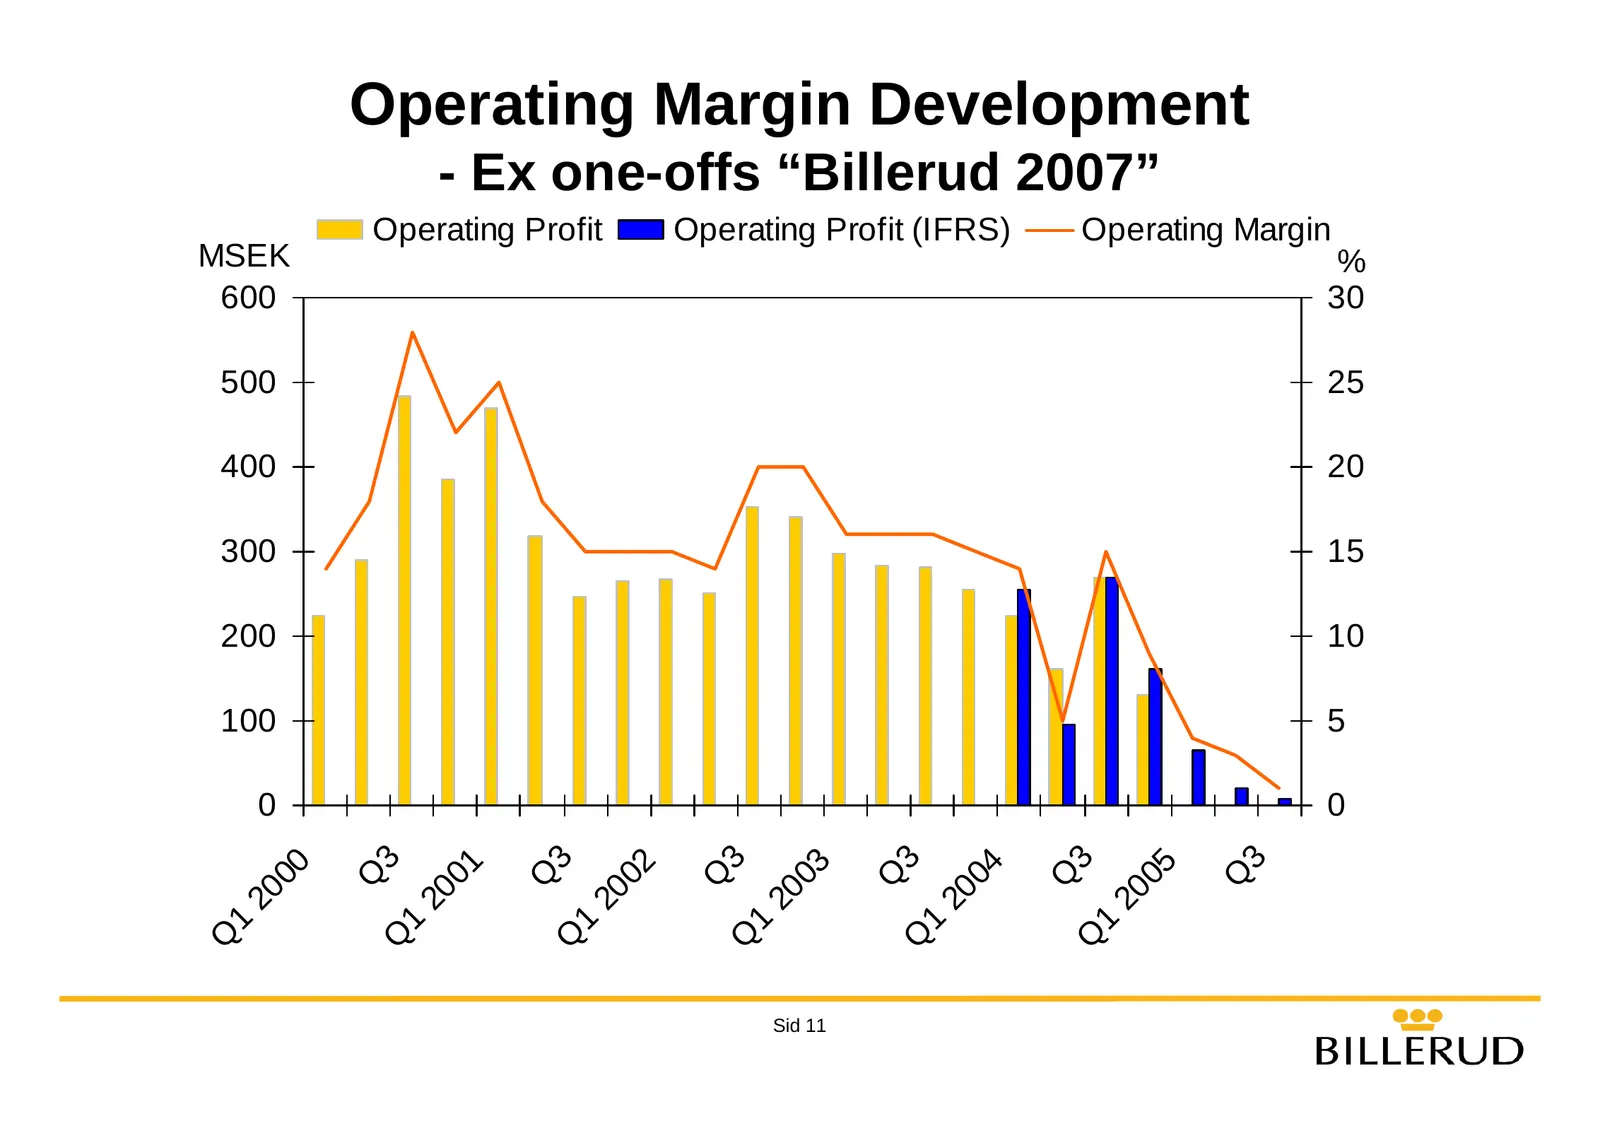
Operating Margin Development - Ex one-offs “Billerud 2007” Operating Profit Operating Profit (IFRS) Operating Margin MSEK % 600 30 500 25 400 20 300 15 200 10 100 5 0 0 3 3 3 3 3 3 00 01 02 03 04 05 Q Q Q Q Q Q 20 20 20 20 20 20 1 1 1 1 1 1 Q Q Q Q Q Q Sid 11
Slide 12: Cash Flow
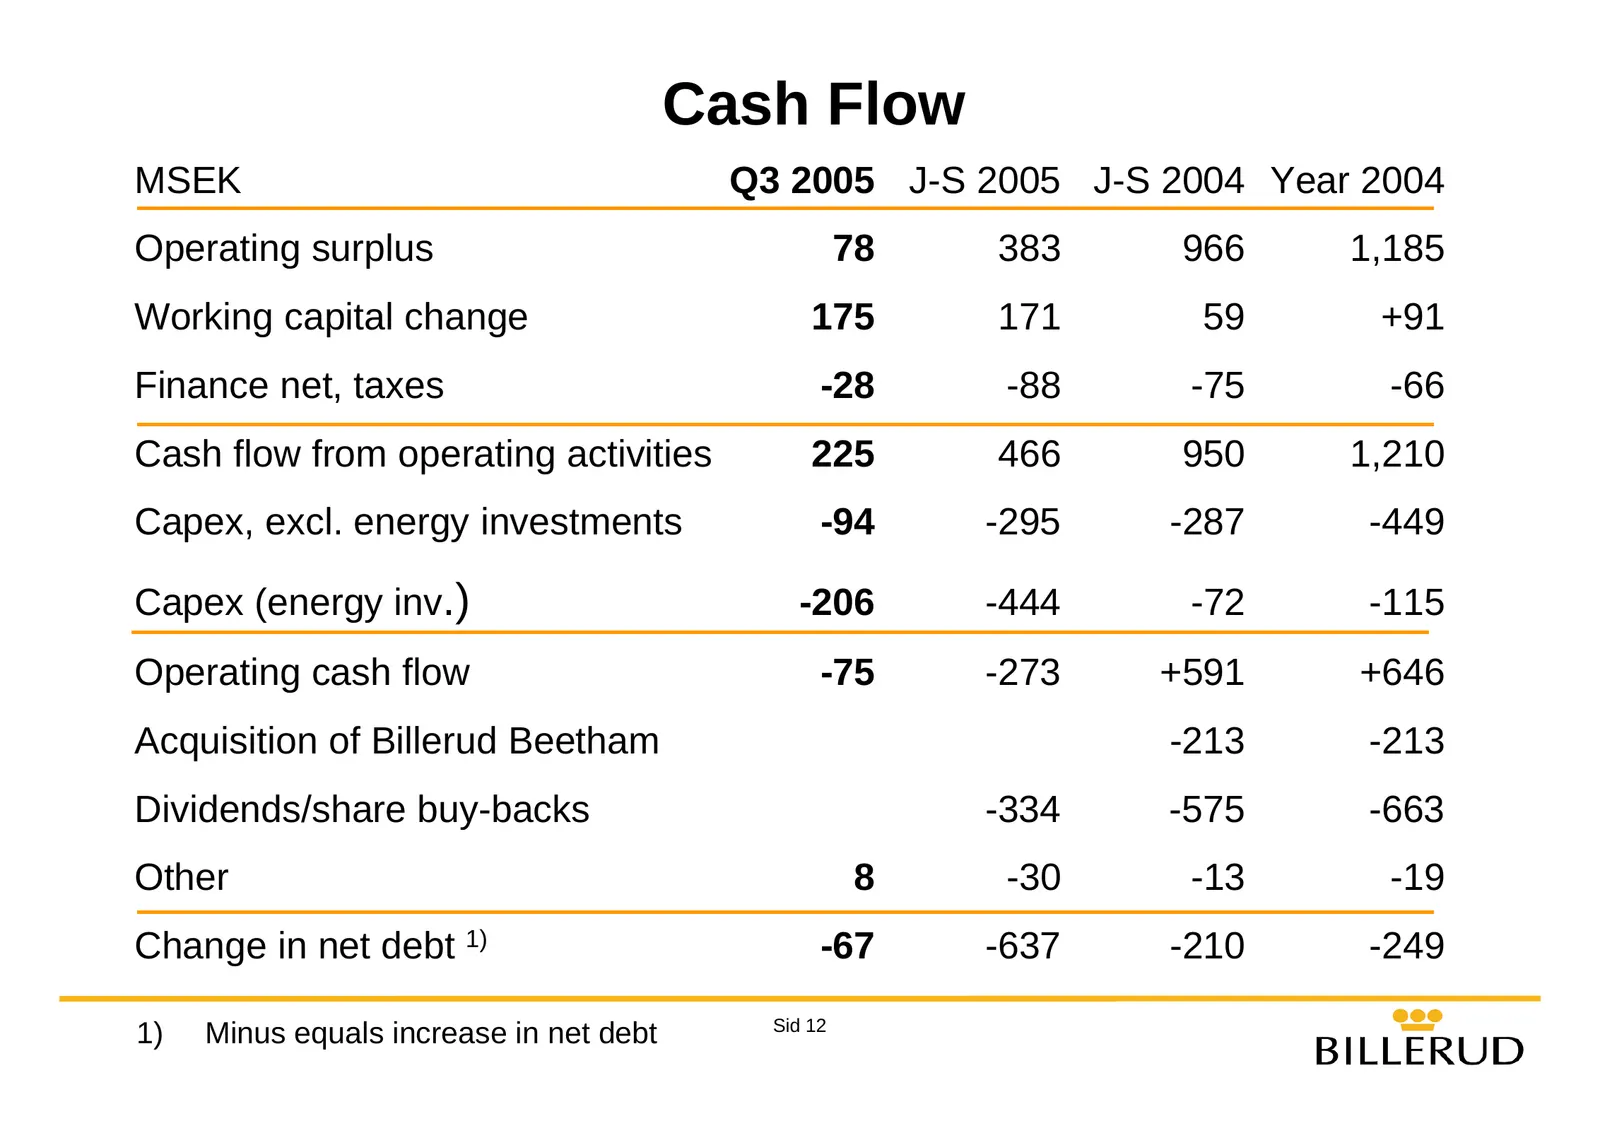
Cash Flow MSEK Q3 2005 J-S 2005 J-S 2004 Year 2004 Operating surplus 78 383 966 1,185 Working capital change 175 171 59 +91 Finance net, taxes -28 -88 -75 -66 Cash flow from operating activities 225 466 950 1,210 Capex, excl. energy investments -94 -295 -287 -449 Capex (energy inv.) -206 -444 -72 -1
Slide 13: Currency Situation
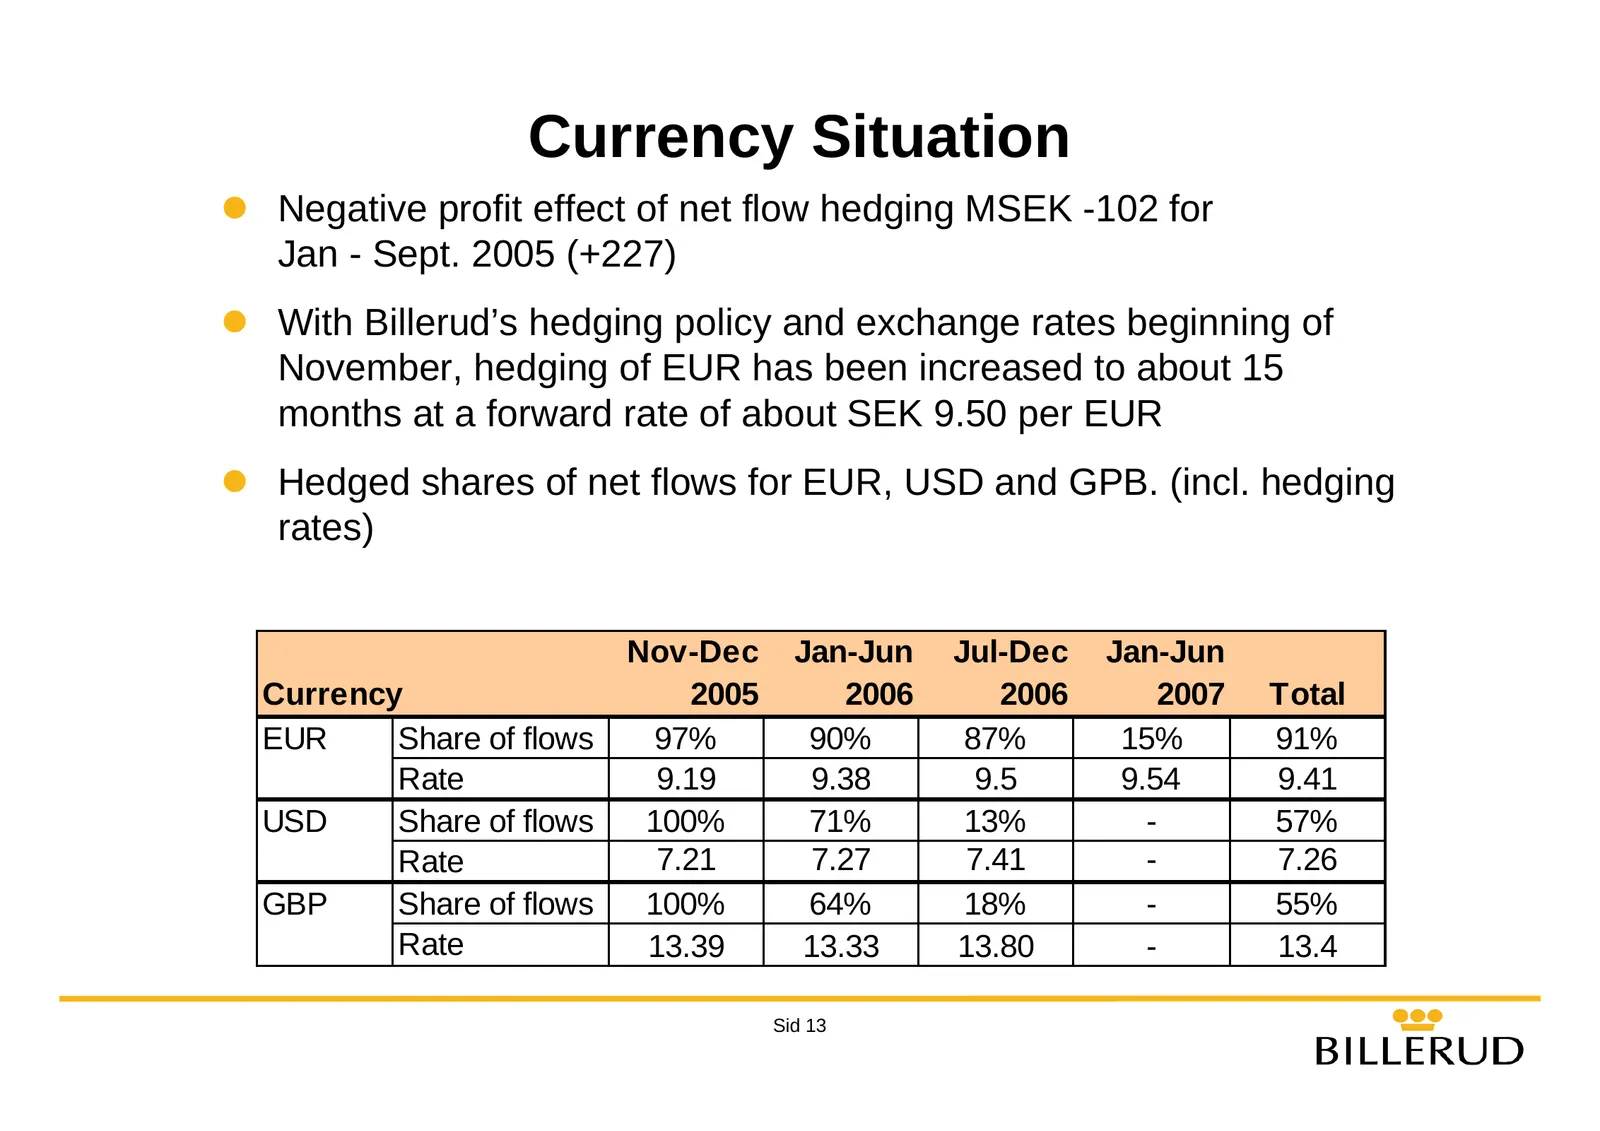
Currency Situation z Negative profit effect of net flow hedging MSEK -102 for Jan - Sept. 2005 (+227) z With Billerud’s hedging policy and exchange rates beginning of November, hedging of EUR has been increased to about 15 months at a forward rate of about SEK 9.50 per EUR z Hedged shares of net flo
Slide 14: Financial Objectives
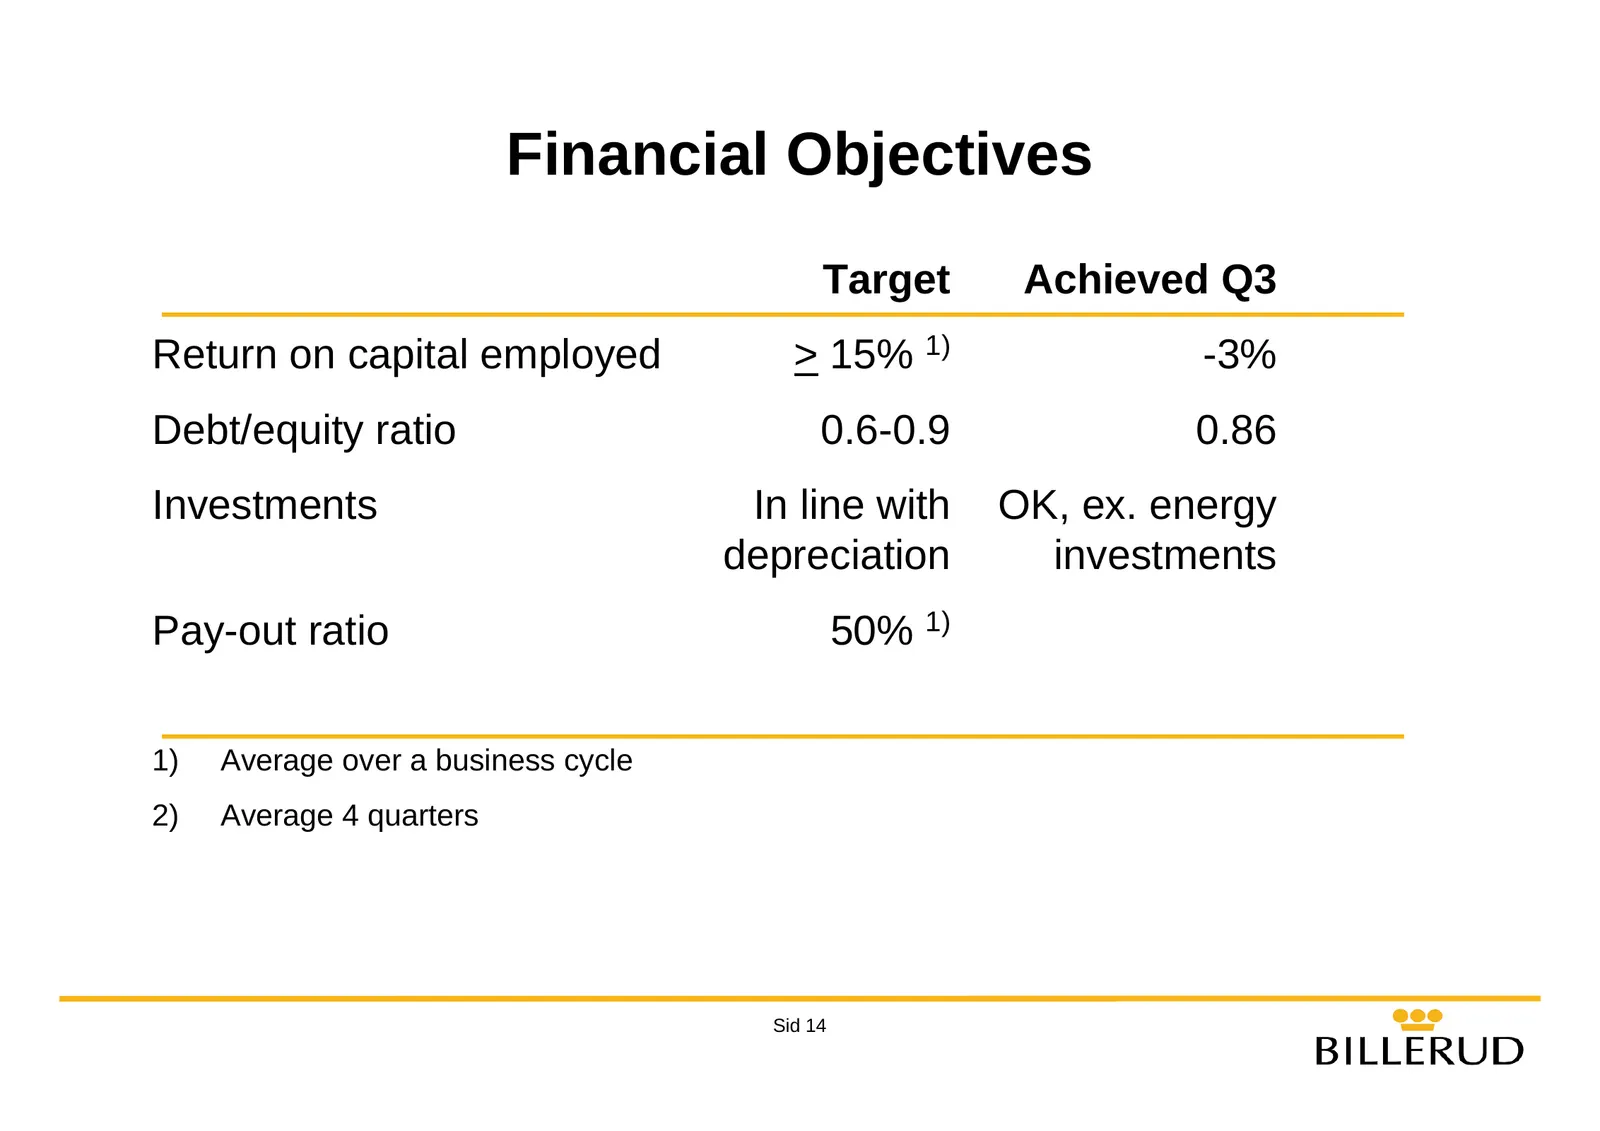
Financial Objectives Target Achieved Q3 Return on capital employed > 15% 1) -3% Debt/equity ratio 0.6-0.9 0.86 Investments In line with OK, ex. energy depreciation investments Pay-out ratio 50% 1) 1) Average over a business cycle 2) Average 4 quarters Sid 14
Slide 15: Outlook
Outlook Sid 15 bt BILLERUD
Slide 16: Outlook
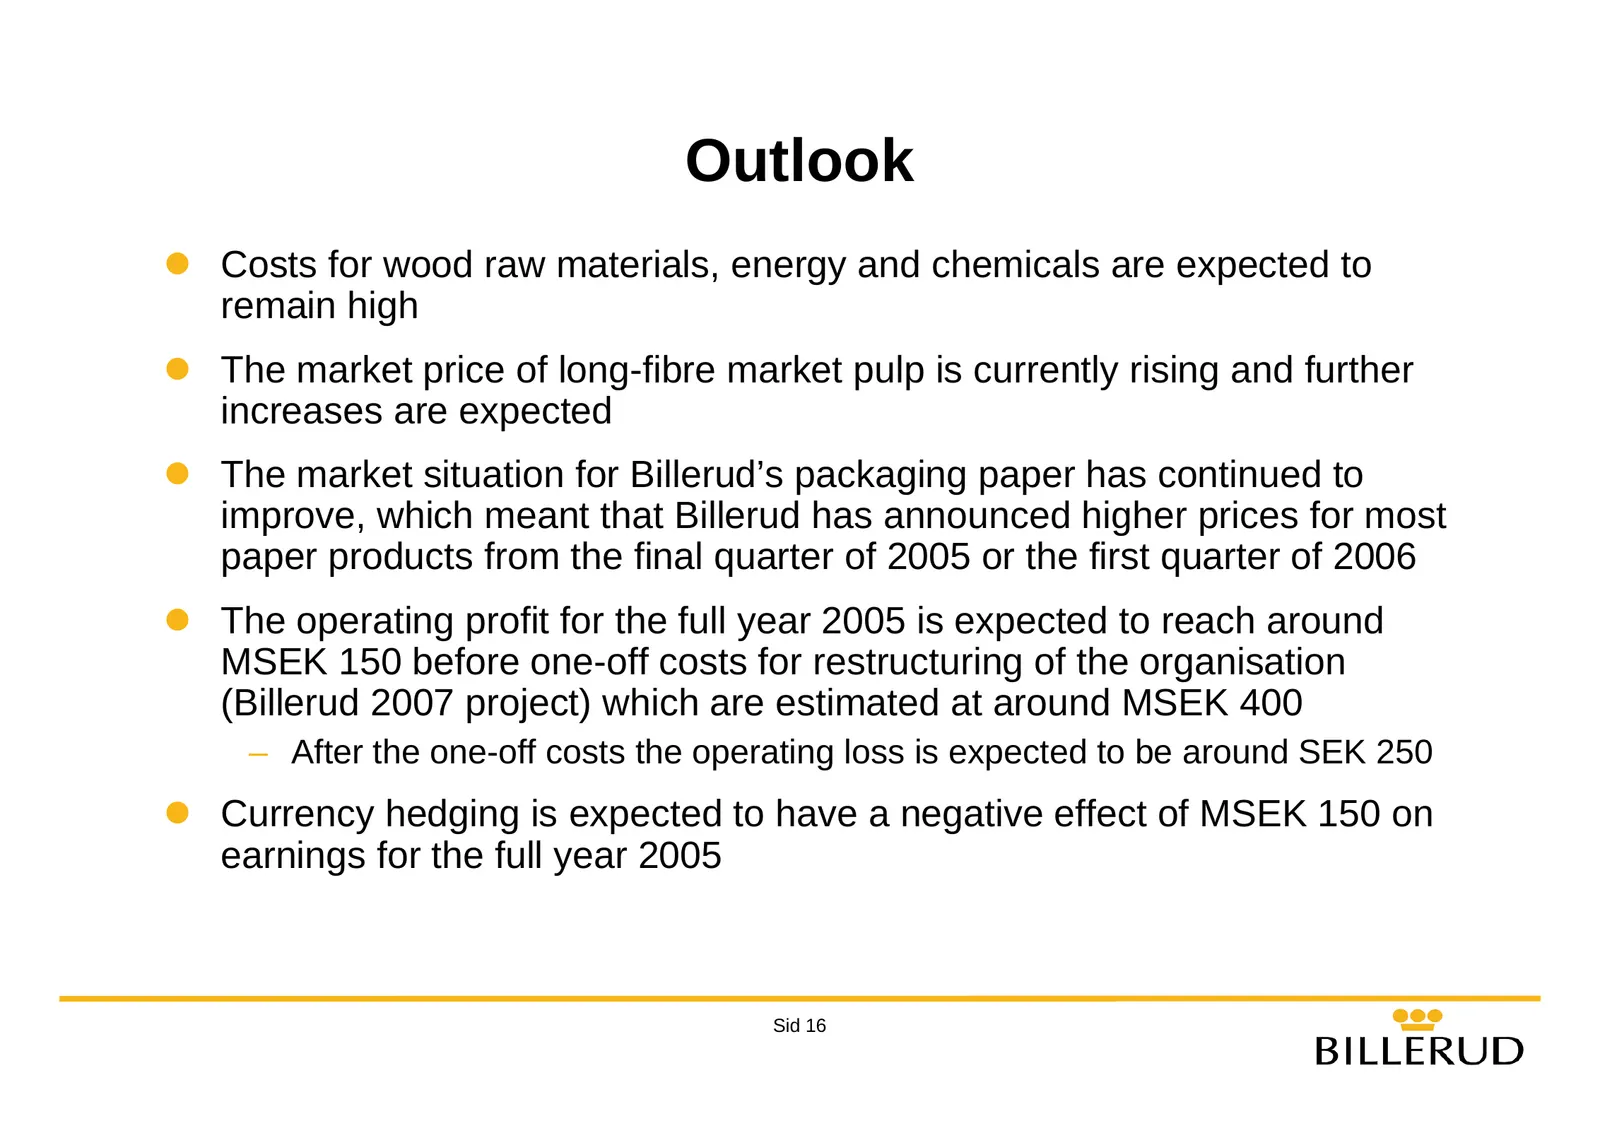
Outlook z Costs for wood raw materials, energy and chemicals are expected to remain high z The market price of long-fibre market pulp is currently rising and further increases are expected z The market situation for Billerud’s packaging paper has continued to improve, which meant that Billerud has a
Slide 17: Billerud January – September 2005
Billerud January – September 2005 Stockholm, November 9 Per Lindberg, CEO Nils Lindholm, CFO Sid 17
Slide 18: Appendix
- Appendix - BILLERUD Sid 18
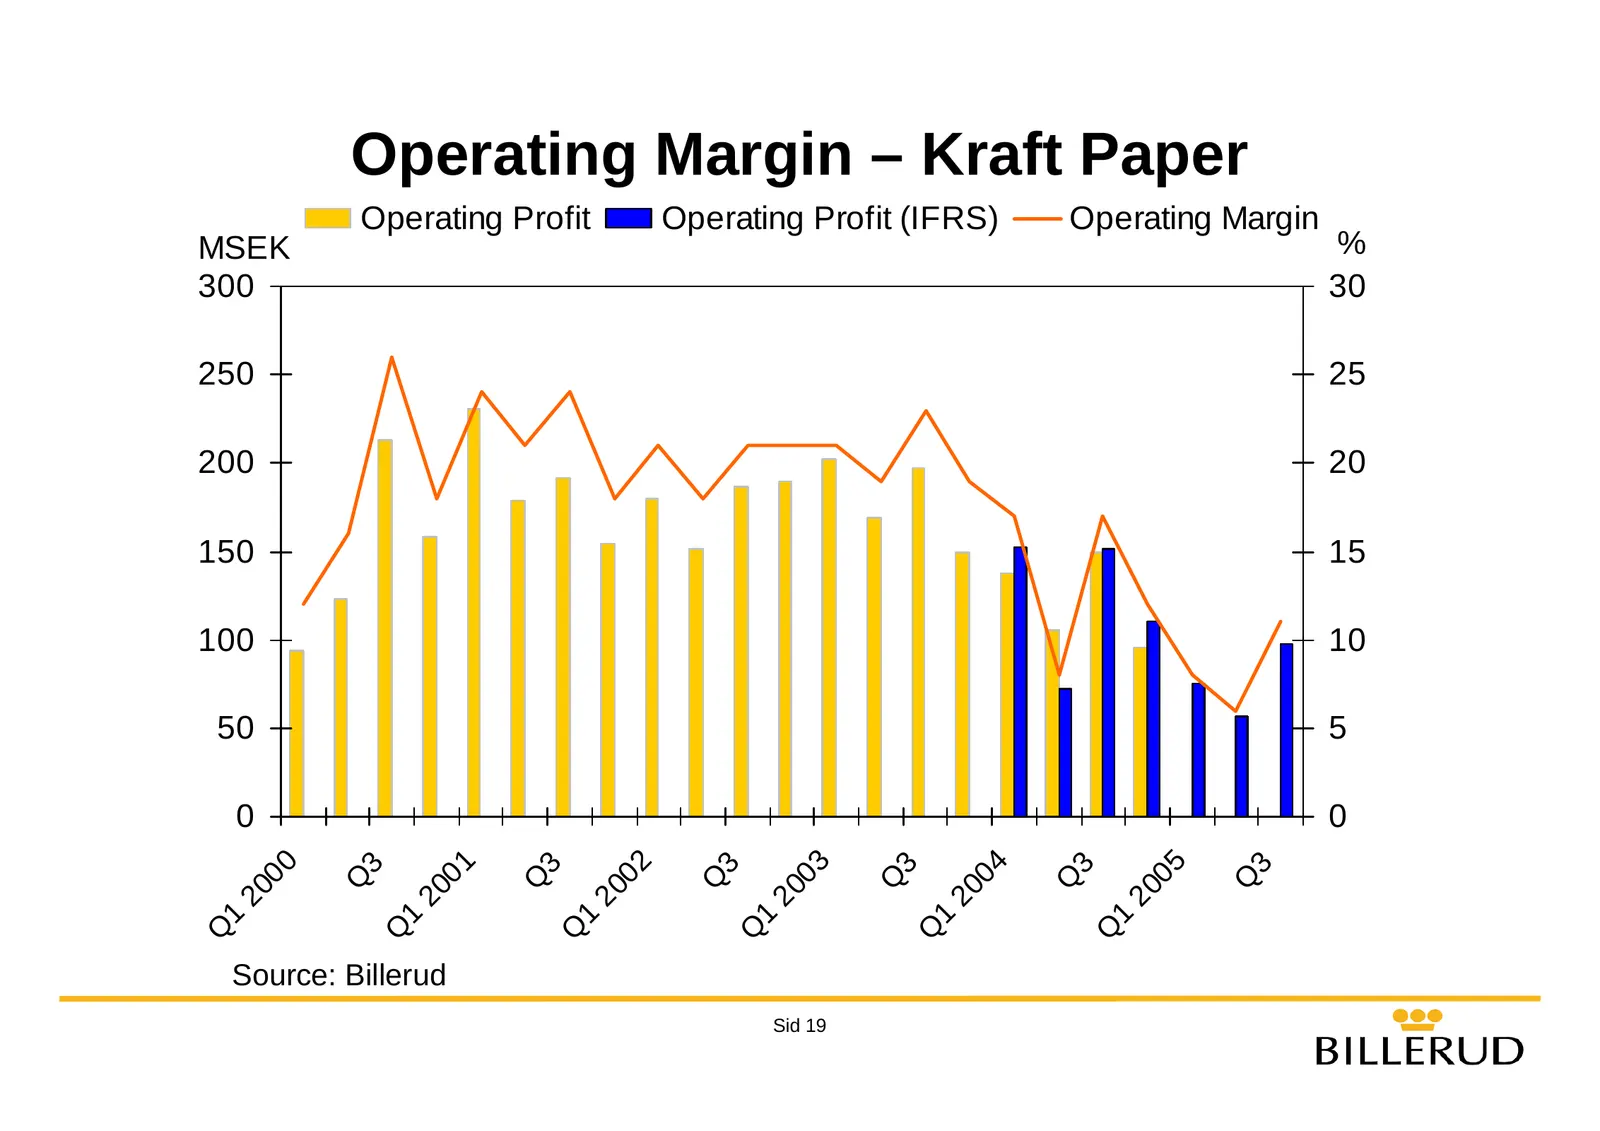
Slide 19: Operating Margin – Kraft Paper
Operating Margin – Kraft Paper Operating Profit Operating Profit (IFRS) Operating Margin MSEK % 300 30 250 25 200 20 150 15 100 10 50 5 0 0 00 01 02 03 04 05 3 3 3 3 3 3 Q Q Q Q Q Q 20 20 20 20 20 20 1 1 1 1 1 1 Q Q Q Q Q Q Source: Billerud Sid 19
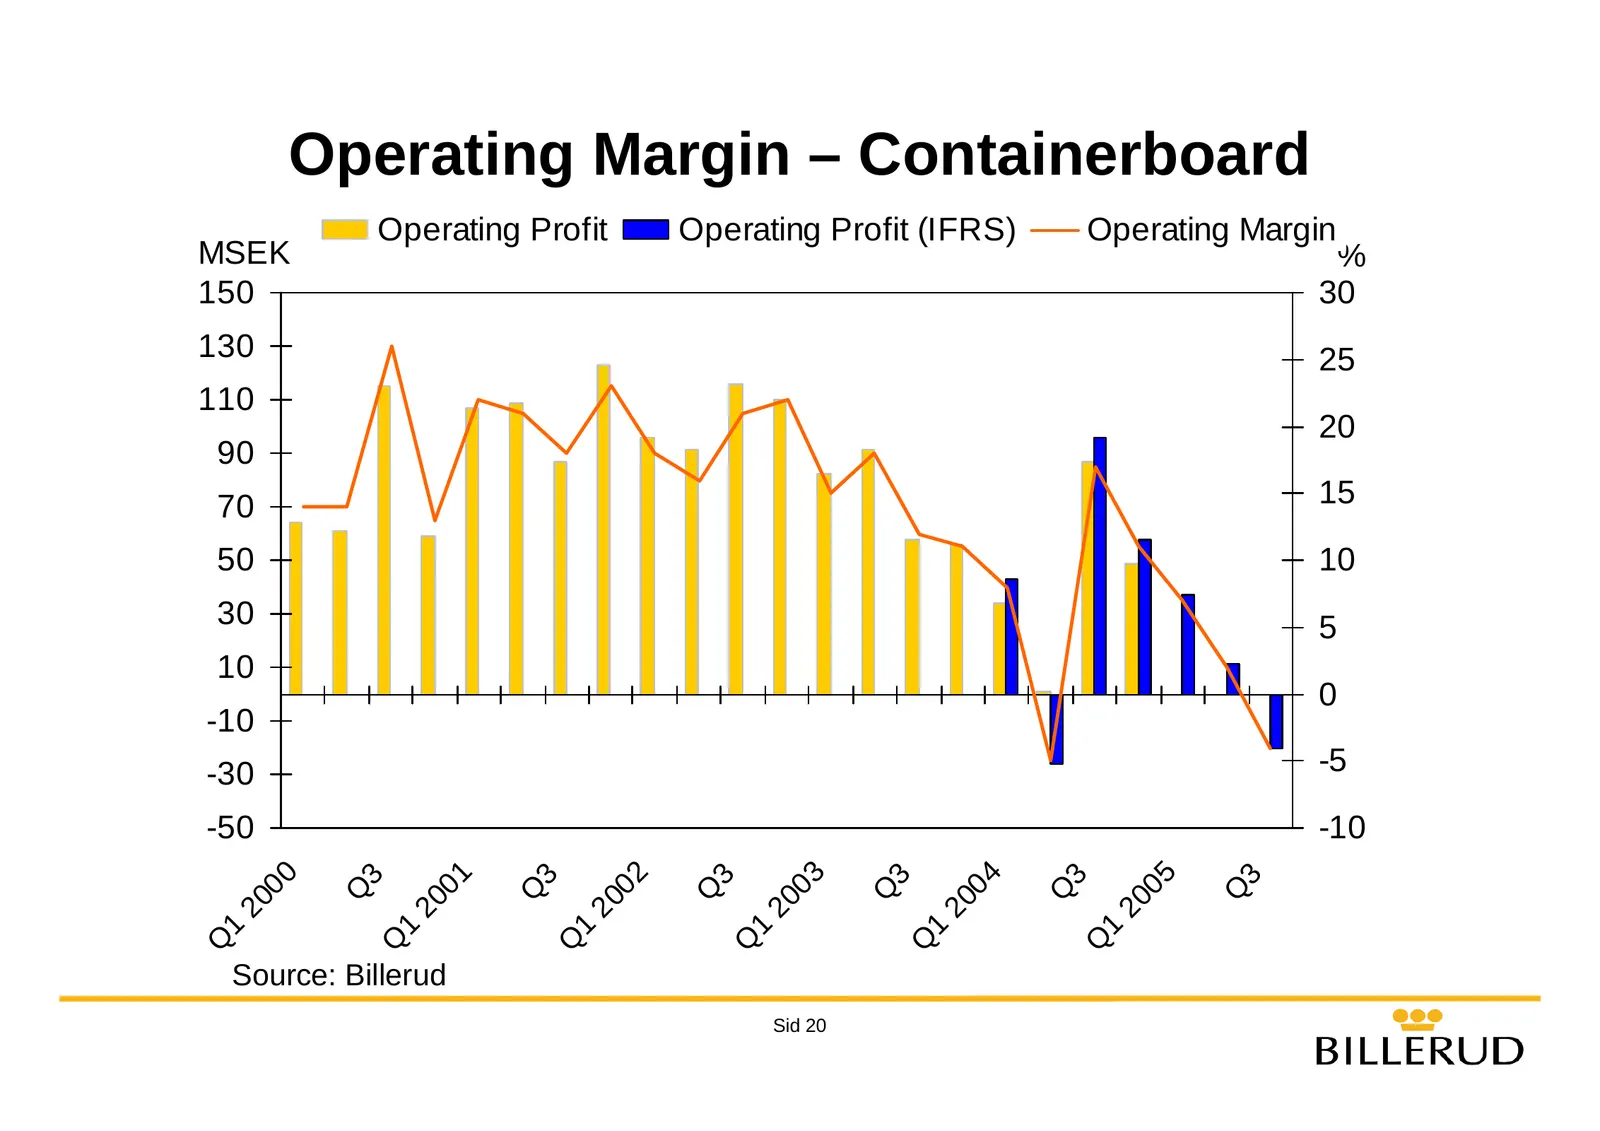
Slide 20: Operating Margin – Containerboard
Operating Margin – Containerboard Operating Profit Operating Profit (IFRS) Operating Margin MSEK % 150 30 130 25 110 20 90 70 15 50 10 30 5 10 0 -10 -30 -5 -50 -10 00 01 02 03 04 05 3 3 3 3 3 3 Q Q Q Q Q Q 20 20 20 20 20 20 1 1 1 1 1 1 Q Q Q Q Q Q Source: Billerud Sid 20
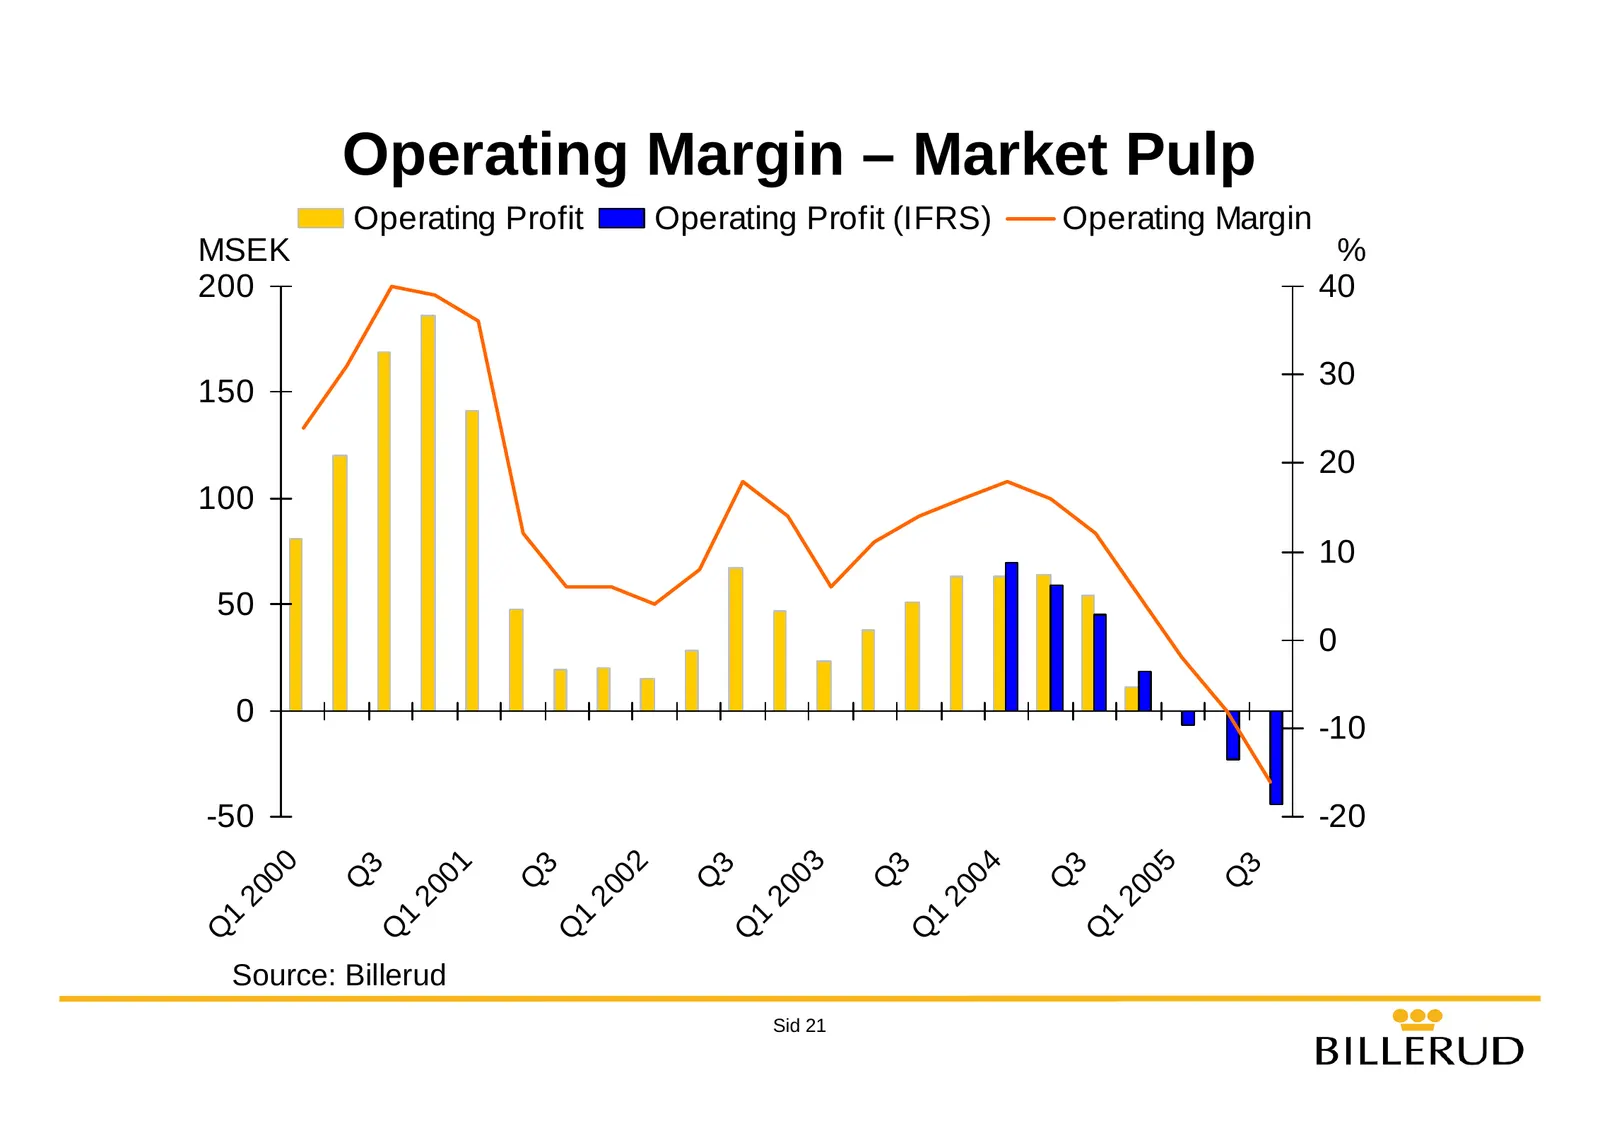
Slide 21: Operating Margin – Market Pulp
Operating Margin – Market Pulp Operating Profit Operating Profit (IFRS) Operating Margin MSEK % 200 40 30 150 20 100 10 50 0 0 -10 -50 -20 00 01 02 03 04 05 3 3 3 3 3 3 Q Q Q Q Q Q 20 20 20 20 20 20 1 1 1 1 1 1 Q Q Q Q Q Q Source: Billerud Sid 21
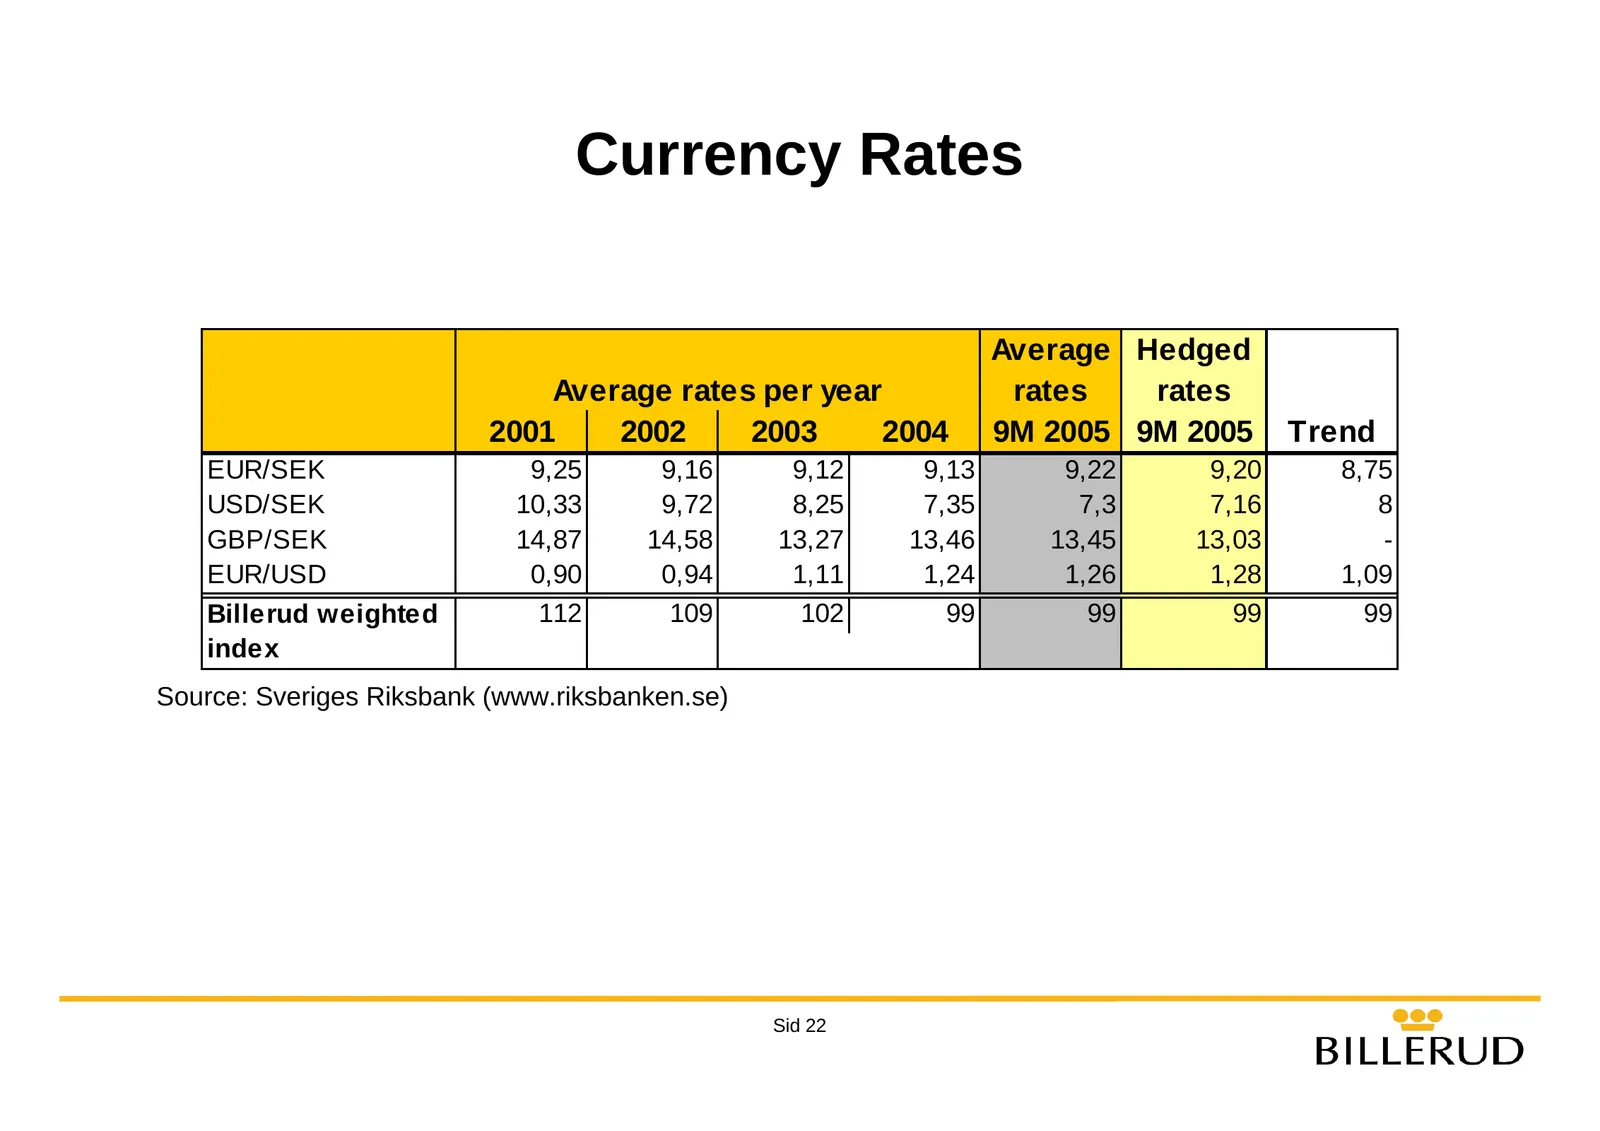
Slide 22: Currency Rates
Currency Rates Average Hedged Average rates per year rates rates 2001 2002 2003 2004 9M 2005 9M 2005 Trend EUR/SEK 9,25 9,16 9,12 9,13 9,22 9,20 8,75 USD/SEK 10,33 9,72 8,25 7,35 7,3 7,16 8 GBP/SEK 14,87 14,58 13,27 13,46 13,45 13,03 - EUR/USD 0,90 0,94 1,11 1,24 1,26 1,28 1,09 Billerud weighted 112
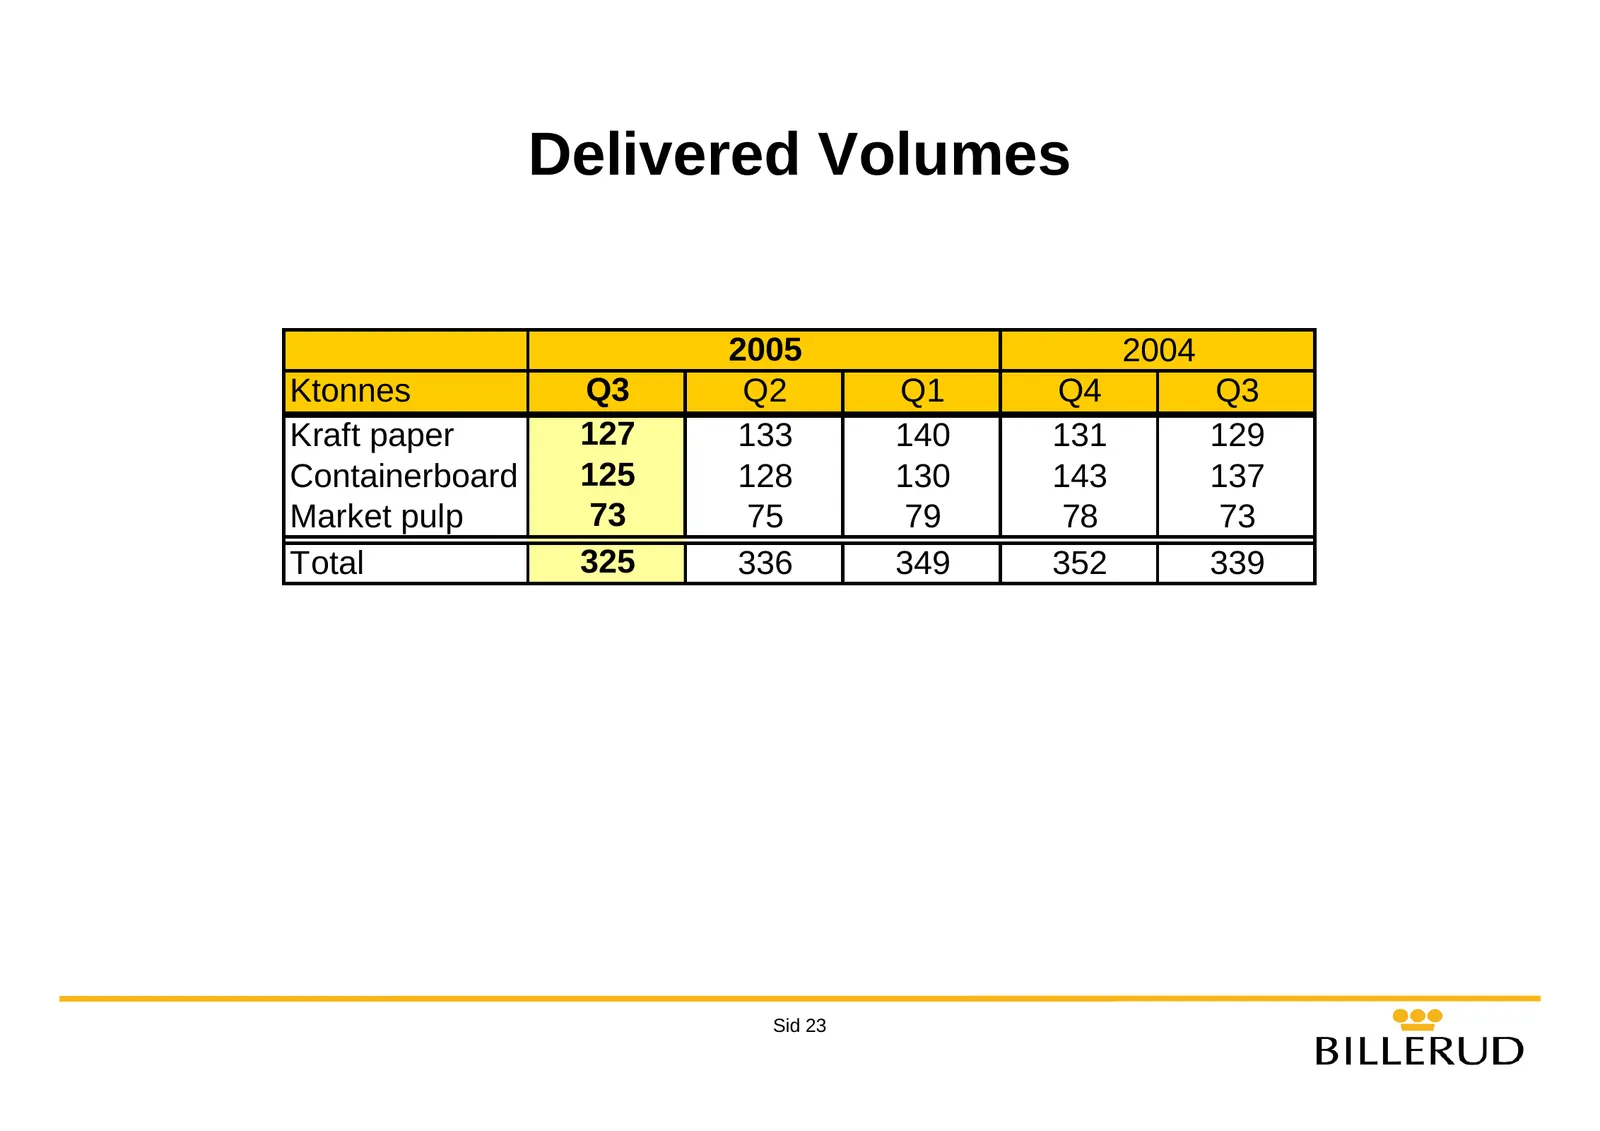
Slide 23: Delivered Volumes
Delivered Volumes 2005 2004 Ktonnes Q3 Q2 Q1 Q4 Q3 Kraft paper 127 133 140 131 129 Containerboard 125 128 130 143 137 Market pulp 73 75 79 78 73 Total 325 336 349 352 339 Sid 23
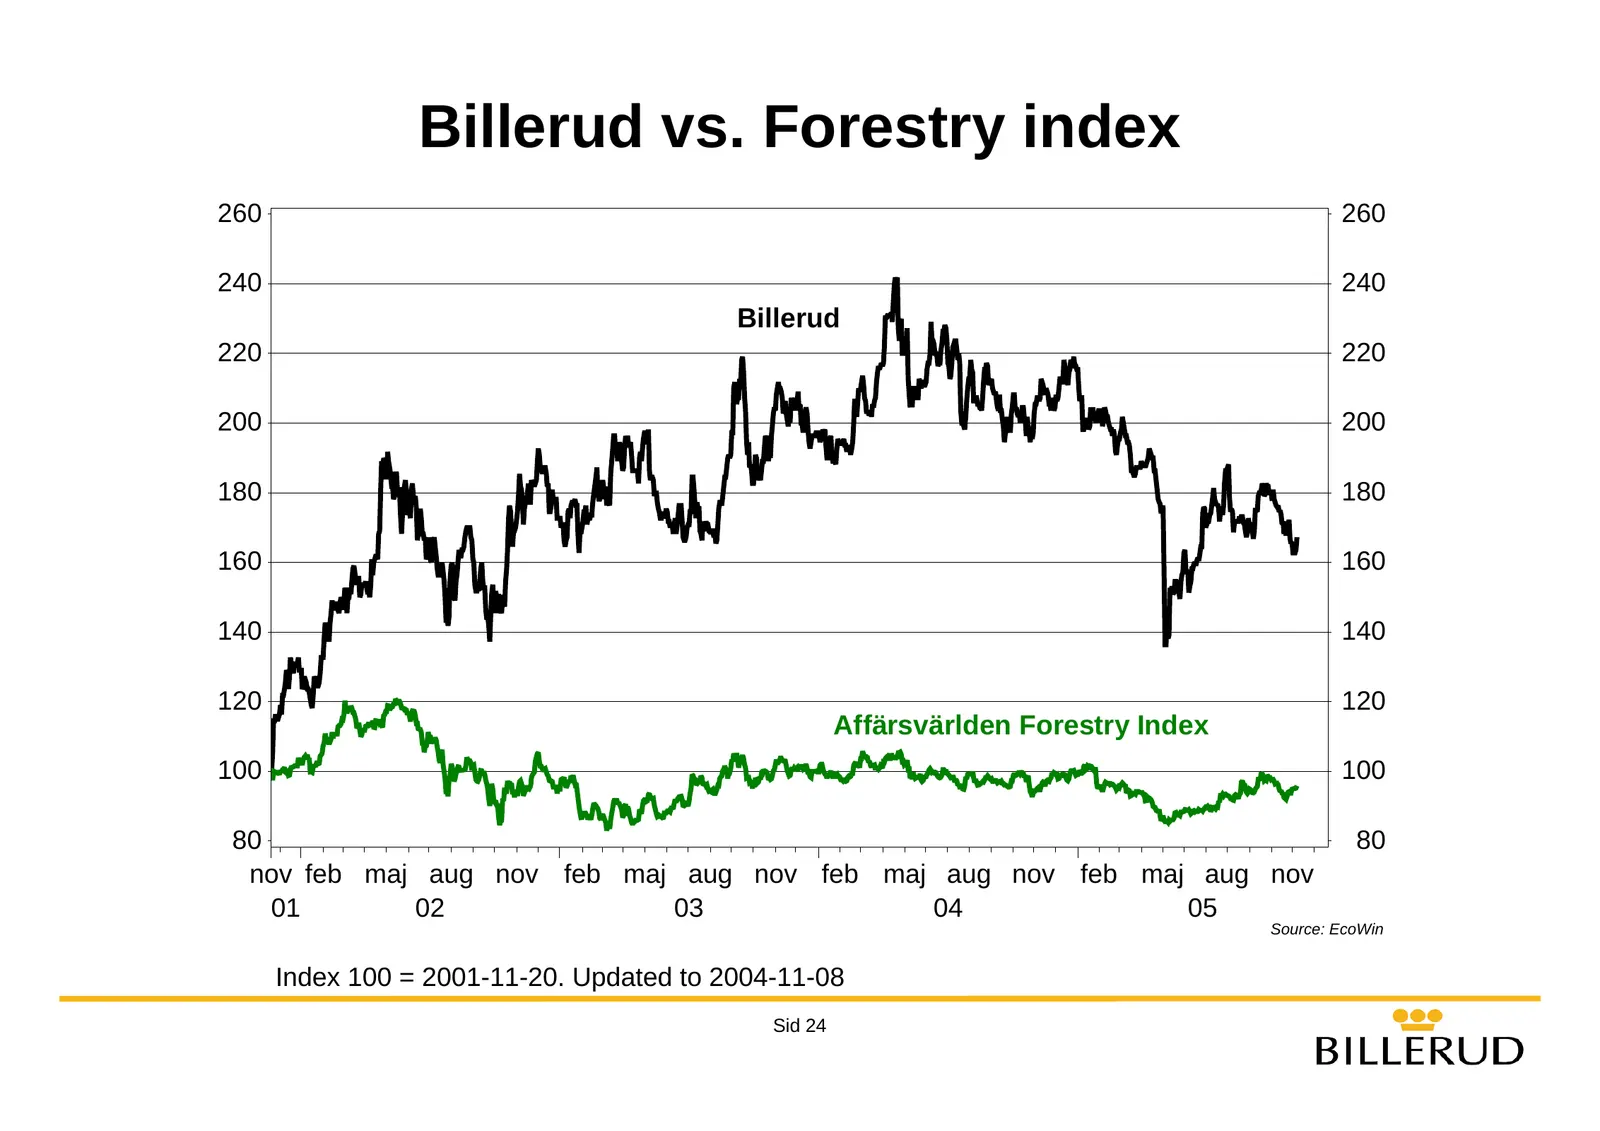
Slide 24: Billerud vs. Forestry index
Billerud vs. Forestry index 260 260 240 240 Billerud 220 220 200 200 180 180 160 160 140 140 120 120 Affärsvärlden Forestry Index 100 100 80 80 nov feb maj aug nov feb maj aug nov feb maj aug nov feb maj aug nov 01 02 03 04 05 Source: EcoWin Index 100 = 2001-11-20. Updated to 2004-11-08 Sid 24
Source: Internet Archive copy of billerud.se
More decks from Billerud AB
 Q3 2026 Earnings Presentation16 slides · Oct 22, 2026
 Q2 2026 Earnings Presentation17 slides · Jul 17, 2026
 Q1 2026 Earnings Presentation17 slides · Apr 28, 2026
 Q4 2025 Earnings Presentation21 slides · Jan 30, 2026
 DNB Carnegie Nordic Forest Conference 202515 slides · Nov 12, 2025
 Q3 2025 Earnings Presentation18 slides · Oct 23, 2025