Premier Financial — First Defiance Financial — Shareholder Meeting (April 2008)
39 slides from Premier Financial's shareholder meeting presentation, Apr 28, 2008
Slide 1: Annual Meeting of Shareholders
Annual Meeting of Shareholders April 22, 2008

Slide 2: Safe Harbor and Regulation FD Statement
Safe Harbor and Regulation FD Statement Statements contained in this presentation which are not historical facts are forward-looking statements as defined in the Private Securities Litigation Act of 1995. Such forward-looking statements are subject to risks and uncertainties which could cause actual

Slide 3: First Defiance Financial Corp. Company Profile
First Defiance Financial Corp. Company Profile Our unwavering focus for over 90 years: Community Financial Services Consolidated Assets of $1.89 billion at 3/31/08 First Federal Bank of the Midwest: 36 banking centers in 15 counties; 45 ATM locations Wealth Management and Trust Services First Insura

Slide 4: Why First Defiance is Strong, Stable and Growing
Why First Defiance is Strong, Stable and Growing A Community Banking Model that is tested and proven Values: Customer First Trusted Advisors Local decision-making Increasing the value of our company
Slide 5: A Look Back: '02 Leader Mortgage Sale
Why First Defiance is Strong, Stable and Growing A Look Back: ’02 Leader Mortgage Sale The Plan: Effective Utilization of Capital, Managing for the Long-Term The Results: 36 offices in 15 counties 2.2x Assets 576 Employees New Markets Shareholder Value Largest Community Bank in region Positioned for

Slide 6: Recognizing and Capitalizing on Opportunities
Why First Defiance is Strong, Stable and Growing Recognizing and Capitalizing on Opportunities: Acquisitions De novo branching Targeted products and services: Remote Deposit—136 customers CDARS—Nationally ranked Commercial and Non-Residential Real Estate Loans at $1.1 billion

Slide 7: 2007 Highlights
In 2007: Opened new office on Coldwater Road in Fort Wayne Acquired HHWS Insurance Agency Announced Pavilion Bancorp Acquisition Why First Defiance is Strong, Stable and Growing

Slide 8: Growth in deposits and commercial loans
14% growth in non-interest bearing deposits $50.2 million growth in commercial loans Steady mortgage volume despite economy New Operations Center Why First Defiance is Strong, Stable and Growing
Slide 9: First Federal Bank's New Market
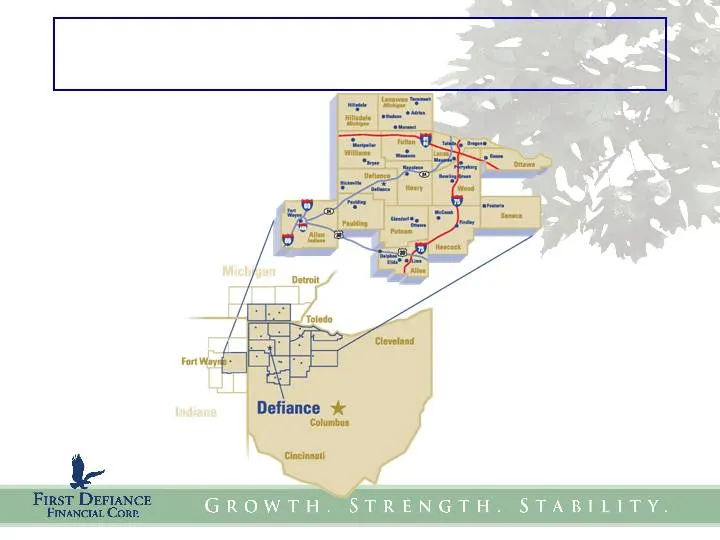
First Federal Bank’s New Market

Slide 10: Financial Highlights
Financial Highlights (in millions, except per share amounts) 0.97% 0.95% 1.04% 0.90% Core Return on assets 9.08% 9.15% 10.03% 8.48% Core Return on equity $0.50 $0.54 $2.18 $1.94 Core Net Income per share $3.61 $3.91 $15.60 $13.90 Core Net Income $11.98 $13.59 $49.02 $48.66 Net Interest Income 2007 2
Slide 11: Commercial Loans
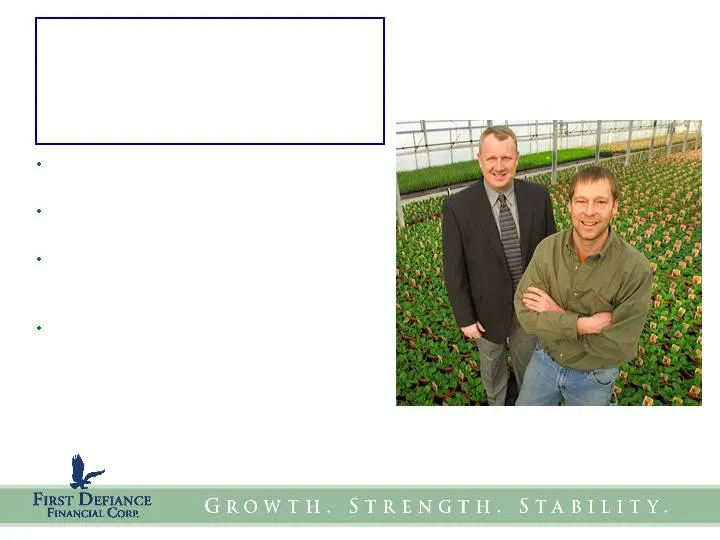
Commercial Loans $50.2 million in commercial loan growth= 21.5% in ‘07 Strong small business environment not tied to subprime Able to make loans up to $25.6 million; general internal limit is $10 million Credit Quality Tim Harris, EVP, Eastern Market President of First Federal Bank meets with custom
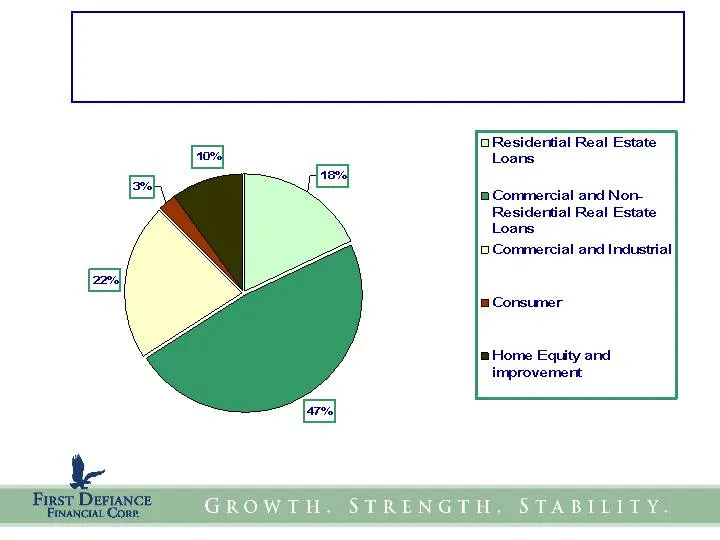
Slide 12: Residential Real Estate Loans
10% DResidertial Real Estate Loans EA cr a7°4 GROWTH, a Commercial and Non Residential Real Estate Loans improvement STRENGTH. STABILITY.
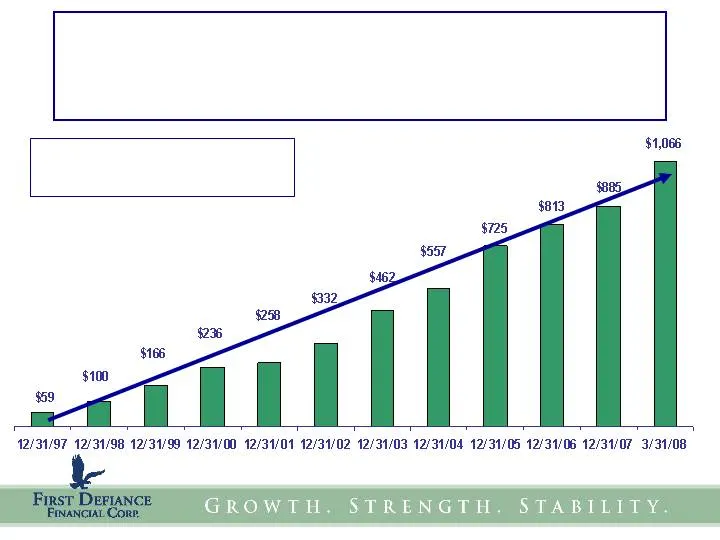
Slide 13: Commercial & Commercial Real Estate Loan Balances
Commercial & Commercial Real Estate Loan Balances (in $000s) CAGR = 28.4% (excluding acquisitions)
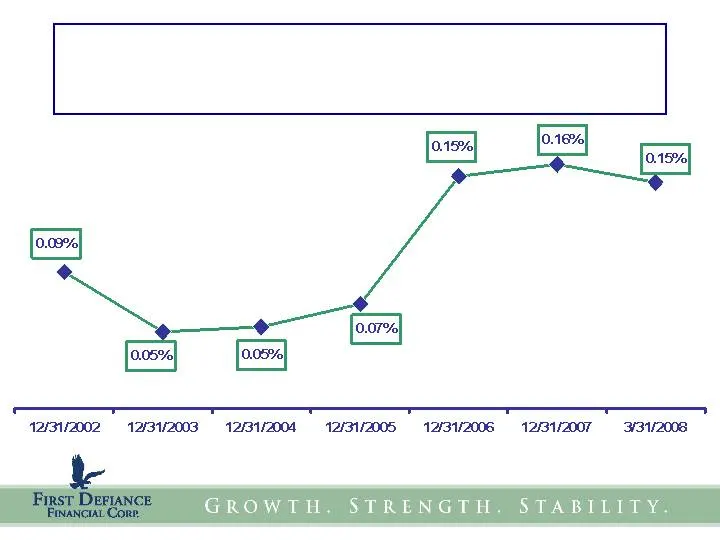
Slide 14: Net Charge-Offs
Net Charge-Offs (as a percent of average loans)
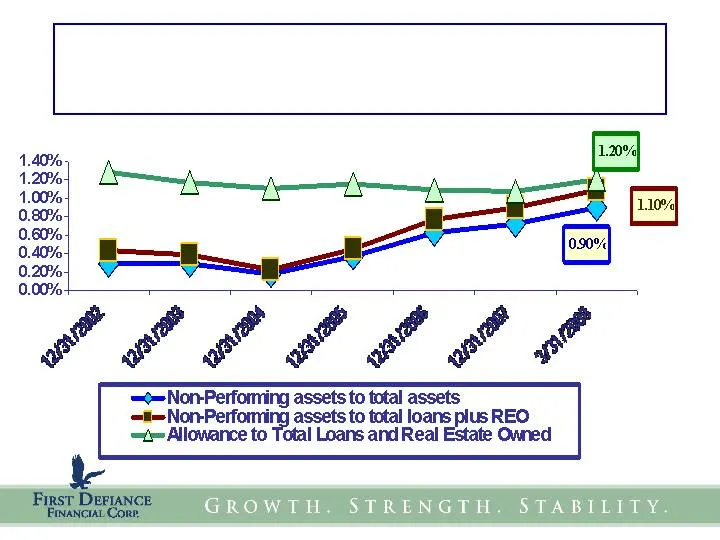
Slide 15: Allowance and Non-Performing Assets
1.40%. 1.20% 1.00%. 0.80%. 0.60% 0.40%. 0.20%. 0.00%. == Allowance to GRO assets to total lo: ‘otal Loans and Real TRENGTH SLLSS LS == Non-Perfoiming assets to total assets == Non-Perfomii TABILIT
Slide 16: Allowance to Non-Performings
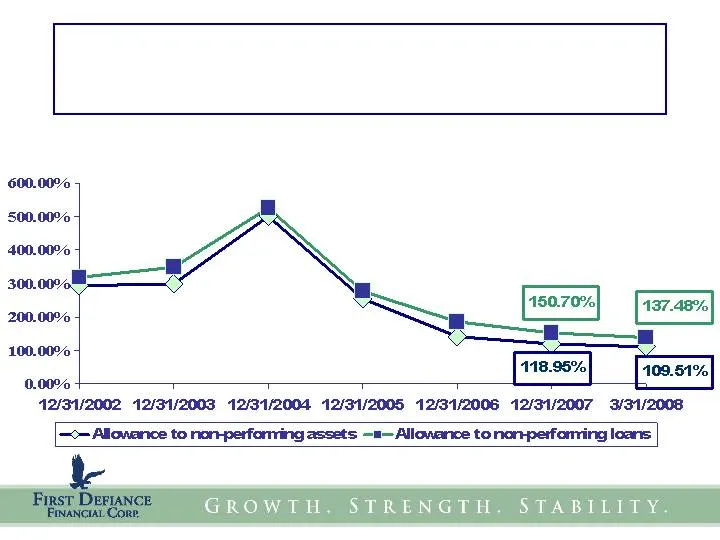
Allowance to Non-Performings

Slide 17: Credit Quality Factors
Credit Quality Factors We know our customers: in-market lending Solid underwriting standards Credit Administration infrastructure active throughout the loan process Asset Review Committee assures on-going monitoring

Slide 18: Mortgage Banking
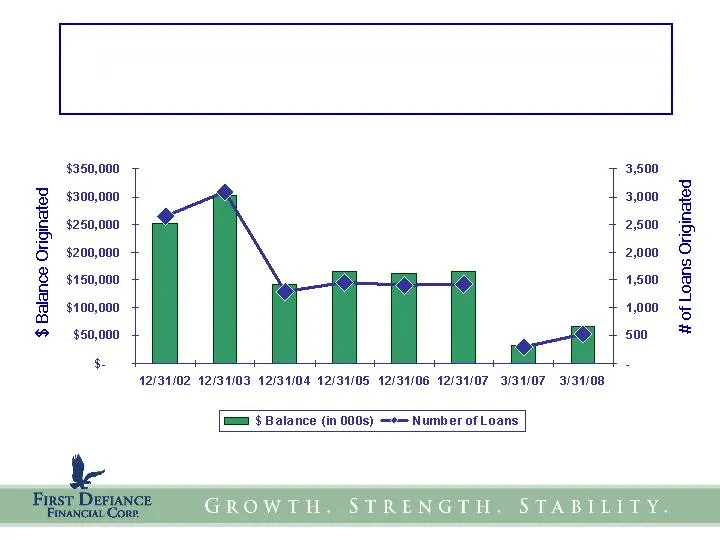
Mortgage Banking Jennifer Moenter discusses her home building project with Cindy Metzger, branch manager of First Federal Bank in Delphos. $65.8 million in mortgage originations 517 mortgages in 1 st quarter 2008, a 55% increase from 2007 Never involved in sub-prime lending Leading originator in reg
Slide 19: Mortgage originations chart
$350,000 3,500 3 3 $300,000 3000 2 a e & $250,000 2500 = = 6 $200,000 2,000 a g $160,000 1900 & ~ ‘@ $100,000 1,000 = & 5 rs > $60,000 Pa | 500 12/34/02 12/34/03 12/34/04 12/31/05 12/34/08 12/31/07 3/34/07 3/31/08 T= $ Balance (in 000s) —*— Number of Loans GROWTH. STRENGTH. STABILITY.
Slide 20: Loans serviced chart
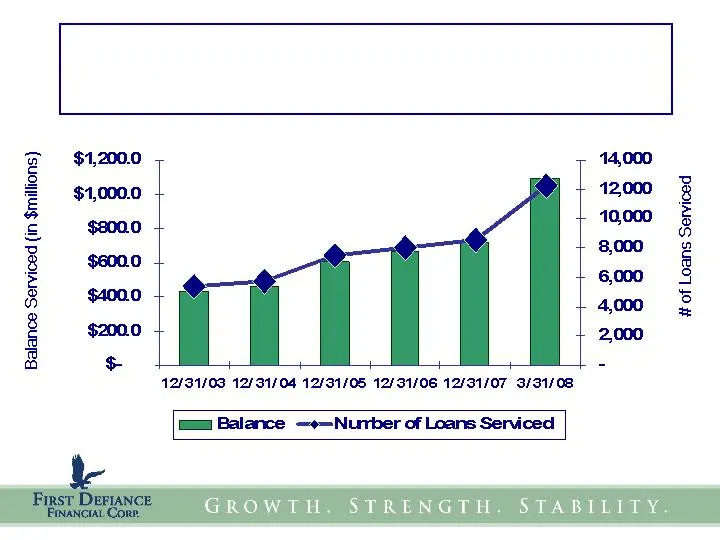
$1,200.0 14,000 2 $1,000 12,000 3 2 $2000 “ & C g $600.0 S 5 : 6000 & 5 — s4o00 on 2 sa00 2,000 & & 12/31/08 12/31/04 12/31/05 12/31/06 12/31/07 3/31/08 am Balance —e—Number of Loans Serviced GROWTH. STRENGTH. STABILITY.
Slide 21: Deposits
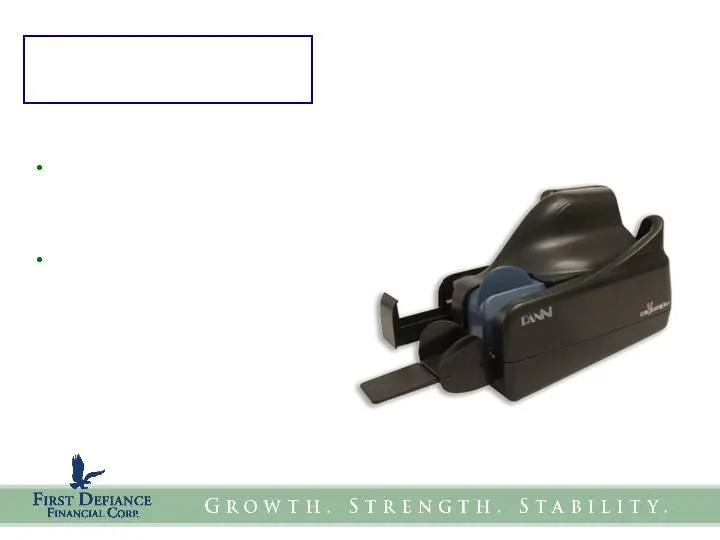
Deposits In 2007: Over 20,000 new retail deposit accounts opened 1,606 new commercial deposit customers joined First Federal Remote deposit scanner for businesses.
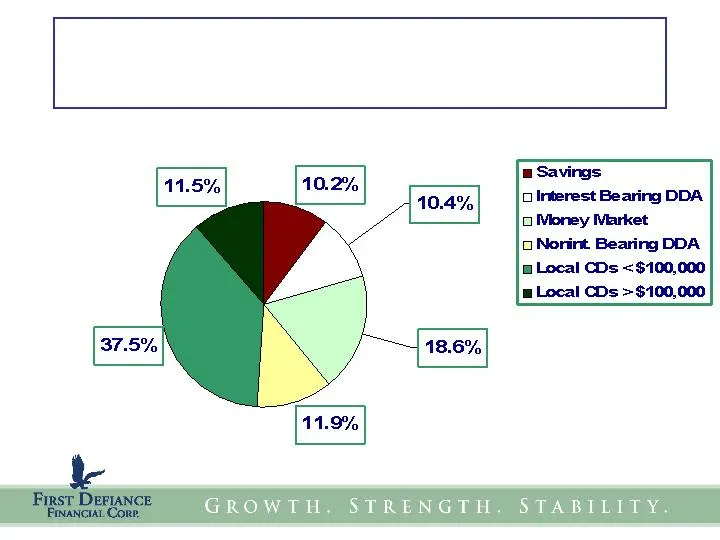
Slide 22: March 2008 Deposit Account Mix
March 2008 Deposit Account Mix (excludes brokered and national CDs)
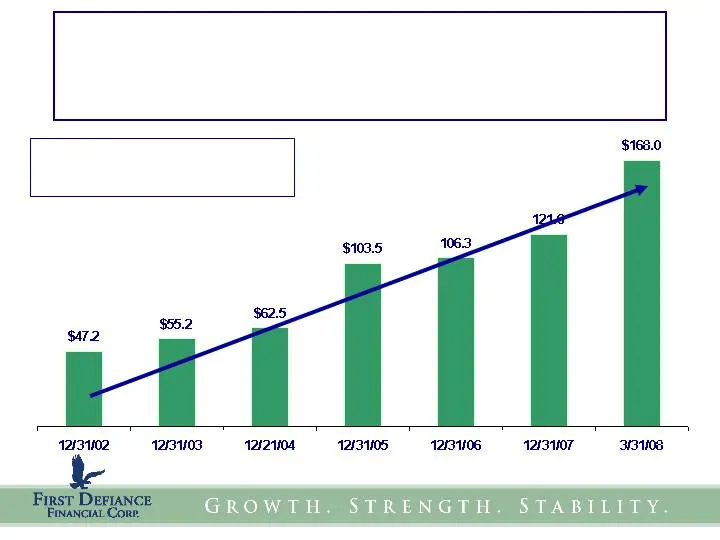
Slide 23: Non-Interest Bearing Deposits
Non-Interest Bearing Deposits (In 000s) CAGR = 12.9% (excluding acquisitions)
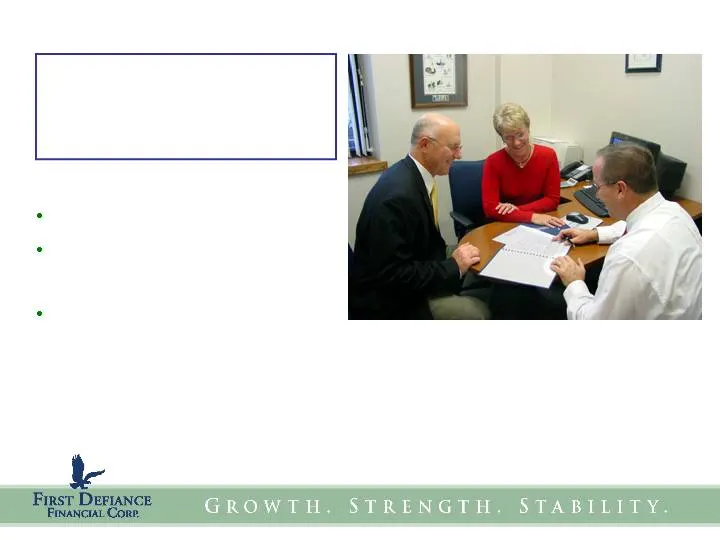
Slide 24: First Insurance & Investments
First Insurance & Investments Expanded market Strong growth in group health and life insurance Innovation required to grow in soft property and casualty market

Slide 25: Headquartered in Defiance
Headquartered in Defiance In 1998, acquired a property & casualty agency; in 1999, acquired an agency with strong group health and commercial lines; in 2007, acquired Bowling Green Ohio based property & casualty agency Growth strategy Increase sales opportunities Cross-sell services between First Fe

Slide 26: Insurance commission income growth
Commission income growth to $5.3 million in 2007 from $3.3 million in 2002. Health and Life revenue continues to grow at > 10% rate Effective management of relationships with Insurance Companies and good fortune with claims experience has resulted in significant improvements in “contingent” income $

Slide 27: Financial Results
Financial Results Net Interest Margin increased by 24 basis points in 2008 first quarter over 2007 fourth quarter Core EPS up 6% over 2007 first quarter Pavilion acquisition completed on March 14, 2008 and had only modest impact on 2008 first quarter
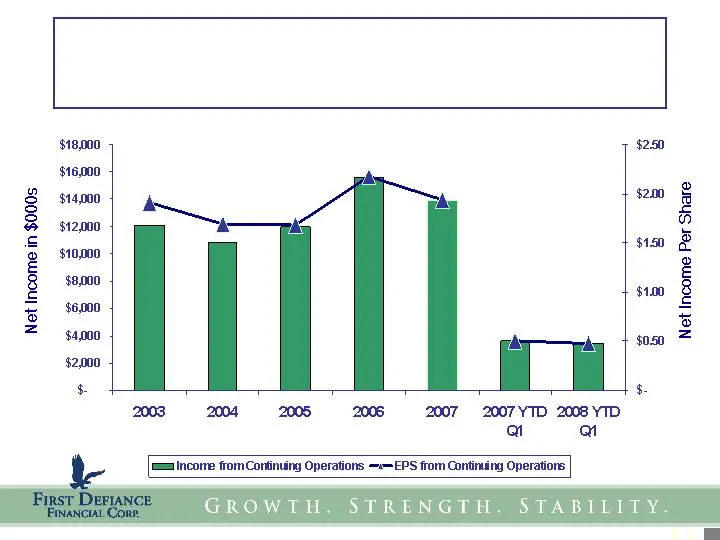
Slide 28: Net Income and Net Income Per Share
$1800 $250 $16,000 $14,000 s210 $12,000 $150 $8,000 Sina $6,000 $400 $050 $2,000 4 1s. 2003 2004 2005 2006 2007 = 2007 YTD 2008 YTD a an Net Income in $000s : Net Income Per Share. [EEtncome fom Consinany Operations —— EPS fom Contain Operators GROWTH. STRENGTH. STABILITY.
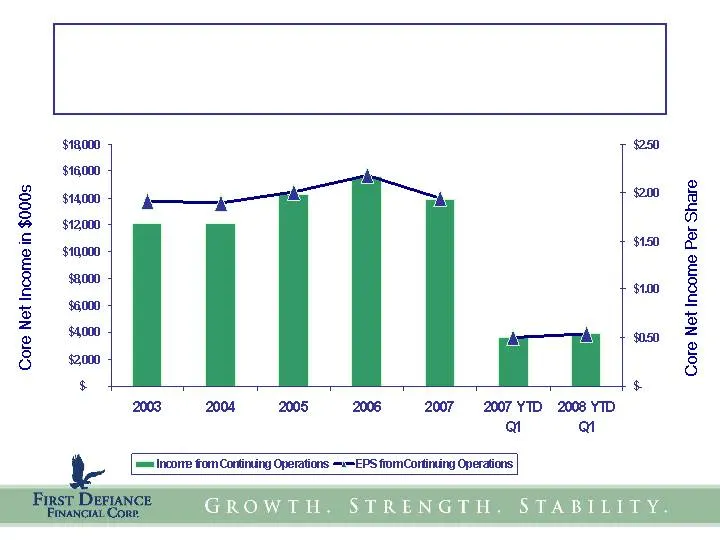
Slide 29: Net Income – Core Earnings
Net Income – Core Earnings (excludes one time charges related to settlement of contingent liability in 2004 and acquisition related charges in 2005 and 2008)
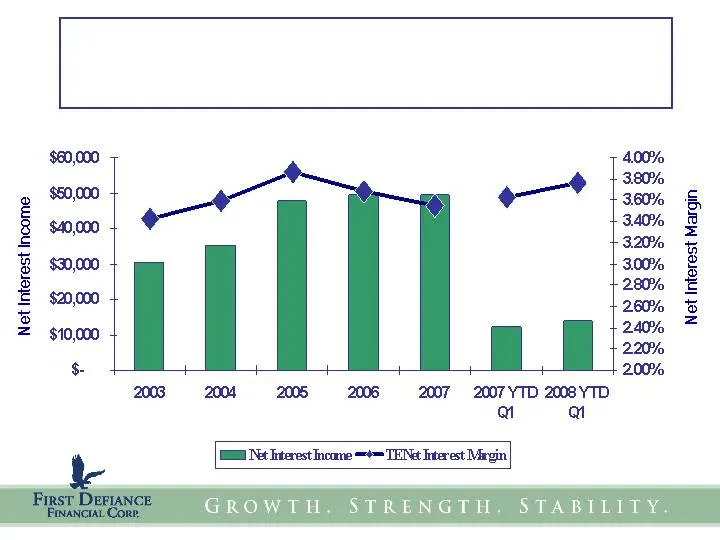
Slide 30: Net Interest Income
Net Interest Income (Tax Equivalent, Continuing Operations Dollars in thousands)
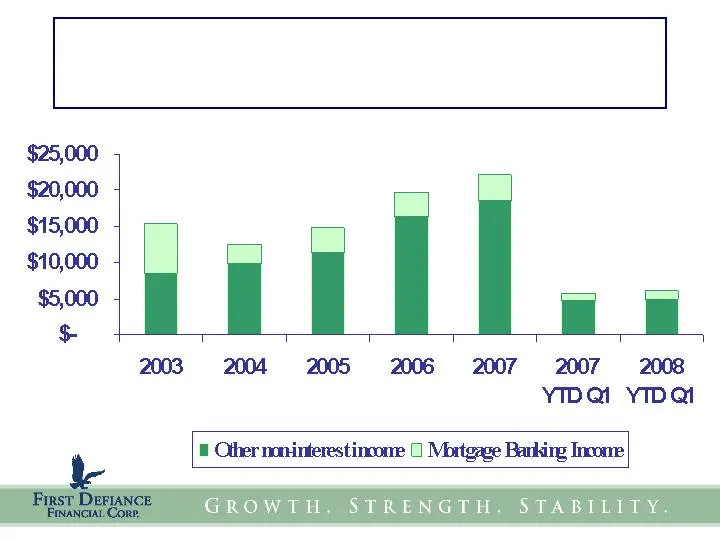
Slide 31: Non-Interest Income
Non-Interest Income (in $000s, excludes securities gains)
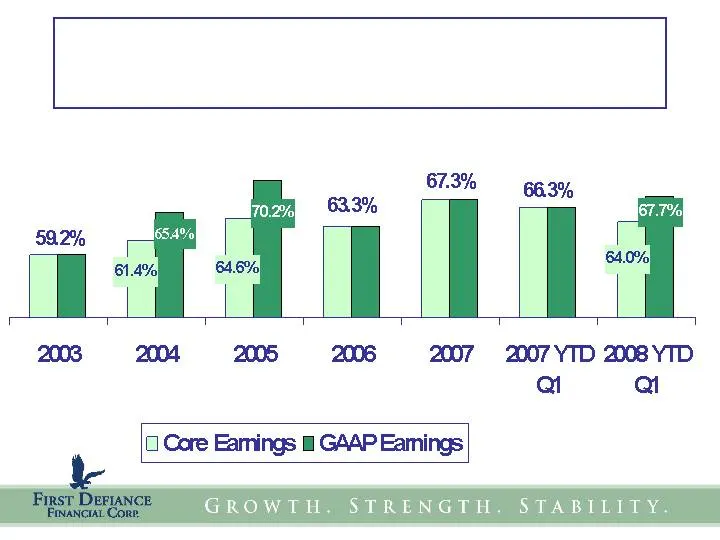
Slide 32: Core Earnings vs GAAP Earnings
| 1 4%) 2003 2004 2005 2006 2007 «= 2007 YTD 2008 YTD ai ai C Core Eamings 8 GAAP Eamings GROWTH RENGTH. TABILIT ¥

Slide 33: Pavilion Bancorp. Acquisition
Pavilion Bancorp. Acquisition Purchase price of $28 million in cash and 1,039,000 shares of First Defiance stock Value of $55.2 million using October 2, 2007 stock price. Using March 14 stock price, value is $48.2 million Increased assets by $285 million, net; loans by $231 million and deposits by $

Slide 34: Capital Management Initiatives
Capital Management Initiatives Bank Debt Increased Bank Debt by $20 million to fund Pavilion acquisition Trust Preferred Securities Issued $15 million on 3/30/2007 fixed for 5 years at 6.441%, 90-day LIBOR + 150 bps after that. Issued $20 million on 10/28/05 at 90- day LIBOR + 138 bps Cash Dividends
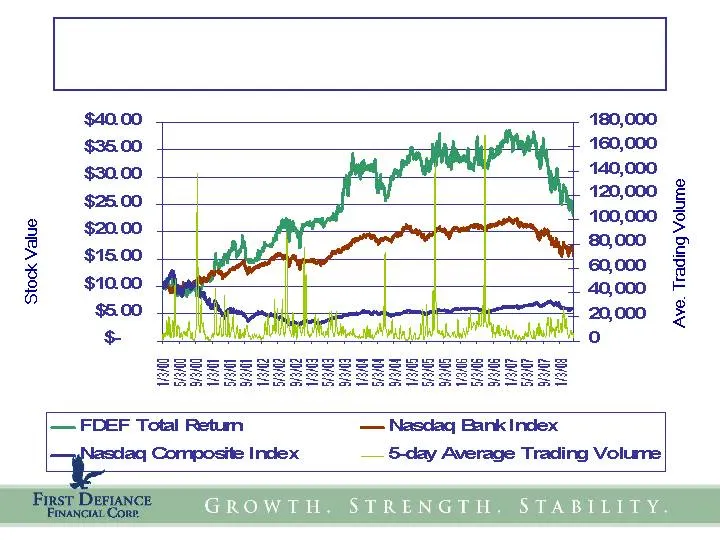
Slide 35: FDEF Total Return vs Indexes
$40.00 480,000 $3600 4 + 160,000 $30.00 140,000 $25.00 | 420,000 Q 2 100,000 3 g $2000 sats | 3 = $16.00 & 5 enc00 g $10.00 | 40,000 $6.00 | 20,000 2 _— FDEF Total Retum — Nasdaq Bank Index Jaq Composite Index — 8-day Average Trading Volume GROWTH. STRENGTH. STABILITY.
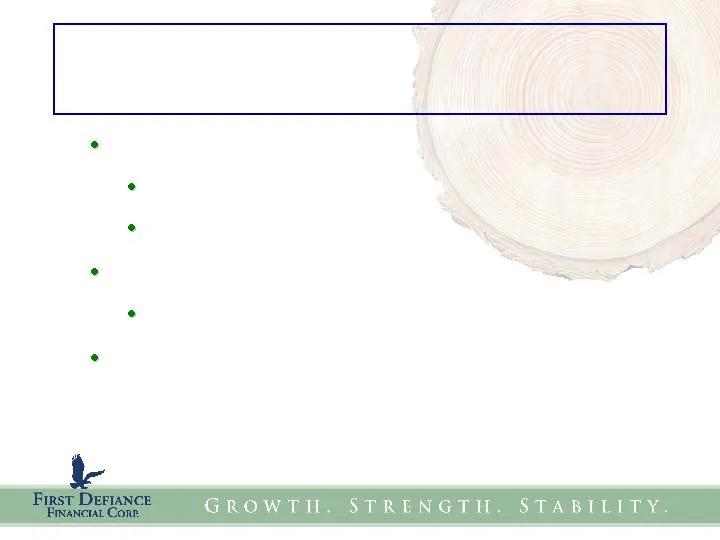
Slide 36: Stock Performance
Stock Performance Industry Bias Mortgage concerns Fear Geographic Bias Market Concern Buying Opportunity with Dividend Yield

Slide 37: Growth. Strength. Stability. 2008 Focus
Growth. Strength. Stability. 2008 Focus: Integrate new offices Good to Great Initiative Enhance Trusted Advisor services Private Banking Deposit Growth Strategies Wealth Management Services

Slide 38: A Clear Vision for the Future
Growth. Strength. Stability. A Clear Vision for the Future Based on our Core Values Outstanding Team in Place Well Prepared and Well Positioned

Slide 39: ale
ale a First’ DEFIANCE Financaat. Corr
Source: SEC EDGAR · 8-K filed Apr 28, 2008
More decks from Premier Financial Corp
 Investor Presentation (February 2025)51 slides · Feb 10, 2025
 Q4 2024 Earnings Presentation23 slides · Jan 22, 2025
 Q3 2024 Earnings Presentation50 slides · Nov 6, 2024
 Q3 2024 Earnings Presentation22 slides · Oct 23, 2024
 Investor Presentation (August 2024)54 slides · Aug 30, 2024
 Merger or Acquisition (July 2024)39 slides · Jul 26, 2024