AMOREPACIFIC Holdings Corp. · KRX:002790
AMOREPACIFIC — FY2017 Earnings Presentation
7 slides from AMOREPACIFIC's earnings presentation, 2018
Slide 1: AMOREPACIFIC GROUP 2017 Earnings Release
AMOREPACIFIC GROUP 2017 Earnings Release 1 2017 Earnings Summary 2 Earnings by Subsidiary 3 4Q 2017 Earnings by Subsidiary 4 Financial Summary As a note, it is suggested to use this material only as a reference, as it contains information and data that are subject to changes without prior notice due
Slide 2: 2017 Earnings Summary
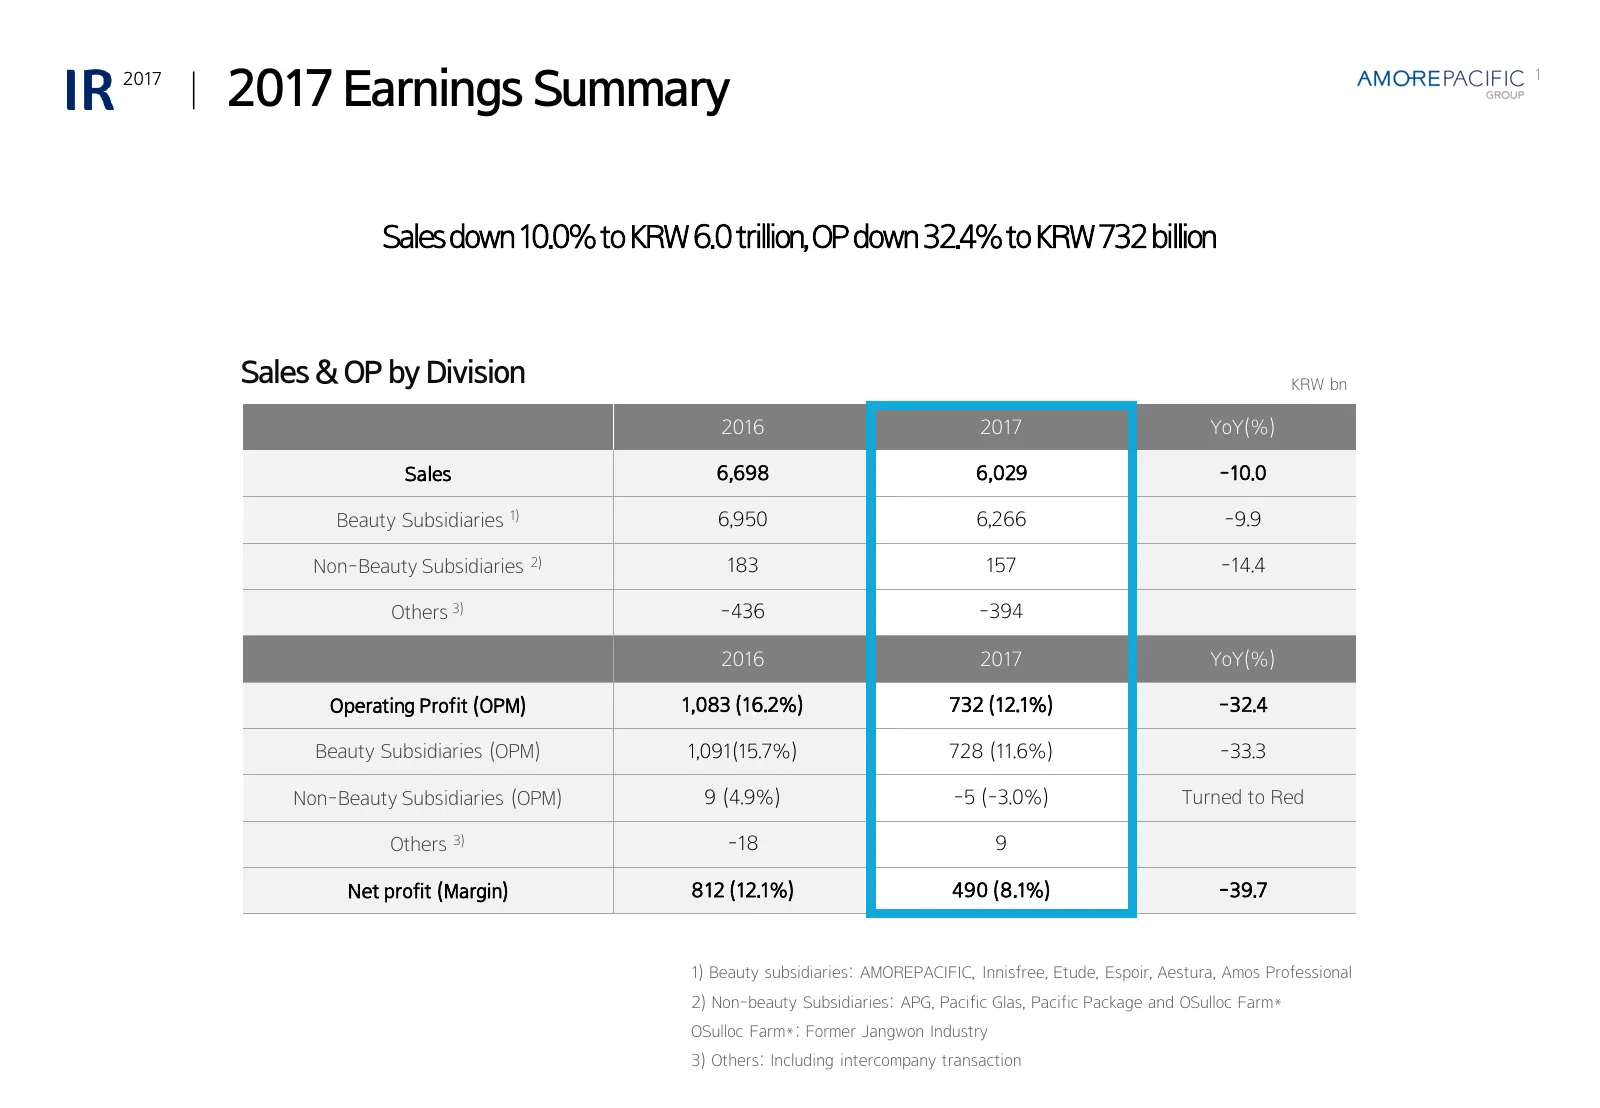
ㅣ 2017 Earnings Summary 2017 1 Sales down 10.0% to KRW 6.0 trillion, OP down 32.4% to KRW 732 billion Sales & OP by Division KRW bn 2016 2017 YoY(%) Sales 6,698 6,029 -10.0 Beauty Subsidiaries 1) 6,950 6,266 -9.9 Non-Beauty Subsidiaries 2) 183 157 -14.4 Others 3) -436 -394 2016 2017 YoY(%) Operating
Slide 3: Earnings by Subsidiary (1/3)
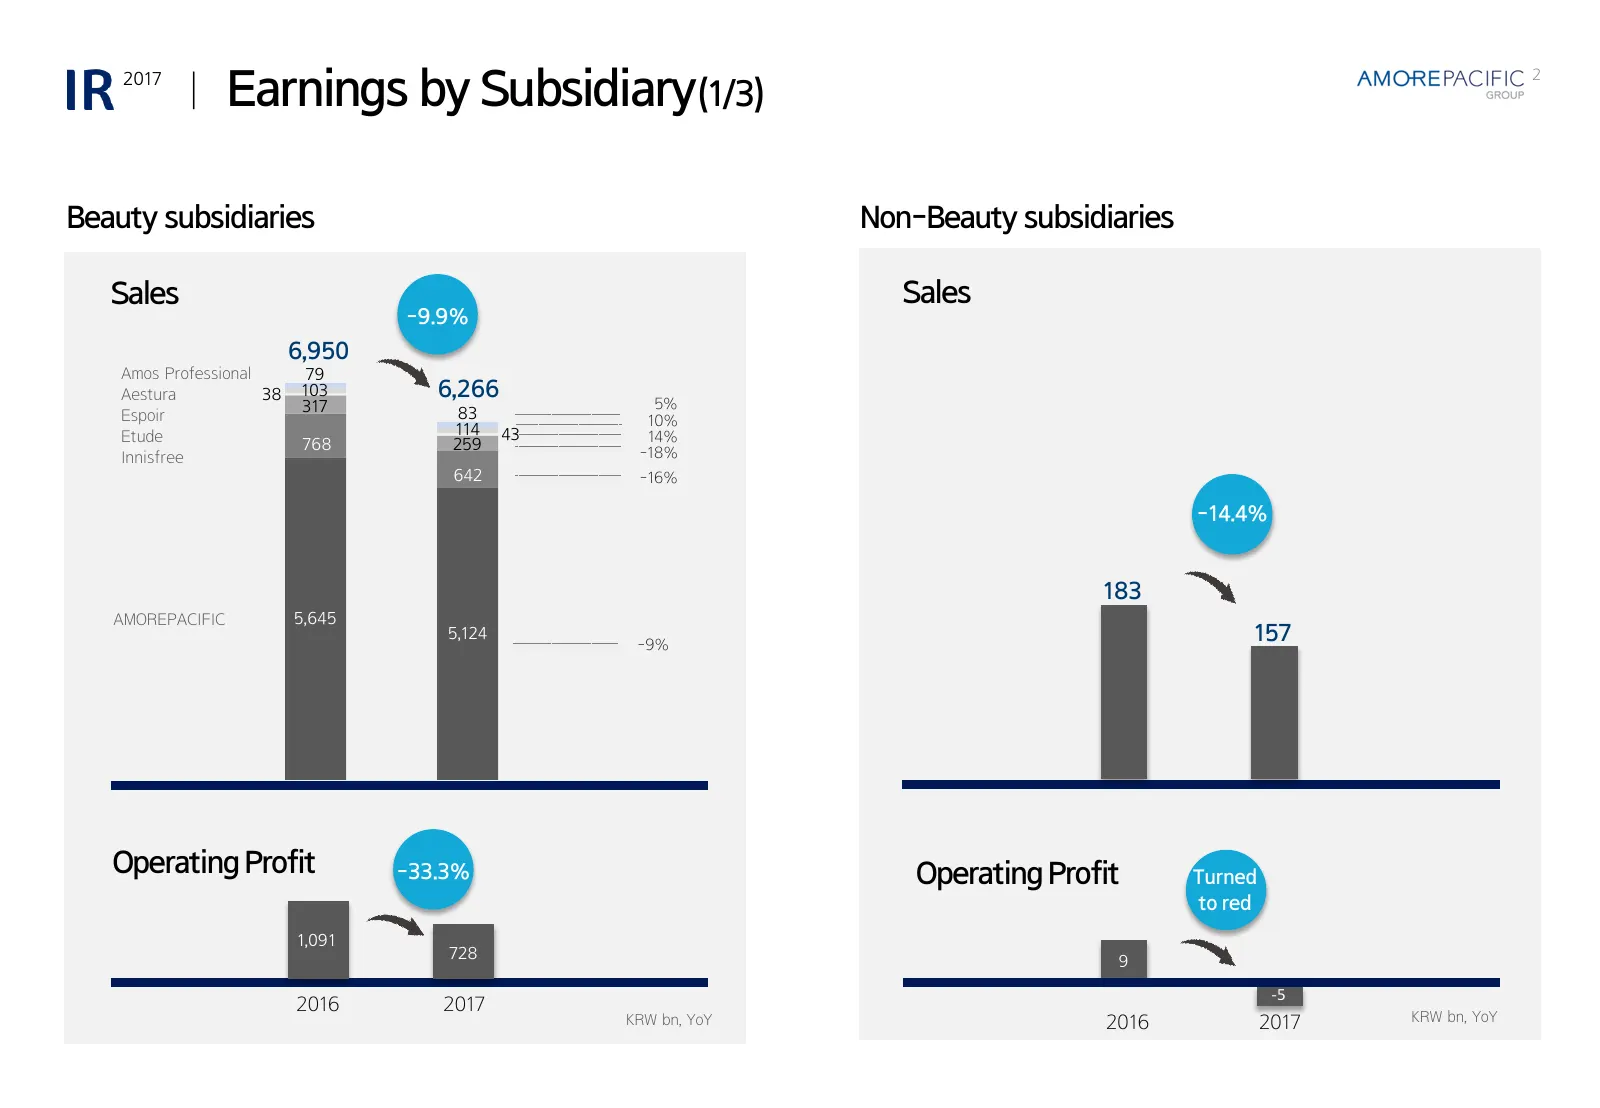
ㅣ Earnings by Subsidiary(1/3) 2017 2 Beauty subsidiaries Non-Beauty subsidiaries Sales Sales -9.9% 6,950 Amos Professional 79 Aestura 38 103 6,266 5% 317 83 Espoir 10% Etude 114 43 14% 768 259 -18% Innisfree 642 -16% -14.4% 183 AMOREPACIFIC 5,645 5,124 -9% 157 Operating Profit -33.3% Operating Profi
Slide 4: Earnings by Subsidiary (2/3)
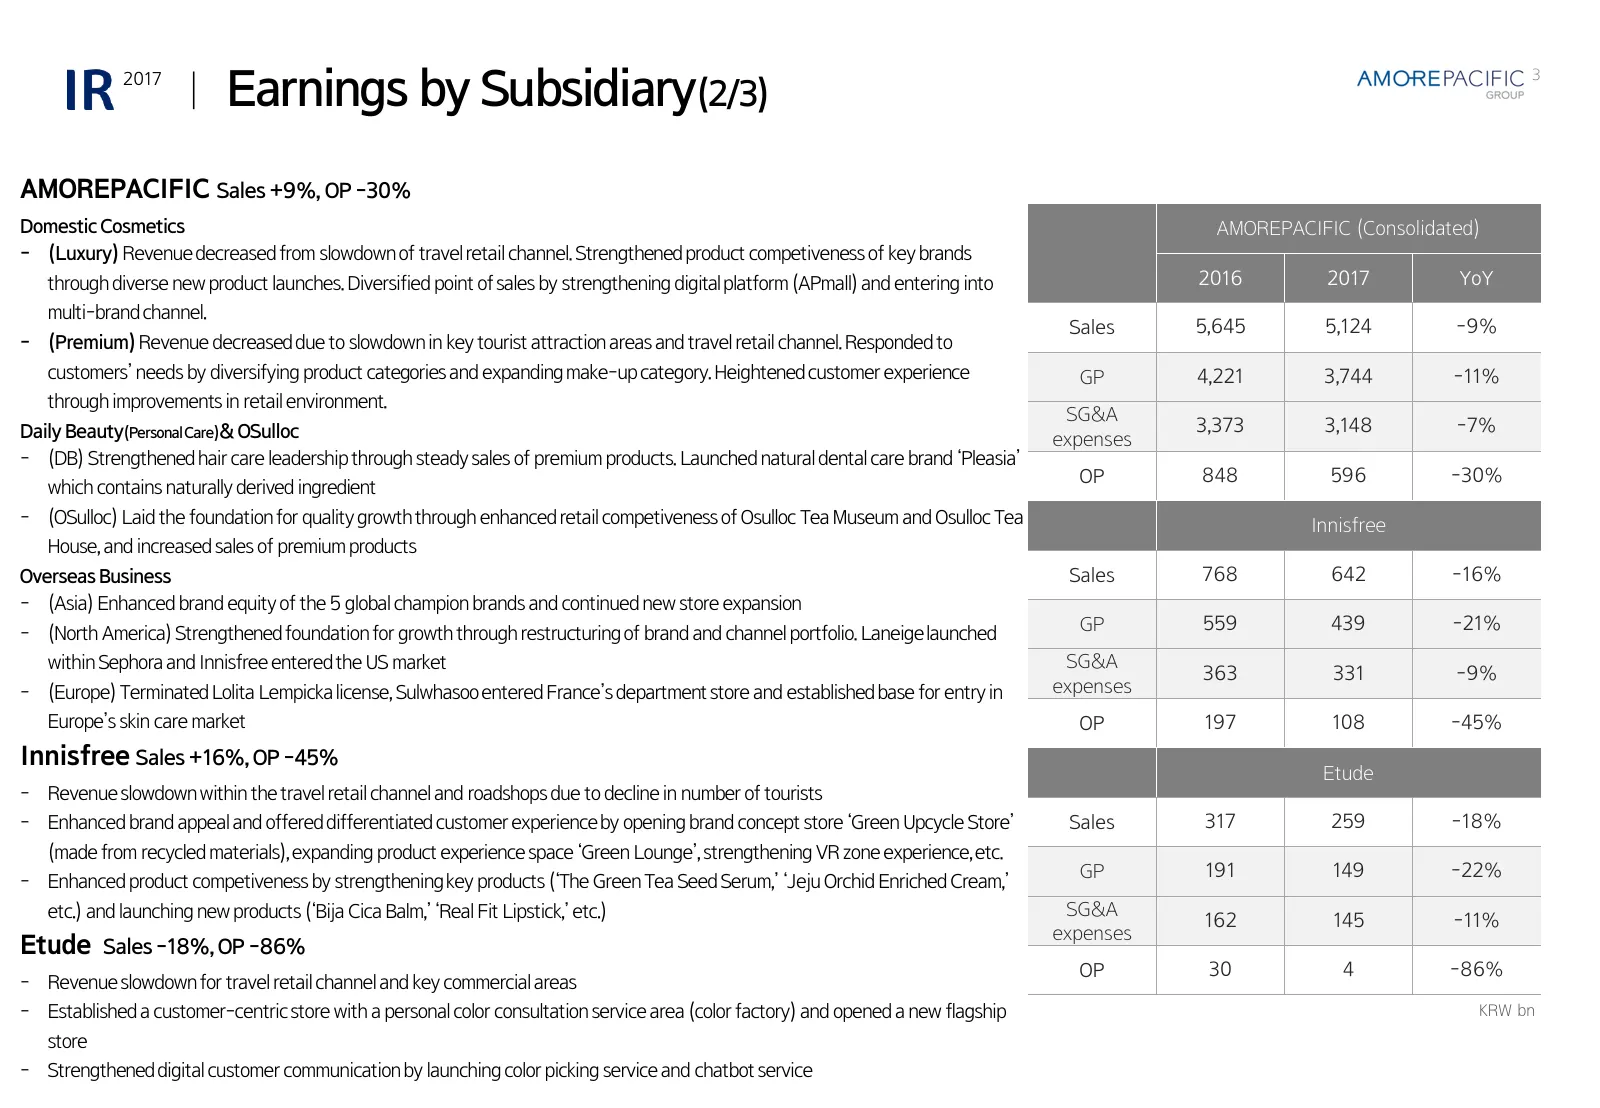
ㅣ Earnings by Subsidiary(2/3) 2017 3 AMOREPACIFIC Sales +9%, OP -30% Domestic Cosmetics AMOREPACIFIC (Consolidated) - (Luxury) Revenue decreased from slowdown of travel retail channel. Strengthened product competiveness of key brands through diverse new product launches. Diversified point of sales b
Slide 5: Earnings by Subsidiary (3/3)
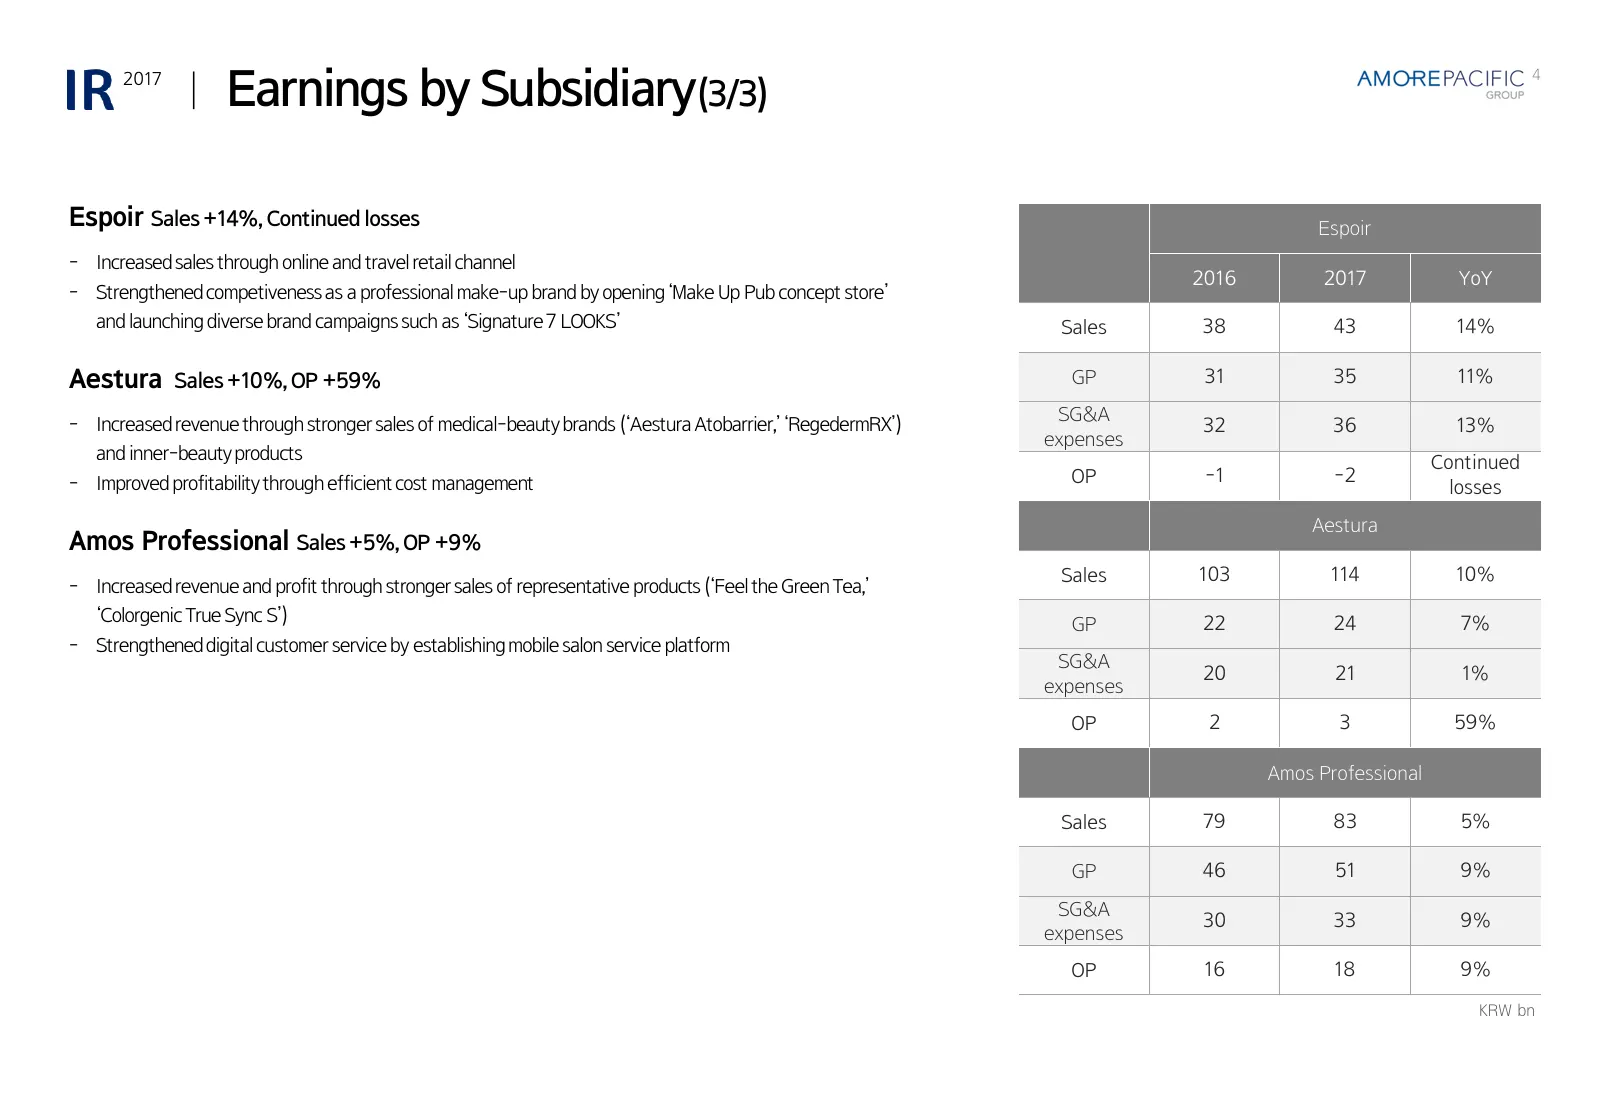
ㅣ Earnings by Subsidiary(3/3) 2017 4 Espoir Sales +14%, Continued losses Espoir - Increased sales through online and travel retail channel 2016 2017 YoY - Strengthened competiveness as a professional make-up brand by opening ‘Make Up Pub concept store’ and launching diverse brand campaigns such as ‘
Slide 6: 4Q 2017 Earnings Summary
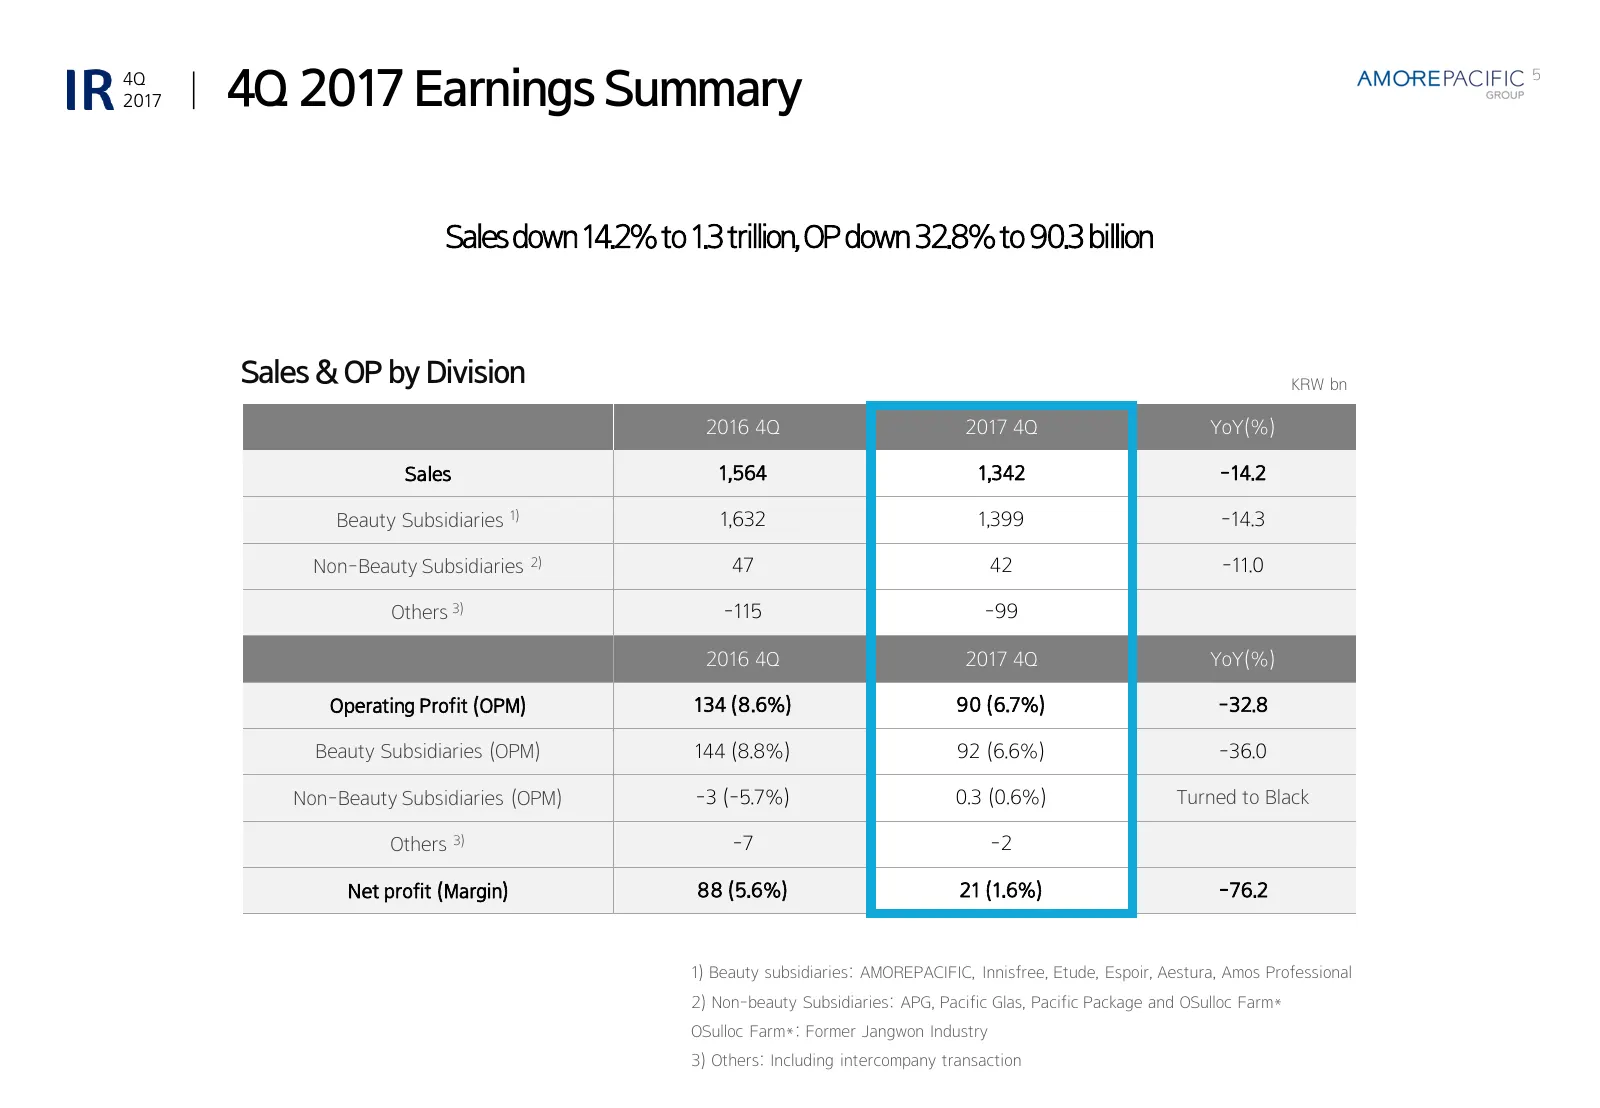
ㅣ 4Q 2017 Earnings Summary 4Q 5 2017 Sales down 14.2% to 1.3 trillion, OP down 32.8% to 90.3 billion Sales & OP by Division KRW bn 2016 4Q 2017 4Q YoY(%) Sales 1,564 1,342 -14.2 Beauty Subsidiaries 1) 1,632 1,399 -14.3 Non-Beauty Subsidiaries 2) 47 42 -11.0 Others 3) -115 -99 2016 4Q 2017 4Q YoY(%)
Slide 7: Financial Summary
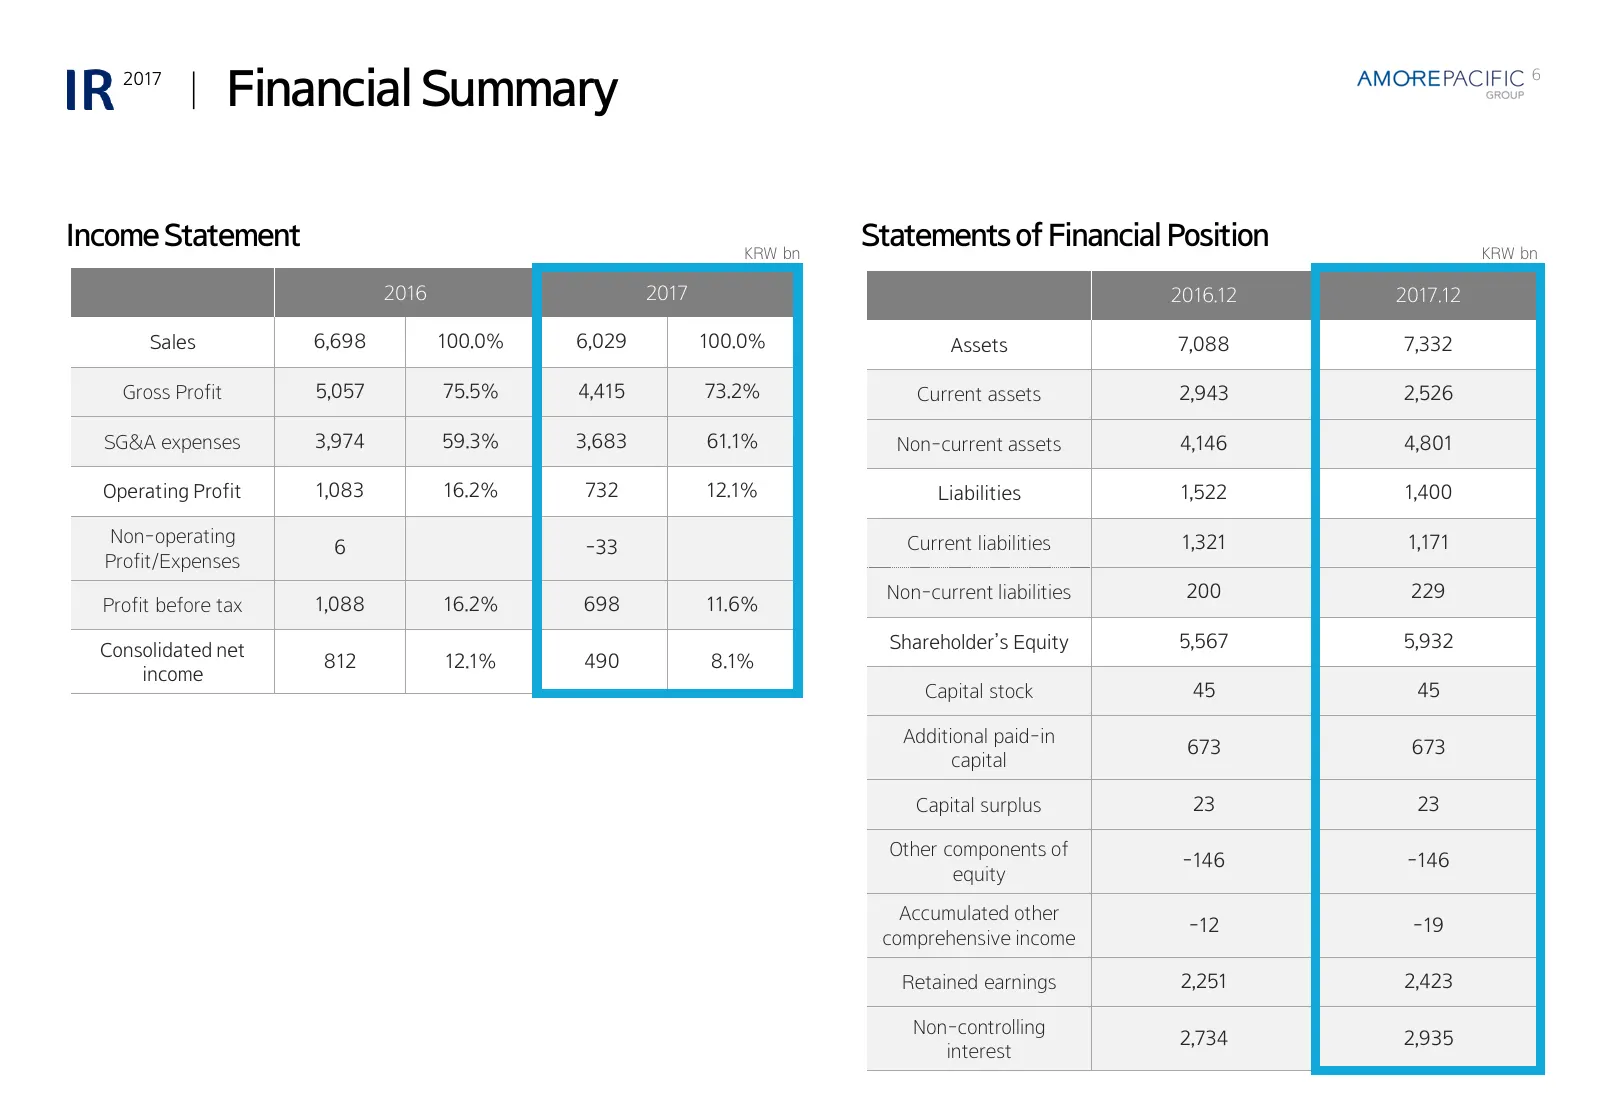
ㅣ Financial Summary 2017 6 Income Statement KRW bn Statements of Financial Position KRW bn 2016 2017 2016.12 2017.12 Sales 6,698 100.0% 6,029 100.0% Assets 7,088 7,332 Gross Profit 5,057 75.5% 4,415 73.2% Current assets 2,943 2,526 SG&A expenses 3,974 59.3% 3,683 61.1% Non-current assets 4,146 4,801
Source: company website
More decks from AMOREPACIFIC Holdings Corp.
 Q2 2026 Earnings Presentation13 slides · Jul 30, 2026
 Q1 2026 Earnings Presentation13 slides · Apr 29, 2026
 FY2025 Earnings Presentation17 slides · Feb 6, 2026
 FY2024 Earnings Presentation14 slides · Feb 6, 2025
 FY2024 Earnings Presentation14 slides · February 2025
 Merger or Acquisition (September 2022)4 slides · Sep 1, 2022