Celsia SA ESP · BVC:CELSIA
Celsia SA ESP — Celsia — LarrainVial Andean E-Conference 2022
22 slides from Celsia SA ESP's conference presentation, March 2022

Slide 1: LarrainVial Andean E-Conference
LarrainVial Andean E- Conference March, 2022
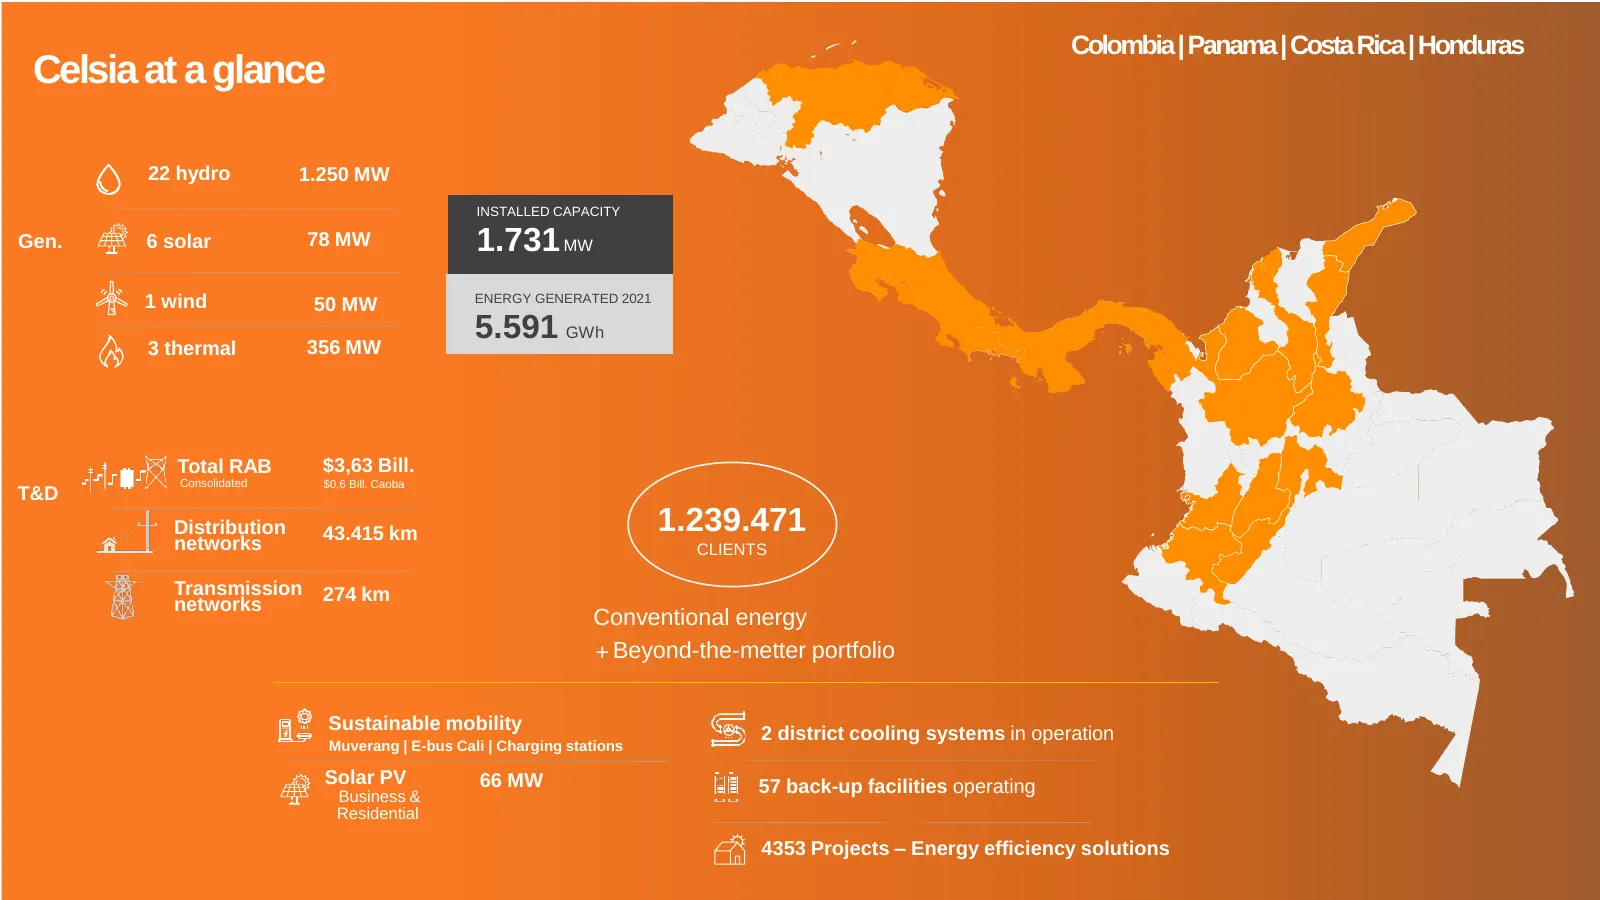
Slide 2: Celsia at a glance
Colombia | Panama | Costa Rica | Honduras Celsia at a glance 22 hydro 1.250 MW INSTALLED CAPACITY Gen. 6 solar 78 MW 1.731 MW 1 wind ENERGY GENERATED 2021 50 MW 3 thermal 356 MW 5.591 GWh Total RAB $3,63 Bill. Consolidated $0,6 Bill. Caoba T&D Distribution 43.415 km 1.239.471 networks CLIENTS Transm
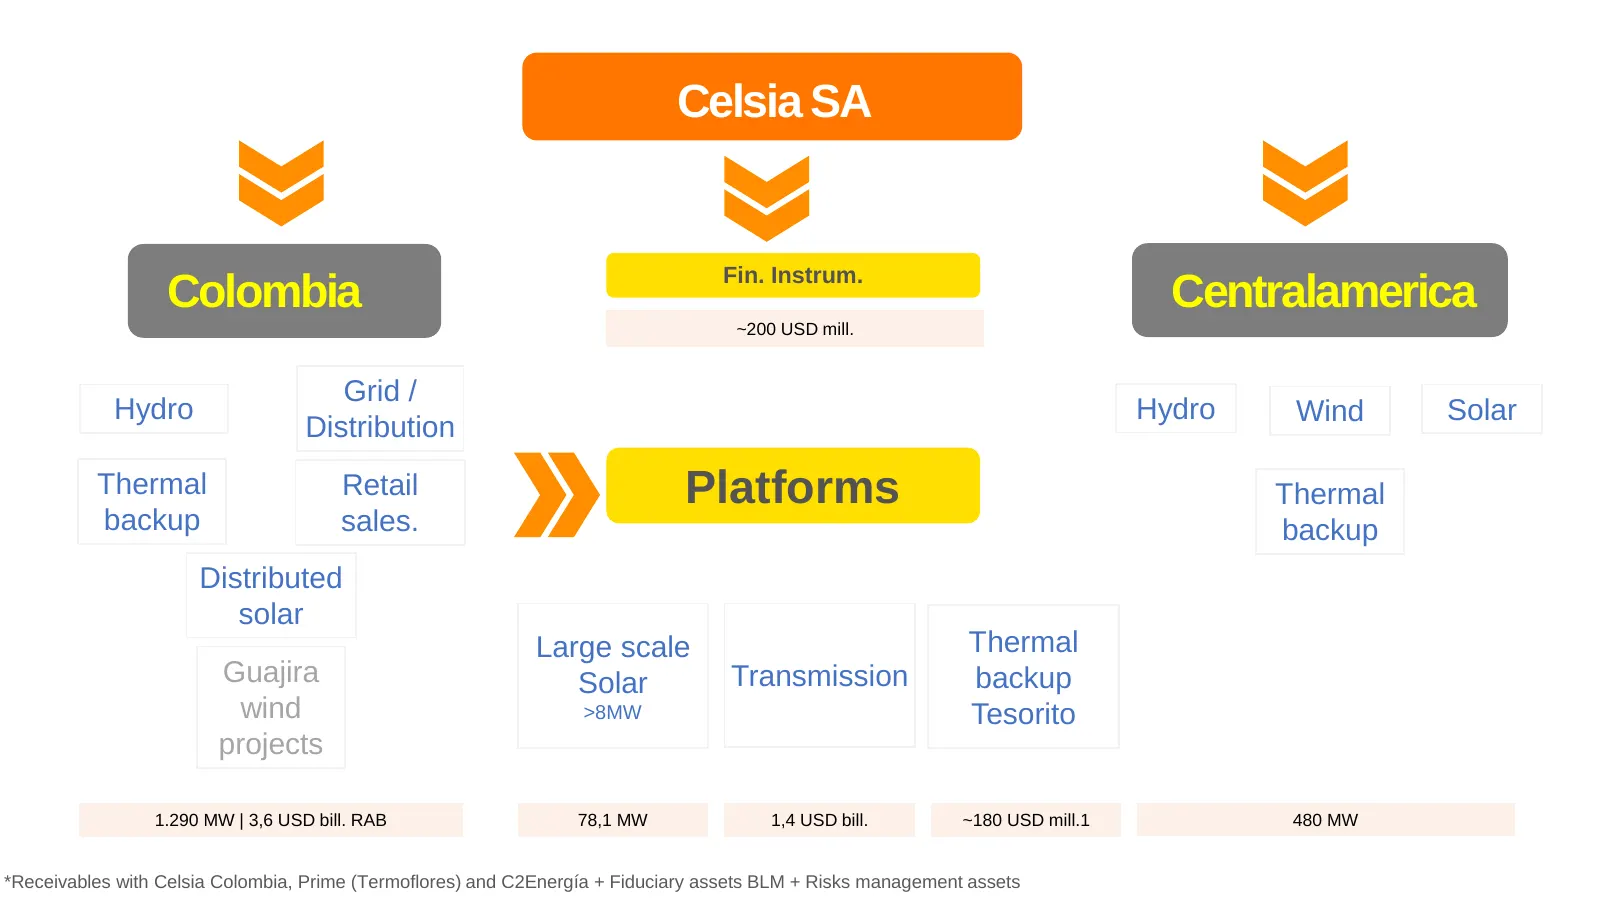
Slide 3: Celsia SA Colombia Centralamerica
Celsia SA Fin. Instrum. Colombia Centralamerica ~200 USD mill. Grid / Hydro Hydro Wind Solar Distribution Thermal Retail Platforms Thermal backup sales. backup Distributed solar Large scale Thermal Guajira Solar Transmission backup wind >8MW Tesorito projects 1.290 MW | 3,6 USD bill. RAB 78,1 MW 1,4
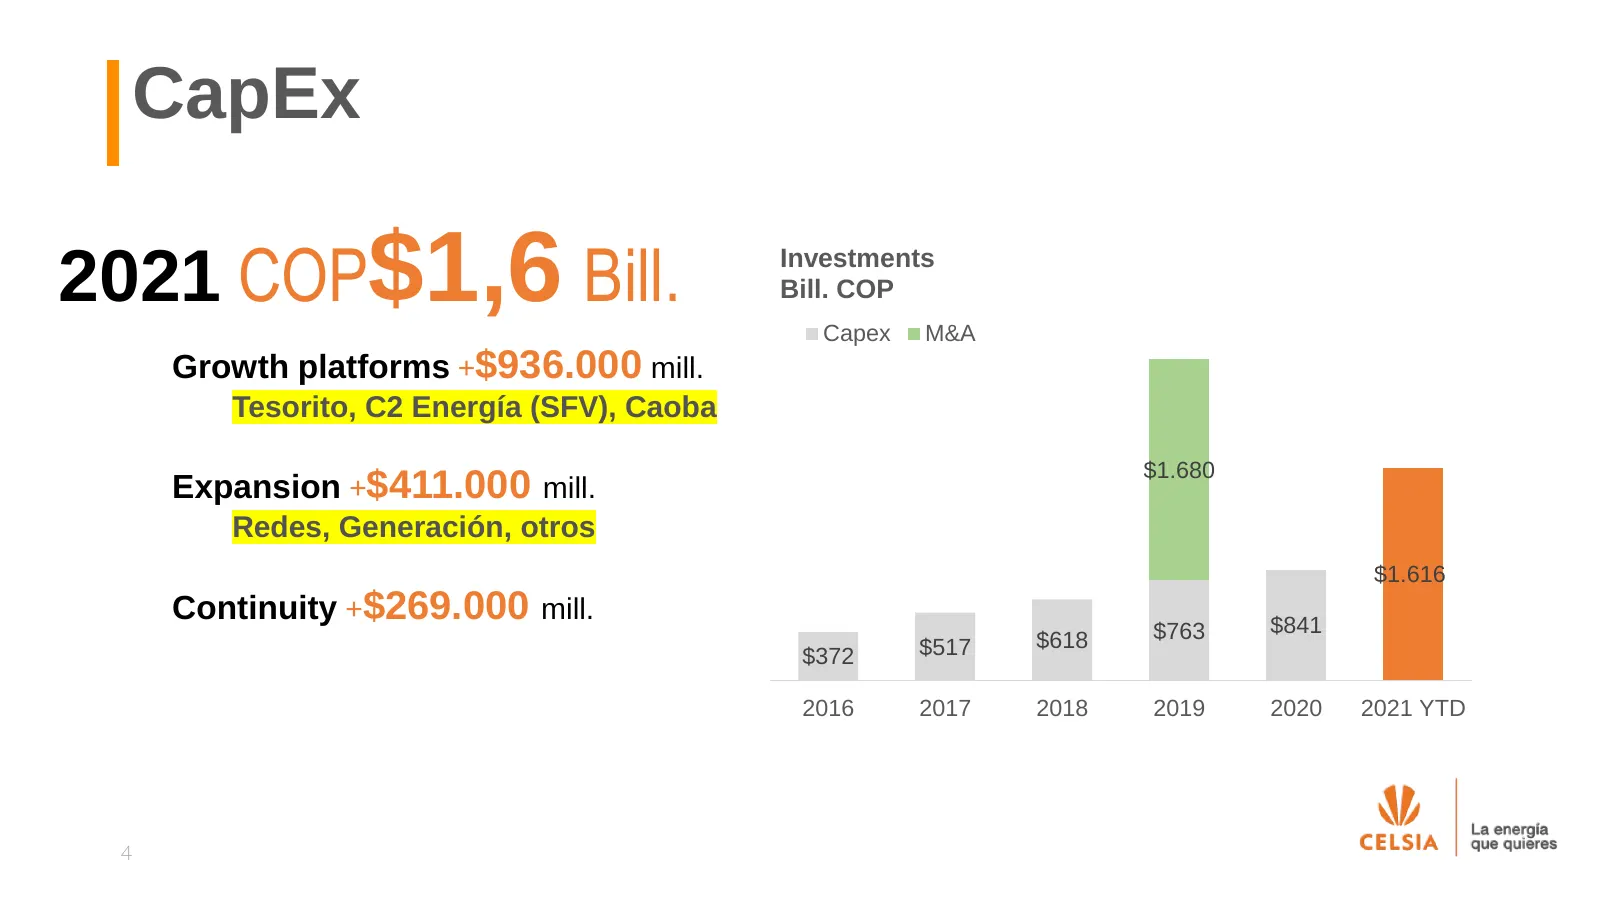
Slide 4: CapEx 2021 COP $1,6 Bill.
CapEx 2021 COP$1,6 Bill. Investments Bill. COP Capex M&A Growth platforms +$936.000 mill. Tesorito, C2 Energía (SFV), Caoba $1.680 Expansion +$411.000 mill. Redes, Generación, otros $1.616 Continuity +$269.000 mill. $841 $618 $763 $372 $517 2016 2017 2018 2019 2020 2021 YTD 4
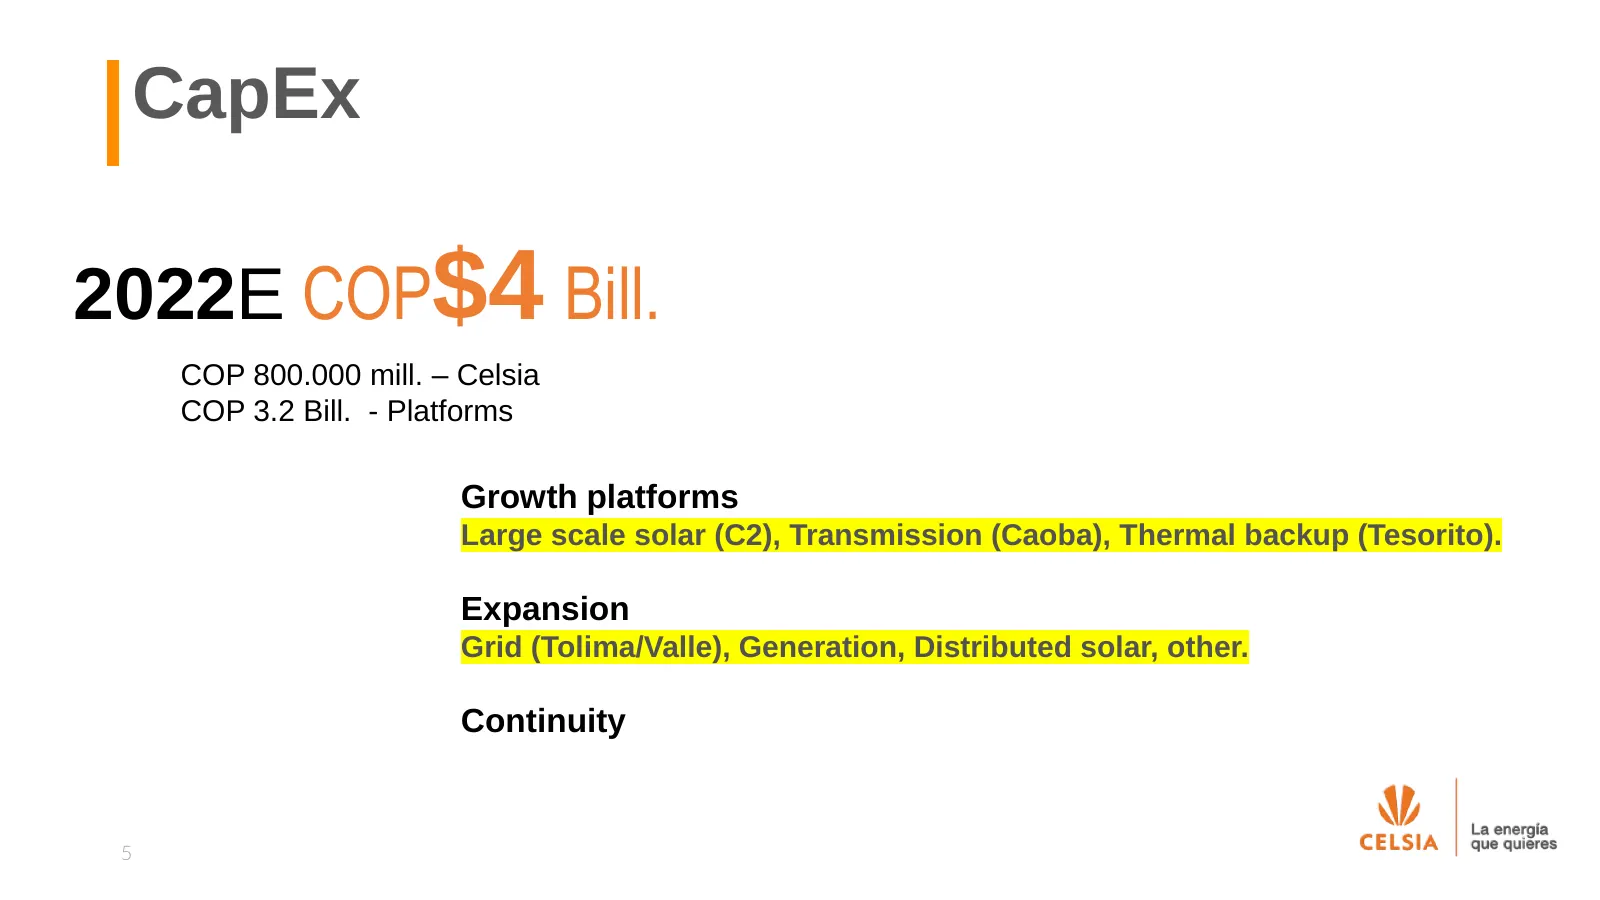
Slide 5: CapEx 2022E COP $4 Bill.
CapEx 2022E COP$4 Bill. COP 800.000 mill. – Celsia COP 3.2 Bill. - Platforms Growth platforms Large scale solar (C2), Transmission (Caoba), Thermal backup (Tesorito). Expansion Grid (Tolima/Valle), Generation, Distributed solar, other. Continuity 5
Slide 6: Large scale non-conventional renewables
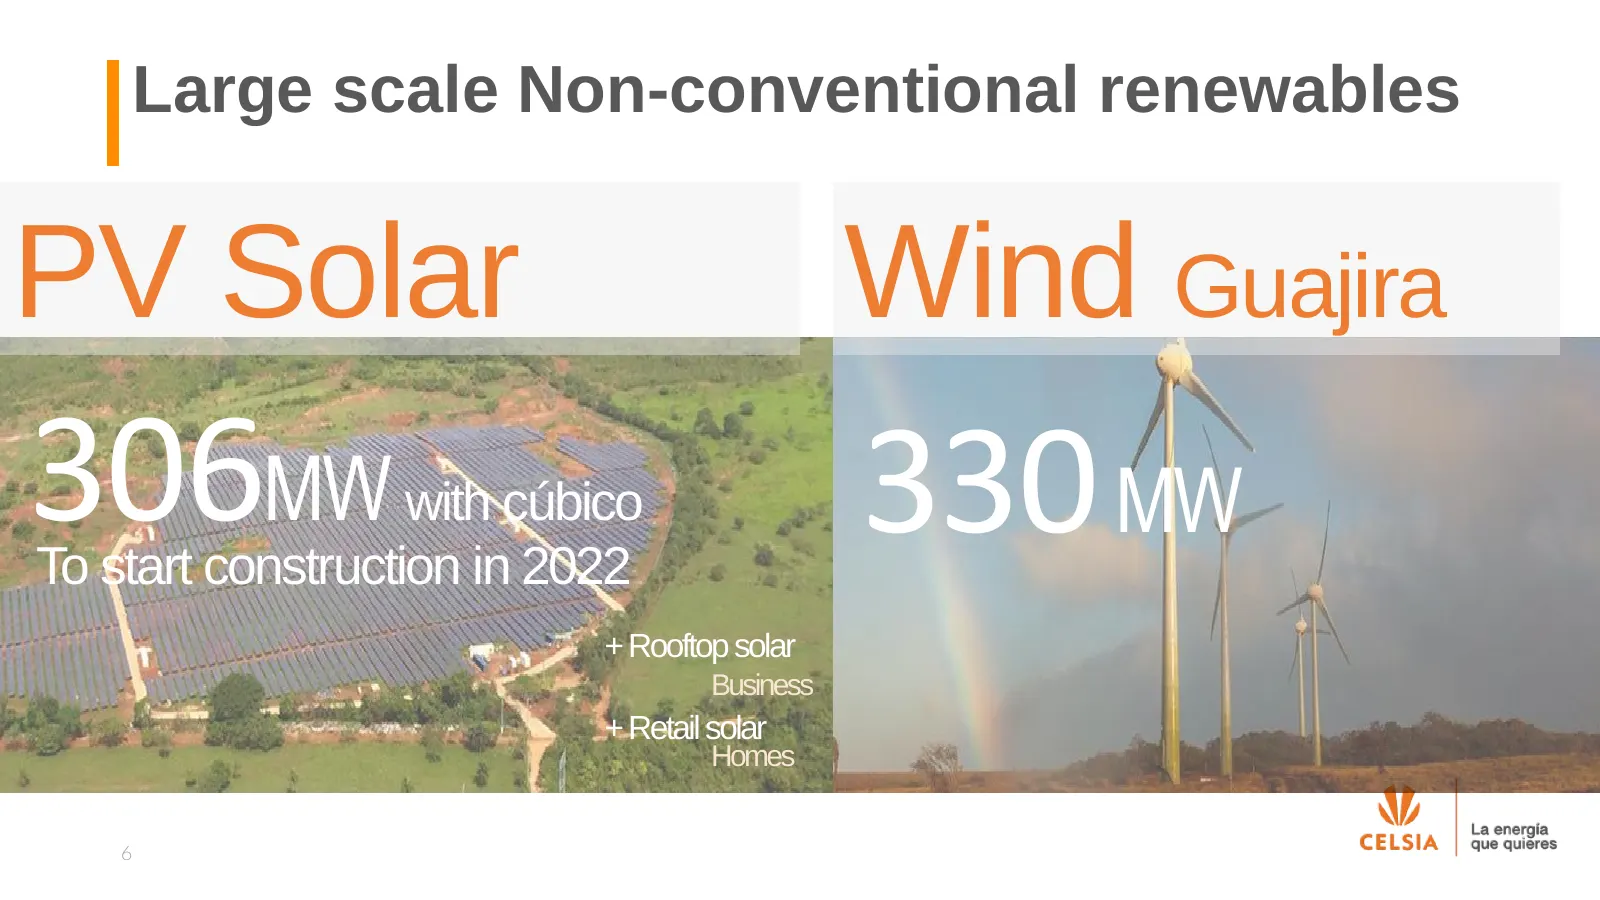
Large scale Non-conventional renewables PV Solar Wind Guajira 306MW with cúbico To start construction in 2022 330 MW + Rooftop solar Business + Retail solar Homes 6
Slide 7: Relevant player in Colombia – NC renewables
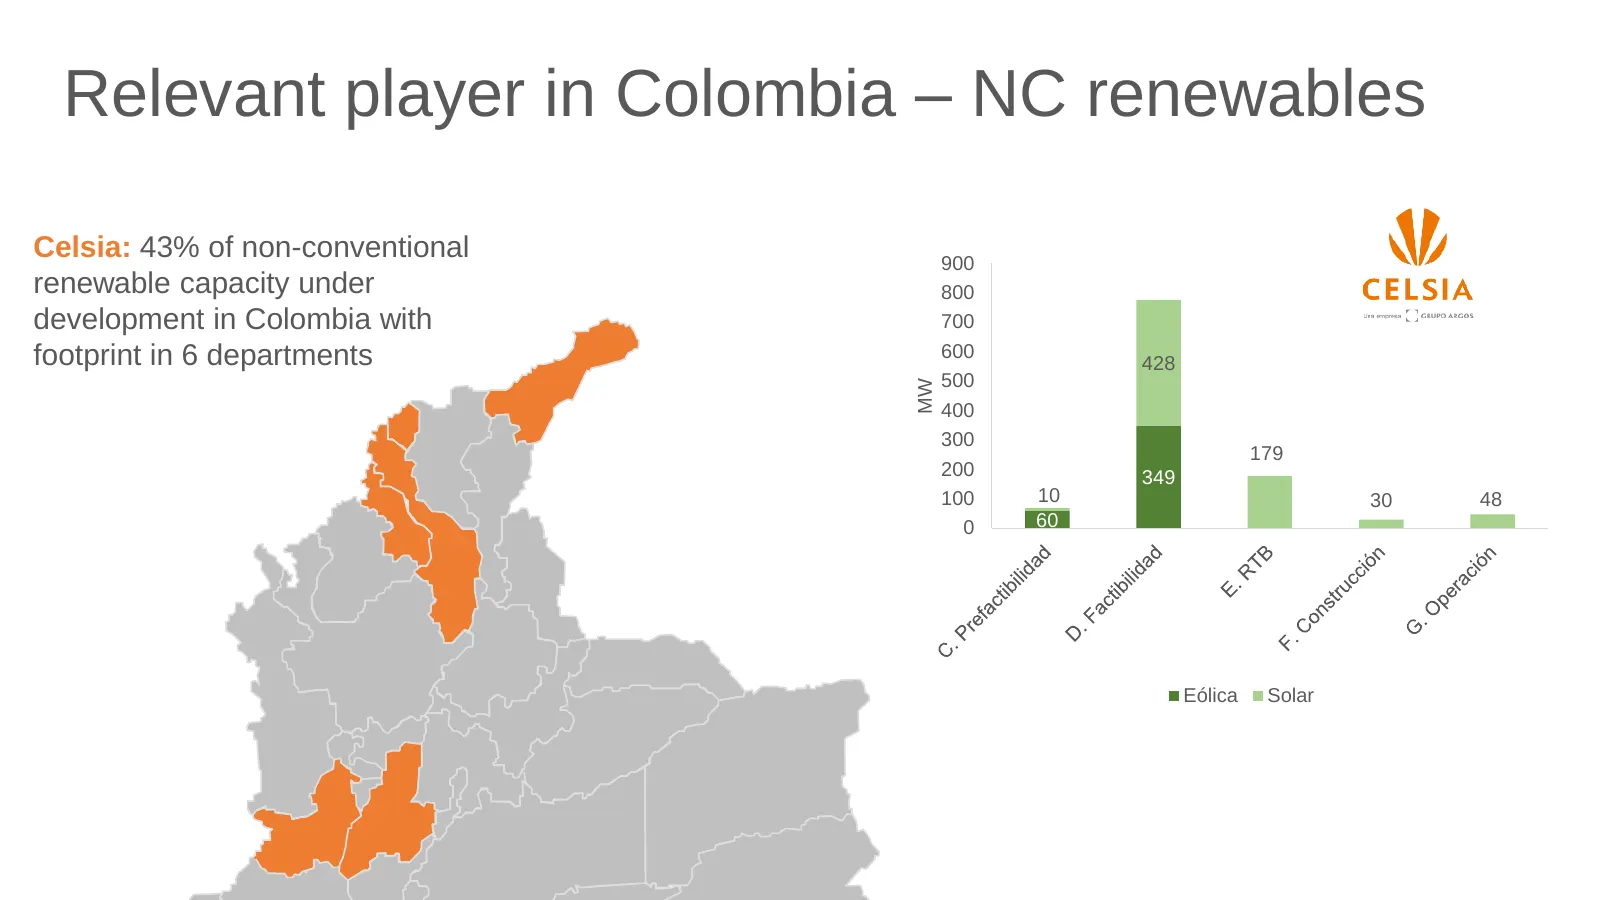
Relevant player in Colombia – NC renewables Celsia: 43% of non-conventional 900 renewable capacity under 800 development in Colombia with 700 footprint in 6 departments 600 428 500 MW 400 300 179 200 349 100 10 30 48 0 60 Eólica Solar
Slide 8: Transmisión - Caoba inversiones
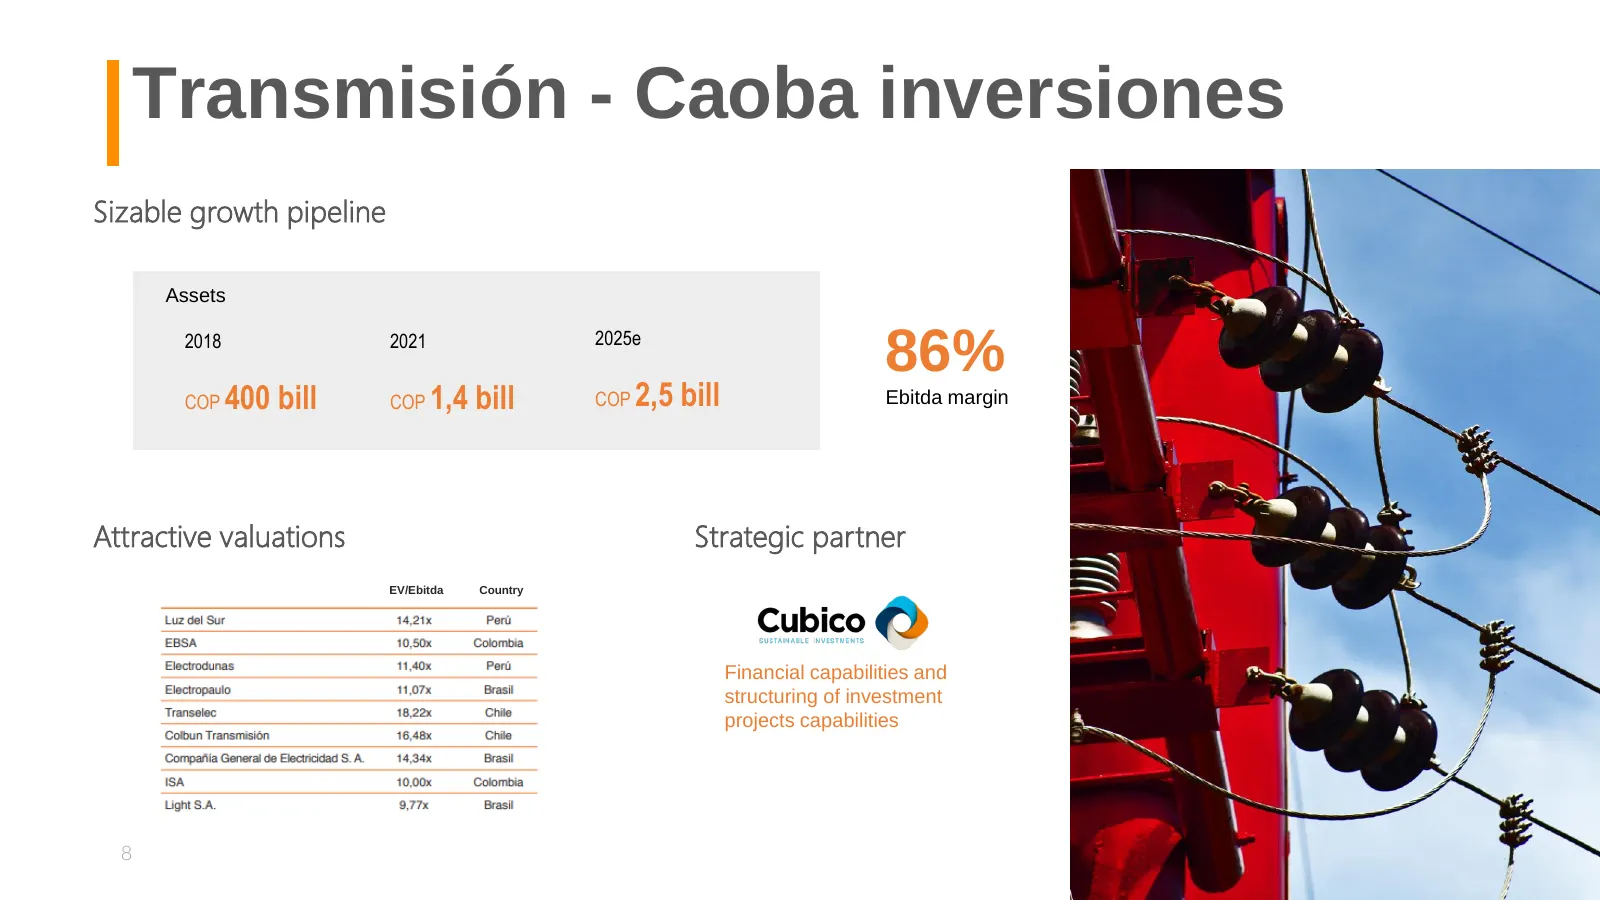
Transmisión - Caoba inversiones Sizable growth pipeline Assets 2025e 2018 2021 86% COP 400 bill COP 1,4 bill COP 2,5 bill Ebitda margin Attractive valuations Strategic partner EV/Ebitda Country Financial capabilities and structuring of investment projects capabilities 8
Slide 9: System reliability - efficiencies and compensations that neutralize impact
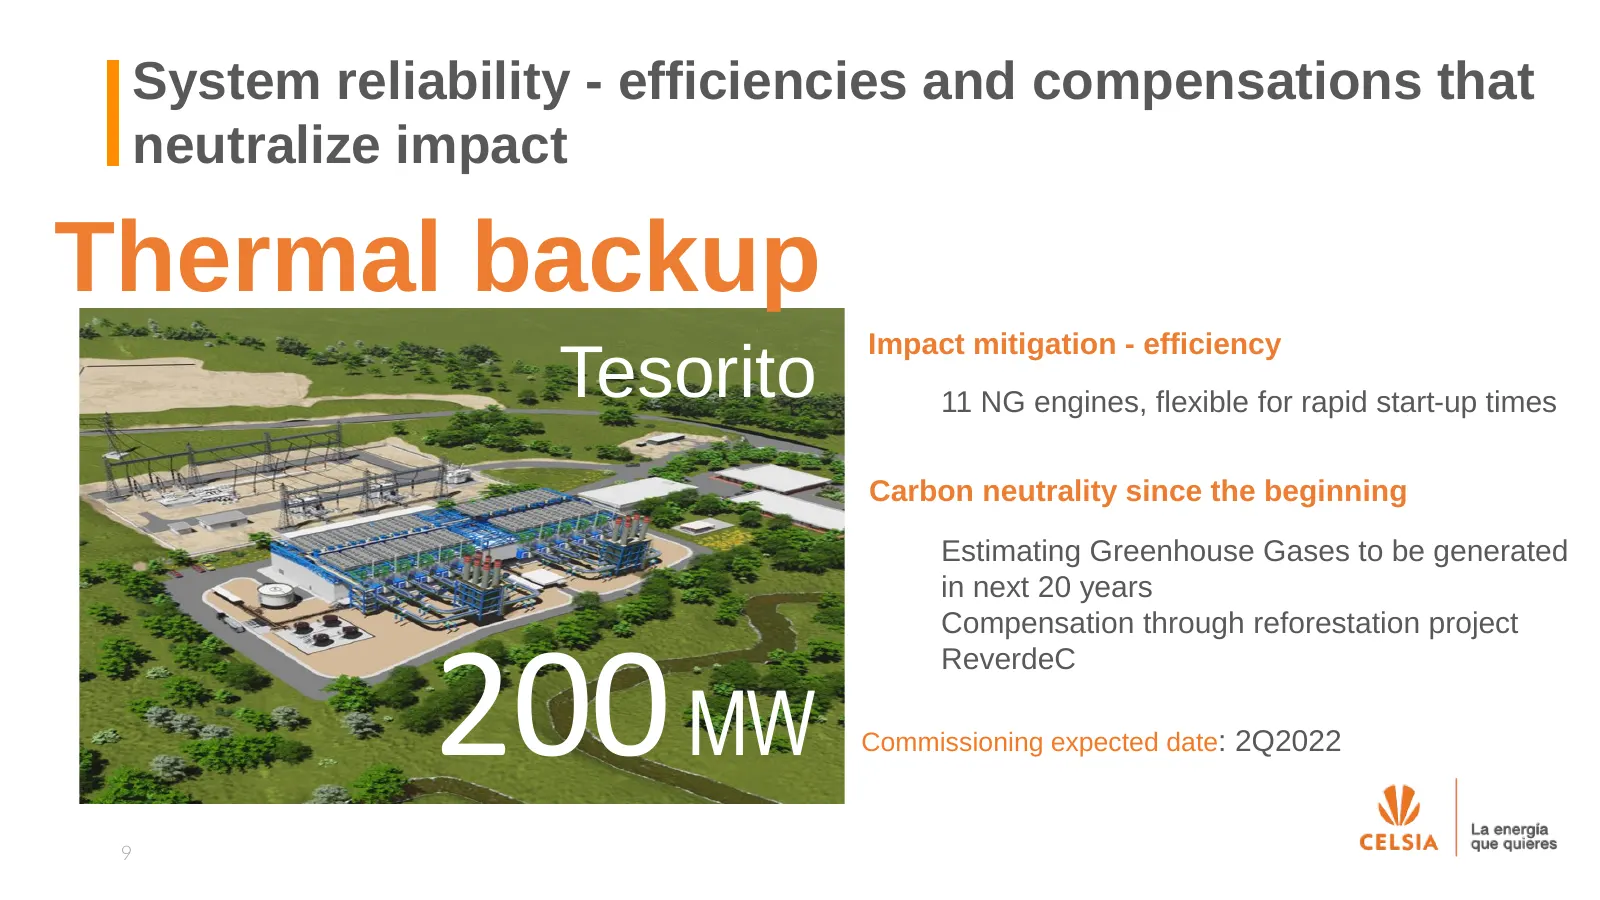
System reliability - efficiencies and compensations that neutralize impact Thermal backup Impact mitigation - efficiency Tesorito 11 NG engines, flexible for rapid start-up times Carbon neutrality since the beginning Estimating Greenhouse Gases to be generated in next 20 years Compensation through r
Slide 10: Distribution - Tolima
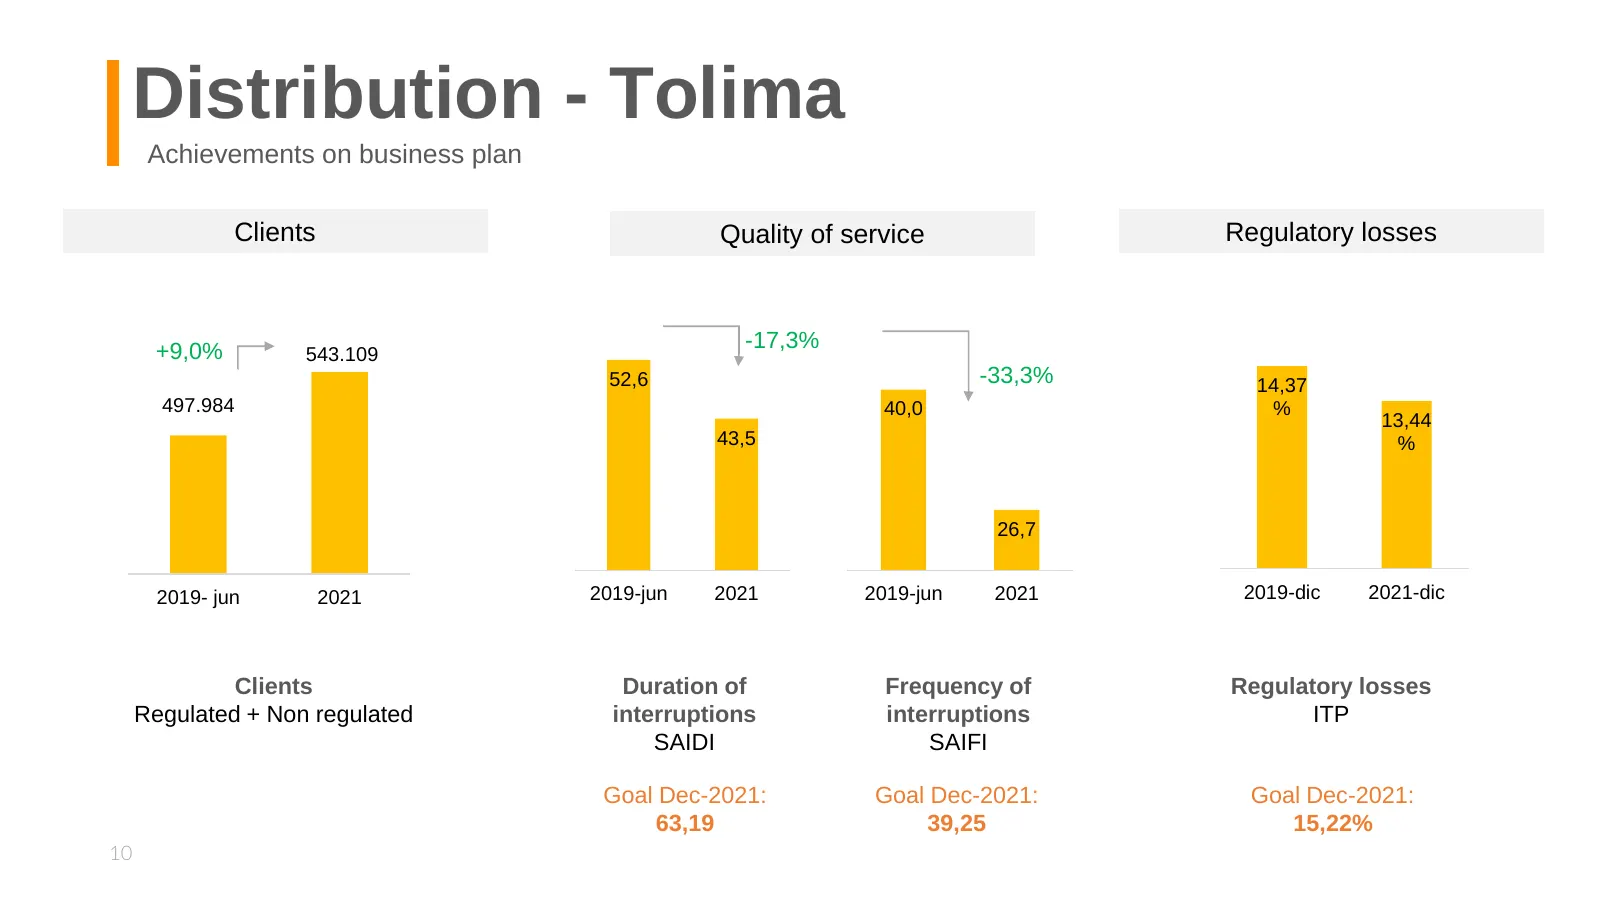
Distribution - Tolima Achievements on business plan Clients Quality of service Regulatory losses +9,0% -17,3% 543.109 52,6 -33,3% 14,37 497.984 40,0 % 13,44 43,5 % 26,7 2019- jun 2021 2019-jun 2021 2019-jun 2021 2019-dic 2021-dic Clients Duration of Frequency of Regulatory losses Regulated + Non reg
Slide 11: Distribution - Tolima
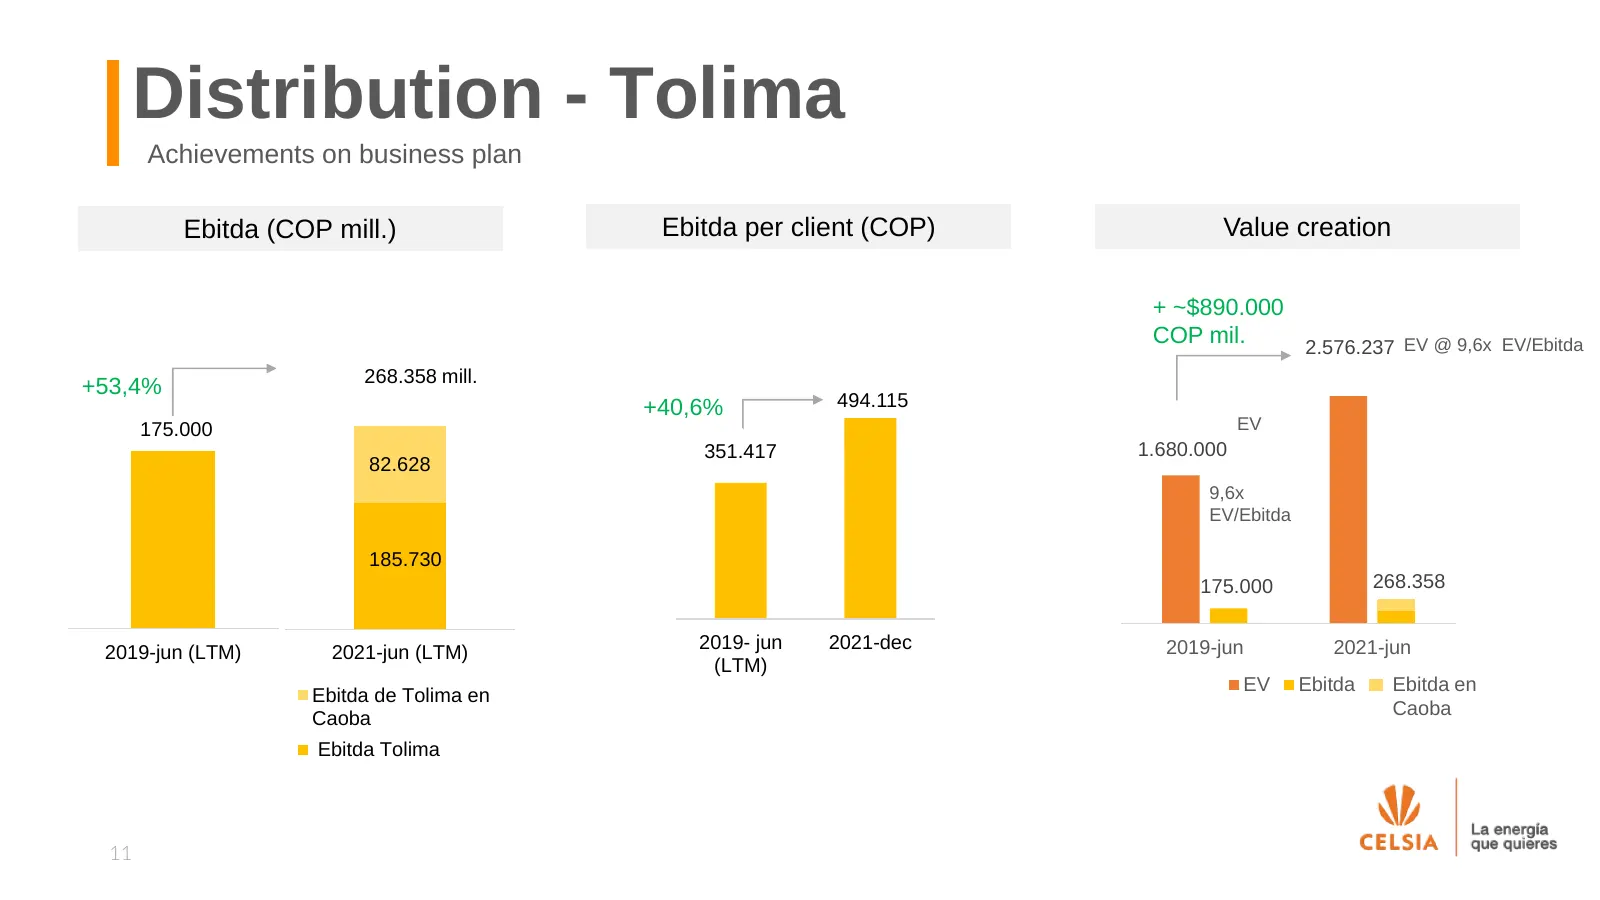
Distribution - Tolima Achievements on business plan Ebitda (COP mill.) Ebitda per client (COP) Value creation + ~$890.000 COP mil. 2.576.237 EV @ 9,6x EV/Ebitda 268.358 mill. +53,4% +40,6% 494.115 175.000 EV 351.417 1.680.000 82.628 9,6x EV/Ebitda 185.730 175.000 268.358 2019-jun (LTM) 2019- jun 202
Slide 12: Bahía Las Minas
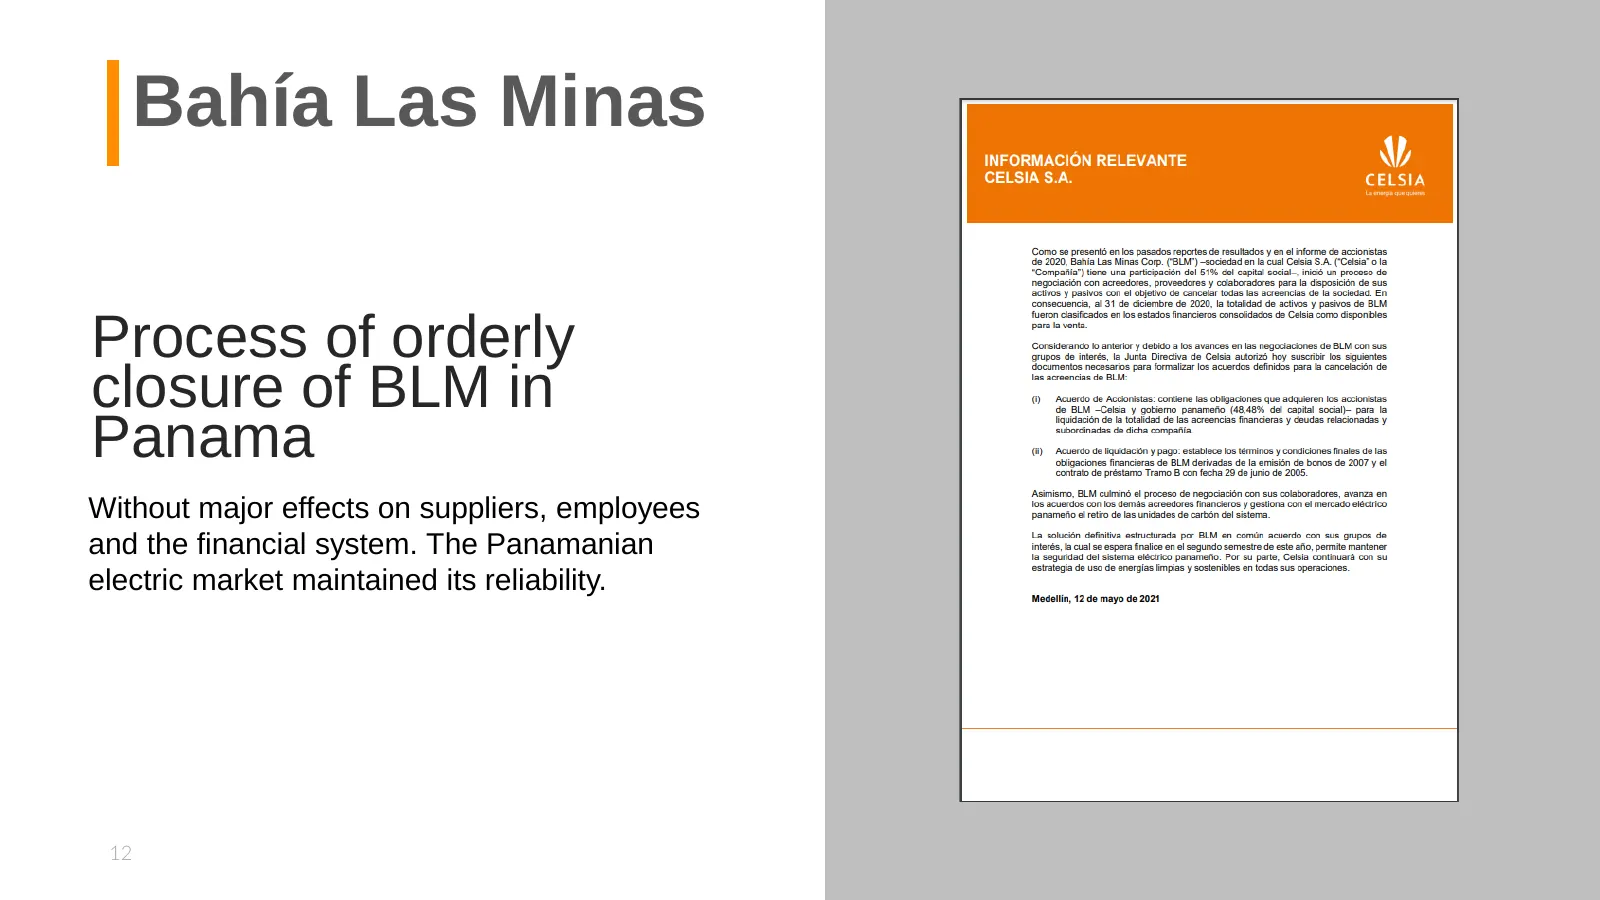
Bahía Las Minas Process of orderly closure of BLM in Panama Without major effects on suppliers, employees and the financial system. The Panamanian electric market maintained its reliability. 12
Slide 13: ESG
W CELSIA La energia que quier
Slide 14: ESG progress and promise
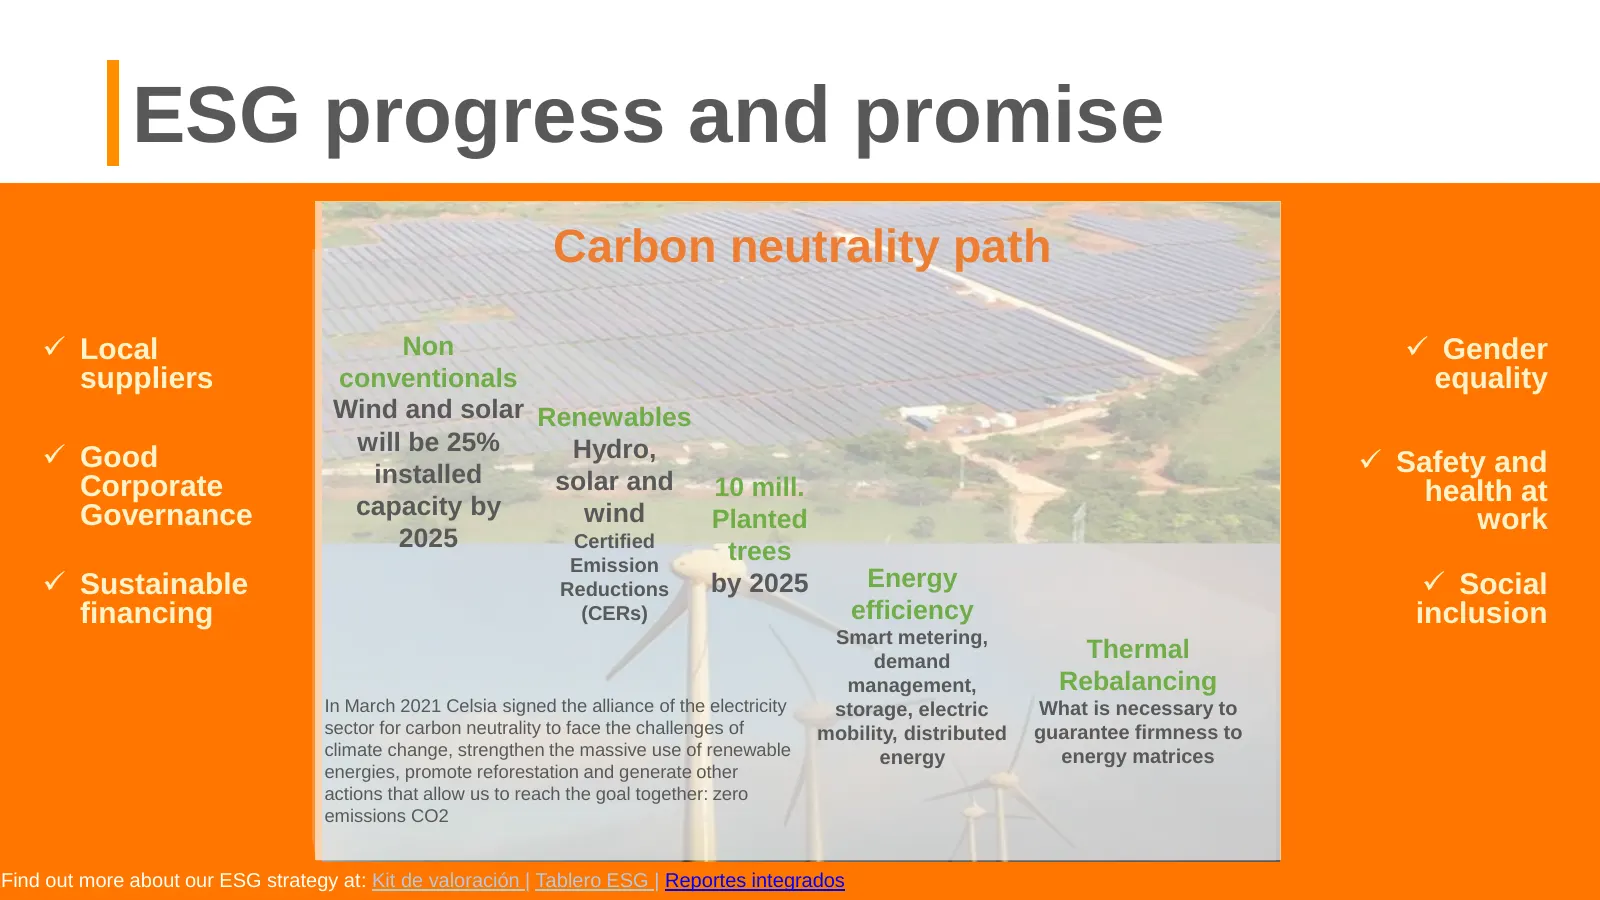
ESG progress and promise Carbon neutrality path ✓ Local Non ✓ Gender suppliers conventionals equality Wind and solar Renewables will be 25% Hydro, ✓ Good ✓ Safety and Corporate installed solar and 10 mill. health at Governance capacity by wind Planted work 2025 Certified Emission trees ✓ Sustainable
Slide 15: ESG dashboard
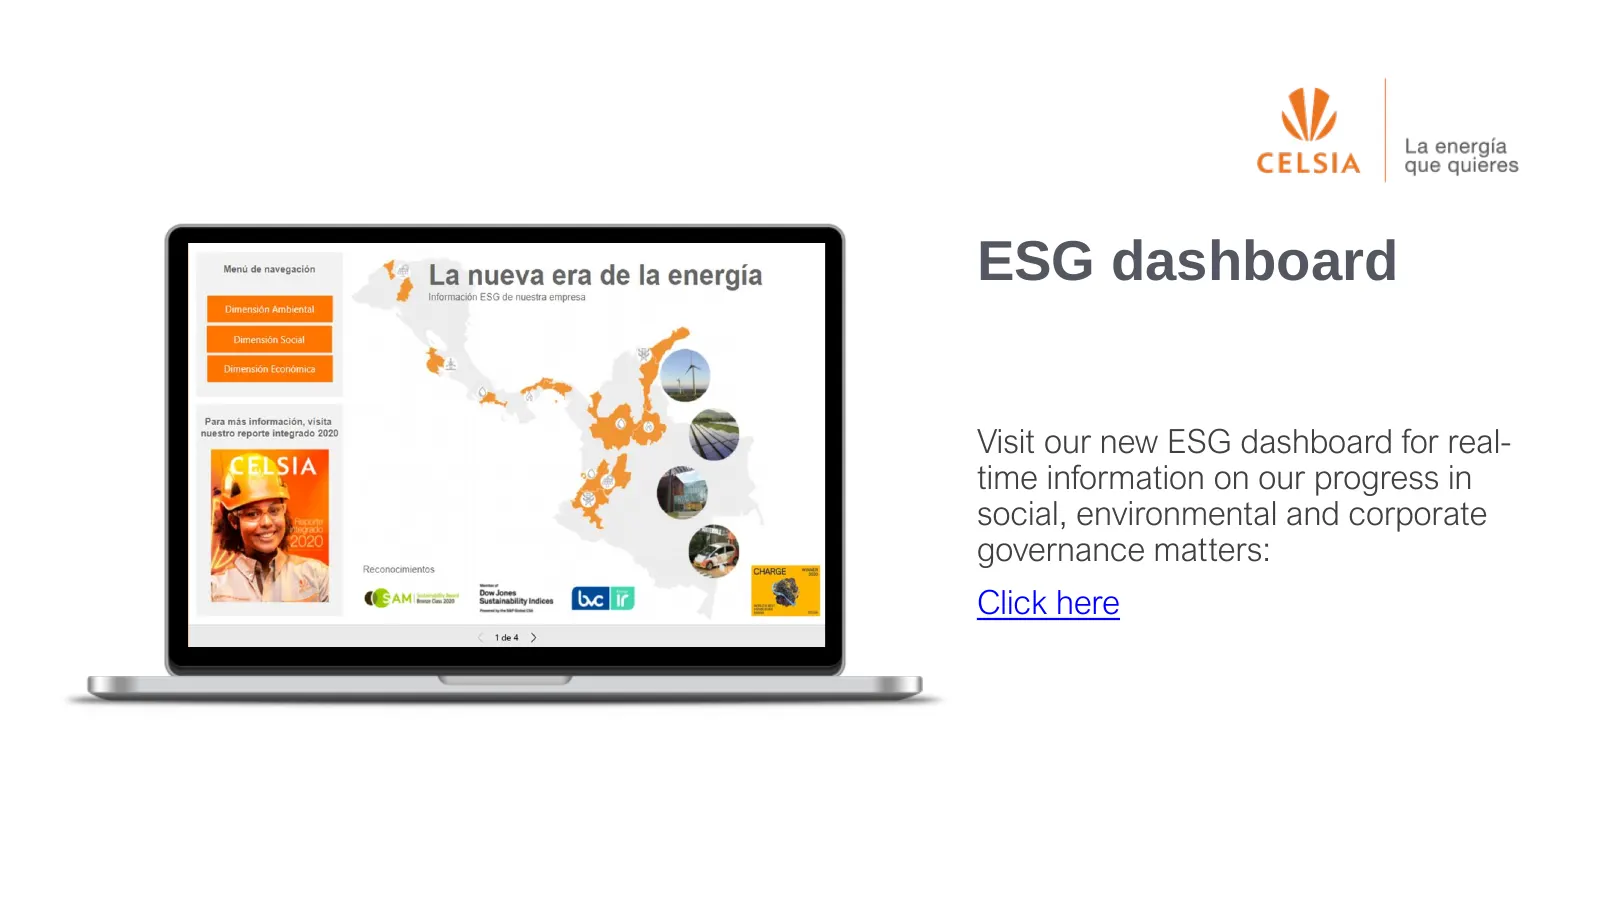
ESG dashboard Visit our new ESG dashboard for real- time information on our progress in social, environmental and corporate governance matters: Click here

Slide 16: Key financials
celsia.com W CELSIA La energia que quieres Key financials
Slide 17: Consolidated IS - Revenues
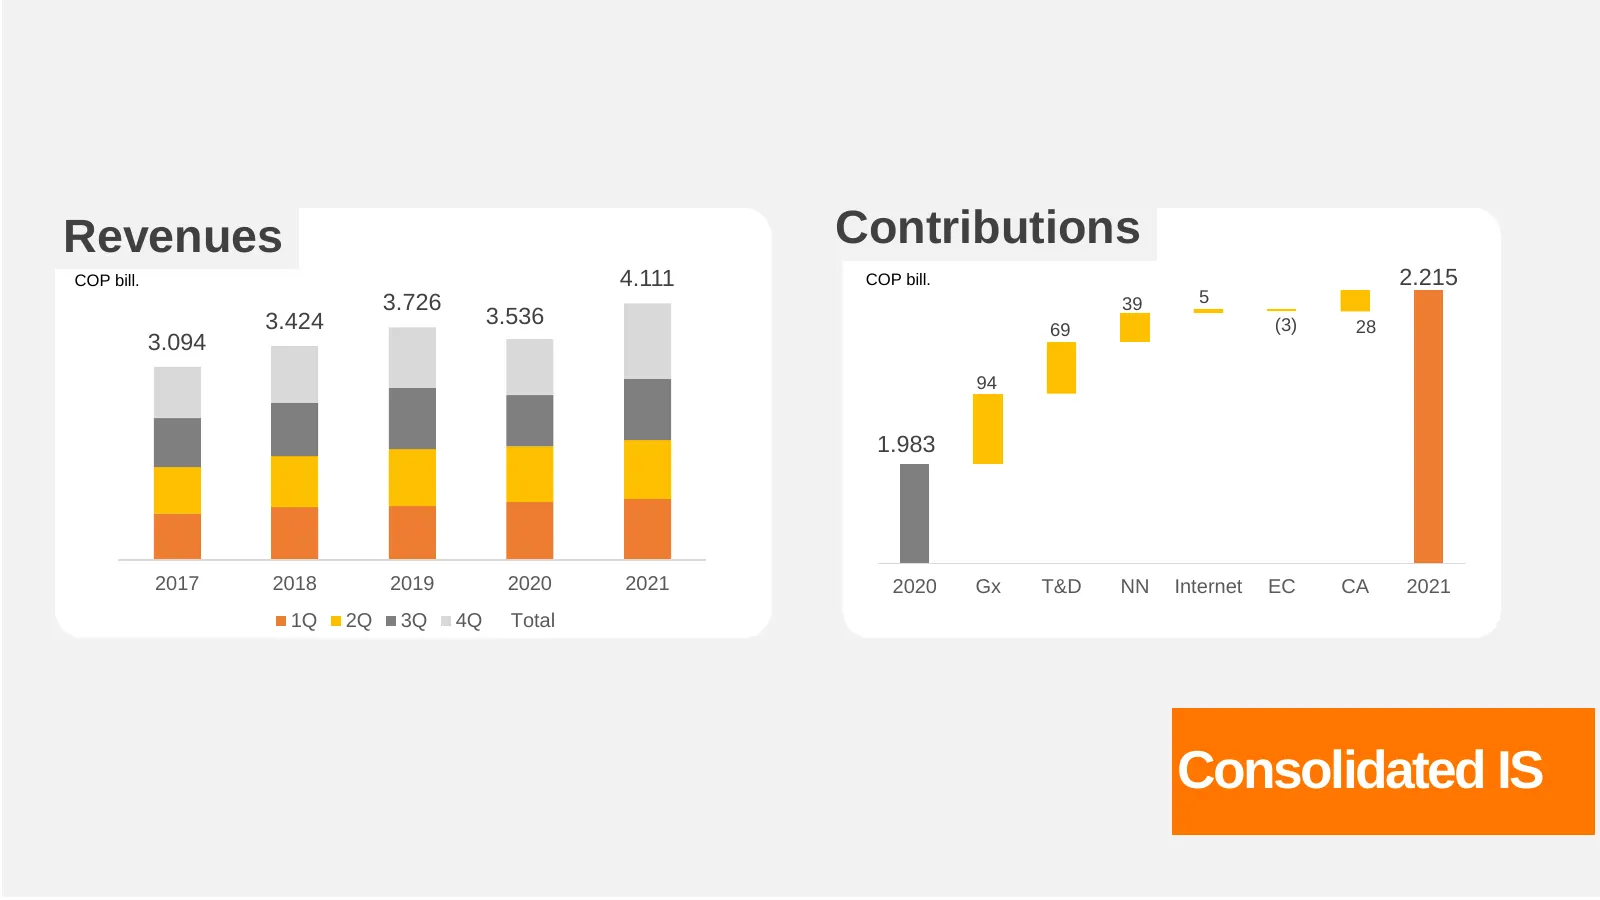
Revenues Contributions COP bill. 4.111 COP bill. 2.215 3.726 39 5 3.424 3.536 (3) 28 69 3.094 94 1.983 2017 2018 2019 2020 2021 2020 Gx T&D NN Internet EC CA 2021 1Q 2Q 3Q 4Q Total Consolidated IS
Slide 18: Consolidated IS - Ebitda
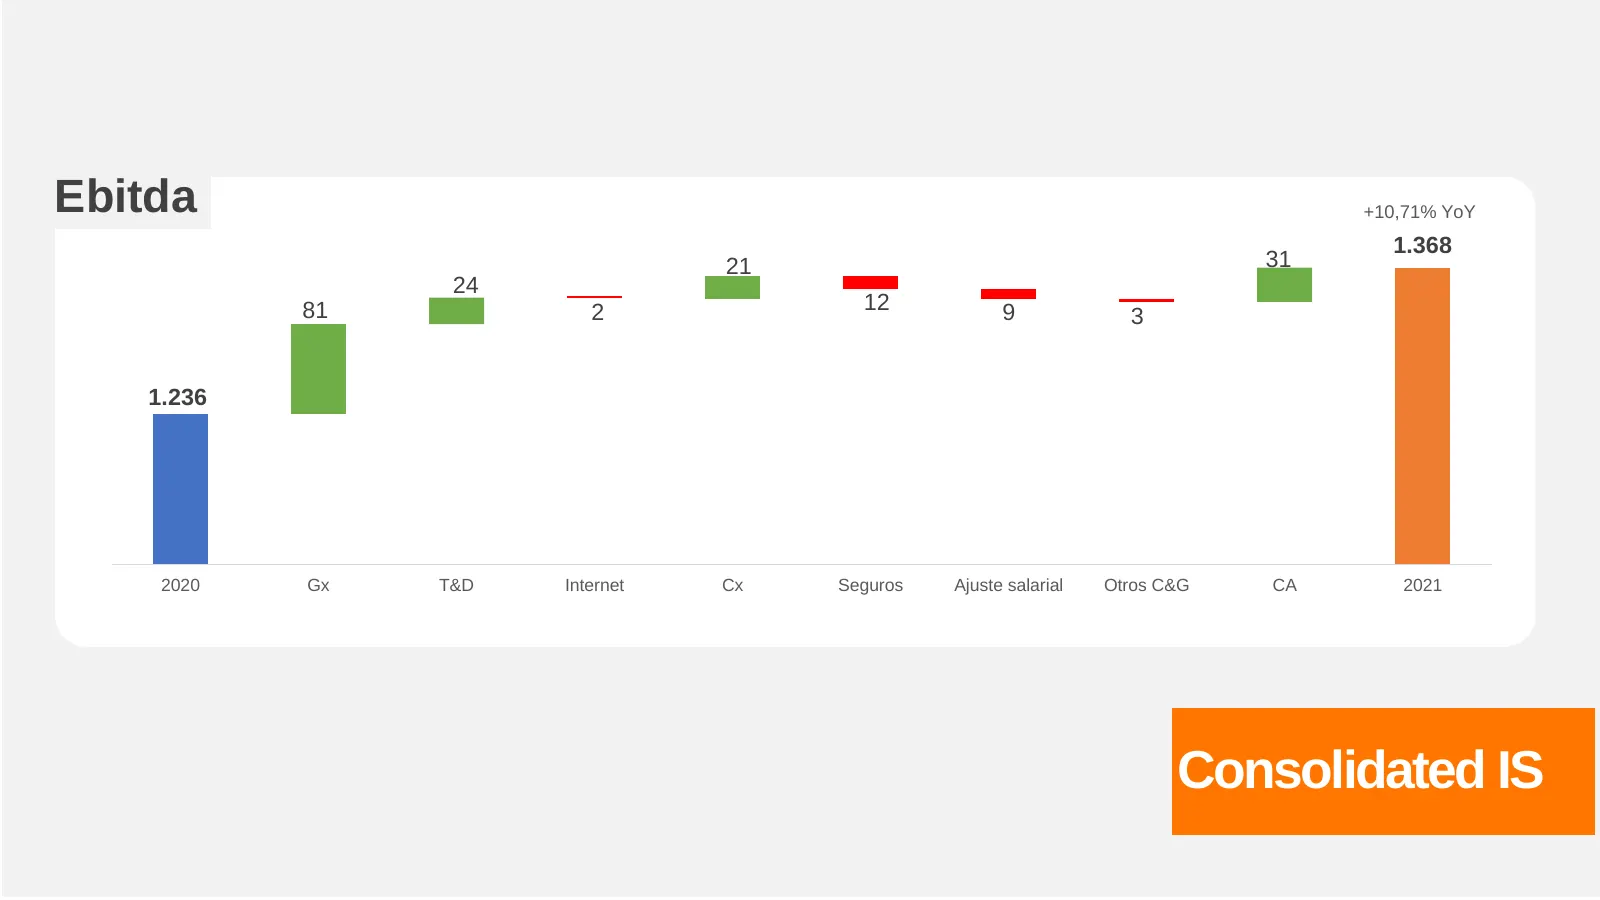
Ebitda +10,71% YoY 1.368 21 31 24 81 2 12 9 3 1.236 2020 Gx T&D Internet Cx Seguros Ajuste salarial Otros C&G CA 2021 Consolidated IS
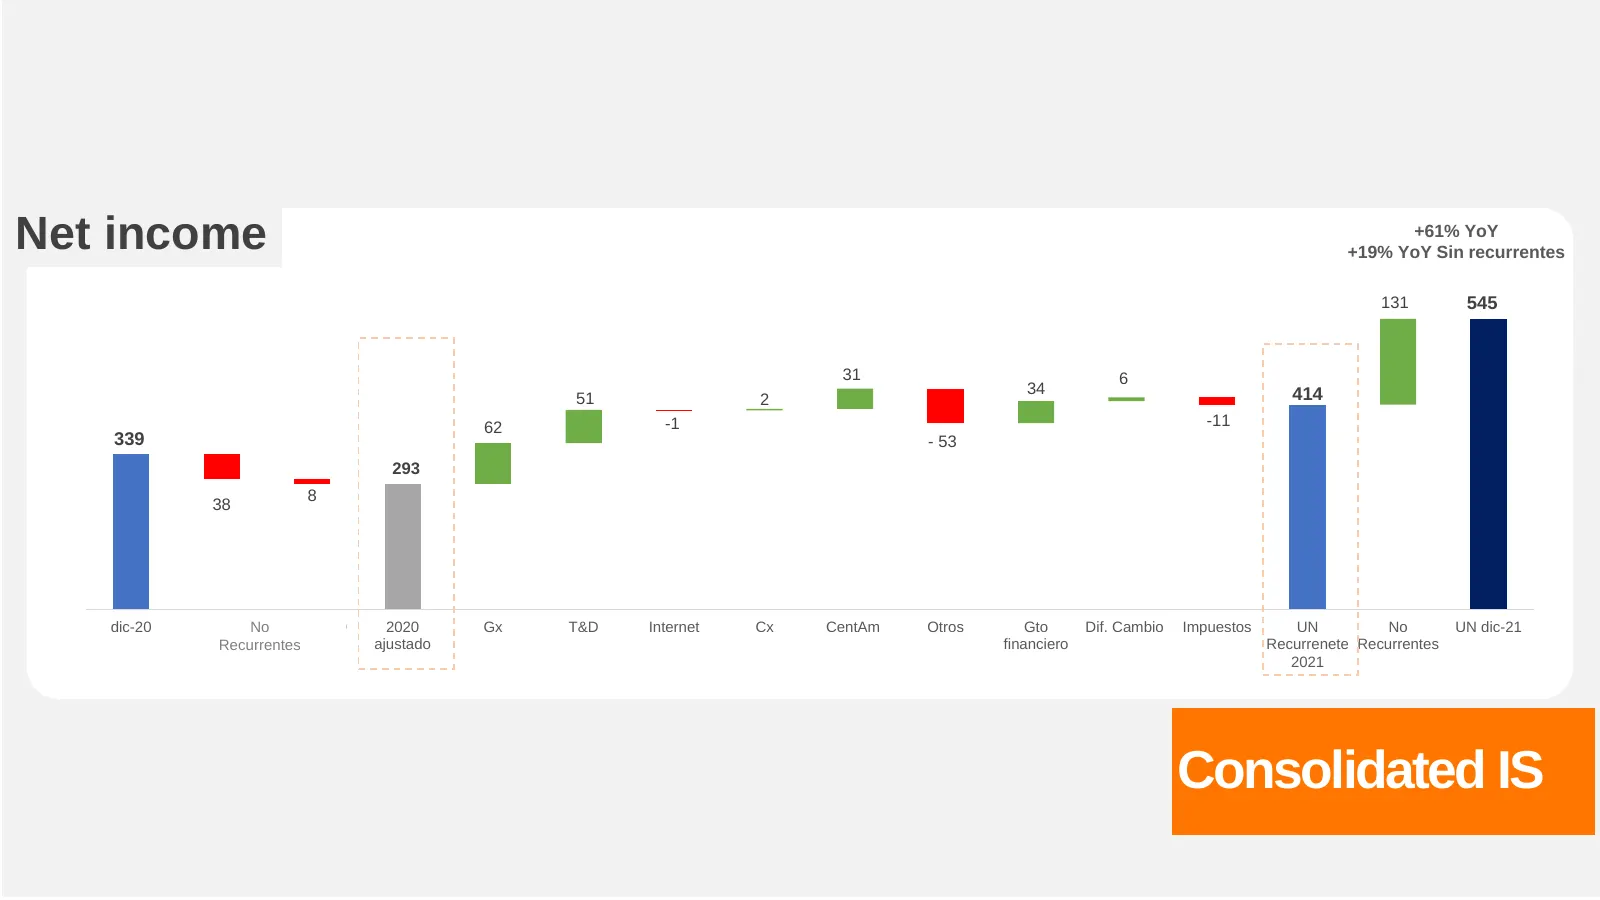
Slide 19: Consolidated IS - Net income
Net income +61% YoY +19% YoY Sin recurrentes 131 545 31 6 34 414 51 2 62 -1 -11 339 - 53 293 8 38 dic-20 Prime No PRO 2019 2020 Gx T&D Internet Cx CentAm Otros Gto Dif. Cambio Impuestos UN No UN dic-21 Recurrentes ajustado financiero Recurrenete Recurrentes 2021 Consolidated IS
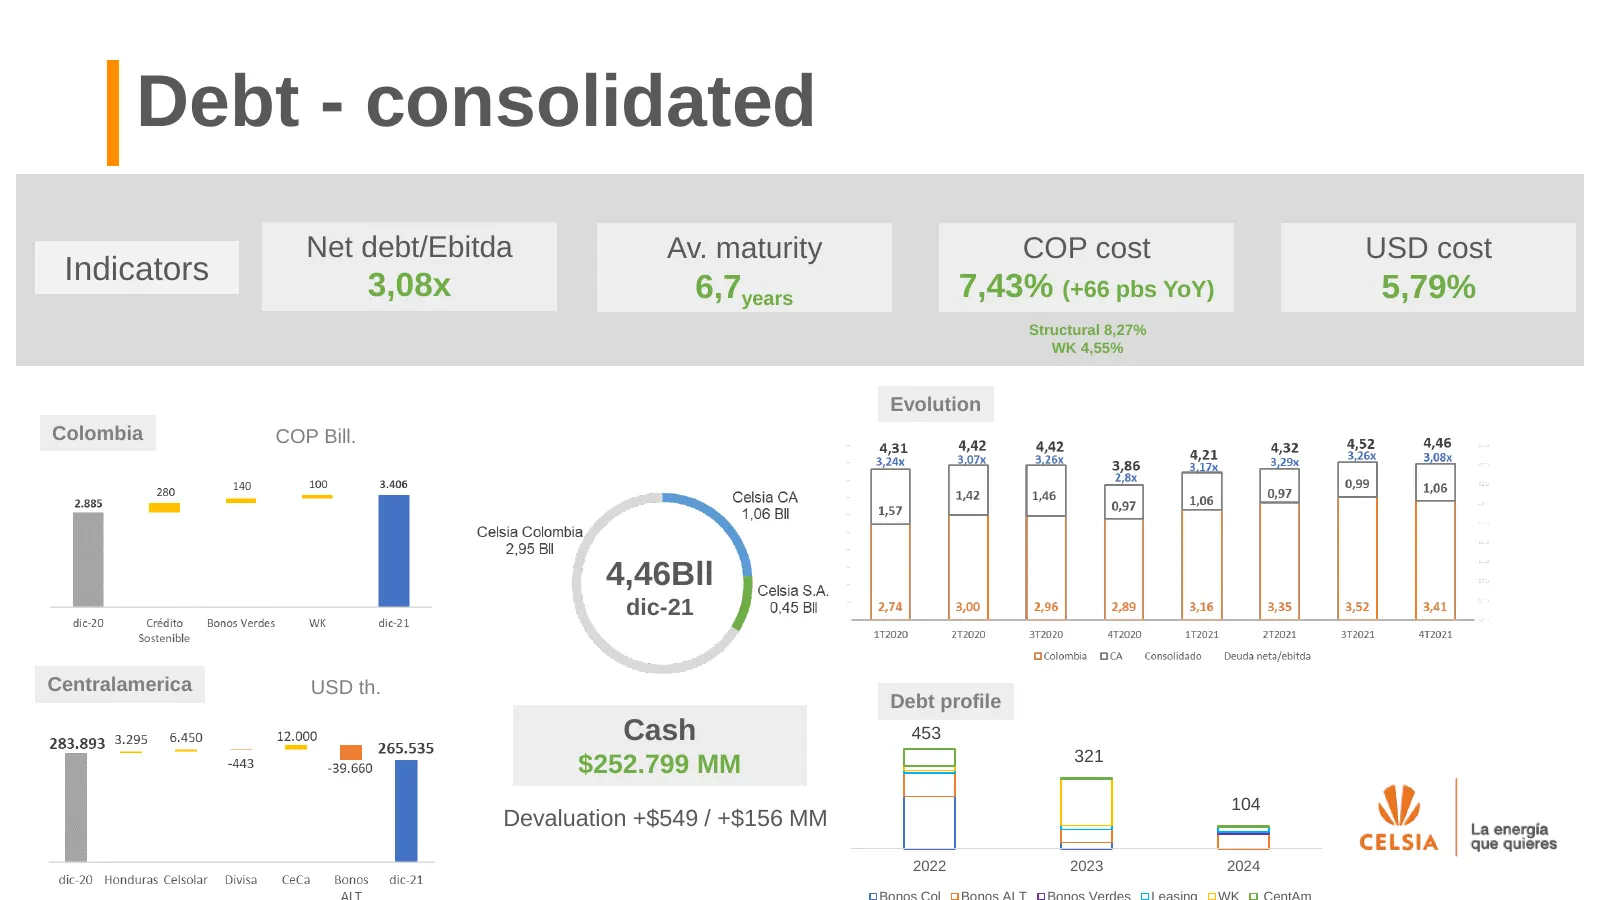
Slide 20: Debt - consolidated
Debt - consolidated Net debt/Ebitda Av. maturity COP cost USD cost Indicators 3,08x 6,7years 7,43% (+66 pbs YoY) 5,79% Structural 8,27% WK 4,55% Evolution Colombia COP Bill. 4,46Bll dic-21 Centralamerica USD th. Debt profile Cash 453 500 450 321 $252.799 MM 400 350 300 250 104 200 Devaluation +$549
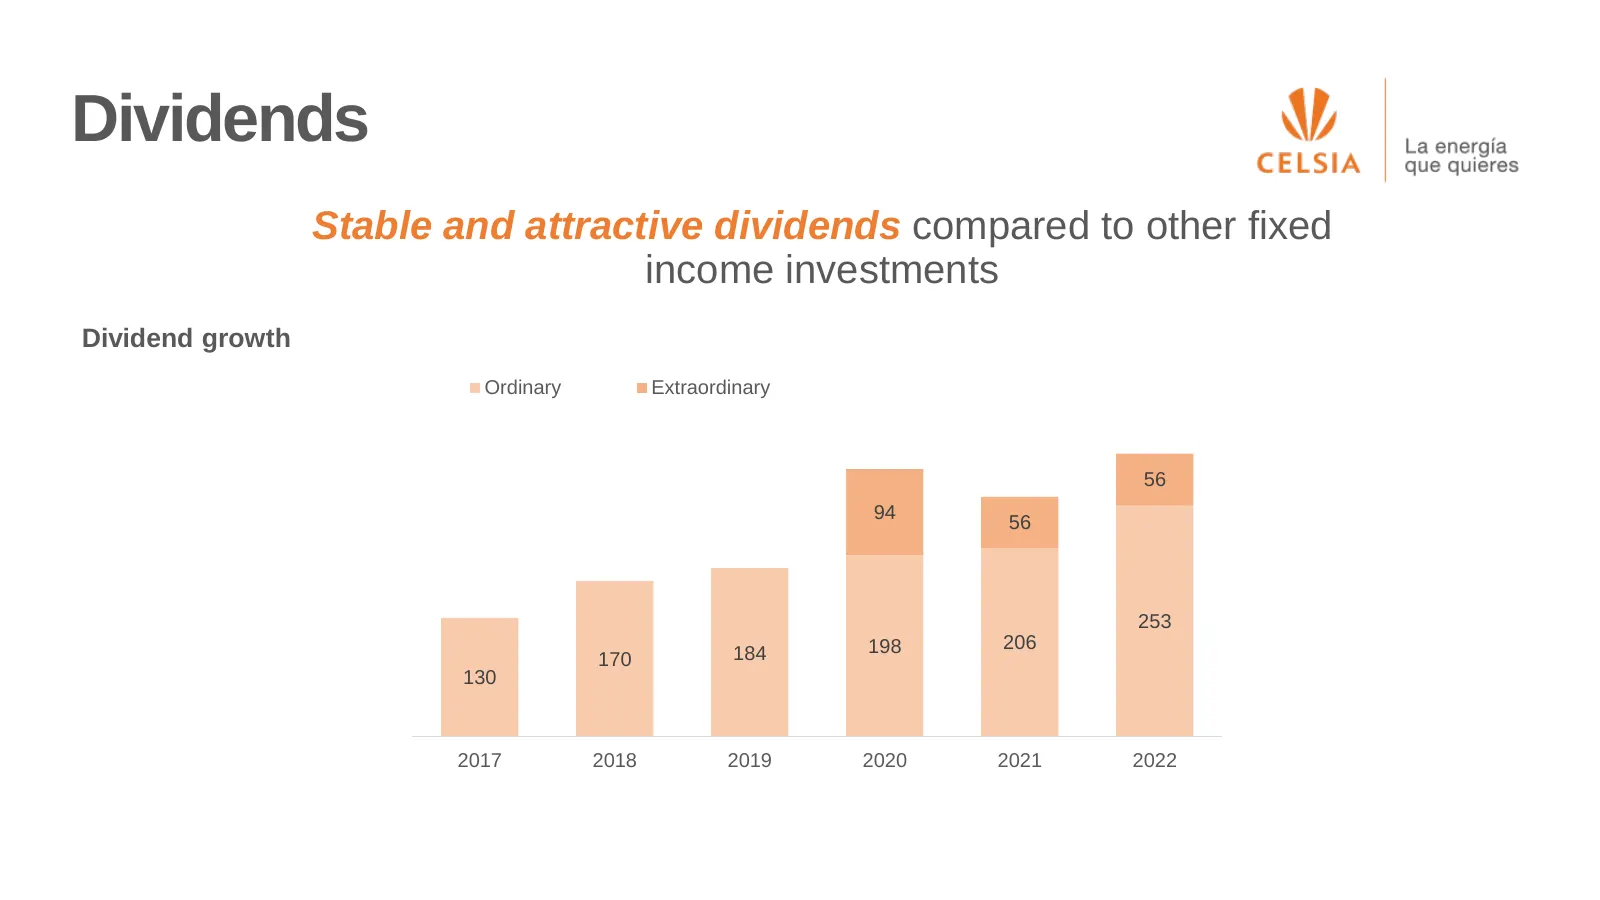
Slide 21: Dividends
Dividends Stable and attractive dividends compared to other fixed income investments Dividend growth Ordinary Extraordinary 350 300 56 250 94 56 200 150 253 100 198 206 170 184 130 50 0 2017 2018 2019 2020 2021 2022

Slide 22: Questions
Investor Relations Jesus Cadavid | Natalia Molina inversionistas@celsia.com +57 3266600 ext. 14514 QUESTIONS
Source: Internet Archive copy of celsia.com
More decks from Celsia SA ESP
 Q3 2026 Earnings Presentation15 slides · November 2026
 Celsia — Investor Presentation (June 2026)26 slides · June 2026
 Celsia — Investor Presentation (June 2026)26 slides · June 2026
 Q4 2025 Earnings Presentation28 slides · February 2026
 Q2 2026 Earnings Presentation16 slides · 2026
 Investor Day (October 2025)46 slides · October 2025