Aryzta AG · SIX:ARYN
Aryzta — Investor Day (June 2022)
55 slides from Aryzta's investor day presentation, Jun 8, 2022
Slide 1: Capital Markets Day
Capital Markets Day 8 June 2022
Slide 2: Forward Looking Statement
Forward Looking Statement This document contains forward looking statements which reflect the Board of Directors' current views and estimates. The forward-looking statements involve certain risks and uncertainties that could cause actual results to differ materially from those contained in the forwa
Slide 3: Agenda
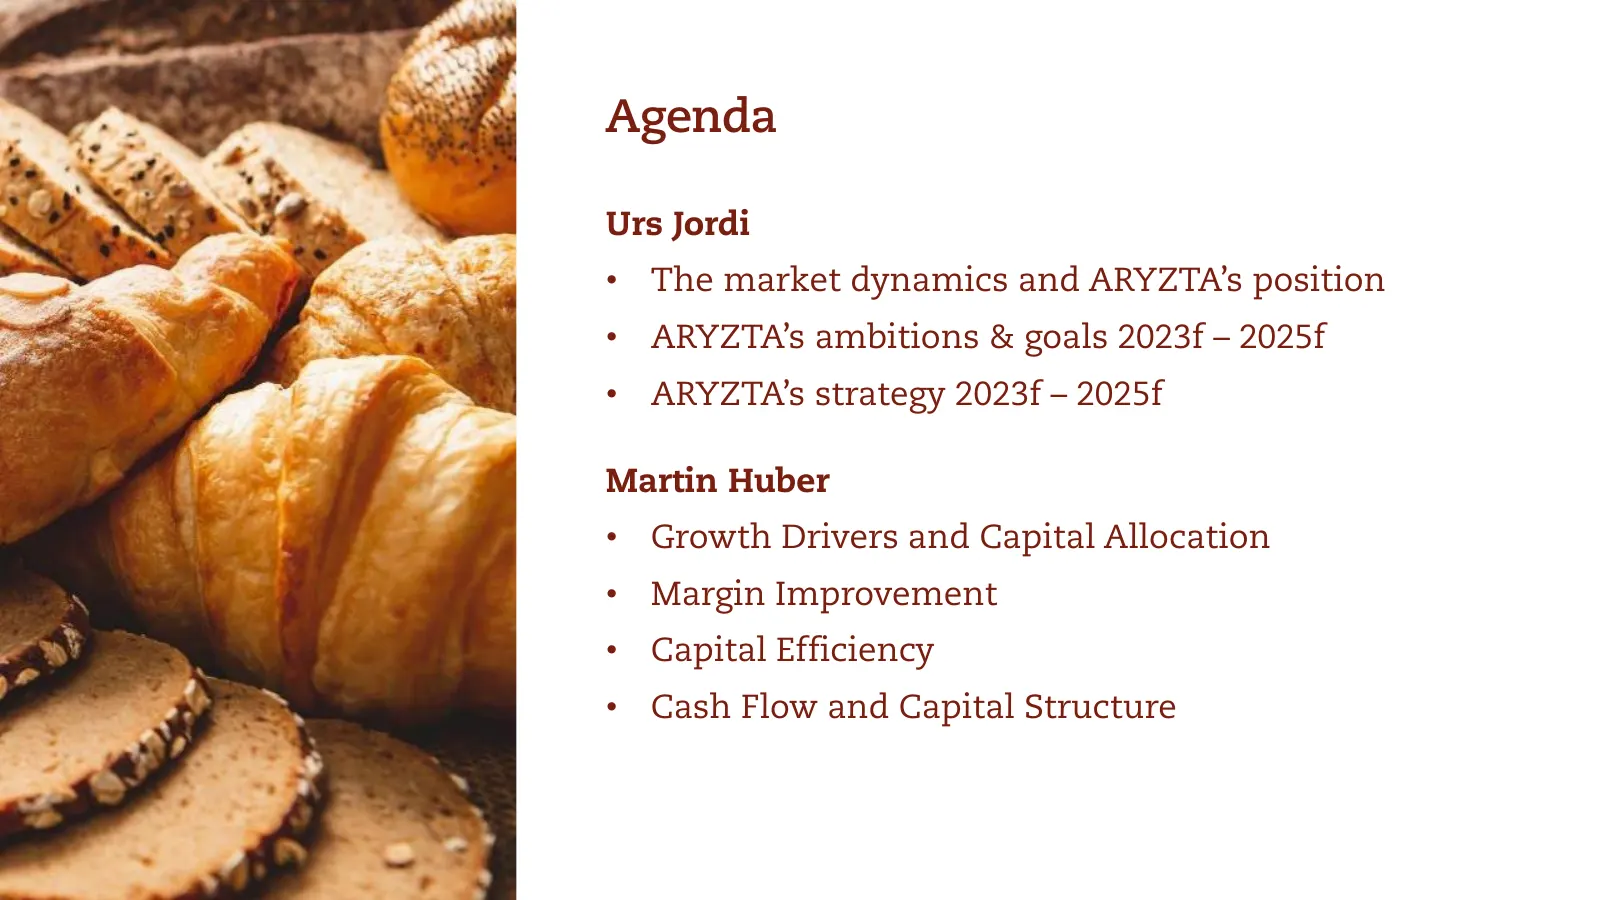
Agenda Urs Jordi • The market dynamics and ARYZTA’s position • ARYZTA’s ambitions & goals 2023f – 2025f • ARYZTA’s strategy 2023f – 2025f Martin Huber • Growth Drivers and Capital Allocation • Margin Improvement • Capital Efficiency • Cash Flow and Capital Structure

Slide 4: Market dynamics and ARYZTA's position
Capital Markets Day Market dynamics and ARYZTA’s position
Slide 5: Bake-off market: Core Focus for ARYZTA
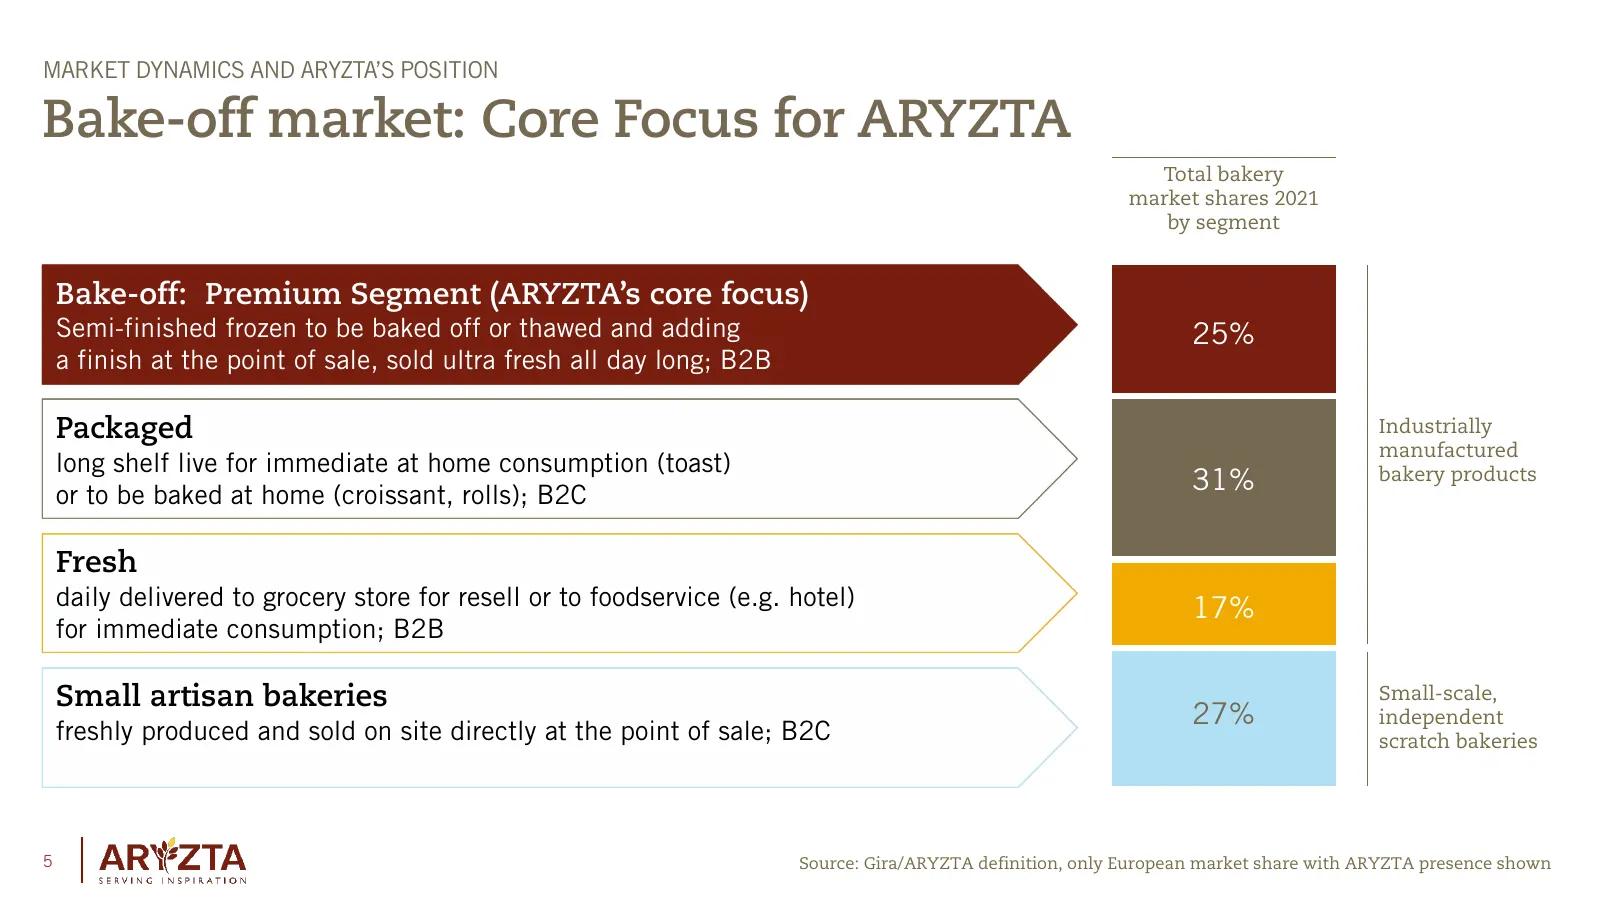
MARKET DYNAMICS AND ARYZTA’S POSITION Bake-off market: Core Focus for ARYZTA Total bakery market shares 2021 by segment Bake-off: Premium Segment (ARYZTA’s core focus) Semi-finished frozen to be baked off or thawed and adding 25% a finish at the point of sale, sold ultra fresh all day long; B2B Pack
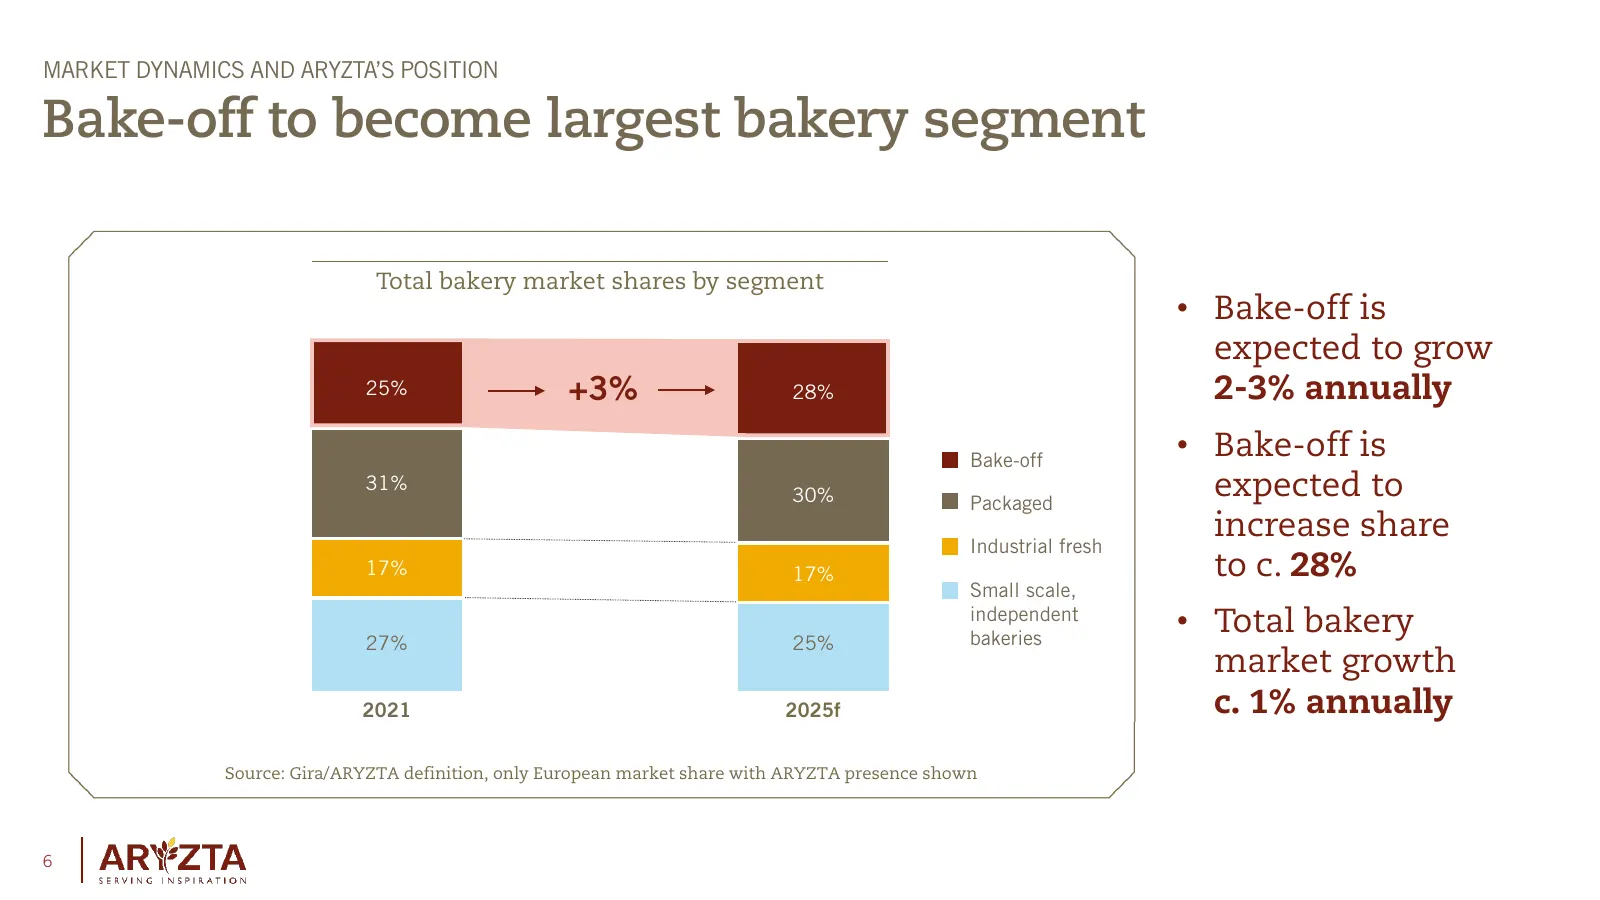
Slide 6: Bake-off to become largest bakery segment
MARKET DYNAMICS AND ARYZTA’S POSITION Bake-off to become largest bakery segment Total bakery market shares by segment • Bake-off is expected to grow 25% +3% 28% 2-3% annually Bake-off • Bake-off is 31% 30% Packaged expected to increase share Industrial fresh 17% 17% to c. 28% Small scale, independen
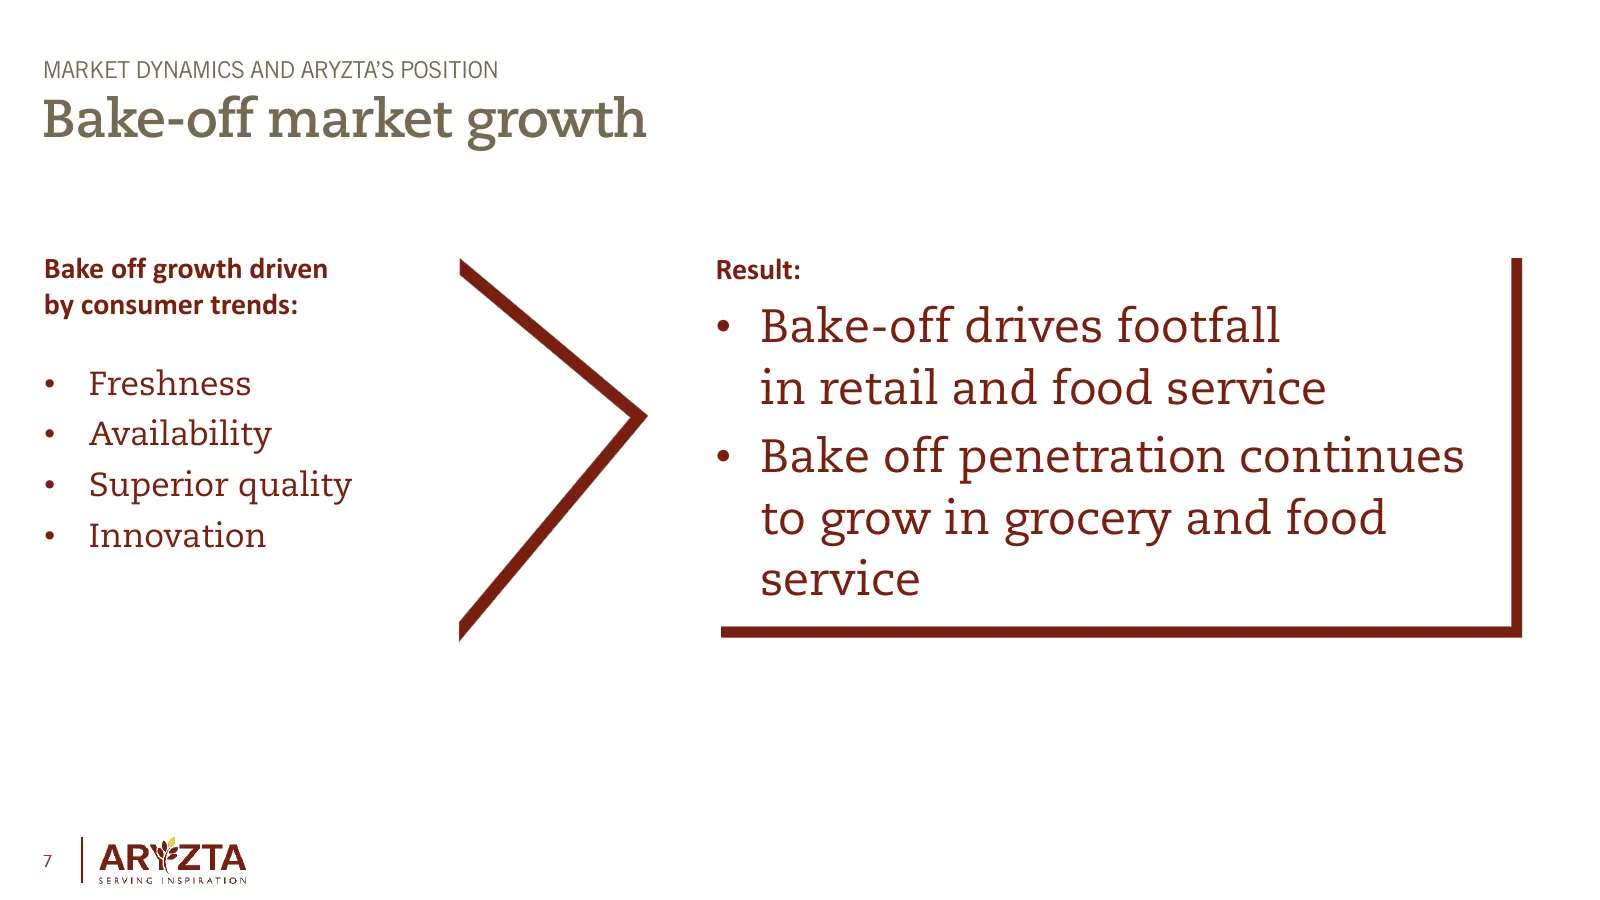
Slide 7: Bake-off market growth
MARKET DYNAMICS AND ARYZTA’S POSITION Bake-off market growth Bake off growth driven Result: by consumer trends: • Bake-off drives footfall • Freshness in retail and food service • Availability • Bake off penetration continues • Superior quality • Innovation to grow in grocery and food service 7
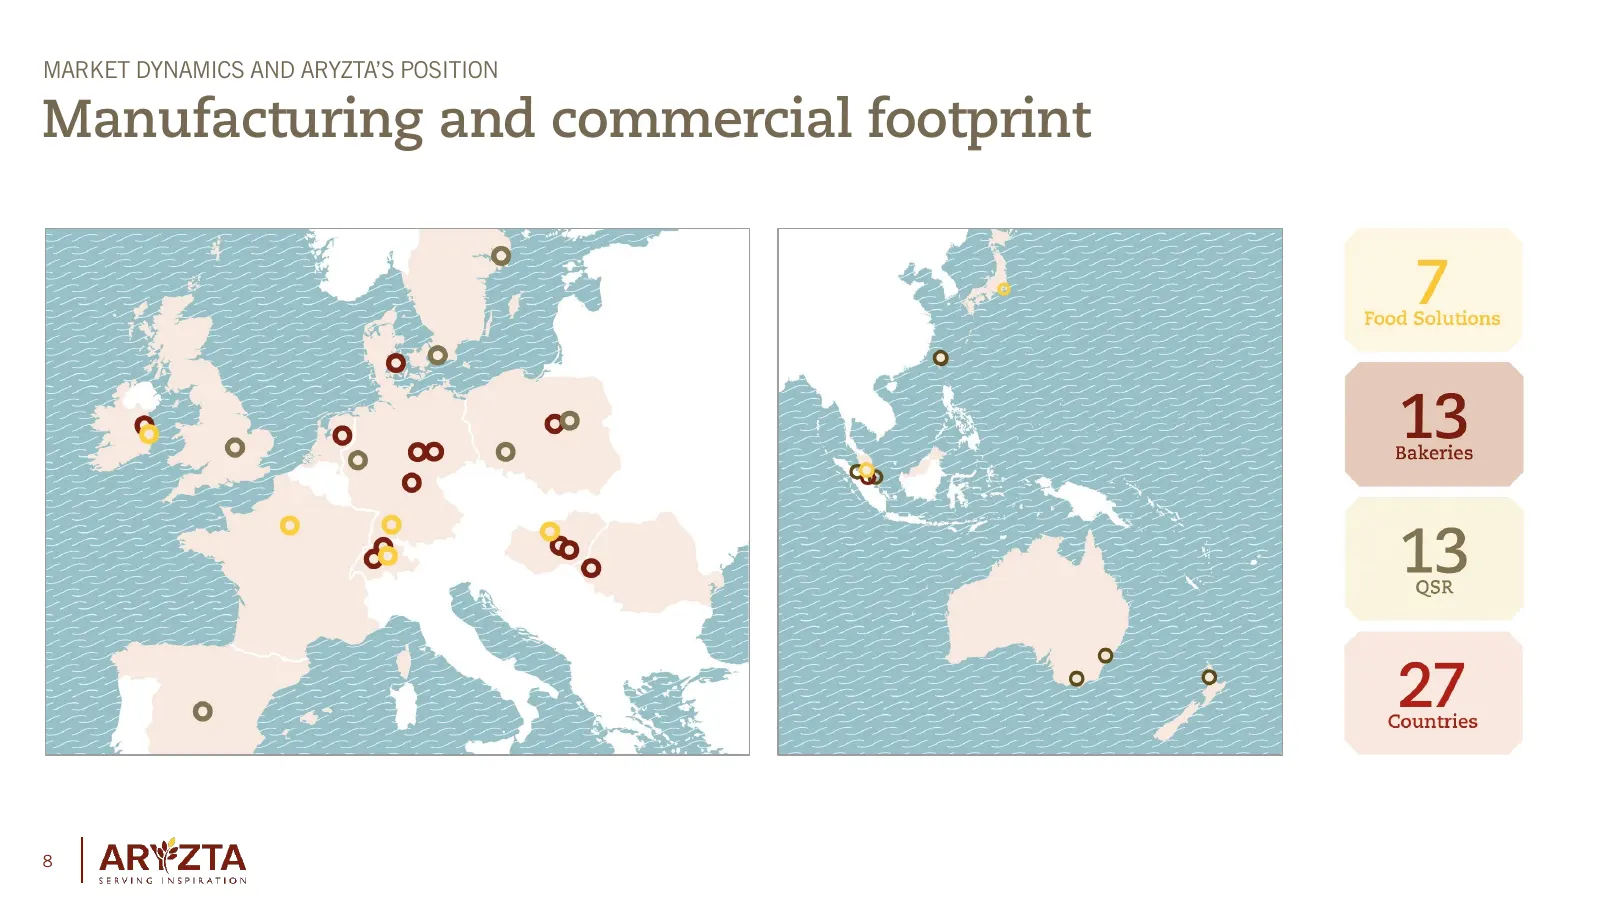
Slide 8: Manufacturing and commercial footprint
MARKET DYNAMICS AND ARYZTA’S POSITION Manufacturing and commercial footprint 8
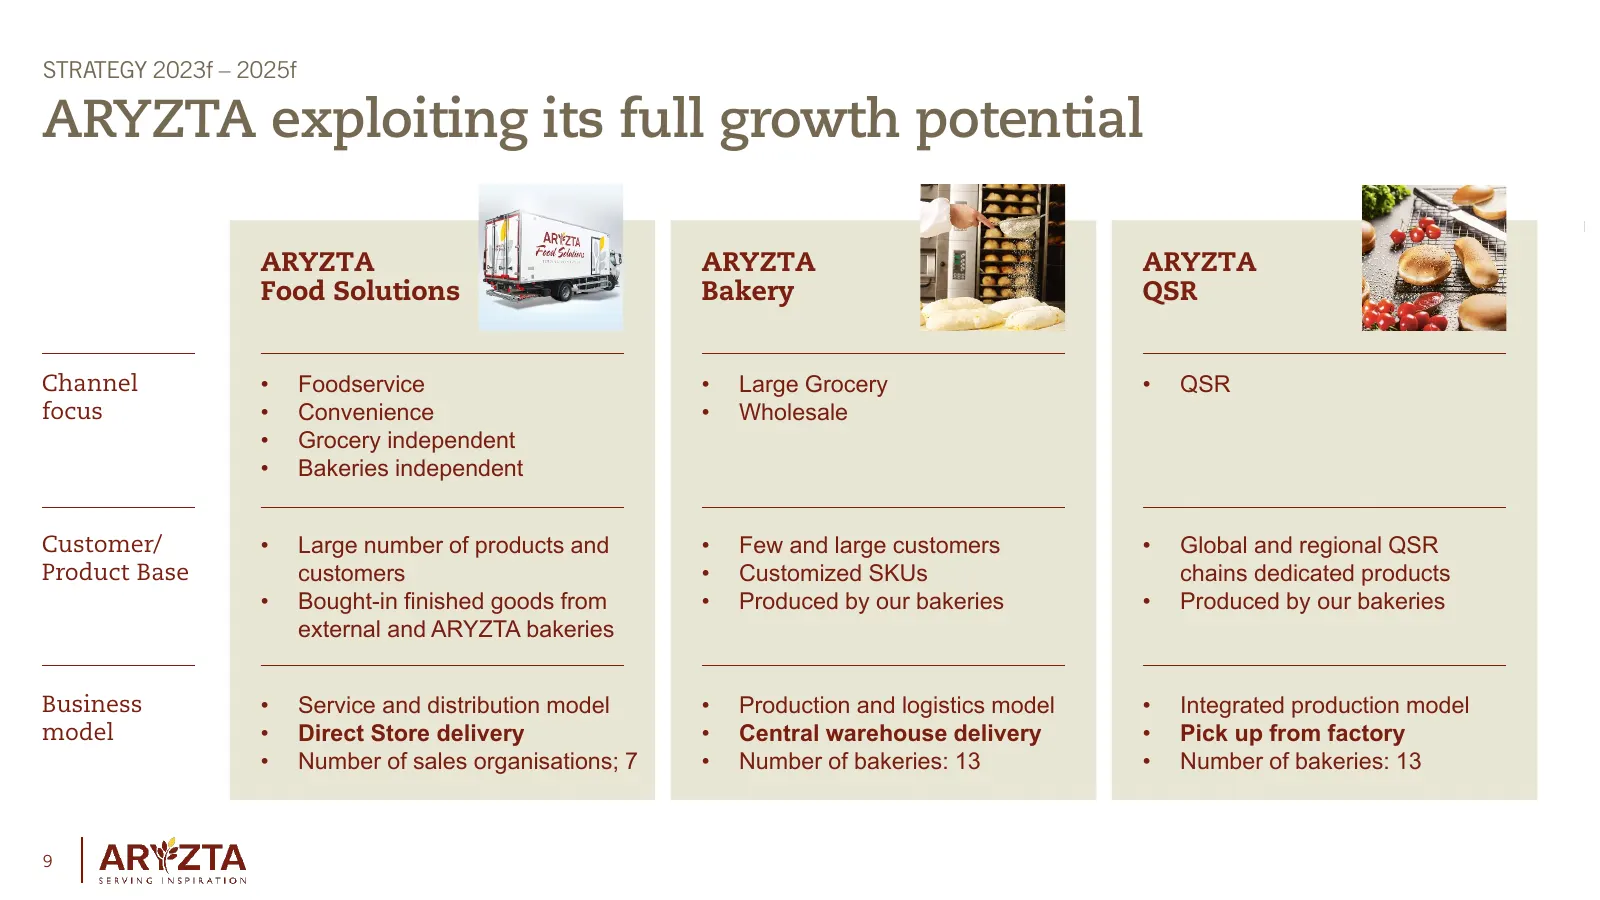
Slide 9: ARYZTA exploiting its full growth potential
STRATEGY 2023f – 2025f ARYZTA exploiting its full growth potential ARYZTA ARYZTA ARYZTA Food Solutions Bakery QSR Channel • Foodservice • Large Grocery • QSR focus • Convenience • Wholesale • Grocery independent • Bakeries independent Customer/ • Large number of products and • Few and large customer
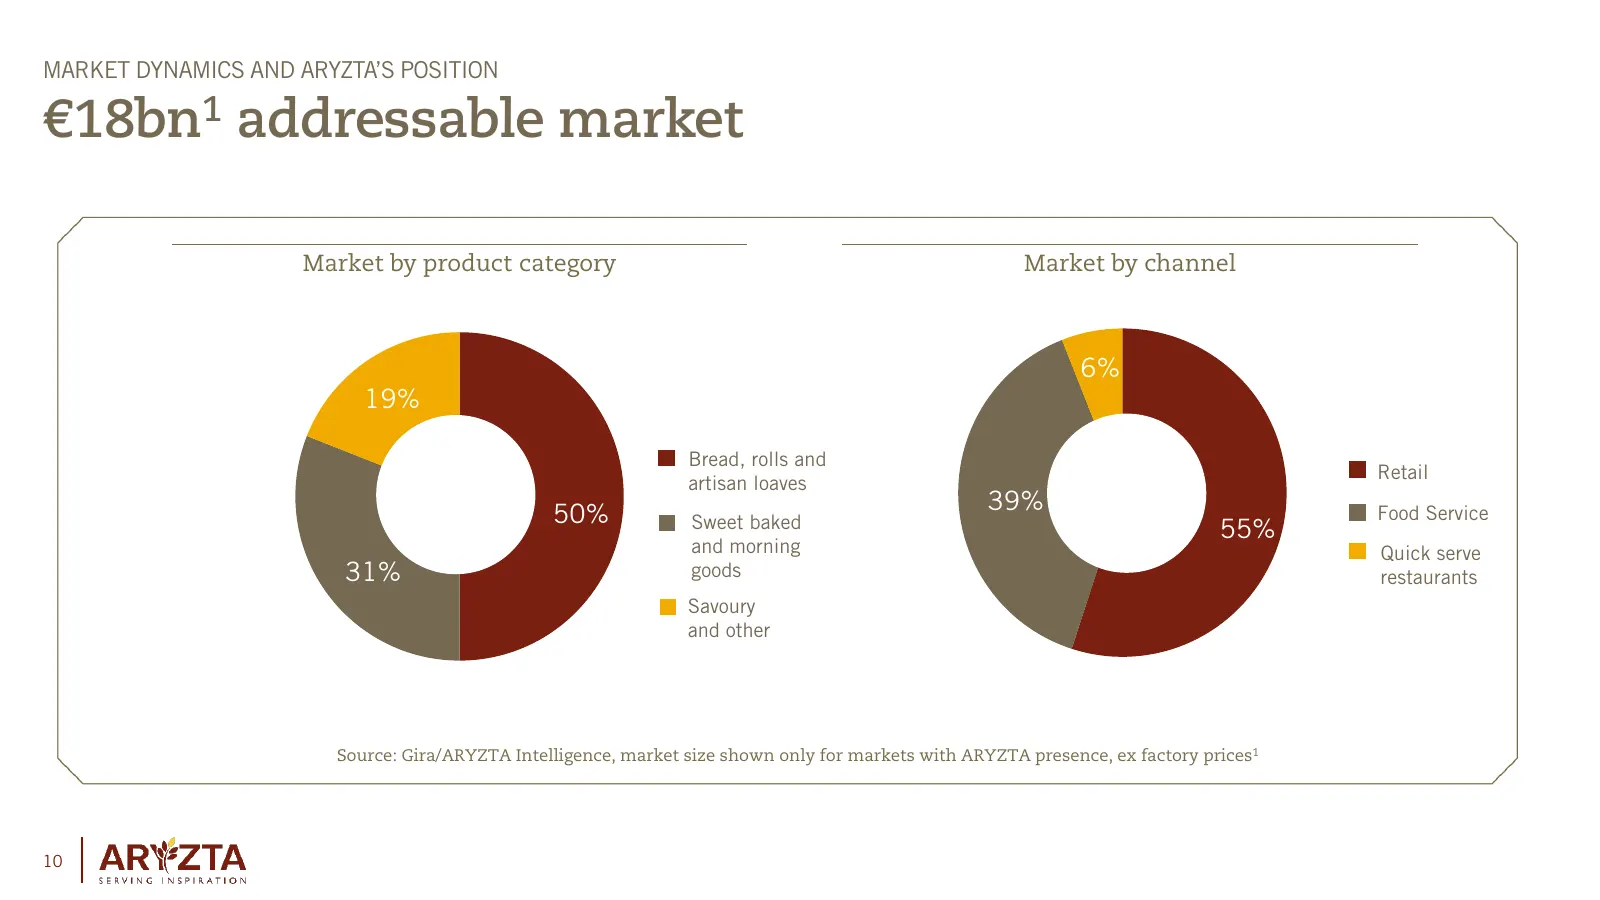
Slide 10: €18bn addressable market
MARKET DYNAMICS AND ARYZTA’S POSITION €18bn1 addressable market Market by product category Market by channel 6% 19% Bread, rolls and Retail artisan loaves 39% 50% Sweet baked Food Service 55% and morning Quick serve 31% goods restaurants Savoury and other Source: Gira/ARYZTA Intelligence, market siz
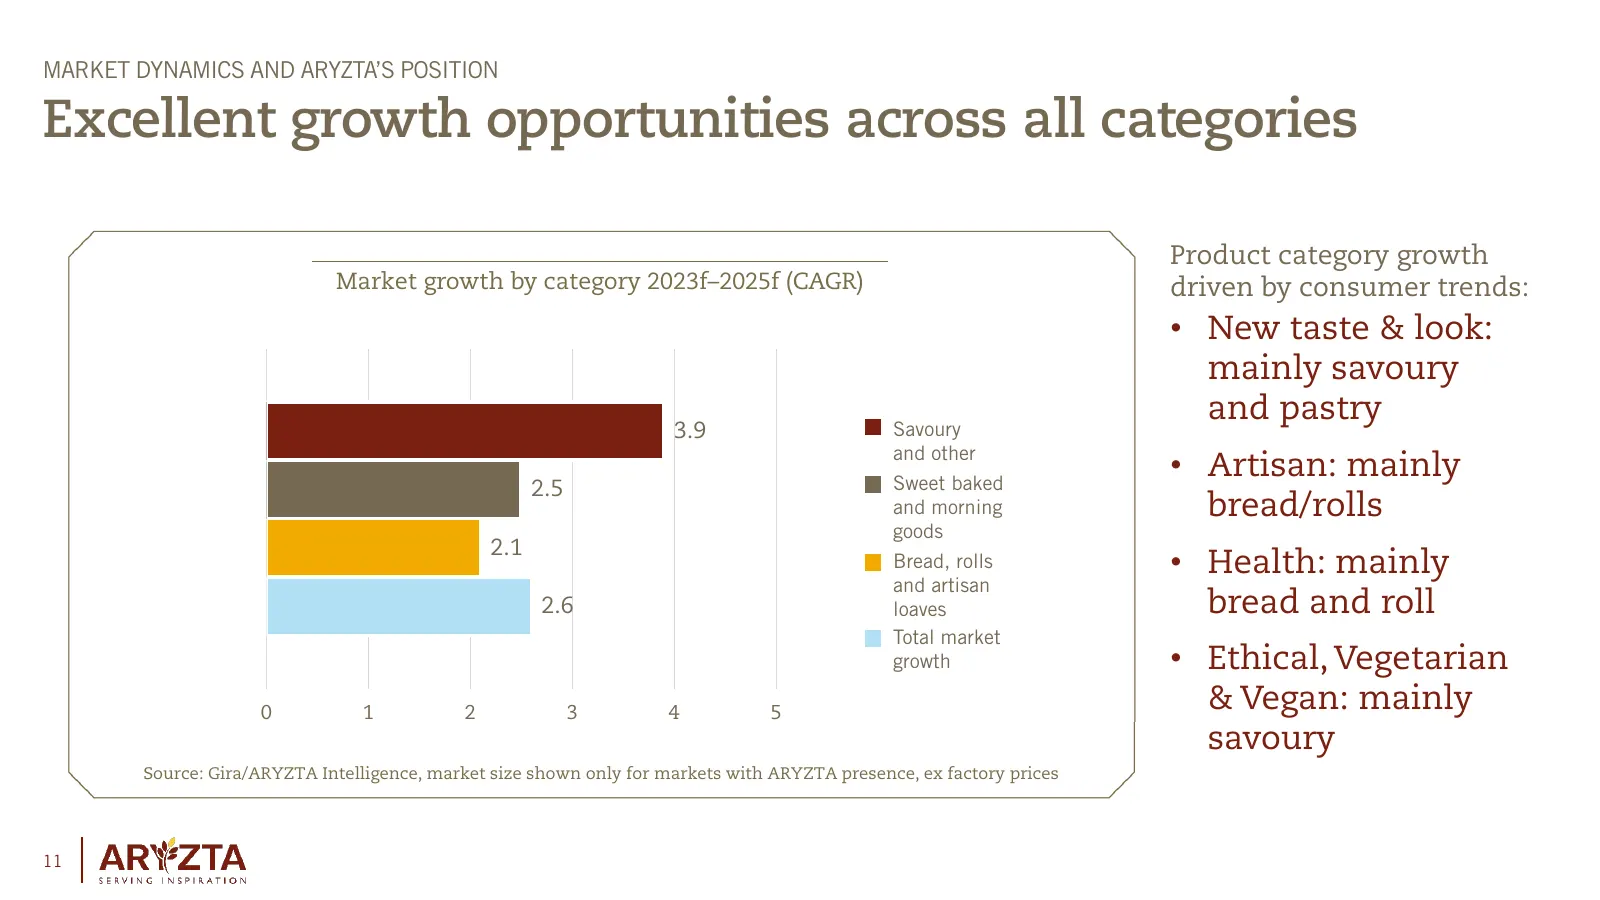
Slide 11: Excellent growth opportunities across all categories
MARKET DYNAMICS AND ARYZTA’S POSITION Excellent growth opportunities across all categories Product category growth Market growth by category 2023f–2025f (CAGR) driven by consumer trends: • New taste & look: mainly savoury and pastry 3.9 Savoury and other Sweet baked • Artisan: mainly 2.5 and morning
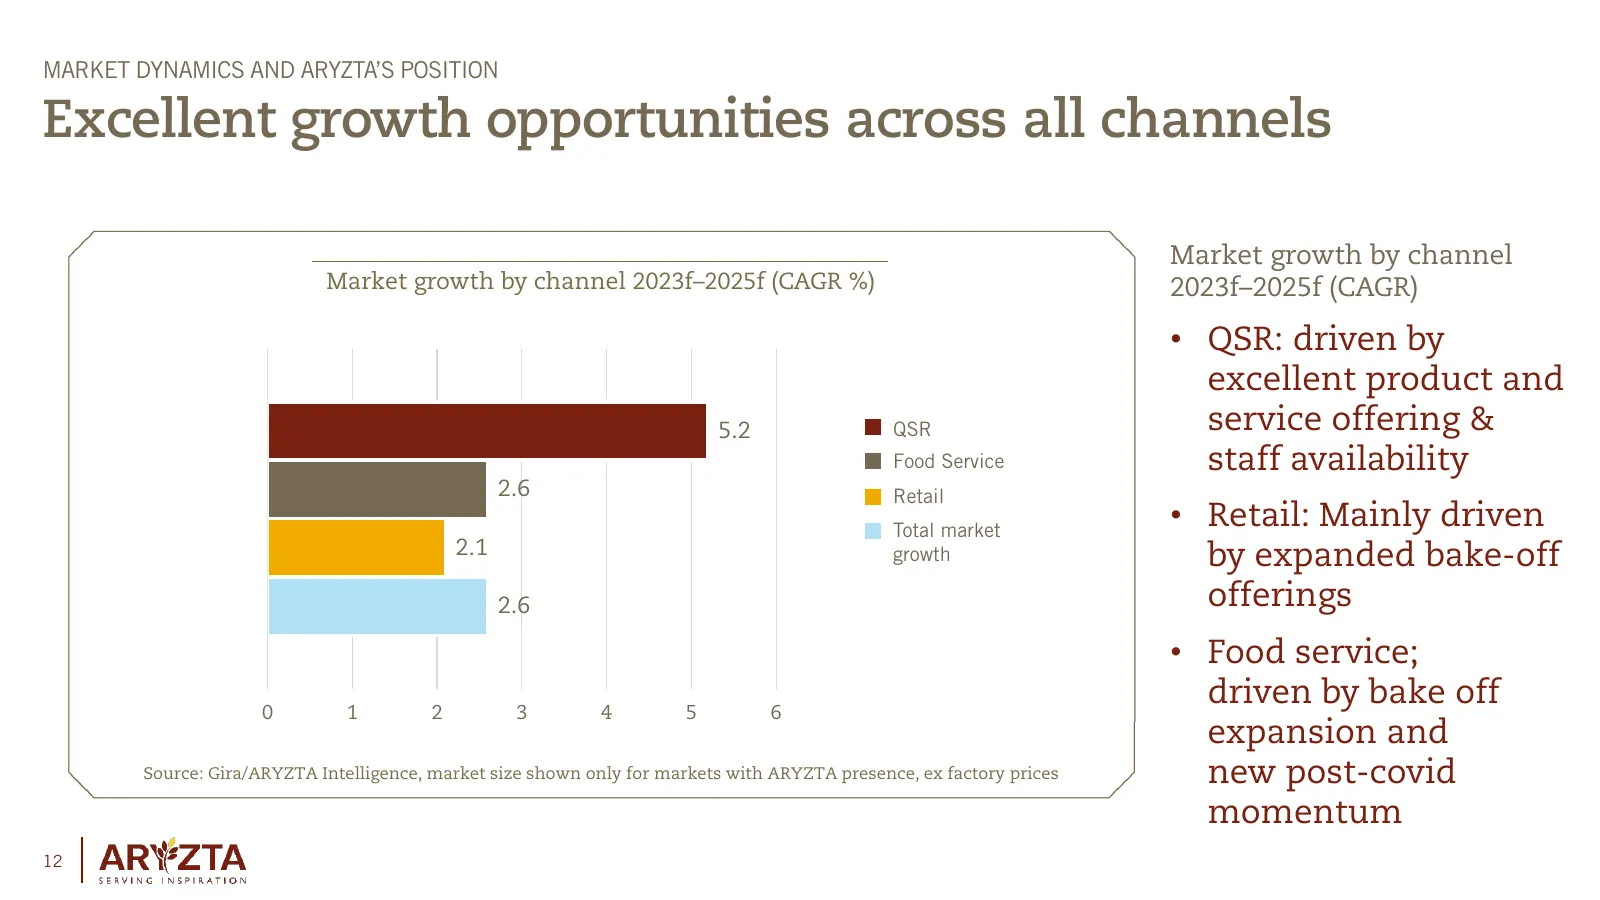
Slide 12: Excellent growth opportunities across all channels
MARKET DYNAMICS AND ARYZTA’S POSITION Excellent growth opportunities across all channels Market growth by channel Market growth by channel 2023f–2025f (CAGR %) 2023f–2025f (CAGR) • QSR: driven by excellent product and 5.2 QSR service offering & Food Service staff availability 2.6 Retail Total market
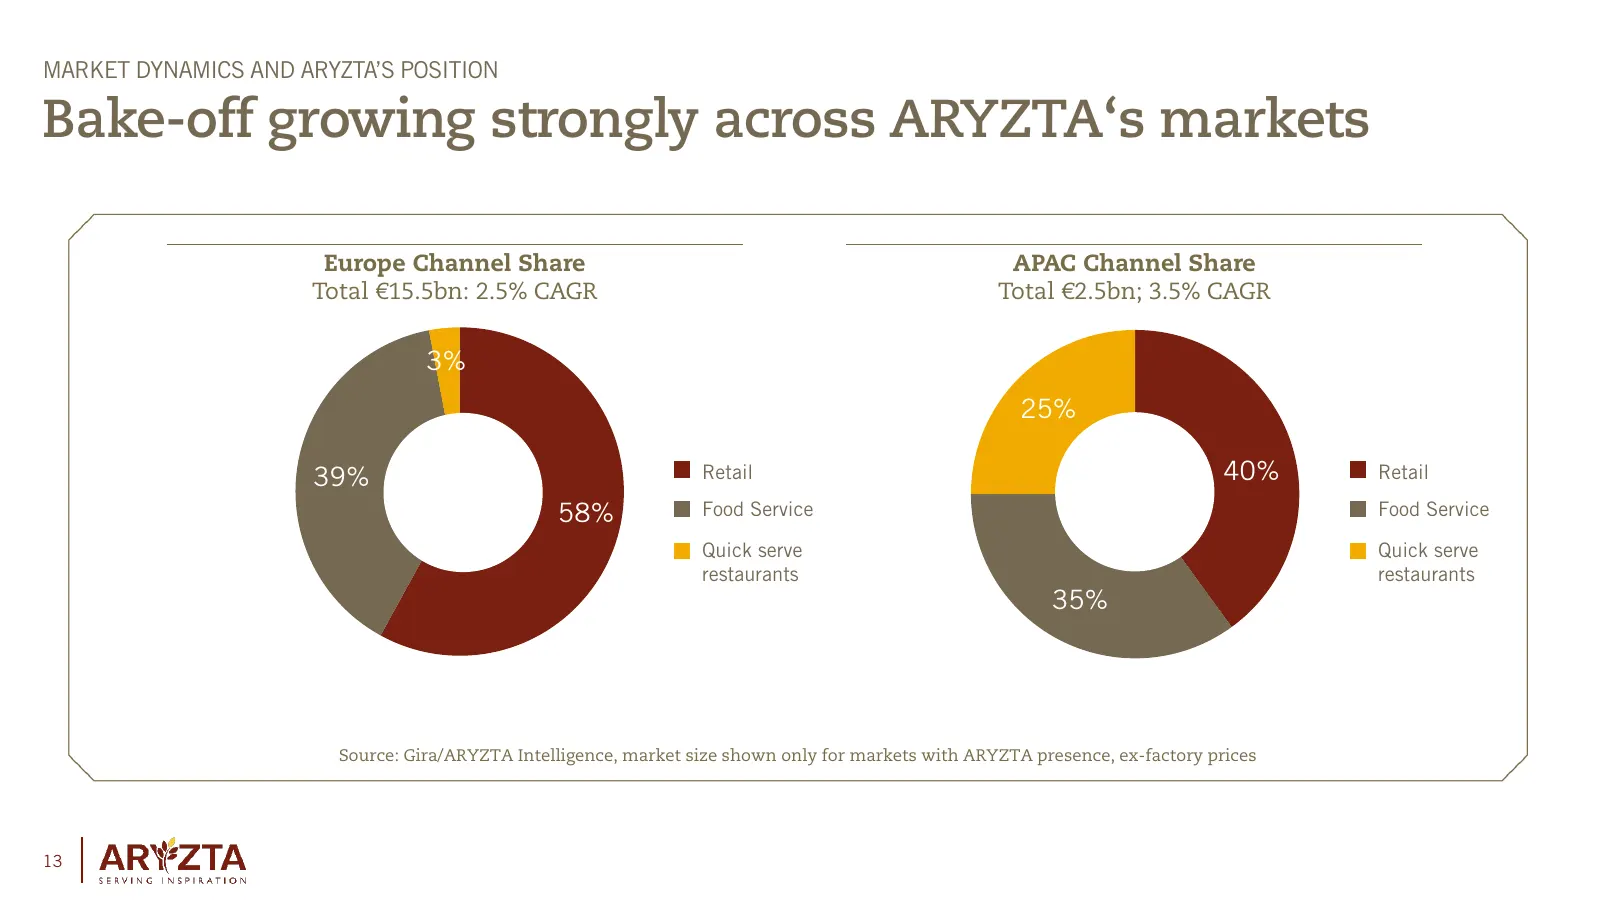
Slide 13: Bake-off growing strongly across ARYZTA's markets
MARKET DYNAMICS AND ARYZTA’S POSITION Bake-off growing strongly across ARYZTA‘s markets Europe Channel Share APAC Channel Share Total €15.5bn: 2.5% CAGR Total €2.5bn; 3.5% CAGR 3% 25% 39% Retail 40% Retail 58% Food Service Food Service Quick serve Quick serve restaurants restaurants 35% Source: Gira
Slide 14: Fragmented Competitor Landscape
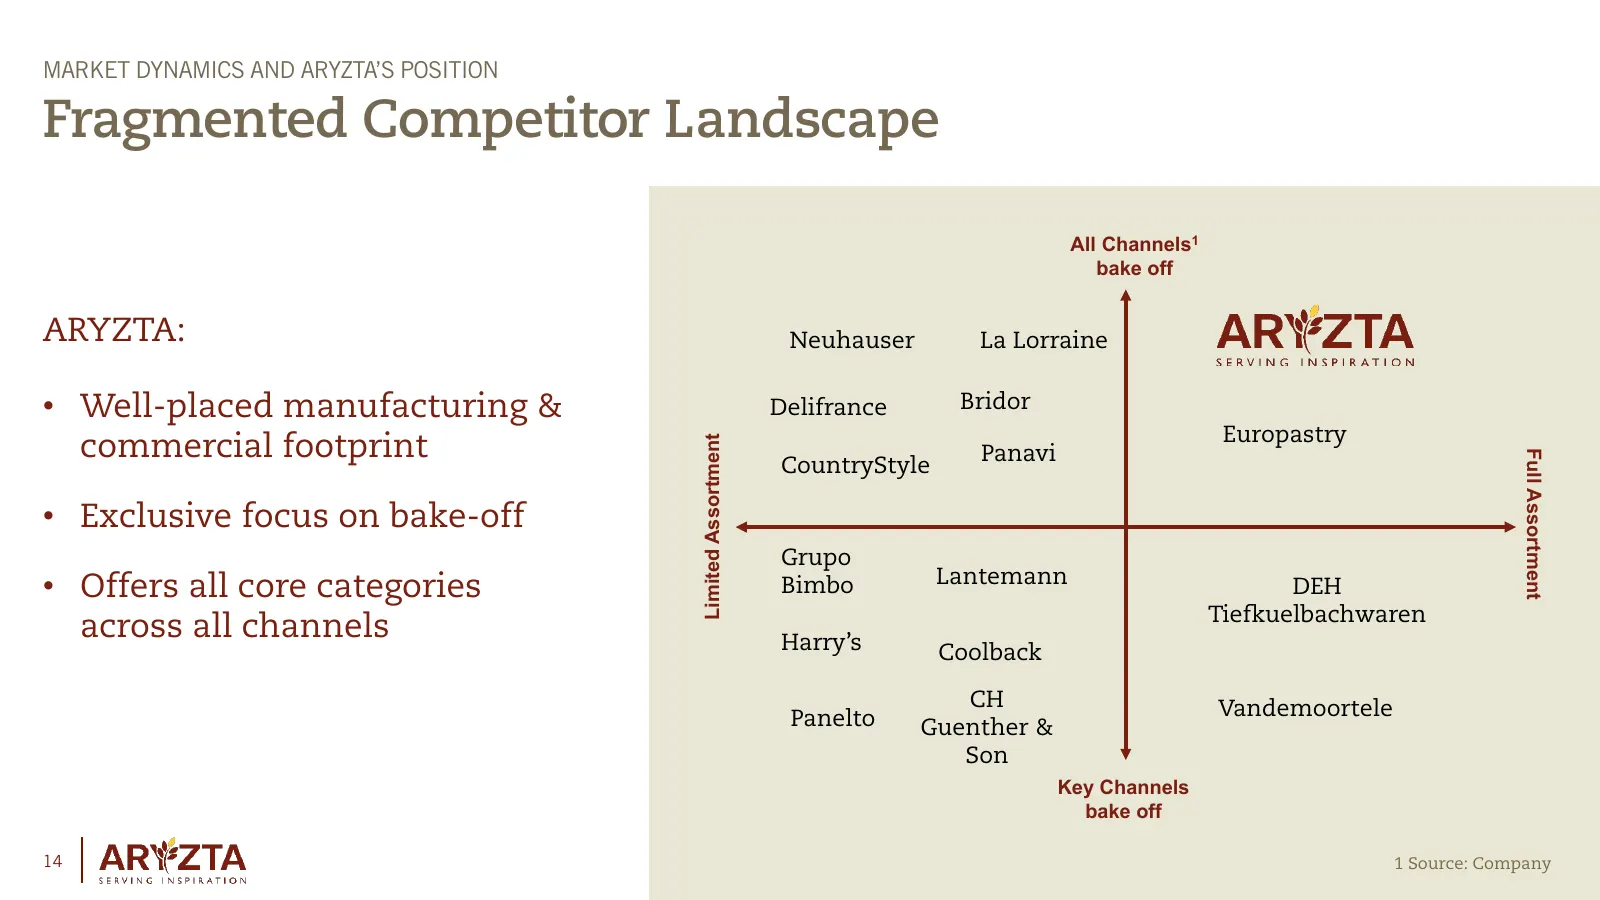
MARKET DYNAMICS AND ARYZTA’S POSITION Fragmented Competitor Landscape All Channels1 bake off ARYZTA: Neuhauser La Lorraine • Well-placed manufacturing & Delifrance Bridor Europastry commercial footprint Limited Assortment Panavi Full Assortment CountryStyle • Exclusive focus on bake-off Grupo • Offe

Slide 15: Ambitions and Goals
Capital Markets Day Ambitions and Goals
Slide 16: Ambition & Goals
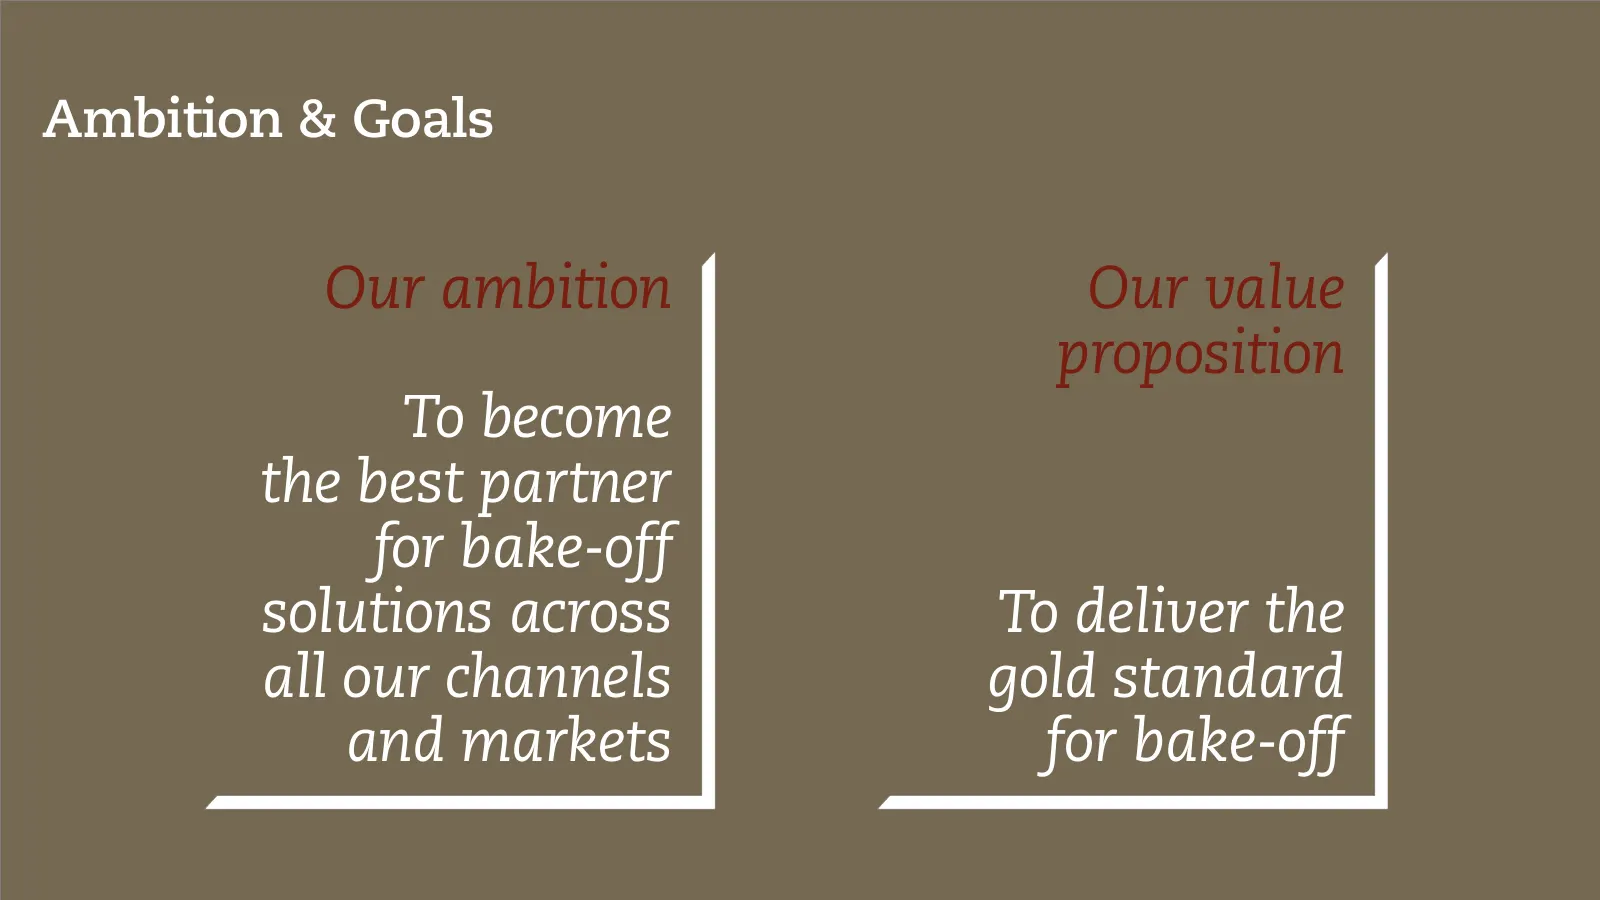
Ambition & Goals Our ambition Our value proposition To become the best partner for bake-off solutions across To deliver the all our channels gold standard and markets for bake-off
Slide 17: Significant inflation challenges remain
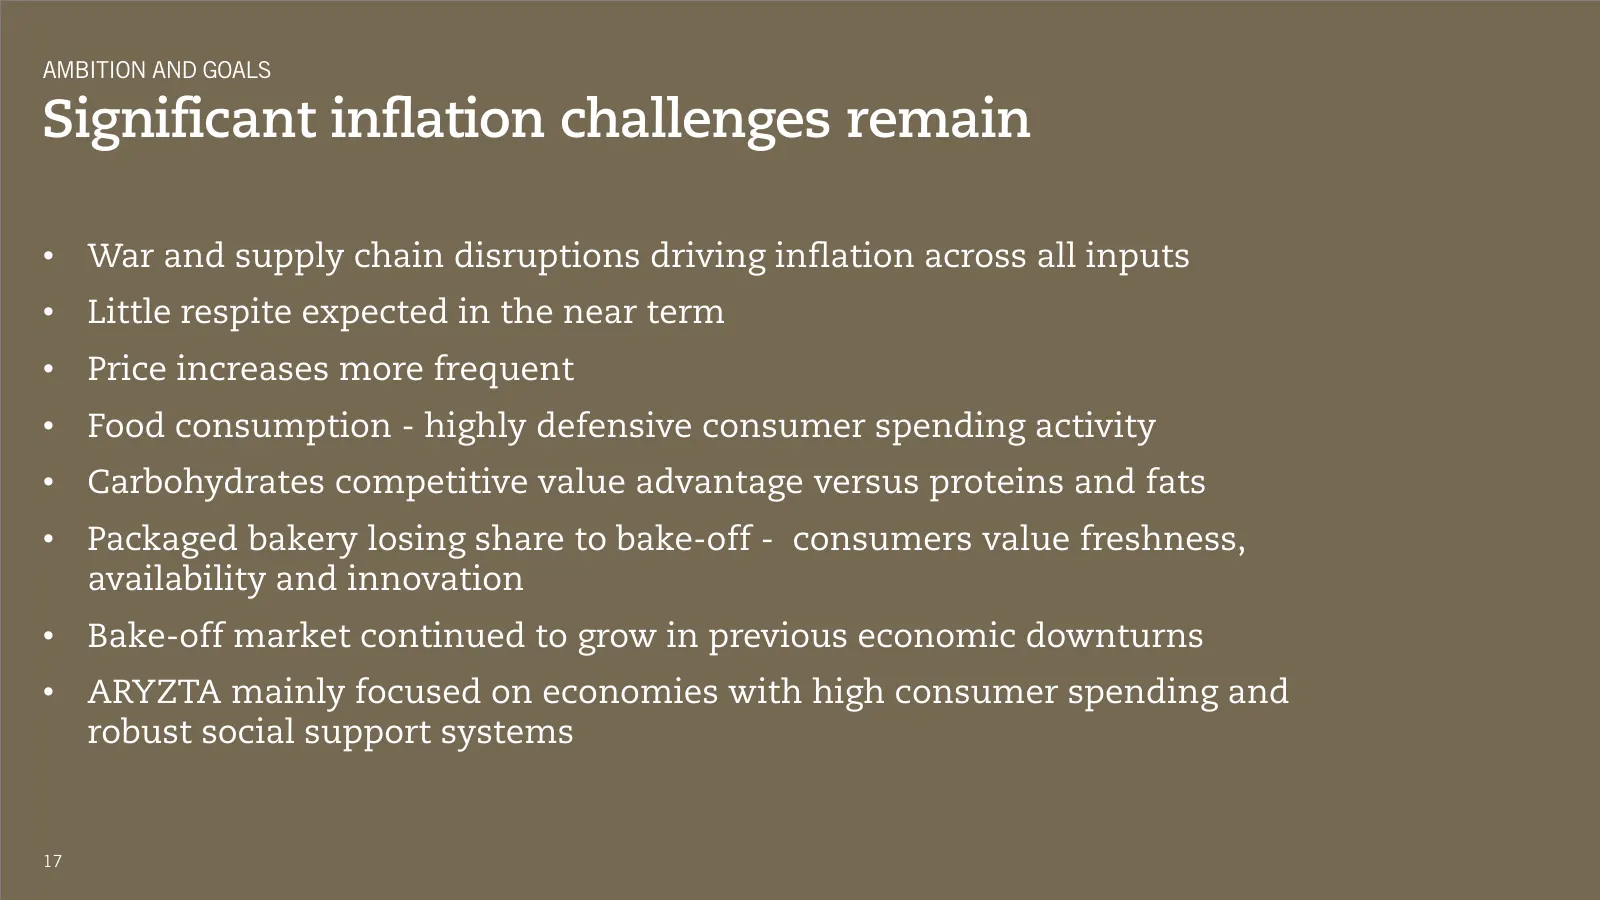
AMBITION AND GOALS Significant inflation challenges remain • War and supply chain disruptions driving inflation across all inputs • Little respite expected in the near term • Price increases more frequent • Food consumption - highly defensive consumer spending activity • Carbohydrates competitive va
Slide 18: Mid-term targets FY 2023f - FY 2025f
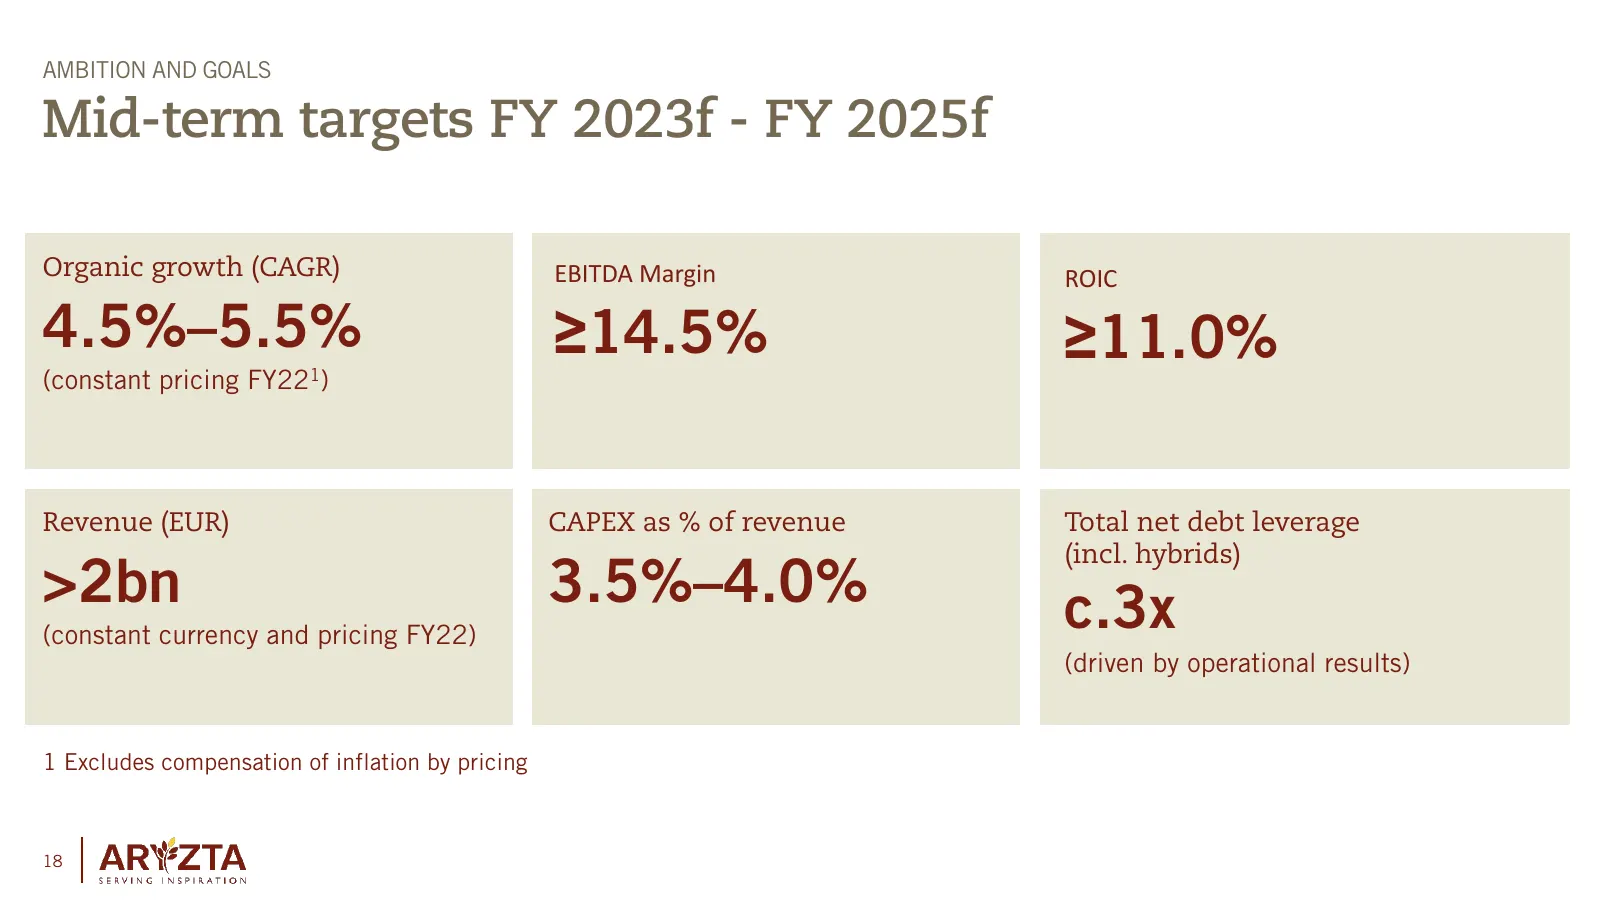
AMBITION AND GOALS Mid-term targets FY 2023f - FY 2025f Organic growth (CAGR) EBITDA Margin ROIC 4.5%–5.5% ≥14.5% ≥11.0% (constant pricing FY221) Revenue (EUR) CAPEX as % of revenue Total net debt leverage (incl. hybrids) >2bn 3.5%–4.0% c.3x (constant currency and pricing FY22) (driven by operationa

Slide 19: Strategy 2023f – 2025f
Capital Markets Day Strategy 2023f – 2025f
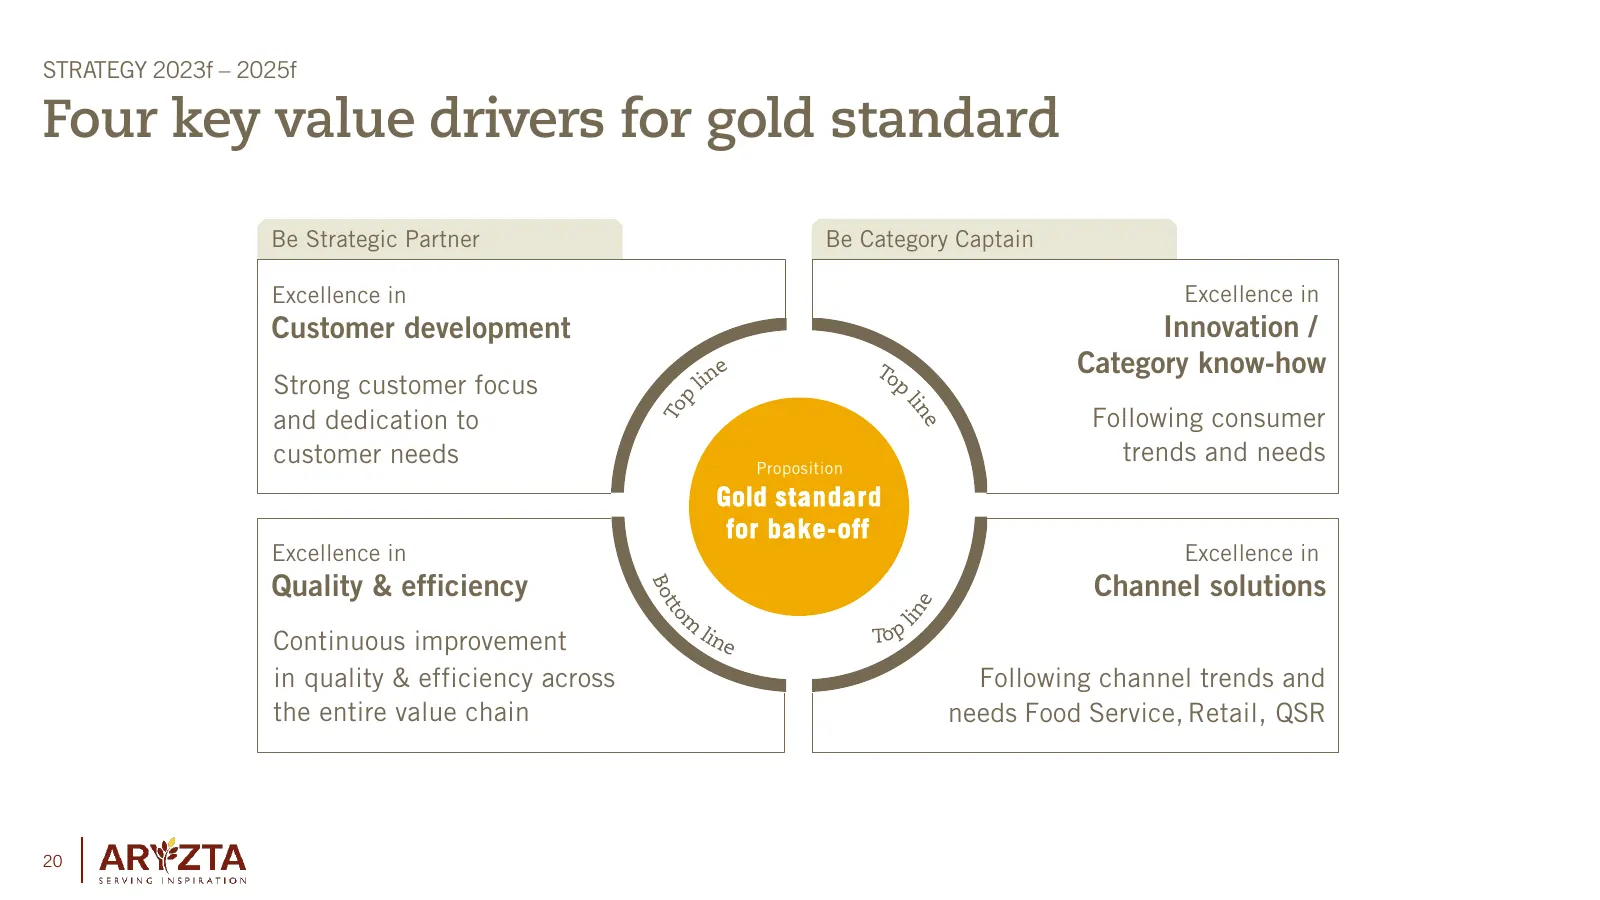
Slide 20: Four key value drivers for gold standard
STRATEGY 2023f – 2025f Four key value drivers for gold standard Be Strategic Partner Be Category Captain Excellence in Excellence in Customer development Innovation / Category know-how Strong customer focus and dedication to Following consumer customer needs Proposition trends and needs Gold standar
Slide 21: Our growth strategy is driven by baseline growth and premiumization/innovation
STRATEGY 2023f – 2025f Our growth strategy is driven by baseline growth and premiumization/ innovation
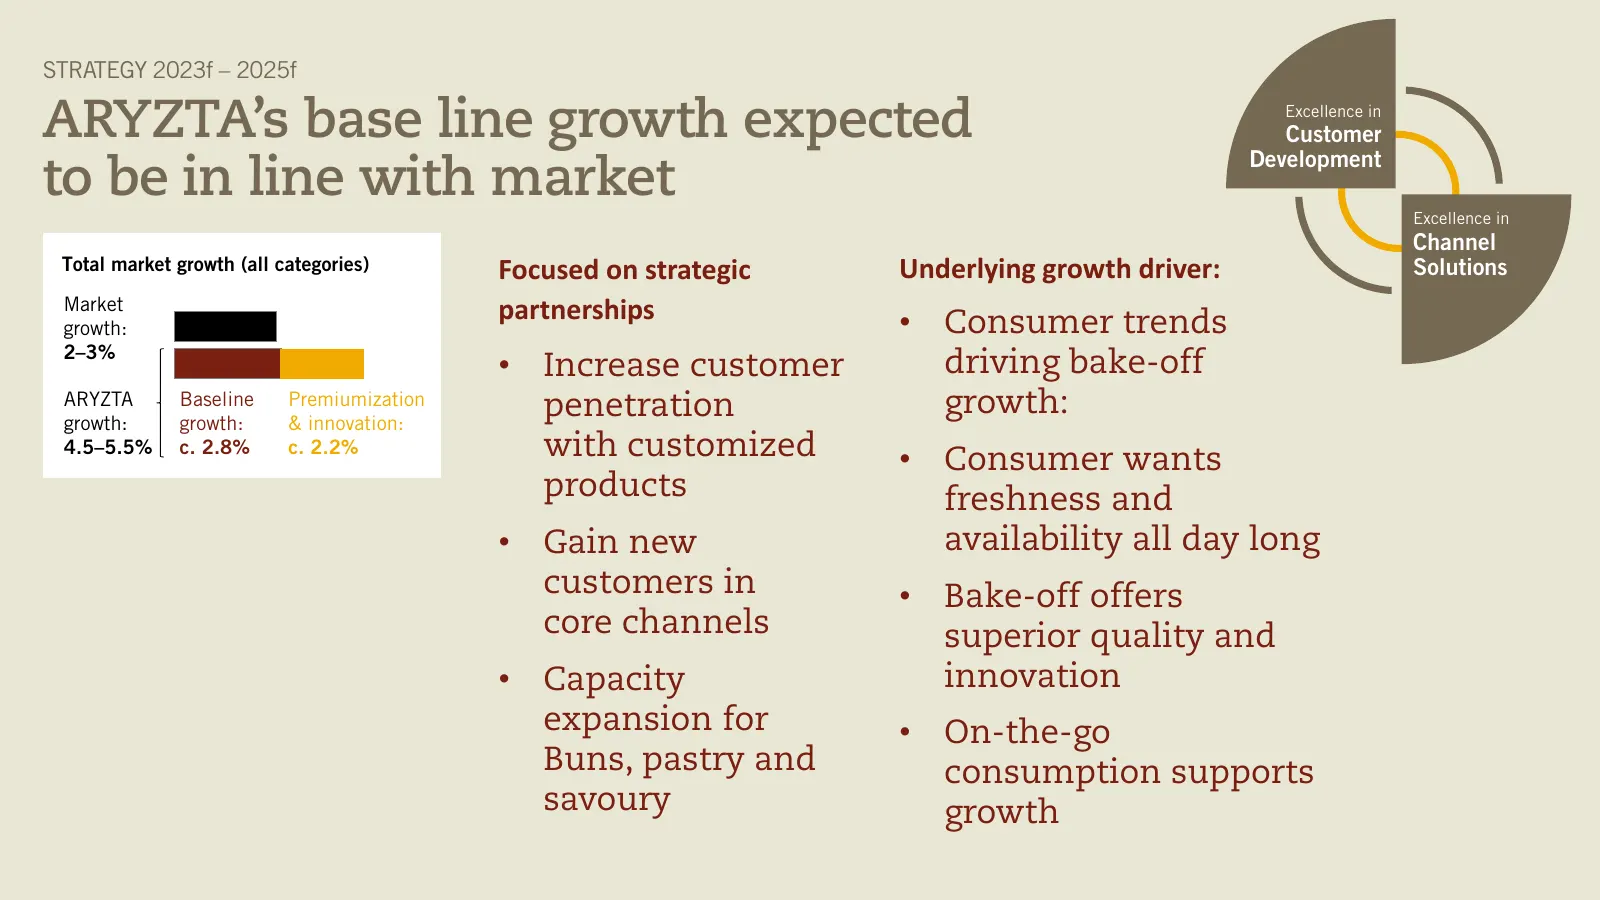
Slide 22: ARYZTA's base line growth expected to be in line with market
STRATEGY 2023f – 2025f ARYZTA’s base line growth expected Excellence in Customer Development to be in line with market Excellence in Channel Total market growth (all categories) Focused on strategic Underlying growth driver: Solutions Market partnerships • Consumer trends growth: 2–3% • Increase cus
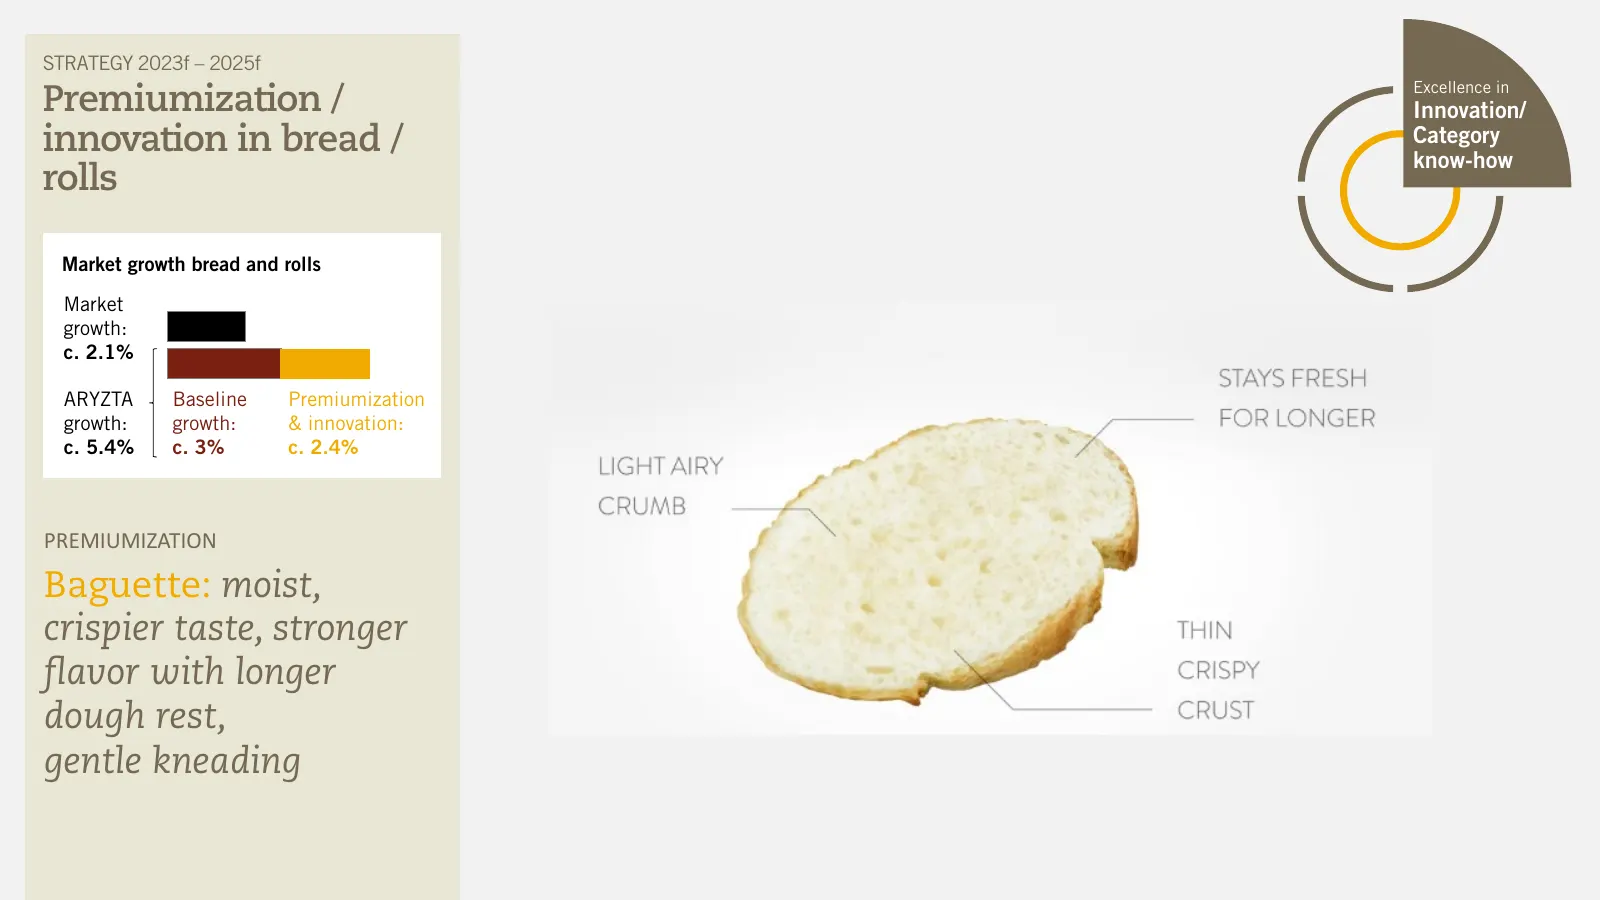
Slide 23: Premiumization / innovation in bread / rolls
STRATEGY 2023f – 2025f Excellence in Premiumization / Innovation/ innovation in bread / Category know-how rolls Market growth bread and rolls Market growth: c. 2.1% ARYZTA Baseline Premiumization growth: growth: & innovation: c. 5.4% c. 3% c. 2.4% PREMIUMIZATION Baguette: moist, crispier taste, stro
Slide 24: Premiumization / innovation in bread / rolls
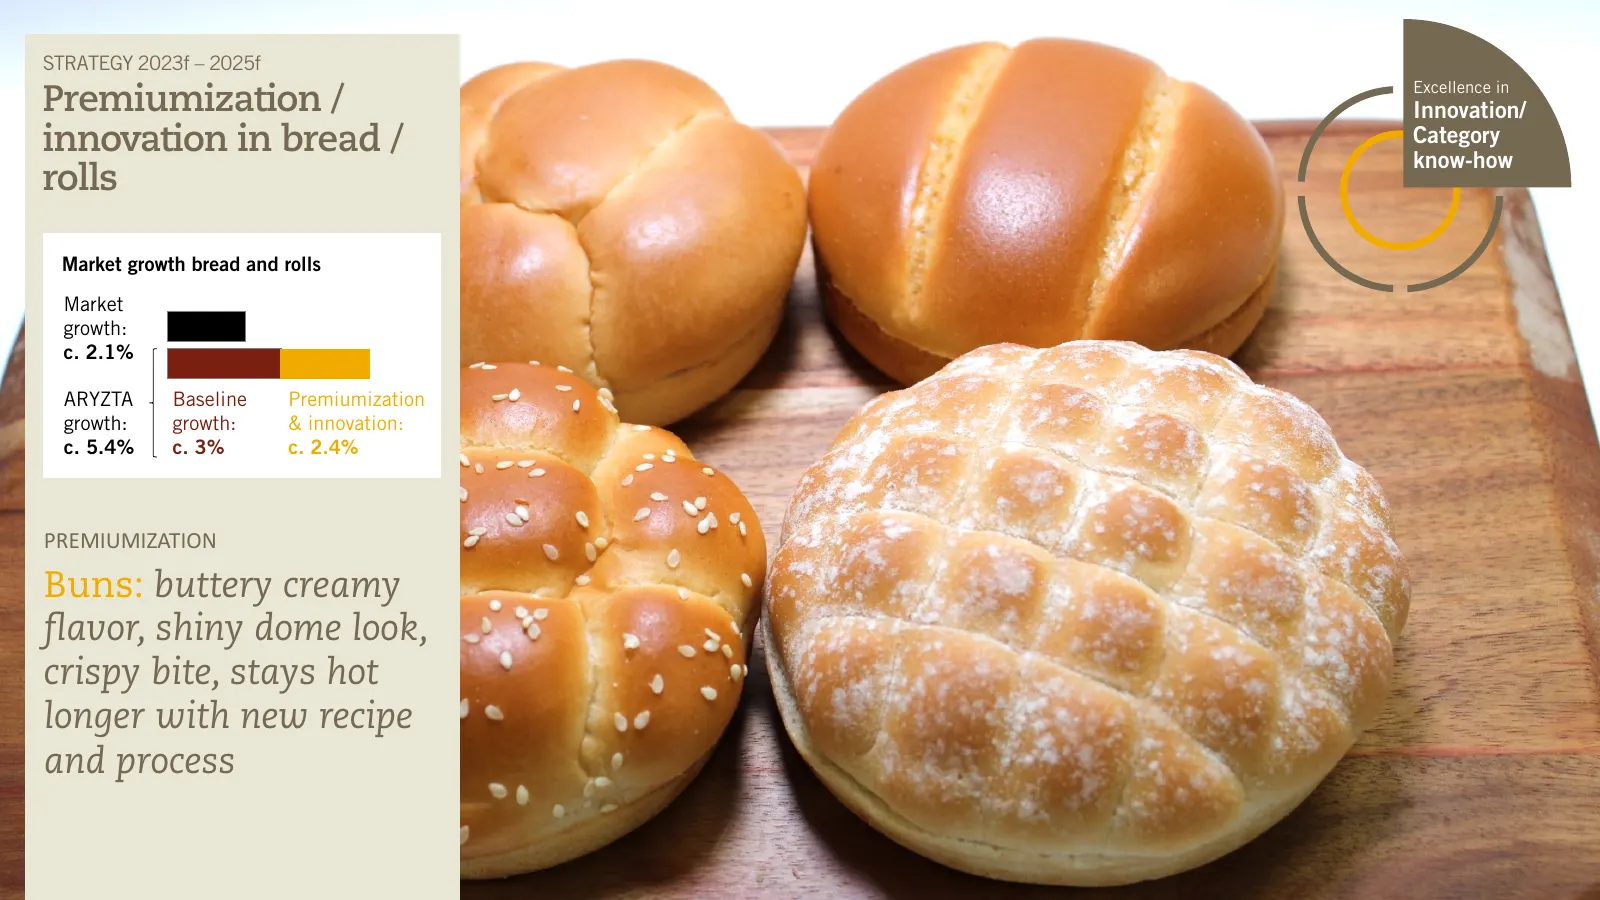
STRATEGY 2023f – 2025f Excellence in Premiumization / Innovation/ innovation in bread / Category know-how rolls Market growth bread and rolls Market growth: c. 2.1% ARYZTA Baseline Premiumization growth: growth: & innovation: c. 5.4% c. 3% c. 2.4% PREMIUMIZATION Buns: buttery creamy flavor, shiny do
Slide 25: Premiumization / innovation in bread / rolls
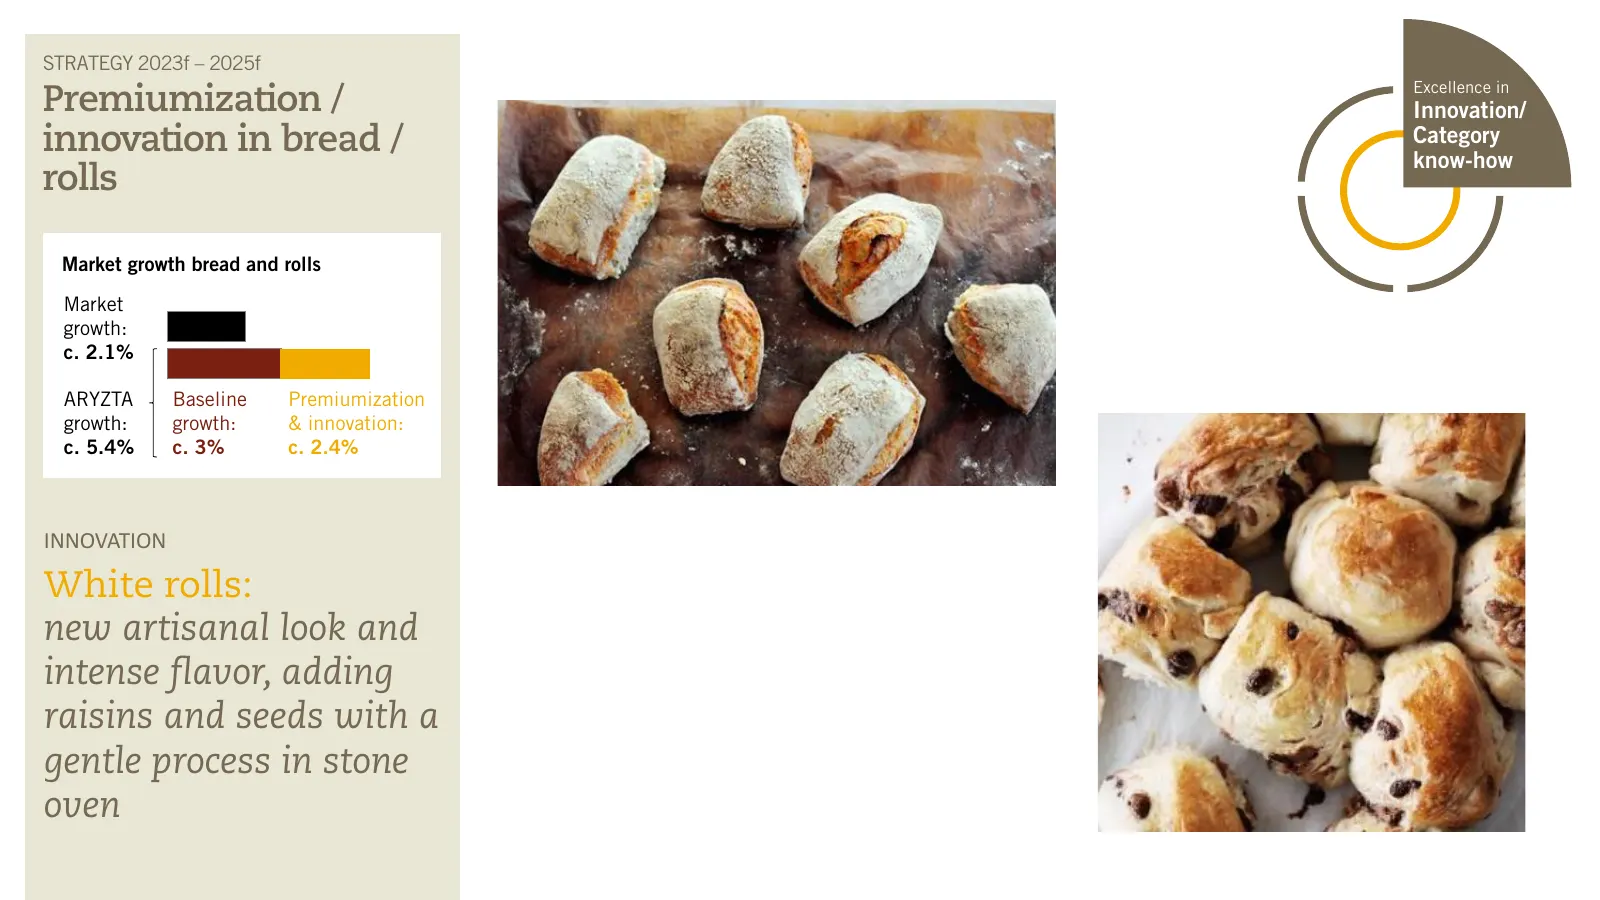
STRATEGY 2023f – 2025f Excellence in Premiumization / Innovation/ innovation in bread / Category know-how rolls Market growth bread and rolls Market growth: c. 2.1% ARYZTA Baseline Premiumization growth: growth: & innovation: c. 5.4% c. 3% c. 2.4% INNOVATION White rolls: new artisanal look and inten
Slide 26: Premiumization / innovation in bread / rolls
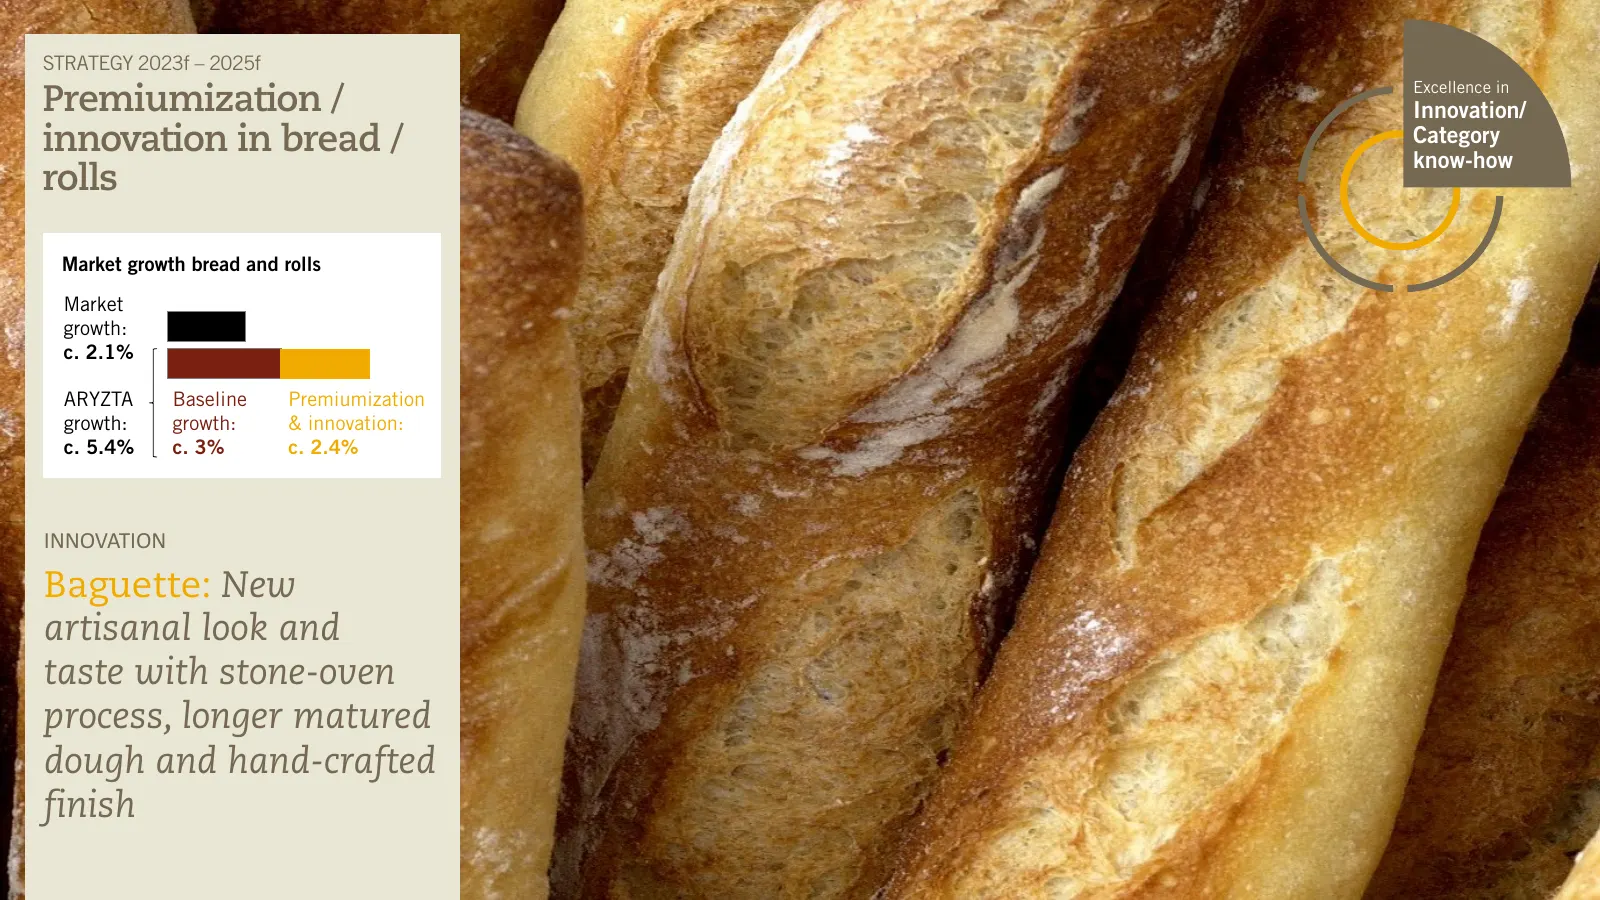
STRATEGY 2023f – 2025f Excellence in Premiumization / Innovation/ innovation in bread / Category know-how rolls Market growth bread and rolls Market growth: c. 2.1% ARYZTA Baseline Premiumization growth: growth: & innovation: c. 5.4% c. 3% c. 2.4% INNOVATION Baguette: New artisanal look and taste wi
Slide 27: Premiumization / innovation in bread / rolls
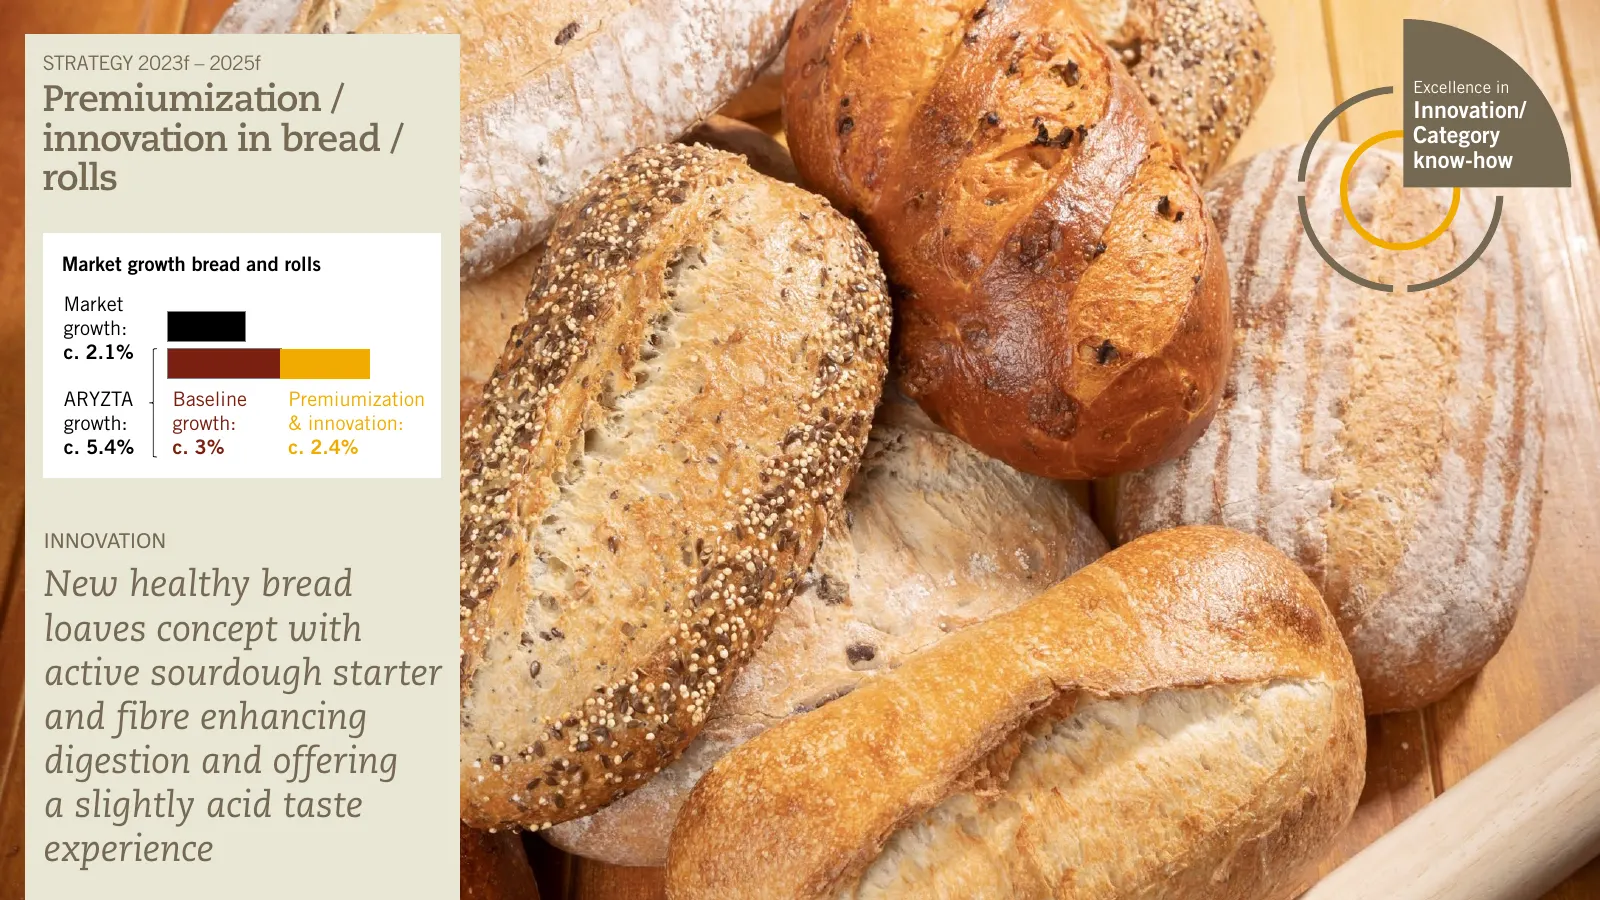
STRATEGY 2023f – 2025f Excellence in Premiumization / Innovation/ innovation in bread / Category know-how rolls Market growth bread and rolls Market growth: c. 2.1% ARYZTA Baseline Premiumization growth: growth: & innovation: c. 5.4% c. 3% c. 2.4% INNOVATION New healthy bread loaves concept with act
Slide 28: Premiumization / innovation in bread / rolls
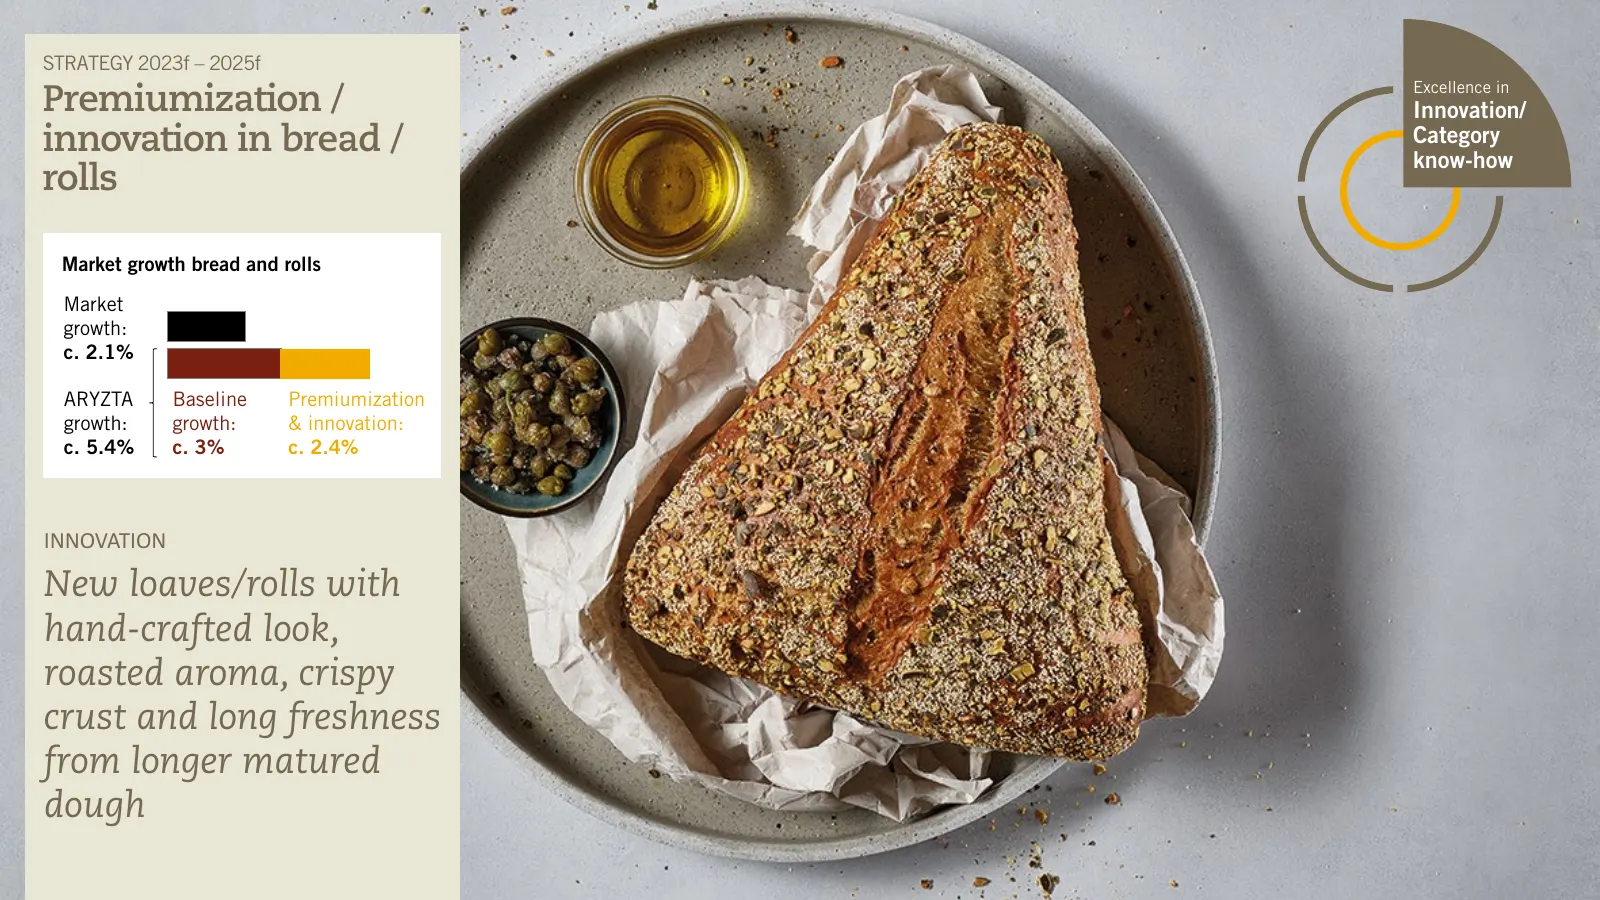
STRATEGY 2023f – 2025f Excellence in Premiumization / Innovation/ innovation in bread / Category know-how rolls Market growth bread and rolls Market growth: c. 2.1% ARYZTA Baseline Premiumization growth: growth: & innovation: c. 5.4% c. 3% c. 2.4% INNOVATION New loaves/rolls with hand-crafted look,
Slide 29: Premiumization / innovation in bread / rolls
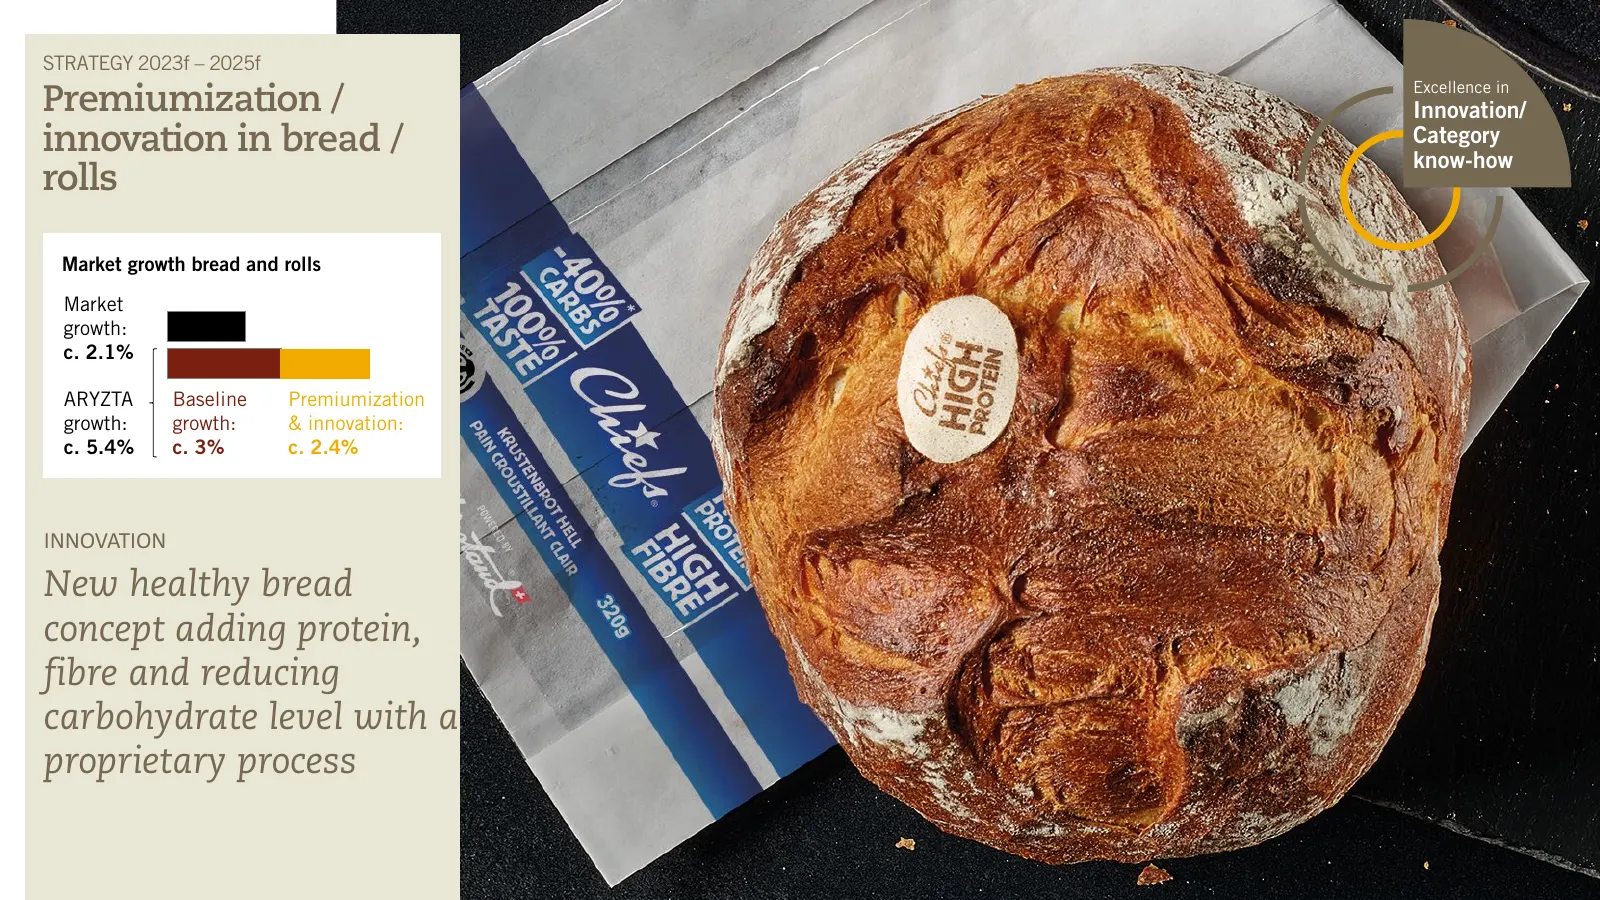
STRATEGY 2023f – 2025f Excellence in Premiumization / Innovation/ innovation in bread / Category know-how rolls Market growth bread and rolls Market growth: c. 2.1% ARYZTA Baseline Premiumization growth: growth: & innovation: c. 5.4% c. 3% c. 2.4% INNOVATION New healthy bread concept adding protein,
Slide 30: ARYZTA's premiumization / innovation in savoury
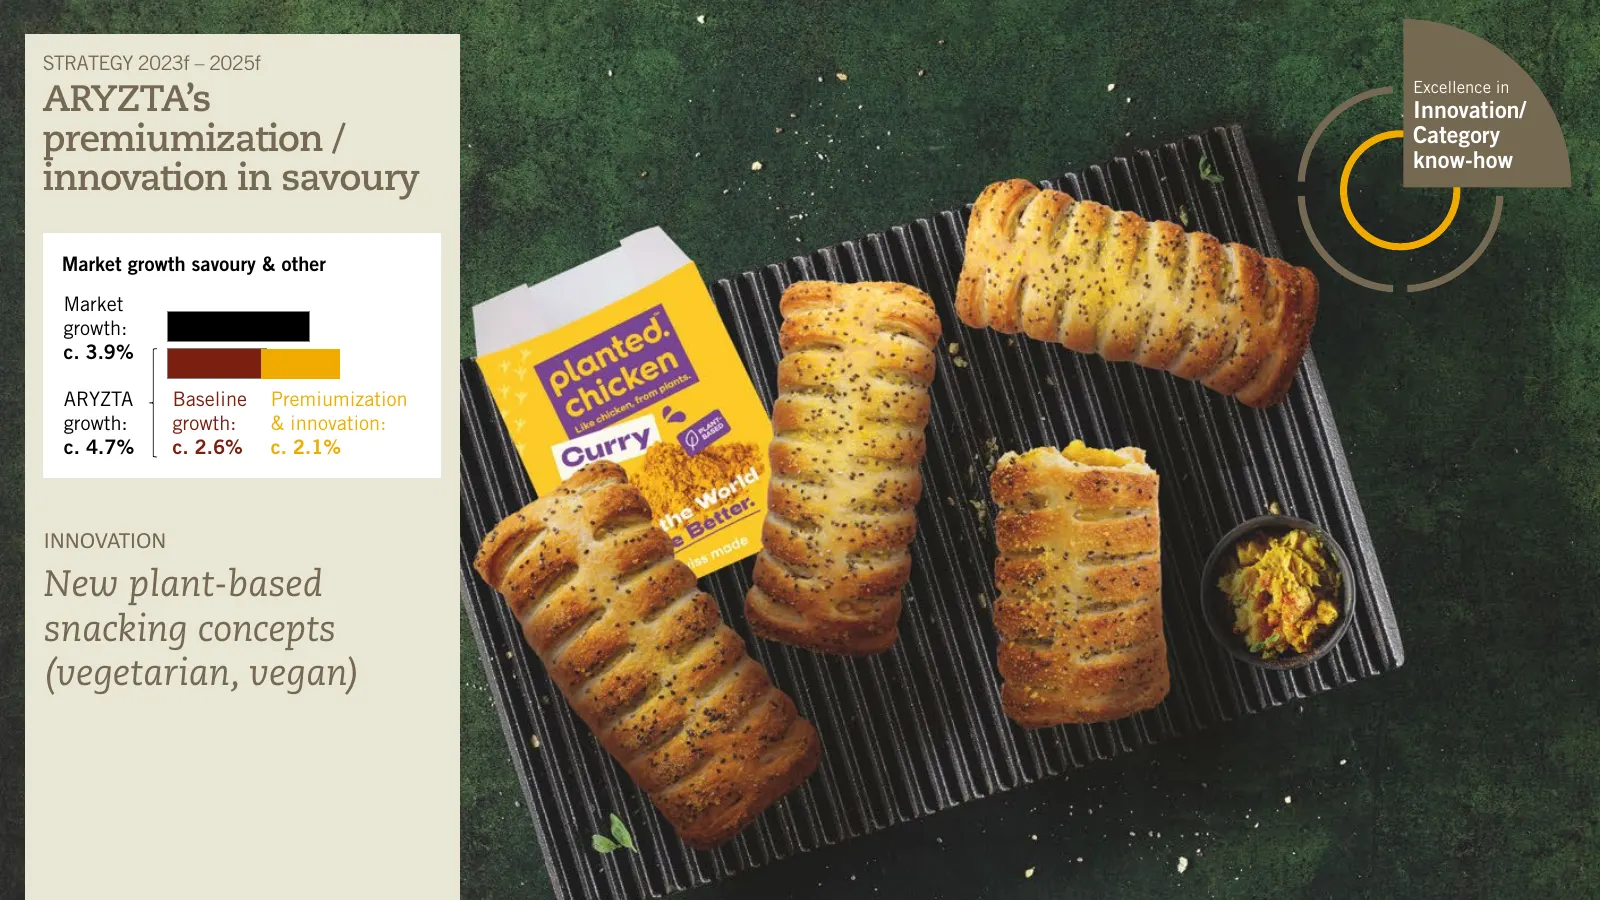
STRATEGY 2023f – 2025f Excellence in ARYZTA’s Innovation/ premiumization / Category know-how innovation in savoury Market growth savoury & other Market growth: c. 3.9% ARYZTA Baseline Premiumization growth: growth: & innovation: c. 4.7% c. 2.6% c. 2.1% INNOVATION New plant-based snacking concepts (v
Slide 31: ARYZTA's premiumization / innovation in savoury
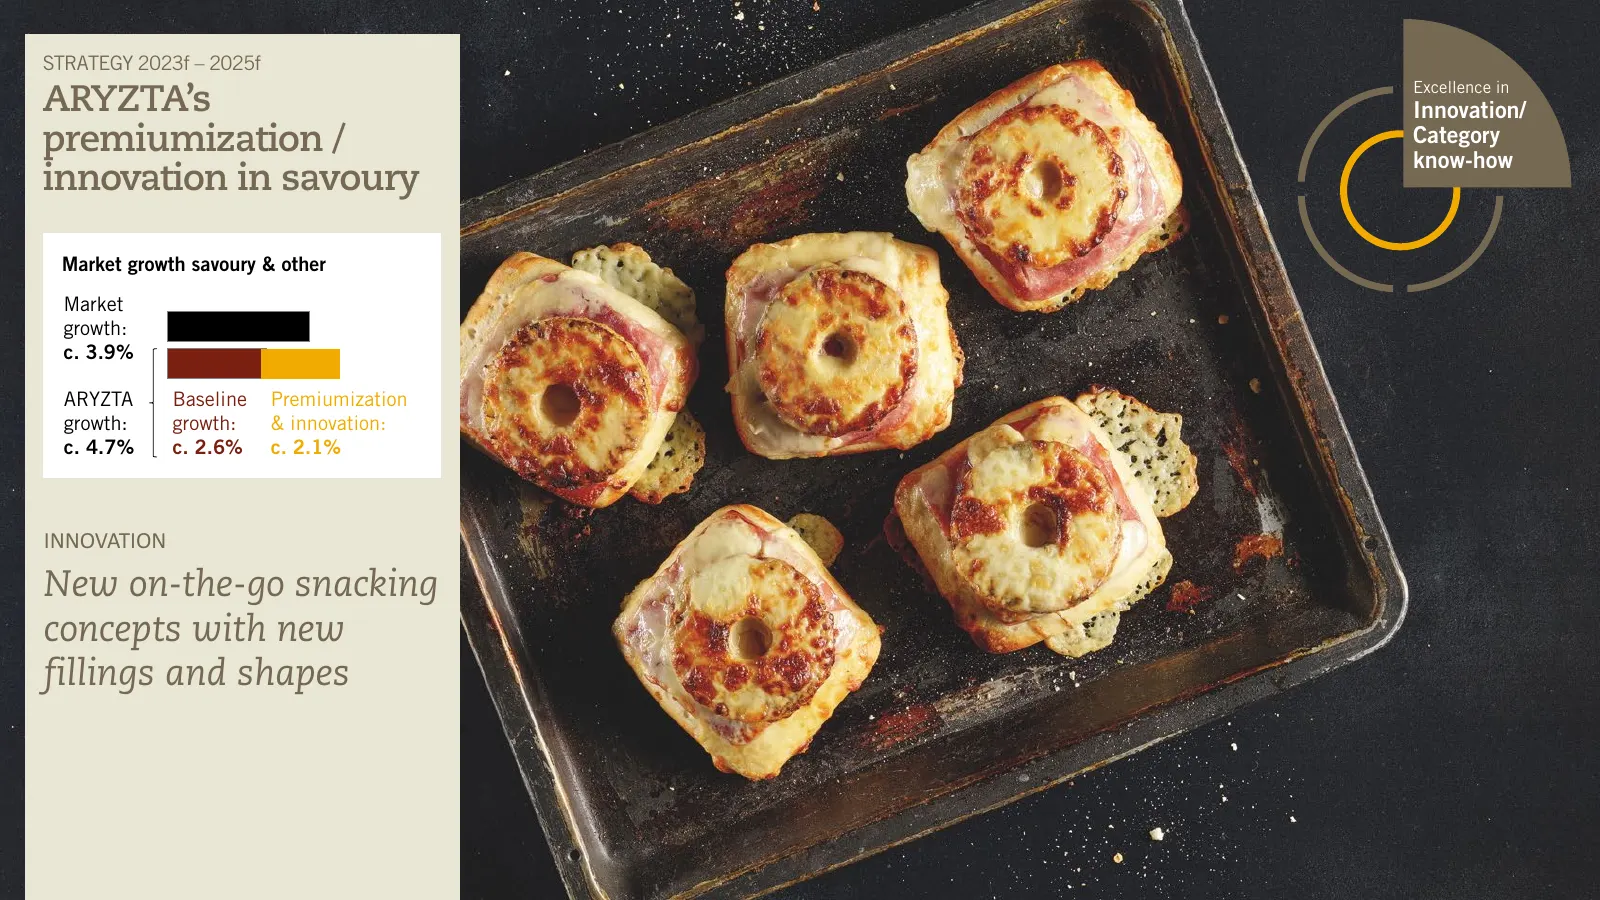
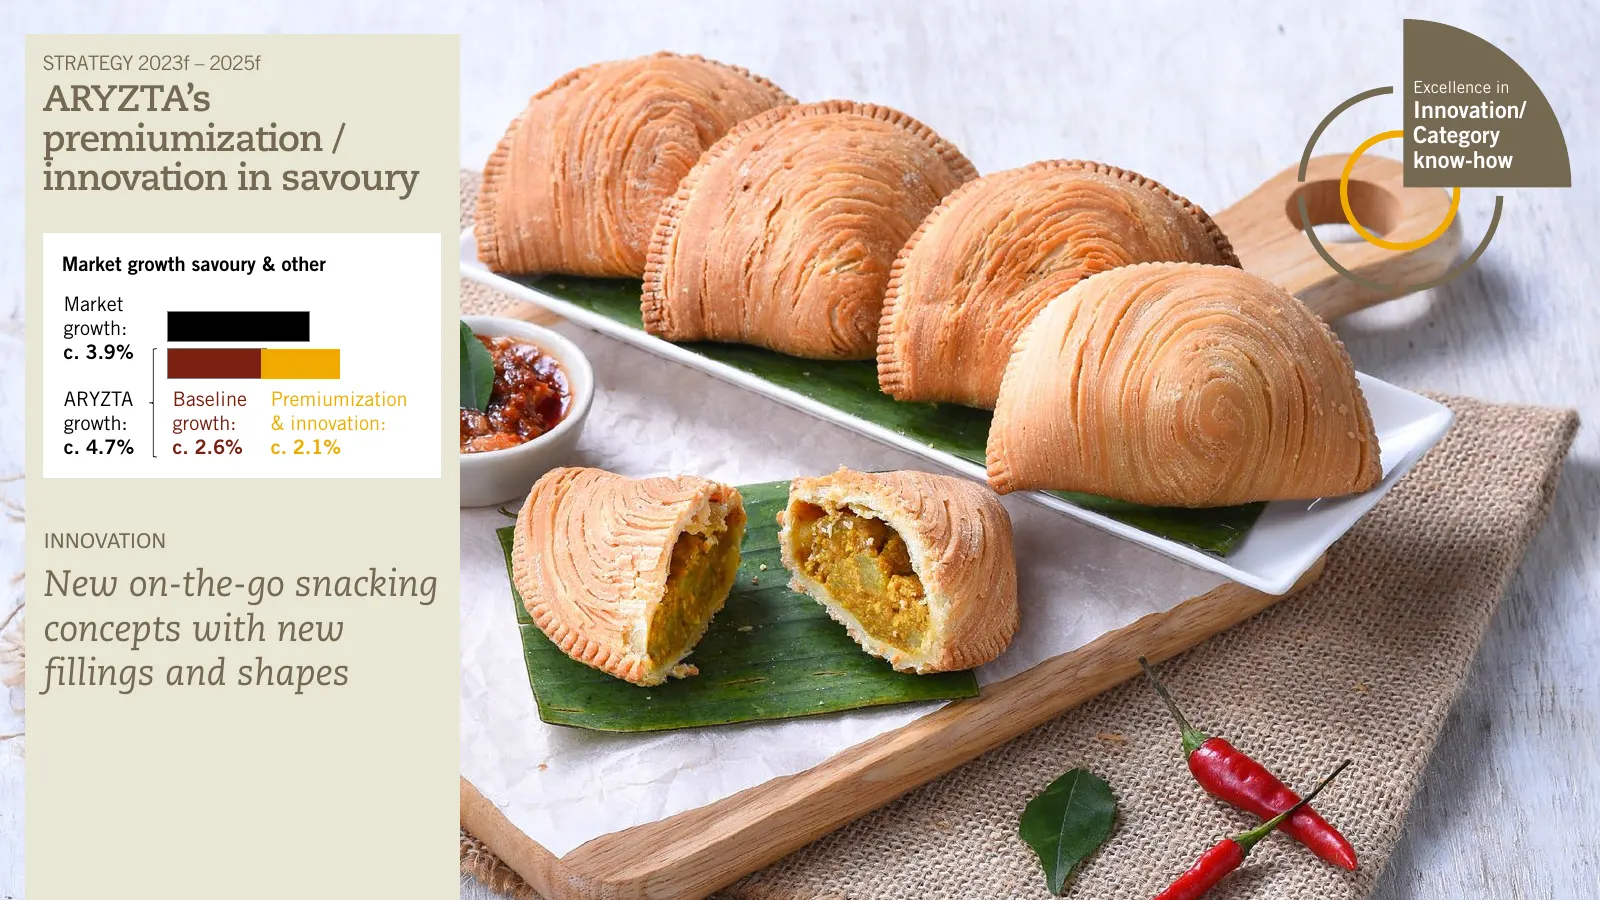
STRATEGY 2023f – 2025f Excellence in ARYZTA’s Innovation/ premiumization / Category know-how innovation in savoury Market growth savoury & other Market growth: c. 3.9% ARYZTA Baseline Premiumization growth: growth: & innovation: c. 4.7% c. 2.6% c. 2.1% INNOVATION New on-the-go snacking concepts with
Slide 32: ARYZTA's premiumization / innovation in savoury
STRATEGY 2023f – 2025f Excellence in ARYZTA’s Innovation/ premiumization / Category know-how innovation in savoury Market growth savoury & other Market growth: c. 3.9% ARYZTA Baseline Premiumization growth: growth: & innovation: c. 4.7% c. 2.6% c. 2.1% INNOVATION New on-the-go snacking concepts with
Slide 33: ARYZTA's premiumization / innovation in morning goods
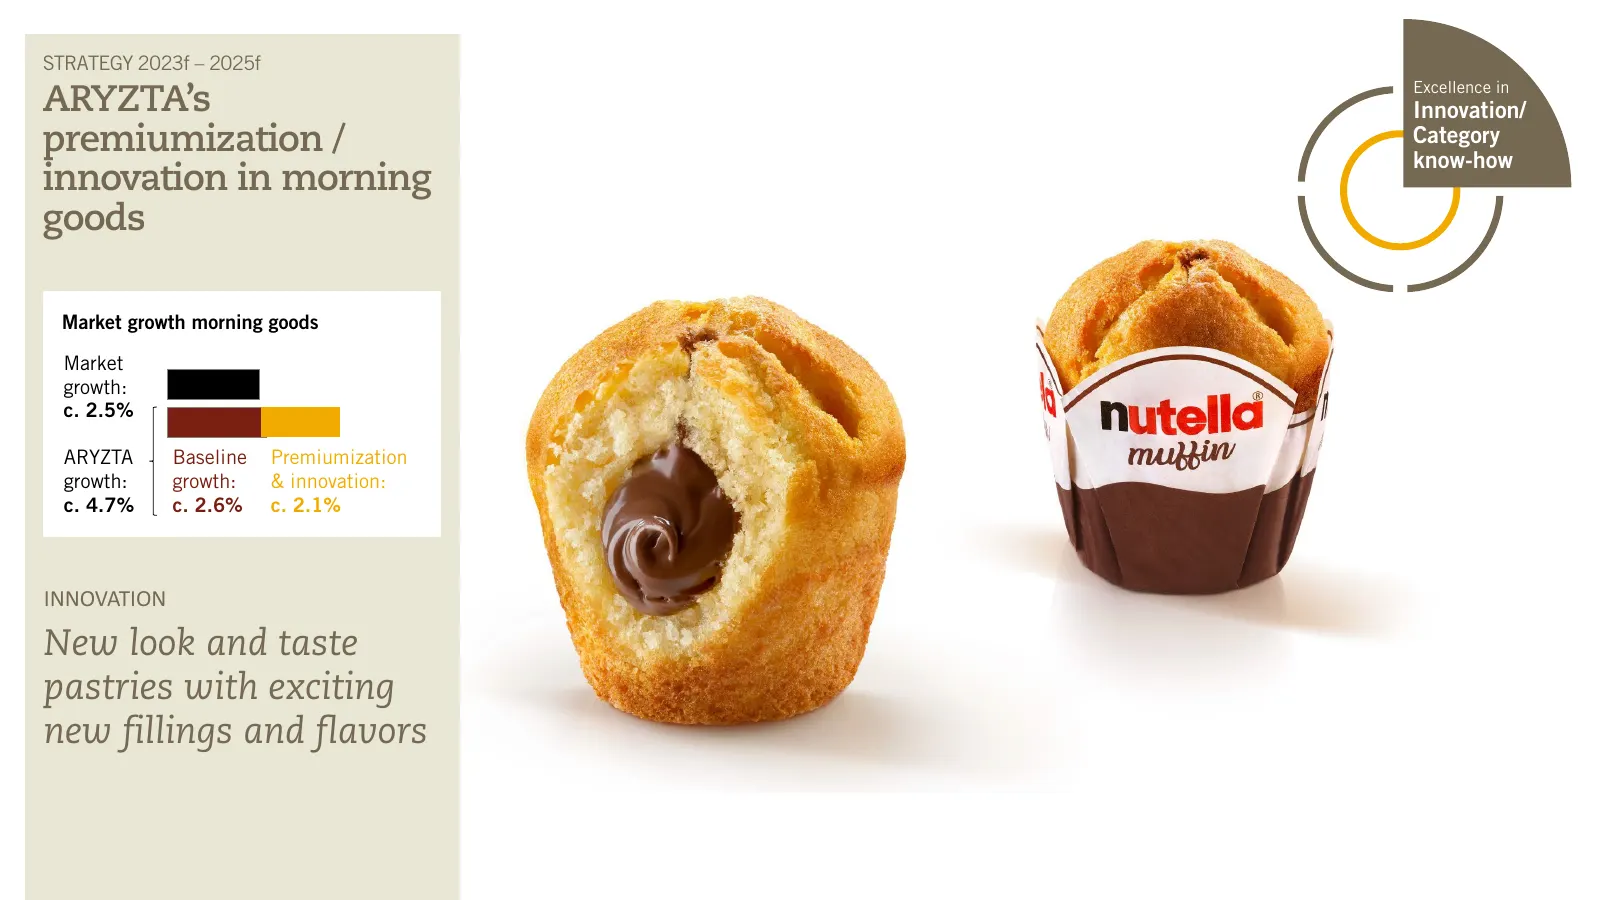
STRATEGY 2023f – 2025f Excellence in ARYZTA’s Innovation/ premiumization / Category know-how innovation in morning goods Market growth morning goods Market growth: c. 2.5% ARYZTA Baseline Premiumization growth: growth: & innovation: c. 4.7% c. 2.6% c. 2.1% INNOVATION New look and taste pastries with
Slide 34: Margin Improvements through quality, efficiency and cost management
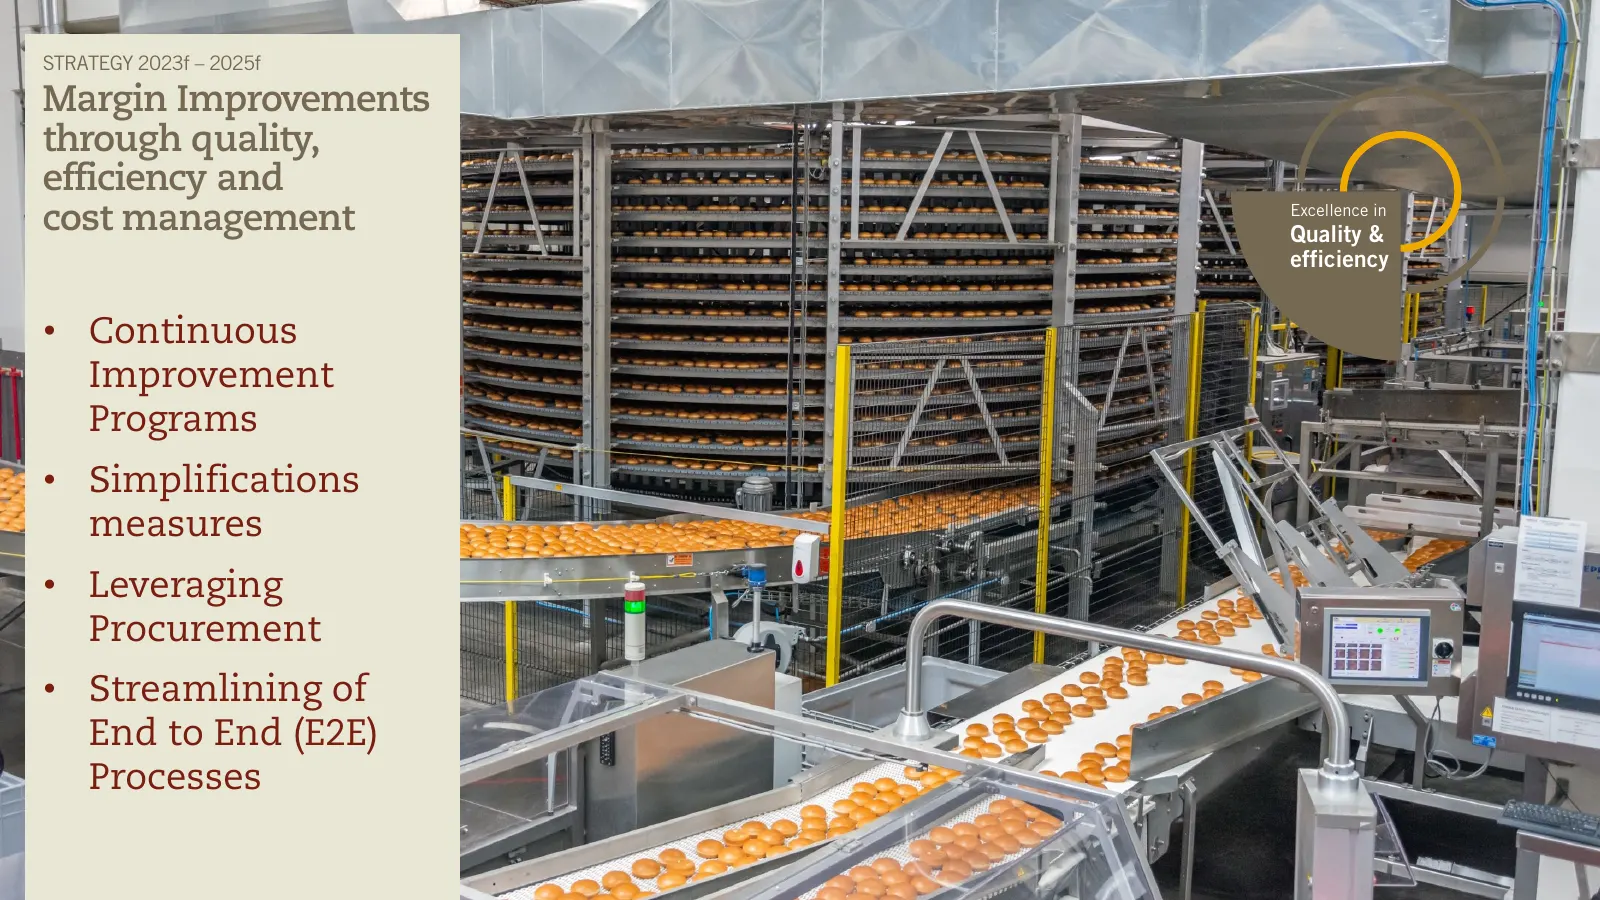
STRATEGY 2023f – 2025f Margin Improvements through quality, efficiency and cost management Excellence in Quality & efficiency • Continuous Improvement Programs • Simplifications measures • Leveraging Procurement • Streamlining of End to End (E2E) Processes
Slide 35: Summary: ARYZTA is creating value by offering the gold standard in bake-off
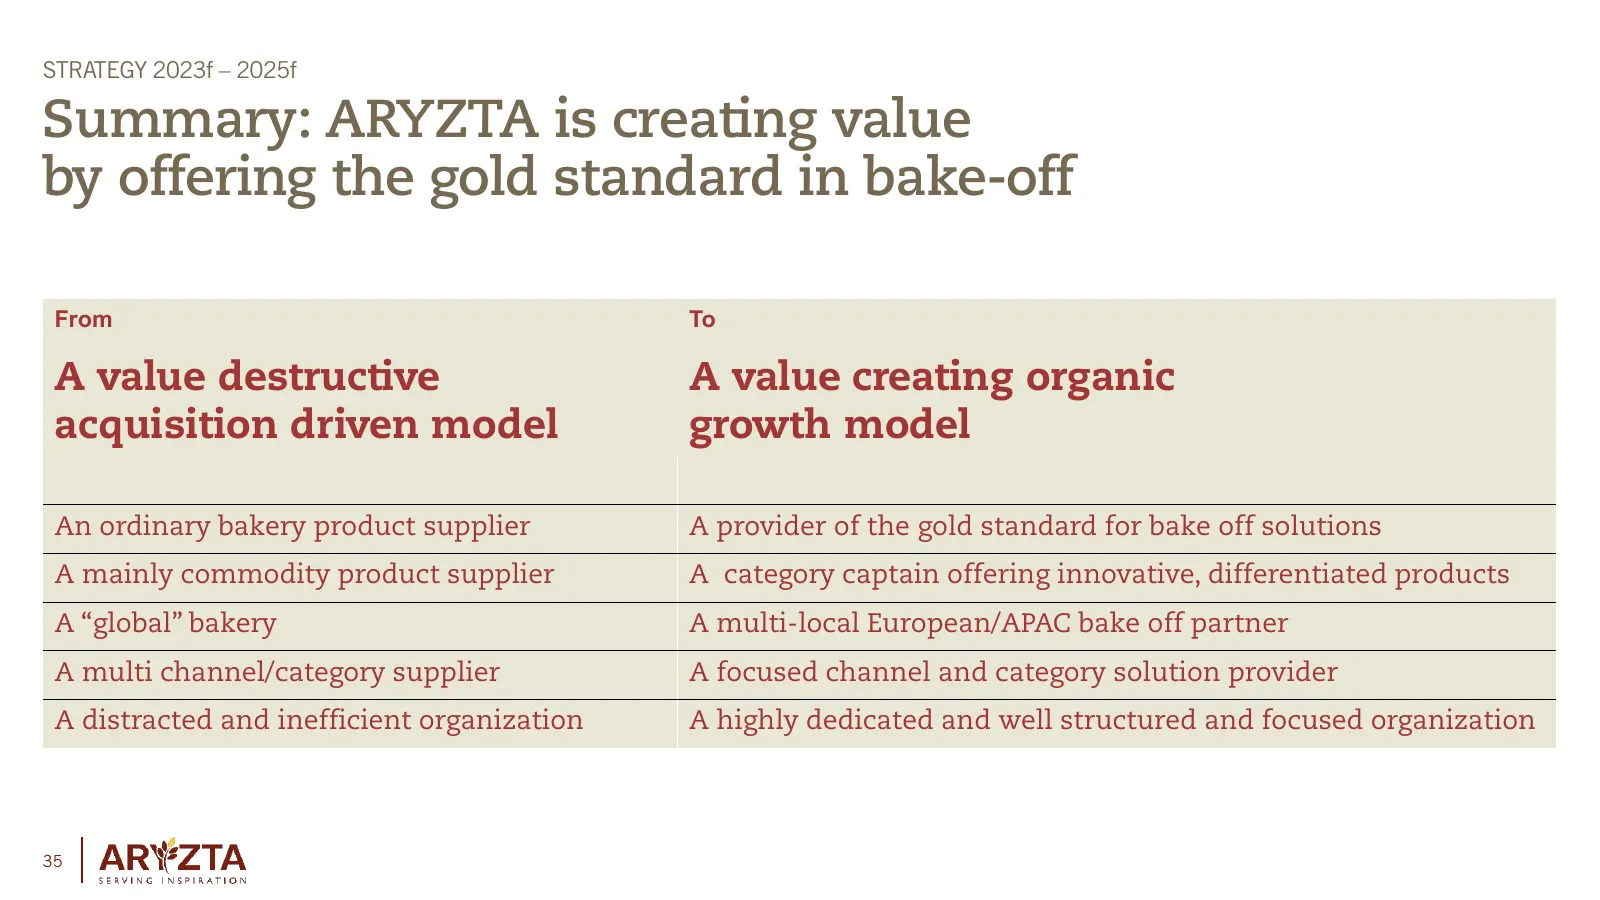
STRATEGY 2023f – 2025f Summary: ARYZTA is creating value by offering the gold standard in bake-off From To A value destructive A value creating organic acquisition driven model growth model An ordinary bakery product supplier A provider of the gold standard for bake off solutions A mainly commodity

Slide 36: Financials 2023f – 2025f
Capital Markets Day Financials 2023f – 2025f
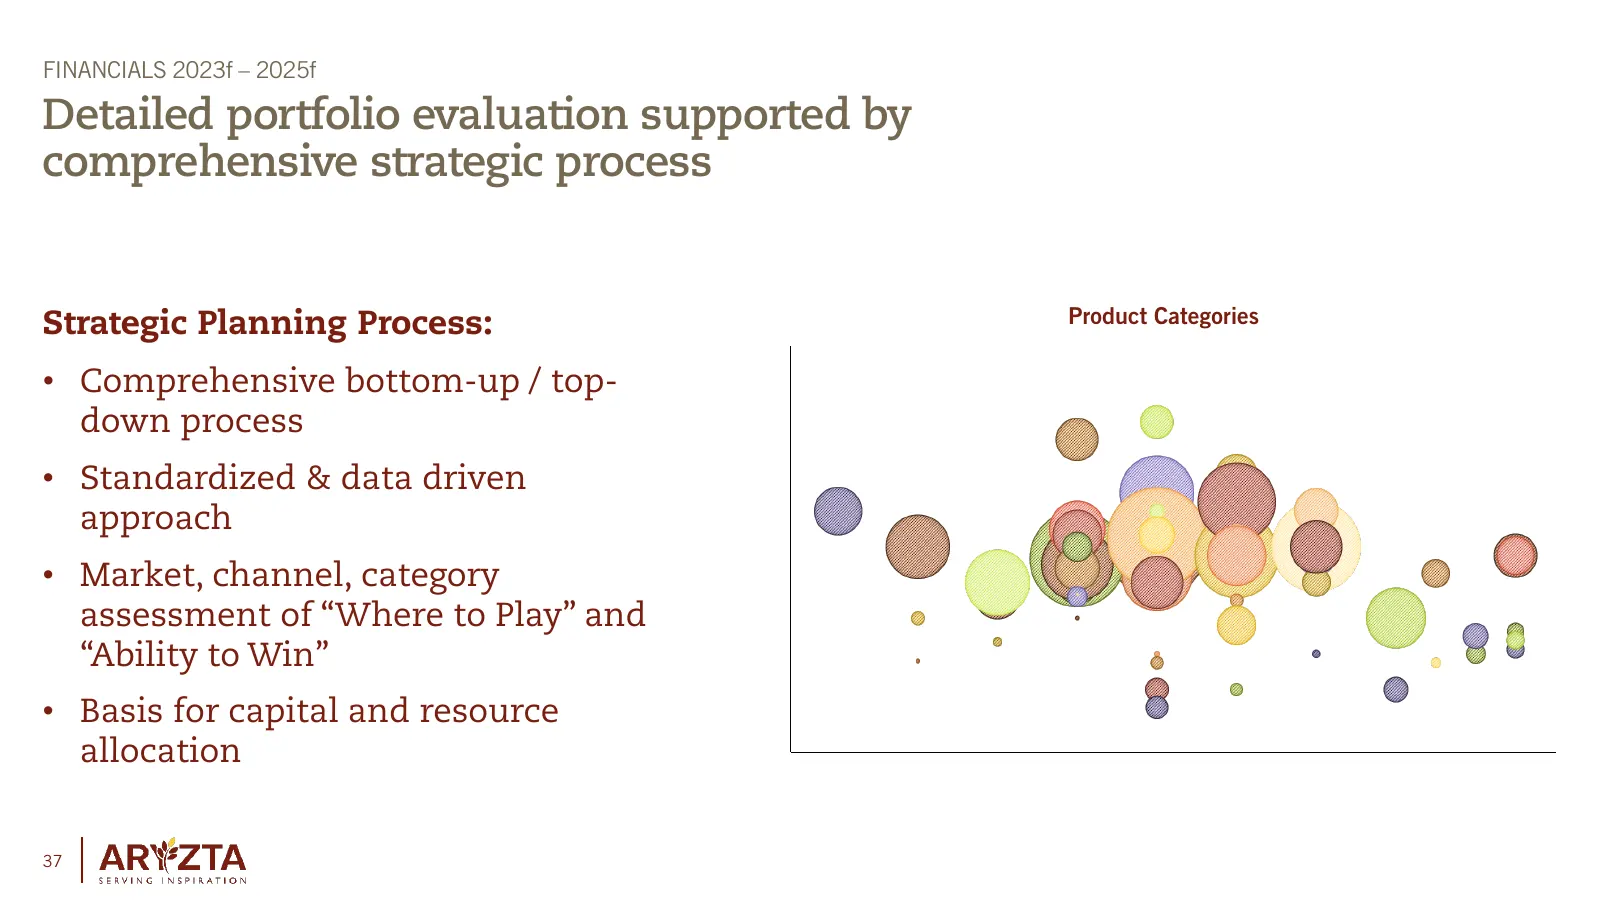
Slide 37: Detailed portfolio evaluation supported by comprehensive strategic process
FINANCIALS 2023f – 2025f Detailed portfolio evaluation supported by comprehensive strategic process Strategic Planning Process: Product Categories • Comprehensive bottom-up / top- down process • Standardized & data driven approach • Market, channel, category assessment of “Where to Play” and “Abilit
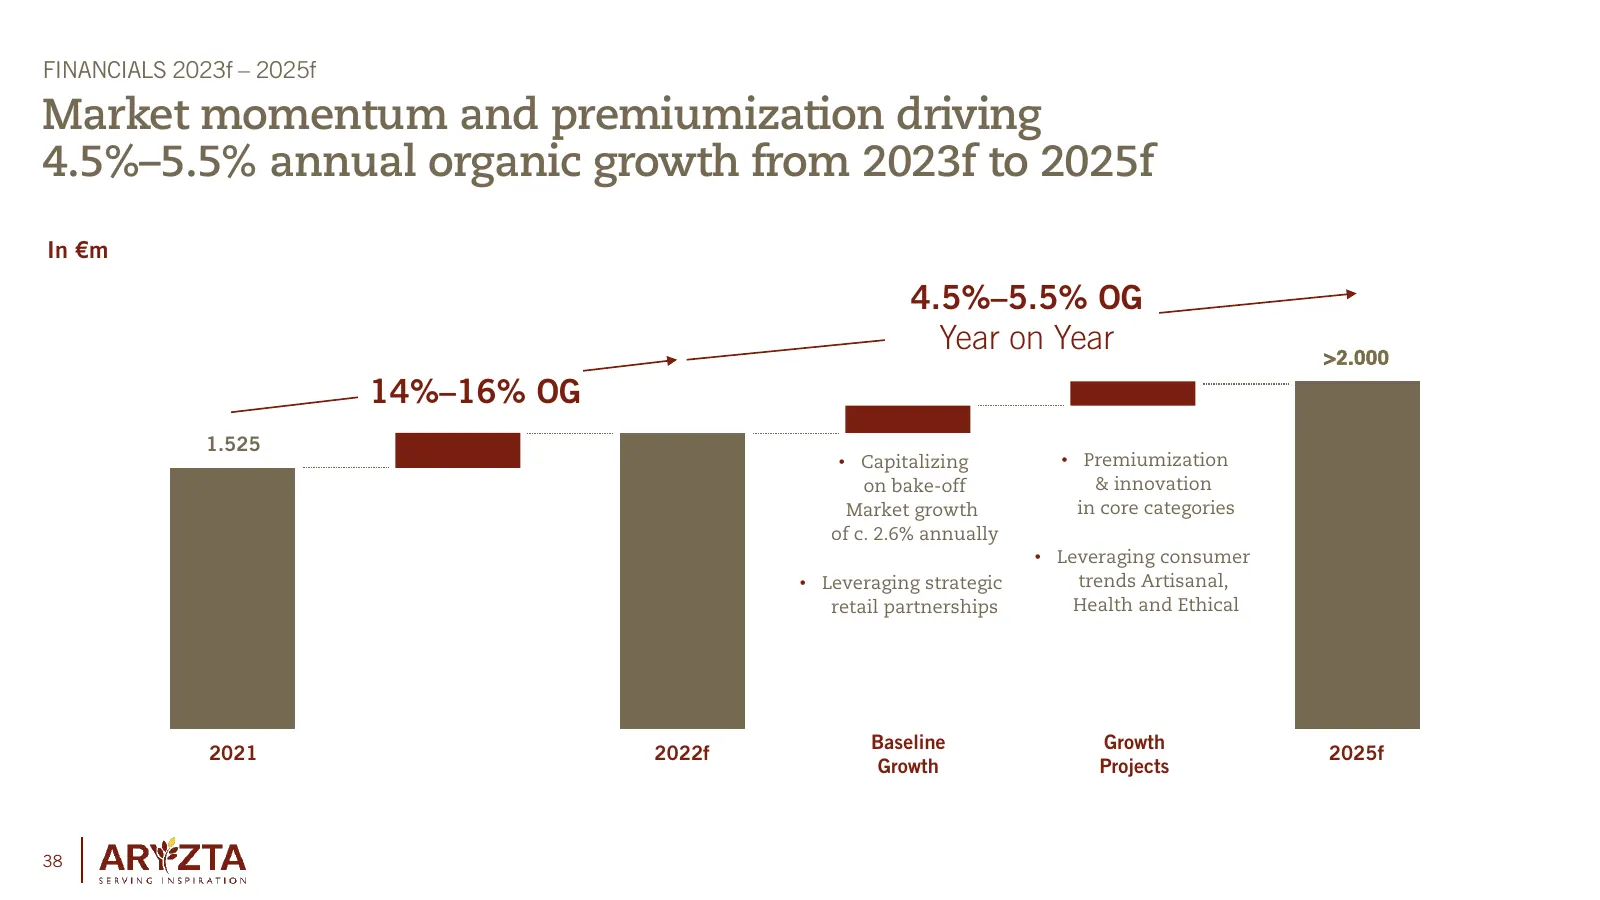
Slide 38: Market momentum and premiumization driving 4.5%–5.5% annual organic growth
FINANCIALS 2023f – 2025f Market momentum and premiumization driving 4.5%–5.5% annual organic growth from 2023f to 2025f In €m 4.5%–5.5% OG Year on Year >2.000 14%–16% OG 1.525 • Capitalizing • Premiumization on bake-off & innovation Market growth in core categories of c. 2.6% annually • Leveraging c
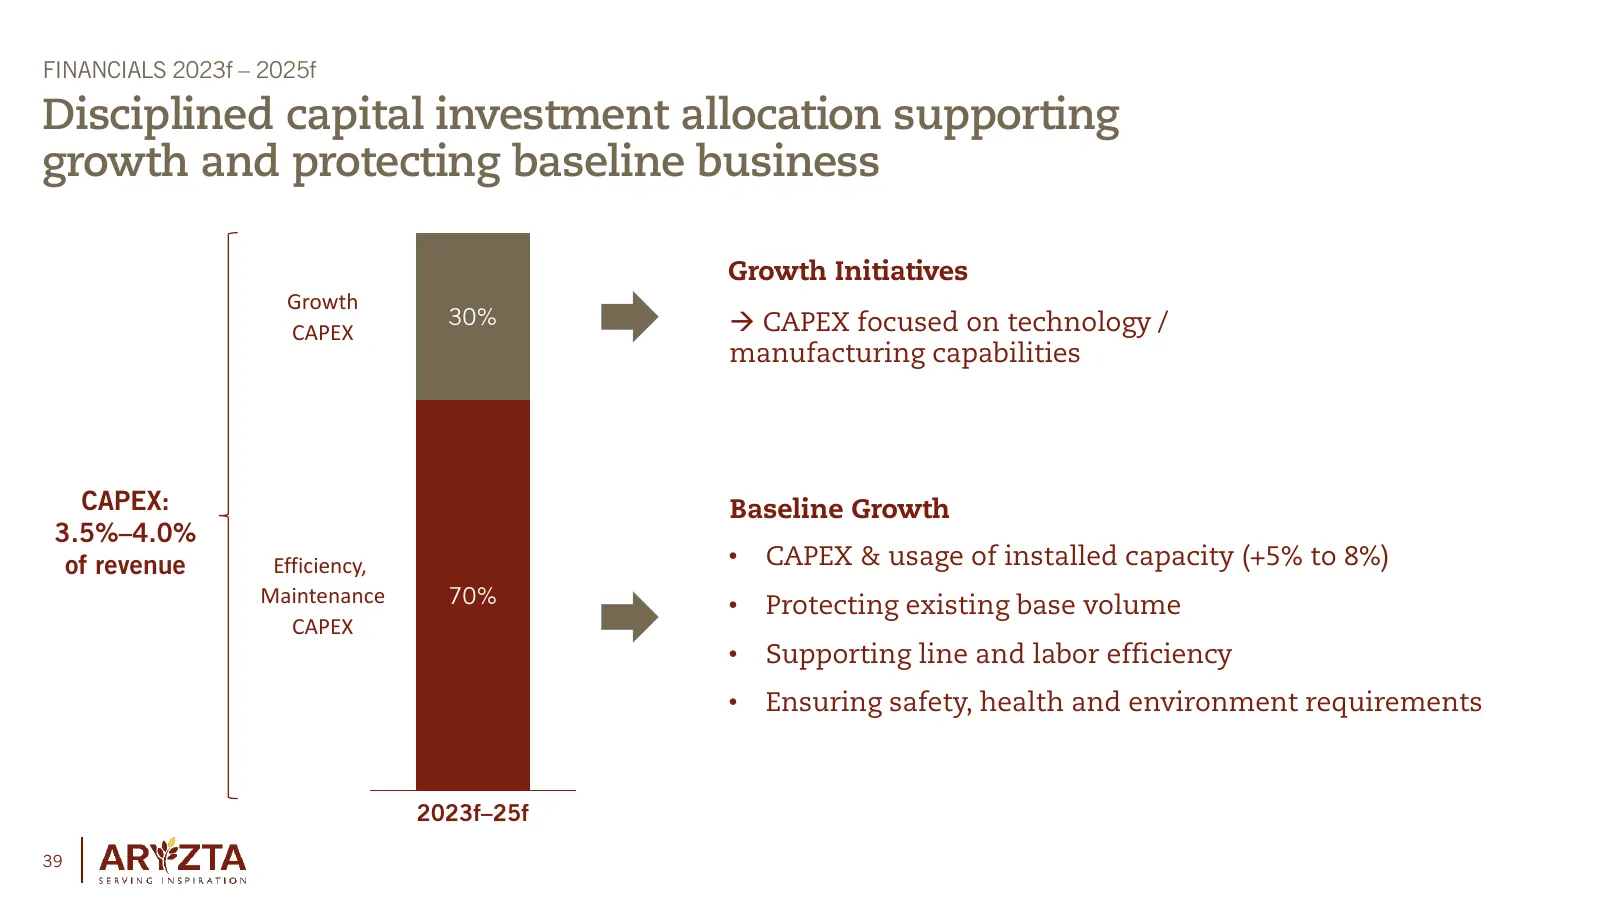
Slide 39: Disciplined capital investment allocation supporting growth
FINANCIALS 2023f – 2025f Disciplined capital investment allocation supporting growth and protecting baseline business Growth Initiatives Growth 30% CAPEX focused on technology / CAPEX manufacturing capabilities CAPEX: Baseline Growth 3.5%–4.0% of revenue Efficiency, • CAPEX & usage of installed ca
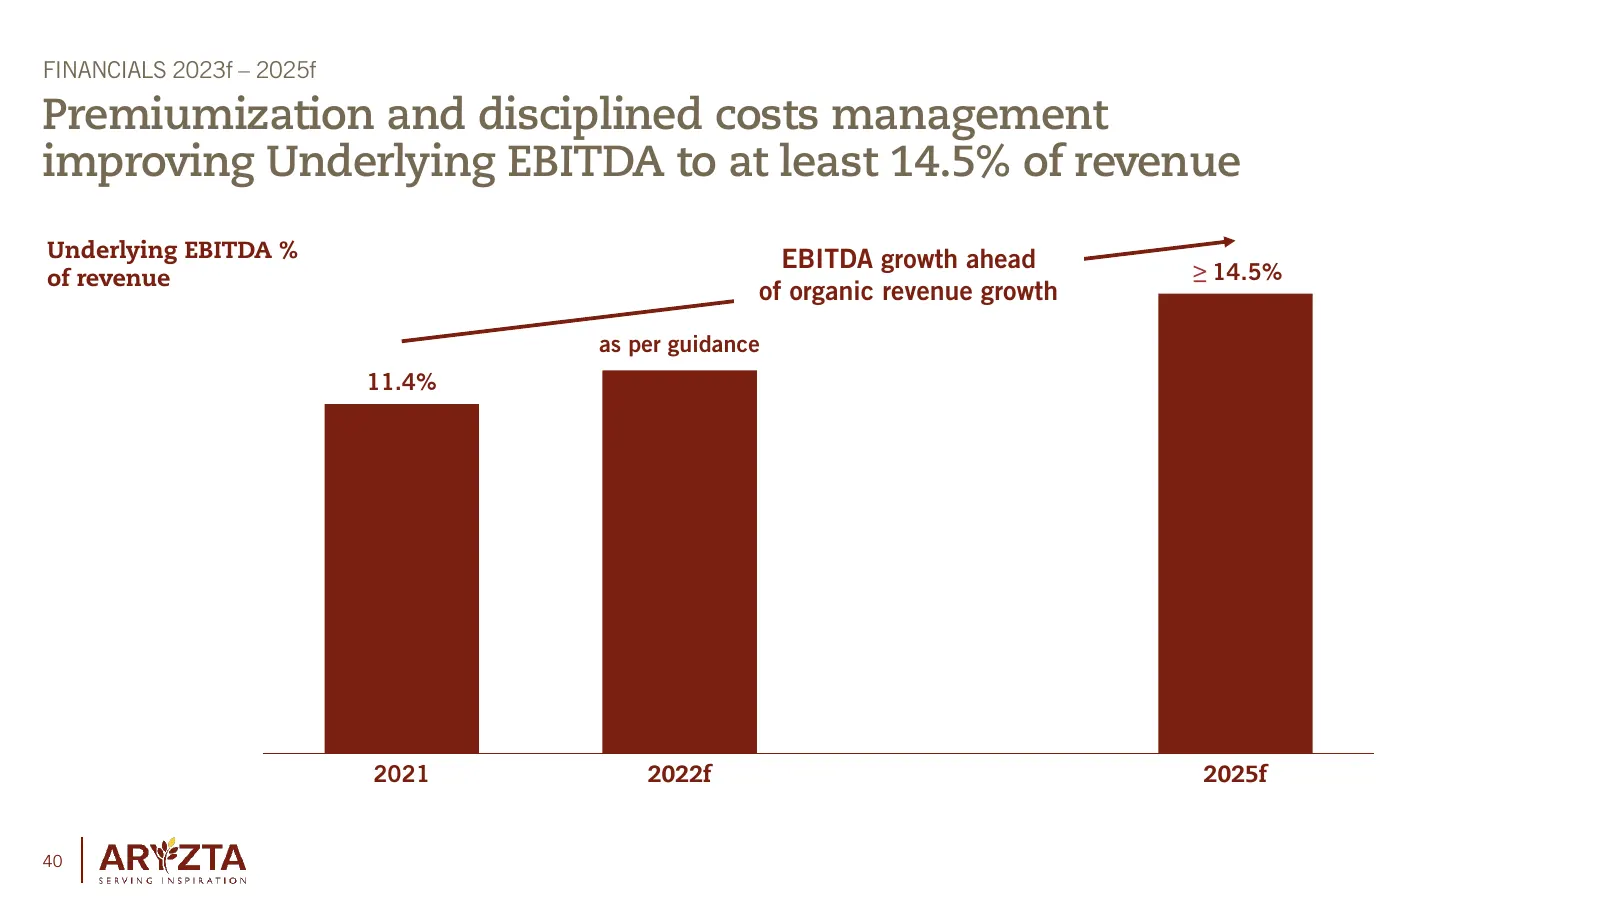
Slide 40: Underlying EBITDA to at least 14.5% of revenue
FINANCIALS 2023f – 2025f Premiumization and disciplined costs management improving Underlying EBITDA to at least 14.5% of revenue Underlying EBITDA % EBITDA growth ahead of revenue ≥ 14.5% of organic revenue growth as per guidance 11.4% 2021 2022f 2025f 40
Slide 41: Key levers of disciplined costs management
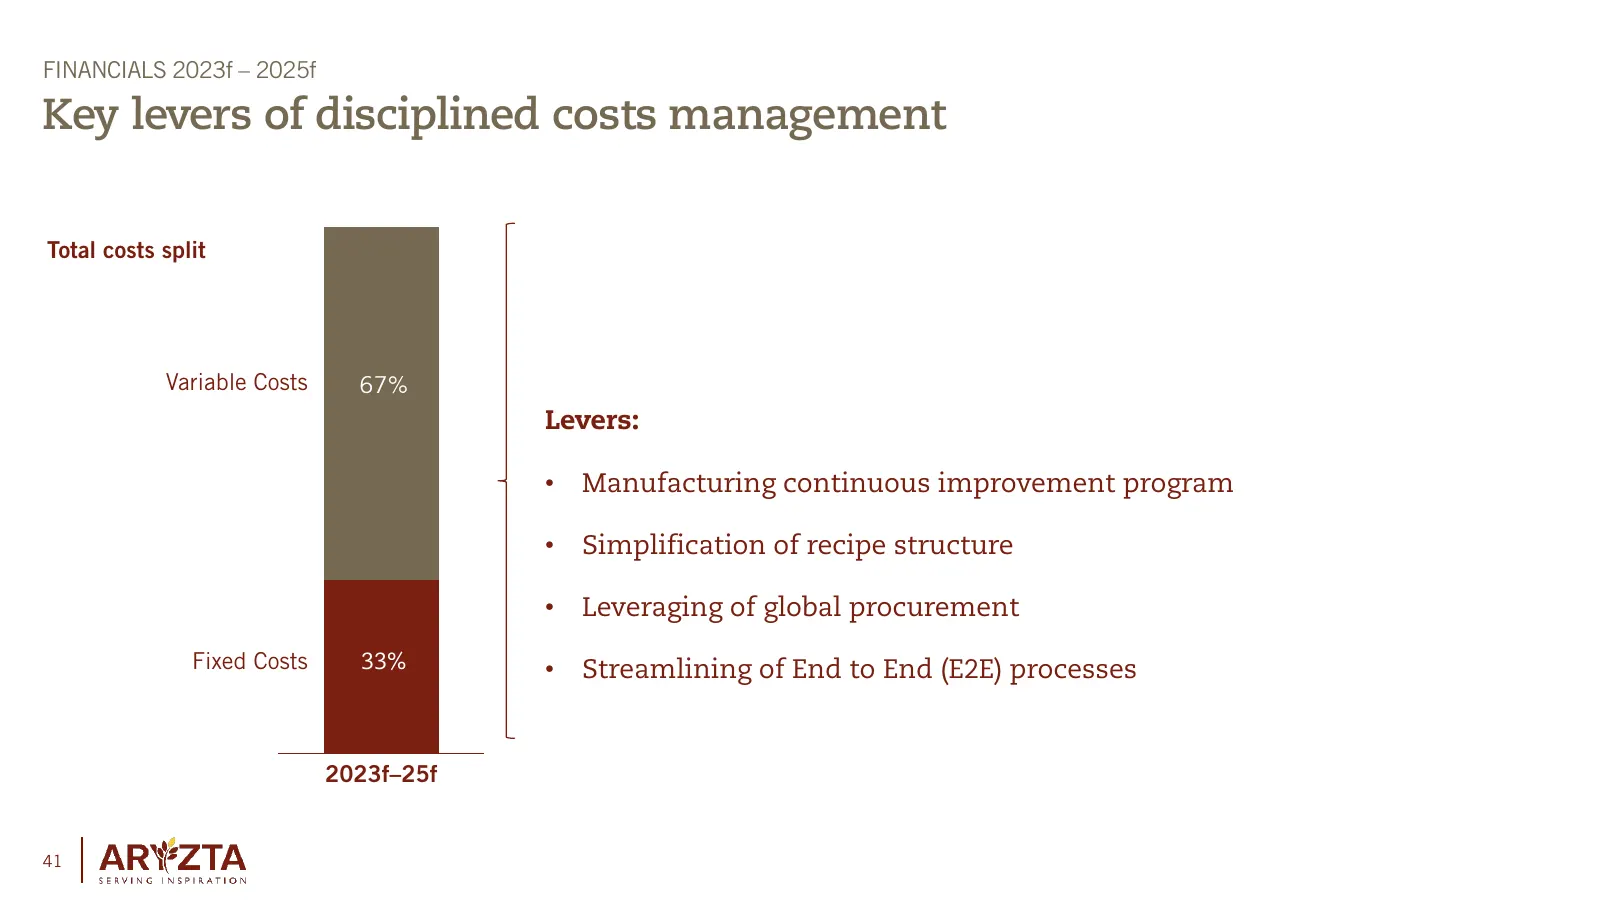
FINANCIALS 2023f – 2025f Key levers of disciplined costs management Total costs split Variable Costs 67% Levers: • Manufacturing continuous improvement program • Simplification of recipe structure • Leveraging of global procurement Fixed Costs 33% • Streamlining of End to End (E2E) processes 2023f–2
Slide 42: Performance control system enabling continuous improvement
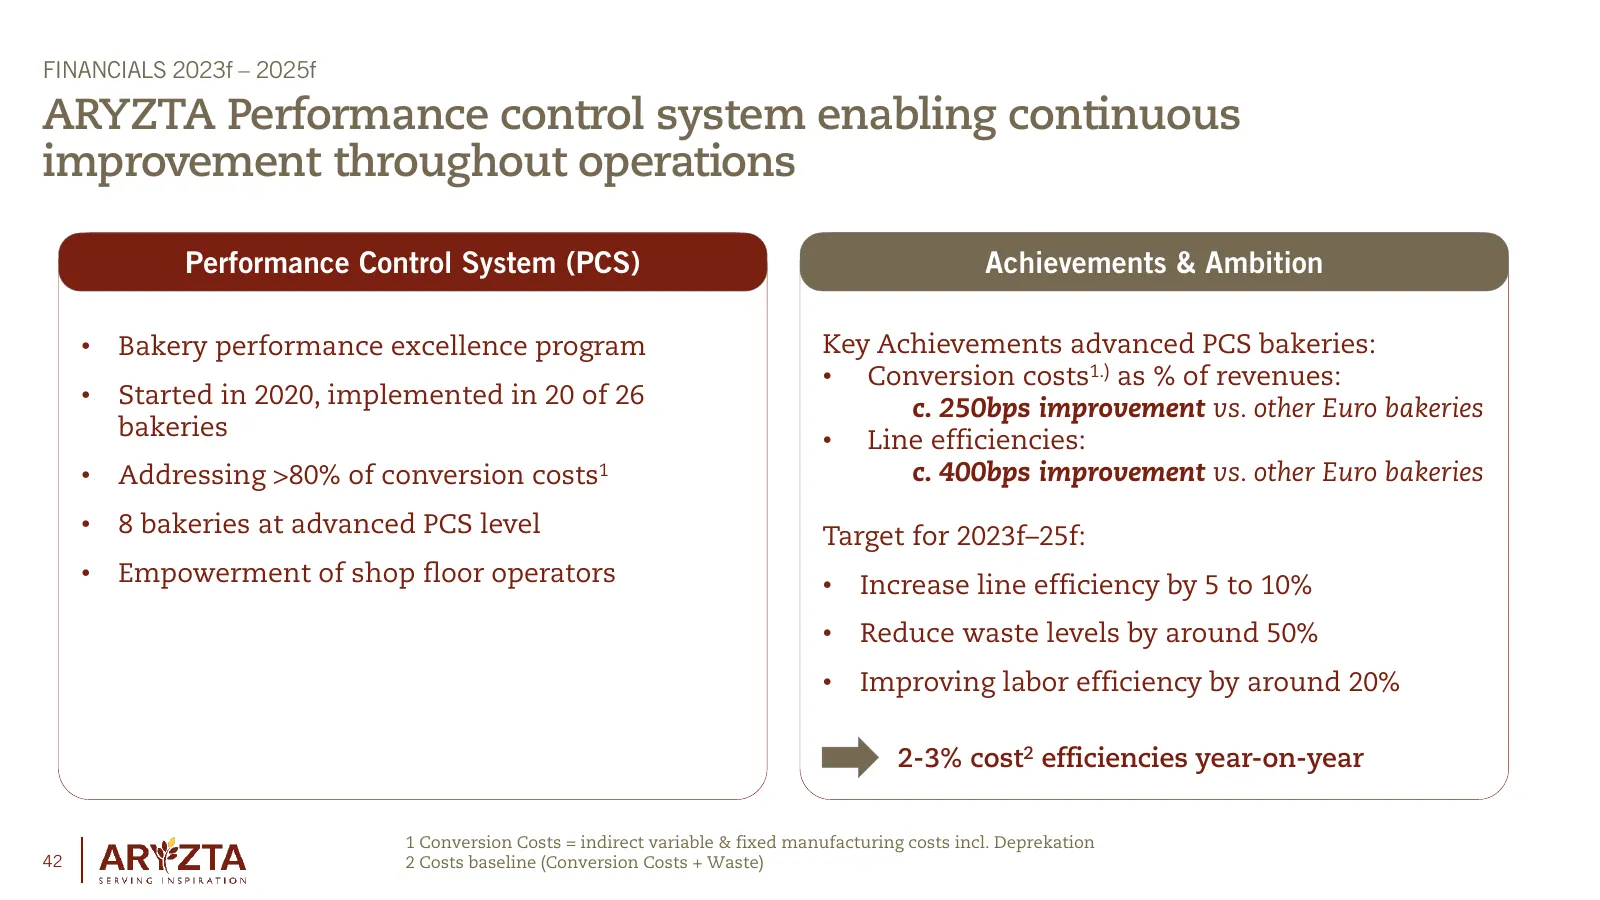
FINANCIALS 2023f – 2025f ARYZTA Performance control system enabling continuous improvement throughout operations Performance Control System (PCS) Achievements & Ambition • Bakery performance excellence program Key Achievements advanced PCS bakeries: • Conversion costs1.) as % of revenues: • Started
Slide 43: Simplification through Project SIMPLEX
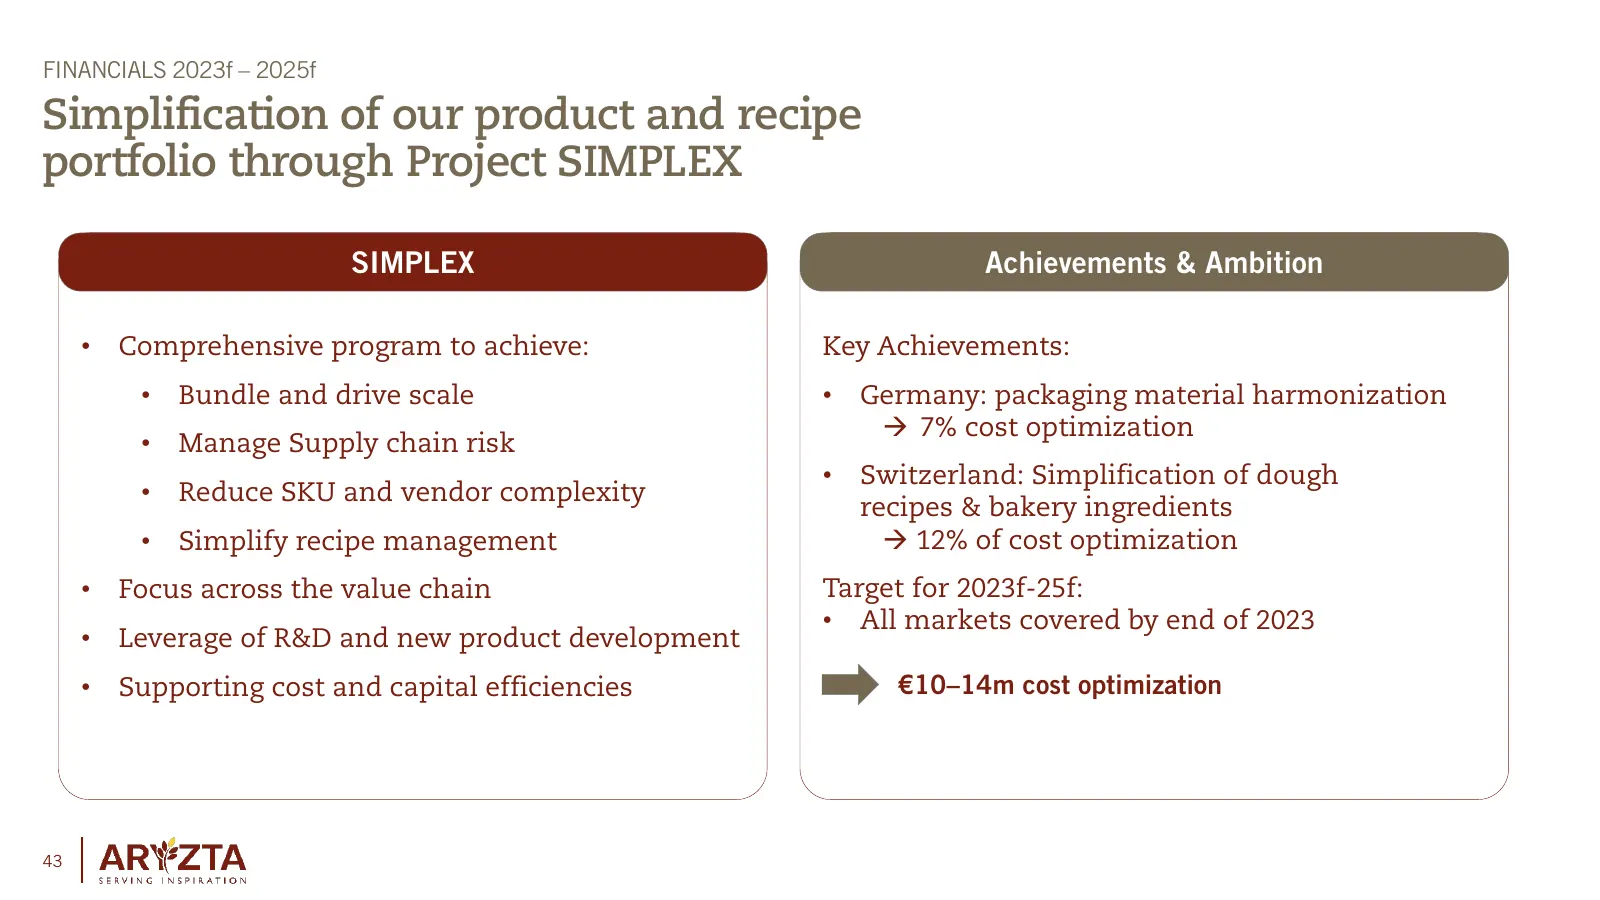
FINANCIALS 2023f – 2025f Simplification of our product and recipe portfolio through Project SIMPLEX SIMPLEX Achievements & Ambition • Comprehensive program to achieve: Key Achievements: • Bundle and drive scale • Germany: packaging material harmonization 7% cost optimization • Manage Supply chain
Slide 44: Acceleration of procurement contribution
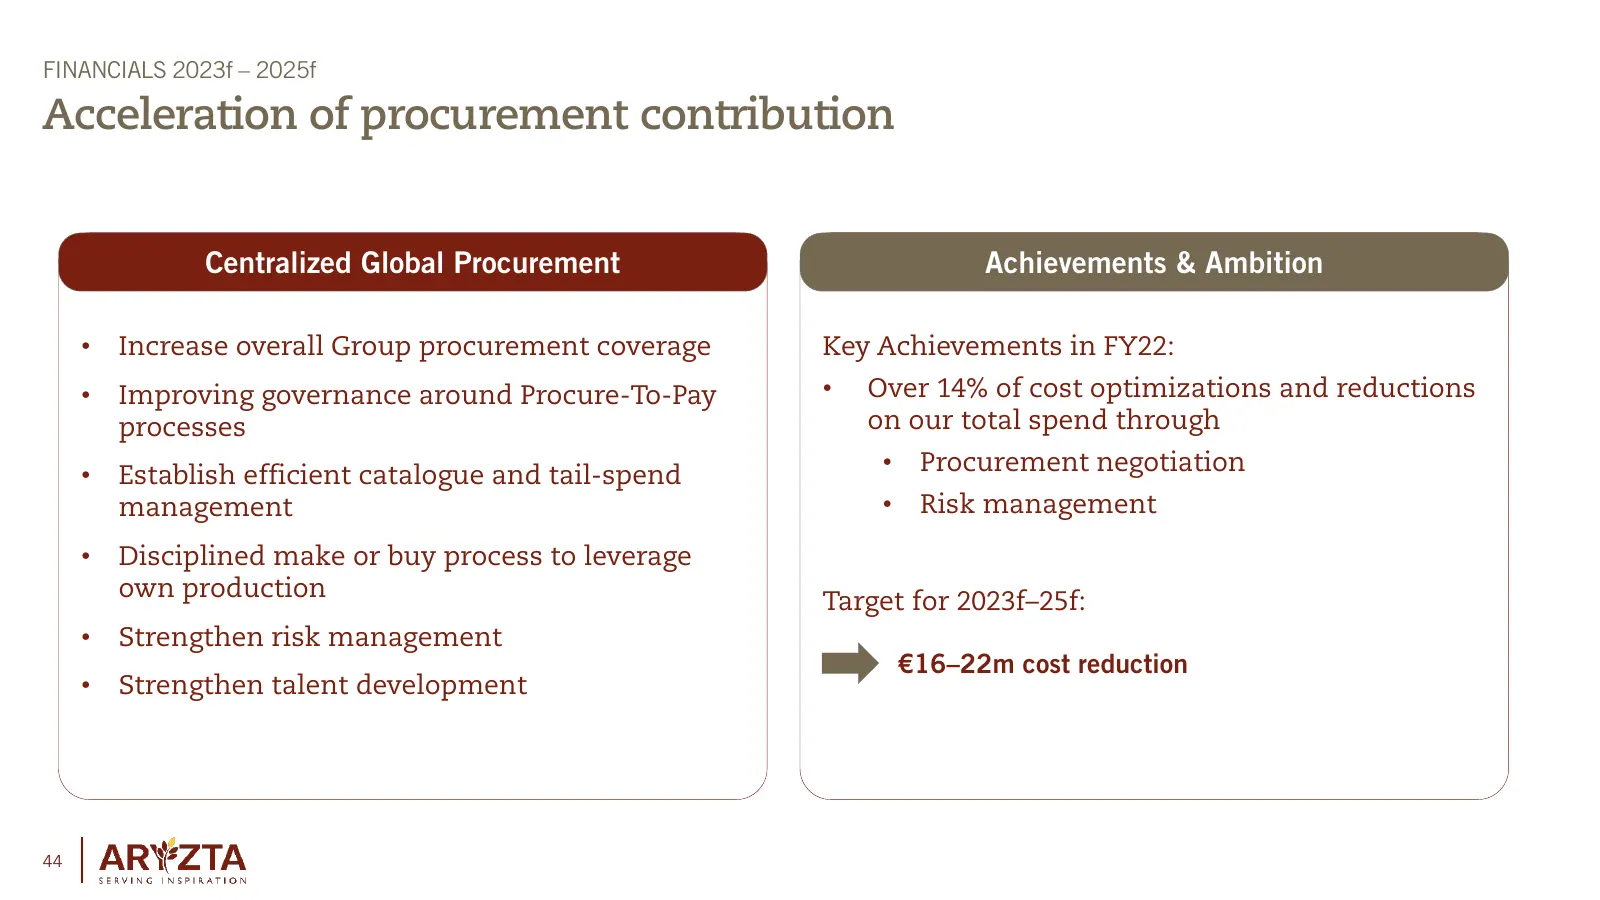
FINANCIALS 2023f – 2025f Acceleration of procurement contribution Centralized Global Procurement Achievements & Ambition • Increase overall Group procurement coverage Key Achievements in FY22: • Improving governance around Procure-To-Pay • Over 14% of cost optimizations and reductions processes on o
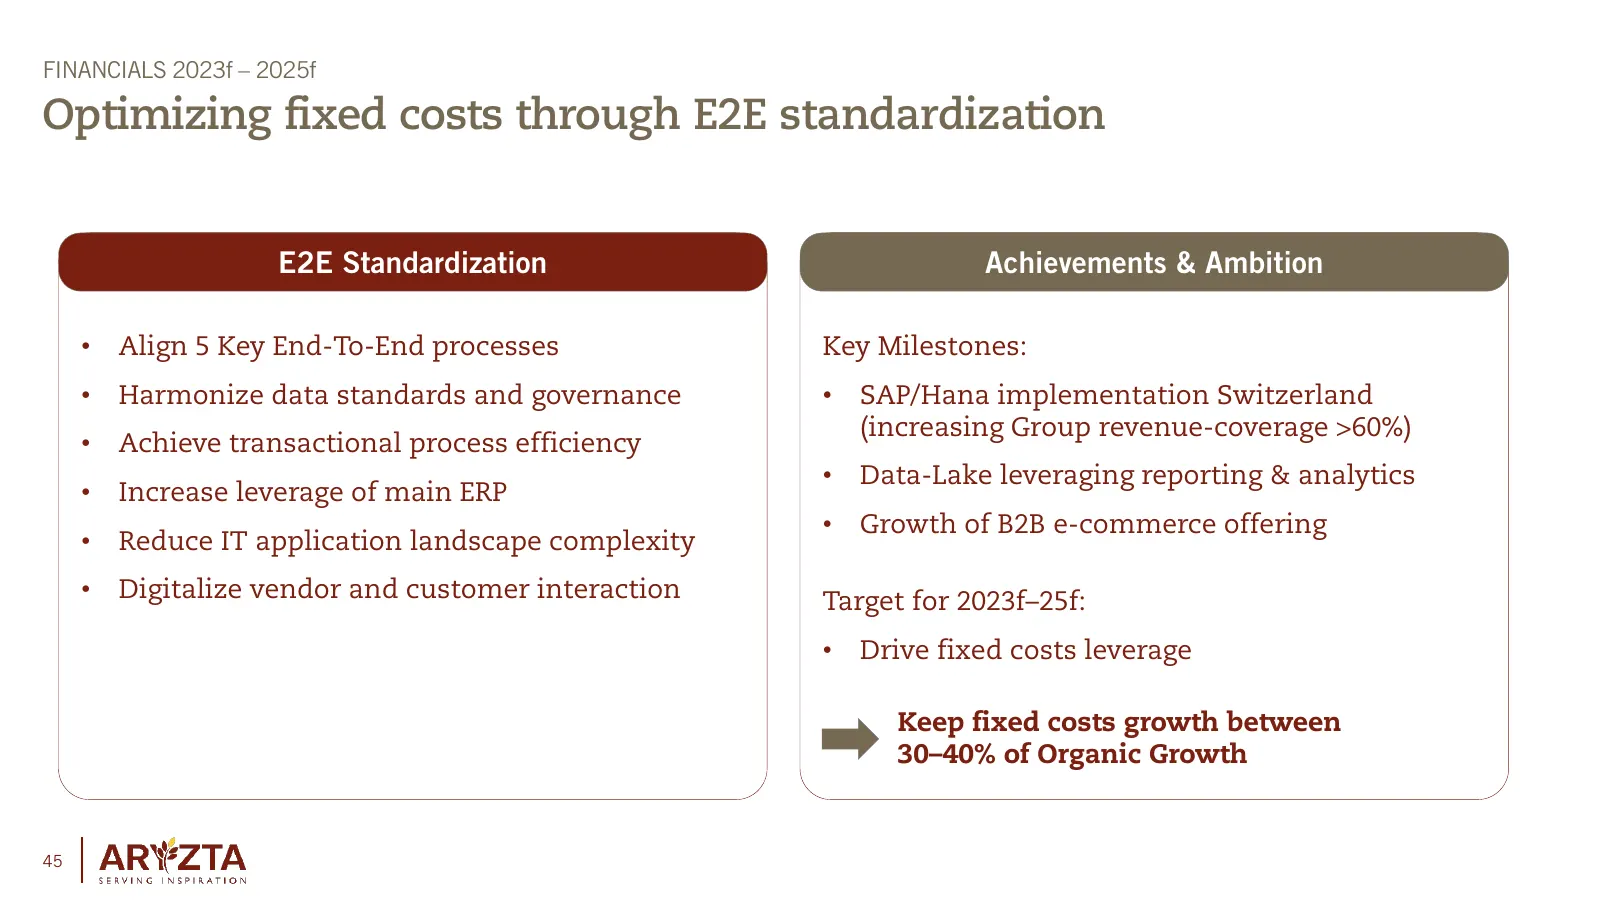
Slide 45: Optimizing fixed costs through E2E standardization
FINANCIALS 2023f – 2025f Optimizing fixed costs through E2E standardization E2E Standardization Achievements & Ambition • Align 5 Key End-To-End processes Key Milestones: • Harmonize data standards and governance • SAP/Hana implementation Switzerland (increasing Group revenue-coverage >60%) • Achiev
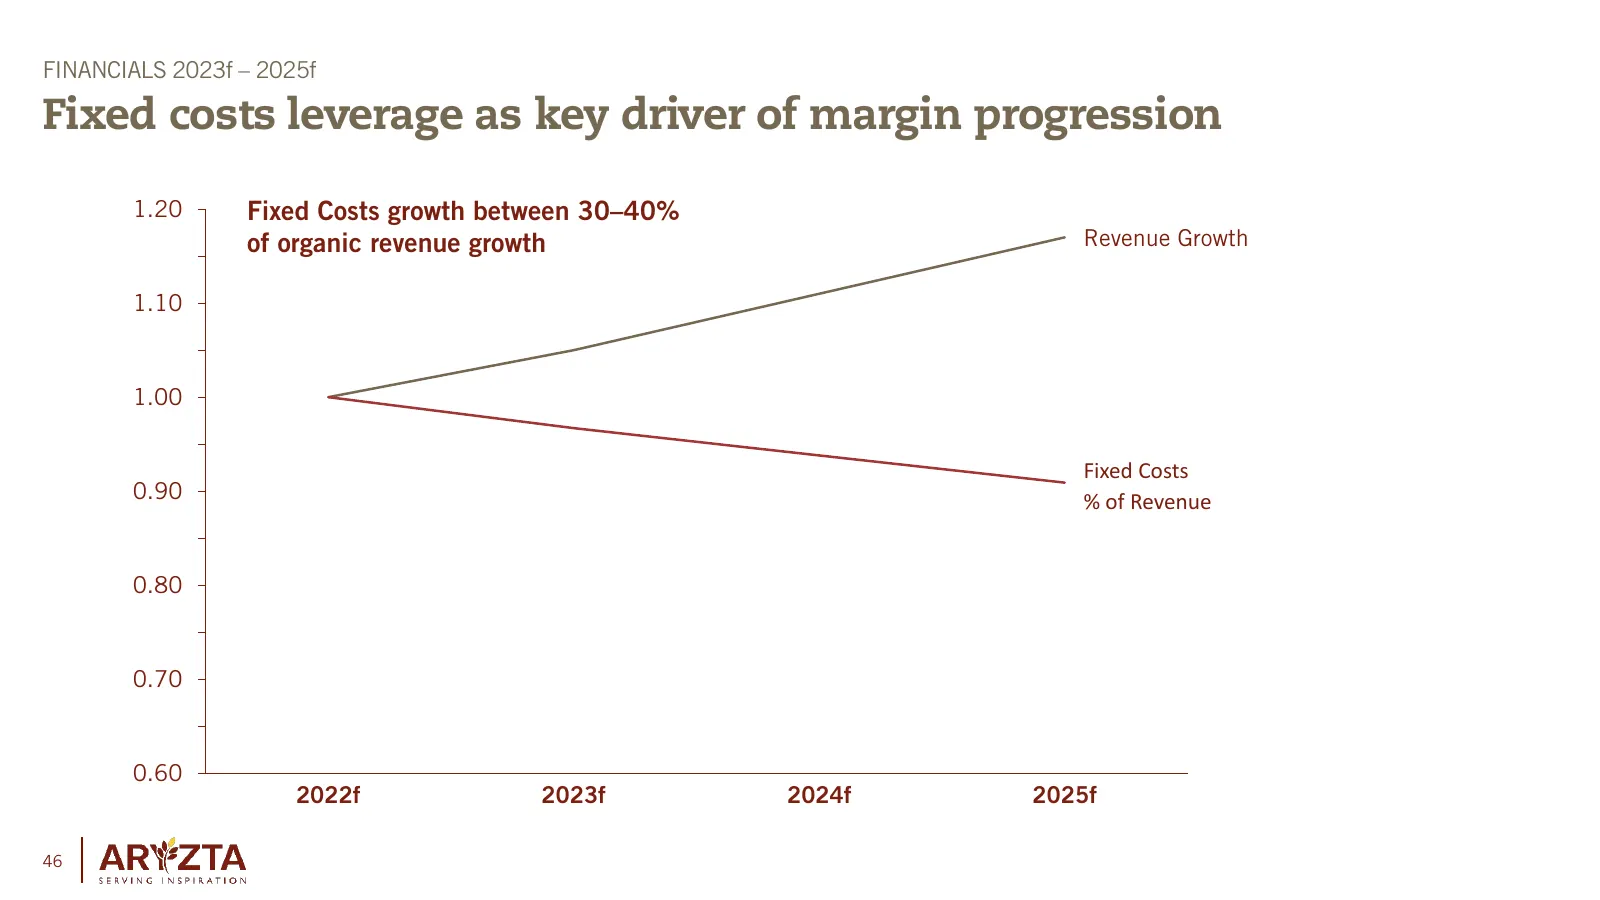
Slide 46: Fixed costs leverage as key driver of margin progression
FINANCIALS 2023f – 2025f Fixed costs leverage as key driver of margin progression 1.20 Fixed Costs growth between 30–40% of organic revenue growth Revenue Growth 1.10 1.00 Fixed Costs 0.90 % of Revenue 0.80 0.70 0.60 2022f 2023f 2024f 2025f 46
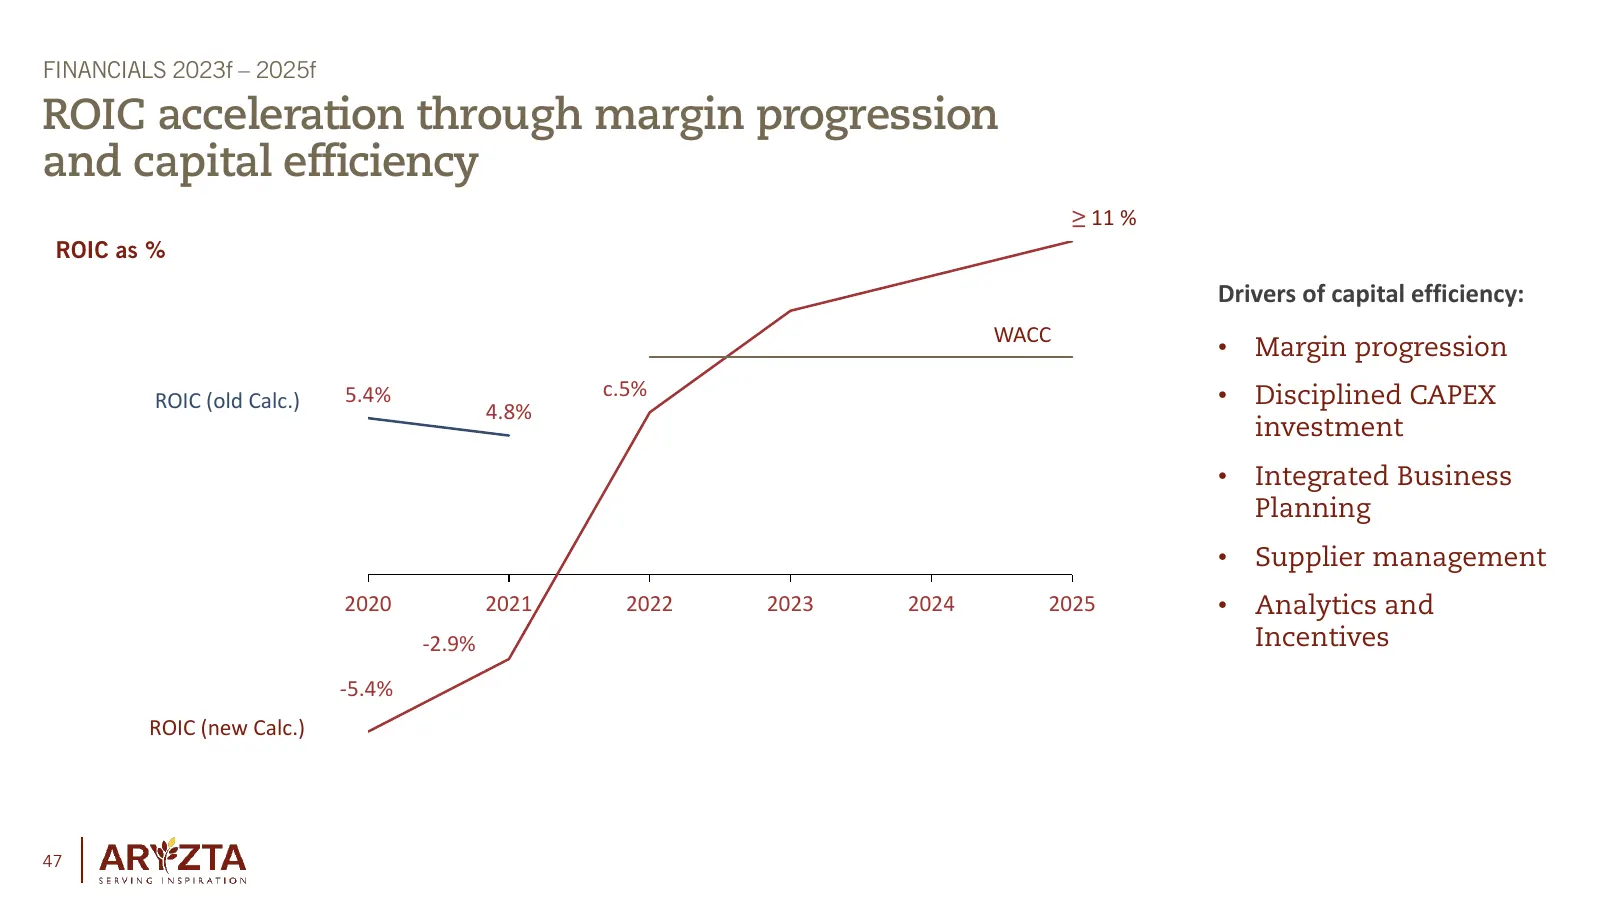
Slide 47: ROIC acceleration through margin progression and capital efficiency
FINANCIALS 2023f – 2025f ROIC acceleration through margin progression and capital efficiency ≥ 11 % ROIC as % Drivers of capital efficiency: WACC • Margin progression 5.4% c.5% • Disciplined CAPEX ROIC (old Calc.) 4.8% investment • Integrated Business Planning • Supplier management 2020 2021 2022 20
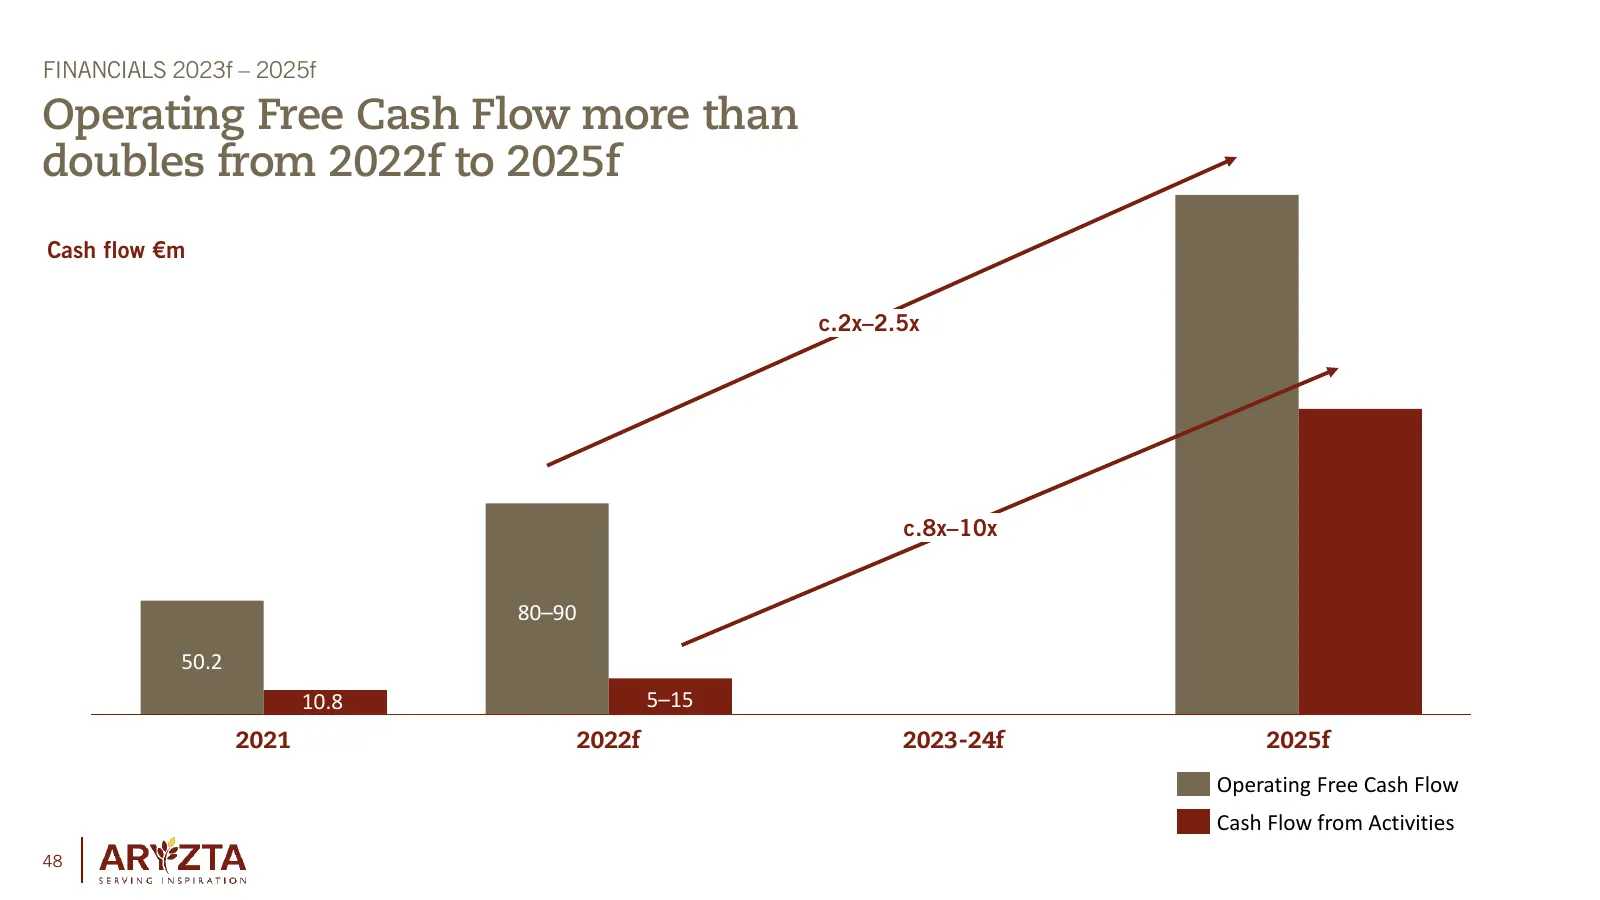
Slide 48: Operating Free Cash Flow more than doubles from 2022f to 2025f
FINANCIALS 2023f – 2025f Operating Free Cash Flow more than doubles from 2022f to 2025f Cash flow €m c.2x–2.5x 210 - 240 110 - 140 80-90 c.8x–10x 50,2 5-15 80–90 -27,4 50.2 10.8 5–15 2021 2022f 2023-24f 2025f Operating Free Cash Flow Cash Flow from Activities 48
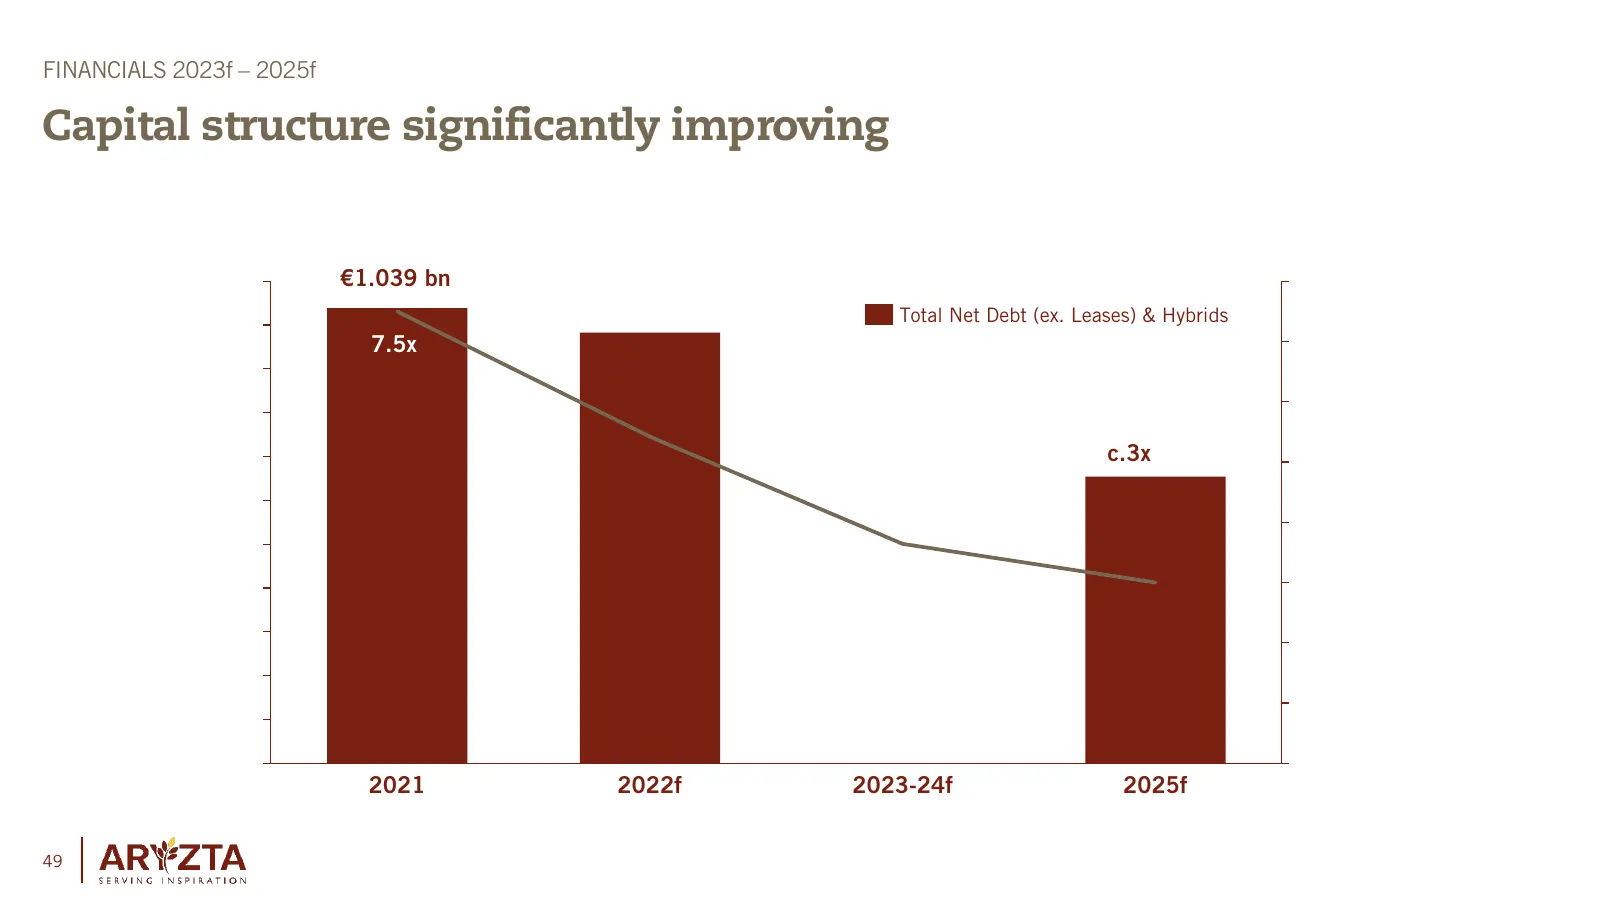
Slide 49: Capital structure significantly improving
FINANCIALS 2023f – 2025f Capital structure significantly improving €1.039 bn Total Net Debt (ex. Leases) & Hybrids 7.5x c.3xx 2021 2022f 2023-24f 2025f 49
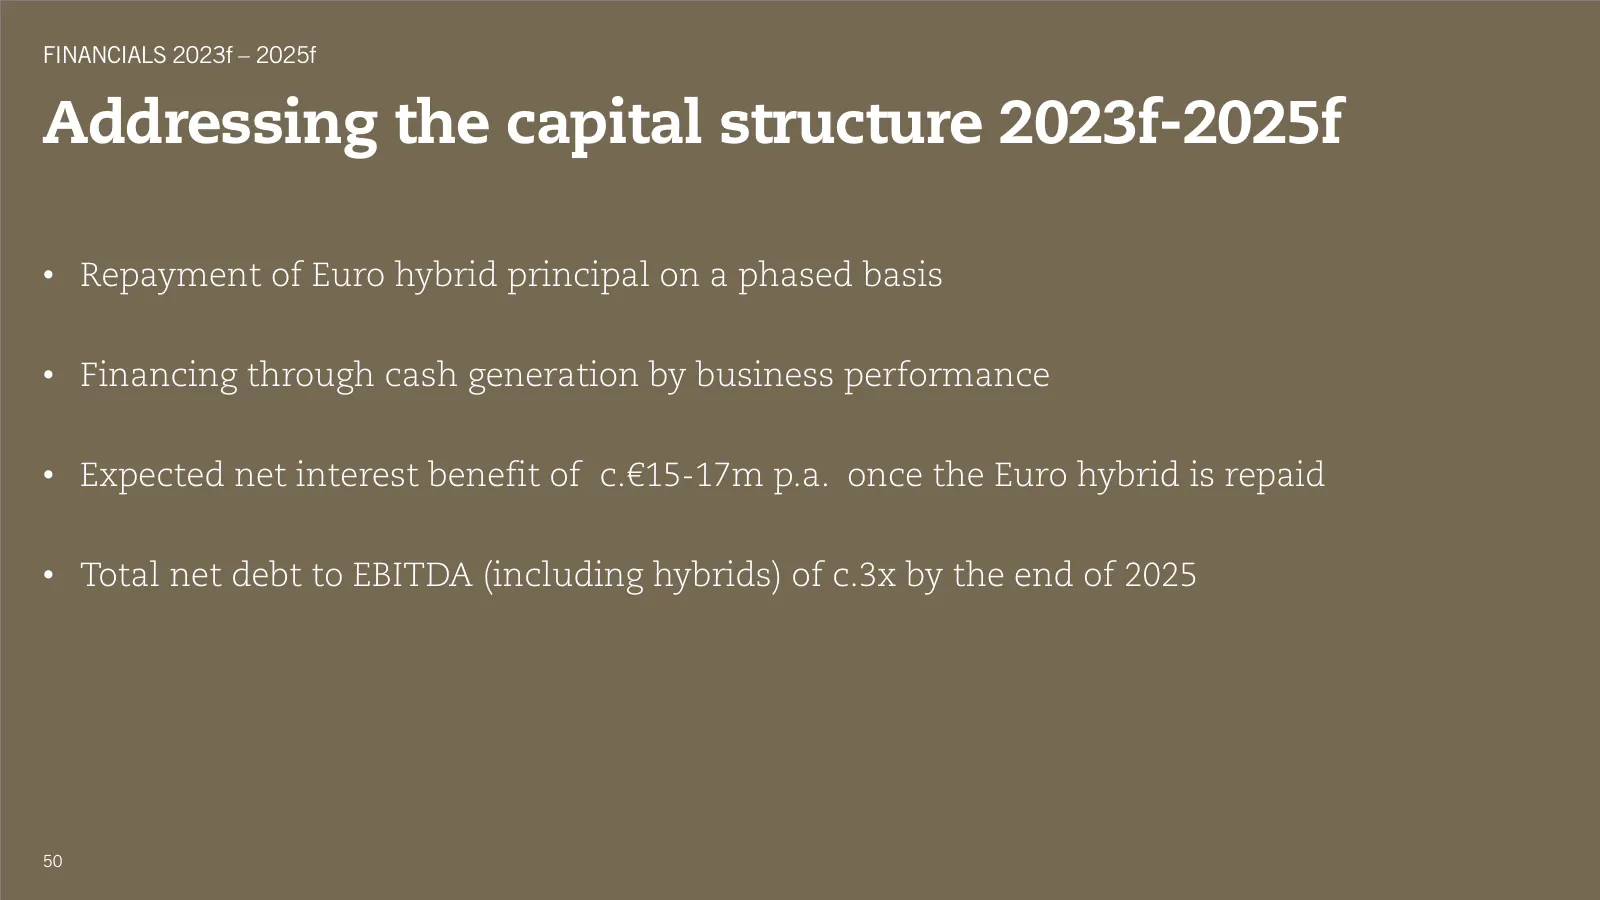
Slide 50: Addressing the capital structure 2023f-2025f
FINANCIALS 2023f – 2025f Addressing the capital structure 2023f-2025f • Repayment of Euro hybrid principal on a phased basis • Financing through cash generation by business performance • Expected net interest benefit of c.€15-17m p.a. once the Euro hybrid is repaid • Total net debt to EBITDA (includ
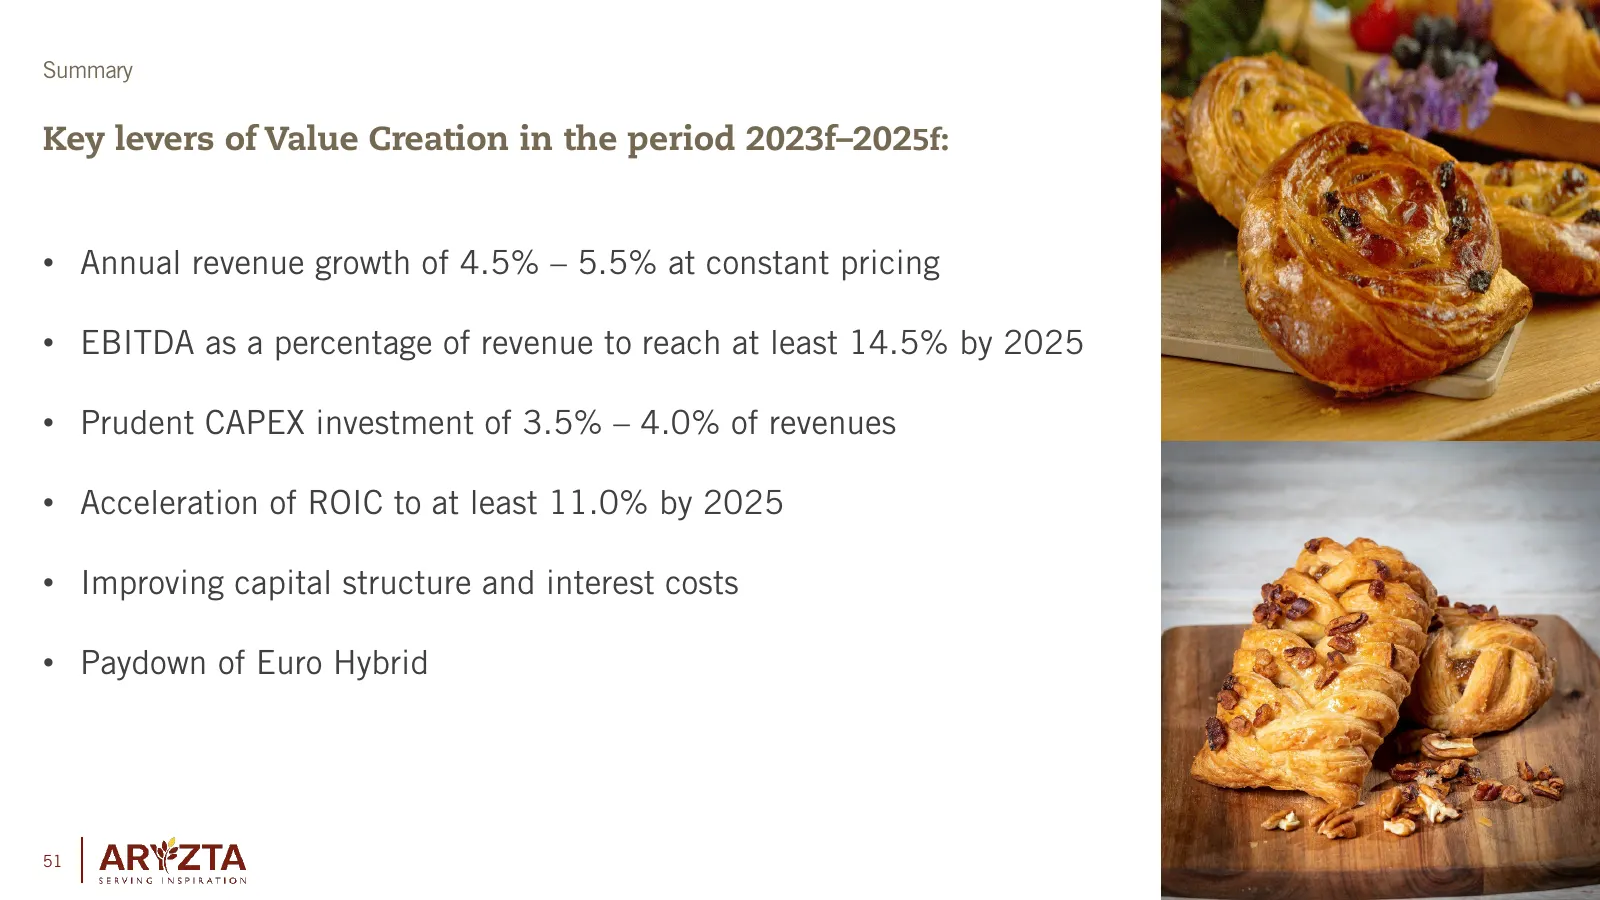
Slide 51: Summary: Key levers of value creation 2023f–2025f
Summary Key levers of Value Creation in the period 2023f–2025f: • Annual revenue growth of 4.5% – 5.5% at constant pricing • EBITDA as a percentage of revenue to reach at least 14.5% by 2025 • Prudent CAPEX investment of 3.5% – 4.0% of revenues • Acceleration of ROIC to at least 11.0% by 2025 • Impr

Slide 52: Appendix
Capital Markets Day Appendix
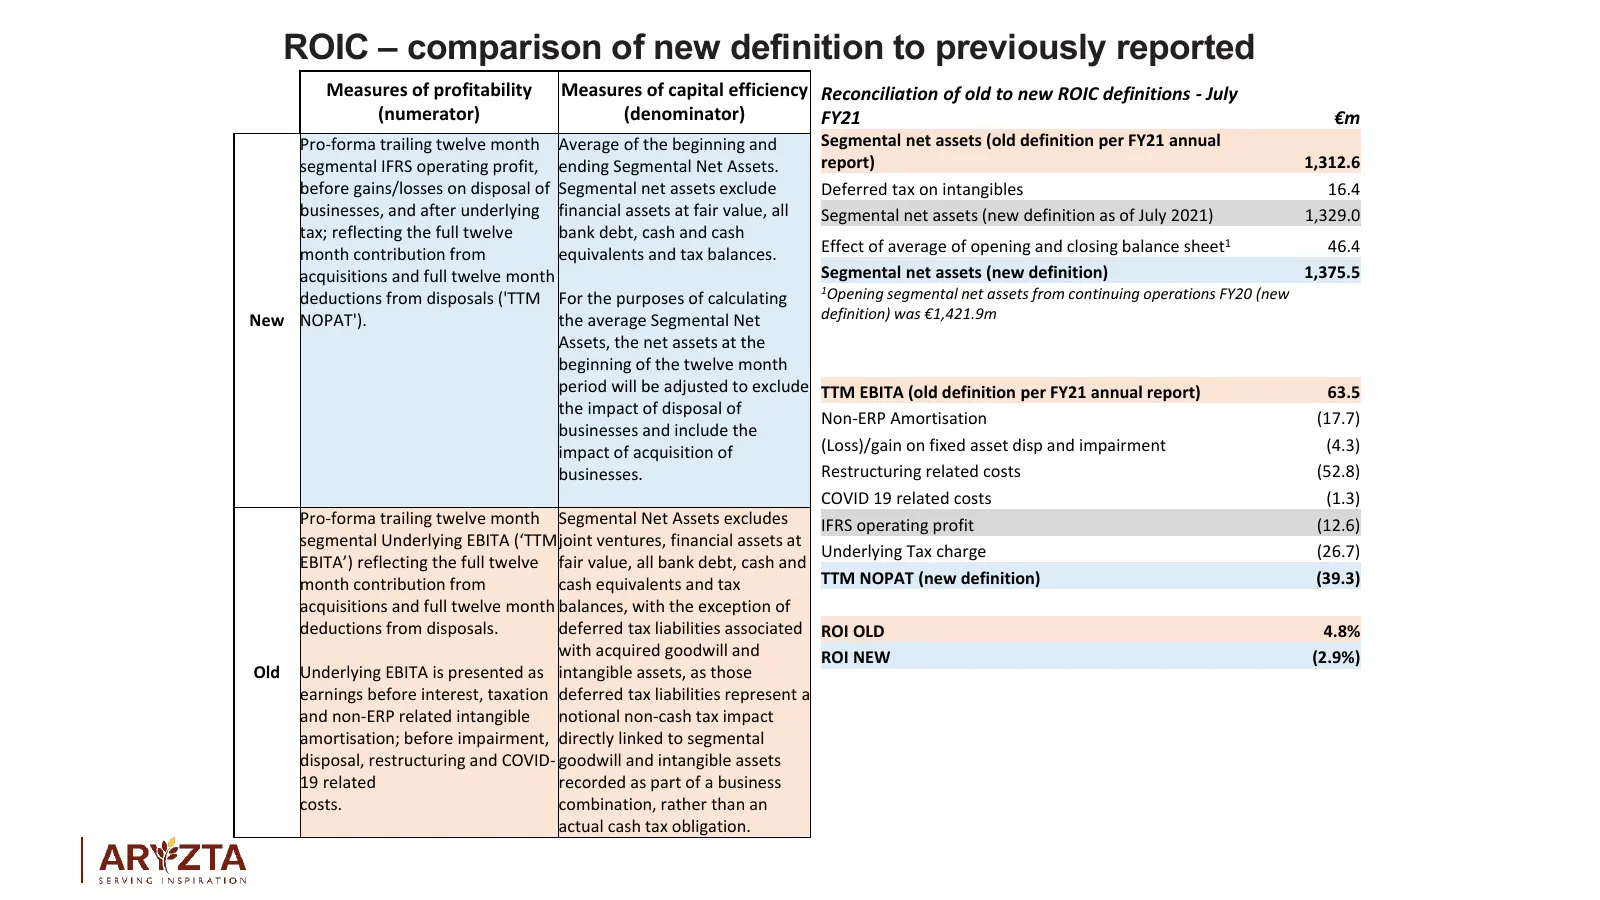
Slide 53: ROIC – comparison of new definition to previously reported
ROIC – comparison of new definition to previously reported Measures of profitability Measures of capital efficiency Reconciliation of old to new ROIC definitions - July (numerator) (denominator) FY21 €m Pro-forma trailing twelve month Average of the beginning and Segmental net assets (old definition
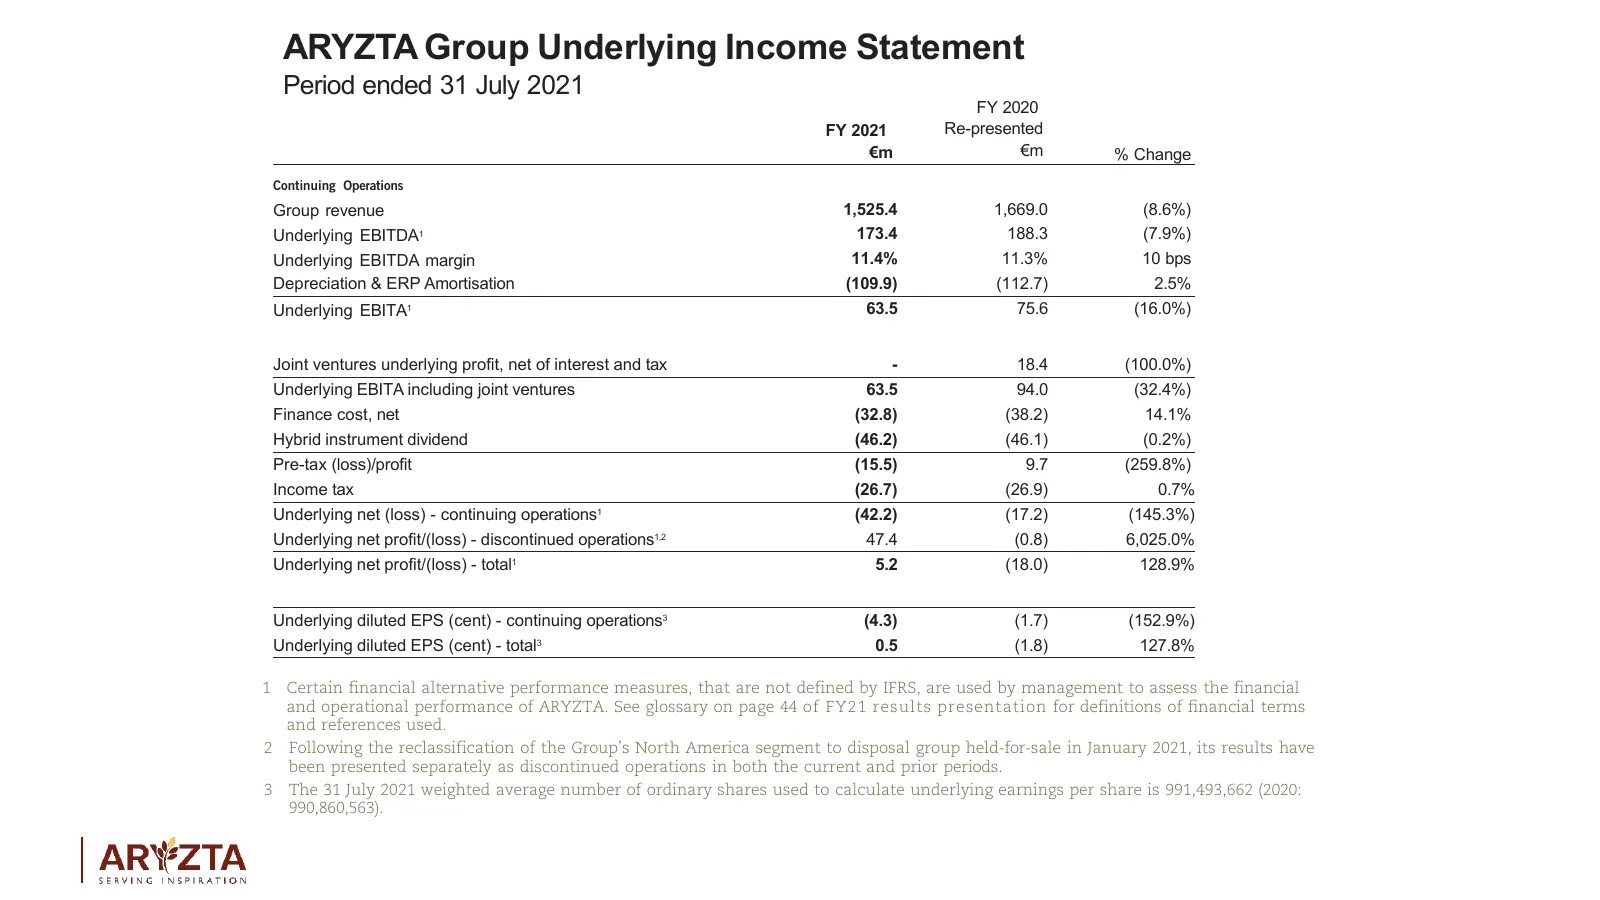
Slide 54: ARYZTA Group Underlying Income Statement
ARYZTA Group Underlying Income Statement Period ended 31 July 2021 FY 2020 FY 2021 Re-presented €m €m % Change Continuing Operations Group revenue 1,525.4 1,669.0 (8.6%) Underlying EBITDA1 173.4 188.3 (7.9%) Underlying EBITDA margin 11.4% 11.3% 10 bps Depreciation & ERP Amortisation (109.9) (112.7)
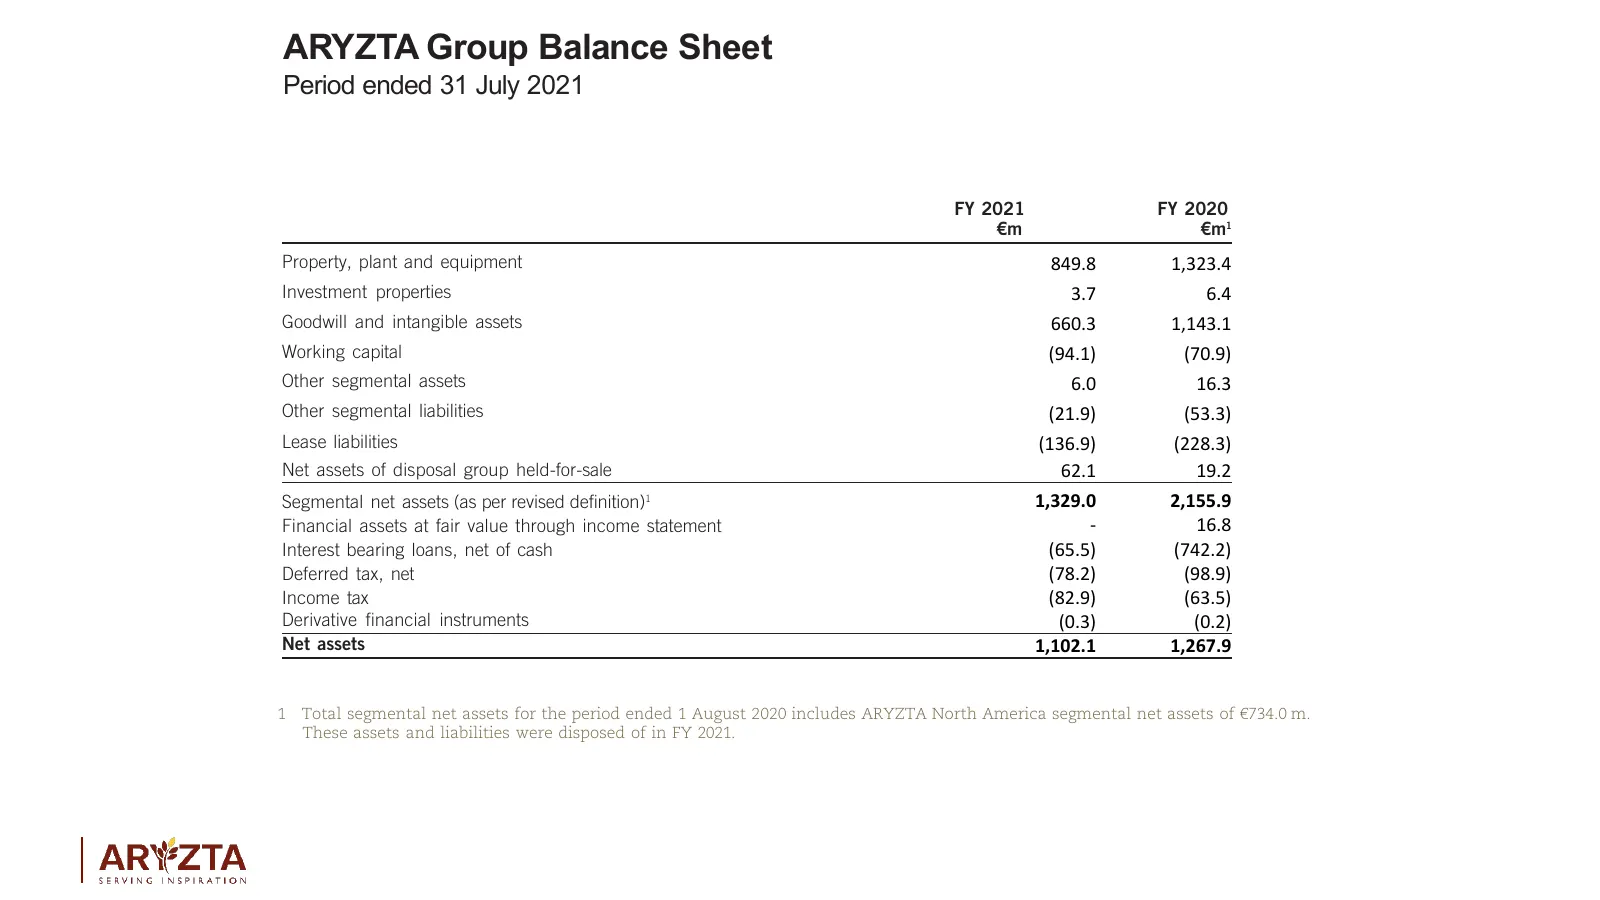
Slide 55: ARYZTA Group Balance Sheet
ARYZTA Group Balance Sheet Period ended 31 July 2021 FY 2021 FY 2020 €m €m1 Property, plant and equipment 849.8 1,323.4 Investment properties 3.7 6.4 Goodwill and intangible assets 660.3 1,143.1 Working capital (94.1) (70.9) Other segmental assets 6.0 16.3 Other segmental liabilities (21.9) (53.3) L
Source: Internet Archive copy of aryzta.com
More decks from Aryzta AG
 H1 2026 Earnings Presentation32 slides · Aug 10, 2026
 FY2025 Earnings Presentation7 slides · Jan 22, 2026
 Q3 2025 Earnings Presentation15 slides · Oct 20, 2025
 H1 2025 Earnings Presentation34 slides · Aug 11, 2025
 Investor Day (May 2025)48 slides · May 7, 2025
 Q1 2025 Earnings Presentation35 slides · Mar 2, 2025