Heidrick & Struggles International
Heidrick & Struggles International — Q2 2023 Earnings Presentation
35 slides from Heidrick & Struggles International's earnings presentation, Jul 31, 2023

Slide 1: Second Quarter 2023 Results
Second Quarter 2023 Results July 31, 2023
Slide 2: Cautionary Statement Regarding Forward-Looking Information
Cautionary Statement Regarding Forward-Looking Information The following slides contain forward-looking statements within the meaning of the federal securities laws, including statements regarding guidance for the third quarter of 2023. The forward-looking statements are based on current expectation
Slide 3: Non-GAAP Financial Measures & Currency Presentation
Non-GAAP Financial Measures & Currency Presentation NON-GAAP FINANCIAL MEASURES To supplement the financial results presented in accordance with generally accepted accounting principles in the United States (“GAAP”), Heidrick & Struggles presents certain non-GAAP financial measures. A “non-GAAP fina

Slide 4: Overview
Overview
Slide 5: Our Purpose & Vision
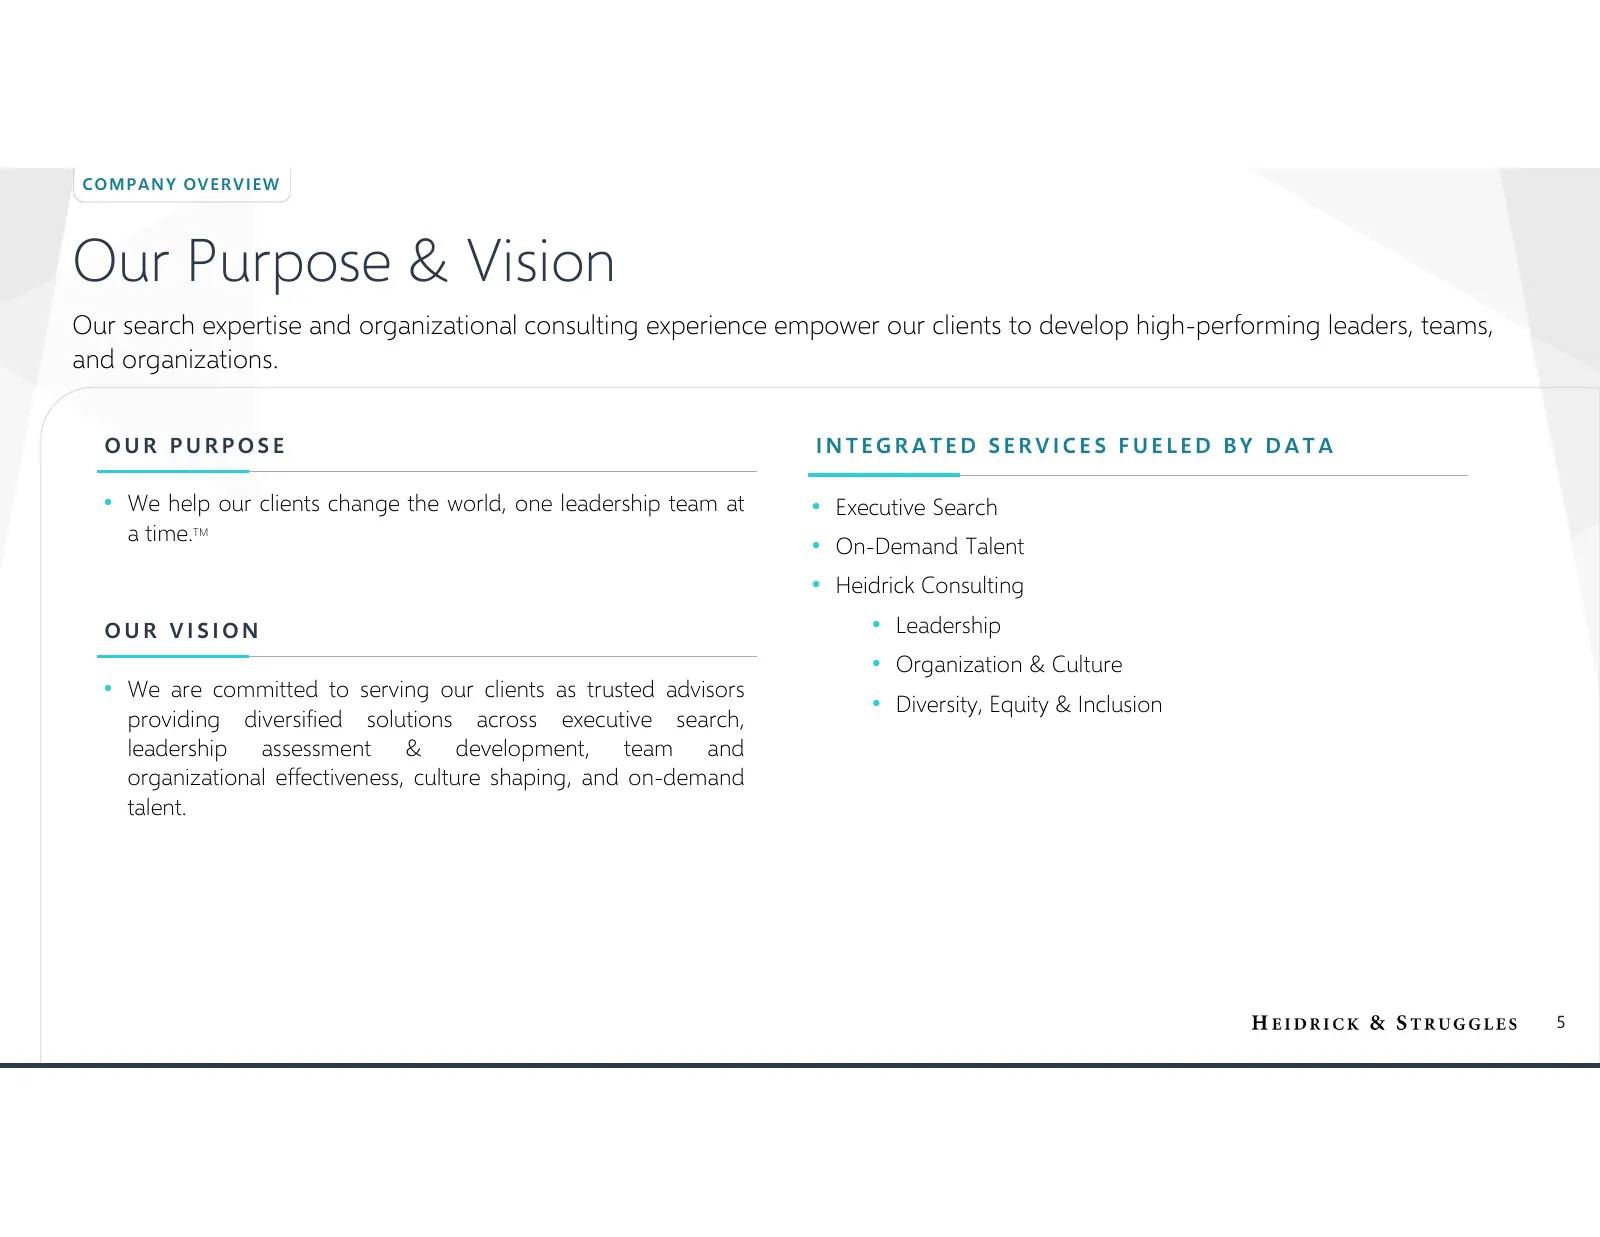
CO M P AN Y OV ER VI EW Our Purpose & Vision Our search expertise and organizational consulting experience empower our clients to develop high-performing leaders, teams, and organizations. OUR PURPOSE INTEGRATED SERVICES FUELED BY DATA • We help our clients change the world, one leadership team at •
Slide 6: Financial Highlights
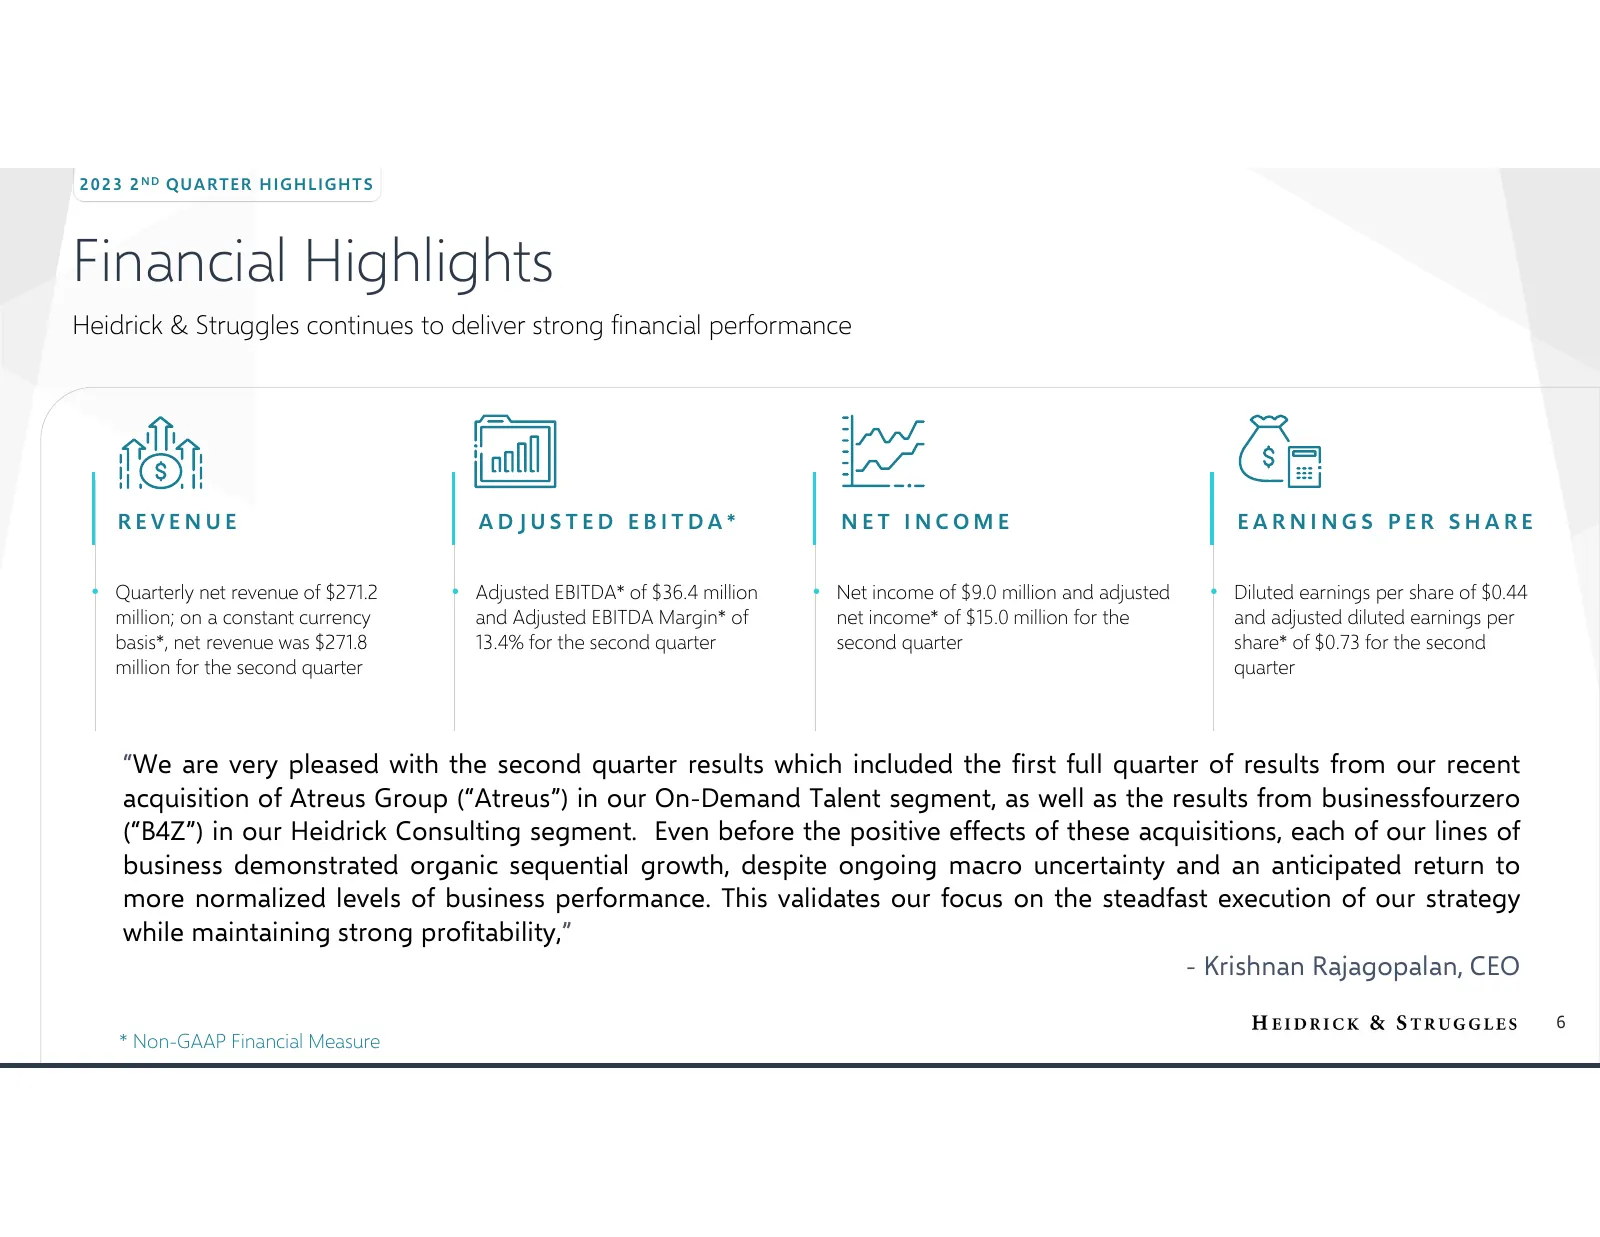
2 02 3 2 N D QU AR TE R H I GH L I GH T S Financial Highlights Heidrick & Struggles continues to deliver strong financial performance REVENUE ADJUSTED EBITDA* NET INCOME EARNINGS PER SHARE • Quarterly net revenue of $271.2 • Adjusted EBITDA* of $36.4 million • Net income of $9.0 million and adjusted
Slide 7: Growth Through Innovative Offerings
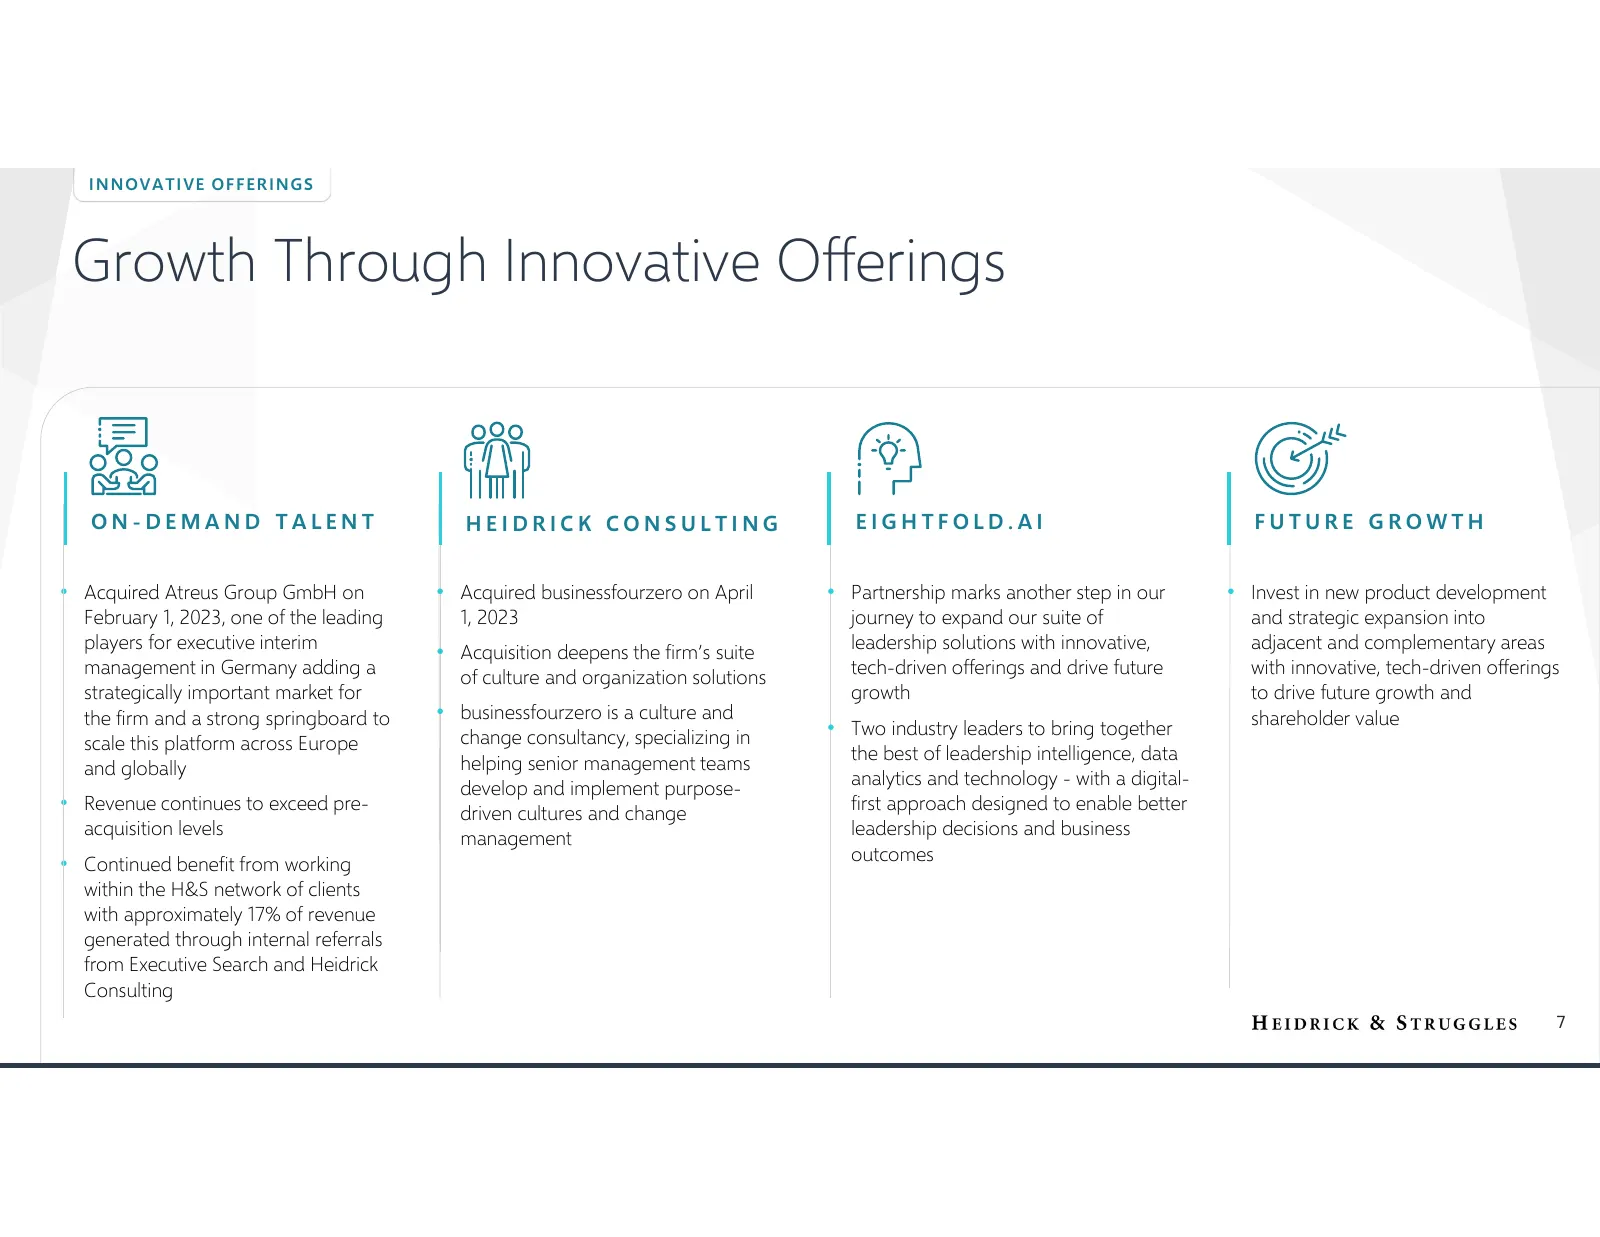
I N N O VA TI VE O F F ER I N GS Growth Through Innovative Offerings ON-DEMAND TALENT HEIDRICK CONSULTING EIGHTFOLD.AI FUTURE GROWTH • Acquired Atreus Group GmbH on • Acquired businessfourzero on April • Partnership marks another step in our • Invest in new product development February 1, 2023, one
Slide 8: Introducing Atreus
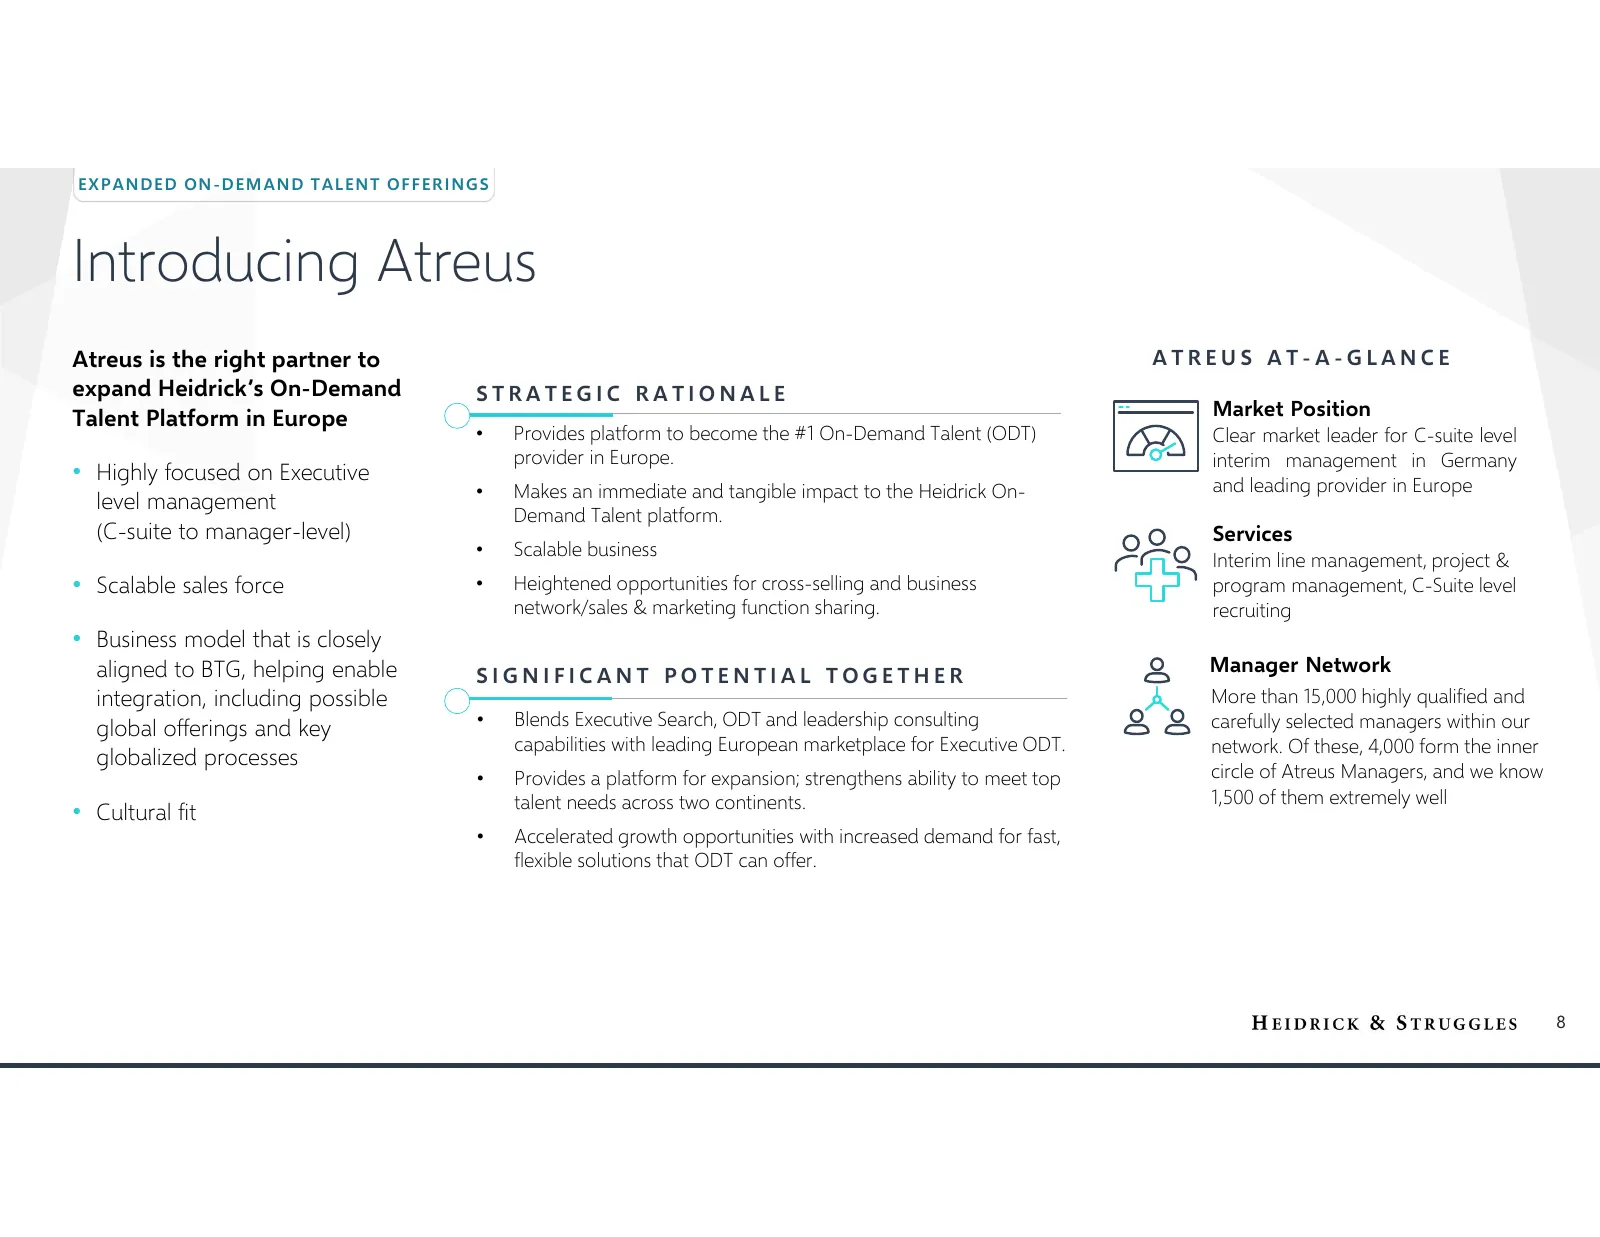
EX P AN D ED ON -D EM AN D T AL EN T OF F ER I N GS Introducing Atreus Atreus is the right partner to ATREUS AT-A-GLANCE expand Heidrick’s On-Demand STRATEGIC RATIONALE Talent Platform in Europe Market Position • Provides platform to become the #1 On-Demand Talent (ODT) Clear market leader for C-sui
Slide 9: Introducing businessfourzero
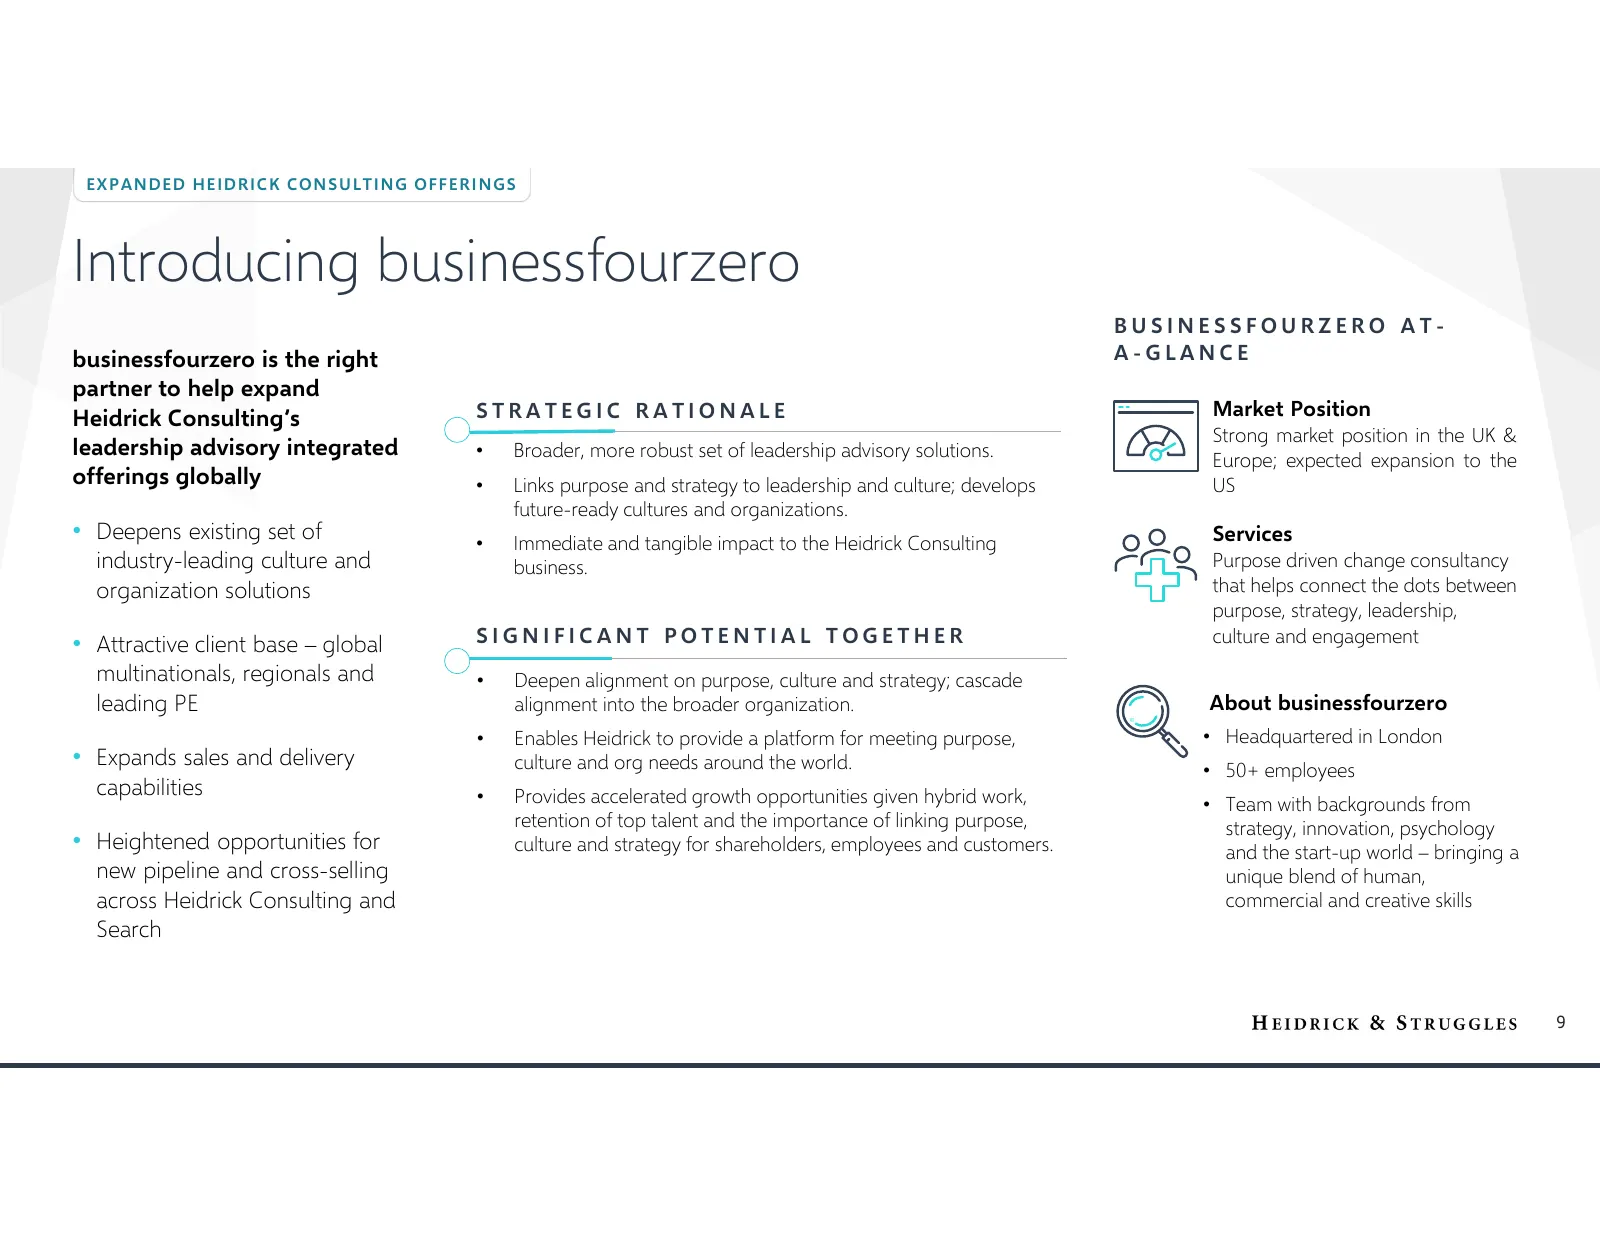
EX P AN DED H E I D R I C K C ON S U LT I N G OF F ER I N GS Introducing businessfourzero BUSINESSFOURZERO AT- businessfourzero is the right A-GLANCE partner to help expand Heidrick Consulting’s STRATEGIC RATIONALE Market Position Strong market position in the UK & leadership advisory integrated • B
Slide 10: Consolidated Results
Consolidated Results
Slide 11: Consolidated Financial Highlights
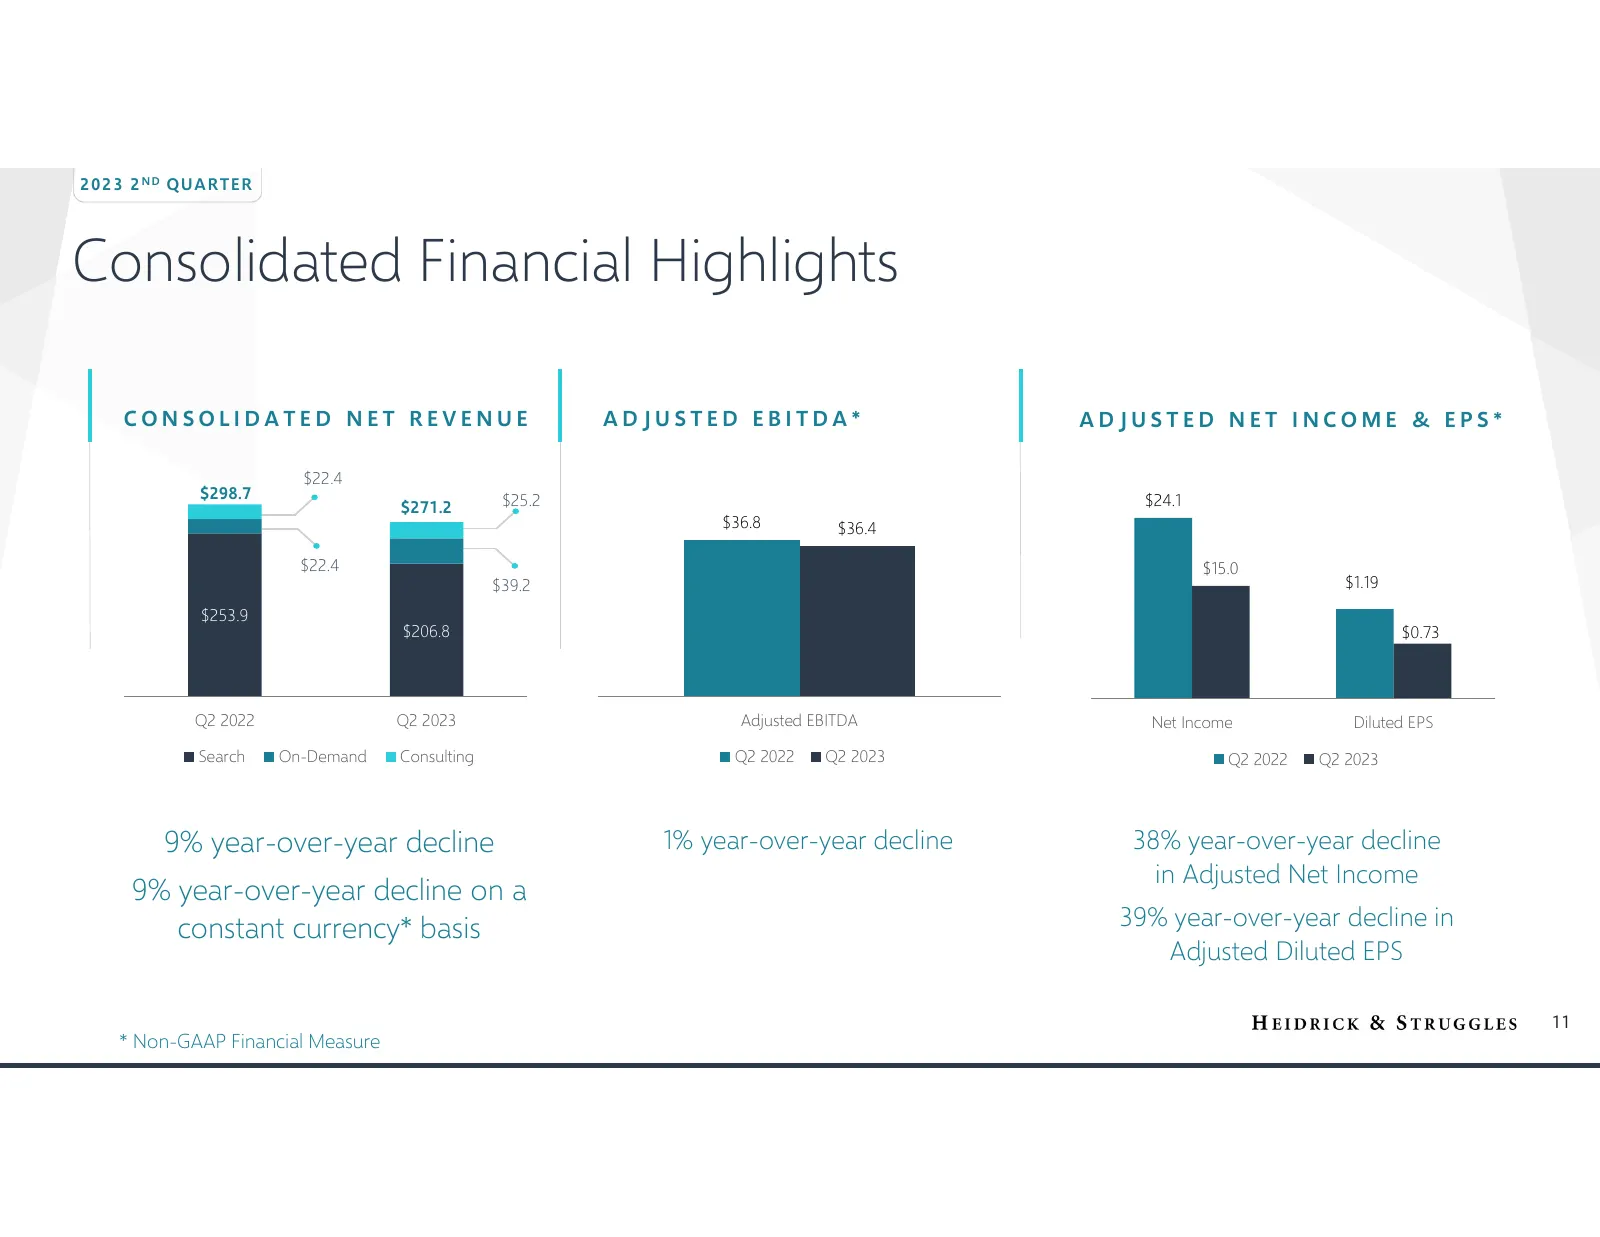
2 02 3 2 N D QU AR TE R Consolidated Financial Highlights CONSOLIDATED NET REVENUE ADJUSTED EBITDA* ADJUSTED NET INCOME & EPS* $22.4 $298.7 $25.2 $24.1 $271.2 $36.8 $36.4 $22.4 $15.0 $39.2 $1.19 $253.9 $206.8 $0.73 Q2 2022 Q2 2023 Adjusted EBITDA Net Income Diluted EPS Search On-Demand Consulting Q2
Slide 12: Consolidated Financial Highlights
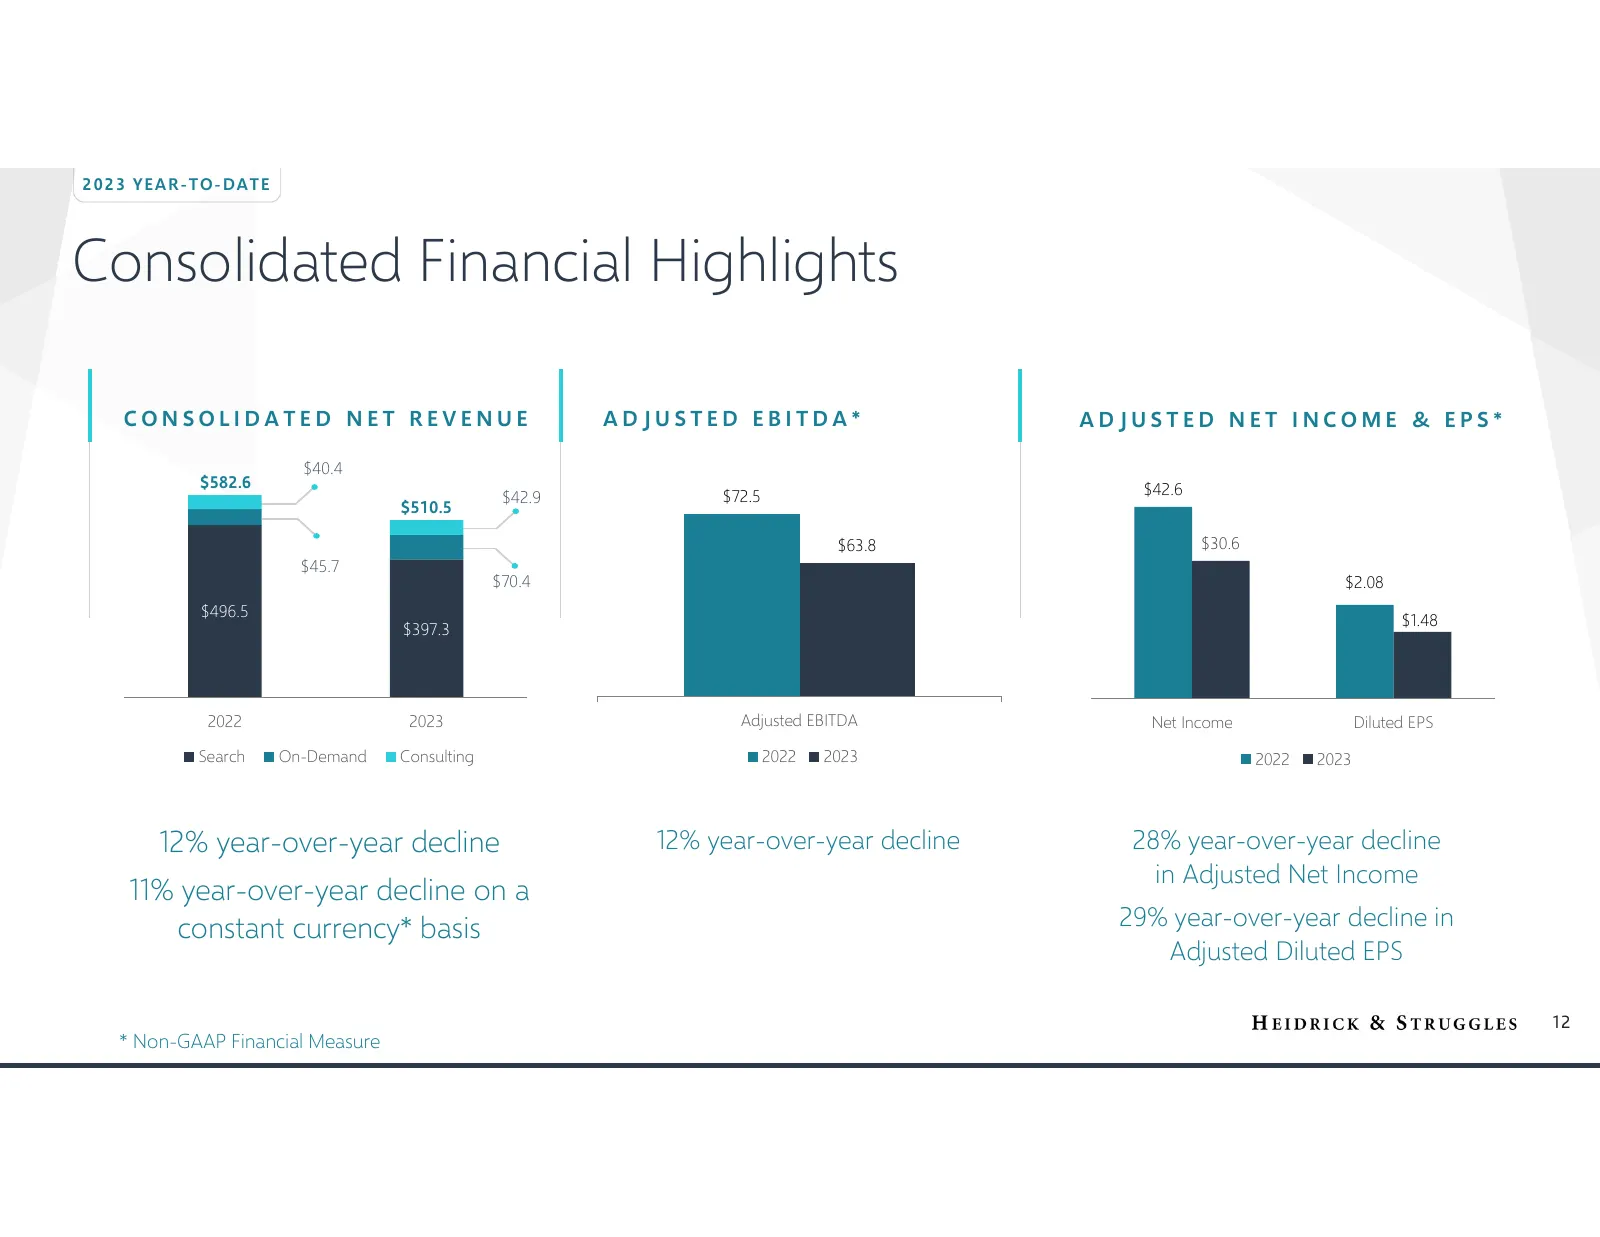
2 02 3 Y EA R- T O- D AT E Consolidated Financial Highlights CONSOLIDATED NET REVENUE ADJUSTED EBITDA* ADJUSTED NET INCOME & EPS* $40.4 $582.6 $42.6 $42.9 $72.5 $510.5 $63.8 $30.6 $45.7 $70.4 $2.08 $496.5 $1.48 $397.3 2022 2023 Adjusted EBITDA Net Income Diluted EPS Search On-Demand Consulting 2022
Slide 13: Expansion In Adjusted EBITDA Margin*
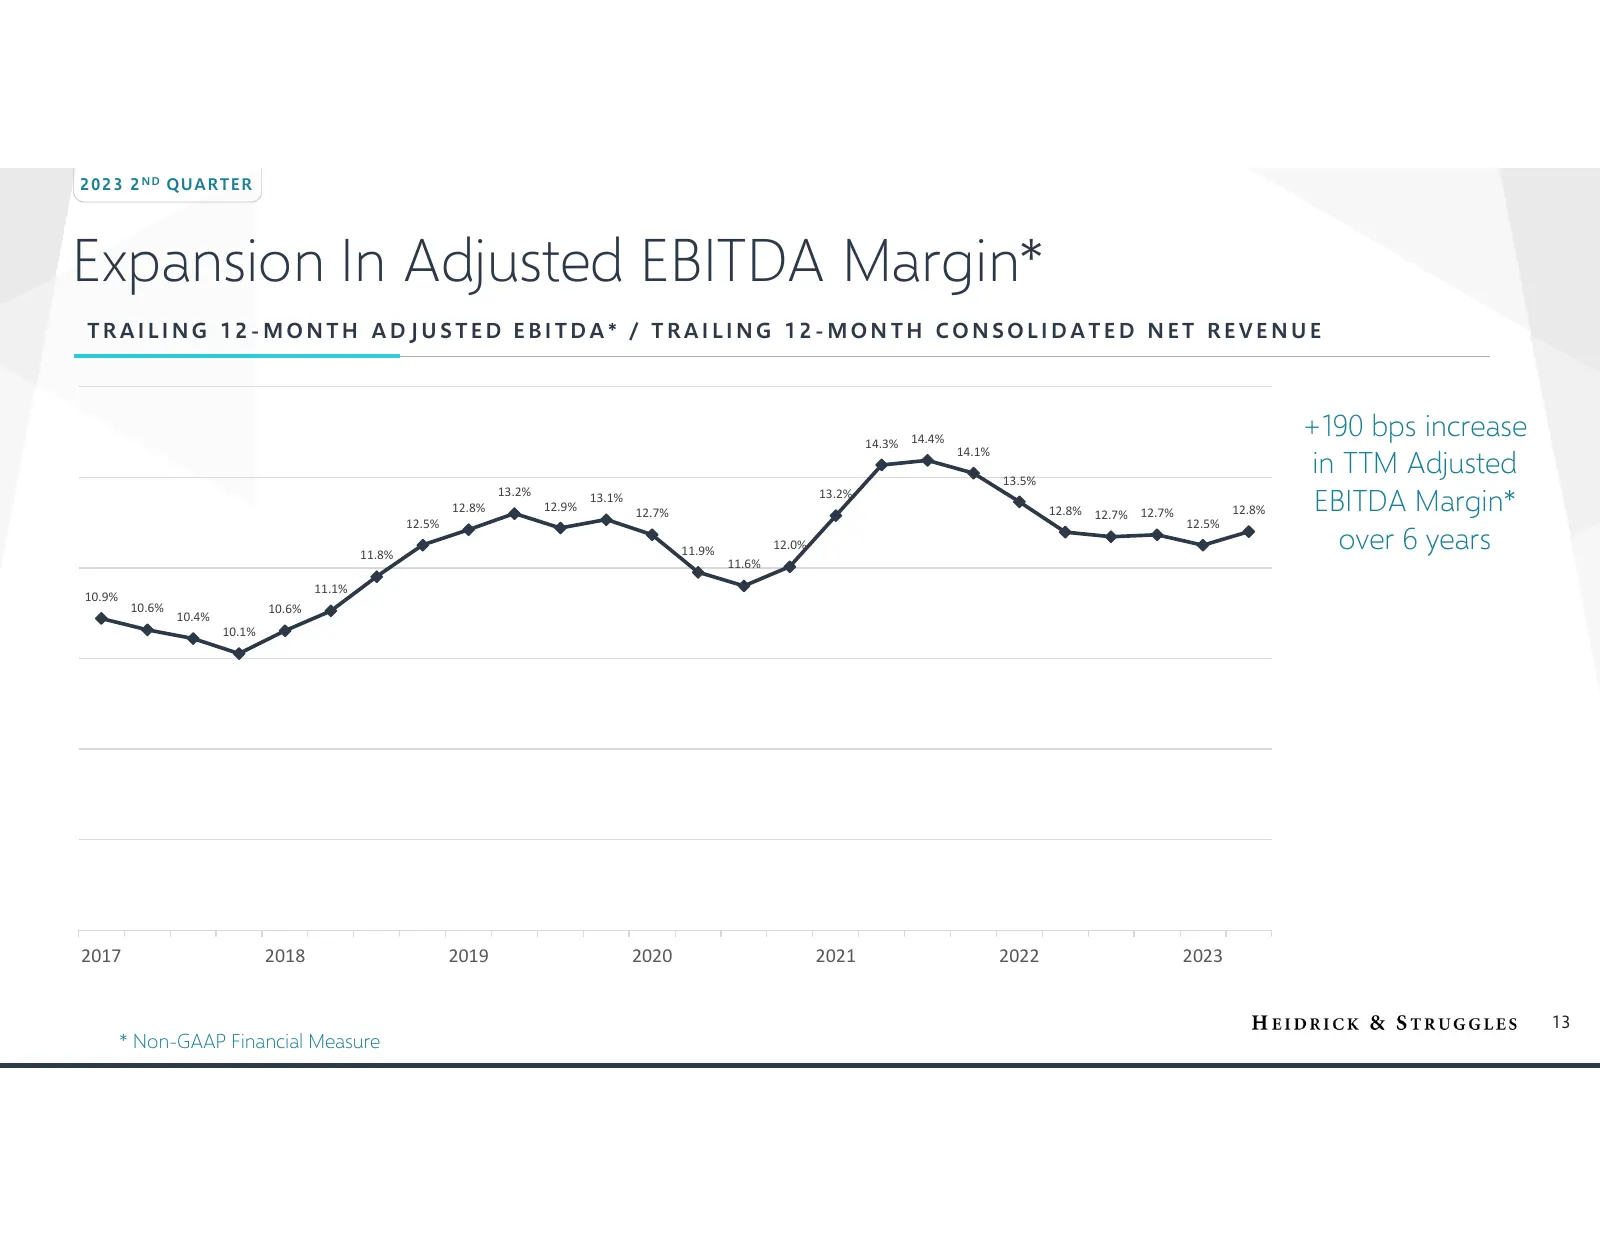
2 02 3 2 N D QU AR TE R Expansion In Adjusted EBITDA Margin* TRAILING 12-MONTH ADJUSTED EBITDA* / TRAILING 12-MONTH CONSOLIDATED NET REVENUE 14.3% 14.4% +190 bps increase in TTM Adjusted 14.1% 13.5% EBITDA Margin* 13.2% 13.1% 13.2% 12.8% 12.9% 12.8% 12.7% 12.7% 12.8% 12.7% 12.5% 12.5% 11.8% 11.9% 12
Slide 14: Executive Search Results
Executive Search Results
Slide 15: Executive Search Financial Highlights
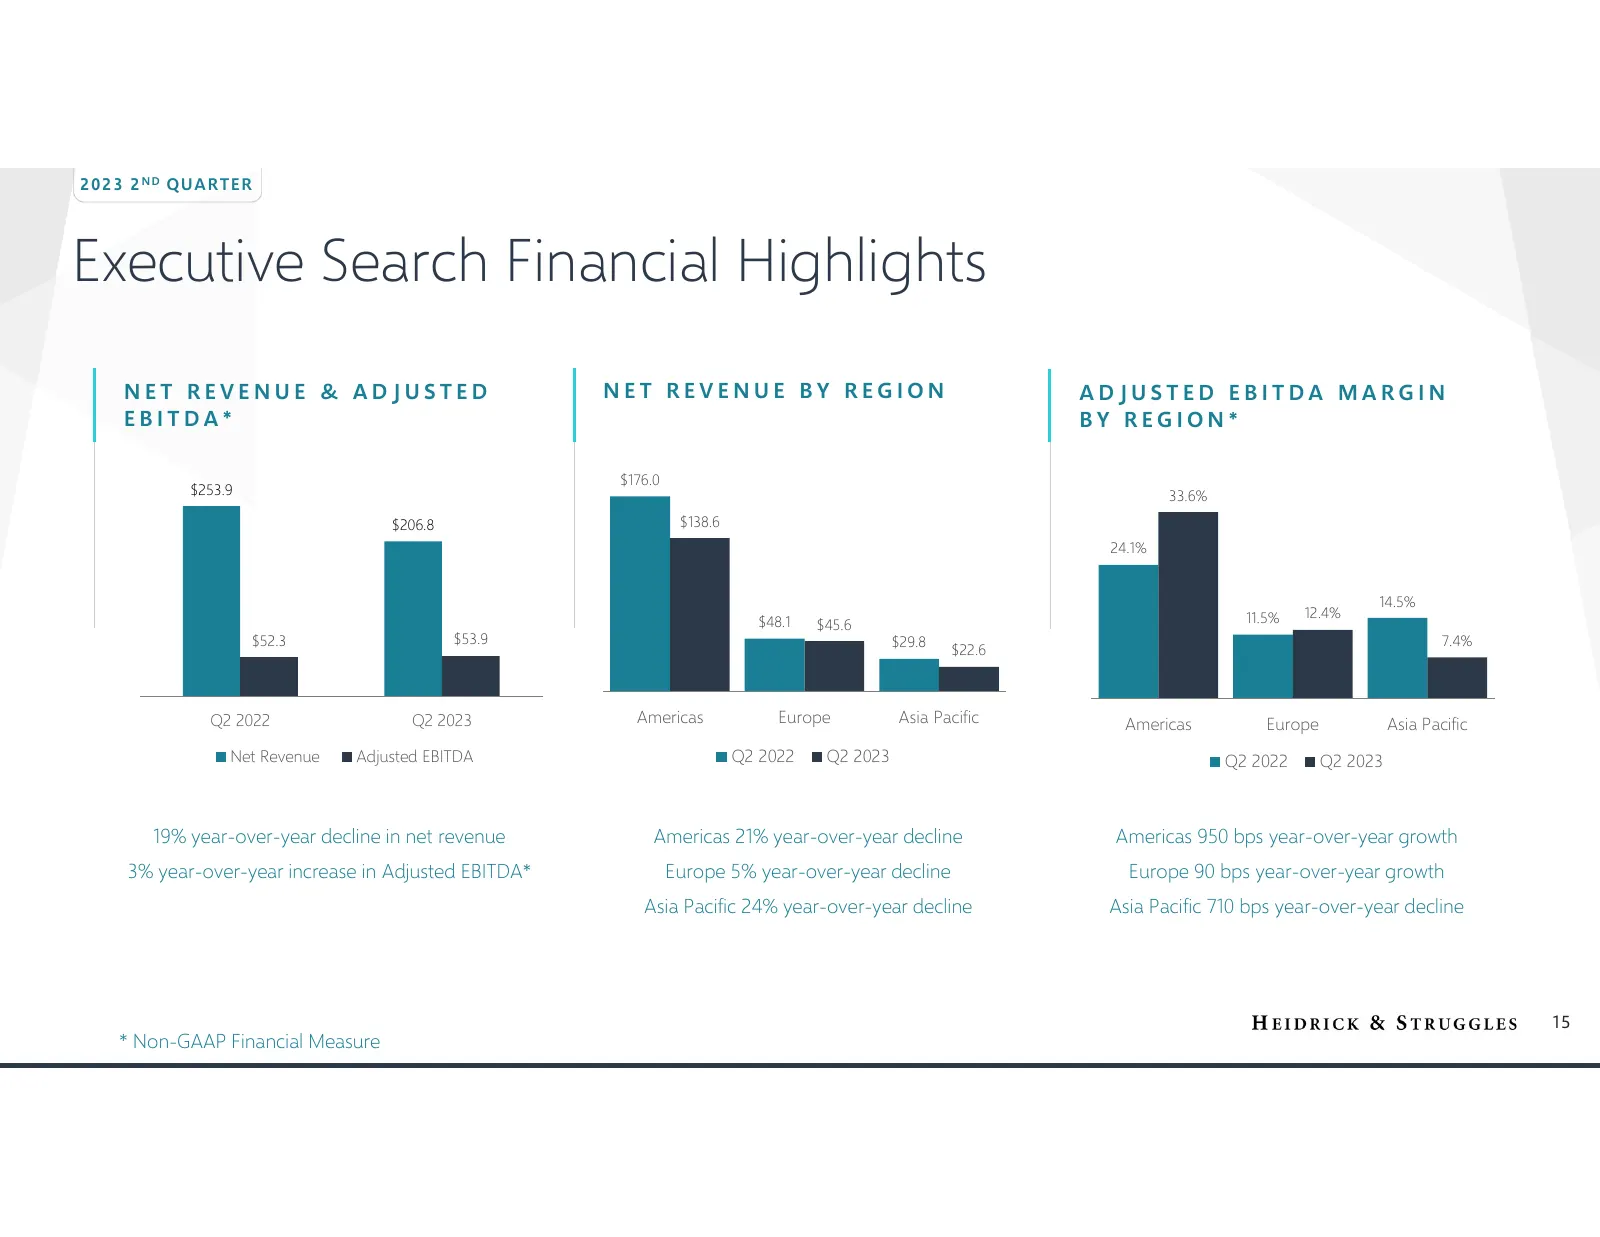
2 02 3 2 N D QU AR TE R Executive Search Financial Highlights NET REVENUE & ADJUSTED NET REVENUE BY REGION ADJUSTED EBITDA MARGIN EBITDA* BY REGION* $176.0 $253.9 33.6% $206.8 $138.6 24.1% 14.5% 11.5% 12.4% $48.1 $45.6 $52.3 $53.9 $29.8 7.4% $22.6 Q2 2022 Q2 2023 Americas Europe Asia Pacific America
Slide 16: Executive Search Operational Highlights
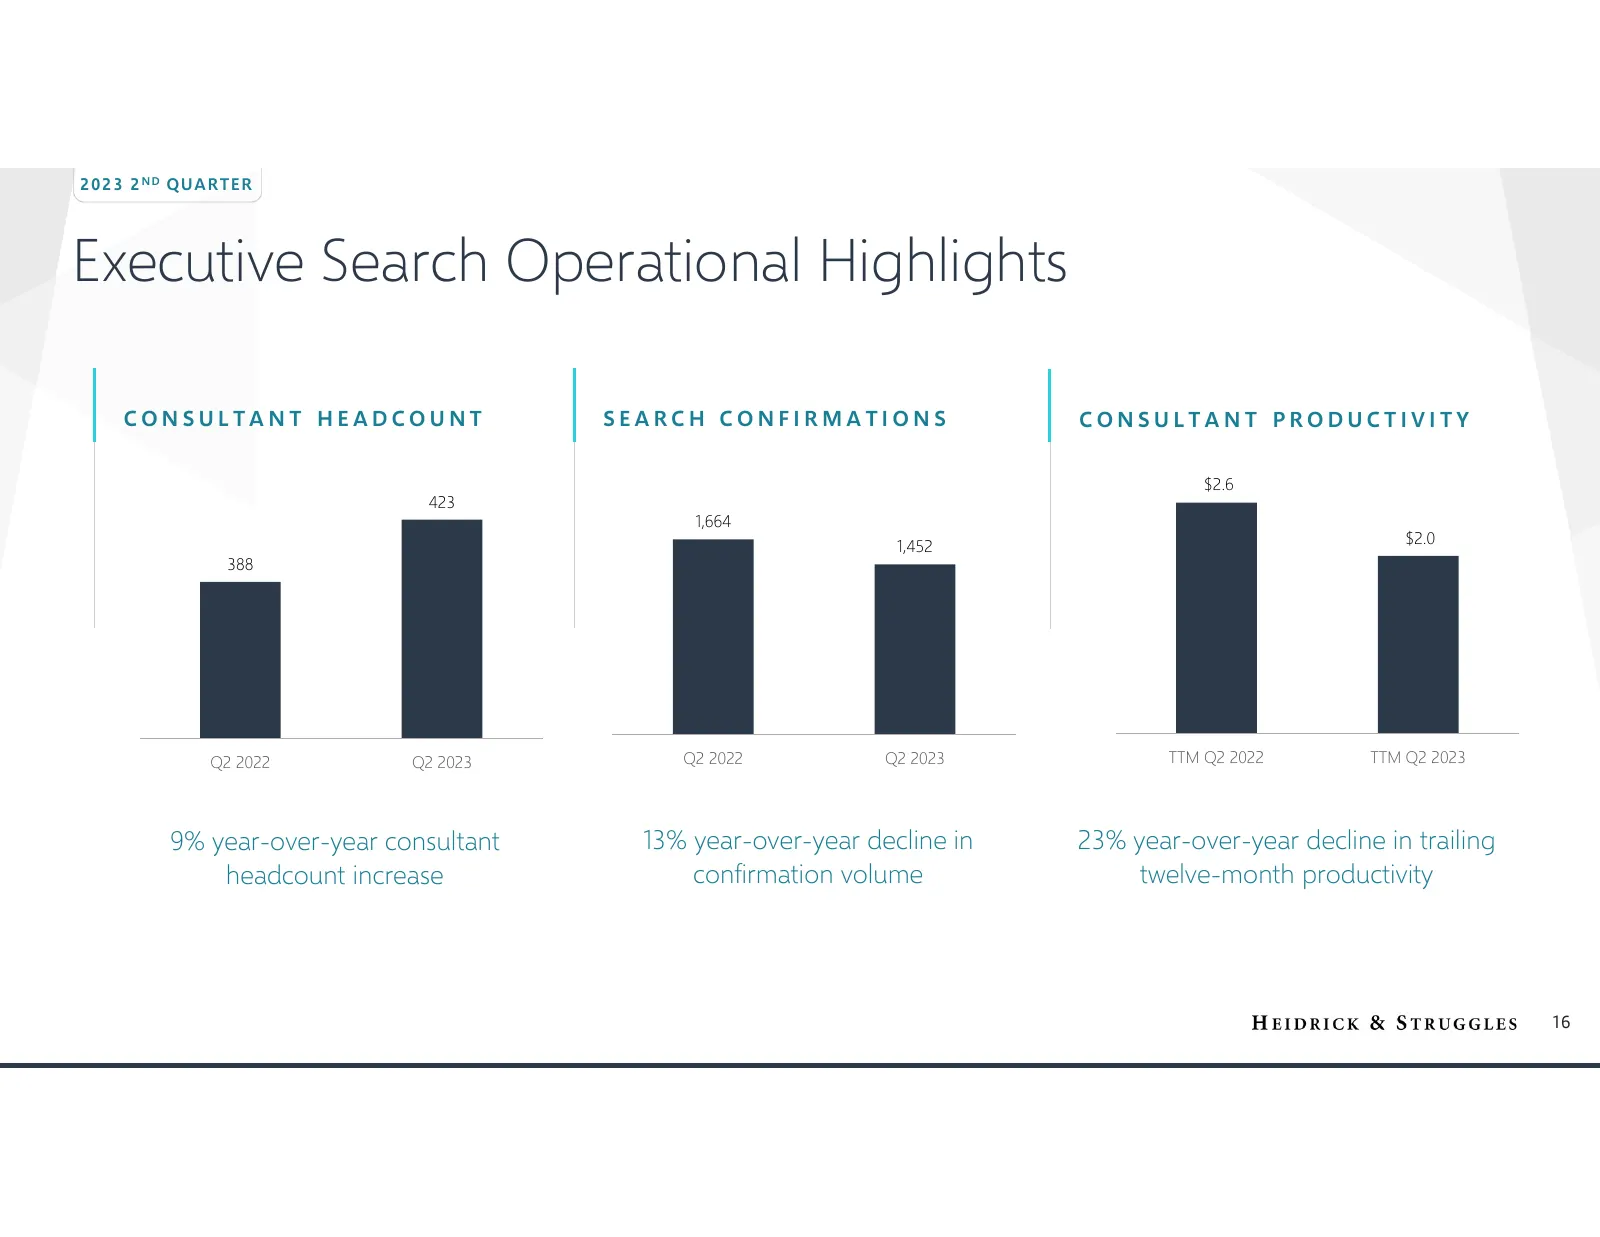
2 02 3 2 N D QU AR TE R Executive Search Operational Highlights CONSULTANT HEADCOUNT SEARCH CONFIRMATIONS CONSULTANT PRODUCTIVITY $2.6 423 1,664 $2.0 1,452 388 Q2 2022 Q2 2023 Q2 2022 Q2 2023 TTM Q2 2022 TTM Q2 2023 9% year-over-year consultant 13% year-over-year decline in 23% year-over-year declin
Slide 17: Diversified Mix Of Business In Executive Search
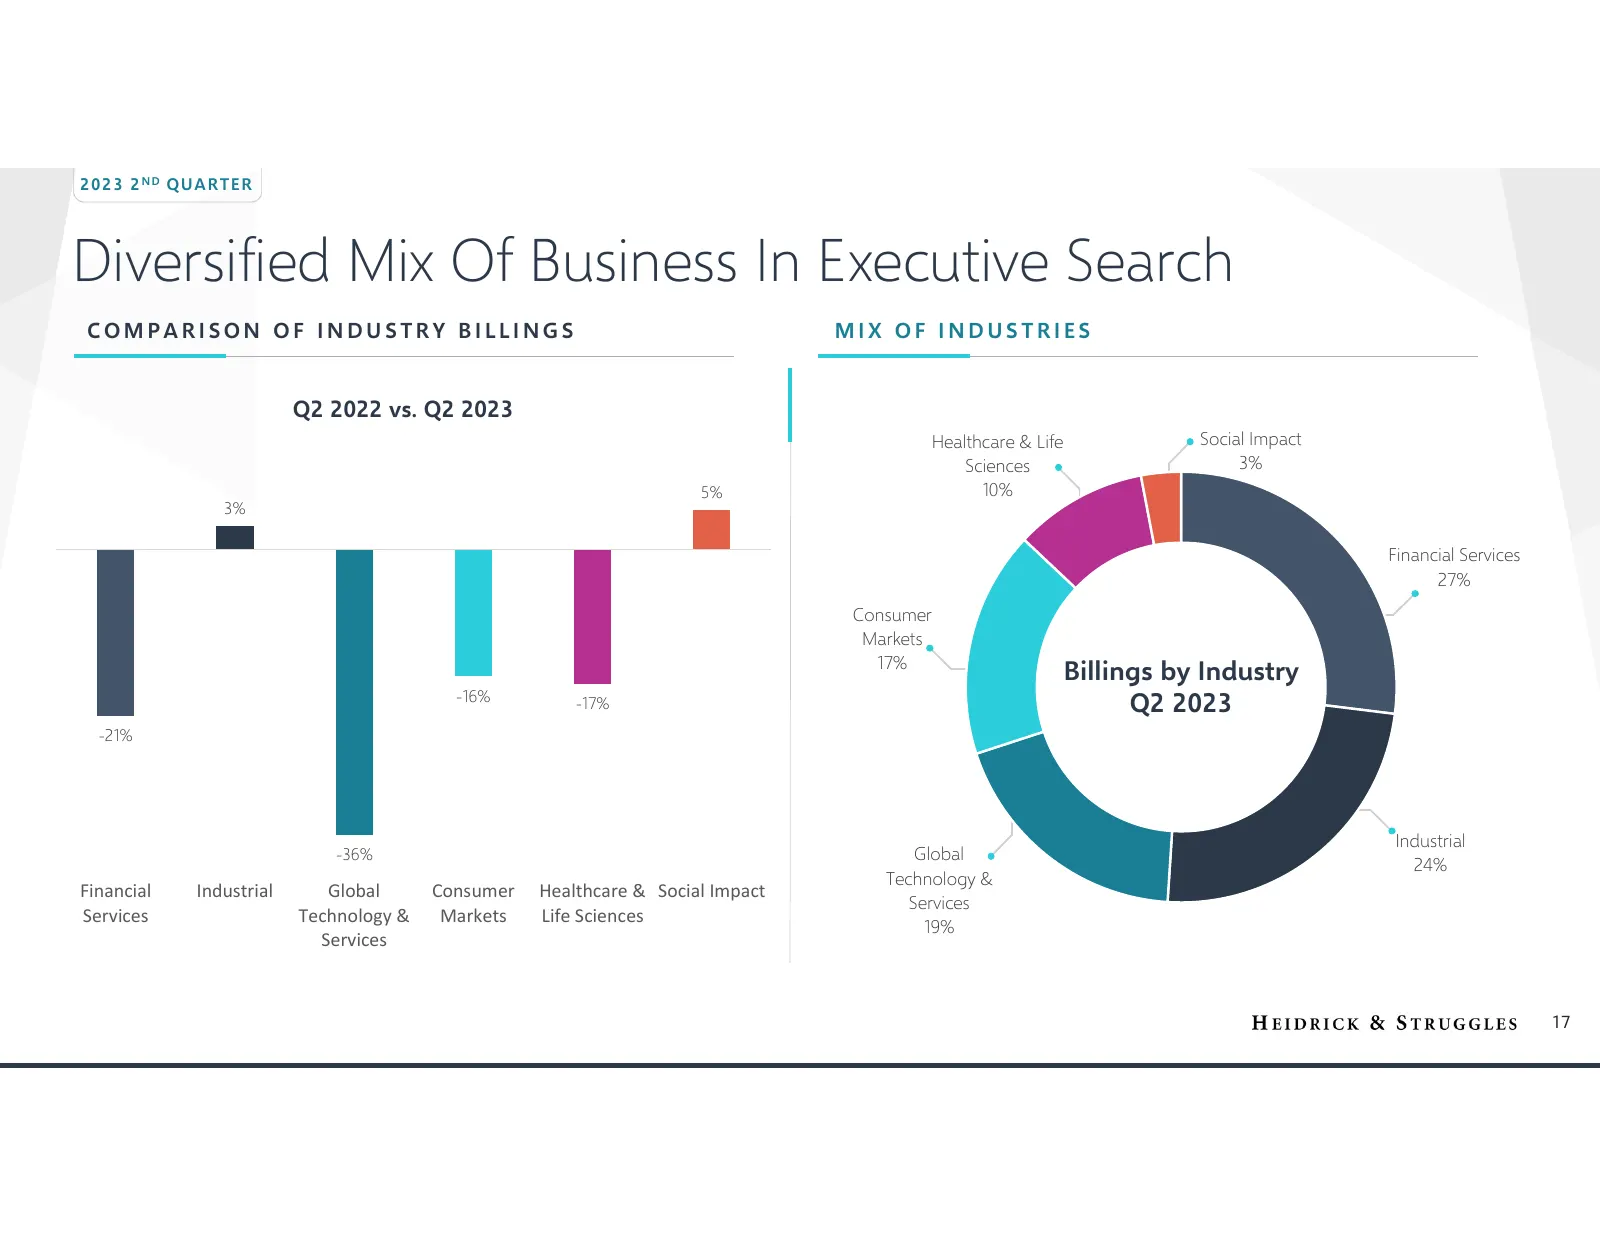
2 02 3 2 N D QU AR TE R Diversified Mix Of Business In Executive Search COMPARISON OF INDUSTRY BILLINGS MIX OF INDUSTRIES Q2 2022 vs. Q2 2023 Healthcare & Life Social Impact Sciences 3% 5% 10% 3% Financial Services 27% Consumer Markets 17% Billings by Industry -16% -17% Q2 2023 -21% Industrial -36%
Slide 18: Executive Search Financial Highlights
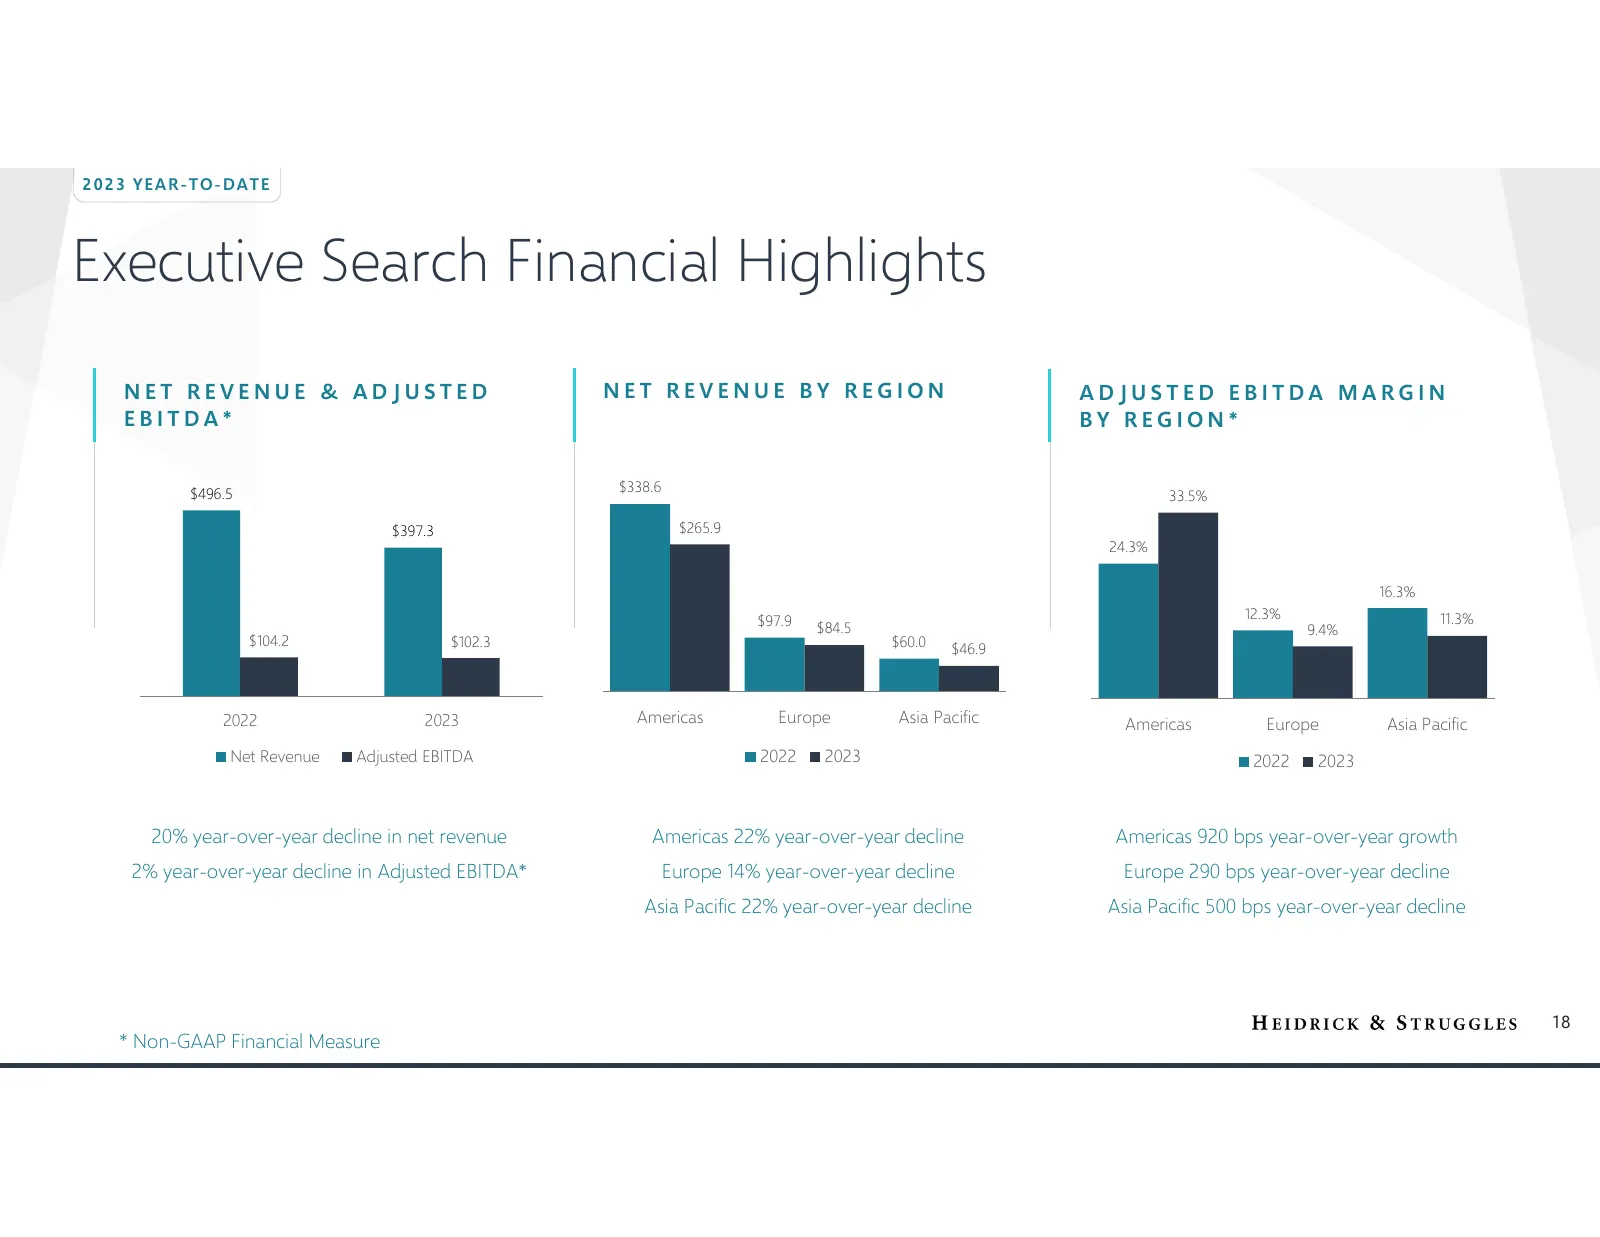
2 02 3 Y EA R- T O- D AT E Executive Search Financial Highlights NET REVENUE & ADJUSTED NET REVENUE BY REGION ADJUSTED EBITDA MARGIN EBITDA* BY REGION* $496.5 $338.6 33.5% $397.3 $265.9 24.3% 16.3% $97.9 12.3% 11.3% $84.5 9.4% $104.2 $102.3 $60.0 $46.9 2022 2023 Americas Europe Asia Pacific Americas
Slide 19: Executive Search Operational Highlights
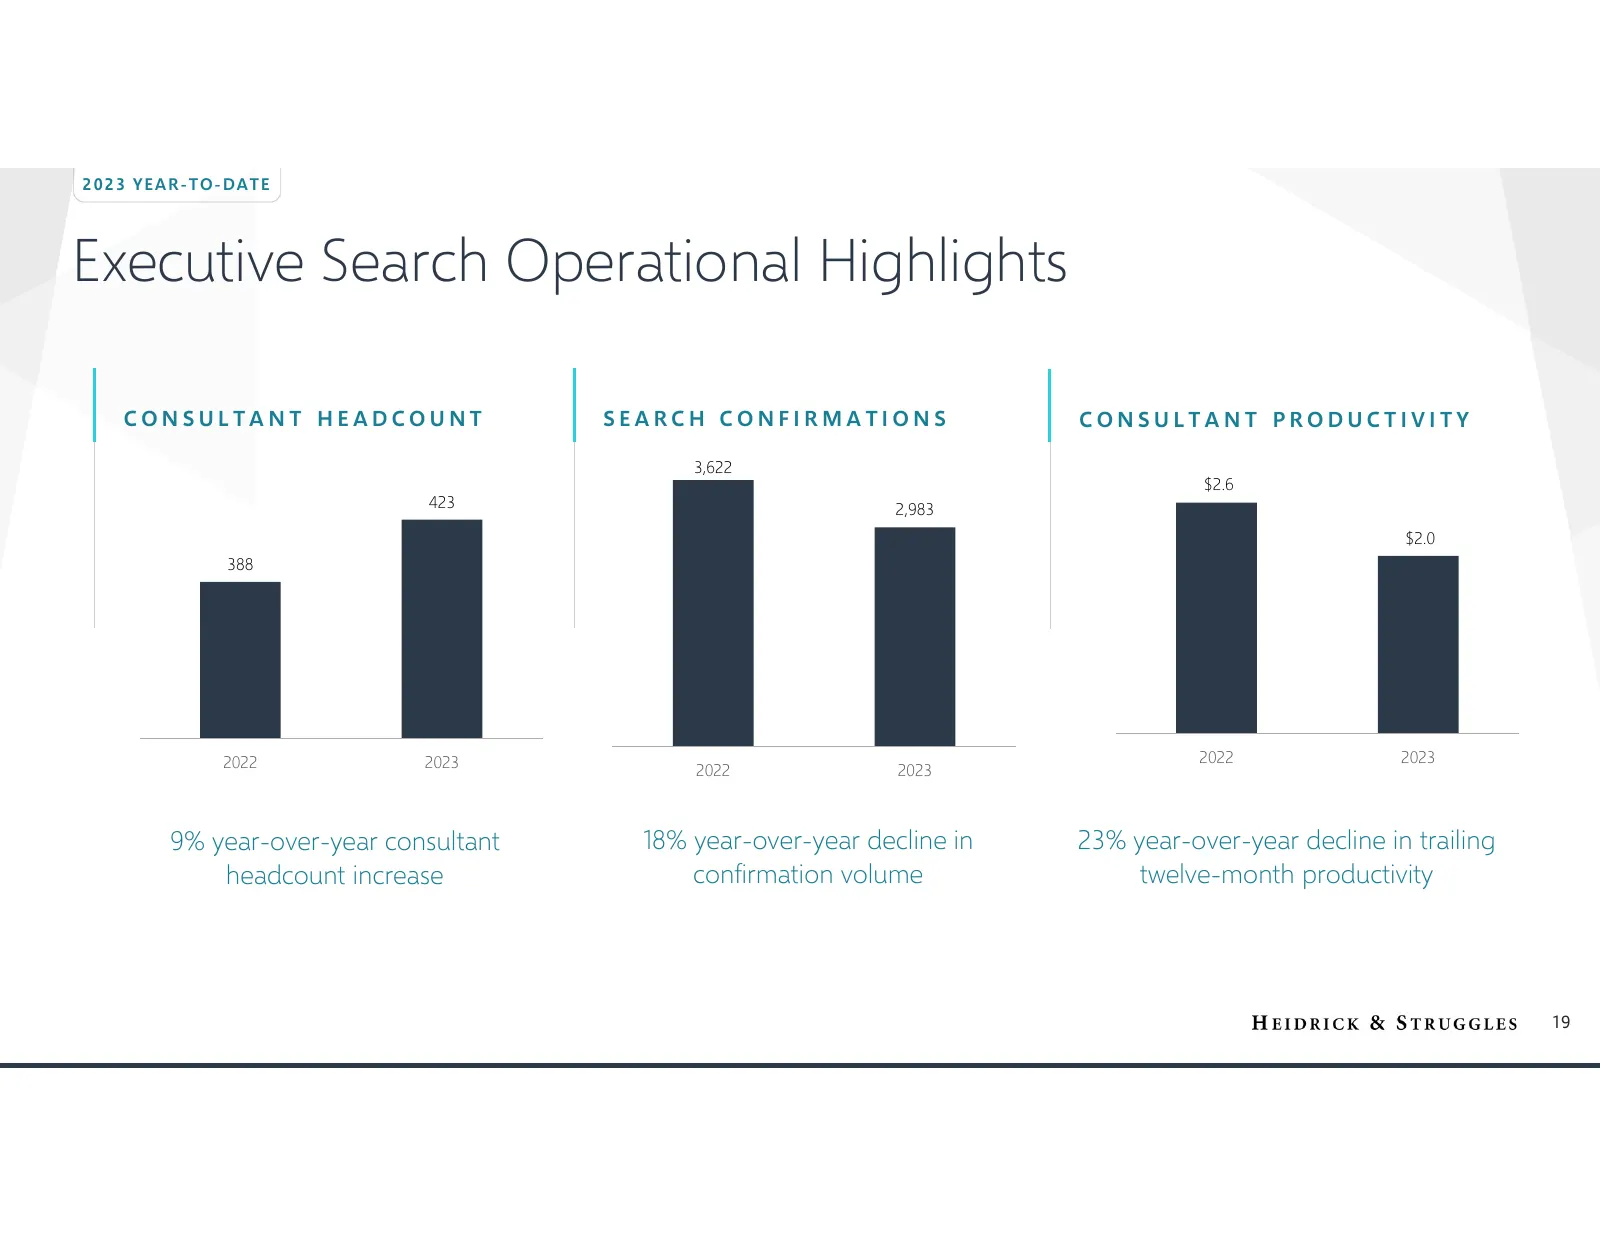
2 02 3 Y EA R- T O- D AT E Executive Search Operational Highlights CONSULTANT HEADCOUNT SEARCH CONFIRMATIONS CONSULTANT PRODUCTIVITY 3,622 $2.6 423 2,983 $2.0 388 2022 2023 2022 2023 2022 2023 9% year-over-year consultant 18% year-over-year decline in 23% year-over-year decline in trailing headcount
Slide 20: Diversified Mix Of Business In Executive Search
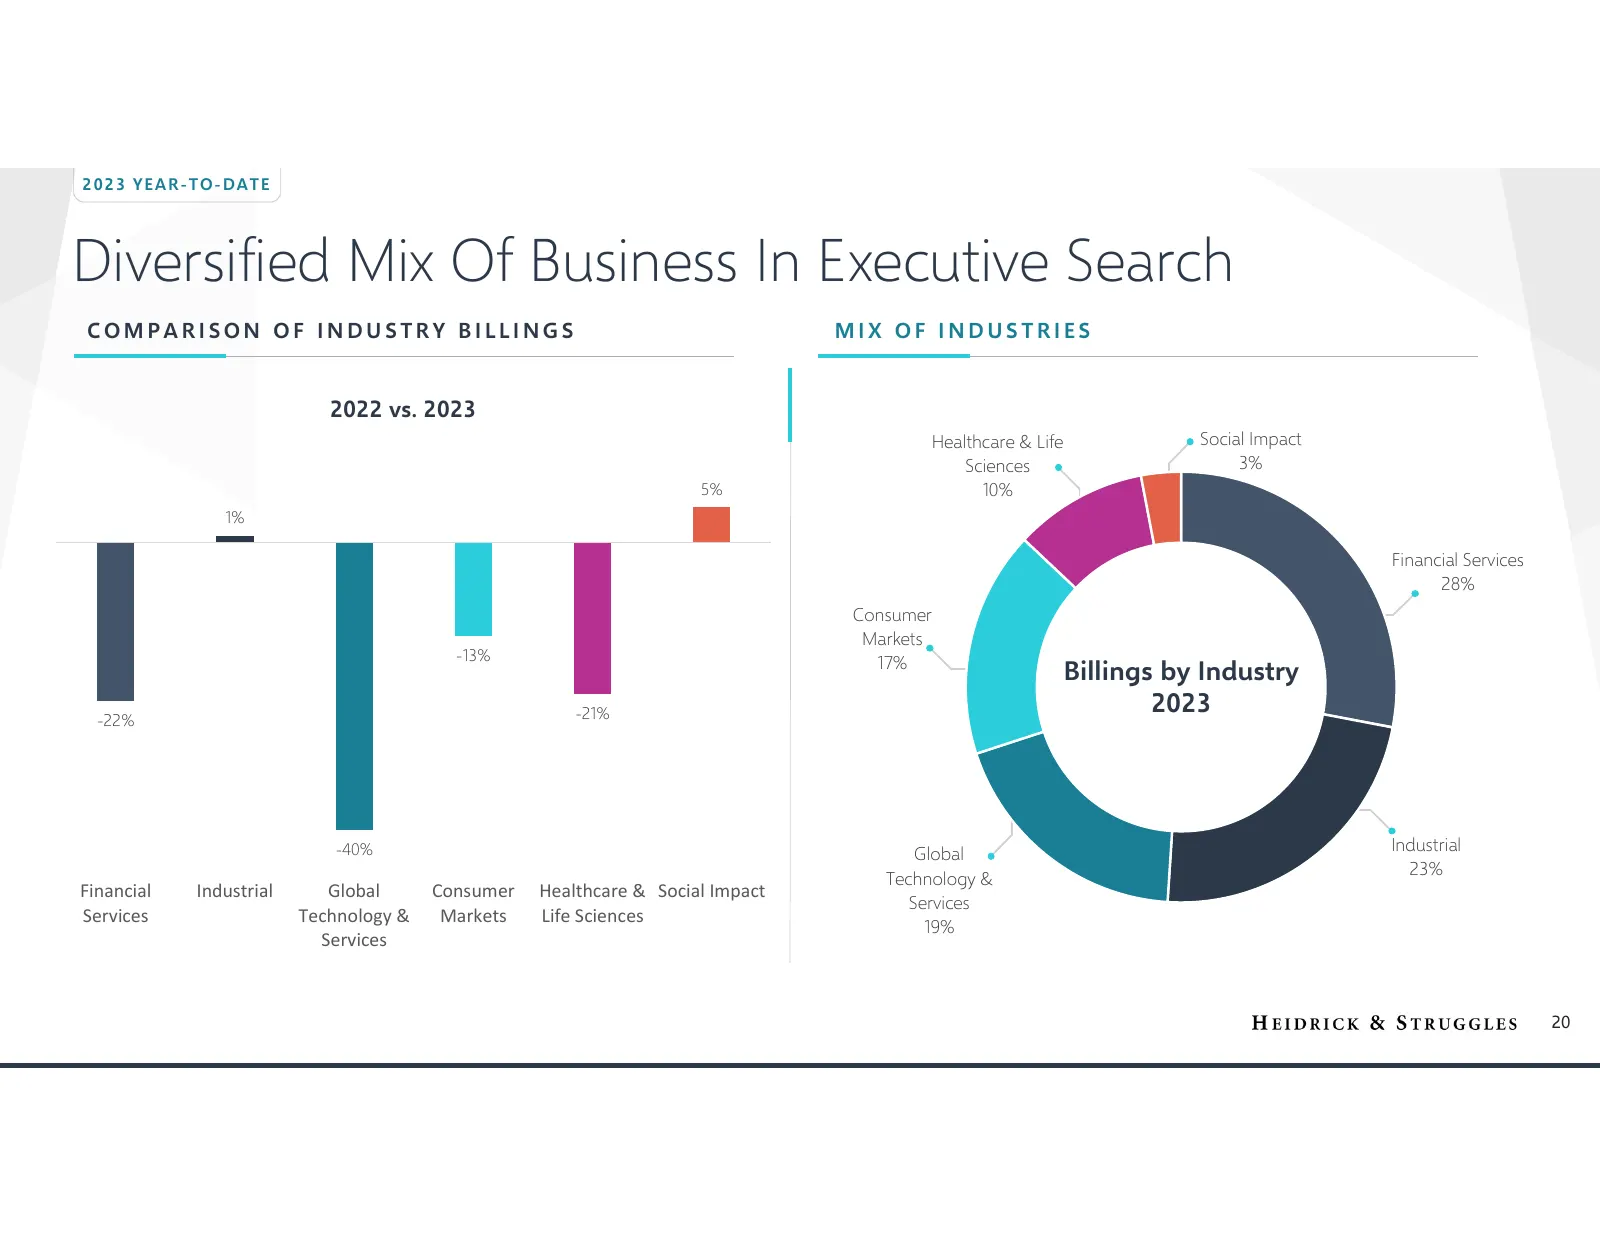
2 02 3 Y EA R- T O- D AT E Diversified Mix Of Business In Executive Search COMPARISON OF INDUSTRY BILLINGS MIX OF INDUSTRIES 2022 vs. 2023 Healthcare & Life Social Impact Sciences 3% 5% 10% 1% Financial Services 28% Consumer Markets -13% 17% Billings by Industry -21% 2023 -22% -40% Industrial Global
Slide 21: On-Demand Talent Results
On-Demand Talent Results
Slide 22: On-Demand Talent Financial Highlights
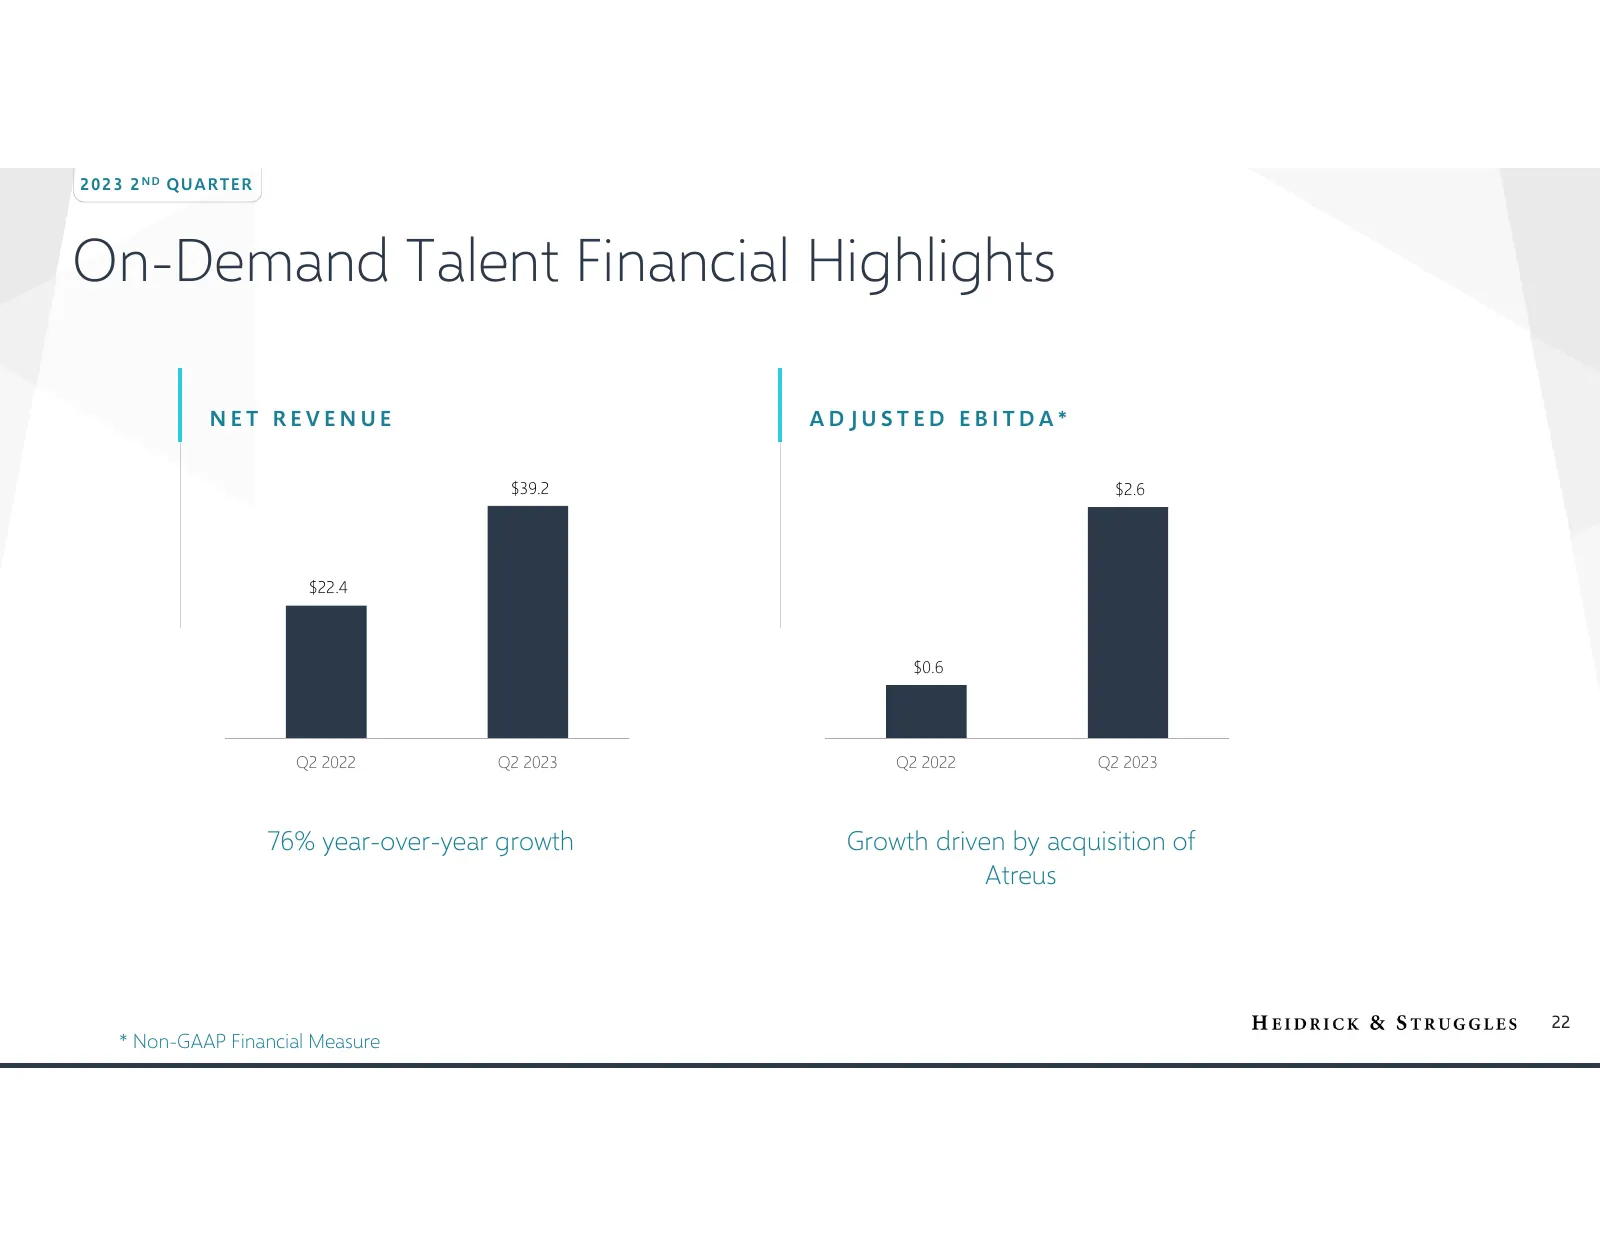
2 02 3 2 N D QU AR TE R On-Demand Talent Financial Highlights NET REVENUE ADJUSTED EBITDA* $39.2 $2.6 $22.4 $0.6 Q2 2022 Q2 2023 Q2 2022 Q2 2023 76% year-over-year growth Growth driven by acquisition of Atreus 22 * Non-GAAP Financial Measure
Slide 23: On-Demand Talent Financial Highlights
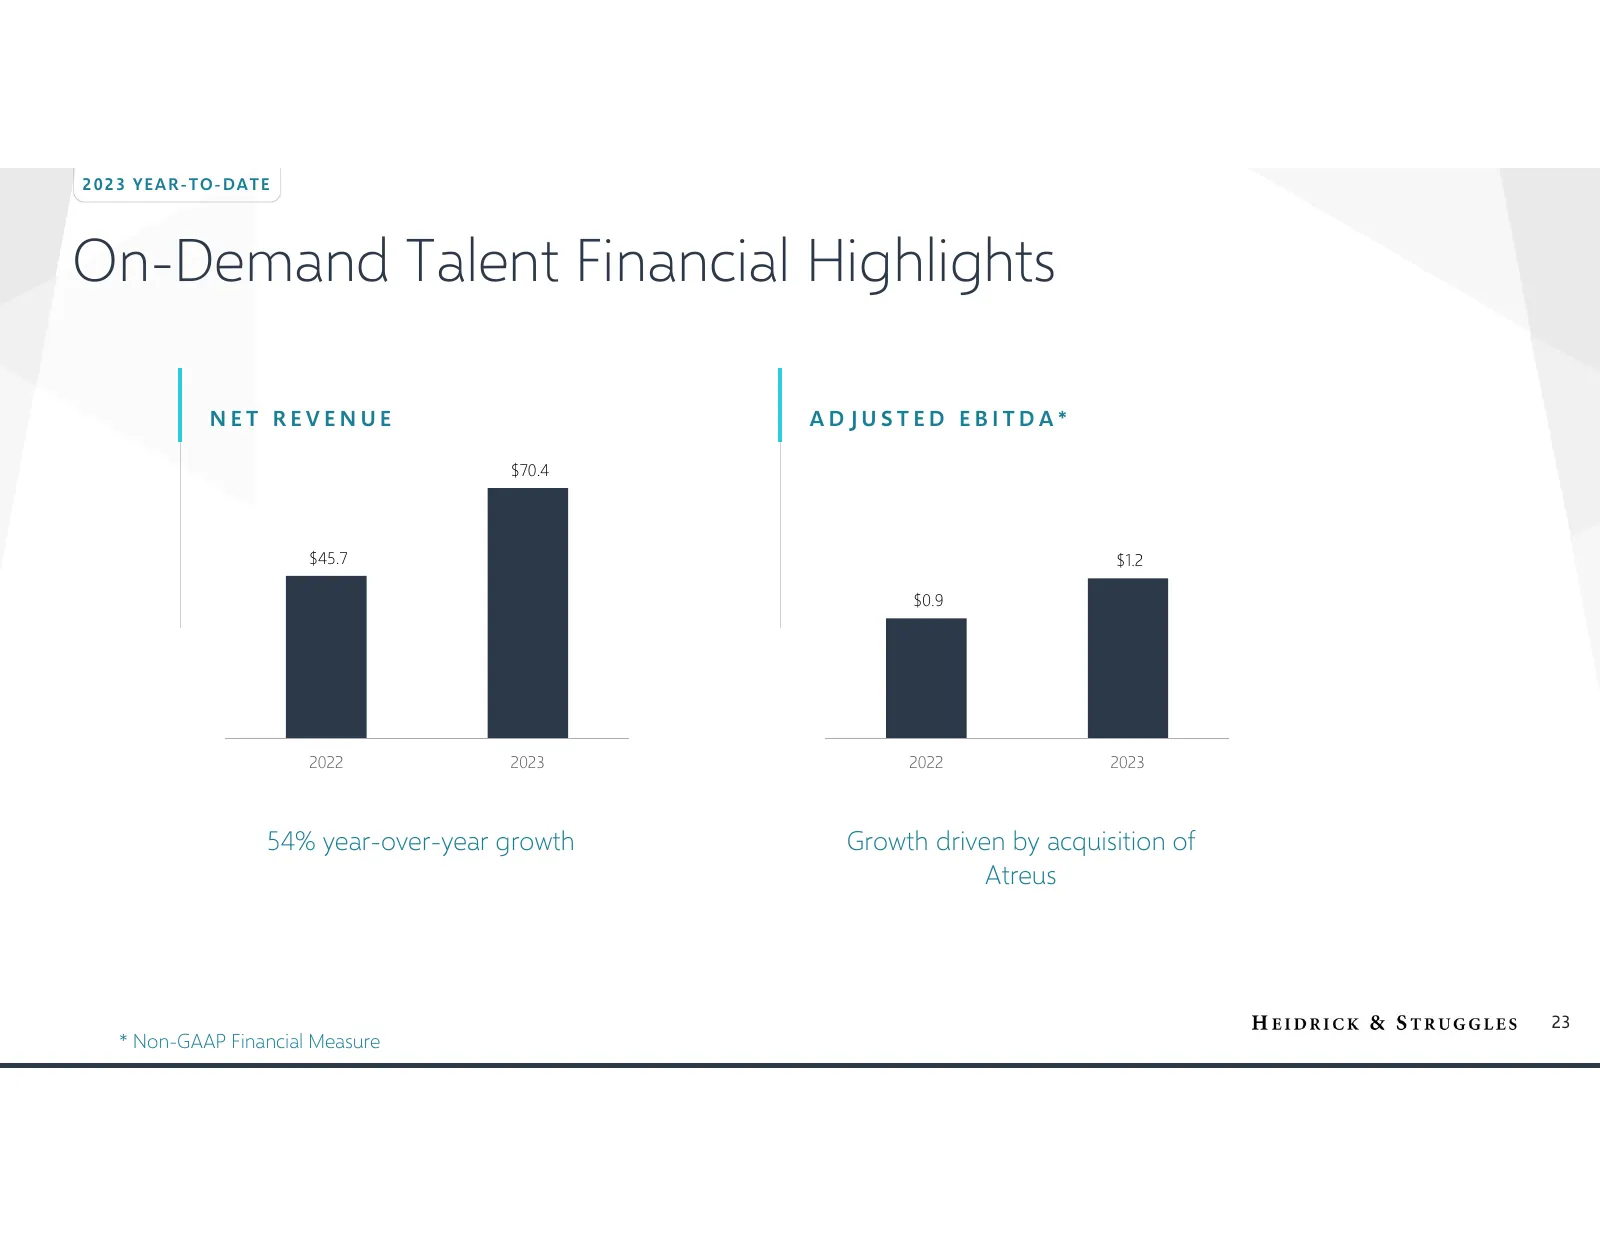
2 02 3 Y EA R- T O- D AT E On-Demand Talent Financial Highlights NET REVENUE ADJUSTED EBITDA* $70.4 $45.7 $1.2 $0.9 2022 2023 2022 2023 54% year-over-year growth Growth driven by acquisition of Atreus 23 * Non-GAAP Financial Measure
Slide 24: Heidrick Consulting Results
Heidrick Consulting Results
Slide 25: Heidrick Consulting Financial Highlights
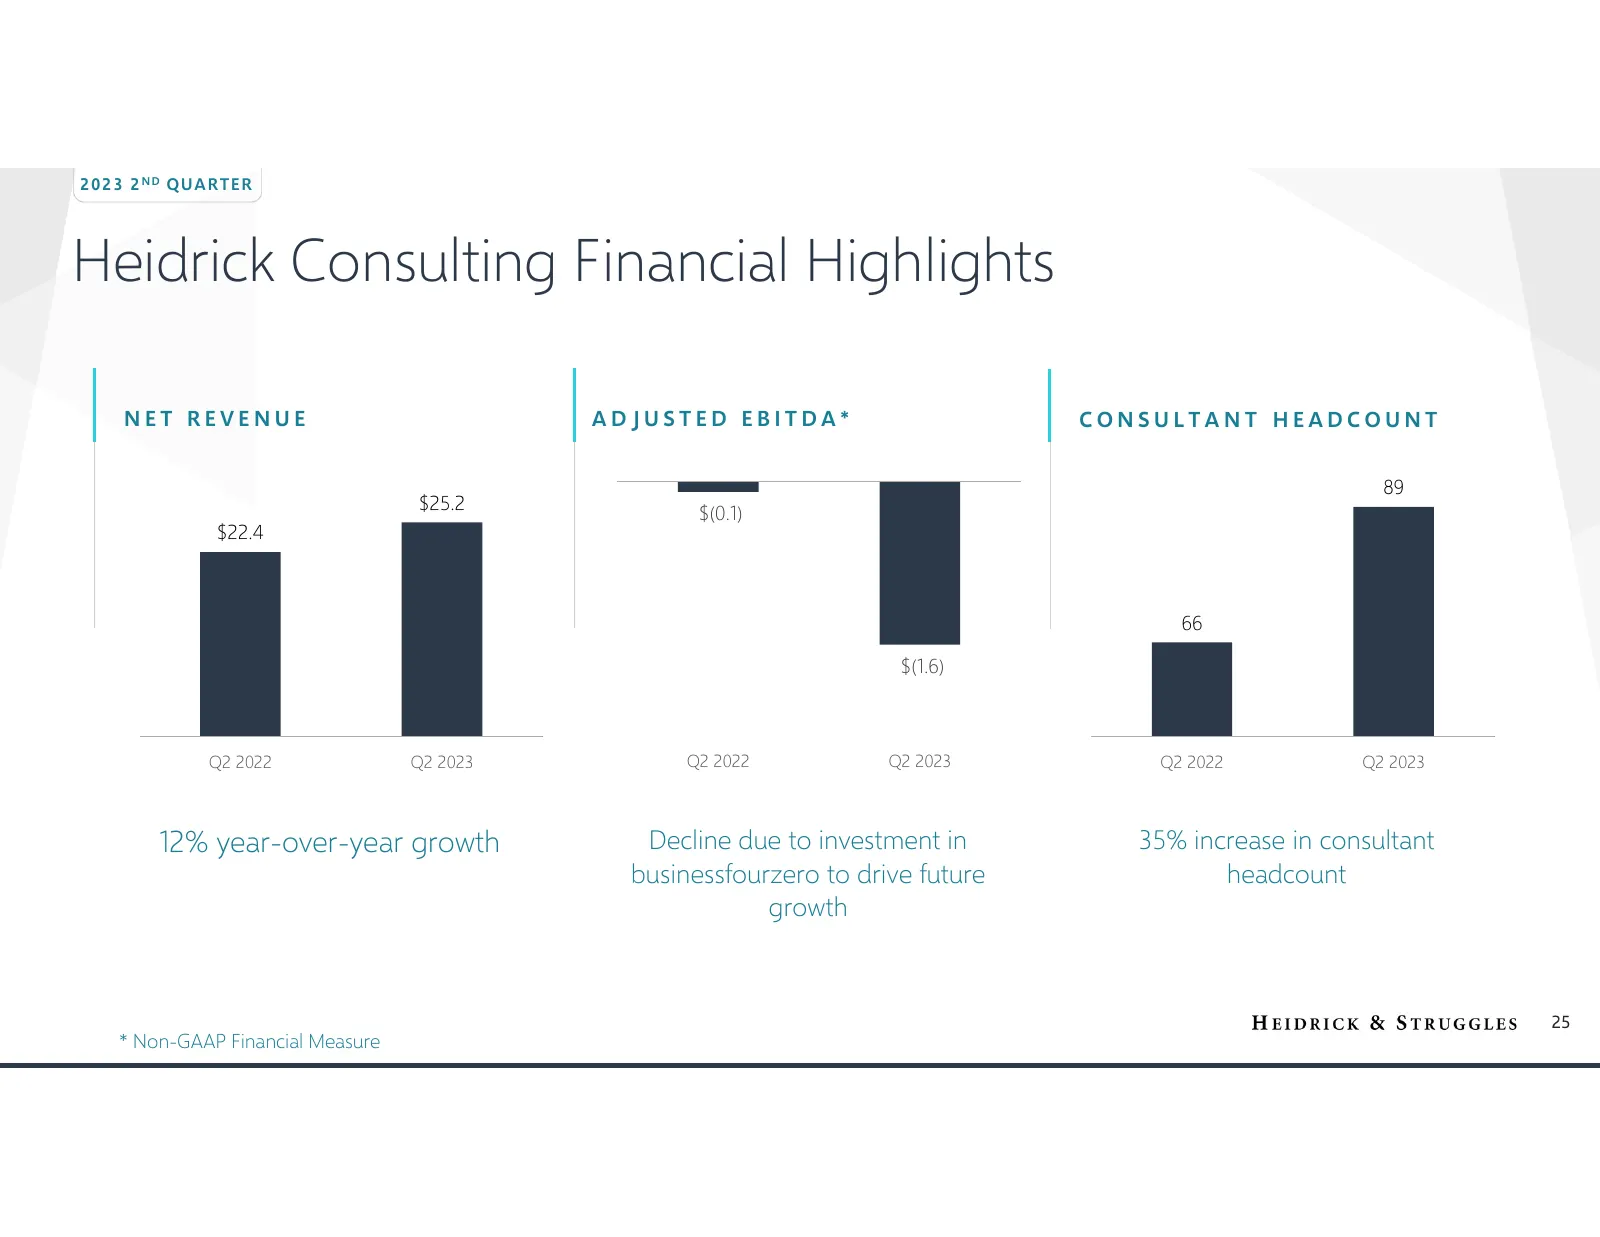
2 02 3 2 N D QU AR TE R Heidrick Consulting Financial Highlights NET REVENUE ADJUSTED EBITDA* CONSULTANT HEADCOUNT 89 $25.2 $(0.1) $22.4 66 $(1.6) Q2 2022 Q2 2023 Q2 2022 Q2 2023 Q2 2022 Q2 2023 12% year-over-year growth Decline due to investment in 35% increase in consultant businessfourzero to dri
Slide 26: Heidrick Consulting Financial Highlights
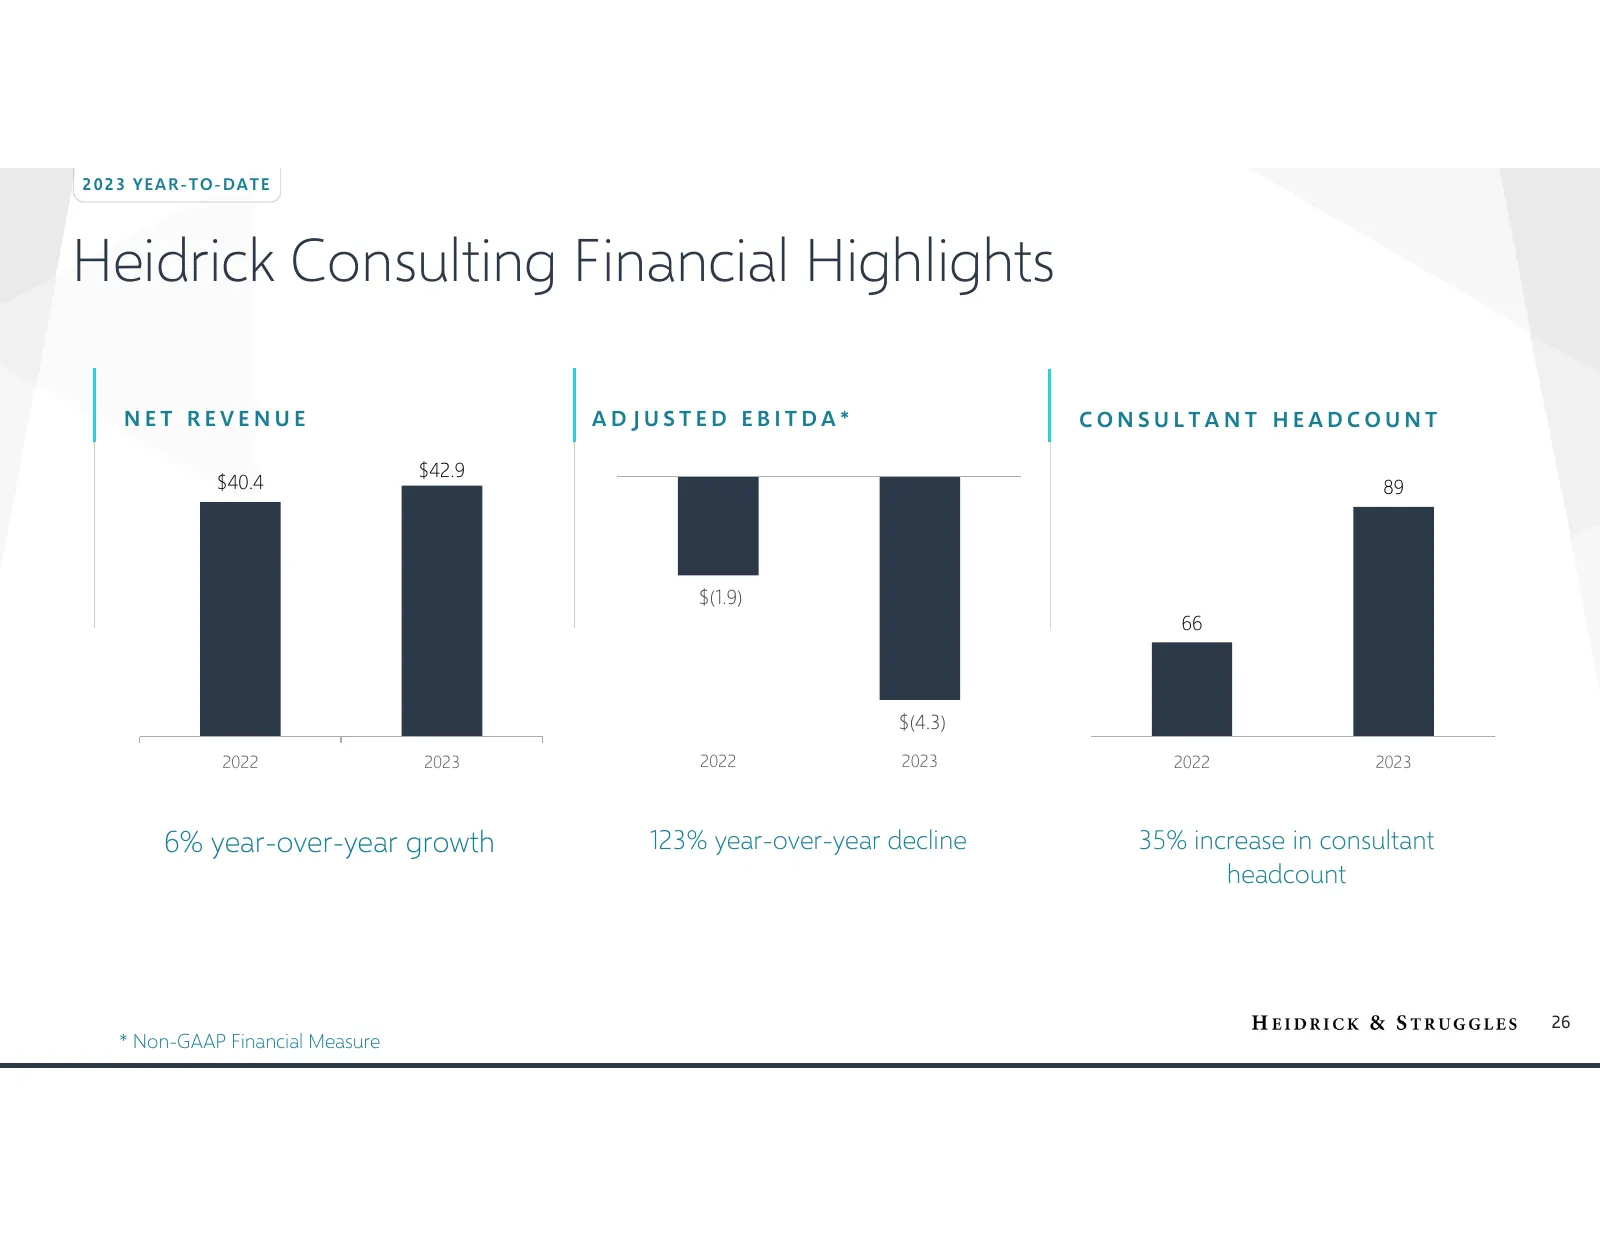
2 02 3 Y EA R- T O- D AT E Heidrick Consulting Financial Highlights NET REVENUE ADJUSTED EBITDA* CONSULTANT HEADCOUNT $42.9 $40.4 89 $(1.9) 66 $(4.3) 2022 2023 2022 2023 2022 2023 6% year-over-year growth 123% year-over-year decline 35% increase in consultant headcount 26 * Non-GAAP Financial Measur

Slide 27: Balance Sheet & Liquidity
Balance Sheet & Liquidity
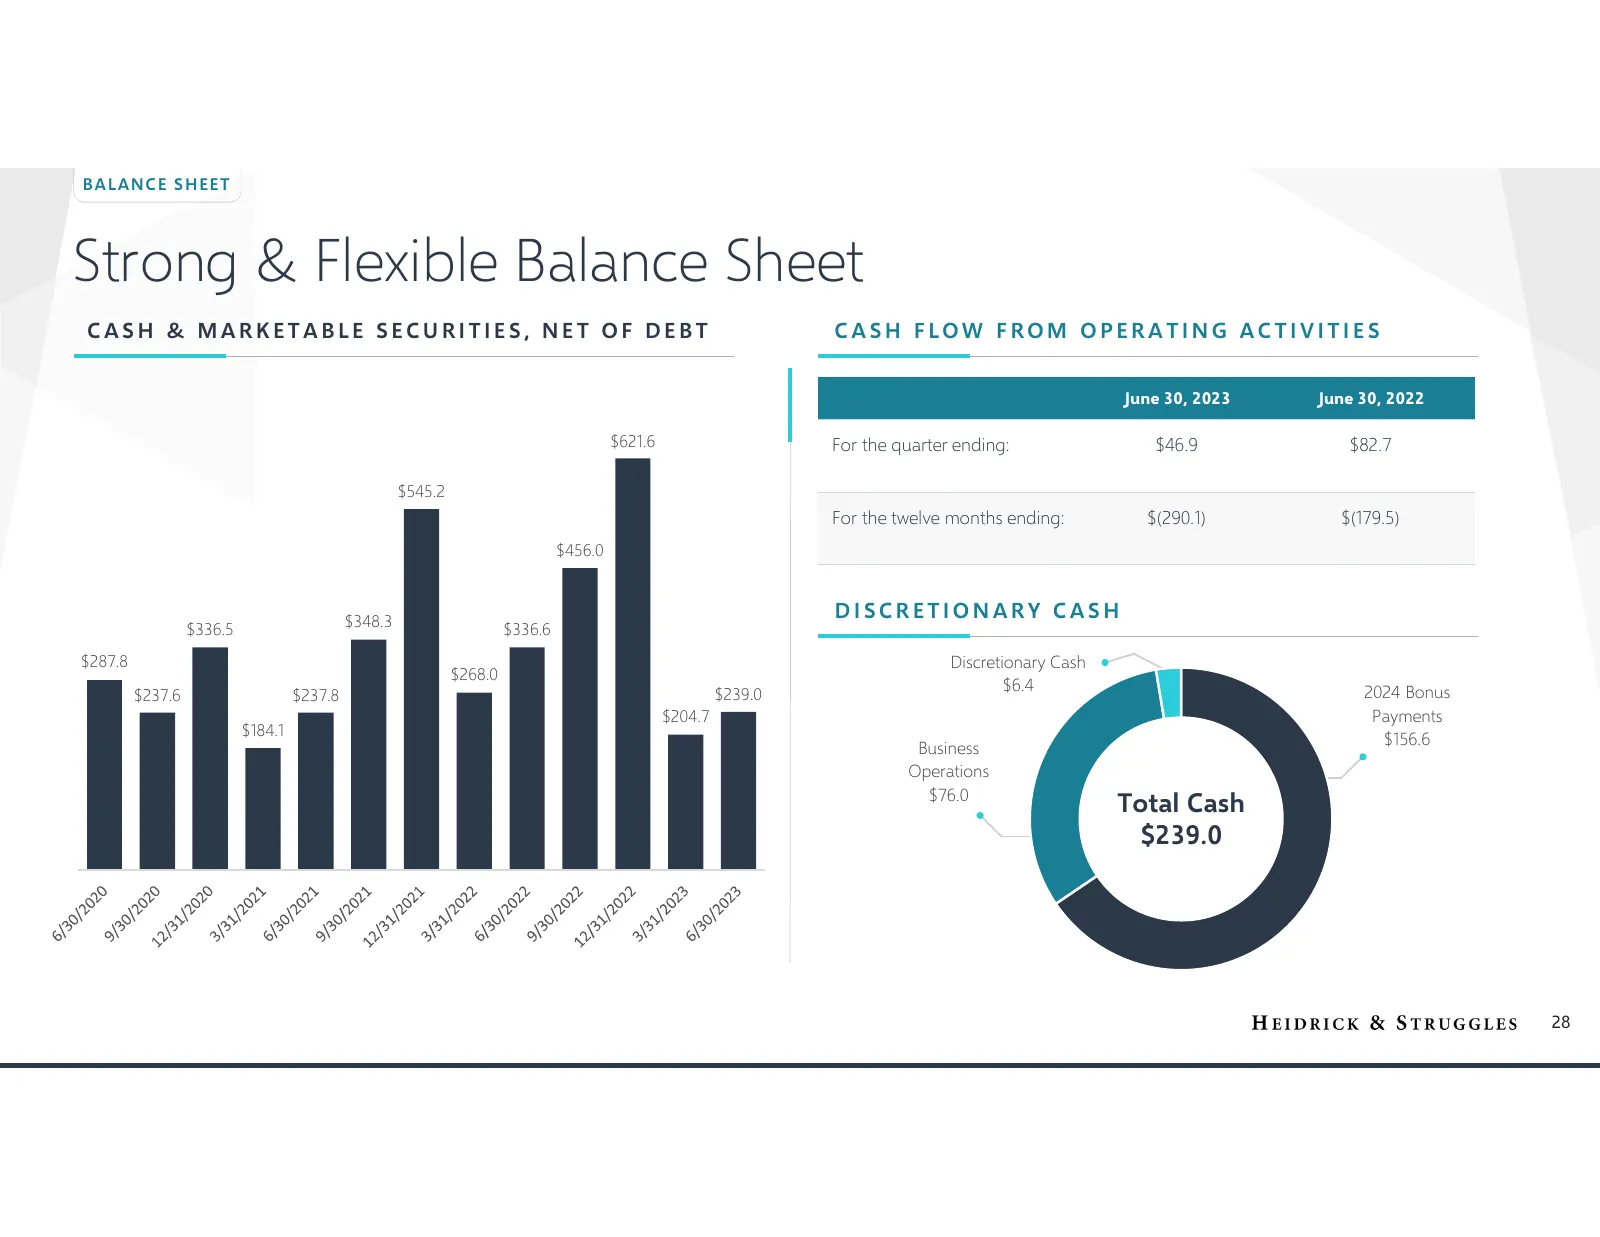
Slide 28: Strong & Flexible Balance Sheet
B A LAN CE S H EE T Strong & Flexible Balance Sheet CASH & MARKETABLE SECURITIES, NET OF DEBT CASH FLOW FROM OPERATING ACTIVITIES June 30, 2023 June 30, 2022 $621.6 For the quarter ending: $46.9 $82.7 $545.2 For the twelve months ending: $(290.1) $(179.5) $456.0 $348.3 DISCRETIONARY CASH $336.5 $336
Slide 29: Strategy & Growth Initiatives
Strategy & Growth Initiatives
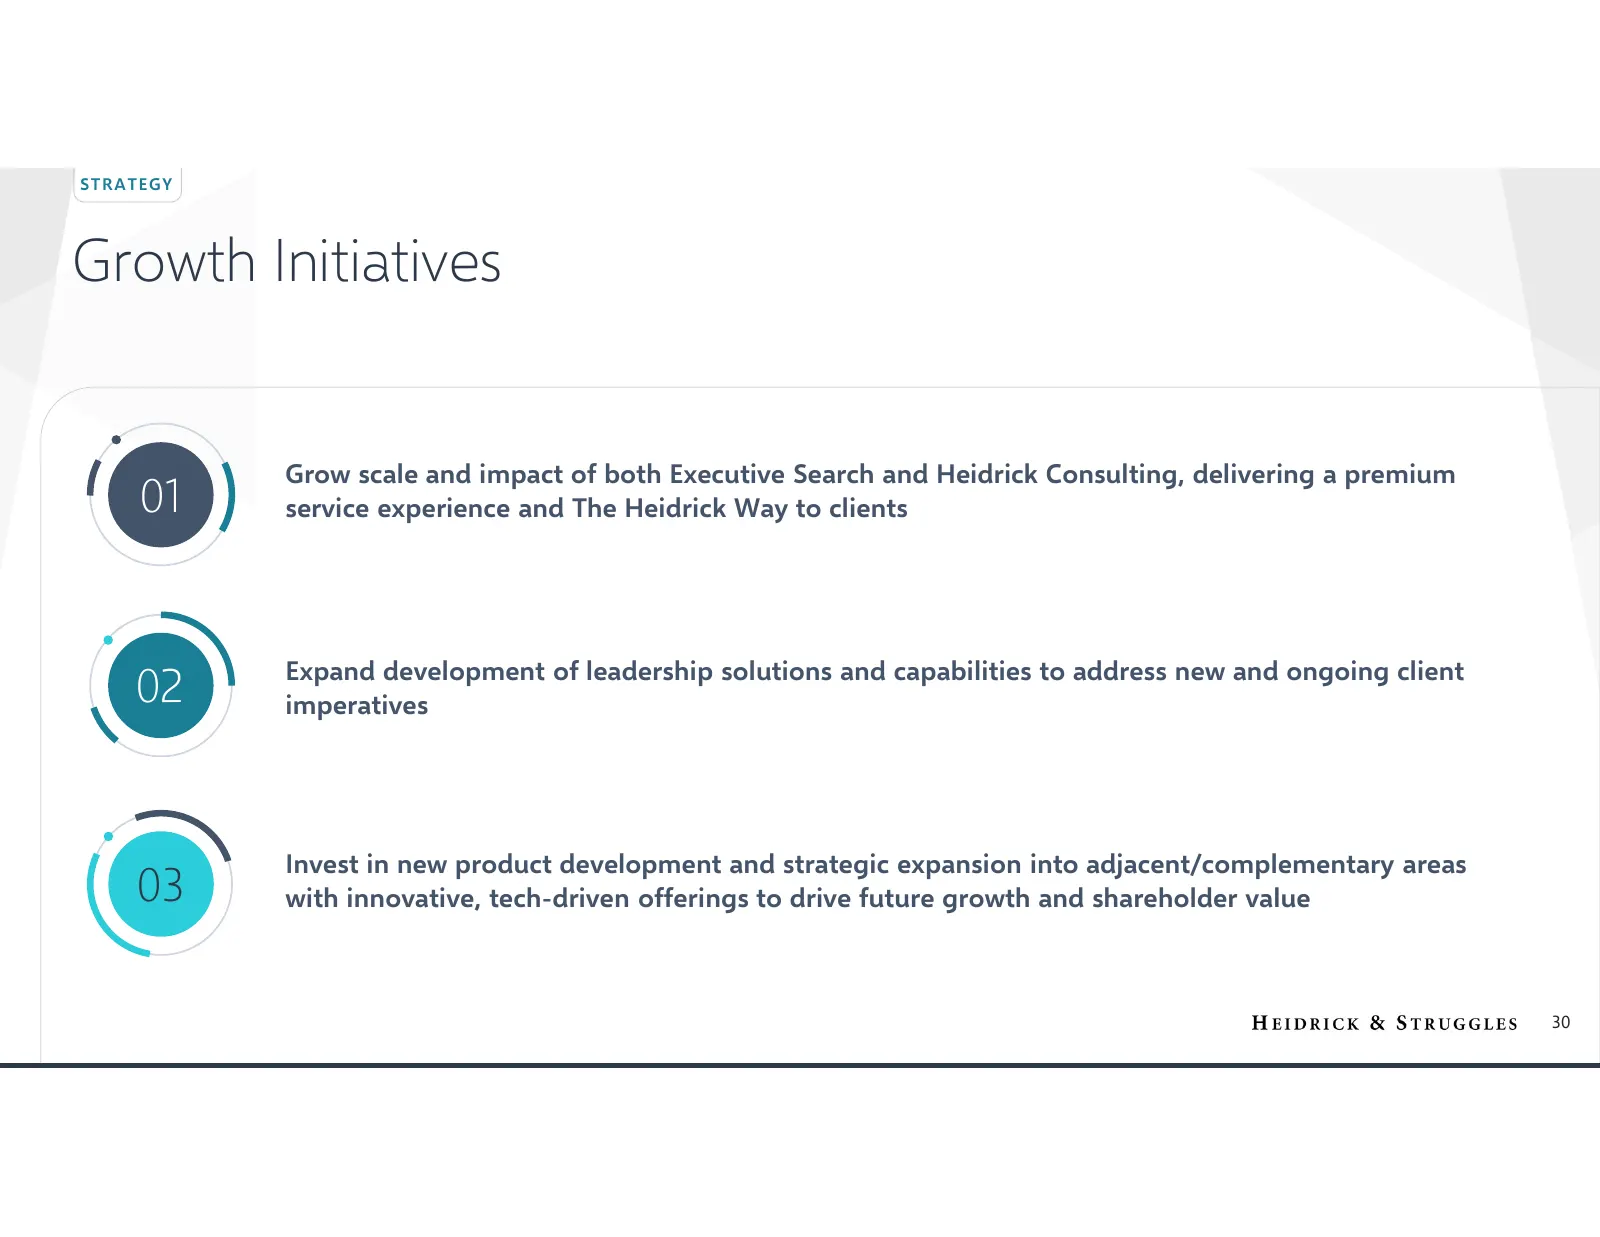
Slide 30: Growth Initiatives
ST R AT EGY Growth Initiatives Grow scale and impact of both Executive Search and Heidrick Consulting, delivering a premium 01 service experience and The Heidrick Way to clients Expand development of leadership solutions and capabilities to address new and ongoing client 02 imperatives Invest in new
Slide 31: Appendix
Appendix Reconciliation of GAAP to Non-GAAP Financial Measures
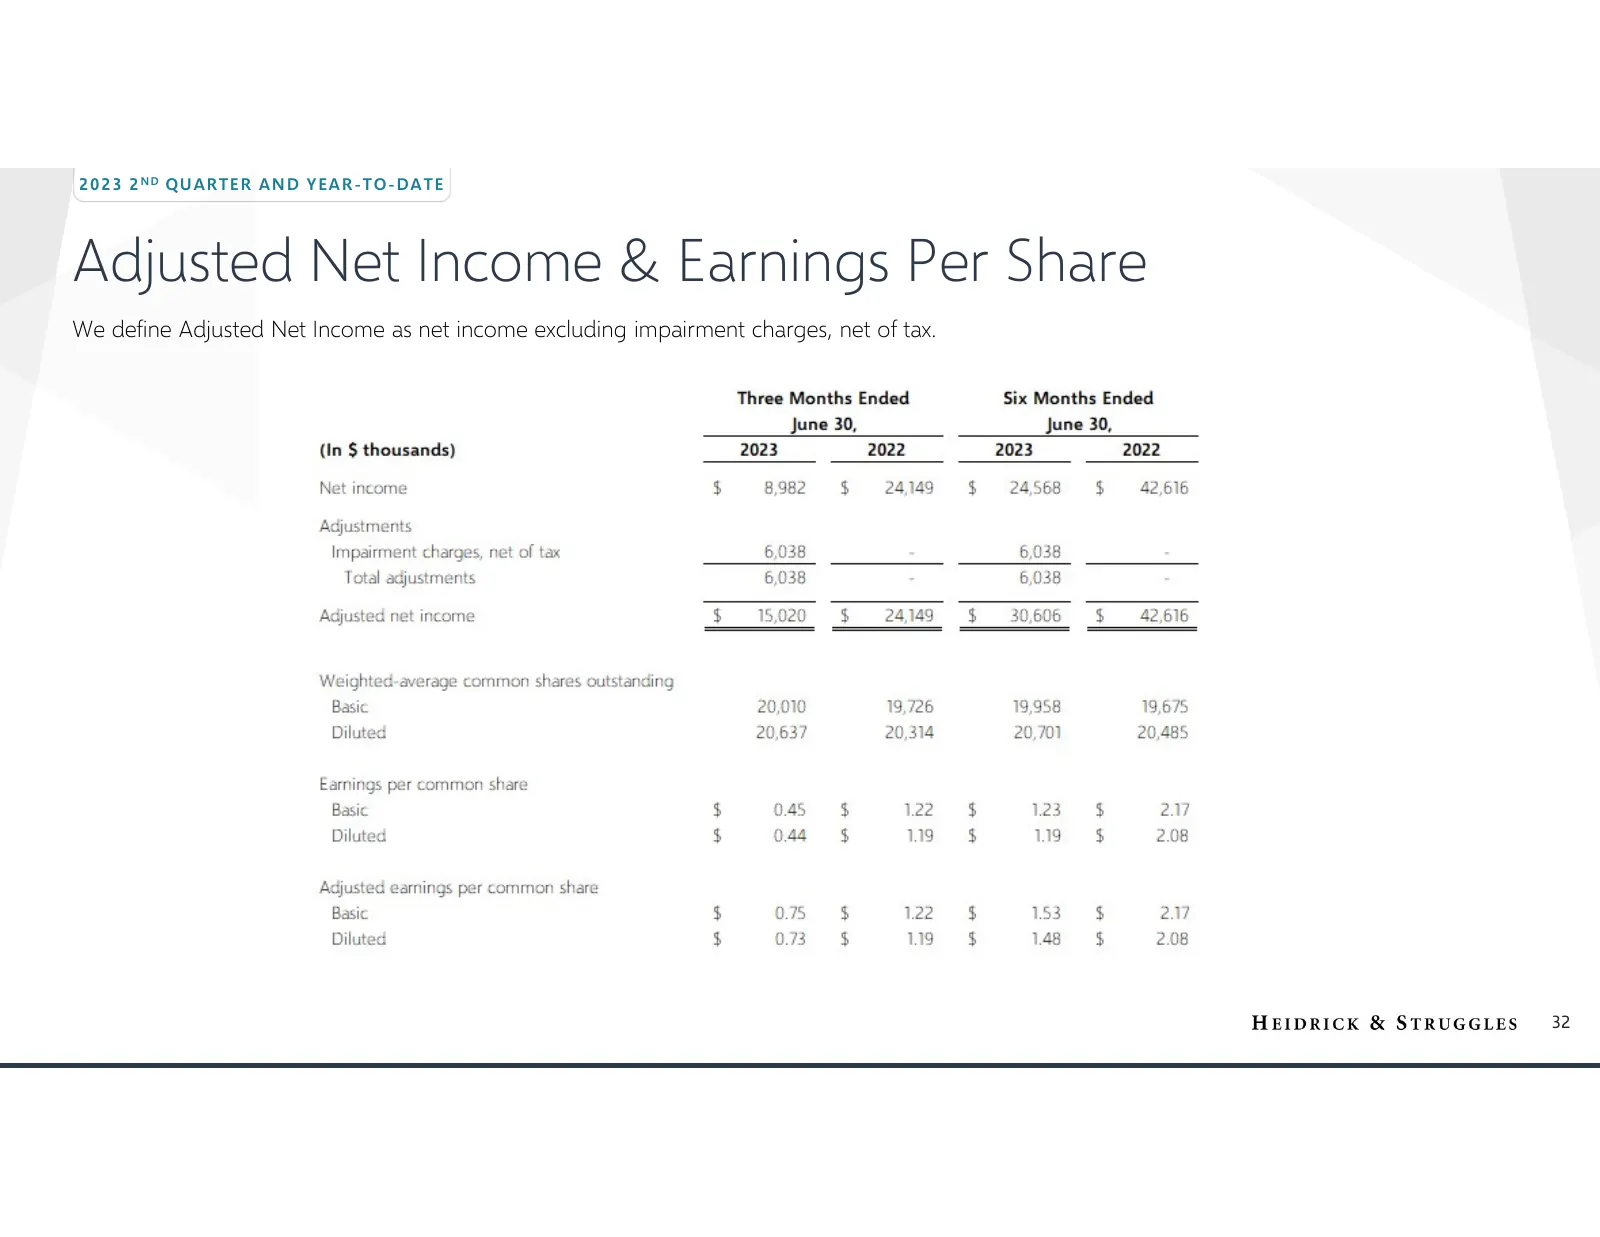
Slide 32: Adjusted Net Income & Earnings Per Share
2 02 3 2 N D QU AR TE R AN D Y EA R -T O- D AT E Adjusted Net Income & Earnings Per Share We define Adjusted Net Income as net income excluding impairment charges, net of tax. 32
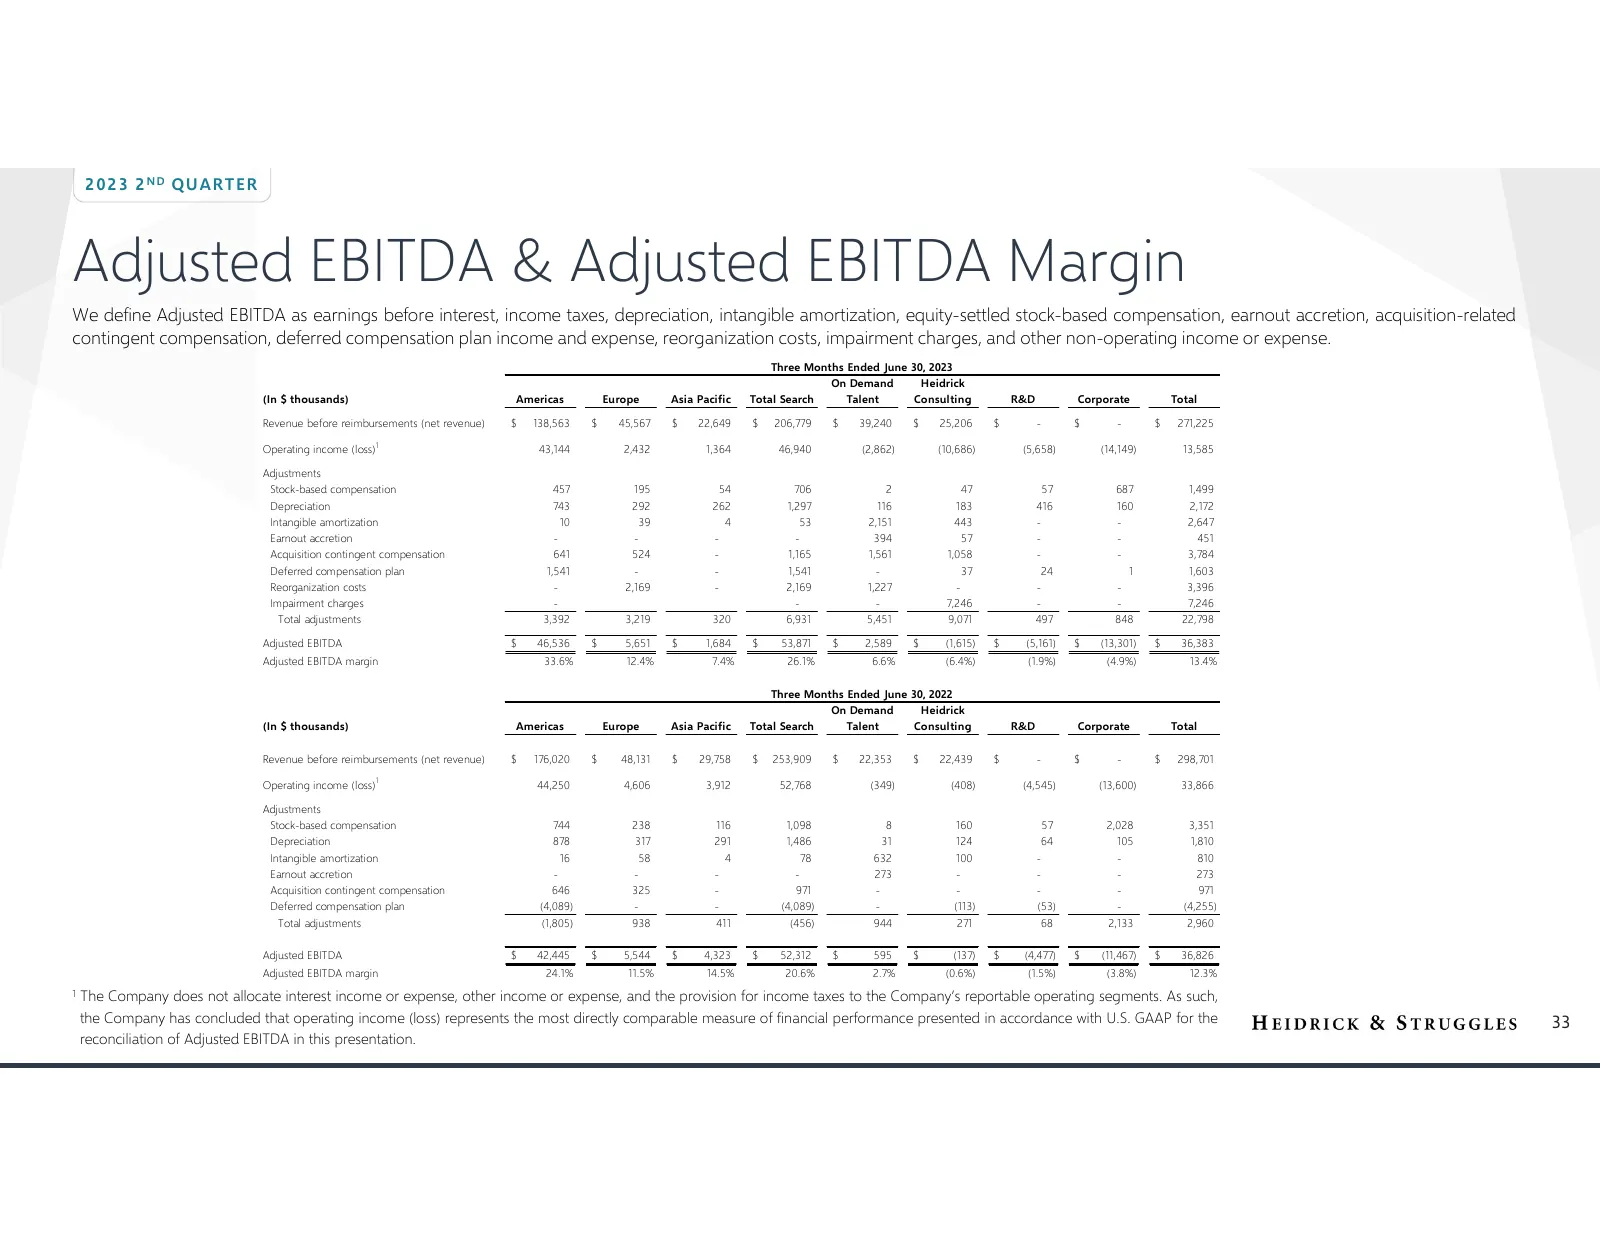
Slide 33: Adjusted EBITDA & Adjusted EBITDA Margin
2 02 3 2 N D QU AR TE R Adjusted EBITDA & Adjusted EBITDA Margin We define Adjusted EBITDA as earnings before interest, income taxes, depreciation, intangible amortization, equity-settled stock-based compensation, earnout accretion, acquisition-related contingent compensation, deferred compensation
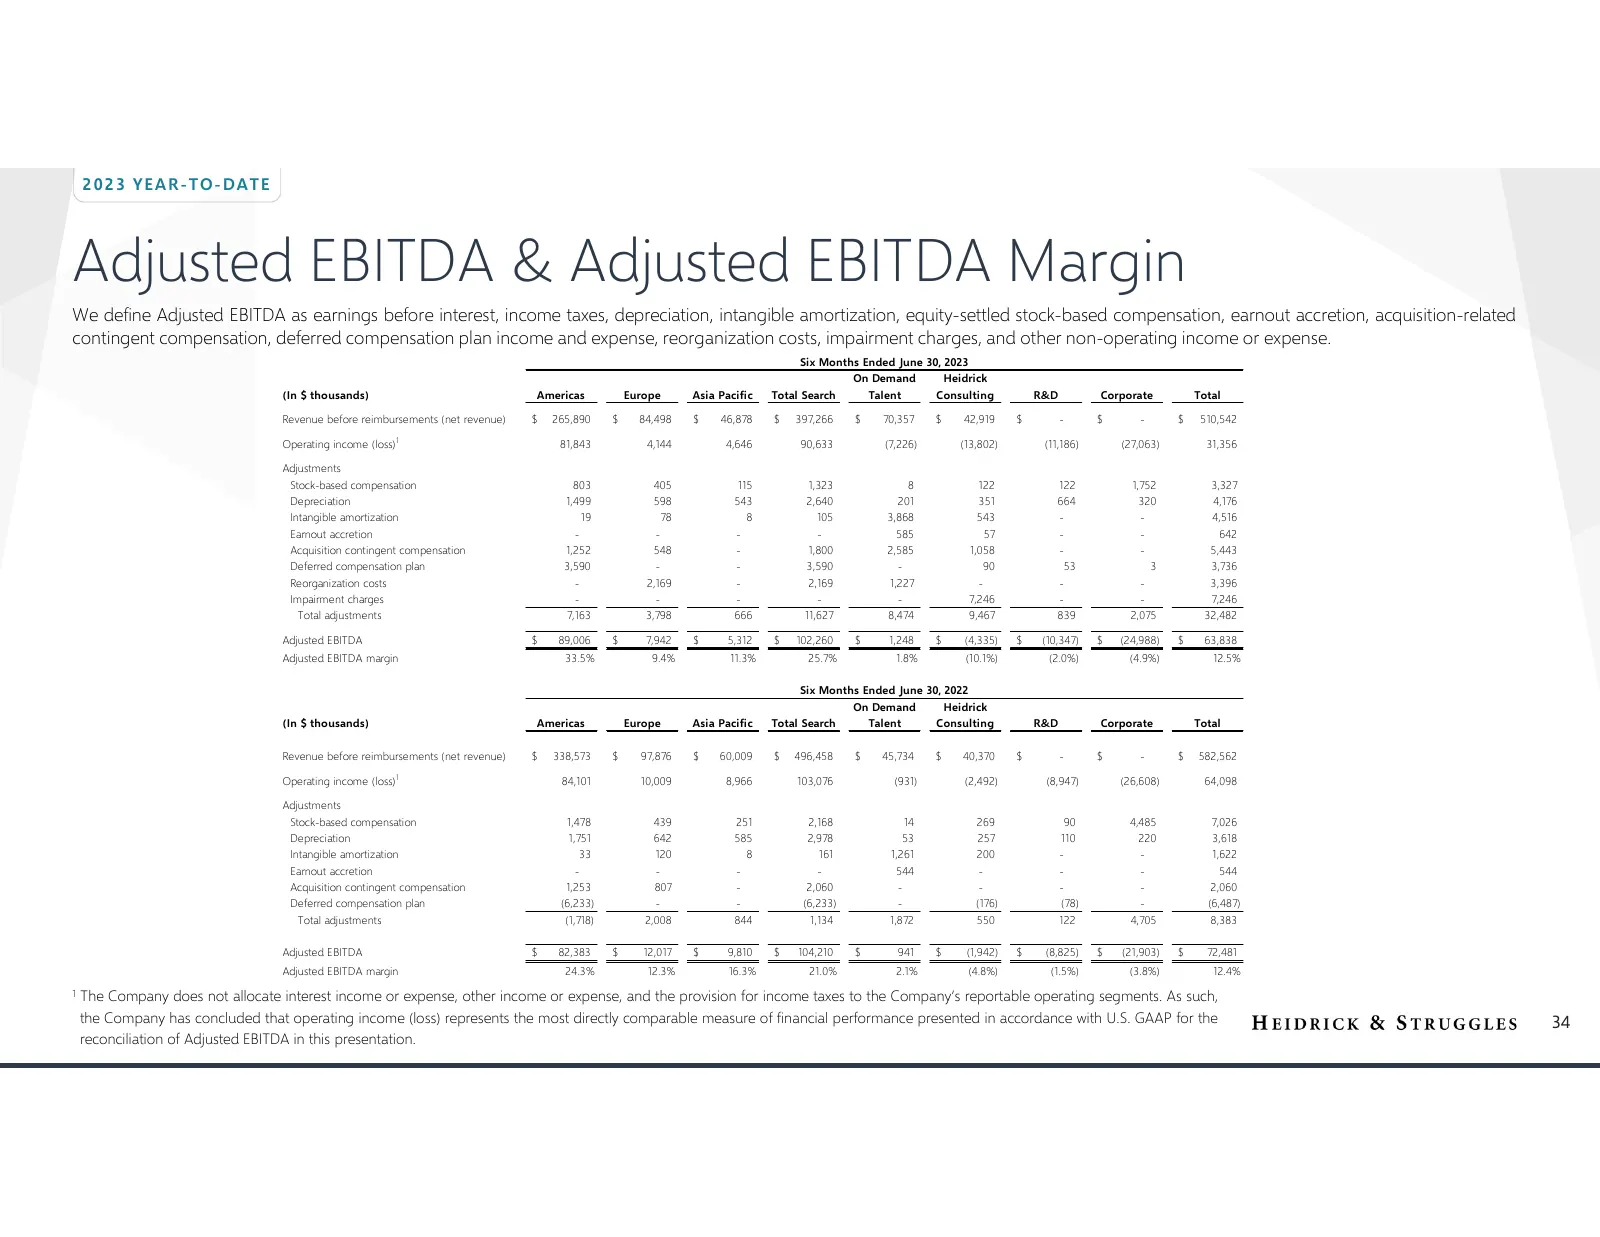
Slide 34: Adjusted EBITDA & Adjusted EBITDA Margin
2 02 3 Y EA R- T O- D AT E Adjusted EBITDA & Adjusted EBITDA Margin We define Adjusted EBITDA as earnings before interest, income taxes, depreciation, intangible amortization, equity-settled stock-based compensation, earnout accretion, acquisition-related contingent compensation, deferred compensati

Slide 35: Suzanne Rosenberg, Vice President - Investor Relations
Suzanne Rosenberg, Vice President - Investor Relations srosenberg@heidrick.com 212.551.0554
Source: EarningsCall slides
More decks from Heidrick & Struggles International
 Q1 2025 Earnings Presentation20 slides · May 5, 2025
 Q4 2024 Earnings Presentation26 slides · Mar 3, 2025
 Investor Day (December 2024)68 slides · Dec 3, 2024
 Q3 2024 Earnings Presentation24 slides · Nov 4, 2024
 Q2 2024 Earnings Presentation25 slides · Jul 29, 2024
 Q1 2024 Earnings Presentation25 slides · May 6, 2024