K+s AG · XETR:SDF
K+s — K+S Aktiengesellschaft — Investor Presentation (October 2005)
45 slides from K+s's investor presentation, Oct 12, 2005
Slide 1: K+S Analysts' Day 2005
K+S Group - 12 October 2005 Experience growth. K+S Analysts‘ Day 2005 12 October 2005 K+S Group 0
Slide 2: Content
K+S Analysts‘ Day 2005 Content A. Global Trends B. Fertilizer Basics C. Efficiency Benefits of Balanced Fertilization - Nitrogen Efficiency - Resistance . Diseases . Salt Stress - Water Use Efficiency - CO2 Efficiency D. Outlook - Rising Quality Demands - Industrial Crops - Agricultural Challenges i
Slide 3: Population Growth
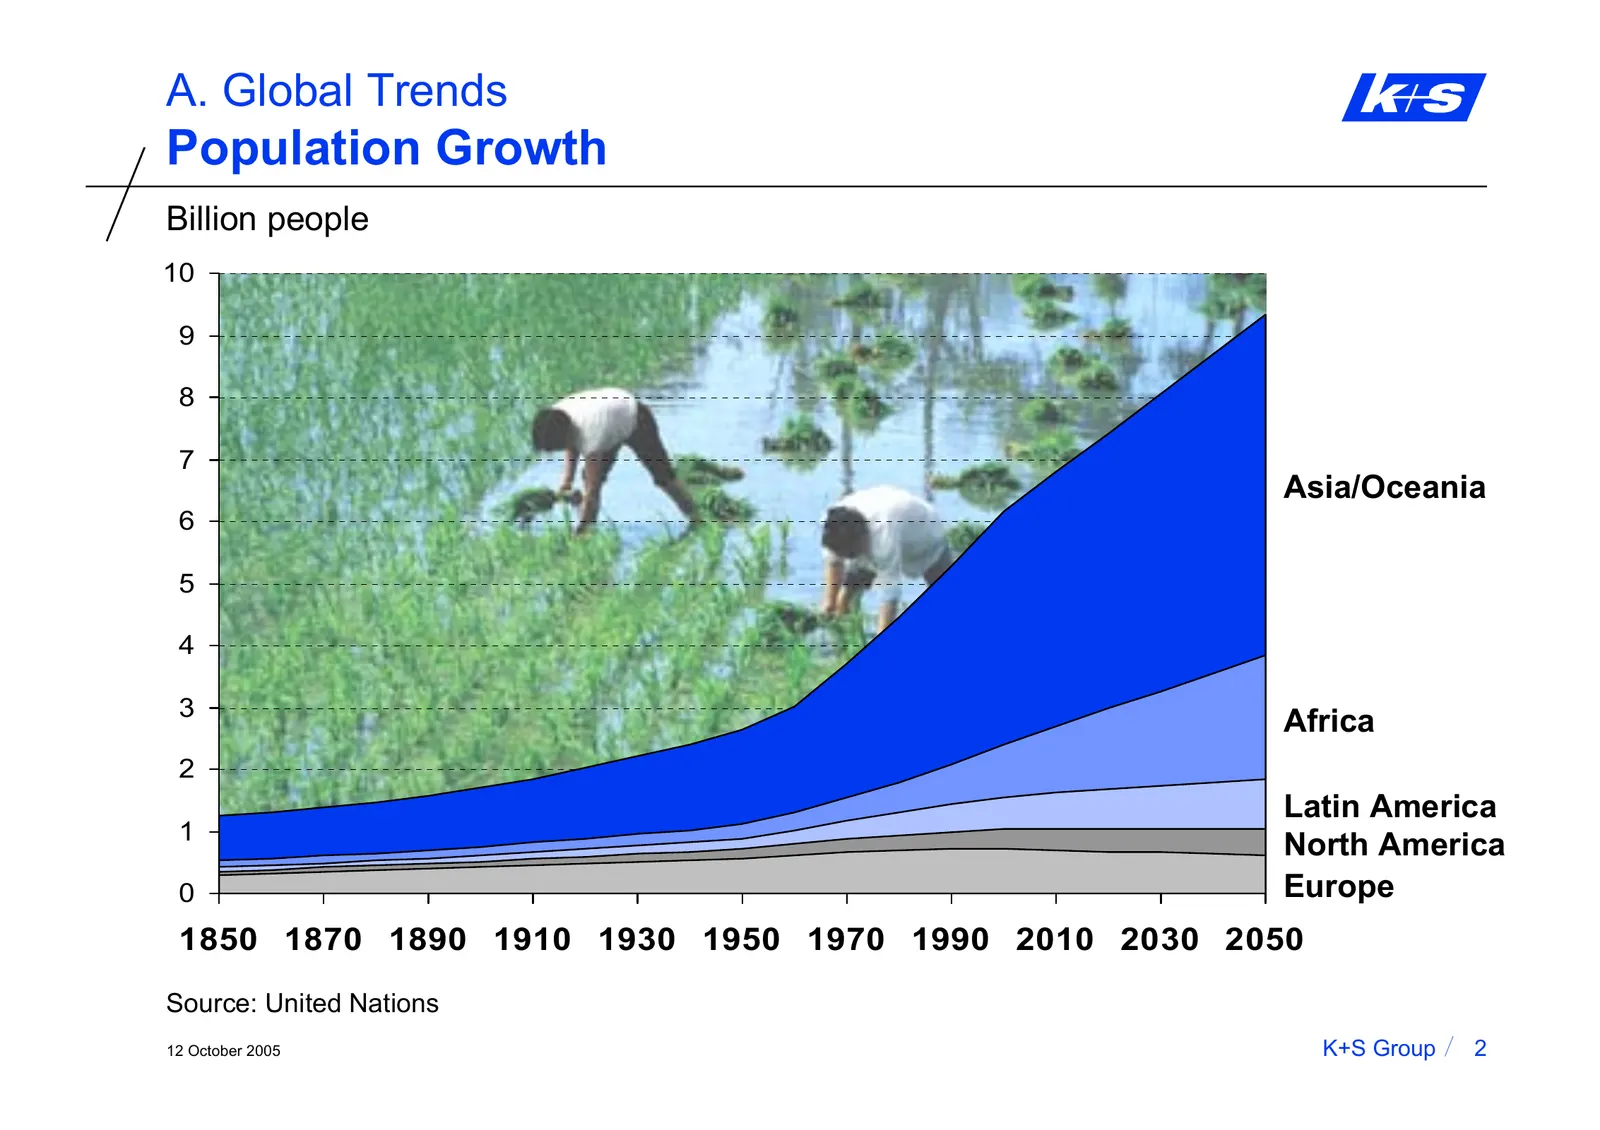
A. Global Trends Population Growth Billion people 10 9 8 7 Asia/Oceania 6 5 4 3 Africa 2 Latin America 1 North America 0 Europe 1850 1870 1890 1910 1930 1950 1970 1990 2010 2030 2050 Source: United Nations 12 October 2005 K+S Group 2
Slide 4: Development of the Irrigated Agricultural Area Worldwide
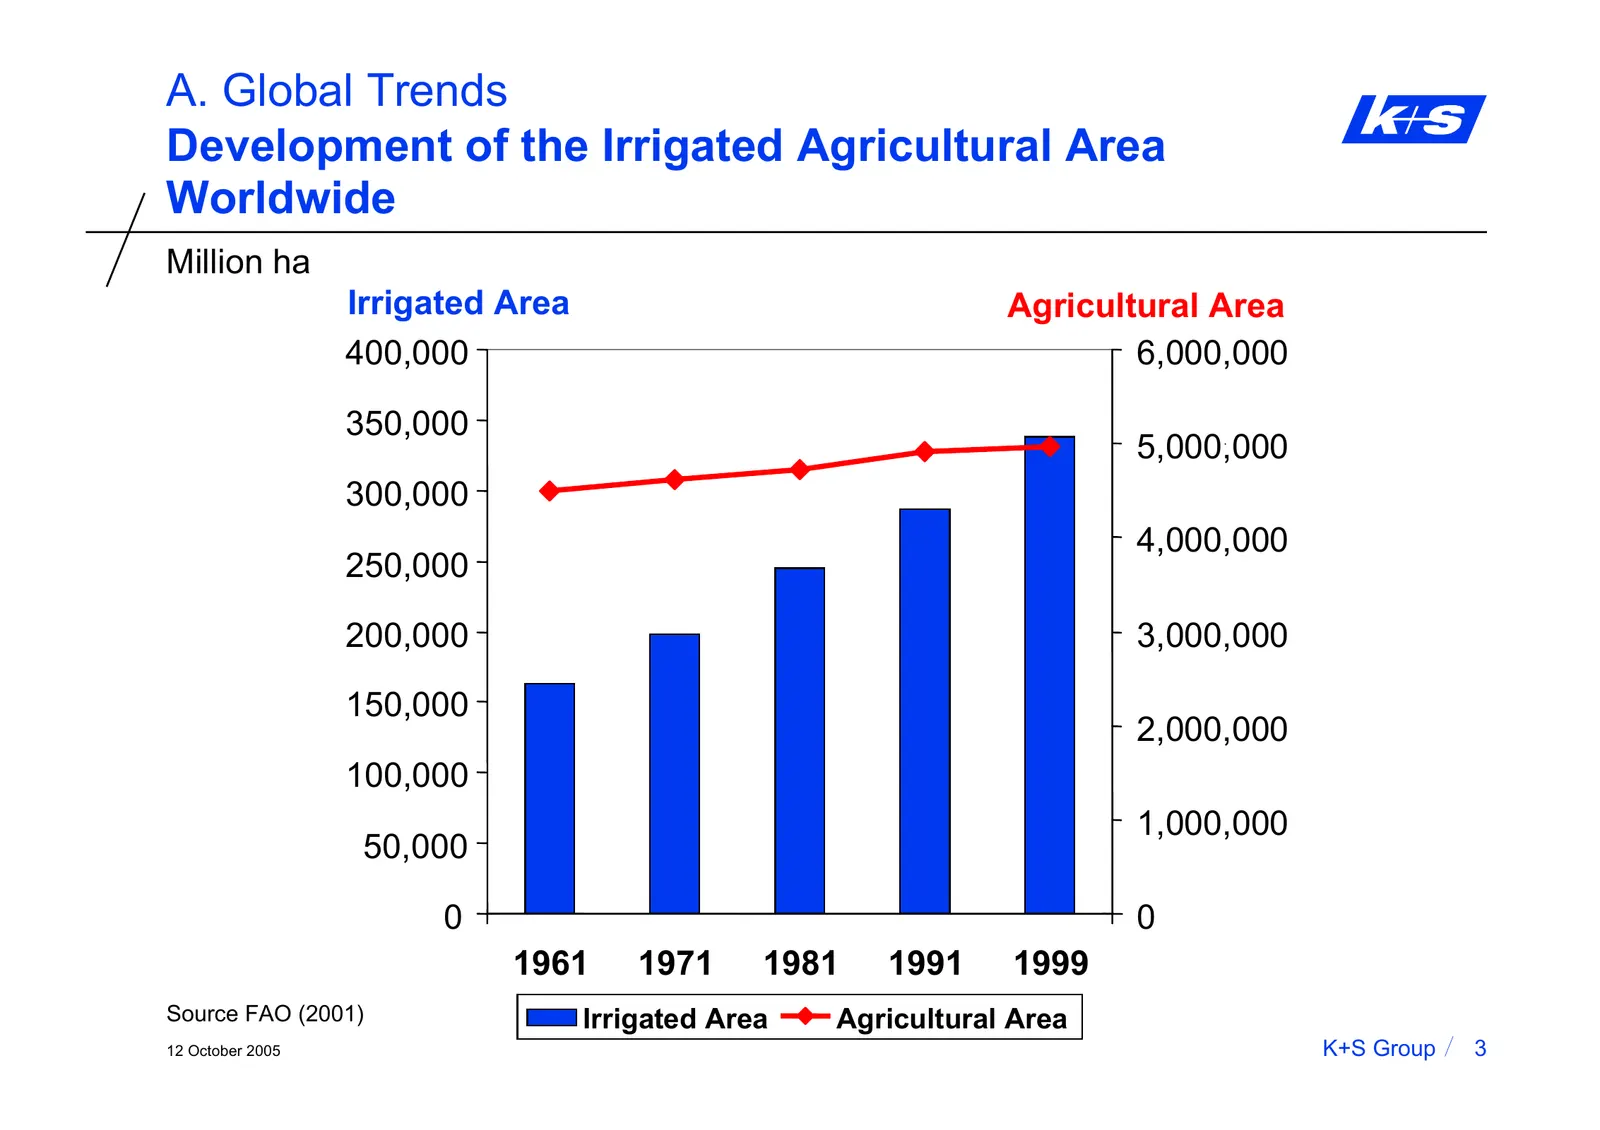
A. Global Trends Development of the Irrigated Agricultural Area Worldwide Million ha Irrigated Area Agricultural Area 400,000 6,000,000 350,000 5,000,000 300,000 4,000,000 250,000 200,000 3,000,000 150,000 2,000,000 100,000 1,000,000 50,000 0 0 1961 1971 1981 1991 1999 Source FAO (2001) Irrigated Ar
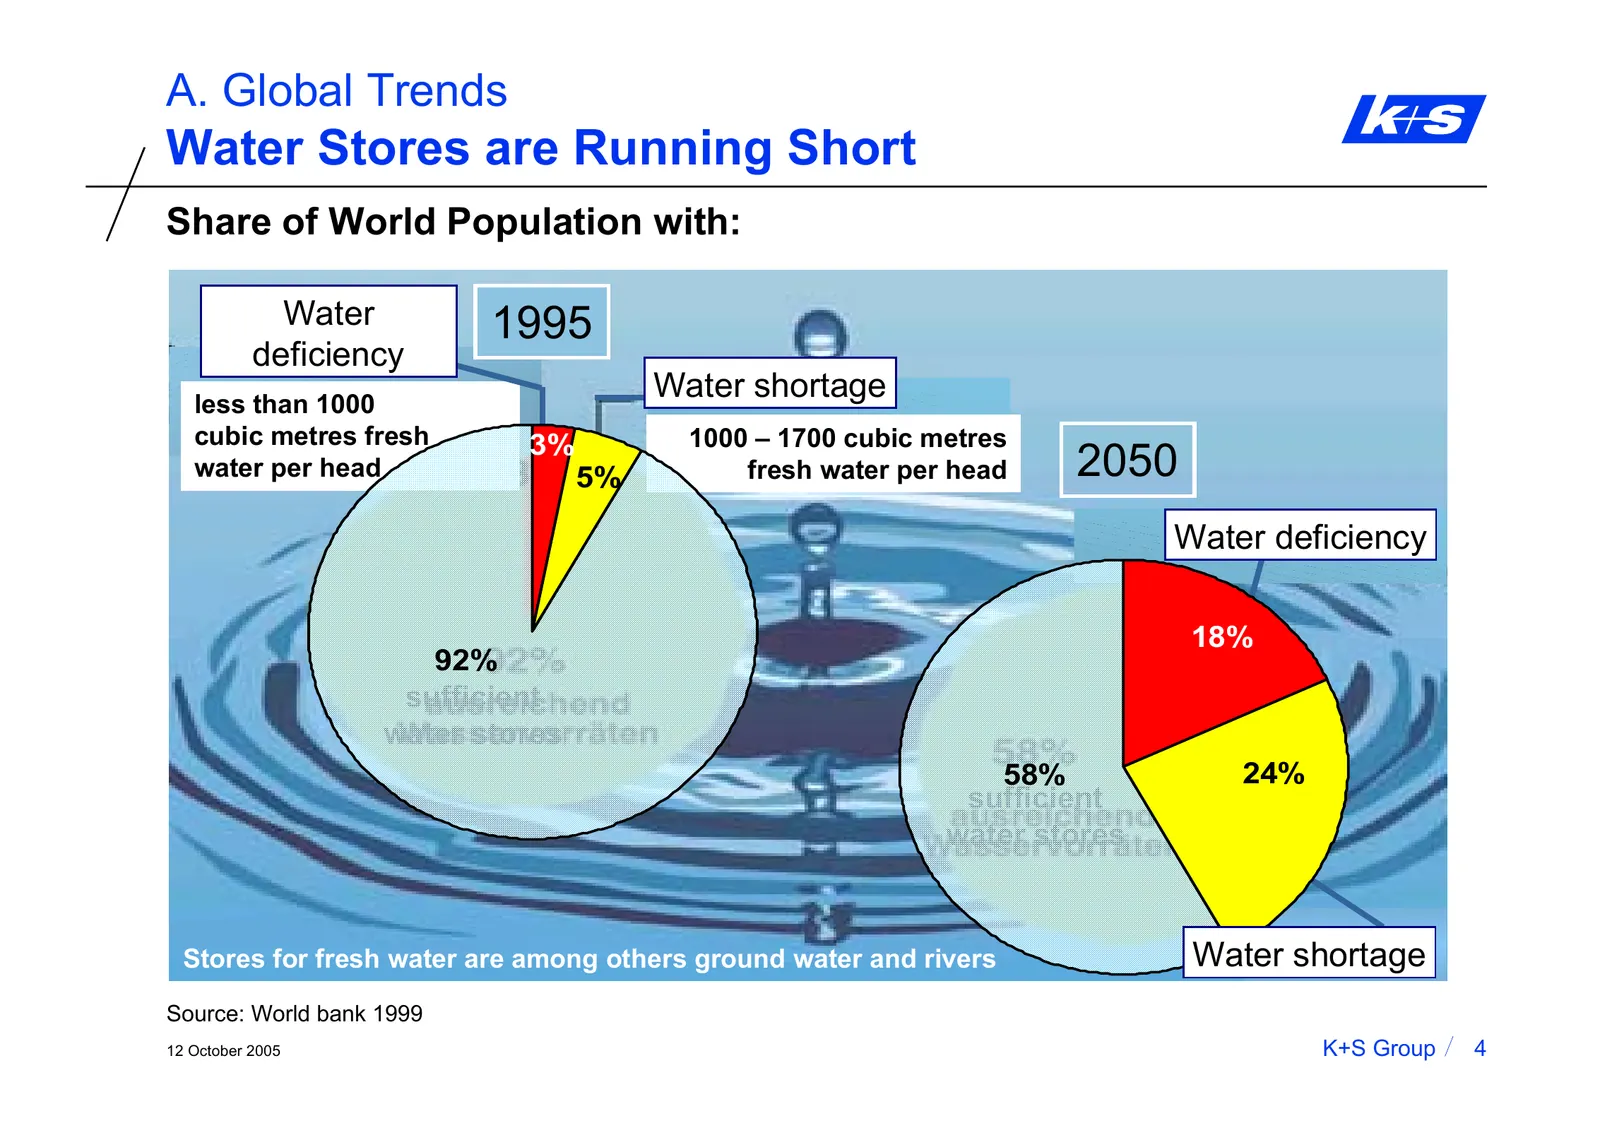
Slide 5: Water Stores are Running Short
A. Global Trends Water Stores are Running Short Share of World Population with: Water 1995 deficiency less than 1000 Water shortage cubic metres fresh 3% 1000 – 1700 cubic metres water per head 5% fresh water per head 2050 Water deficiency 18% 92% sufficient water stores 58% 24% sufficient water sto
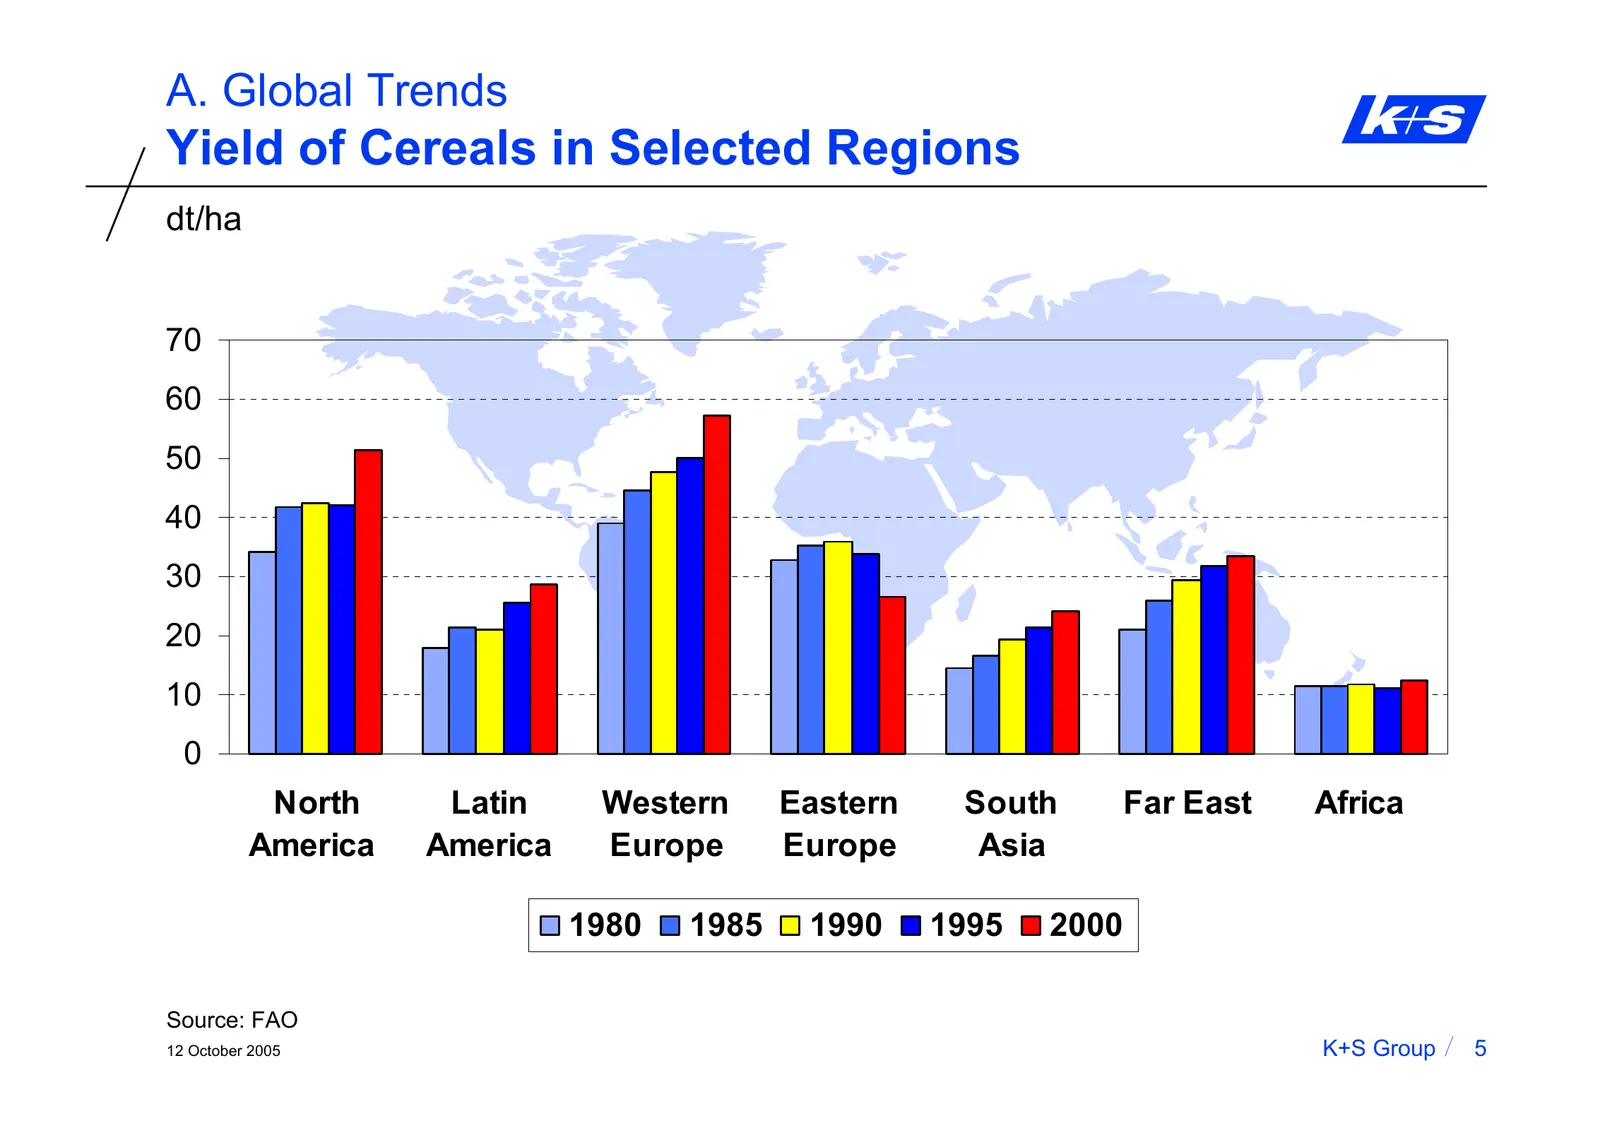
Slide 6: Yield of Cereals in Selected Regions
A. Global Trends Yield of Cereals in Selected Regions dt/ha 70 60 50 40 30 20 10 0 North Latin Western Eastern South Far East Africa America America Europe Europe Asia 1980 1985 1990 1995 2000 Source: FAO 12 October 2005 K+S Group 5
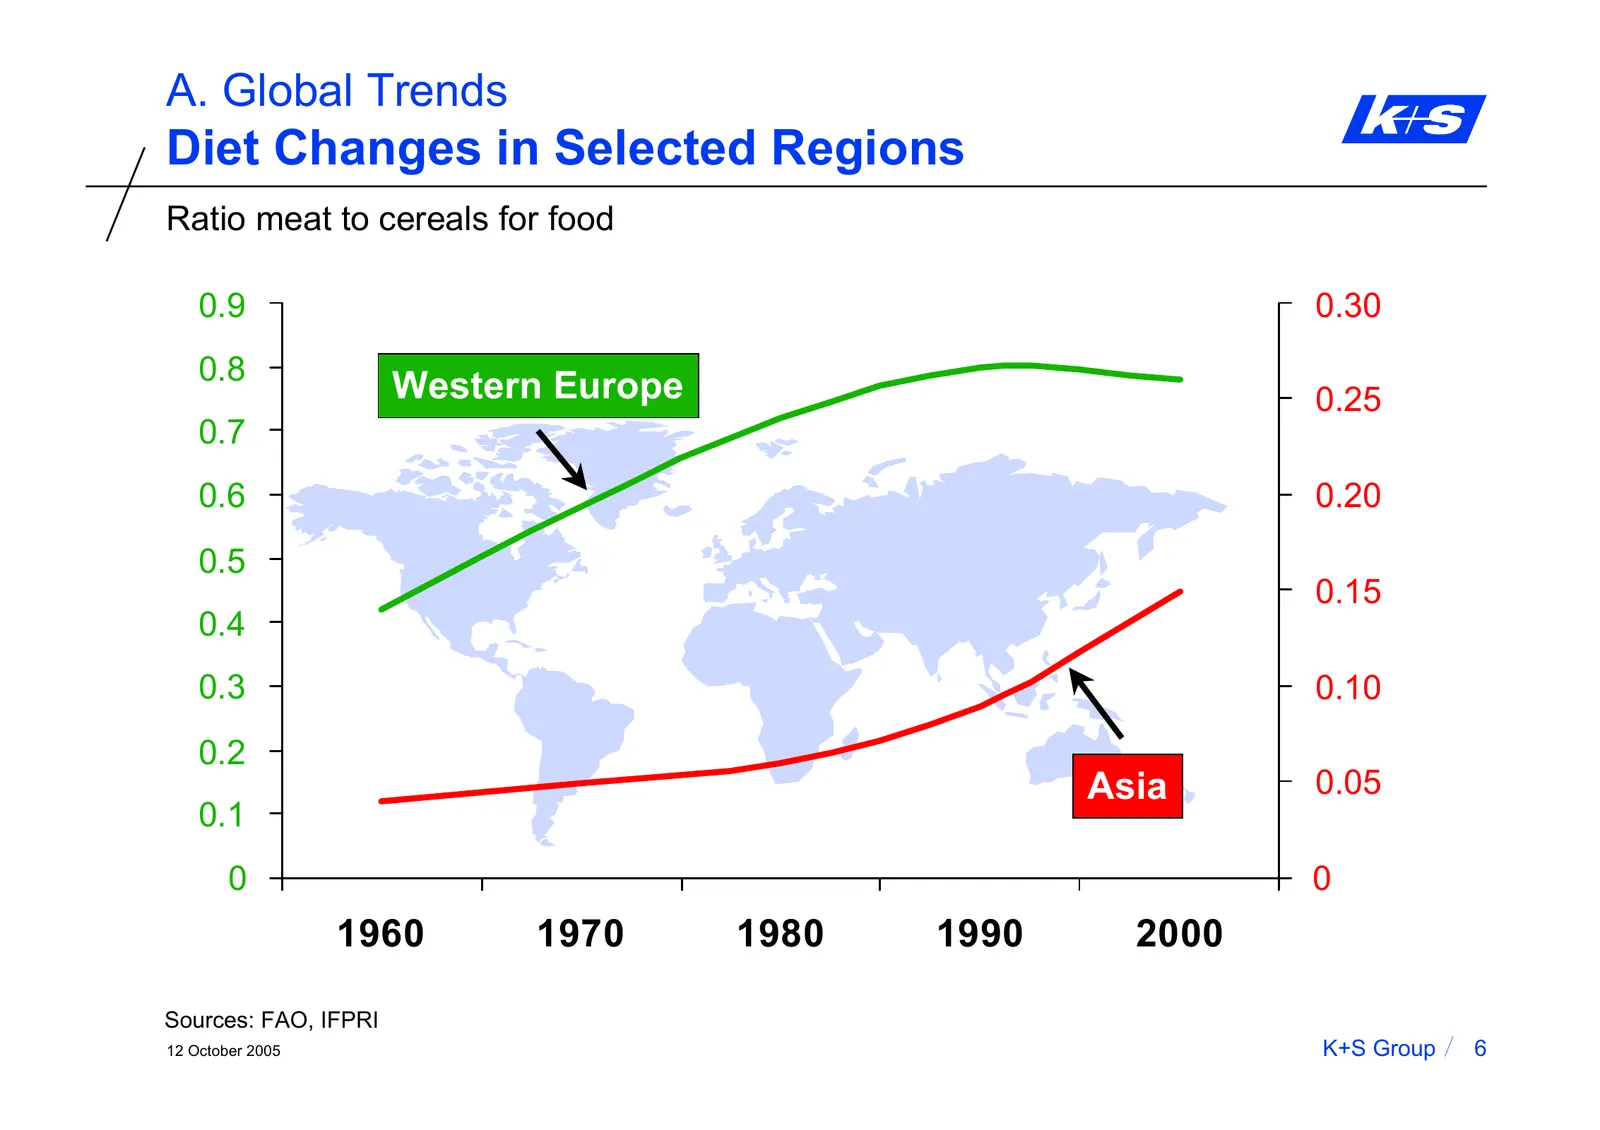
Slide 7: Diet Changes in Selected Regions
A. Global Trends Diet Changes in Selected Regions Ratio meat to cereals for food 0,9 0.9 0,30 0.30 0,8 0.8 Western Europe 0,25 0.25 0,7 0.7 0,6 0.6 0,20 0.20 0,5 0.5 0,15 0.15 0,4 0.4 0,3 0.3 0,10 0.10 0,2 0.2 Asia 0,05 0.05 0,1 0.1 0 0 0,00 0 1960 1970 1980 1990 2000 Sources: FAO, IFPRI 12 October
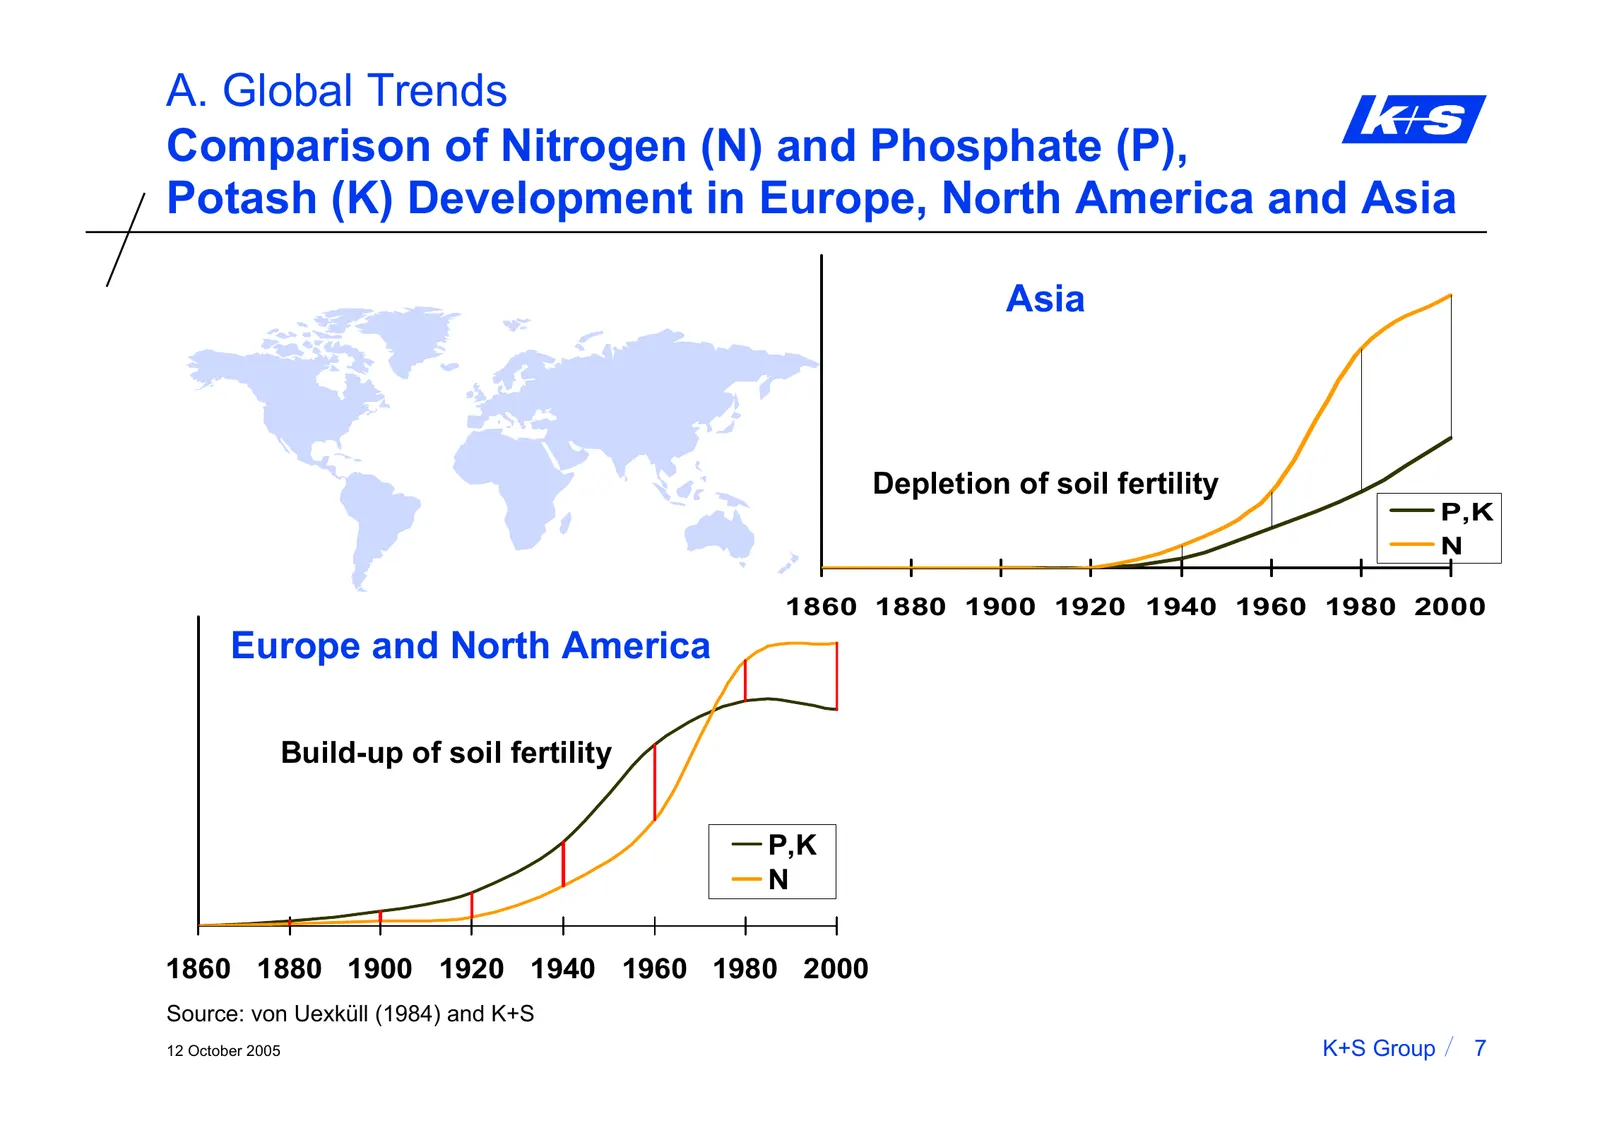
Slide 8: Comparison of Nitrogen, Phosphate, Potash Development in Europe, North America and Asia
A. Global Trends Comparison of Nitrogen (N) and Phosphate (P), Potash (K) Development in Europe, North America and Asia Asia Depletion of soil fertility P,K N 1860 1880 1900 1920 1940 1960 1980 2000 Europe and North America Build-up of soil fertility P,K N 1860 1880 1900 1920 1940 1960 1980 2000 Sou
Slide 9: Content
K+S Analysts‘ Day 2005 Content A. Global Trends B. Fertilizer Basics C. Efficiency Benefits of Balanced Fertilization - Nitrogen Efficiency - Resistance . Diseases . Salt Stress - Water Use Efficiency - CO2 Efficiency D. Outlook - Rising Quality Demands - Industrial Crops - Agricultural Challenges i
Slide 10: Why Fertilize ???
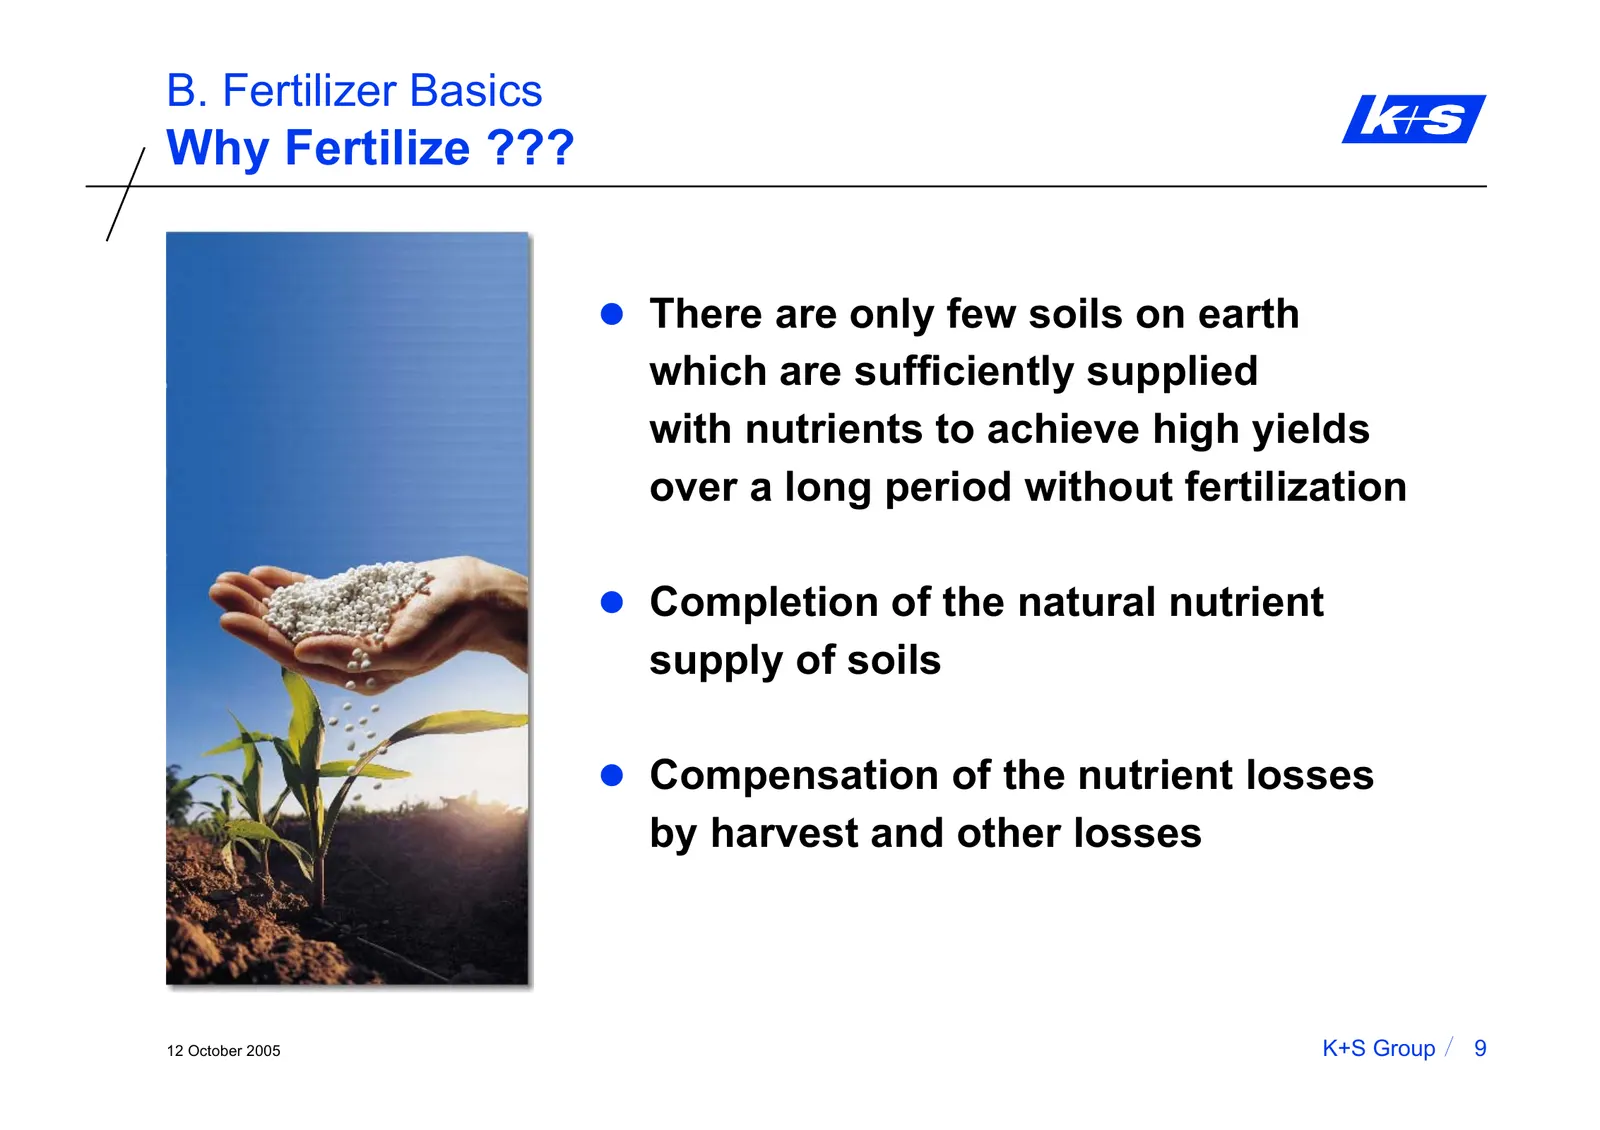
B. Fertilizer Basics Why Fertilize ??? z There are only few soils on earth which are sufficiently supplied with nutrients to achieve high yields over a long period without fertilization z Completion of the natural nutrient supply of soils z Compensation of the nutrient losses by harvest and other lo
Slide 11: What do Plants Demand?
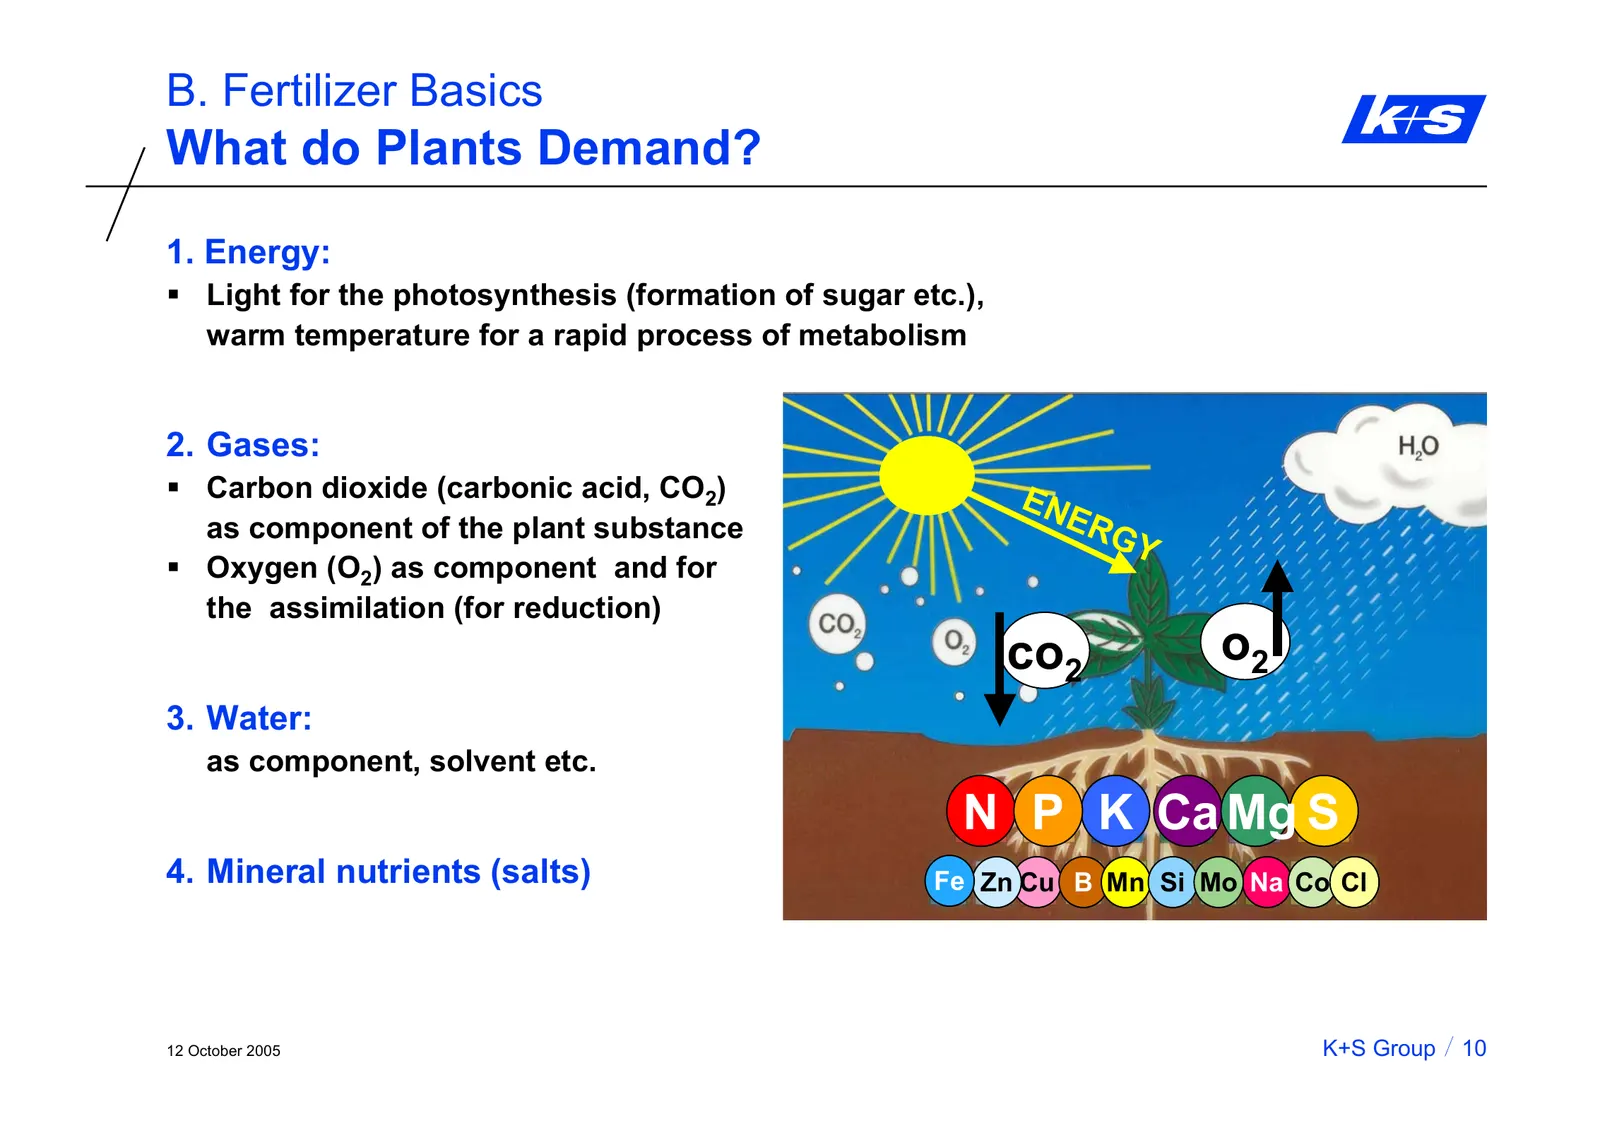
B. Fertilizer Basics What do Plants Demand? 1. Energy: Light for the photosynthesis (formation of sugar etc.), warm temperature for a rapid process of metabolism 2. Gases: Carbon dioxide (carbonic acid, CO2) EN as component of the plant substance ER GY Oxygen (O2) as component and for the assi
Slide 12: Nutrient Cycle
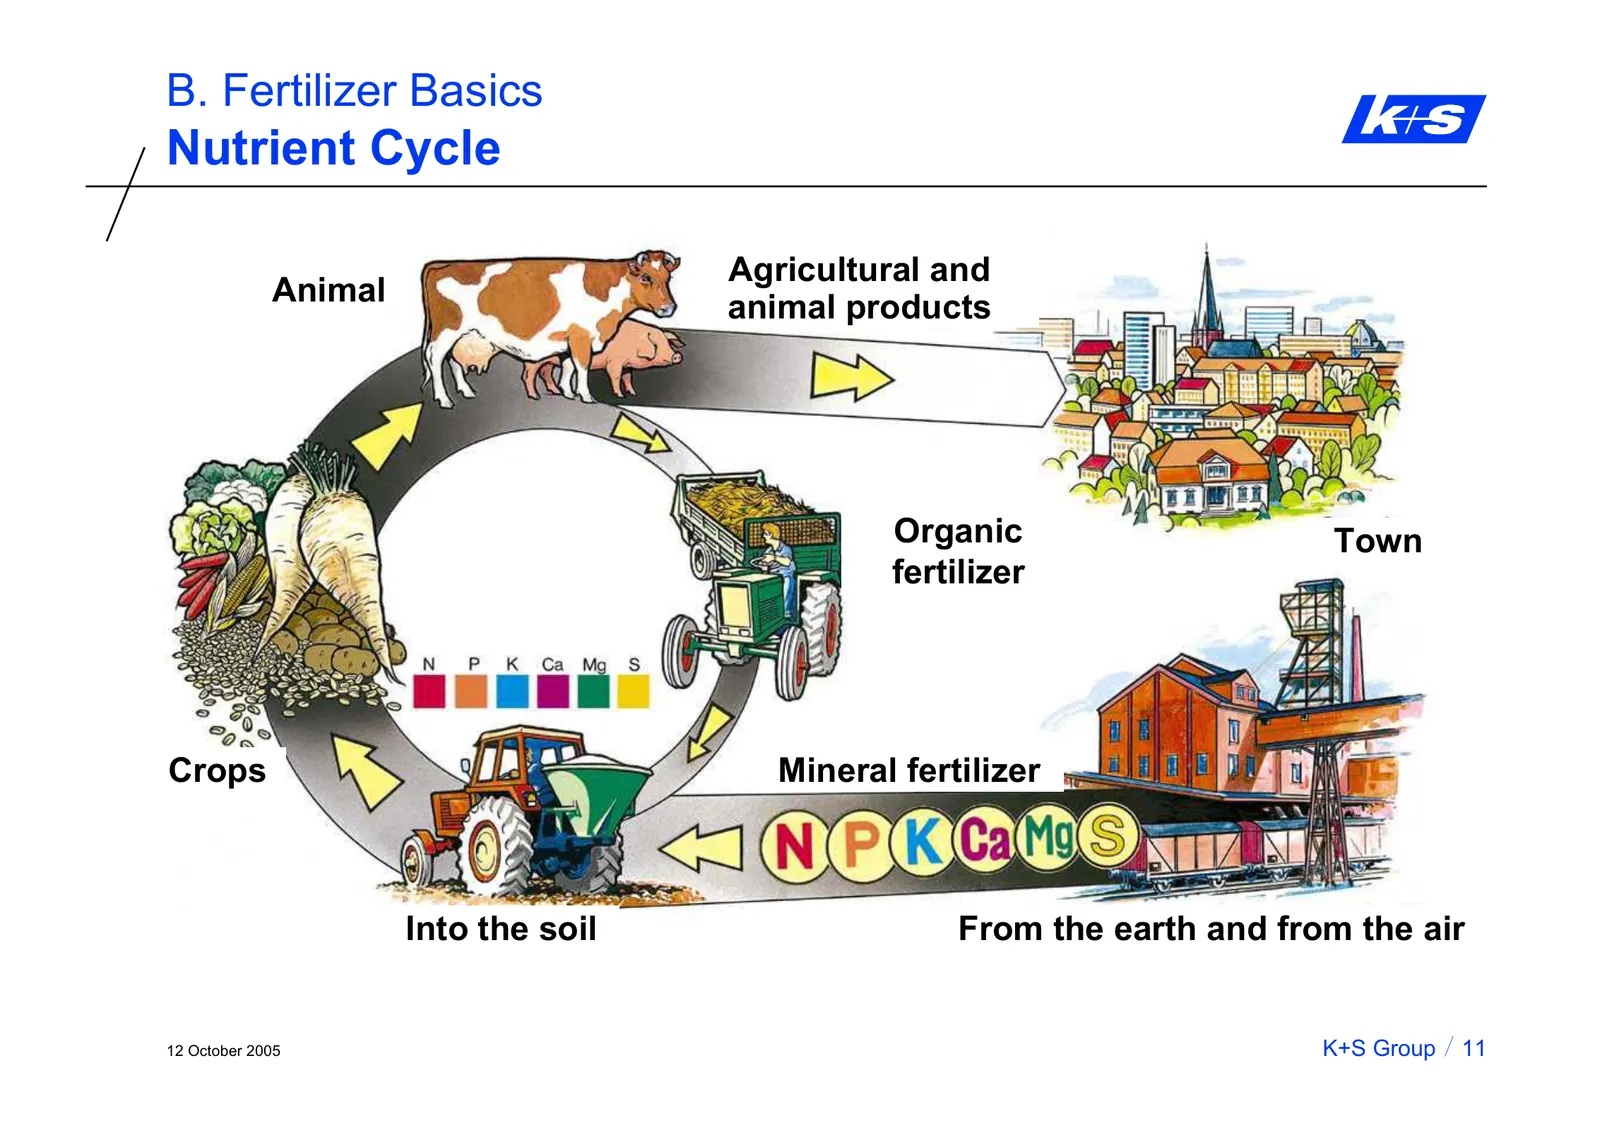
B. Fertilizer Basics Nutrient Cycle Agricultural and Animal animal products Organic Town fertilizer Crops Mineral fertilizer Into the soil From the earth and from the air 12 October 2005 K+S Group 11
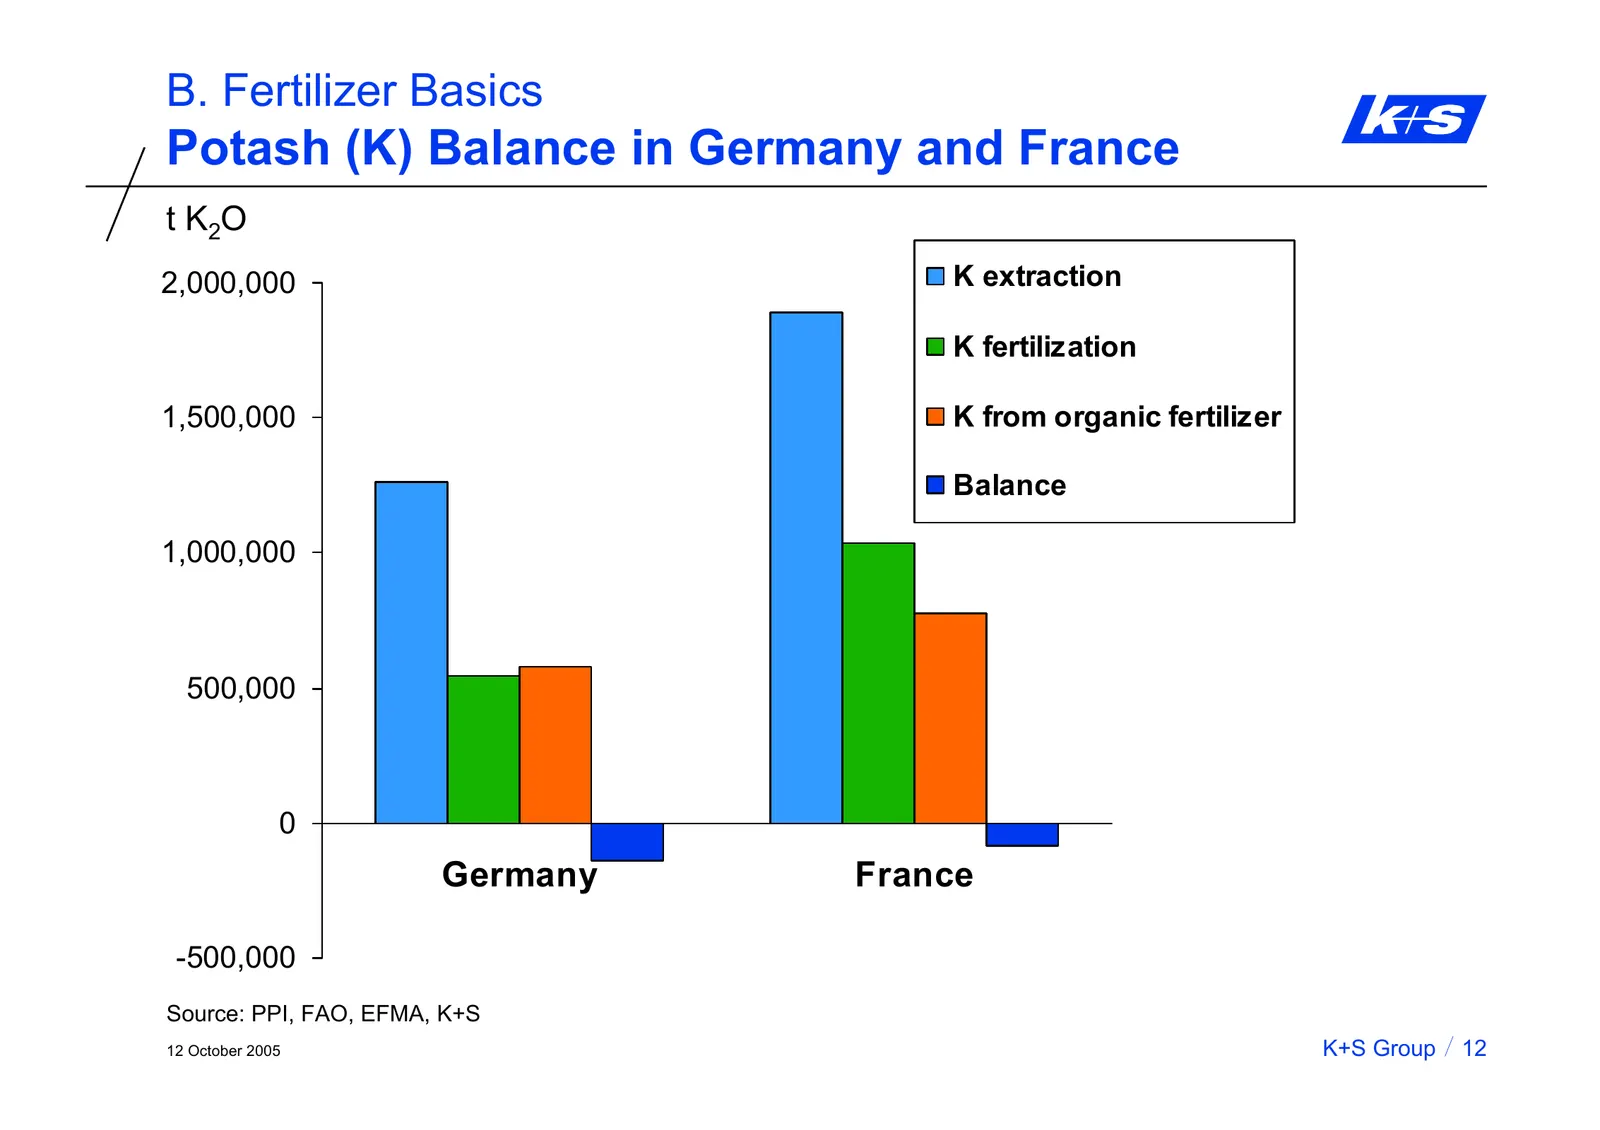
Slide 13: Potash (K) Balance in Germany and France
B. Fertilizer Basics Potash (K) Balance in Germany and France t K2O 2,000,000 2.000.000 K extraction K fertilization 1,500,000 1.500.000 K from organic fertilizer Balance 1,000,000 1.000.000 500,000 500.000 0 Germany France -500,000 -500.000 Source: PPI, FAO, EFMA, K+S 12 October 2005 K+S Group 12
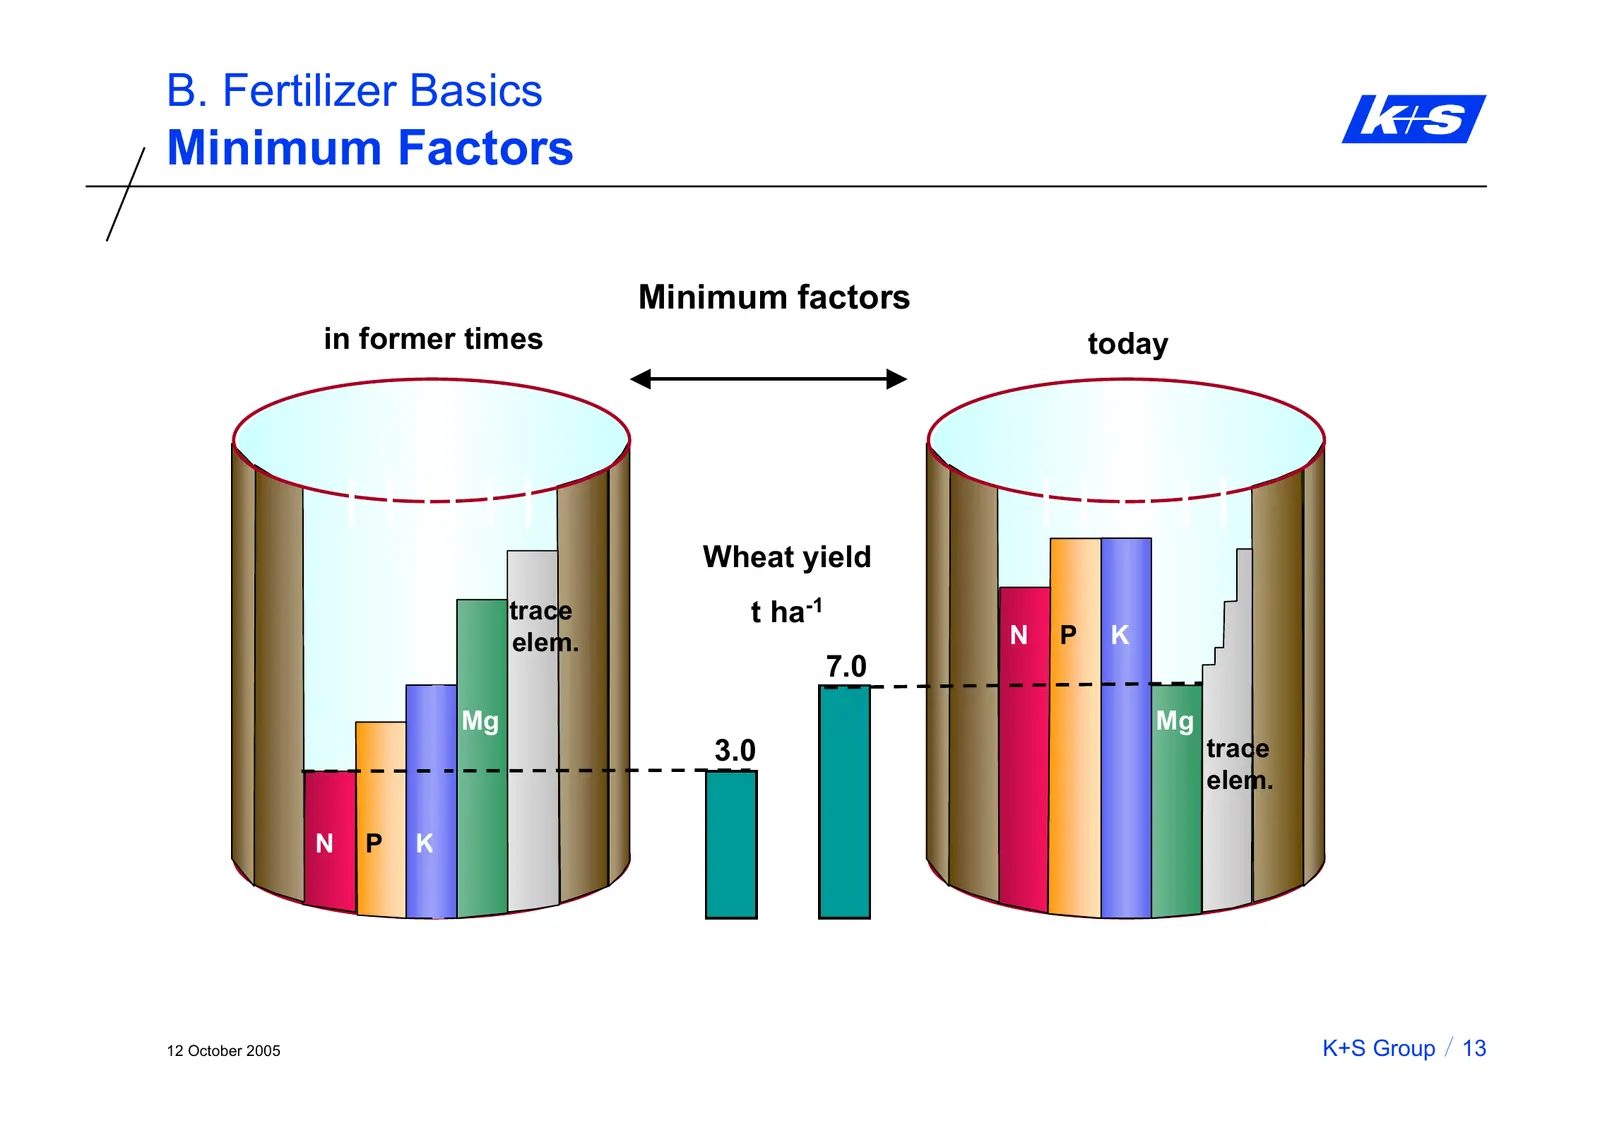
Slide 14: Minimum Factors
B. Fertilizer Basics Minimum Factors Minimum factors in former times today Wheat yield trace t ha-1 elem. N P K 7.0 Mg Mg 3.0 trace elem. N P K 12 October 2005 K+S Group 13
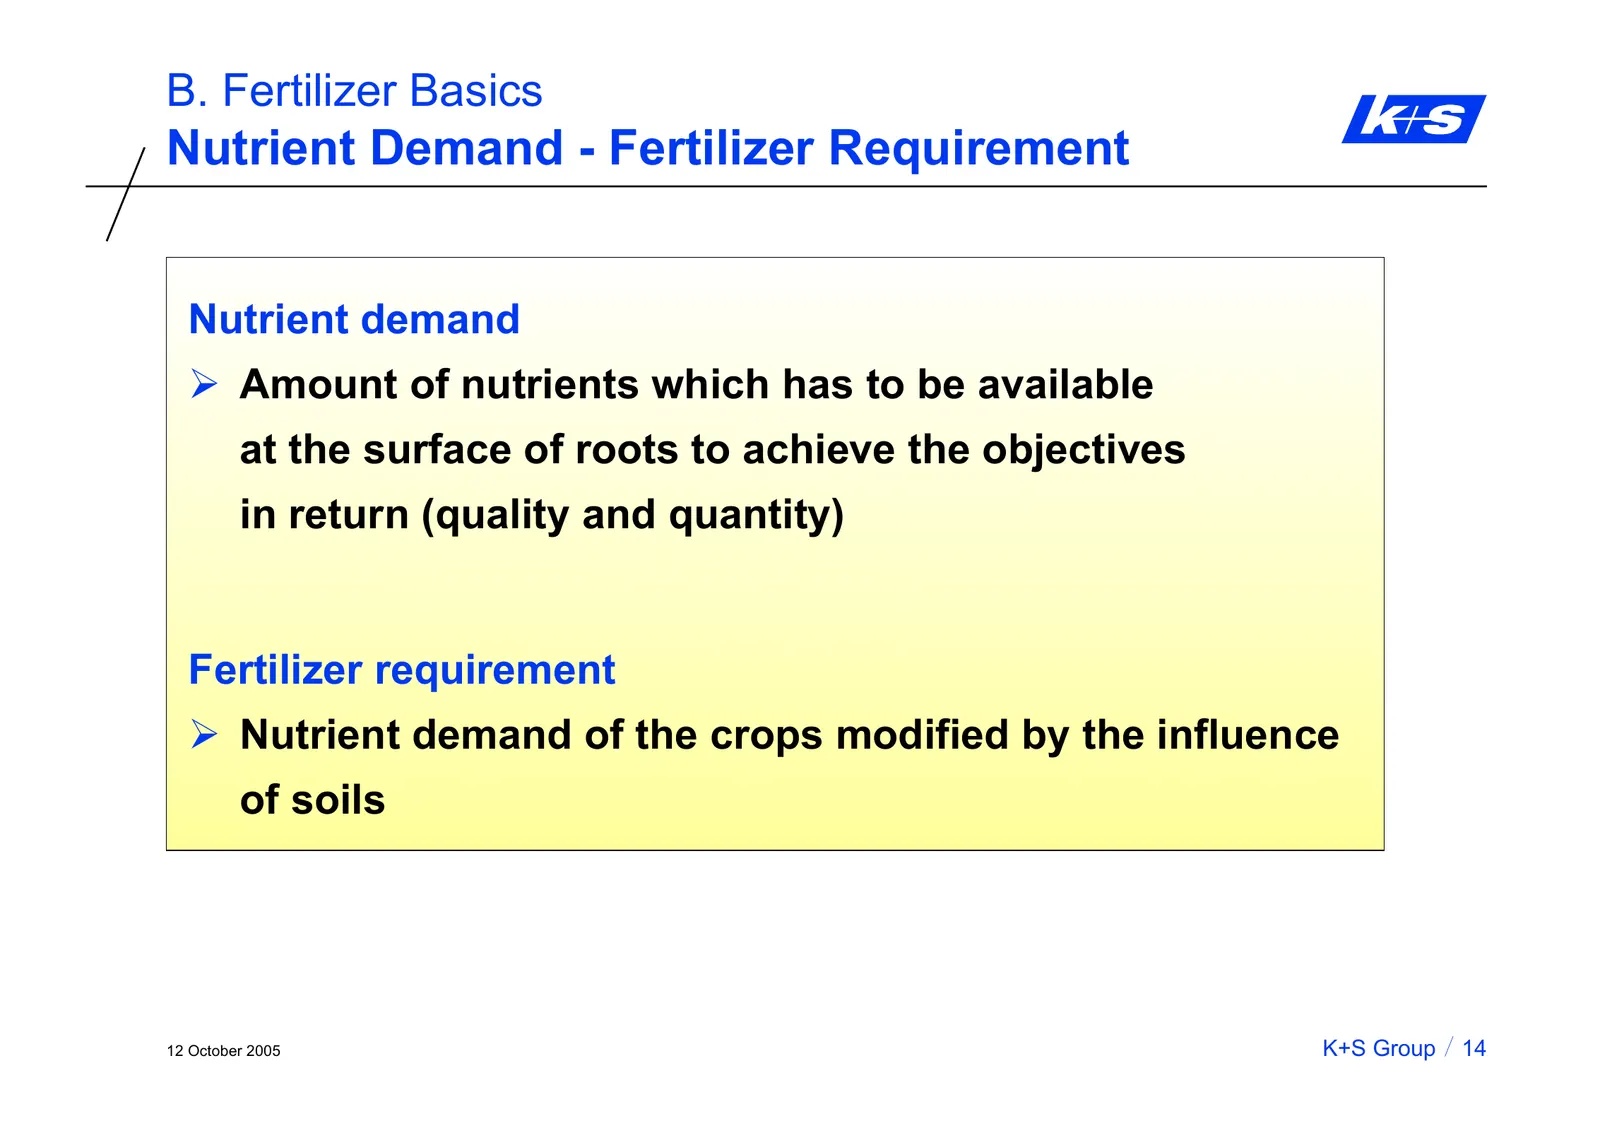
Slide 15: Nutrient Demand - Fertilizer Requirement
B. Fertilizer Basics Nutrient Demand - Fertilizer Requirement Nutrient demand ¾ Amount of nutrients which has to be available at the surface of roots to achieve the objectives in return (quality and quantity) Fertilizer requirement ¾ Nutrient demand of the crops modified by the influence of soils 12
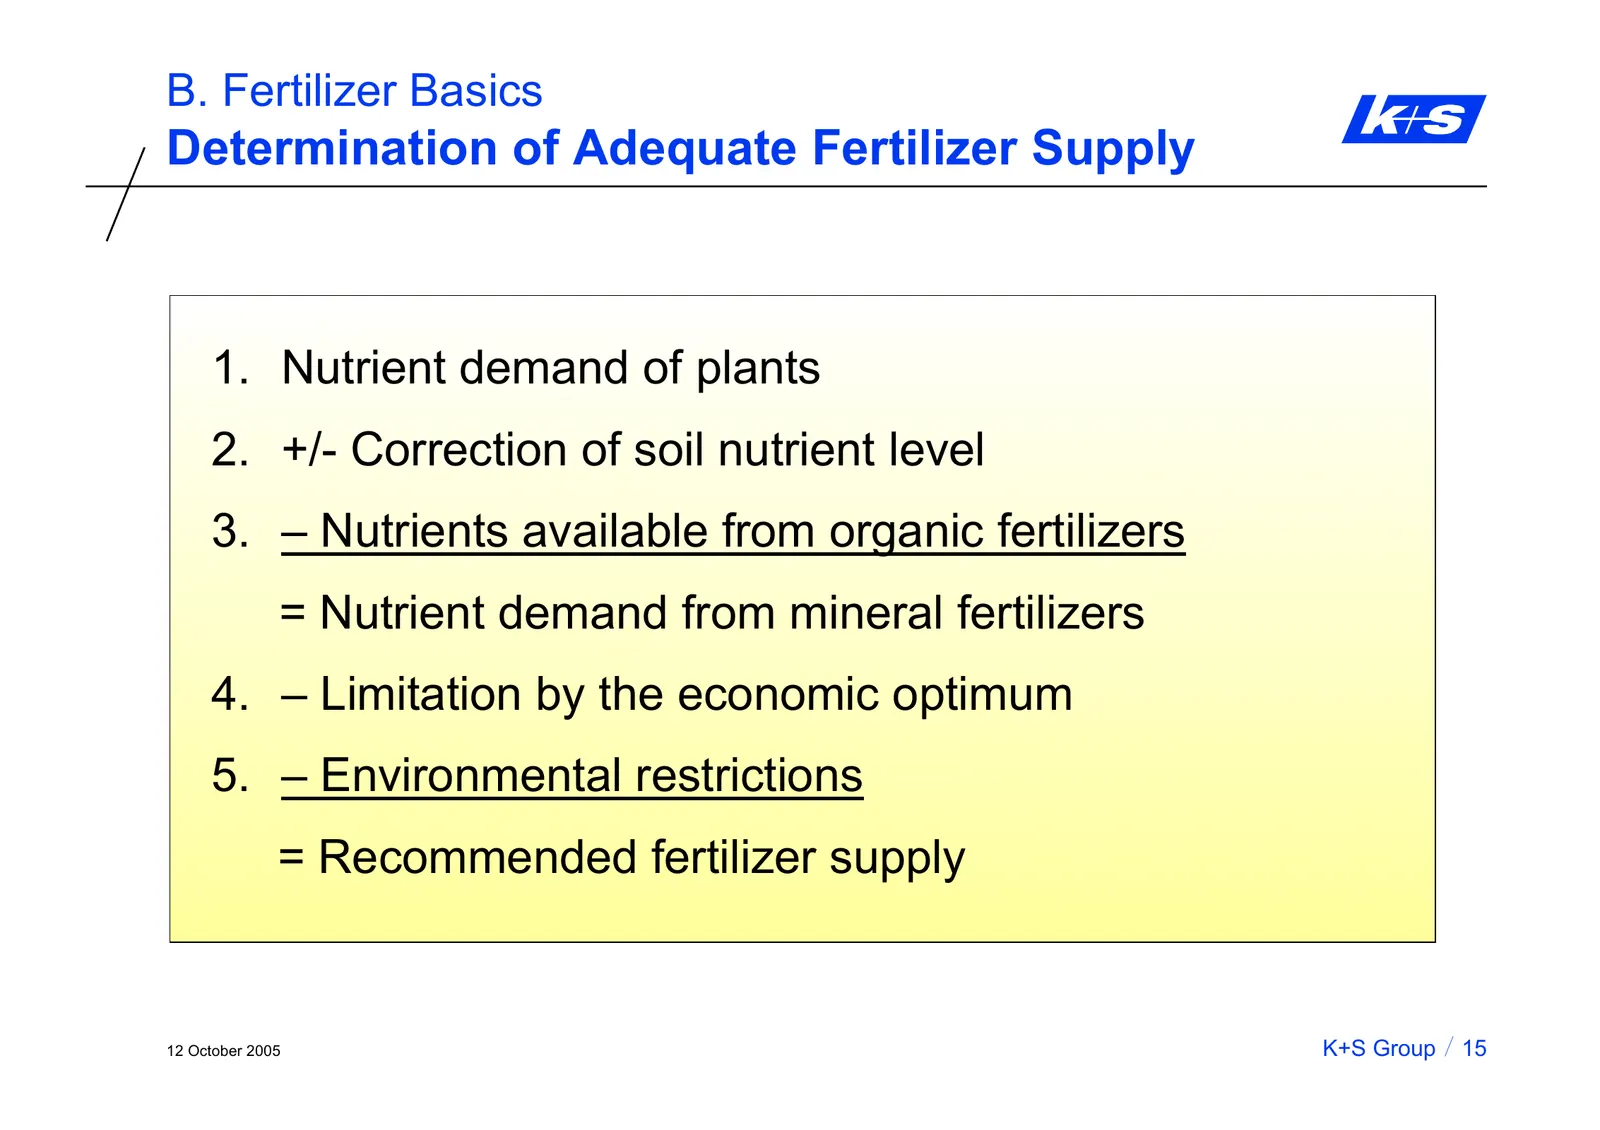
Slide 16: Determination of Adequate Fertilizer Supply
B. Fertilizer Basics Determination of Adequate Fertilizer Supply 1. Nutrient demand of plants 2. +/- Correction of soil nutrient level 3. – Nutrients available from organic fertilizers = Nutrient demand from mineral fertilizers 4. – Limitation by the economic optimum 5. – Environmental restrictions
Slide 17: Dynamic of Potash (K) in the System Soil - Plant
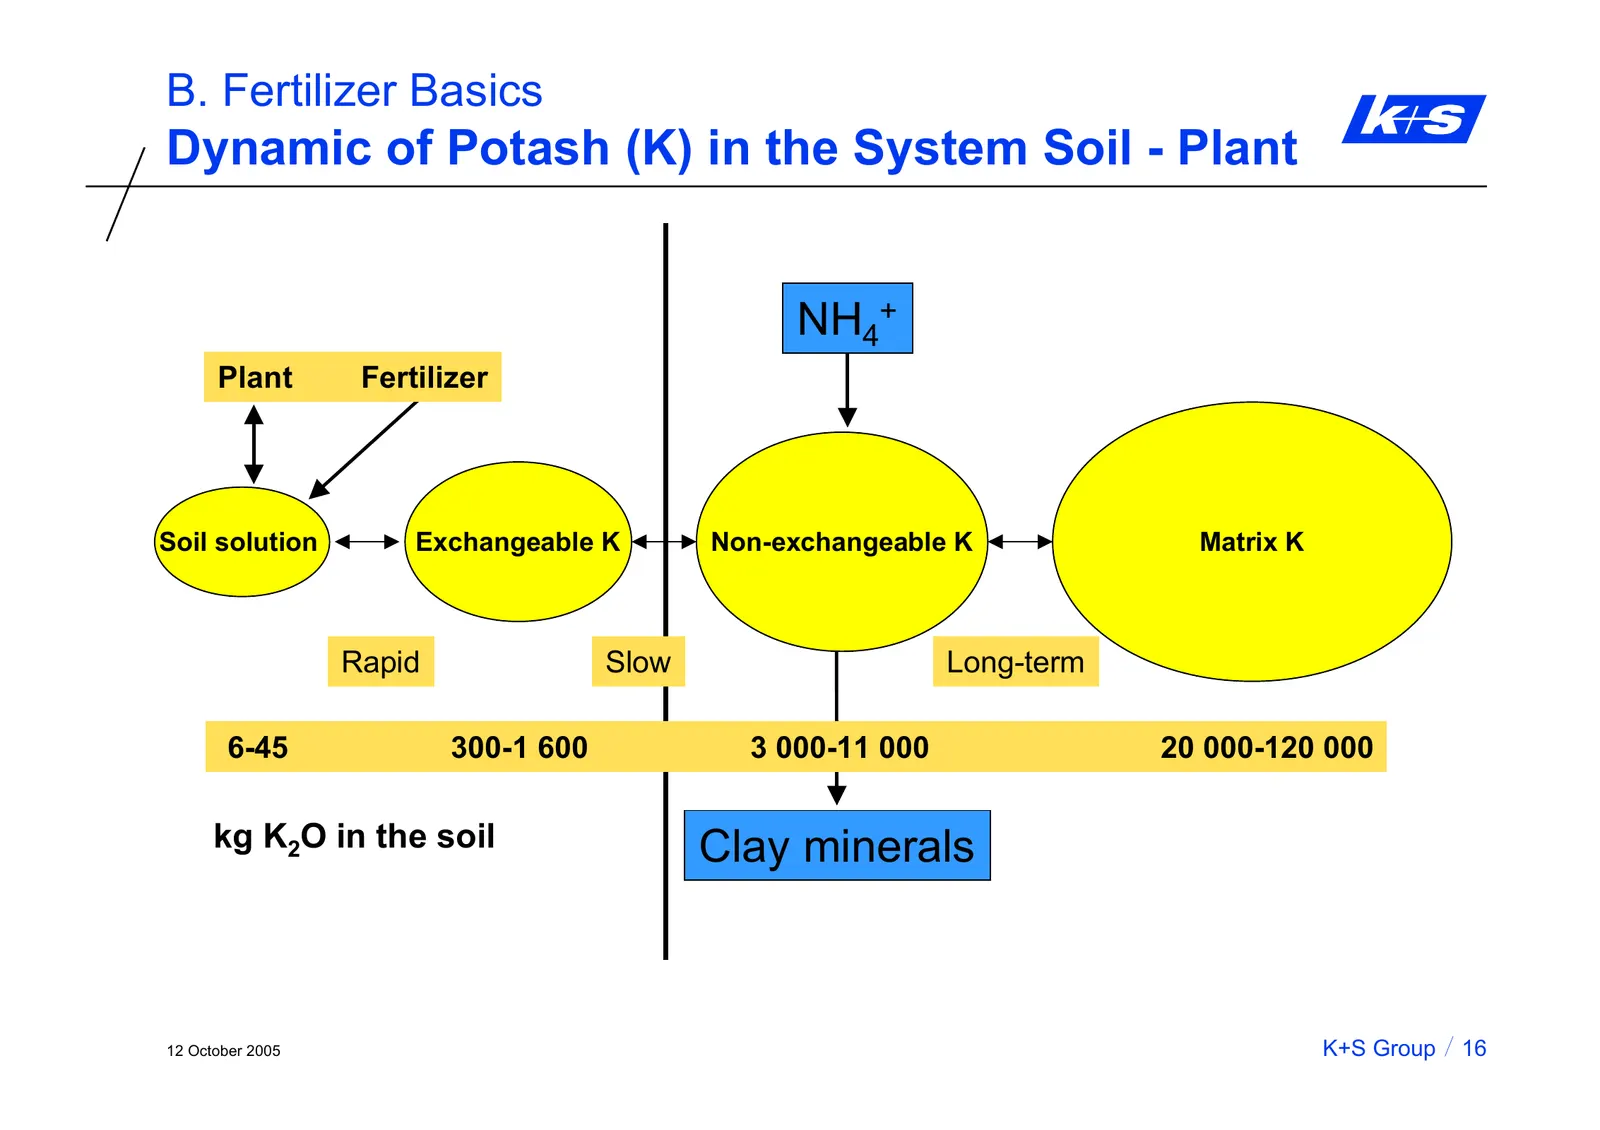
B. Fertilizer Basics Dynamic of Potash (K) in the System Soil - Plant NH4+ Plant Fertilizer Soil solution Exchangeable K Non-exchangeable K Matrix K Rapid Slow Long-term 6-45 300-1 600 3 000-11 000 20 000-120 000 kg K2O in the soil Clay minerals 12 October 2005 K+S Group 16
Slide 18: Relative Distribution of Carbohydrates between Shoot and Roots
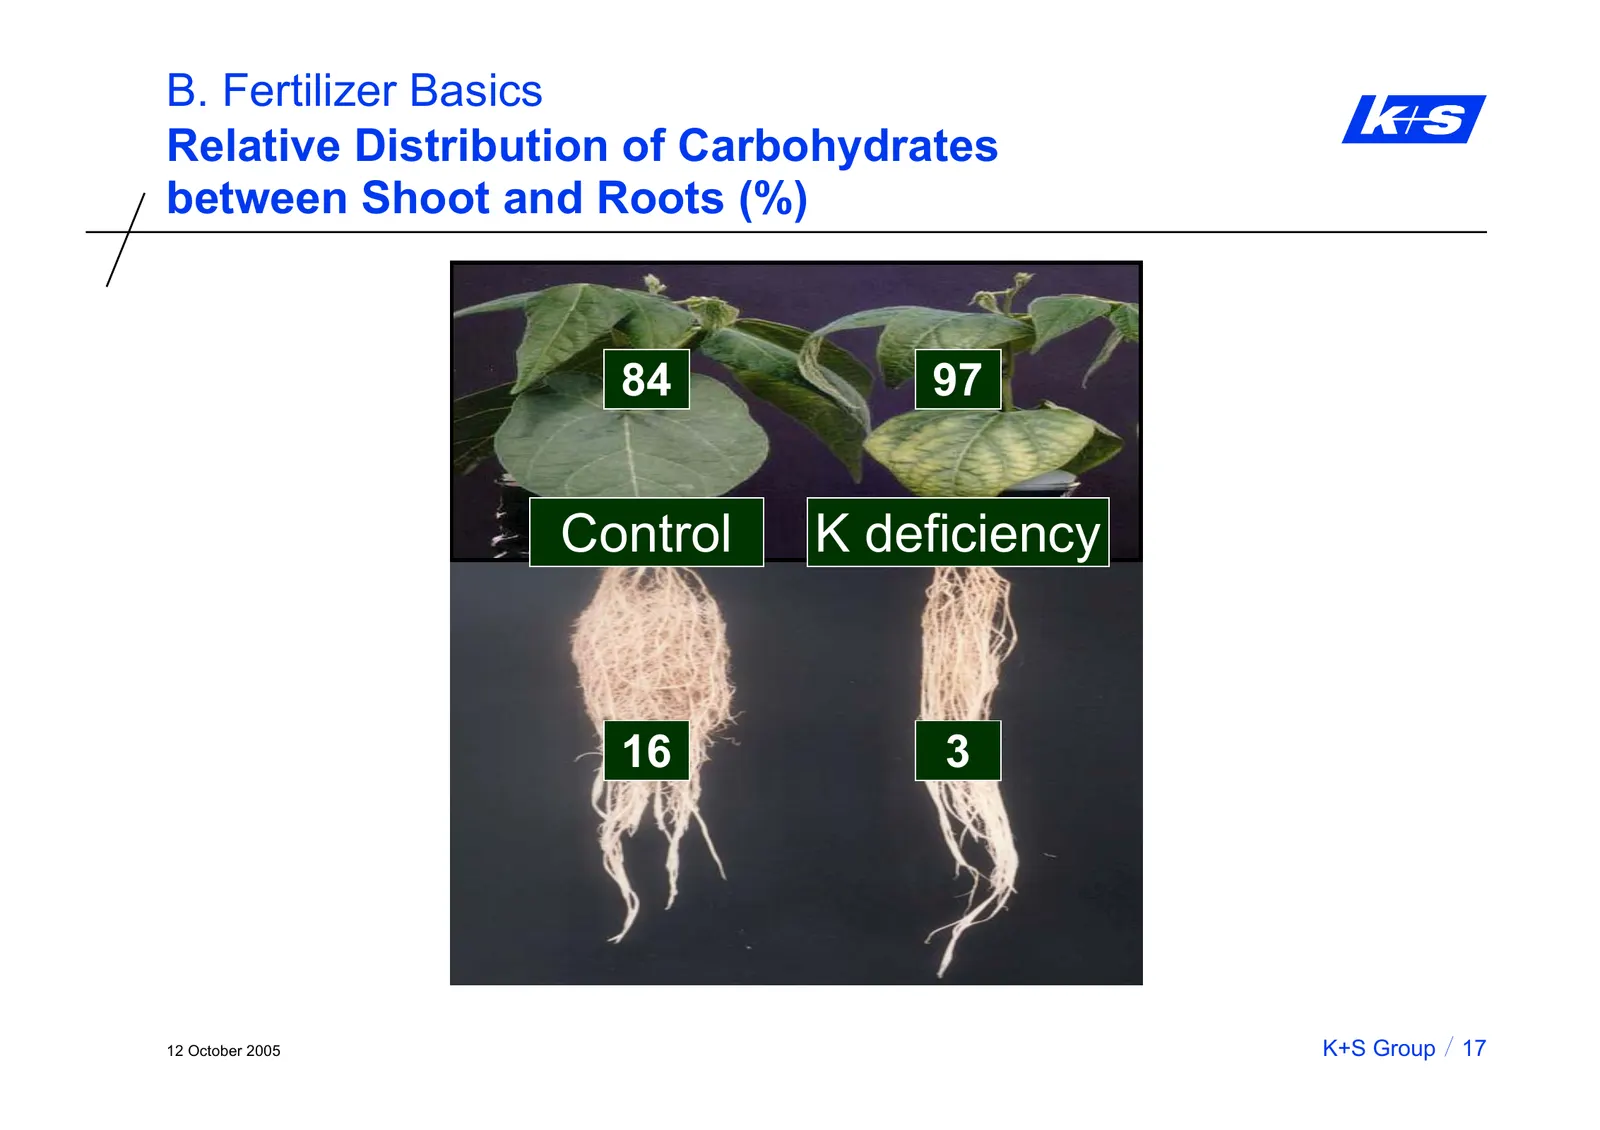
B. Fertilizer Basics Relative Distribution of Carbohydrates between Shoot and Roots (%) 84 97 Control K deficiency 16 3 12 October 2005 K+S Group 17
Slide 19: Relative Distribution of Carbohydrates between Shoot and Roots
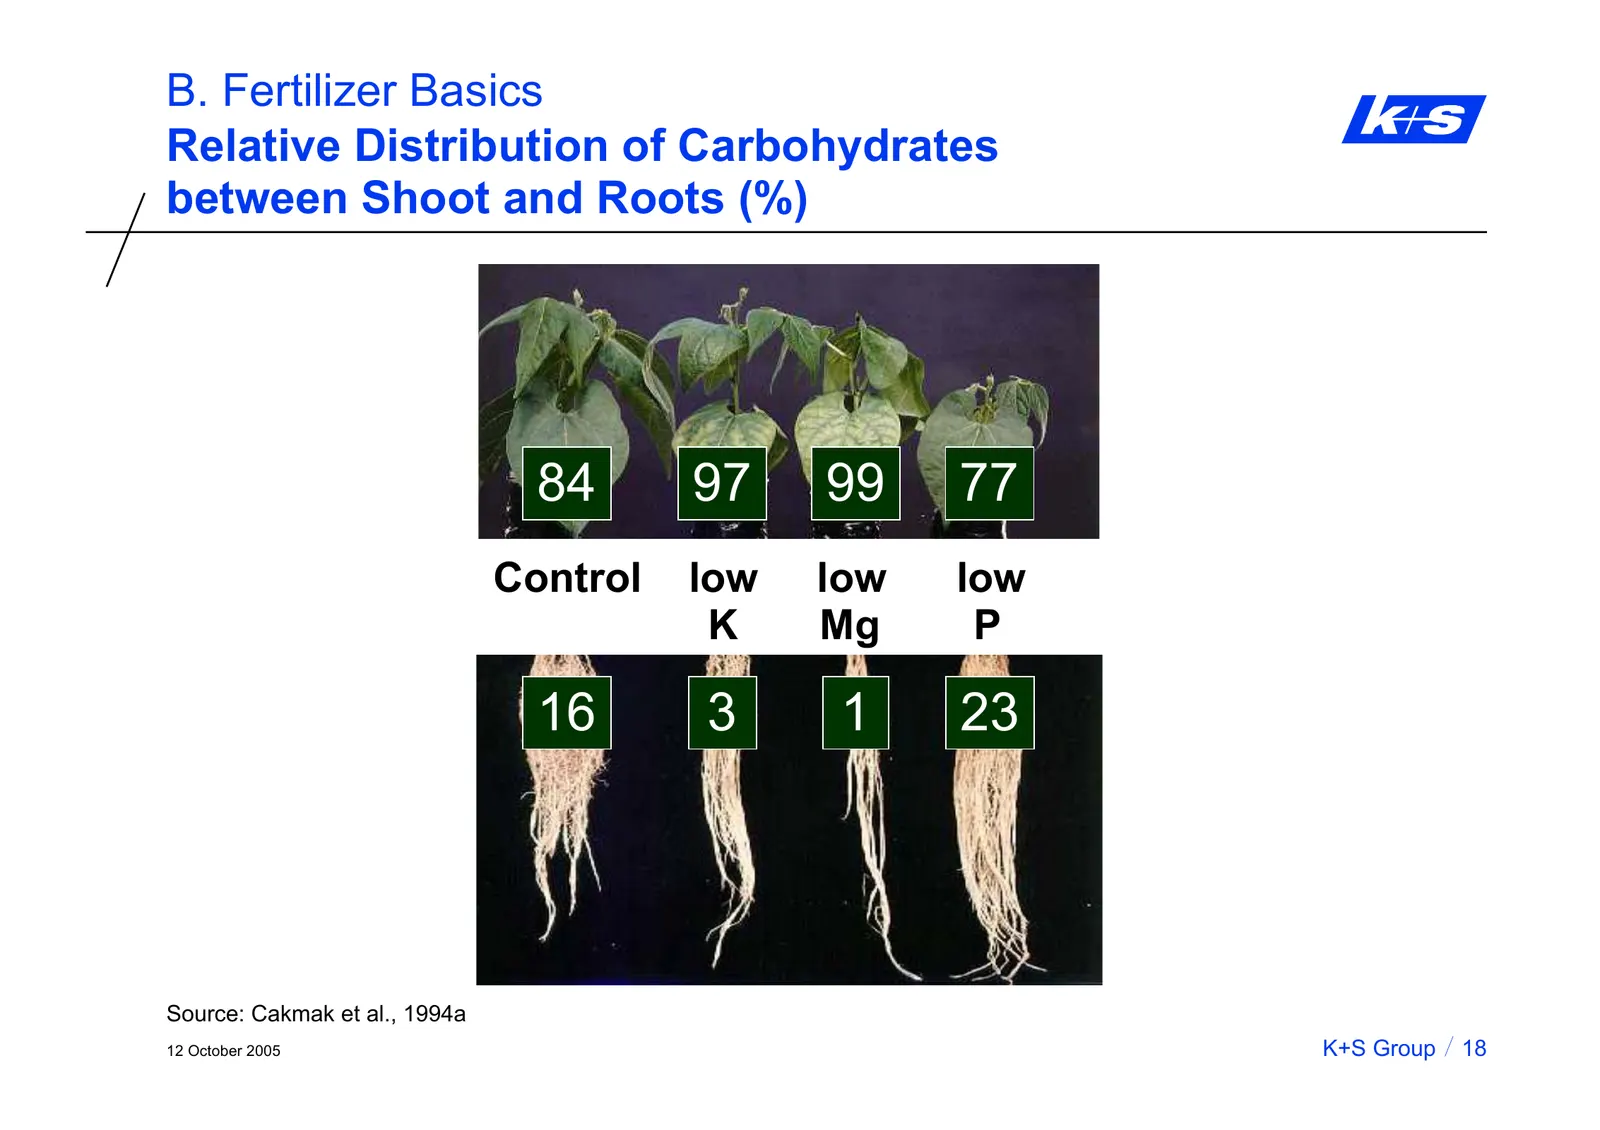
B. Fertilizer Basics Relative Distribution of Carbohydrates between Shoot and Roots (%) 84 97 99 77 Control low low low K Mg P 16 3 1 23 Source: Cakmak et al., 1994a 12 October 2005 K+S Group 18
Slide 20: Major Nutritional Constraints
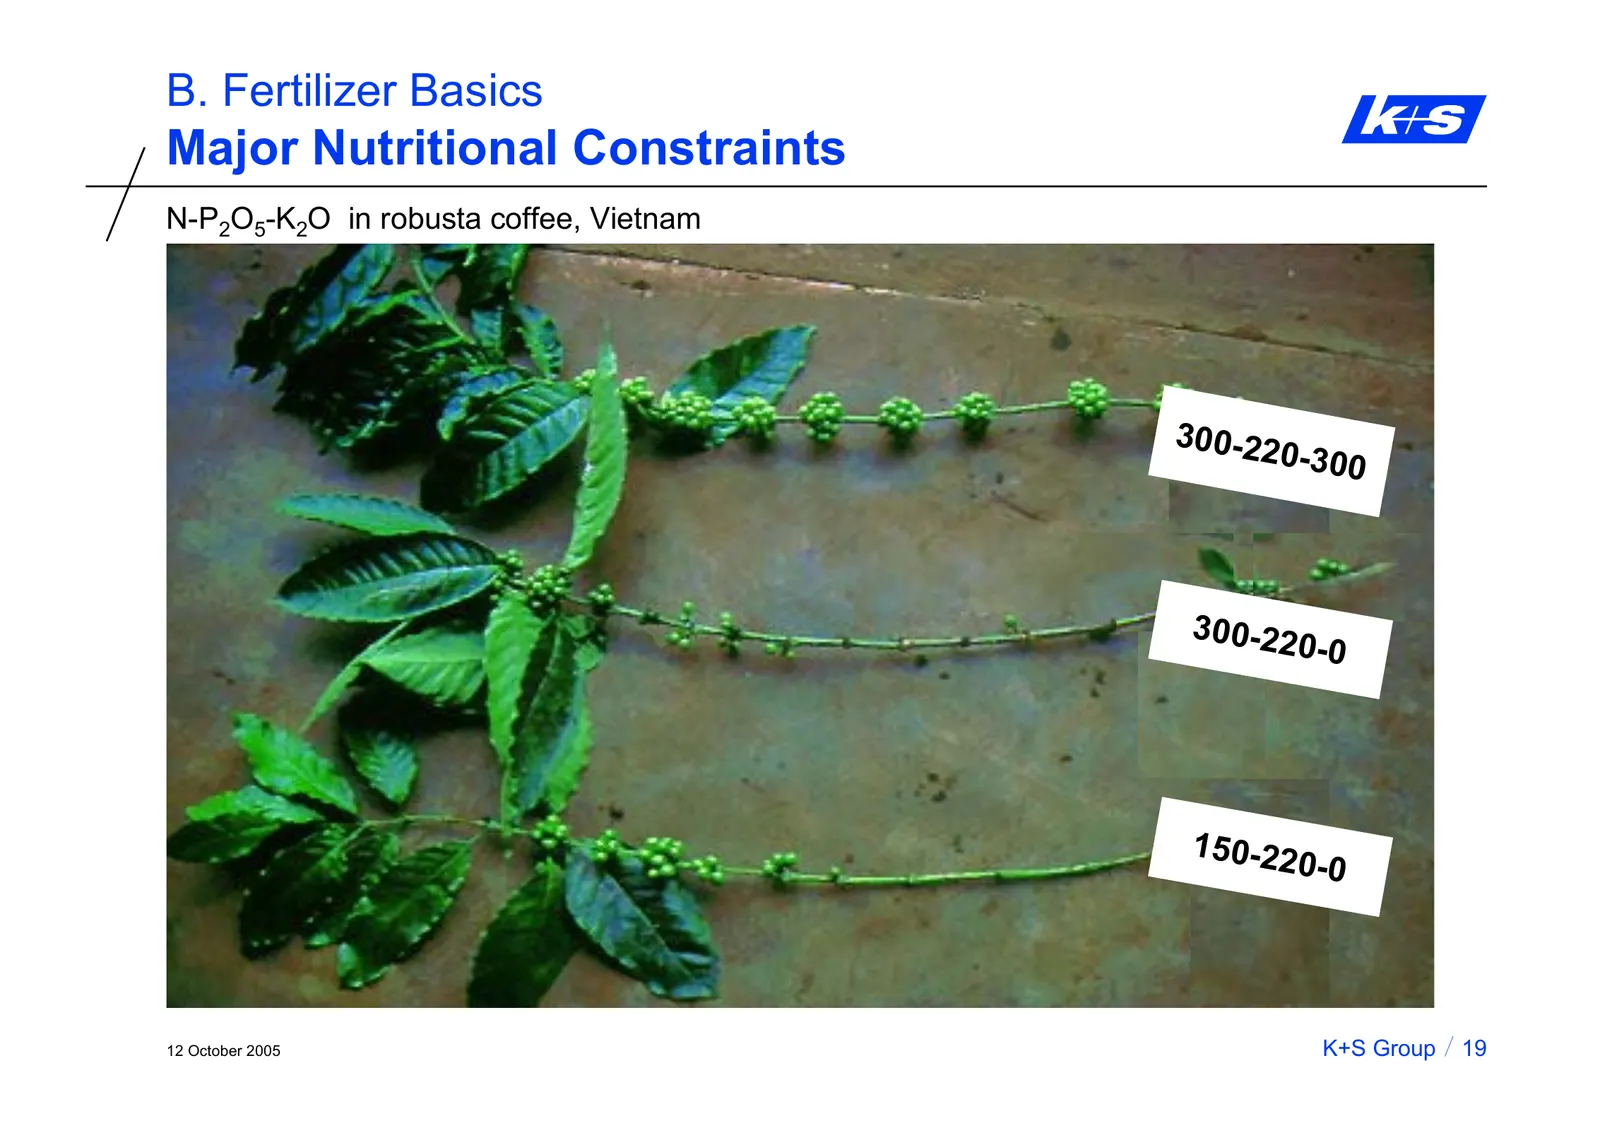
B. Fertilizer Basics Major Nutritional Constraints N-P2O5-K2O in robusta coffee, Vietnam 300-22 0-300 300-22 0 -0 150-22 0-0 12 October 2005 K+S Group 19
Slide 21: Content
K+S Analysts‘ Day 2005 Content A. Global Trends B. Fertilizer Basics C. Efficiency Benefits of Balanced Fertilization - Nitrogen Efficiency - Resistance . Diseases . Salt Stress - Water Use Efficiency - CO2 Efficiency D. Outlook - Rising Quality Demands - Industrial Crops - Agricultural Challenges i
Slide 22: Nitrogen Efficiency
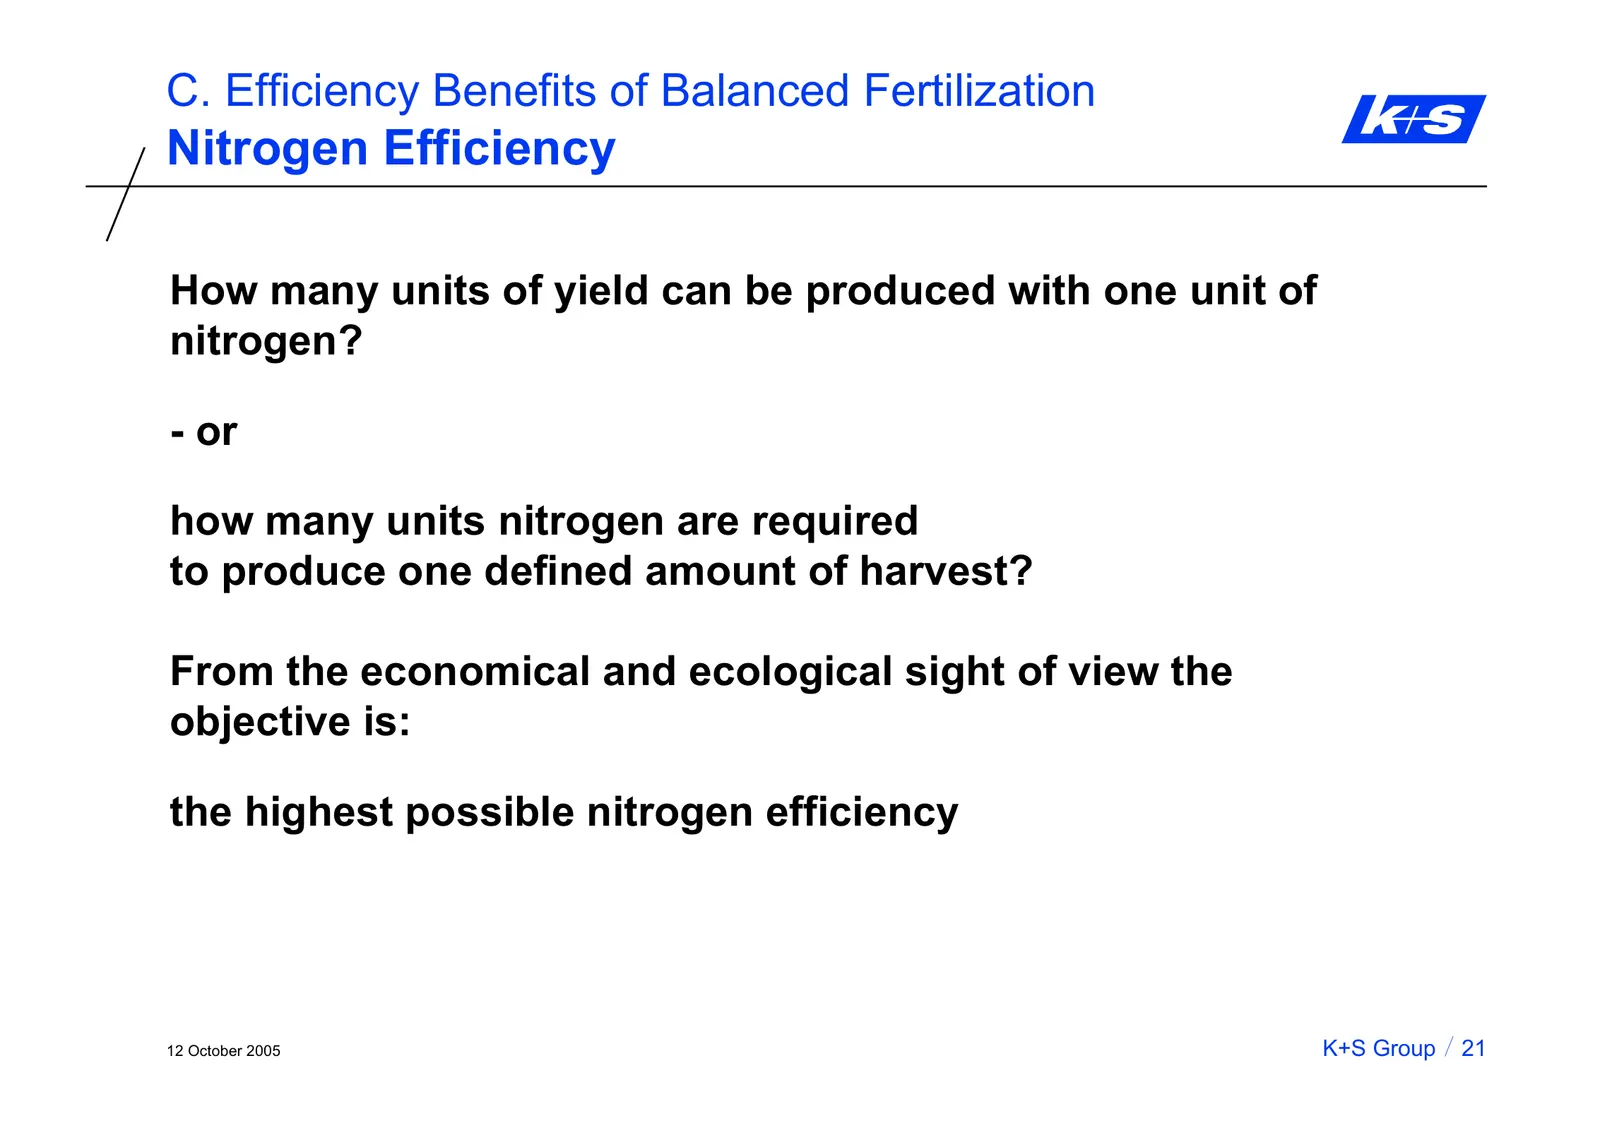
C. Efficiency Benefits of Balanced Fertilization Nitrogen Efficiency How many units of yield can be produced with one unit of nitrogen? - or how many units nitrogen are required to produce one defined amount of harvest? From the economical and ecological sight of view the objective is: the highest p
Slide 23: Causes for a Bad Nitrogen Efficiency
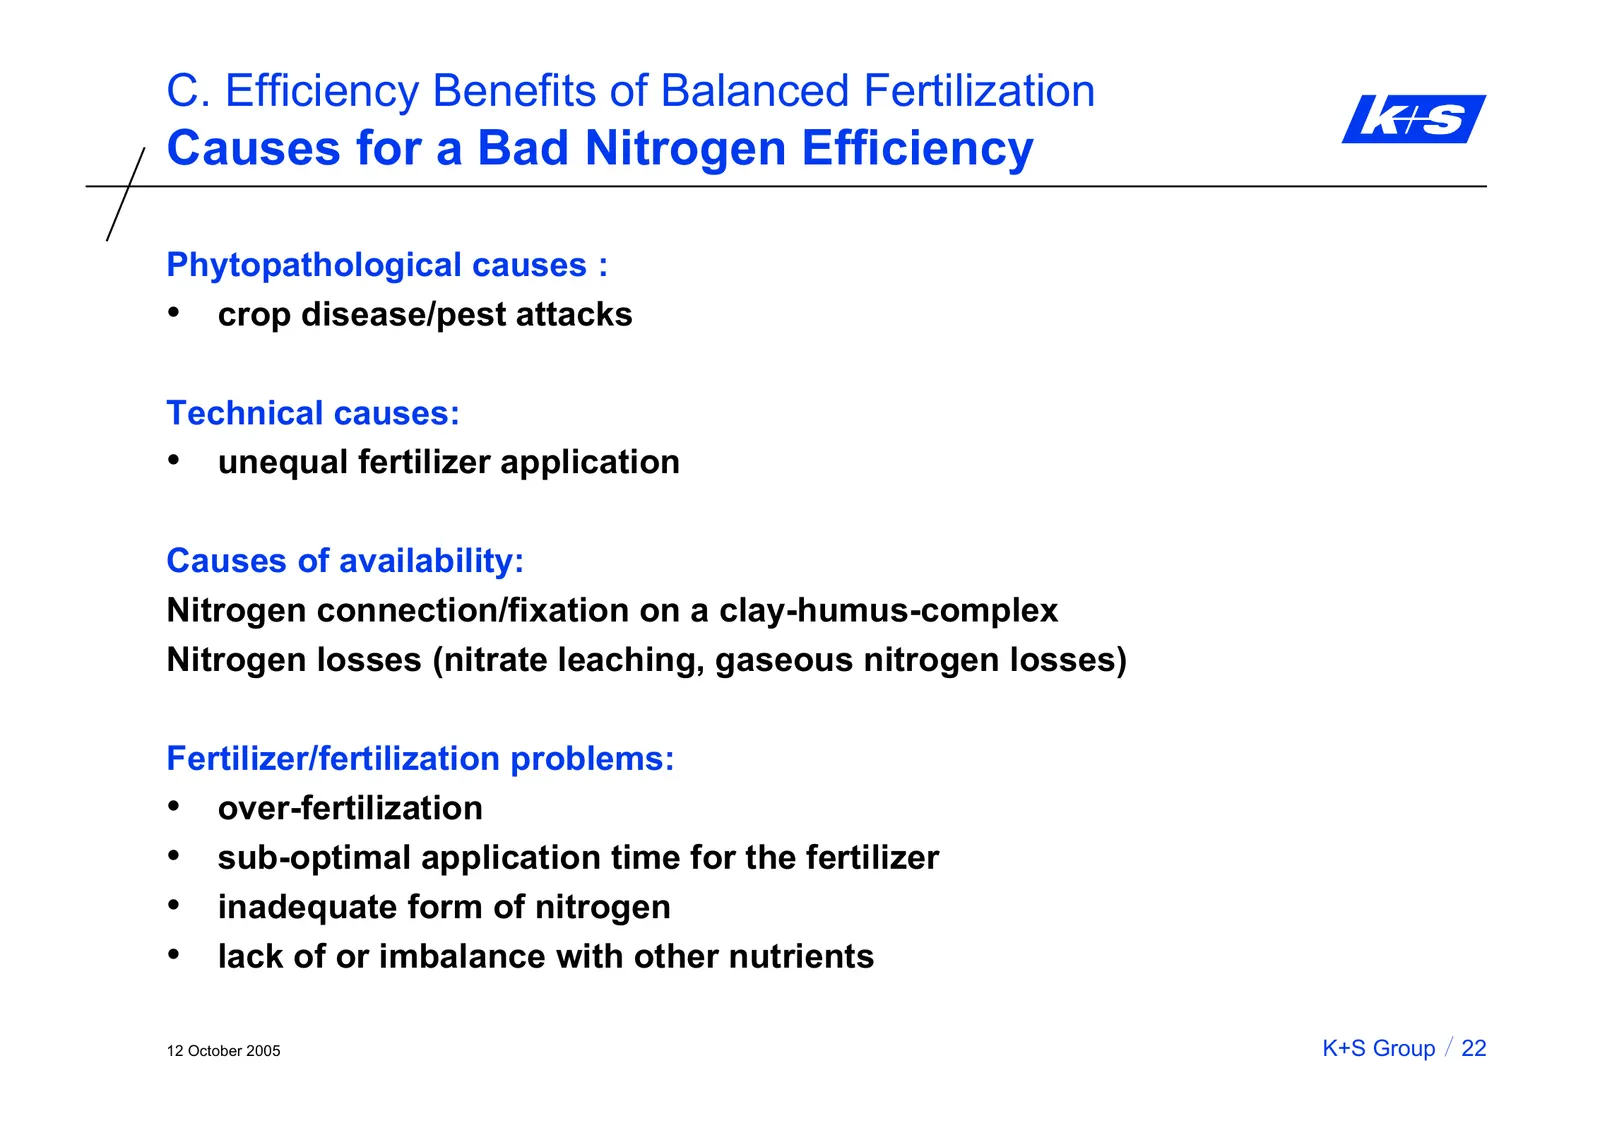
C. Efficiency Benefits of Balanced Fertilization Causes for a Bad Nitrogen Efficiency Phytopathological causes : • crop disease/pest attacks Technical causes: • unequal fertilizer application Causes of availability: Nitrogen connection/fixation on a clay-humus-complex Nitrogen losses (nitrate leachi
Slide 24: Effect of Potash and Magnesium Fertilization on Nitrogen Uptake
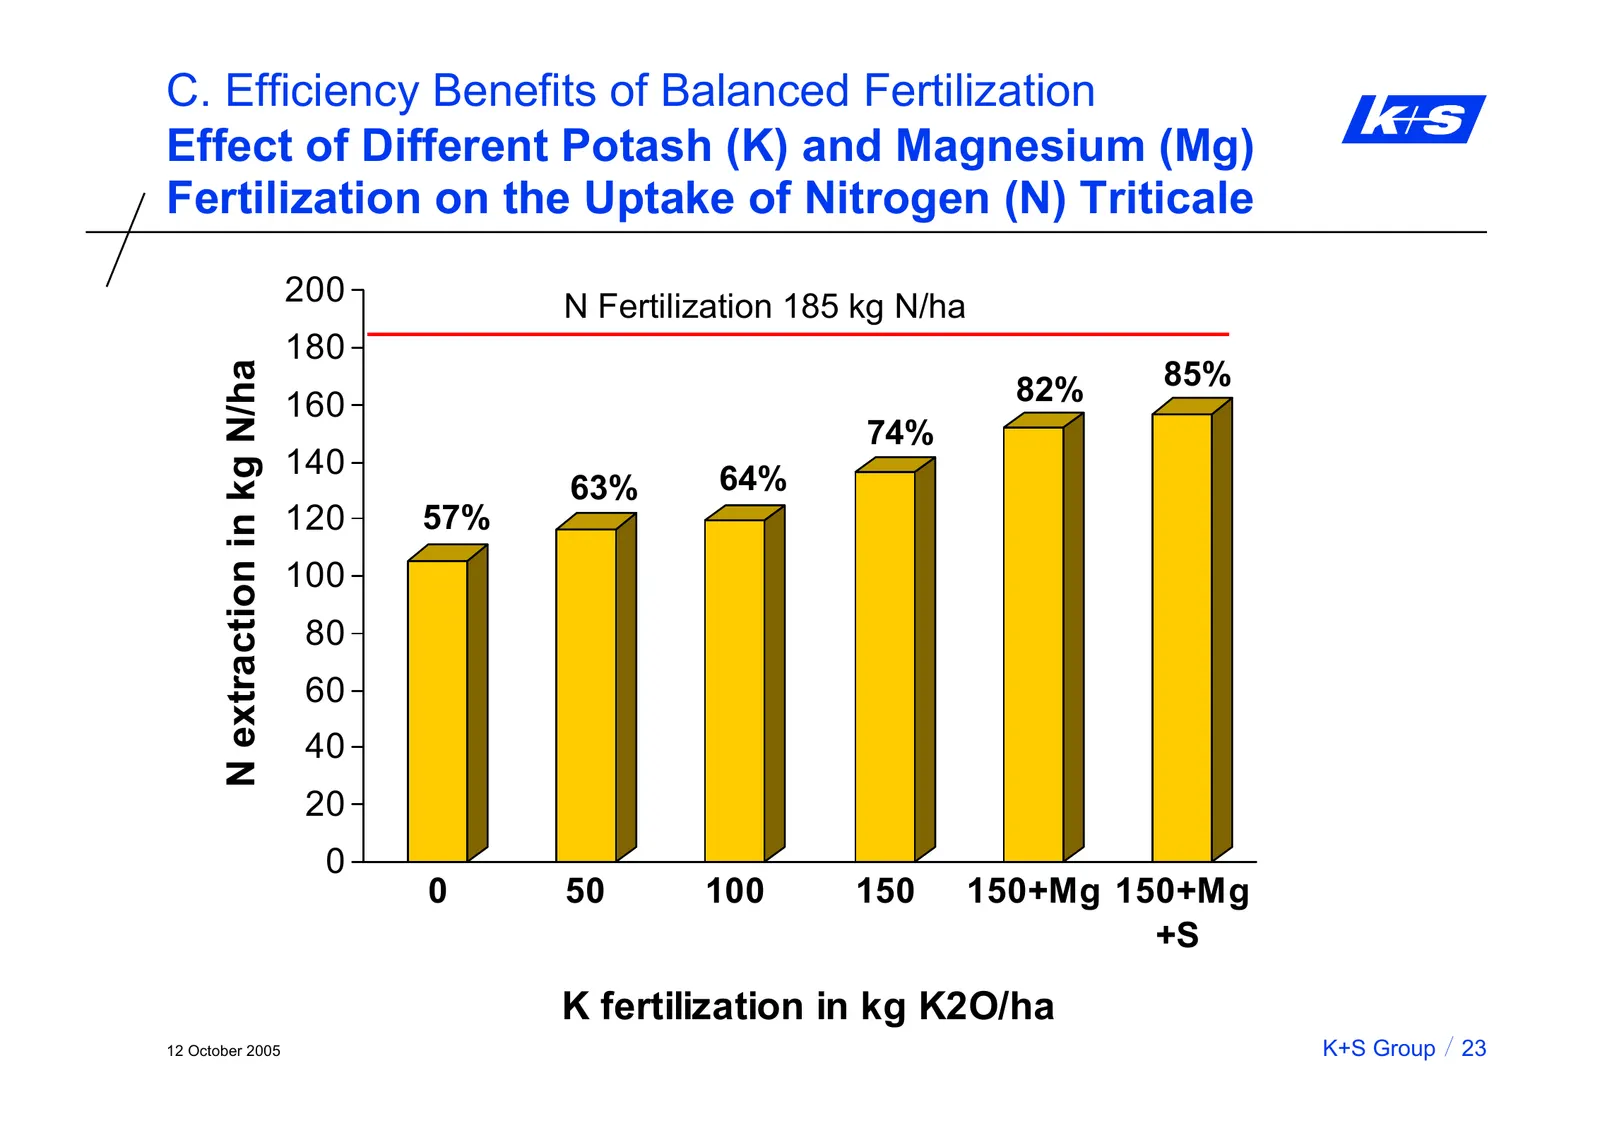
C. Efficiency Benefits of Balanced Fertilization Effect of Different Potash (K) and Magnesium (Mg) Fertilization on the Uptake of Nitrogen (N) Triticale 200 N Fertilization 185 kg N/ha 180 85% N extraction in kg N/ha 160 82% 74% 140 64% 63% 120 57% 100 80 60 40 20 0 0 50 100 150 150+Mg 150+Mg +S K f
Slide 25: ENTEC - Principle System
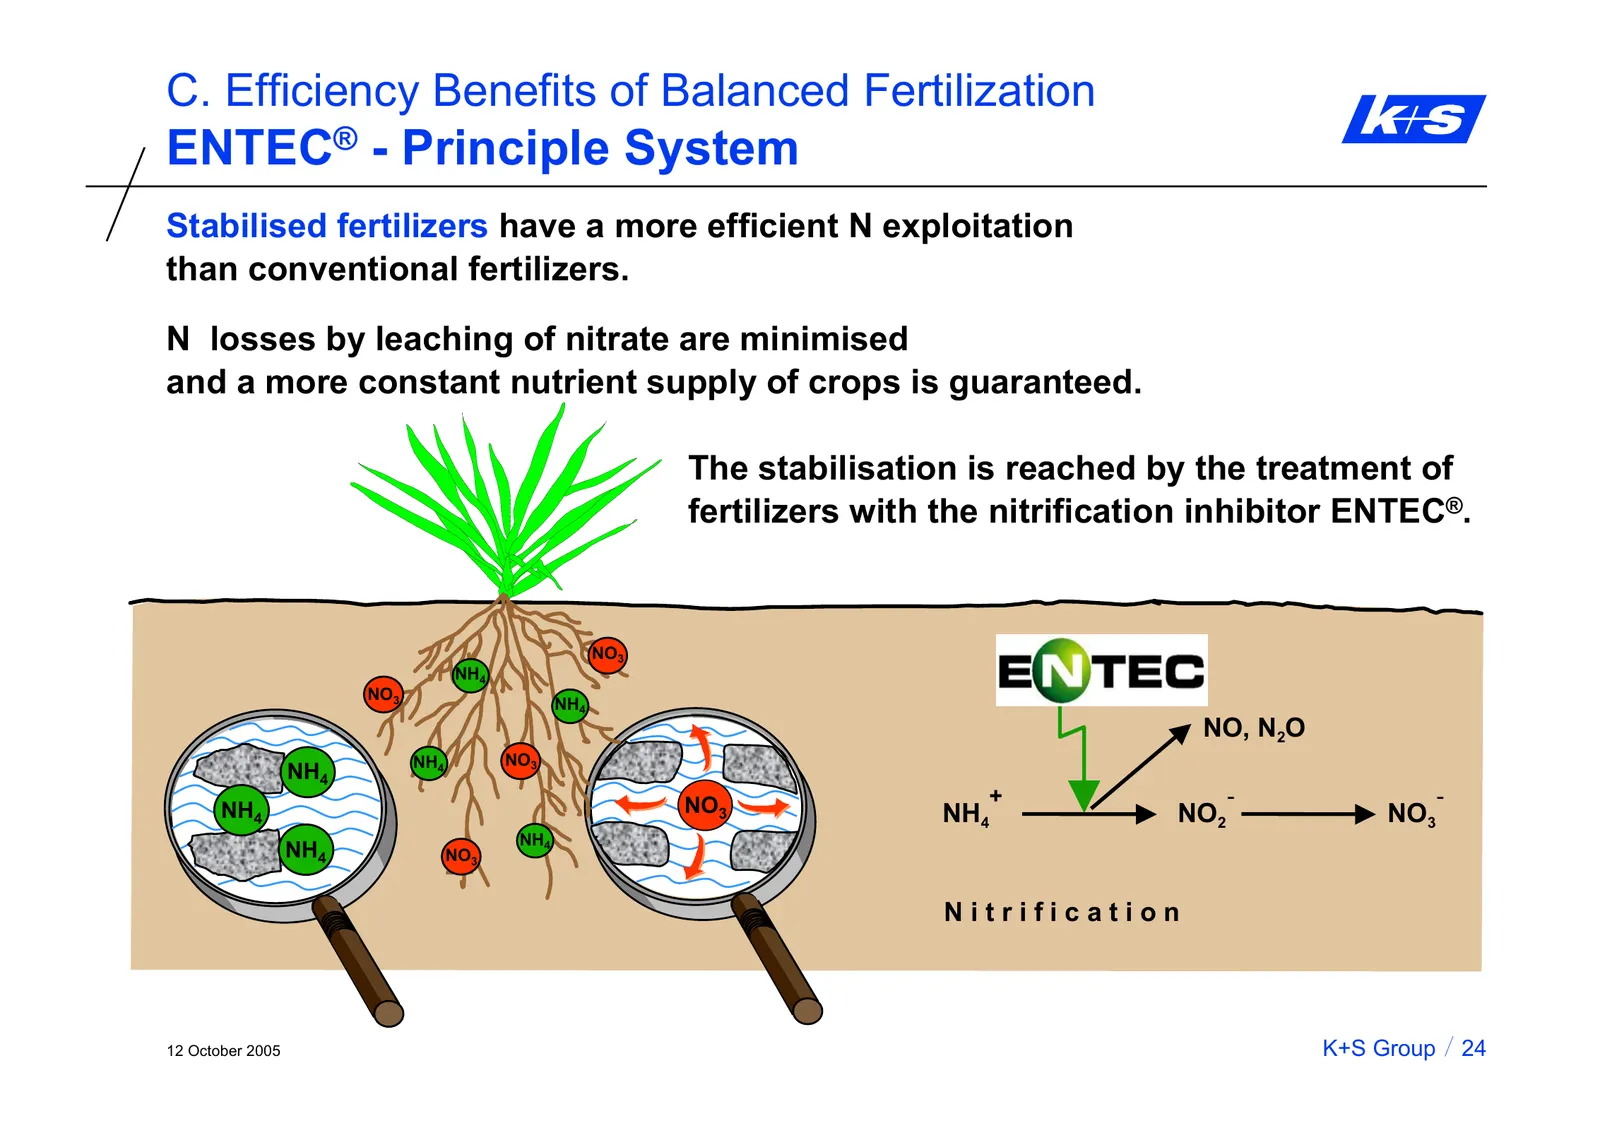
C. Efficiency Benefits of Balanced Fertilization ENTEC® - Principle System Stabilised fertilizers have a more efficient N exploitation than conventional fertilizers. N losses by leaching of nitrate are minimised and a more constant nutrient supply of crops is guaranteed. The stabilisation is reached
Slide 26: Use the Form of Nitrogen with the Highest Efficiency
C. Efficiency Benefits of Balanced Fertilization It is Recommended to Use the Form of Nitrogen with the Highest Efficiency! Advantages of nitrification inhibitors Î reduce the risk of nitrate leaching Î reduce the N2O emission Î often increase the yield - leaves more dark green - suppressed growth Î
Slide 27: Influence of Potash Rates on Resistance of Winter Barley against Powdery Mildew
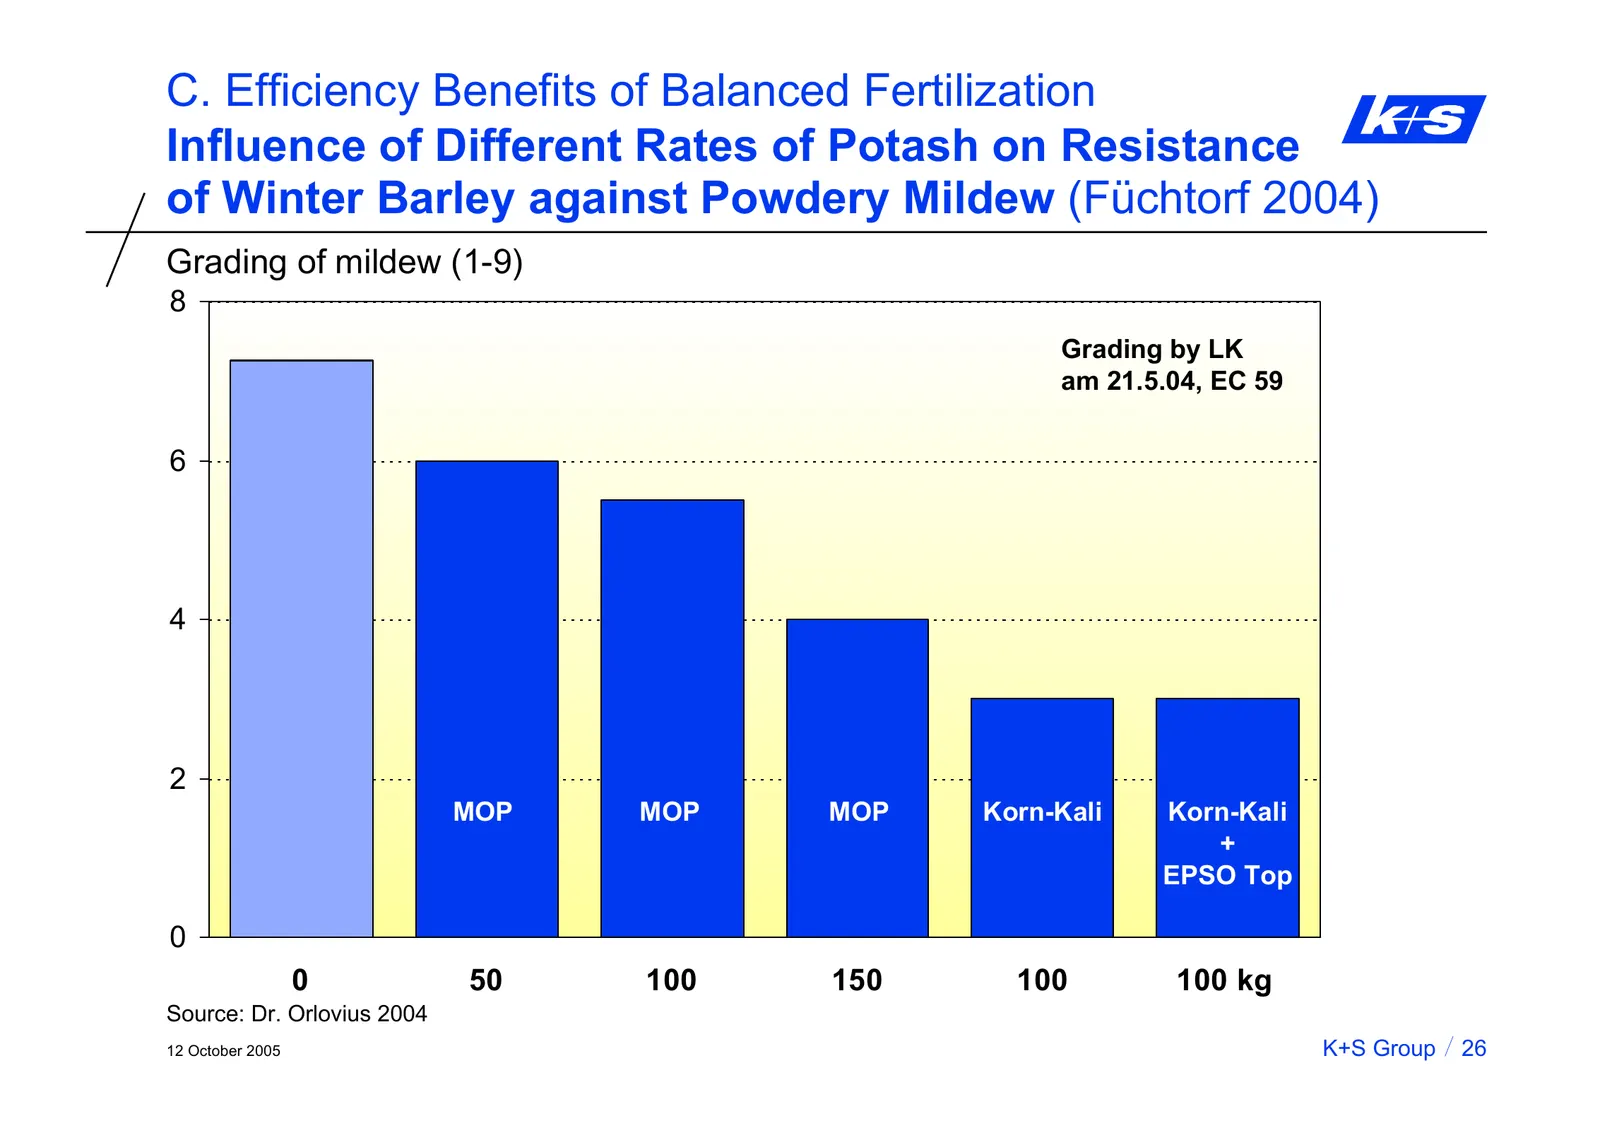
C. Efficiency Benefits of Balanced Fertilization Influence of Different Rates of Potash on Resistance of Winter Barley against Powdery Mildew (Füchtorf 2004) Grading of mildew (1-9) 8 Grading by LK am 21.5.04, EC 59 6 4 2 MOP MOP MOP Korn-Kali Korn-Kali + EPSO Top 0 0 50 100 150 100 100 kg Source: D
Slide 28: Effect of Potash Rates on Resistance against Disease in Barley
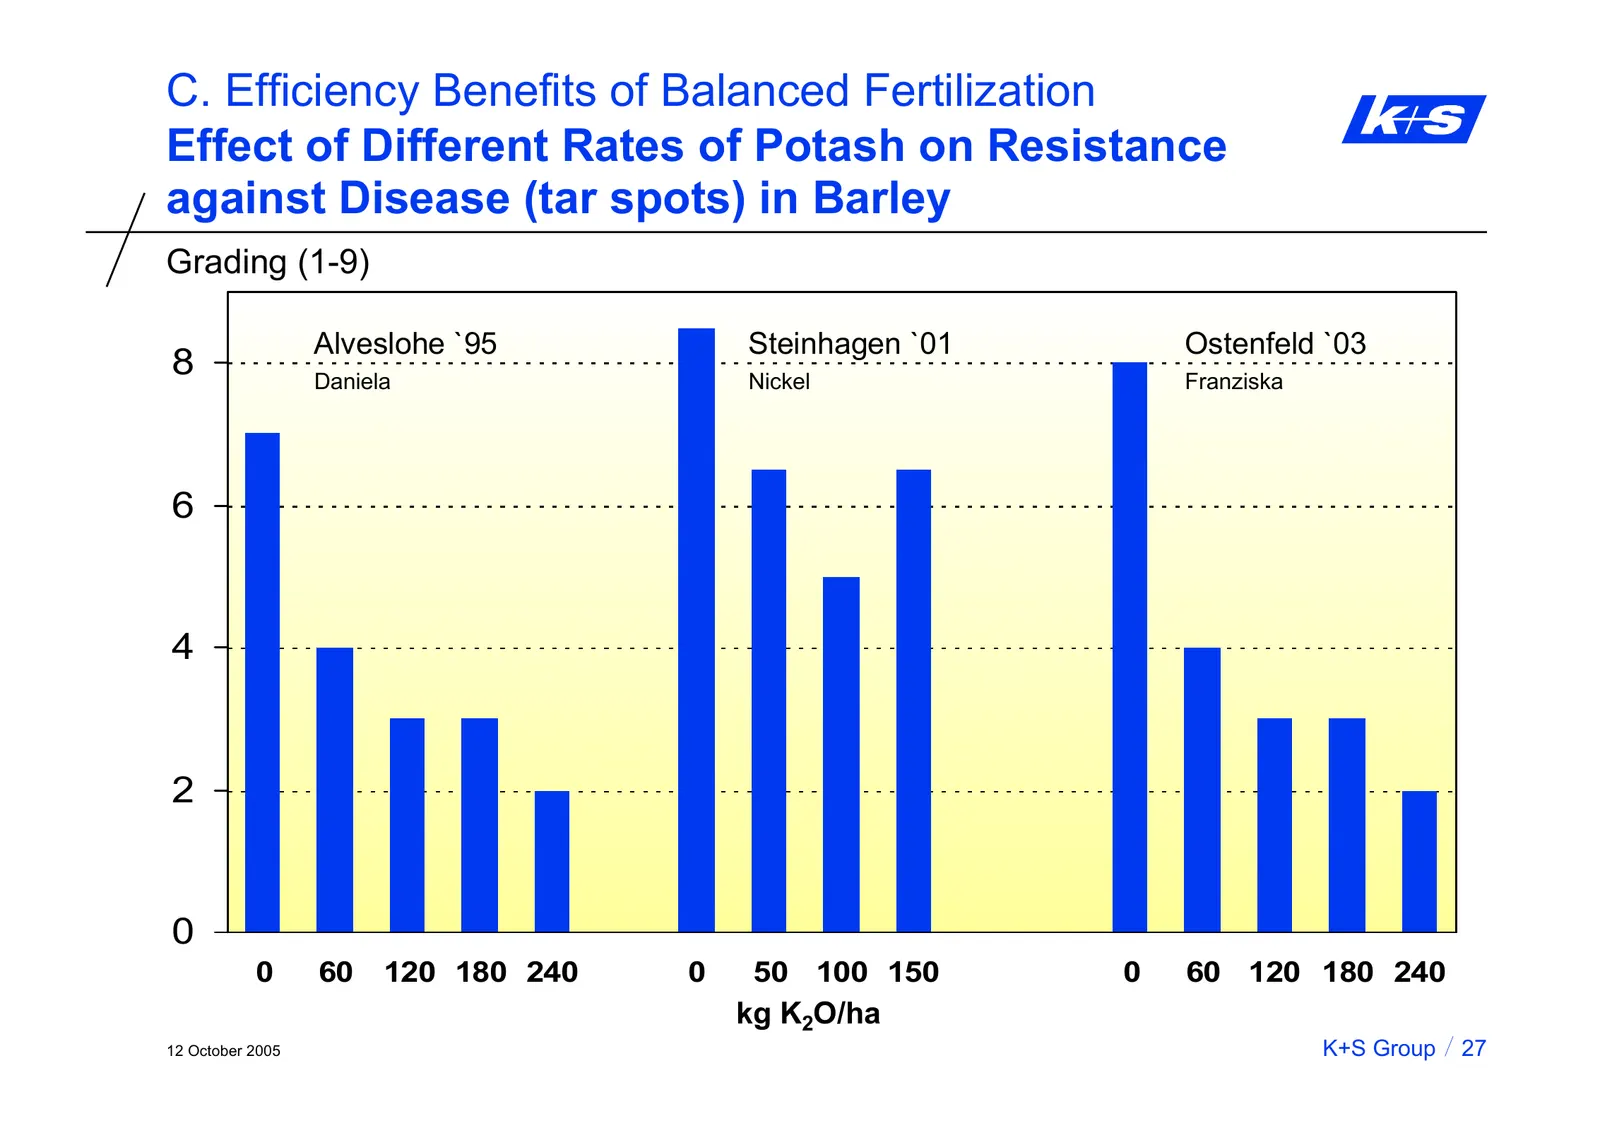
C. Efficiency Benefits of Balanced Fertilization Effect of Different Rates of Potash on Resistance against Disease (tar spots) in Barley Grading (1-9) Alveslohe `95 Steinhagen `01 Ostenfeld `03 8 Daniela Nickel Franziska 6 4 2 0 0 60 120 180 240 0 50 100 150 0 60 120 180 240 kg K2O/ha 12 October 200
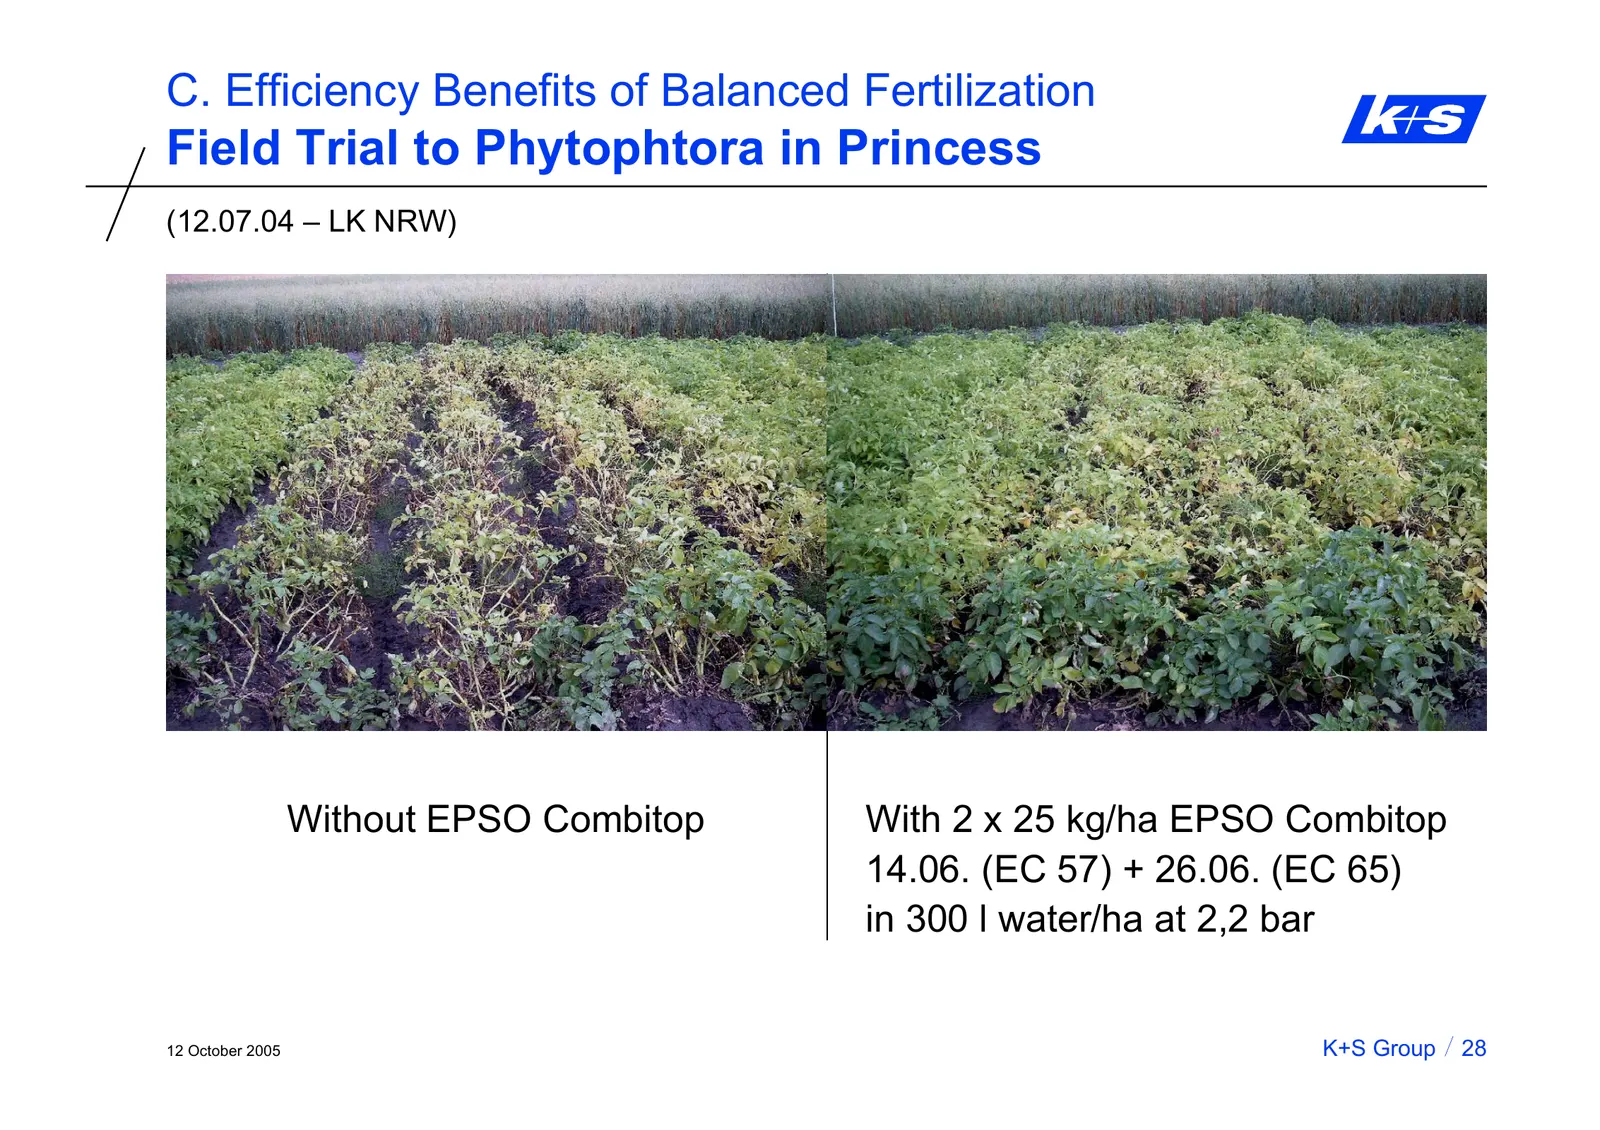
Slide 29: Field Trial to Phytophtora in Princess
C. Efficiency Benefits of Balanced Fertilization Field Trial to Phytophtora in Princess (12.07.04 – LK NRW) Without EPSO Combitop With 2 x 25 kg/ha EPSO Combitop 14.06. (EC 57) + 26.06. (EC 65) in 300 l water/ha at 2,2 bar 12 October 2005 K+S Group 28
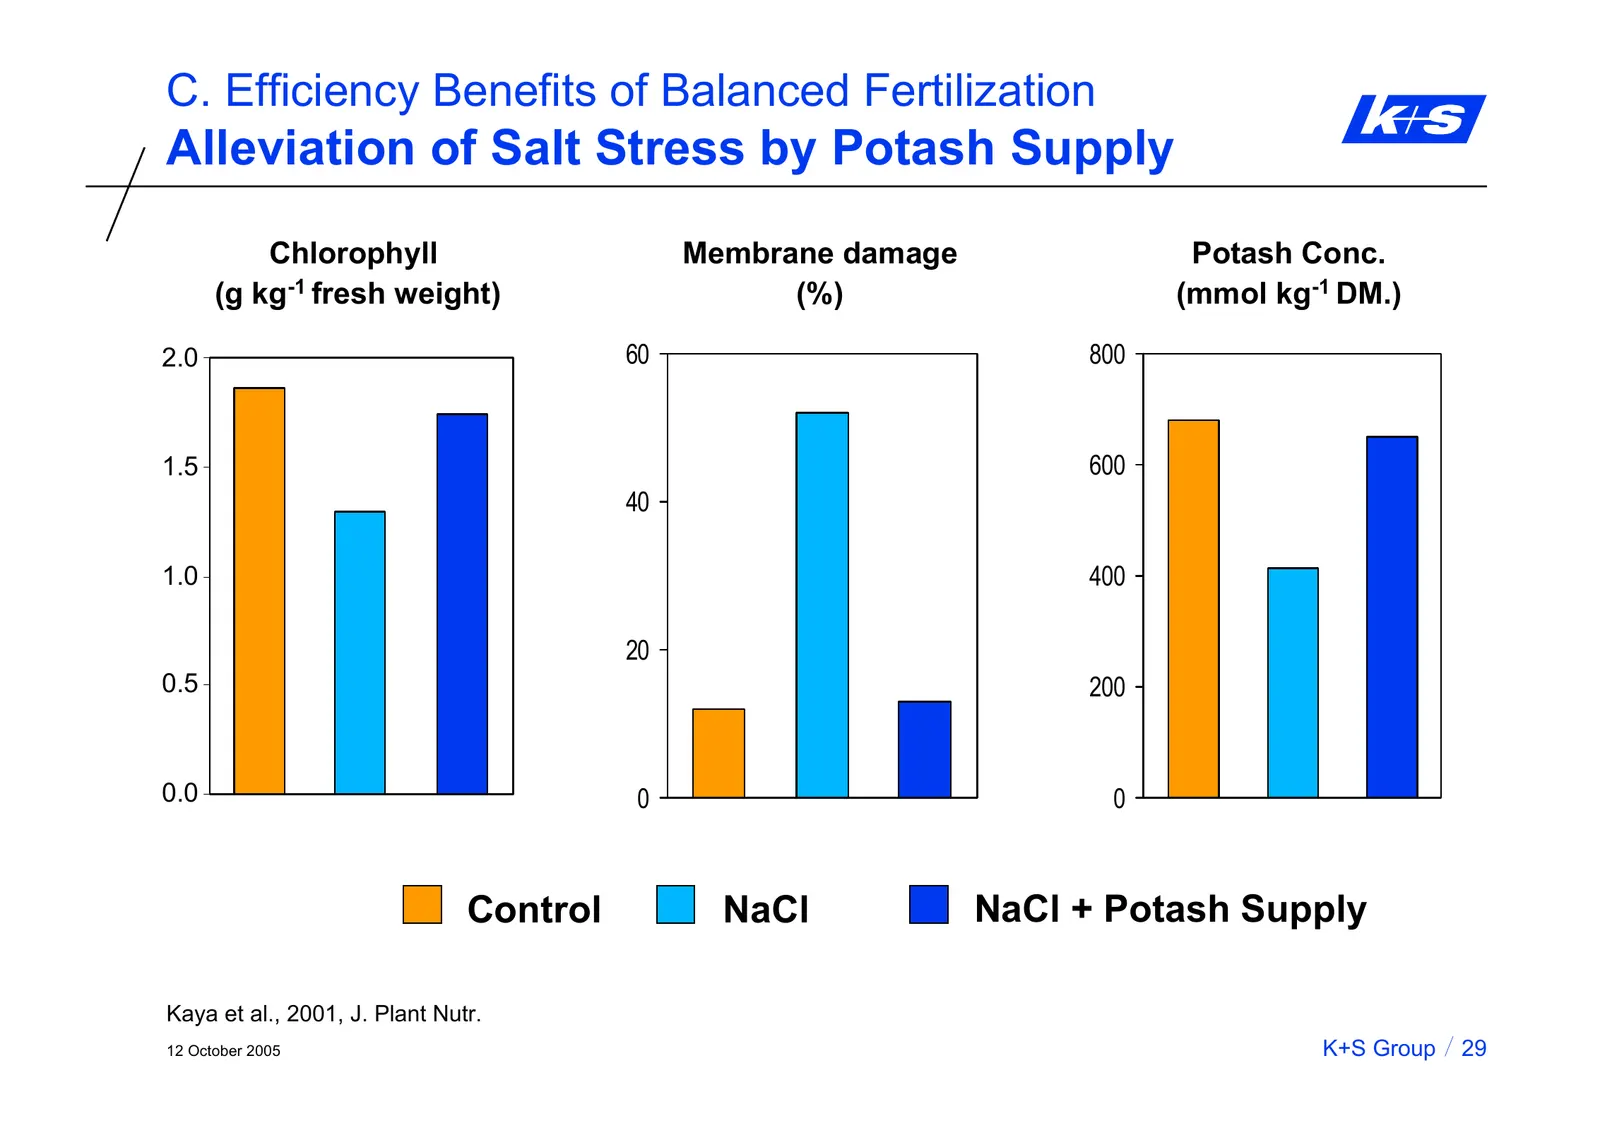
Slide 30: Alleviation of Salt Stress by Potash Supply
C. Efficiency Benefits of Balanced Fertilization Alleviation of Salt Stress by Potash Supply Chlorophyll Membrane damage Potash Conc. (g kg-1 fresh weight) (%) (mmol kg-1 DM.) 2,0 2.0 60 800 1,5 1.5 600 40 1,0 1.0 400 20 0,5 0.5 200 0,0 0.0 0 0 Control NaCl NaCl + Potash Supply Kaya et al., 2001, J.
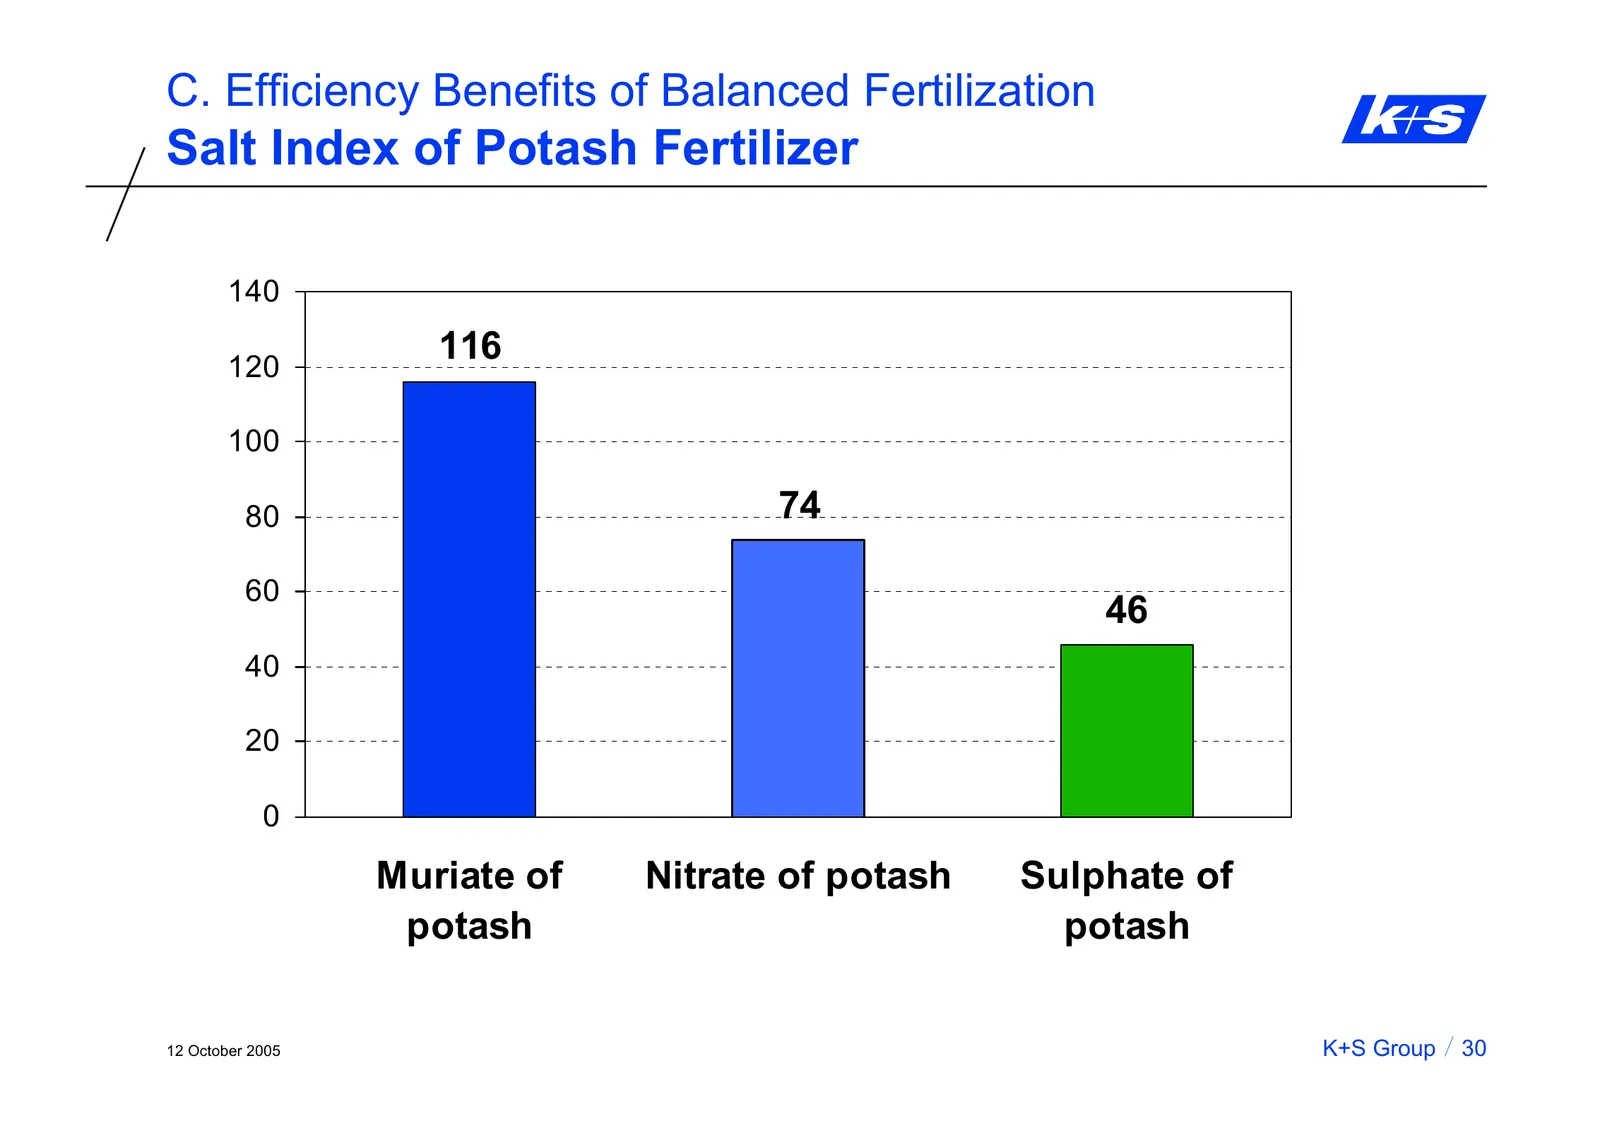
Slide 31: Salt Index of Potash Fertilizer
C. Efficiency Benefits of Balanced Fertilization Salt Index of Potash Fertilizer 140 120 116 100 80 74 60 46 40 20 0 Muriate of Nitrate of potash Sulphate of potash potash 12 October 2005 K+S Group 30
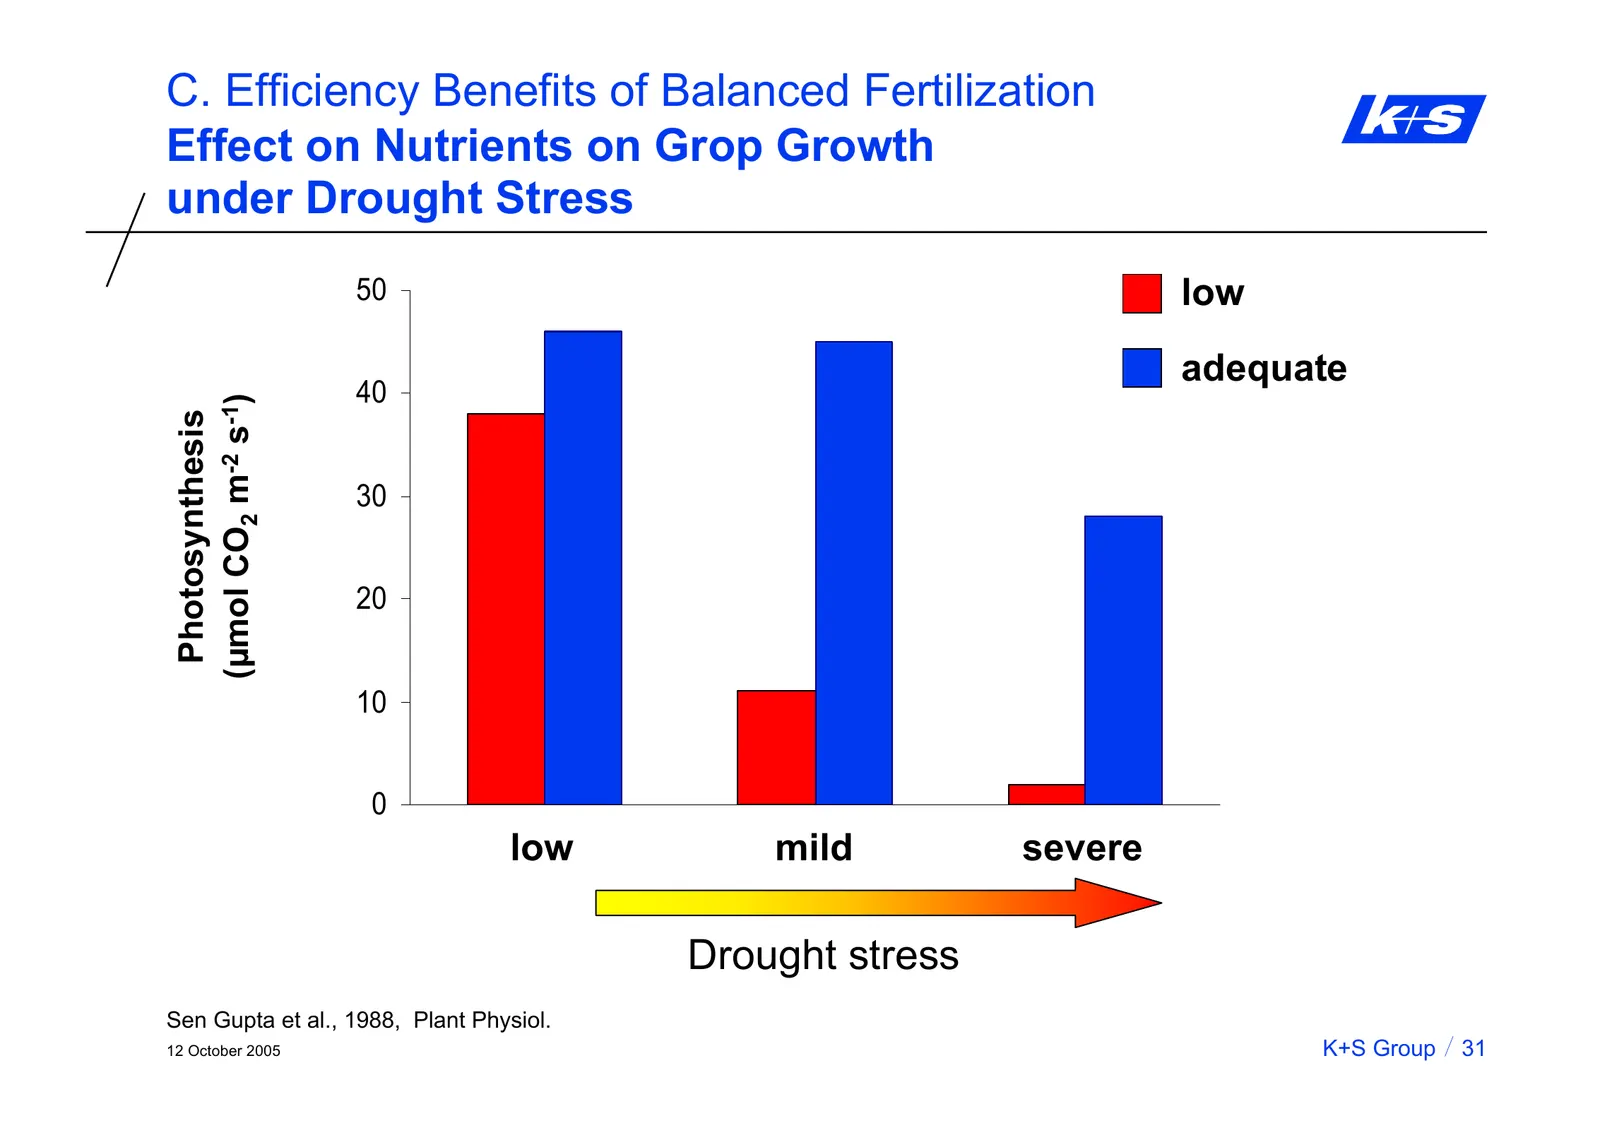
Slide 32: Effect of Nutrients on Crop Growth under Drought Stress
C. Efficiency Benefits of Balanced Fertilization Effect on Nutrients on Grop Growth under Drought Stress 50 low adequate 40 (µmol CO2 m-2 s-1) Photosynthesis 30 20 10 0 low LOW mild MILD severe SEVERE Drought stress Sen Gupta et al., 1988, Plant Physiol. 12 October 2005 K+S Group 31
Slide 33: Effect of Potash on Exploitable Field Capacity
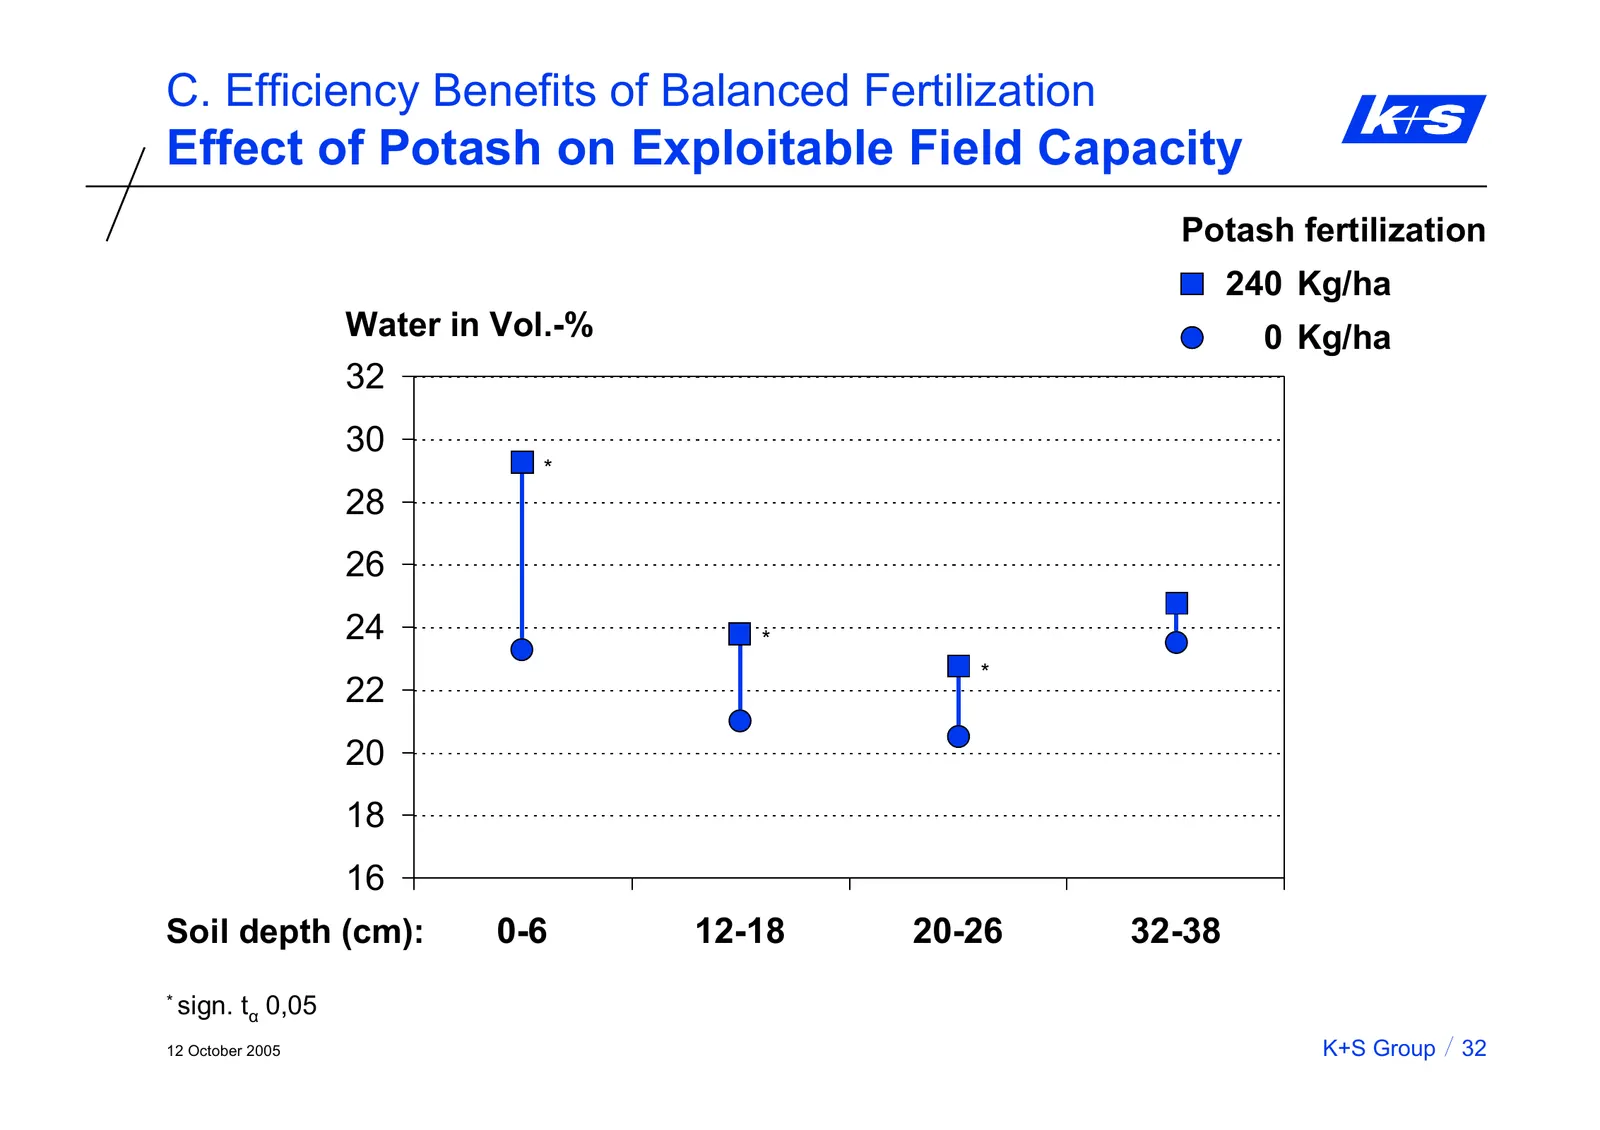
C. Efficiency Benefits of Balanced Fertilization Effect of Potash on Exploitable Field Capacity Potash fertilization 240 Kg/ha Water in Vol.-% 0 Kg/ha 32 30 * 28 26 24 * * 22 20 18 16 Soil depth (cm): 0-6 12-18 20-26 32-38 * sign. t α 0,05 12 October 2005 K+S Group 32
Slide 34: Photosynthesis and Potassium
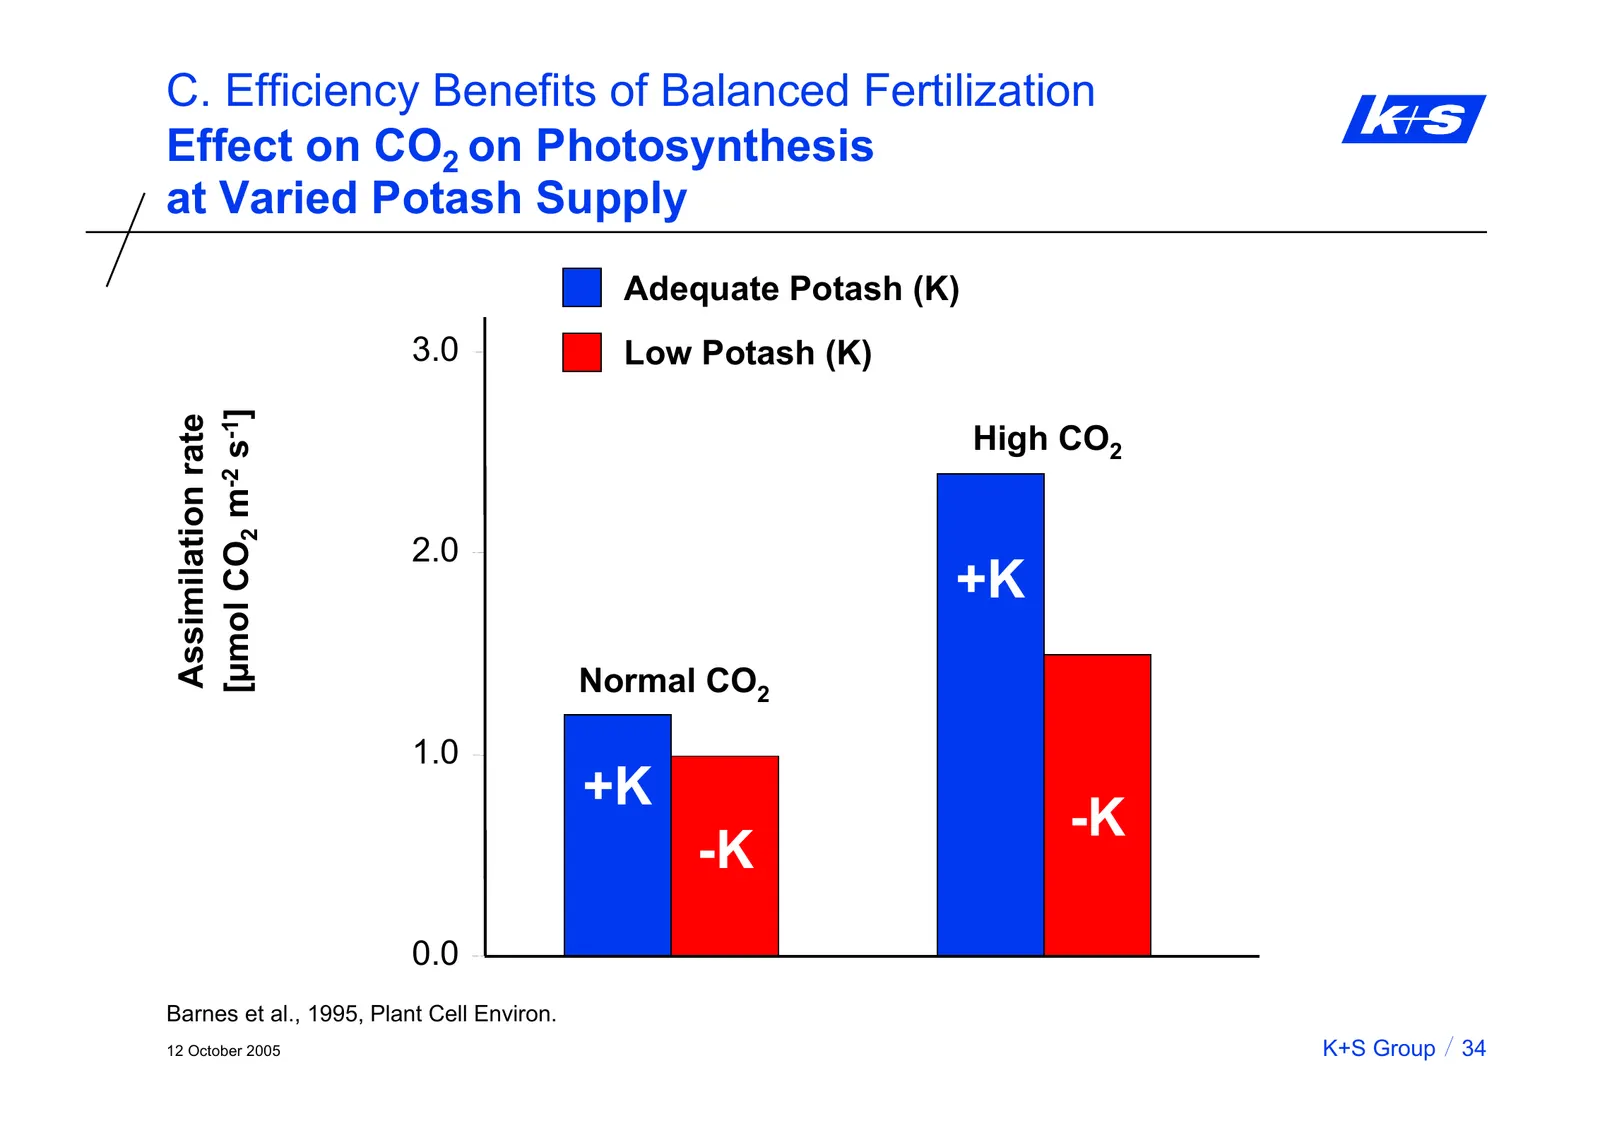
C. Efficiency Benefits of Balanced Fertilization Photosynthesis and Potassium Potassium plays a central role in maintenance of photosynthesis and related process. Decreases in photosynthesis with potash deficiency becomes more distinct when plants are exposed to elevated CO2 concentrations Enhanced
Slide 35: Effect of CO2 on Photosynthesis at Varied Potash Supply
C. Efficiency Benefits of Balanced Fertilization Effect on CO2 on Photosynthesis at Varied Potash Supply Adequate Potash (K) 3.0 Low Potash (K) [µmol CO2 m-2 s-1] Assimilation rate High CO2 2.0 +K Normal CO2 1.0 +K -K -K 0.0 Barnes et al., 1995, Plant Cell Environ. 12 October 2005 K+S Group 34
Slide 36: Plant Reaction under Stress
C. Efficiency Benefits of Balanced Fertilization Plant Reaction under Stress Plants suffering from environmental stress factors such as drought and salinity have large requirement for fertilizer, particularly potash and magnesium 12 October 2005 K+S Group 35
Slide 37: Content
K+S Analysts‘ Day 2005 Content A. Global Trends B. Fertilizer Basics C. Efficiency Benefits of Balanced Fertilization - Nitrogen Efficiency - Resistance . Diseases . Salt Stress - Water Use Efficiency - CO2 Efficiency D. Outlook - Rising Quality Demands - Industrial Crops - Agricultural Challenges i
Slide 38: Potash Supply and Black Spot Incidence in Potato
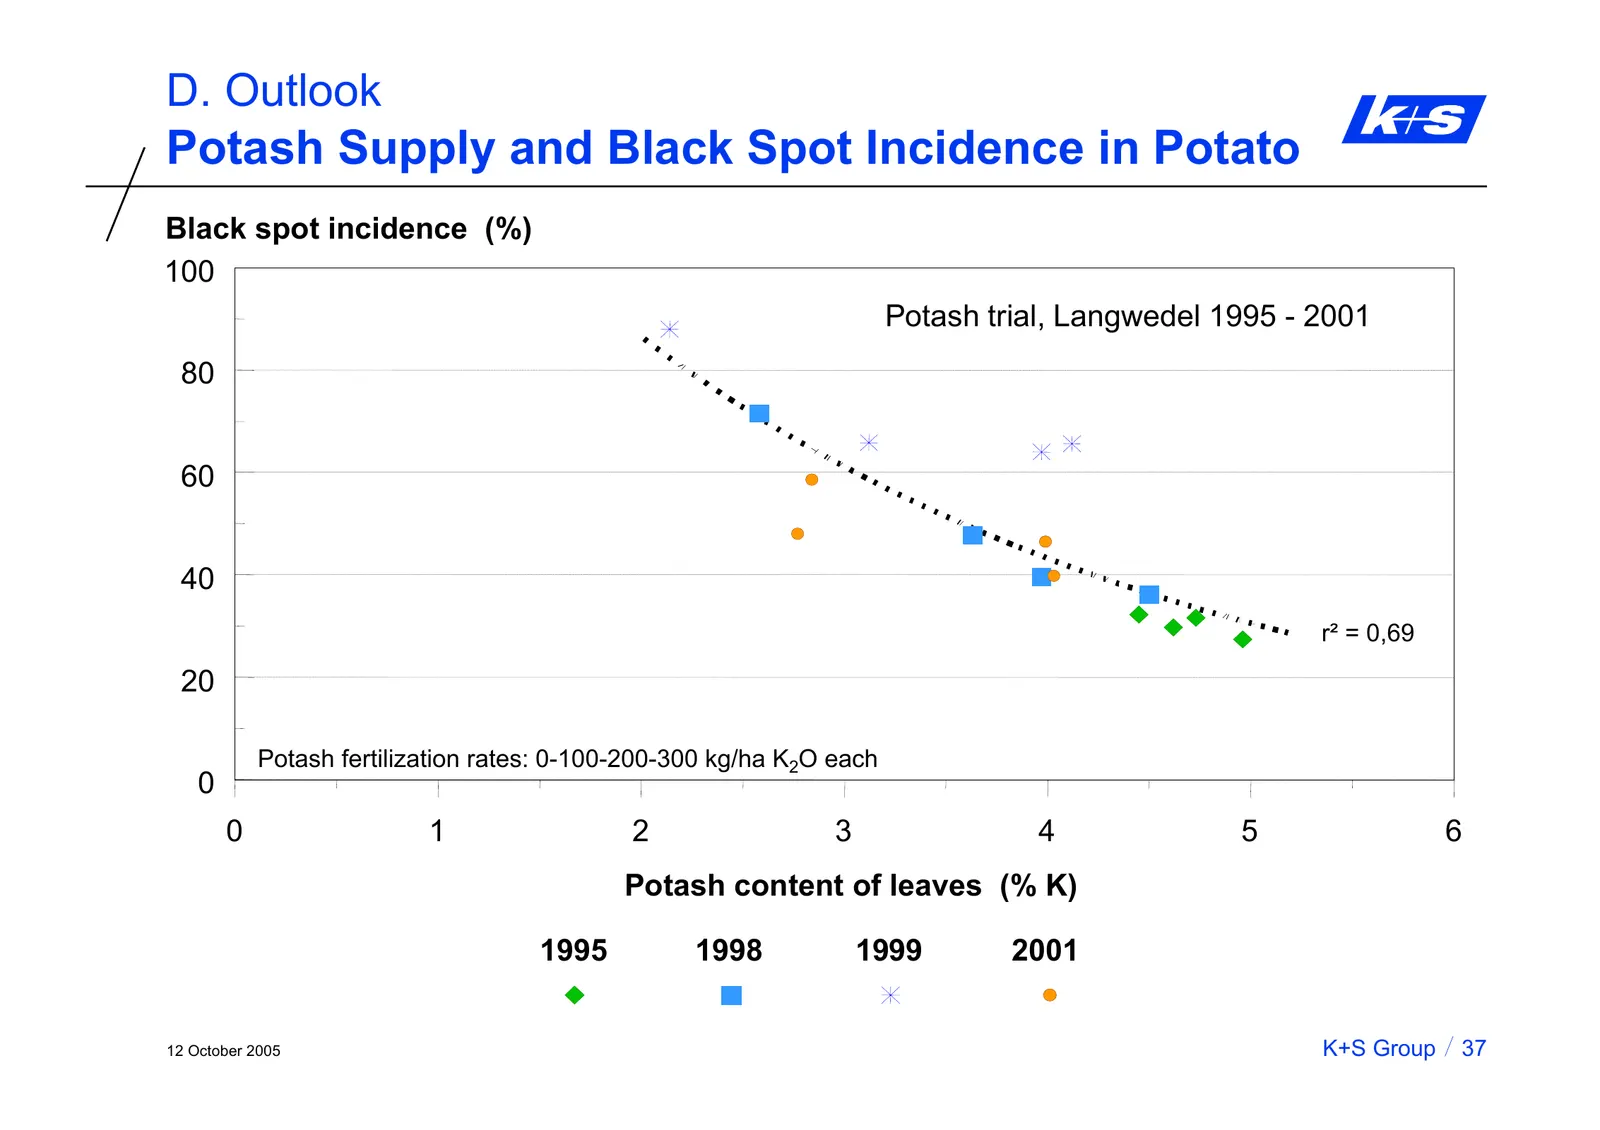
D. Outlook Potash Supply and Black Spot Incidence in Potato Black spot incidence (%) 100 Potash trial, Langwedel 1995 - 2001 80 60 40 r² = 0,69 20 Potash fertilization rates: 0-100-200-300 kg/ha K2O each 0 0 1 2 3 4 5 6 Potash content of leaves (% K) 1995 1998 1999 2001 12 October 2005 K+S Group 37
Slide 39: Effect of Potash Fertilizers on Capsiacin Content of Chilli
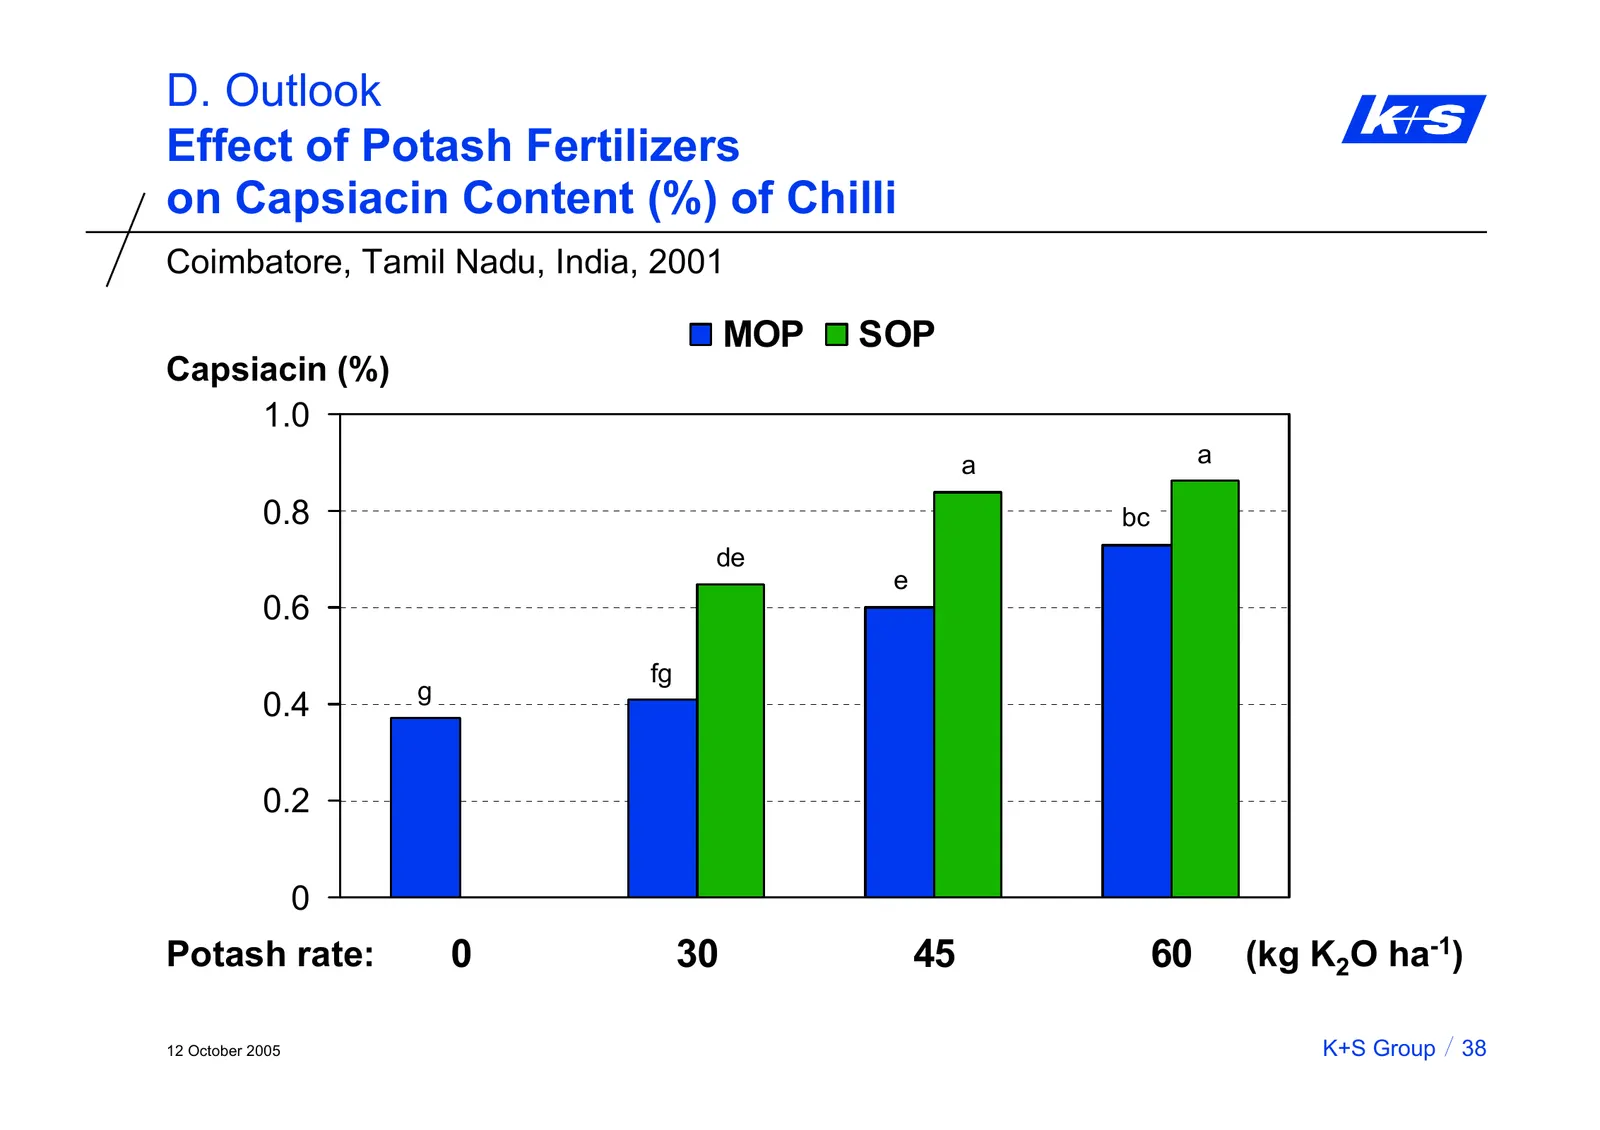
D. Outlook Effect of Potash Fertilizers on Capsiacin Content (%) of Chilli Coimbatore, Tamil Nadu, India, 2001 MOP SOP Capsiacin (%) 1 1.0 a a 0,8 0.8 bc de e 0,6 0.6 fg g 0,4 0.4 0,2 0.2 0 Potash rate: 0 30 45 60 (kg K2O ha-1) 12 October 2005 K+S Group 38
Slide 40: Effect of Potash Sources on Chilli
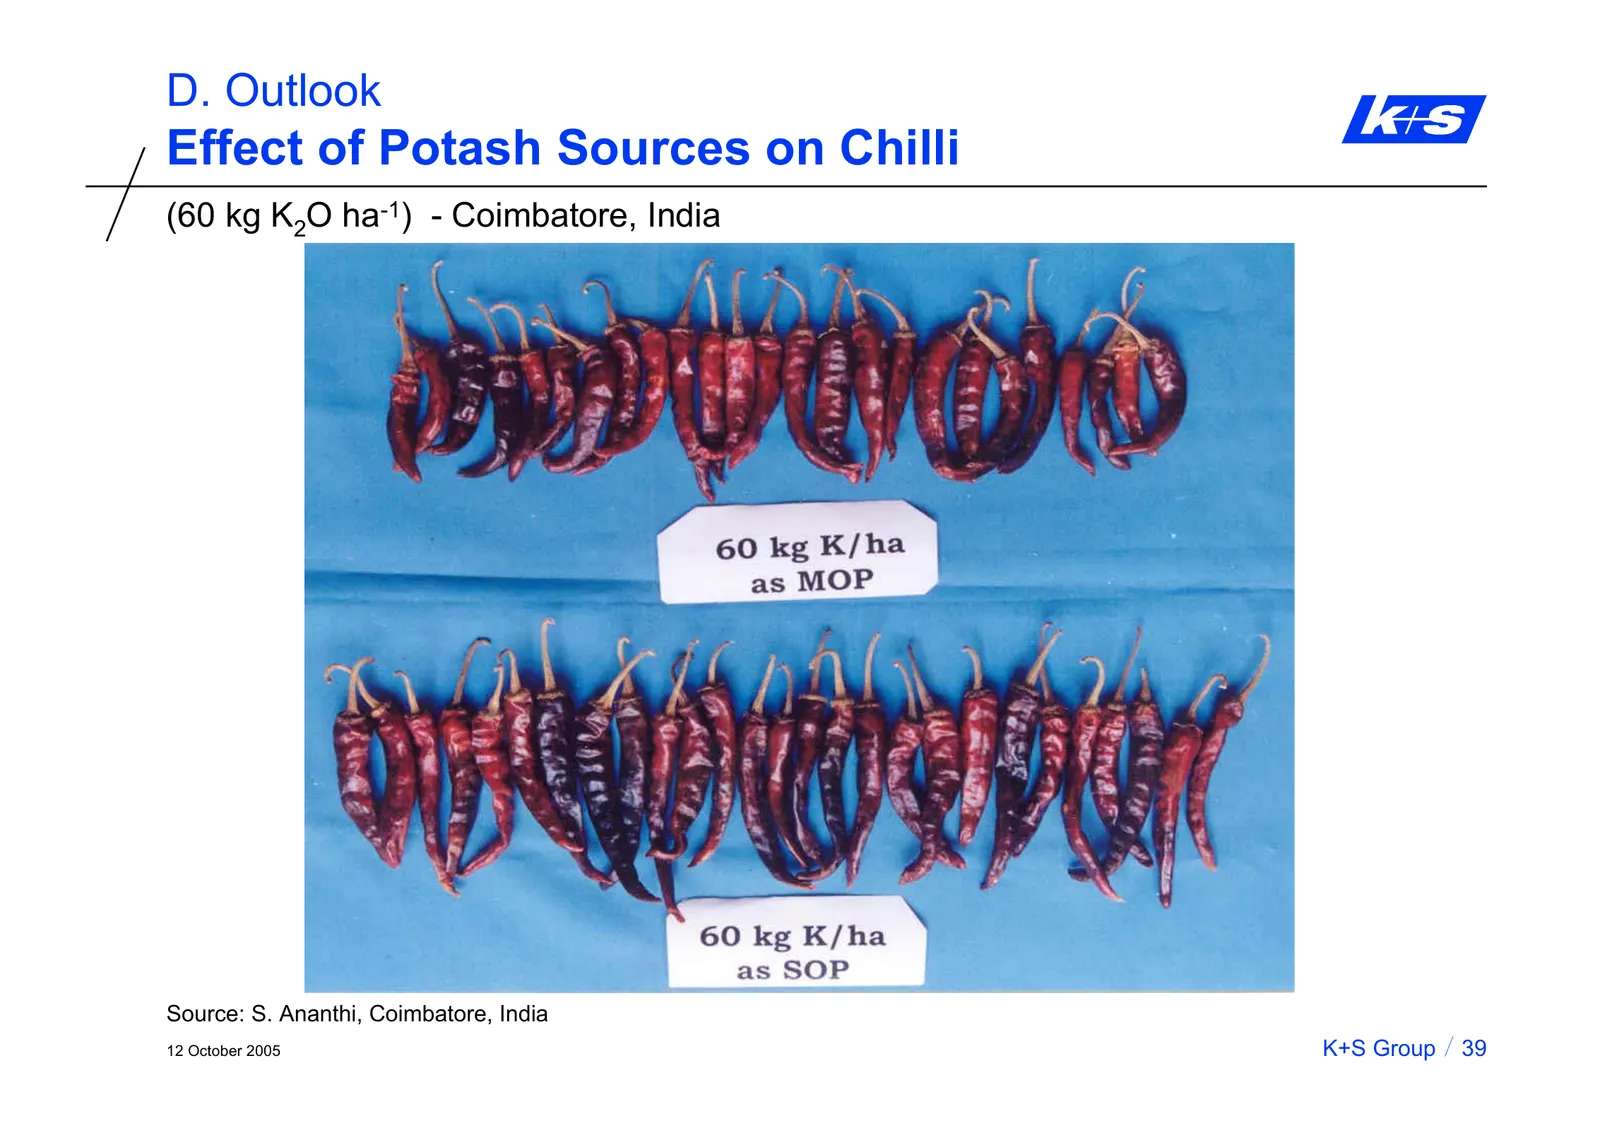
D. Outlook Effect of Potash Sources on Chilli (60 kg K2O ha-1) - Coimbatore, India Source: S. Ananthi, Coimbatore, India 12 October 2005 K+S Group 39
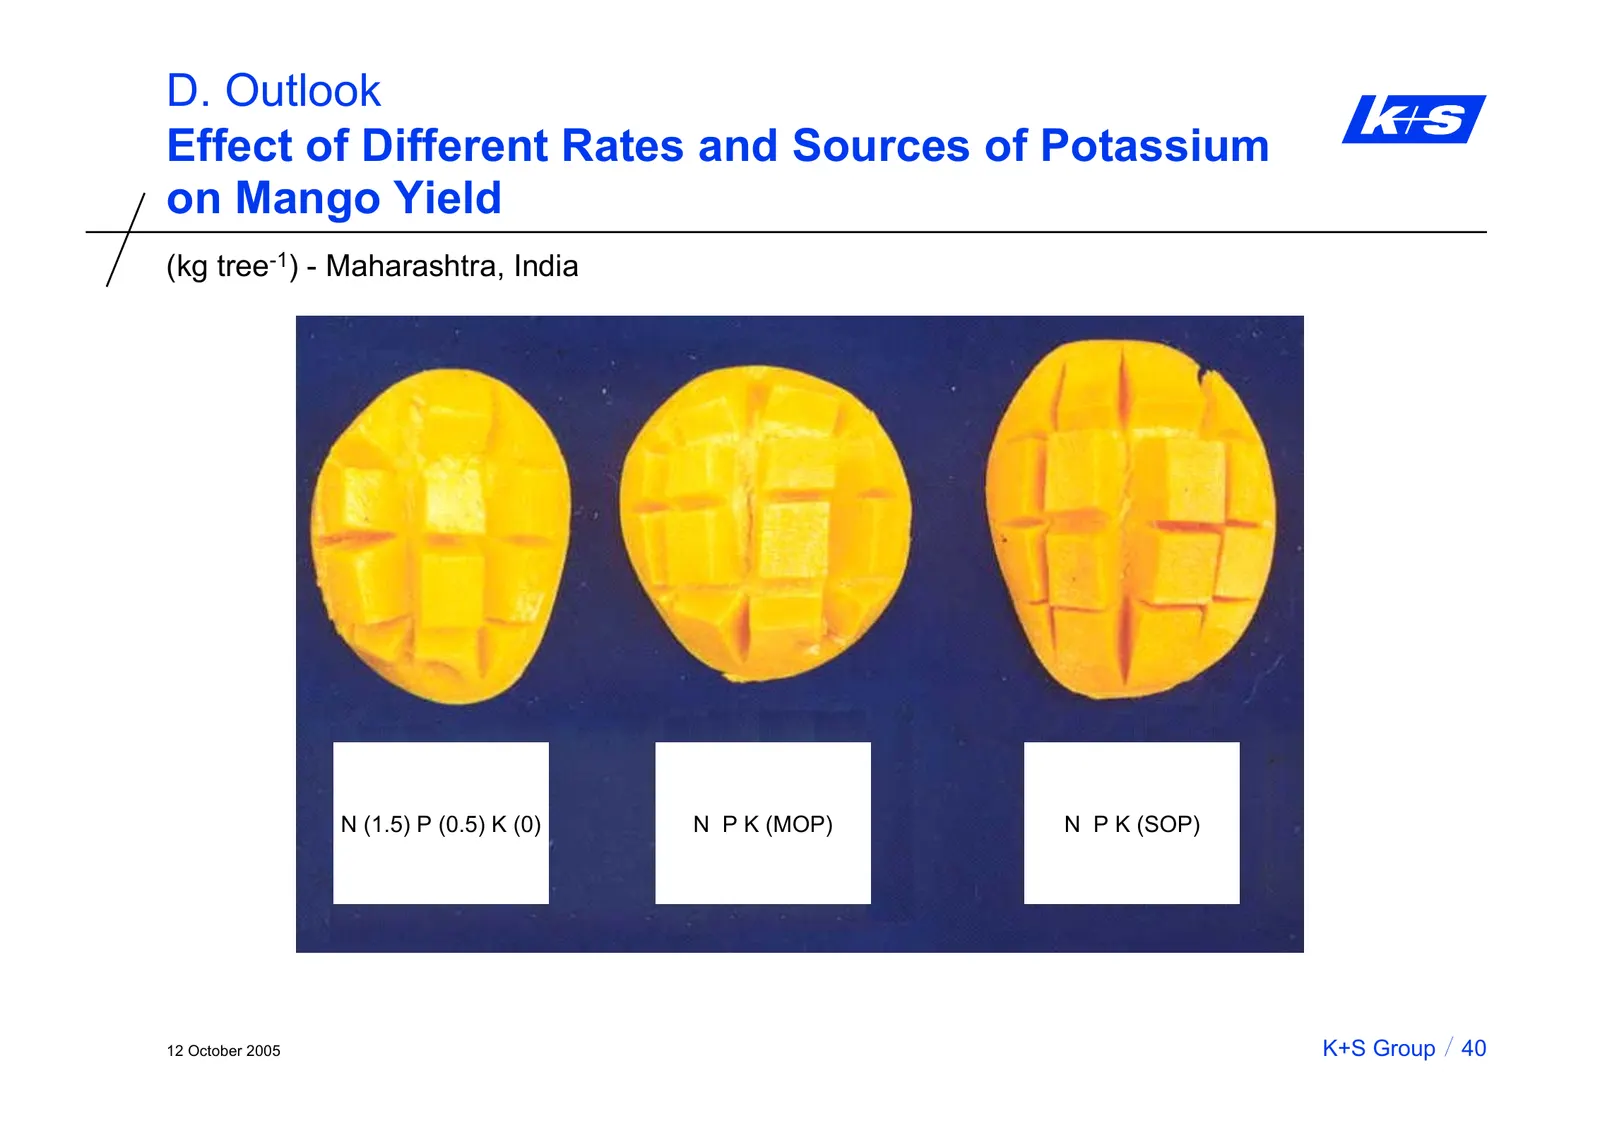
Slide 41: Effect of Rates and Sources of Potassium on Mango Yield
D. Outlook Effect of Different Rates and Sources of Potassium on Mango Yield (kg tree-1) - Maharashtra, India N (1.5) P (0.5) K (0) N P K (MOP) N P K (SOP) 12 October 2005 K+S Group 40
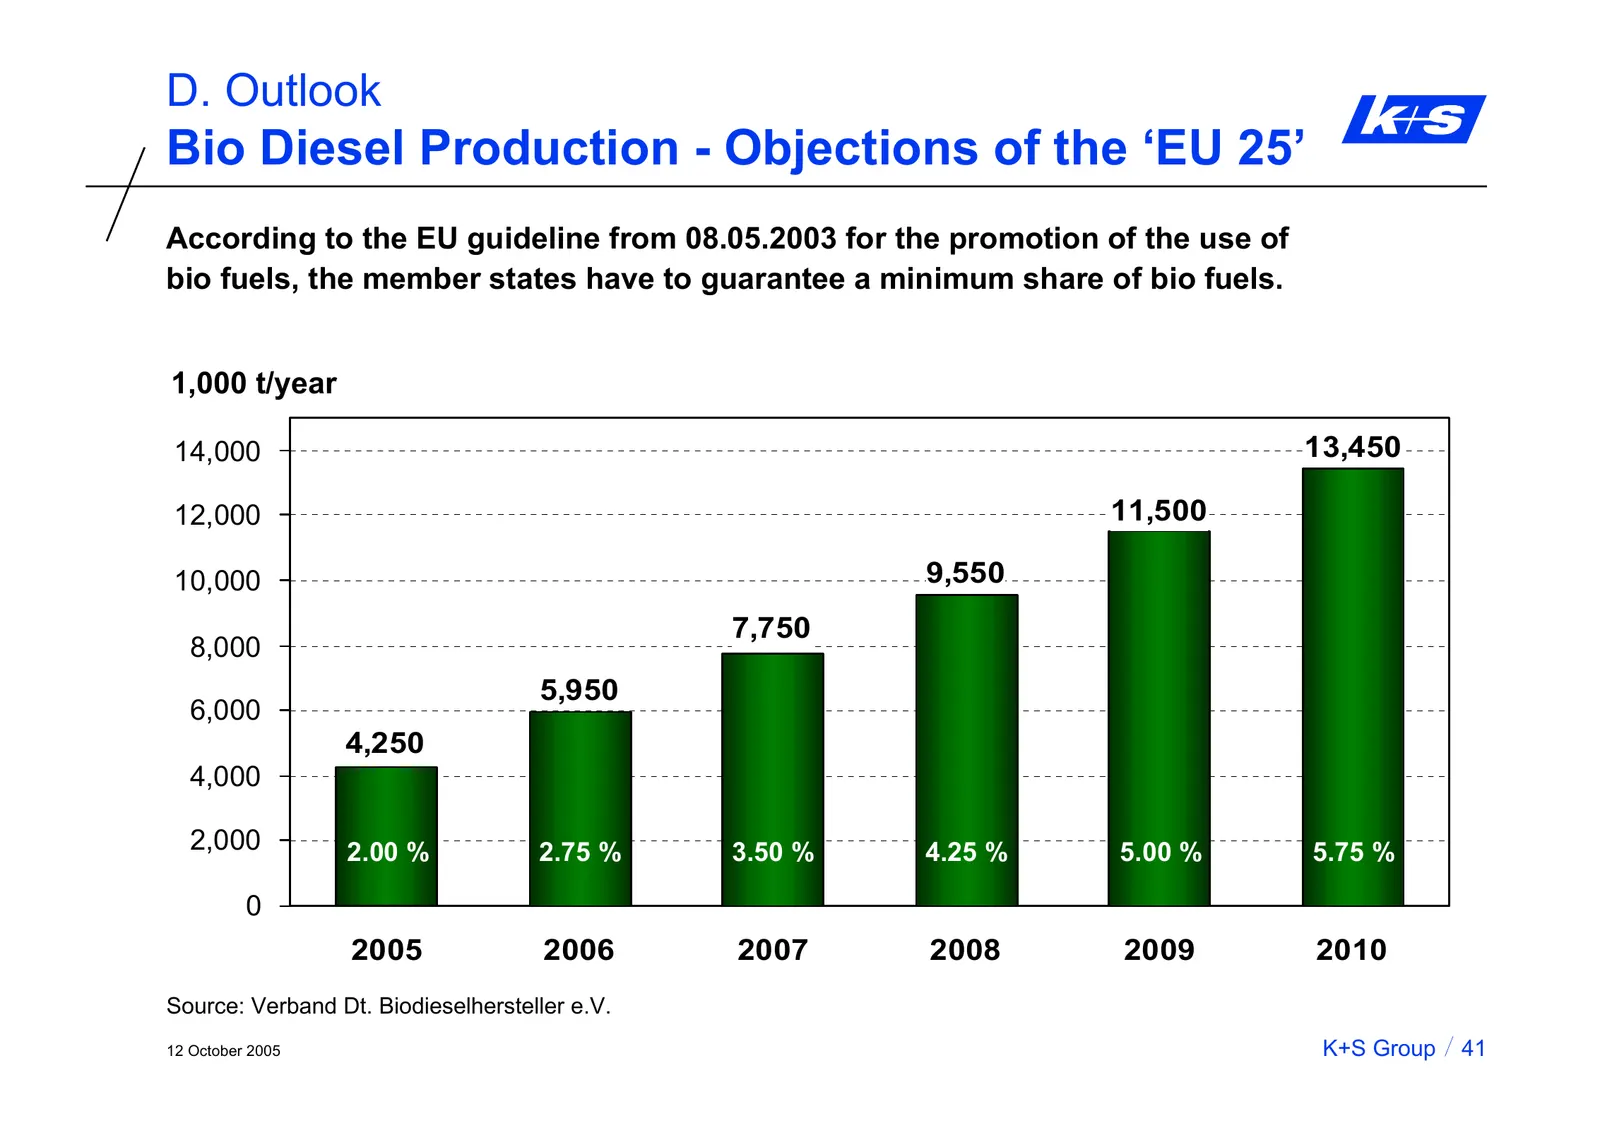
Slide 42: Bio Diesel Production - Objectives of the EU 25
D. Outlook Bio Diesel Production - Objections of the ‘EU 25’ According to the EU guideline from 08.05.2003 for the promotion of the use of bio fuels, the member states have to guarantee a minimum share of bio fuels. 1,000 t/year 14000 14,000 13,450 12000 12,000 11,500 10000 10,000 9,550 7,750 8000 8
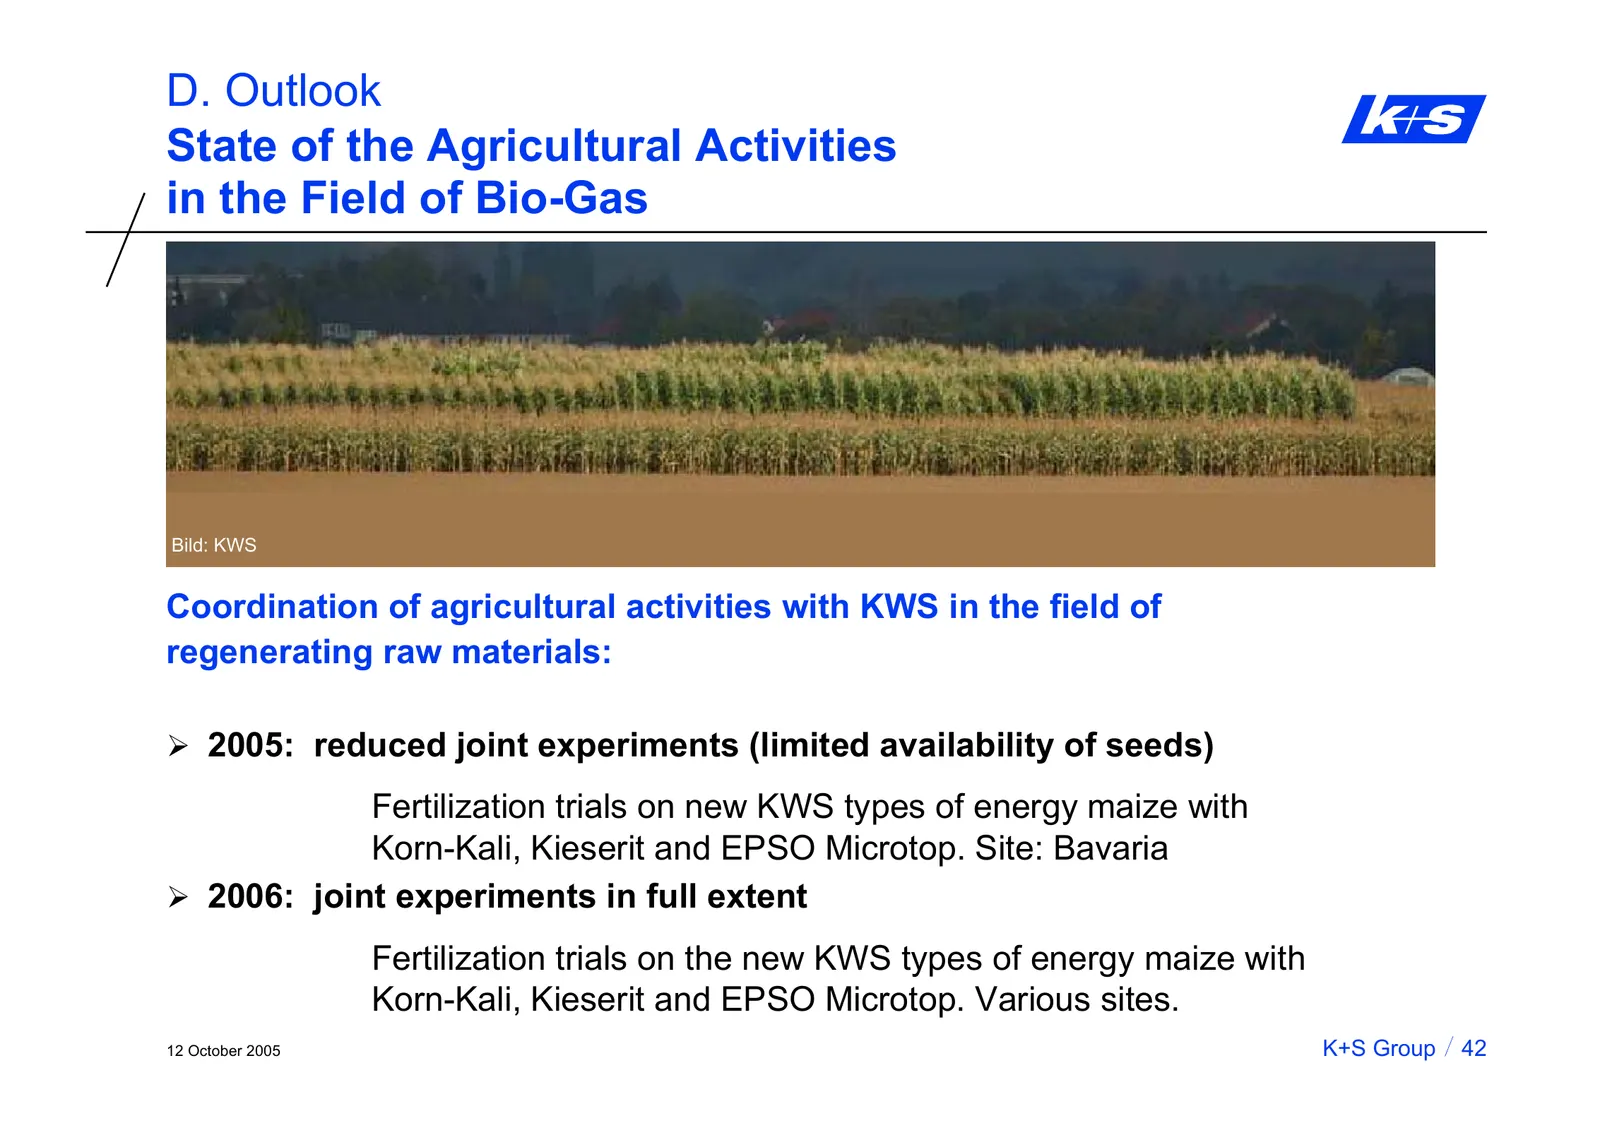
Slide 43: State of the Agricultural Activities in the Field of Bio-Gas
D. Outlook State of the Agricultural Activities in the Field of Bio-Gas Bild: KWS Coordination of agricultural activities with KWS in the field of regenerating raw materials: ¾ 2005: reduced joint experiments (limited availability of seeds) Fertilization trials on new KWS types of energy maize with
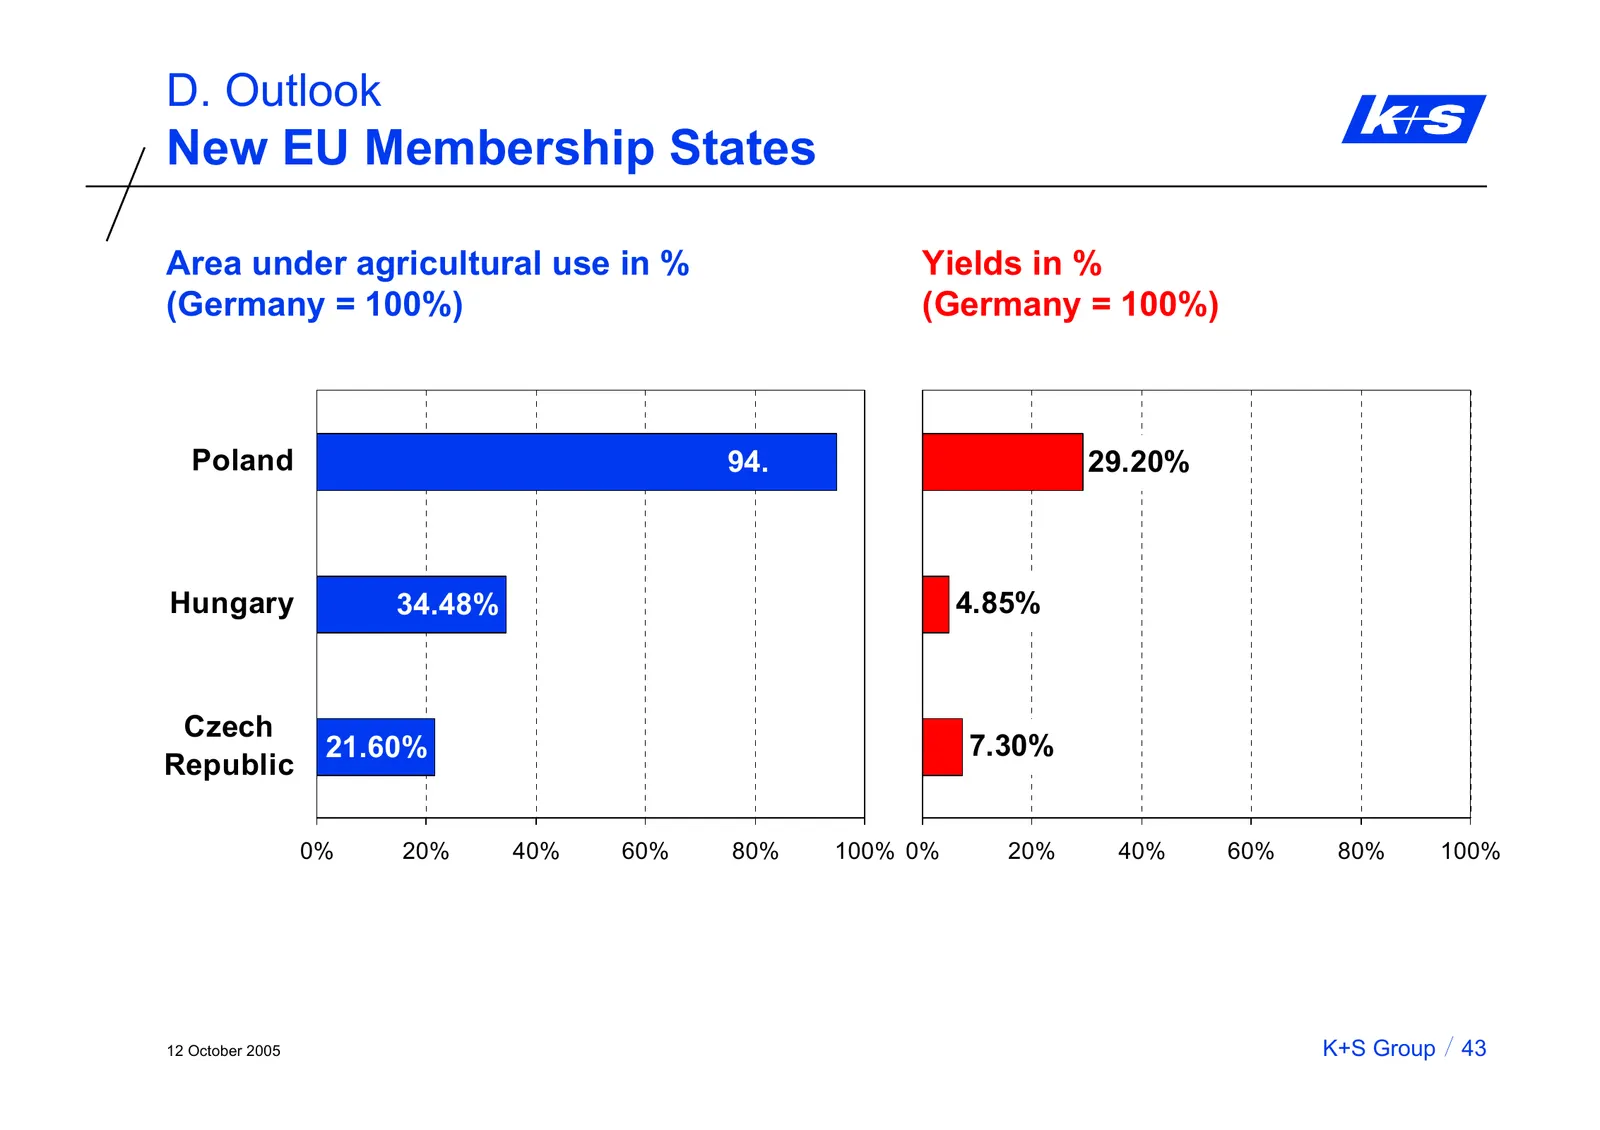
Slide 44: New EU Membership States
D. Outlook New EU Membership States Area under agricultural use in % Yields in % (Germany = 100%) (Germany = 100%) Poland Poland 94.87% 29.20% Hungary 34.48% Hungary 4.85% Czech Czech 21.60% 7.30% Republic Republic 0% 20% 40% 60% 80% 100% 0% 20% 40% 60% 80% 100% 12 October 2005 K+S Group 43
Slide 45: Experience growth.
www.k-plus-s.com Experience growth. K+S Aktiengesellschaft Investor Relations Bertha-von-Suttner-Straße 7 phone: +49 (0)561 / 9301-1460 34131 Kassel (Germany) fax: +49 (0)561 / 9301-2425 phone: +49 (0)561 / 9301-0 email: investor-relations@k-plus-s.com fax: +49 (0)561 / 9301-1753 12 October 2005 K+S
Source: Internet Archive copy of k-plus-s.com
More decks from K+s AG
 Investor Presentation (October 2026)100 slides · October 2026
 Q2 2026 Earnings Presentation9 slides · Aug 12, 2026
 Investor Presentation (August 2026)102 slides · August 2026
 Q1 2026 Earnings Presentation11 slides · May 11, 2026
 Investor Presentation (May 2026)89 slides · May 2026
 Q4 2025 Earnings Presentation11 slides · Mar 13, 2026