CenterState Bank — Shareholder Meeting (April 2019)
21 slides from CenterState Bank's shareholder meeting presentation, Apr 25, 2019
Slide 1: Annual Shareholders' Meeting April 25, 2019
Annual Shareholders’ Meeting April 25, 2019 Exhibit 99.1
Slide 2: Forward Looking Statements
Forward Looking Statements Information in this presentation, other than statements of historical facts, may constitute forward-looking statements, within the meaning of the Private Securities Litigation Reform Act of 1995. These statements include, but are not limited to, CenterState’s plans, object
Slide 3: Overview of Franchise
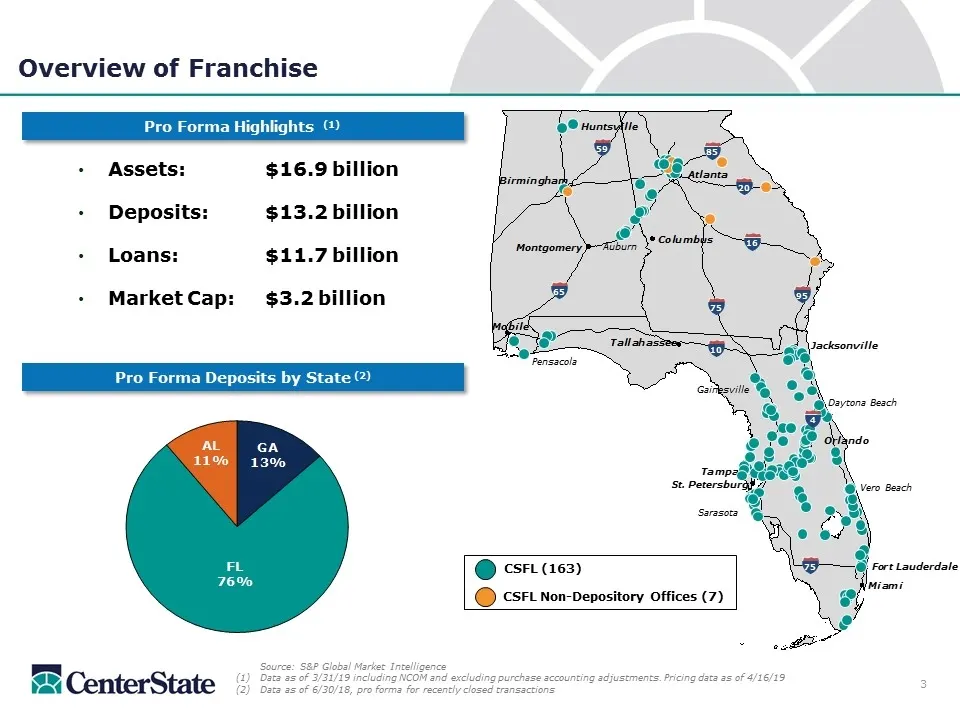
Overview of Franchise Assets: $16.9 billion Deposits: $13.2 billion Loans: $11.7 billion Market Cap: $3.2 billion Pro Forma Highlights (1) Source: S&P Global Market Intelligence Data as of 3/31/19 including NCOM and excluding purchase accounting adjustments. Pricing data as of 4/16/19 Data as of 6/3
Slide 4: Executive Leadership
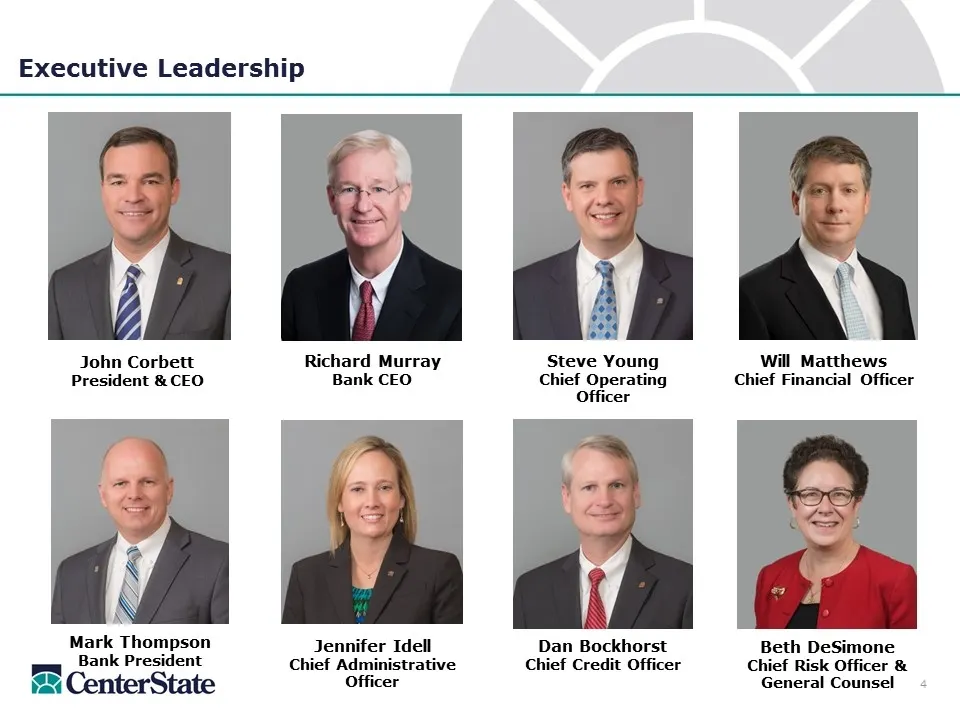
Executive Leadership John Corbett President & CEO Richard Murray Bank CEO Steve Young Chief Operating Officer Will Matthews Chief Financial Officer Dan Bockhorst Chief Credit Officer Jennifer Idell Chief Administrative Officer Beth DeSimone Chief Risk Officer & General Counsel Mark Thompson Bank Pre
Slide 5: Stock Price Performance Over 1, 3 & 5 Year Periods
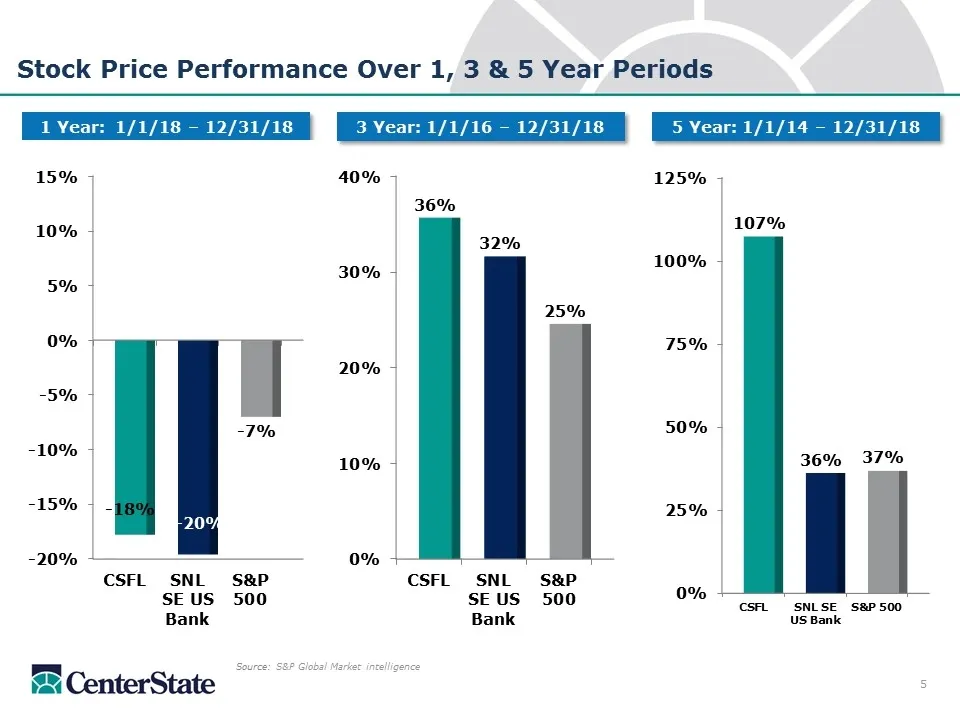
Stock Price Performance Over 1, 3 & 5 Year Periods Source: S&P Global Market intelligence 1 Year: 1/1/18 – 12/31/18 3 Year: 1/1/16 – 12/31/18 5 Year: 1/1/14 – 12/31/18 5
Slide 6: 2018 Highlights
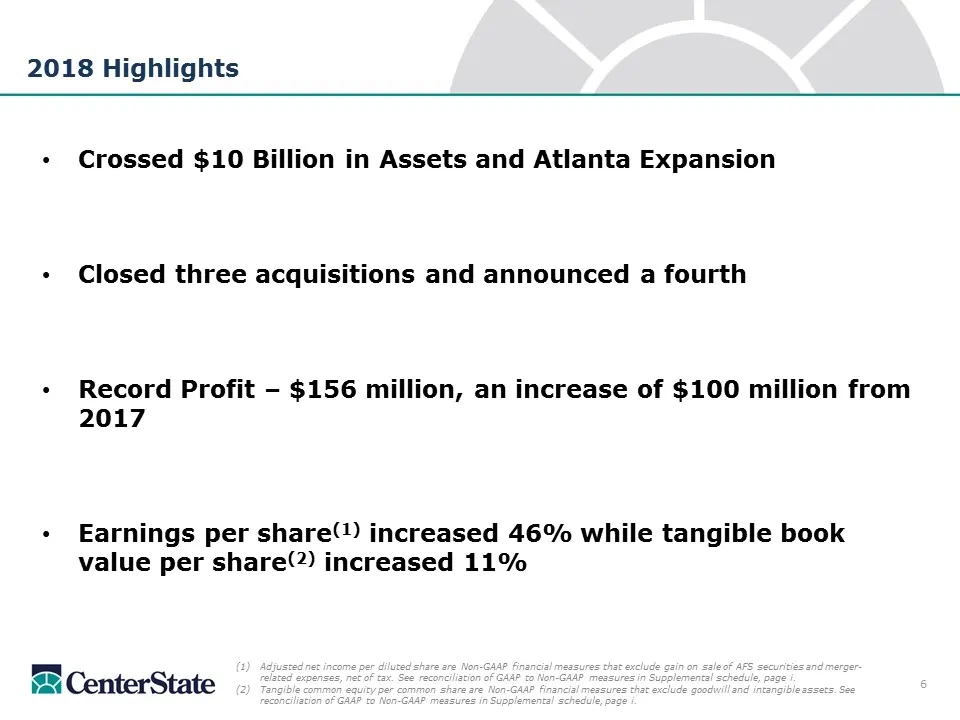
2018 Highlights Crossed $10 Billion in Assets and Atlanta Expansion Closed three acquisitions and announced a fourth Record Profit – $156 million, an increase of $100 million from 2017 Earnings per share(1) increased 46% while tangible book value per share(2) increased 11% 6 Adjusted net income per
Slide 7: Performance Metrics: Return on Average Assets
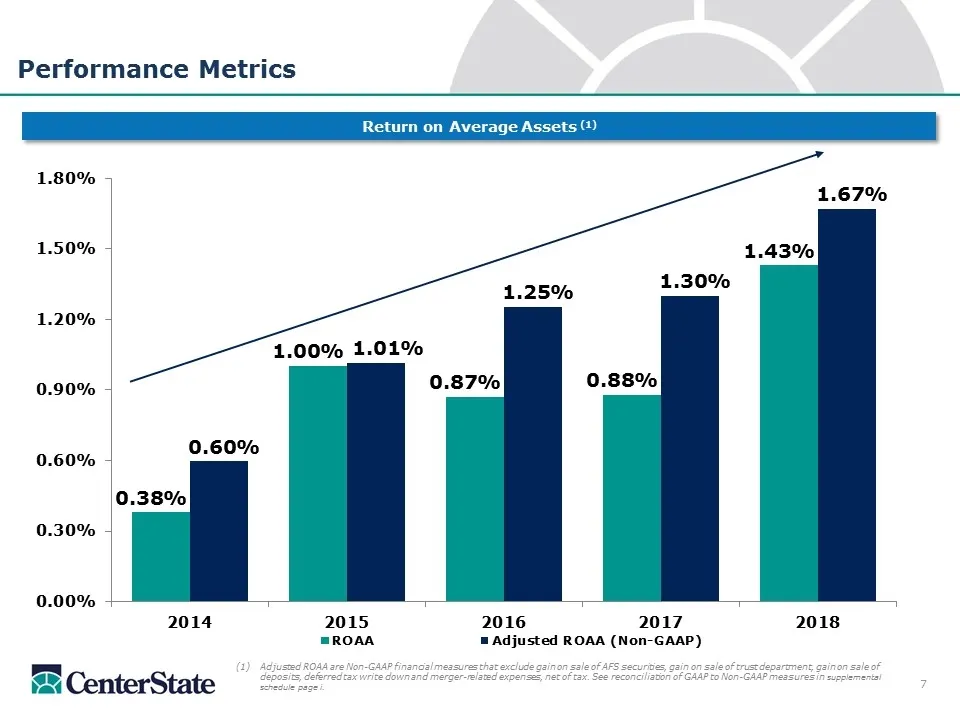
Performance Metrics Return on Average Assets (1) Adjusted ROAA are Non-GAAP financial measures that exclude gain on sale of AFS securities, gain on sale of trust department, gain on sale of deposits, deferred tax write down and merger-related expenses, net of tax. See reconciliation of GAAP to Non-G
Slide 8: Performance Metrics (continued): Efficiency Ratio
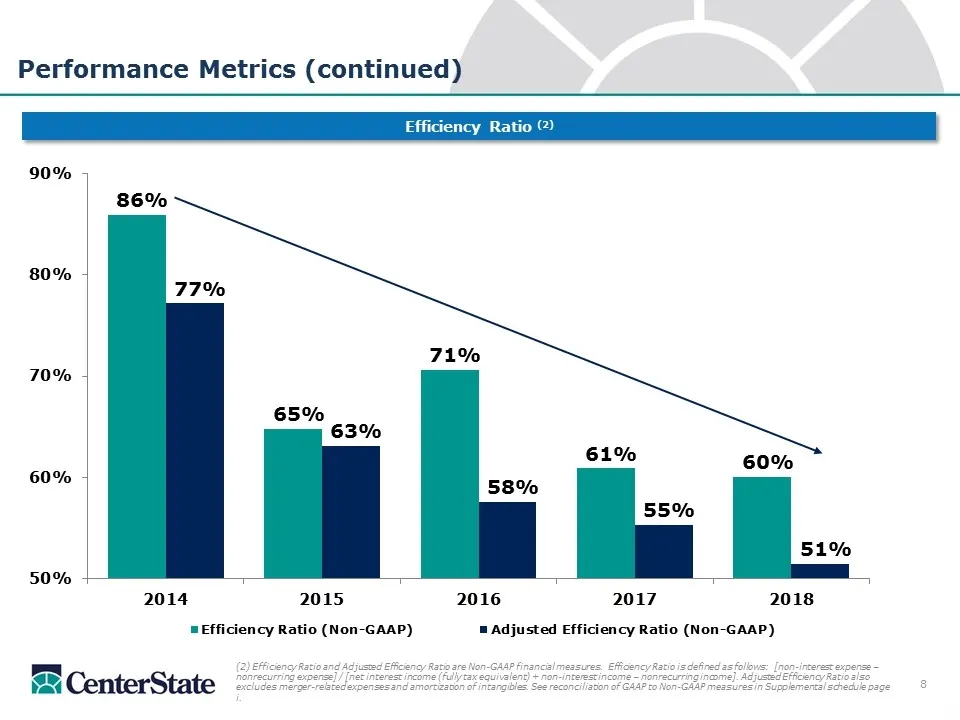
Performance Metrics (continued) Efficiency Ratio (2) 8 (2) Efficiency Ratio and Adjusted Efficiency Ratio are Non-GAAP financial measures. Efficiency Ratio is defined as follows: [non-interest expense – nonrecurring expense] / [net interest income (fully tax equivalent) + non-interest income – nonre
Slide 9: Performance Metrics (continued): Return on Average Tangible Common Equity
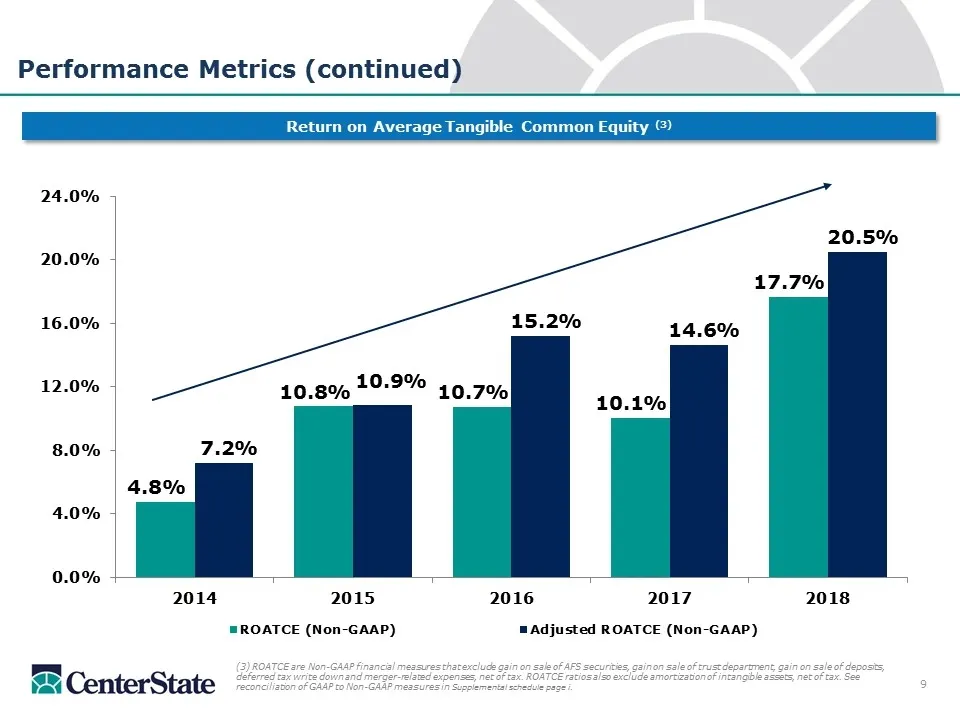
Performance Metrics (continued) Return on Average Tangible Common Equity (3) (3) ROATCE are Non-GAAP financial measures that exclude gain on sale of AFS securities, gain on sale of trust department, gain on sale of deposits, deferred tax write down and merger-related expenses, net of tax. ROATCE rat
Slide 10: TBVPS and Adjusted EPS: Historical and Consensus Forecast
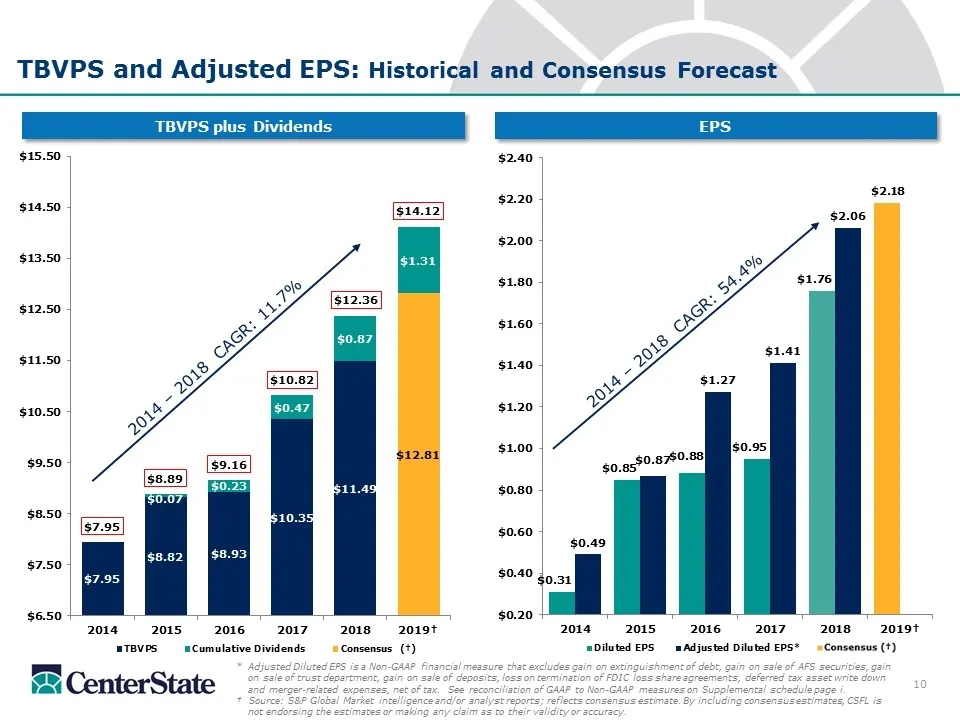
TBVPS and Adjusted EPS: Historical and Consensus Forecast *Adjusted Diluted EPS is a Non-GAAP financial measure that excludes gain on extinguishment of debt, gain on sale of AFS securities, gain on sale of trust department, gain on sale of deposits, loss on termination of FDIC loss share agreements,
Slide 11: Years After the Financial Crisis
10 YEARS AFTER THE FINANCIAL CRISIS
Slide 12: M&A History
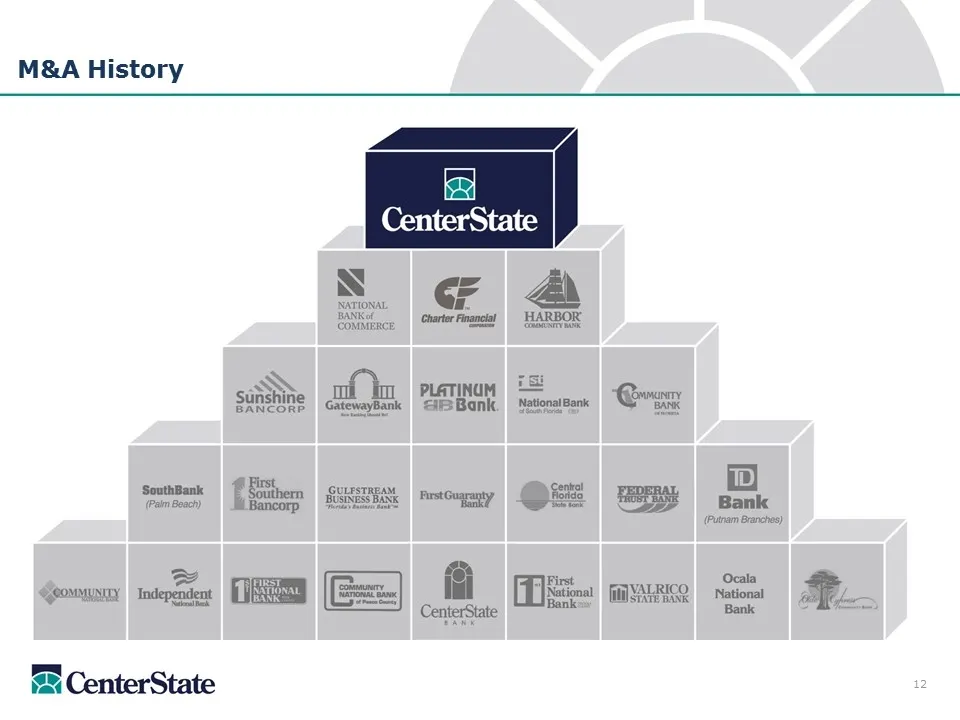
M&A History al CenterState SME, oman HERIOR same [zion GEE omcompey QE TERY [Est mace “Serer eect 7 ~ “= CenterSite = CenterState
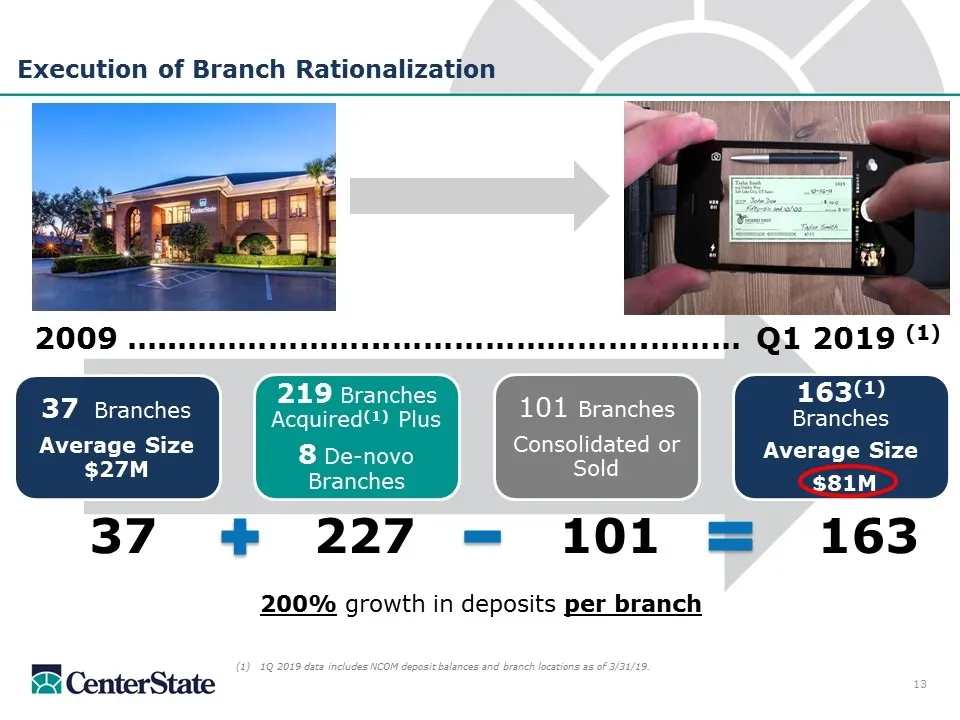
Slide 13: Execution of Branch Rationalization
Execution of Branch Rationalization 200% growth in deposits per branch 37 227 101 163 2009 …..………………...…………………….……… Q1 2019 (1) 13 1Q 2019 data includes NCOM deposit balances and branch locations as of 3/31/19. 37 Branches Average Size $27M 219 Branches Acquired (1) Plus 8 De-novo Branches 101 Branc
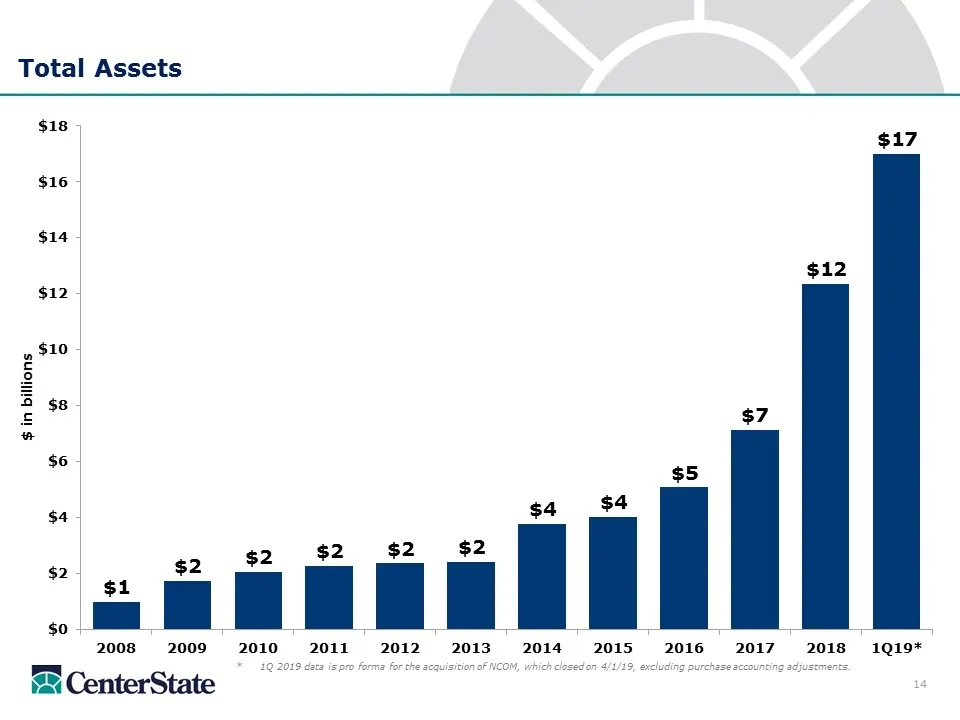
Slide 14: Total Assets
Total Assets *1Q 2019 data is pro forma for the acquisition of NCOM, which closed on 4/1/19, excluding purchase accounting adjustments. $ in billions 14
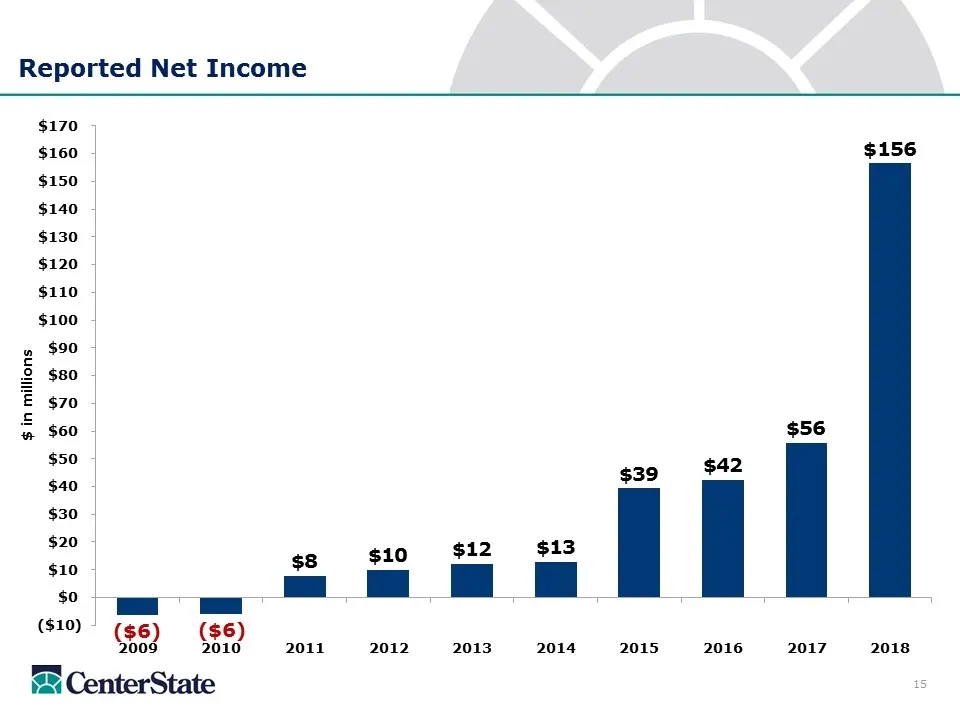
Slide 15: Reported Net Income
Reported Net Income $ in millions 15
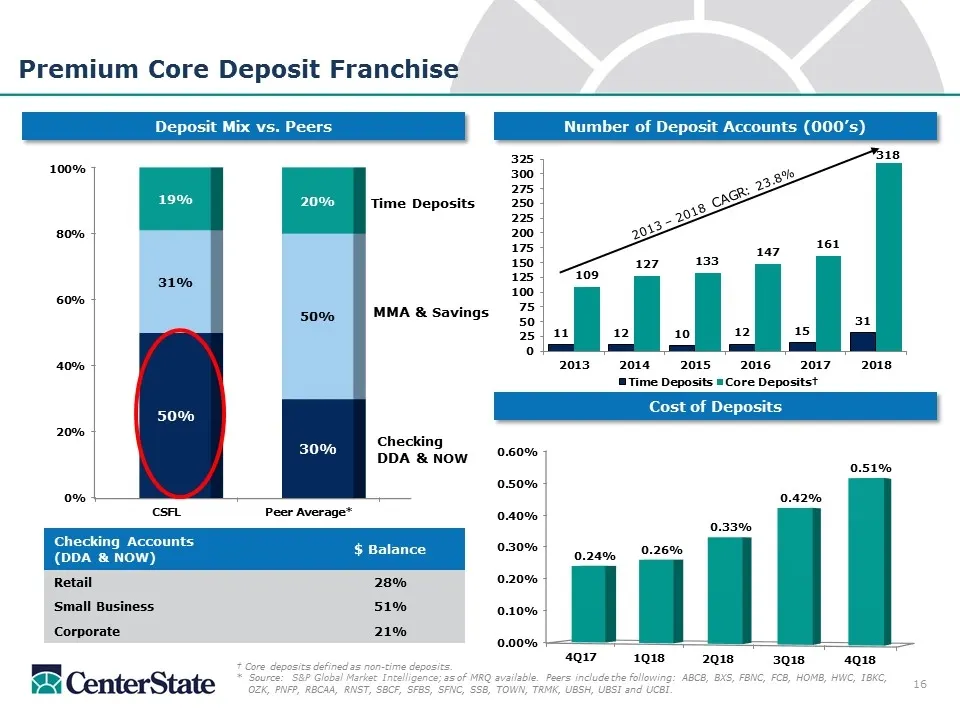
Slide 16: Premium Core Deposit Franchise
Number of Deposit Accounts (000’s) Premium Core Deposit Franchise Cost of Deposits Deposit Mix vs. Peers † Core deposits defined as non-time deposits. * Source: S&P Global Market Intelligence; as of MRQ available. Peers include the following: ABCB, BXS, FBNC, FCB, HOMB, HWC, IBKC, OZK, PNFP, RBCAA,
Slide 17: Best Growth Markets in the Southeast
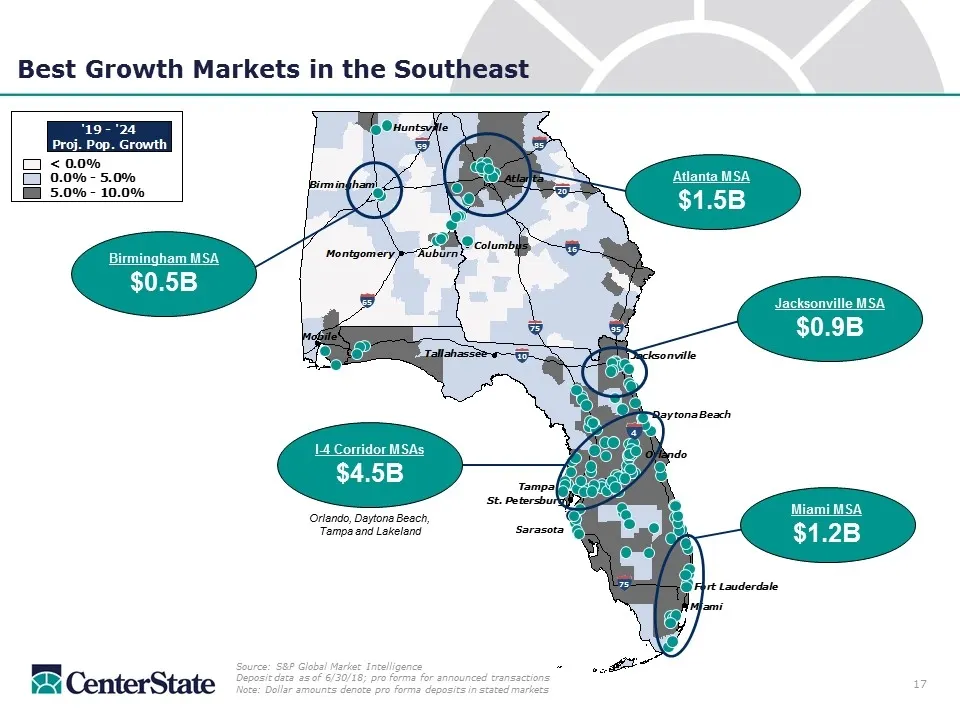
Best Growth Markets in the Southeast Auburn Sarasota Daytona Beach Source: S&P Global Market Intelligence Deposit data as of 6/30/18; pro forma for announced transactions Note: Dollar amounts denote pro forma deposits in stated markets 20 95 16 65 59 75 10 75 85 Atlanta MSA $1.5B Jacksonville MSA $0
Slide 18: Summary and Investment Thesis
Summary and Investment Thesis CenterState is among the largest community banks headquartered in the Southeast by assets, market capitalization, deposit market share and branch footprint(1). CenterState is positioned in the premier growth markets in the Southeast. A premium core deposit franchise wit

Slide 19: Supplemental
Supplemental
Slide 20: Reconciliation of GAAP to Non-GAAP Measures
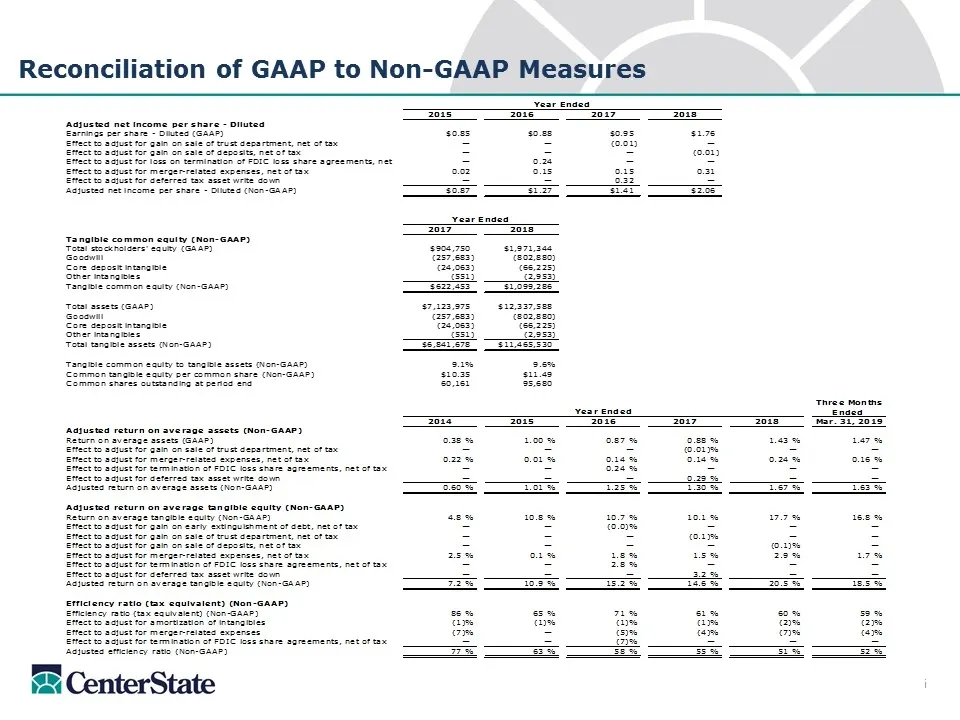
Reconciliation of GAAP to Non-GAAP Measures i
Slide 21: CenterState
ms CenterState
Source: SEC EDGAR · 8-K filed Apr 25, 2019
More decks from CenterState Bank Corporation
 IPO Roadshow (May 2020)42 slides · May 21, 2020
 D.A. Davidson 22nd Annual Financial Institution Virtual Conference (May 2020)25 slides · May 6, 2020
 Q1 2020 Earnings Presentation25 slides · Apr 23, 2020
 Merger or Acquisition (January 2020)24 slides · Jan 27, 2020
 Q3 2019 Earnings Presentation28 slides · Nov 4, 2019
 Investor Presentation (July 2019)28 slides · Jul 30, 2019