Nuix Ltd. · ASX:NXL
Nuix — H1 2025 Earnings Presentation
38 slides from Nuix's earnings presentation, Feb 24, 2025

Slide 1: 1H25 Financial Results
1H25 FINANCIAL RESULTS 24 FEBRUARY 2025

Slide 2: Agenda
AGENDA KEY MESSAGES & METRICS FINANCIAL RESULTS STRATEGY UPDATE OUTLOOK 2

Slide 3: 1. Key Messages & Metrics
1. KEY MESSAGES & METRICS JONATHAN RUBINSZTEIN CHIEF EXECUTIVE OFFICER
Slide 4: Nuix: Our Foundation for Growth
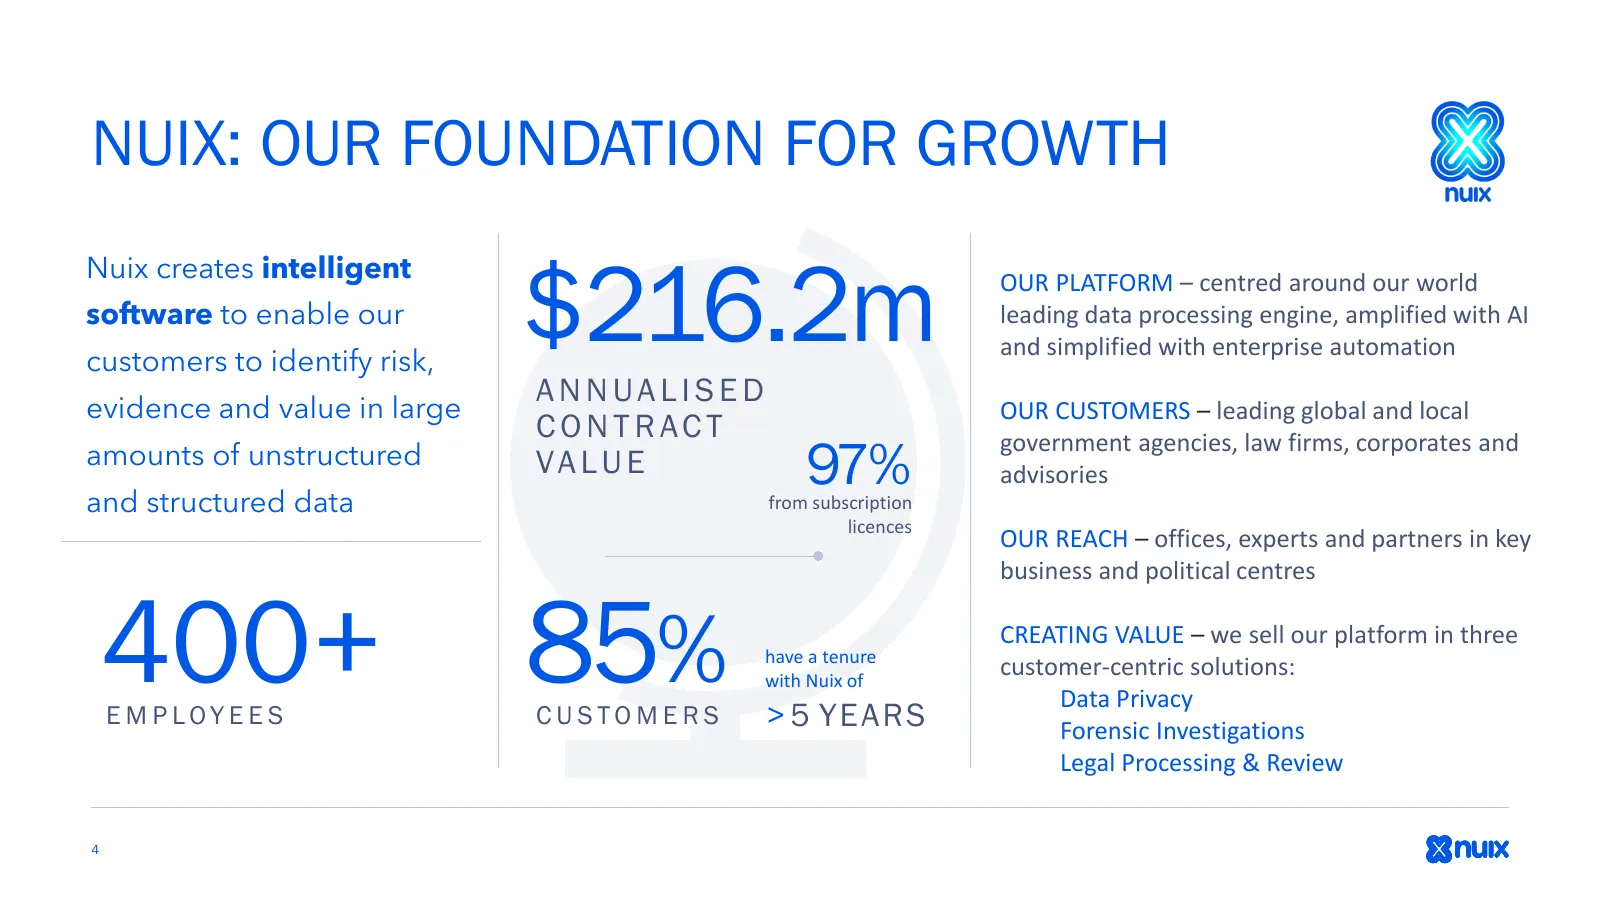
NUIX: OUR FOUNDATION FOR GROWTH $216.2m Nuix creates intelligent OUR PLATFORM – centred around our world software to enable our leading data processing engine, amplified with AI and simplified with enterprise automation customers to identify risk, ANNUALISED evidence and value in large OUR CUSTOMERS
Slide 5: 1H25 Key Messages
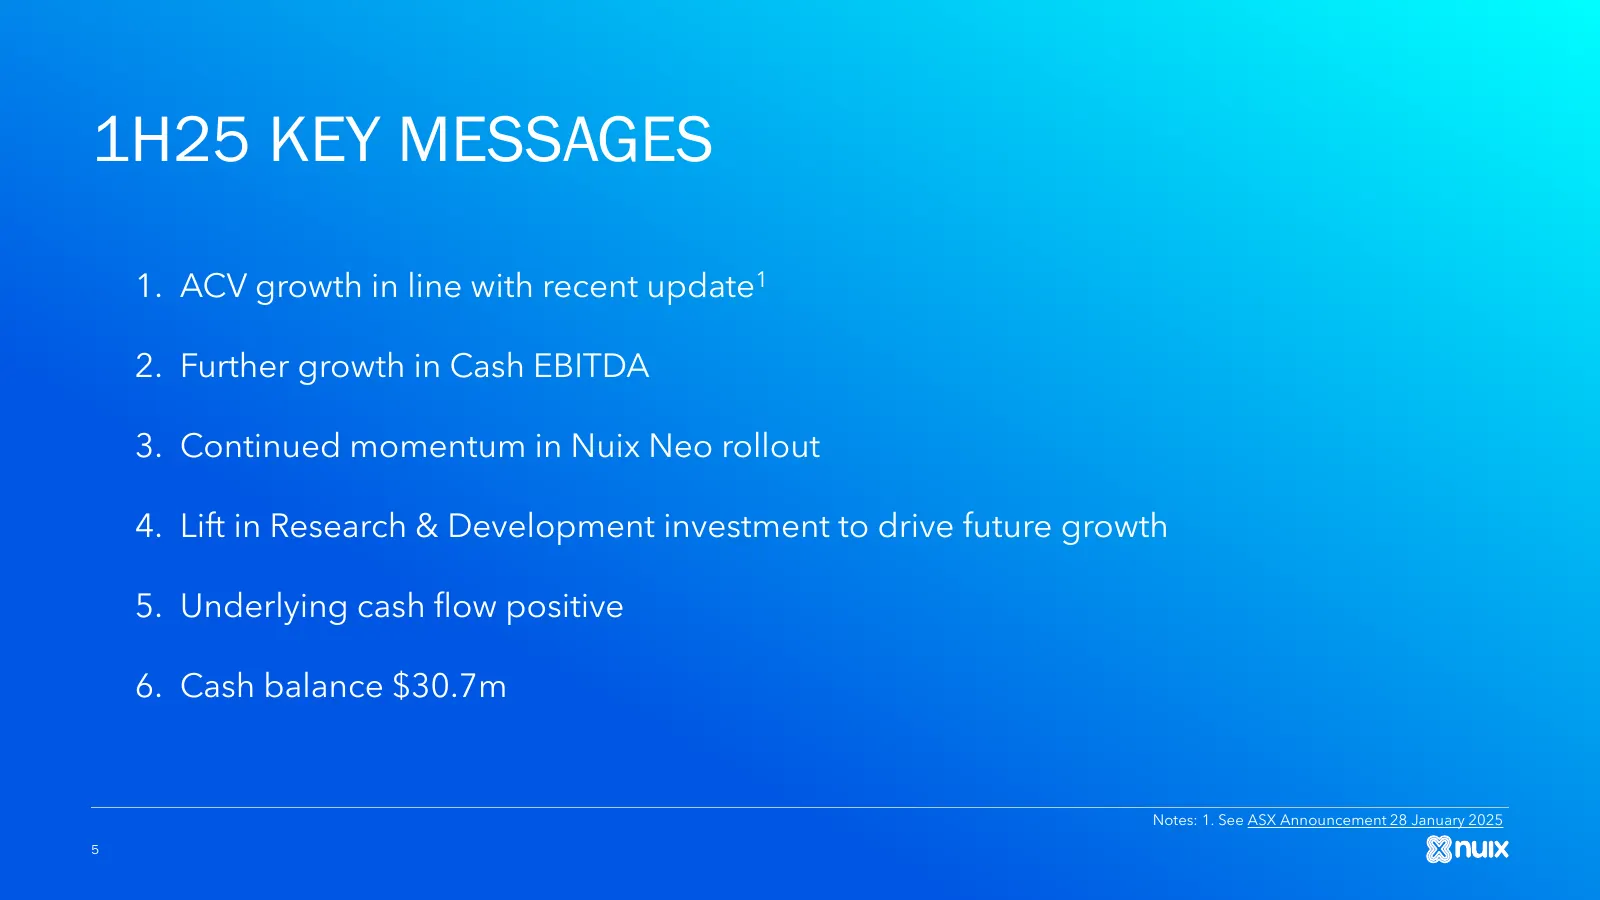
1H25 KEY MESSAGES 1. ACV growth in line with recent update1 2. Further growth in Cash EBITDA 3. Continued momentum in Nuix Neo rollout 4. Lift in Research & Development investment to drive future growth 5. Underlying cash flow positive 6. Cash balance $30.7m Notes: 1. See ASX Announcement 28 January
Slide 6: 1H25 Key Financial Metrics
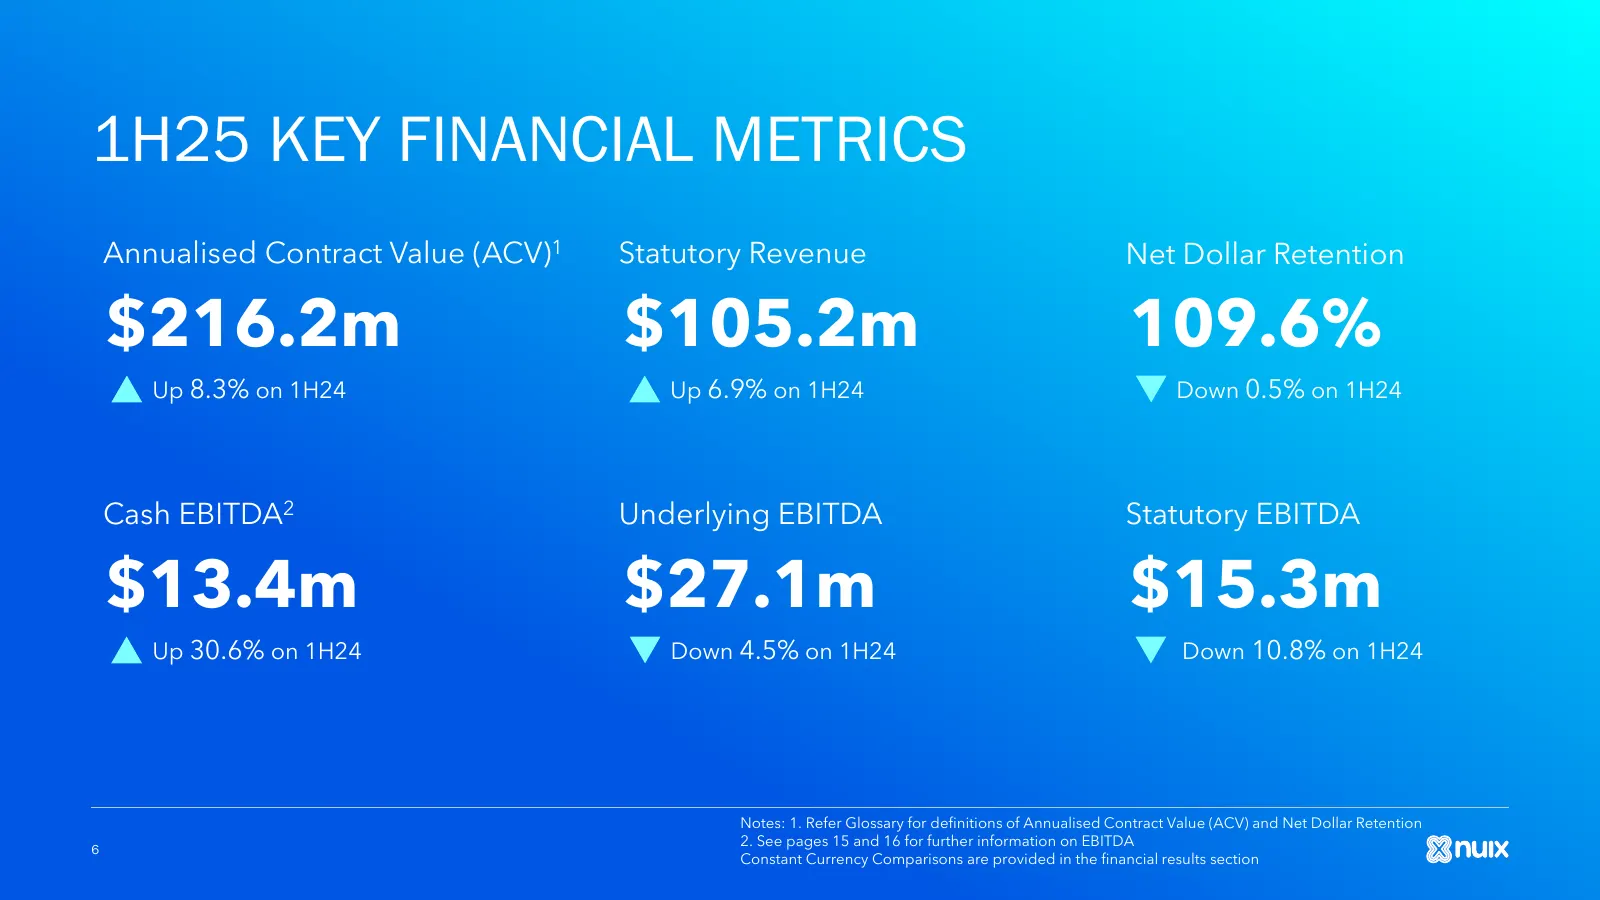
1H25 KEY FINANCIAL METRICS Annualised Contract Value (ACV)1 Statutory Revenue Net Dollar Retention $216.2m $105.2m 109.6% Up 8.3% on 1H24 Up 6.9% on 1H24 Down 0.5% on 1H24 Cash EBITDA2 Underlying EBITDA Statutory EBITDA $13.4m $27.1m $15.3m Up 30.6% on 1H24 Down 4.5% on 1H24 Down 10.8% on 1H24 Notes

Slide 7: 2. Financial Results
2. FINANCIAL RESULTS PETER MCCLELLAND CHIEF FINANCIAL OFFICER
Slide 8: Annualised Contract Value (ACV)
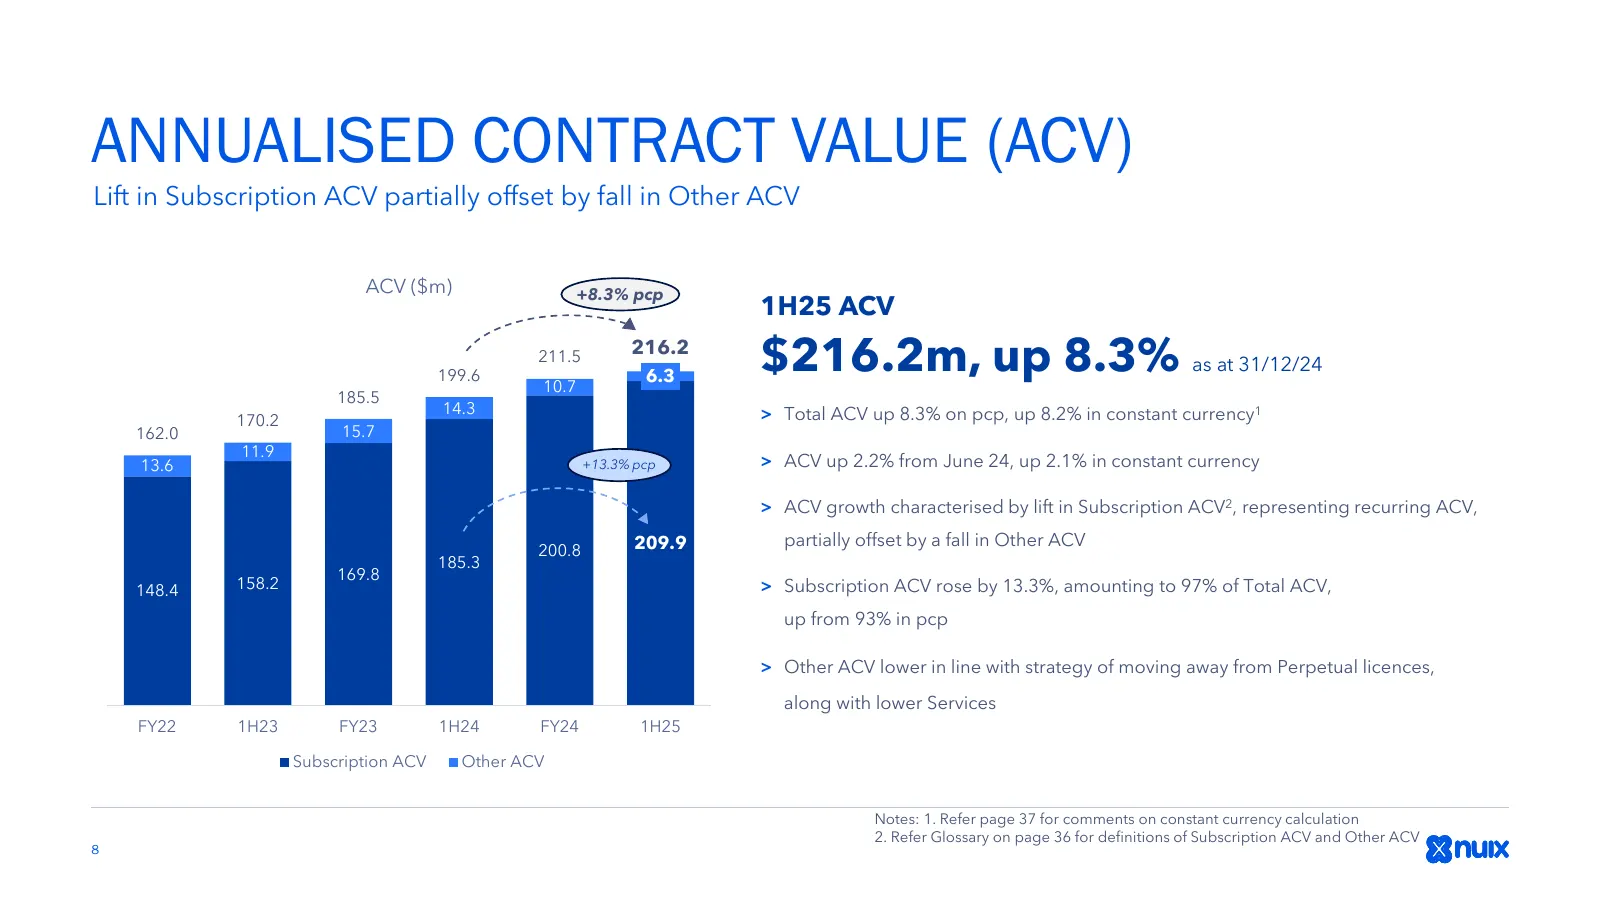
ANNUALISED CONTRACT VALUE (ACV) Lift in Subscription ACV partially offset by fall in Other ACV ACV ($m) +8.3% pcp 1H25 ACV 199.6 211.5 10.7 216.2 6.3 $216.2m, up 8.3% as at 31/12/24 185.5 14.3 > Total ACV up 8.3% on pcp, up 8.2% in constant currency1 170.2 162.0 15.7 11.9 13.6 +13.3% pcp > ACV up 2.
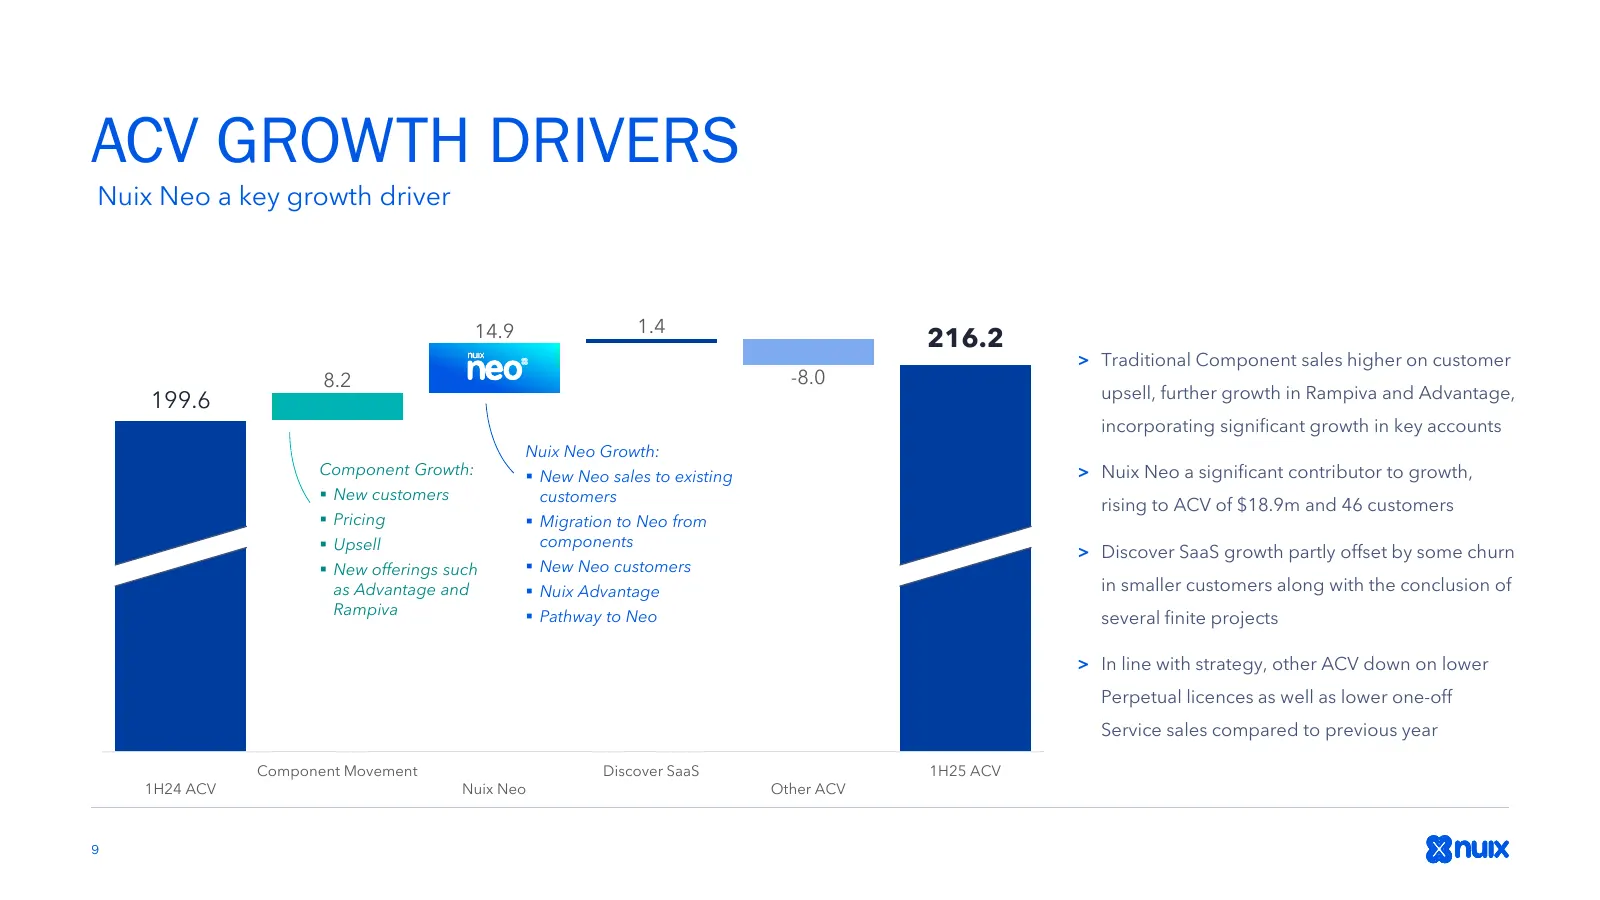
Slide 9: ACV Growth Drivers
ACV GROWTH DRIVERS Nuix Neo a key growth driver 14.9 1.4 216.2 116.2 > Traditional Component sales higher on customer 8.2 -8.0 199.6 upsell, further growth in Rampiva and Advantage, 99.6 incorporating significant growth in key accounts Nuix Neo Growth: Component Growth: New Neo sales to existing >
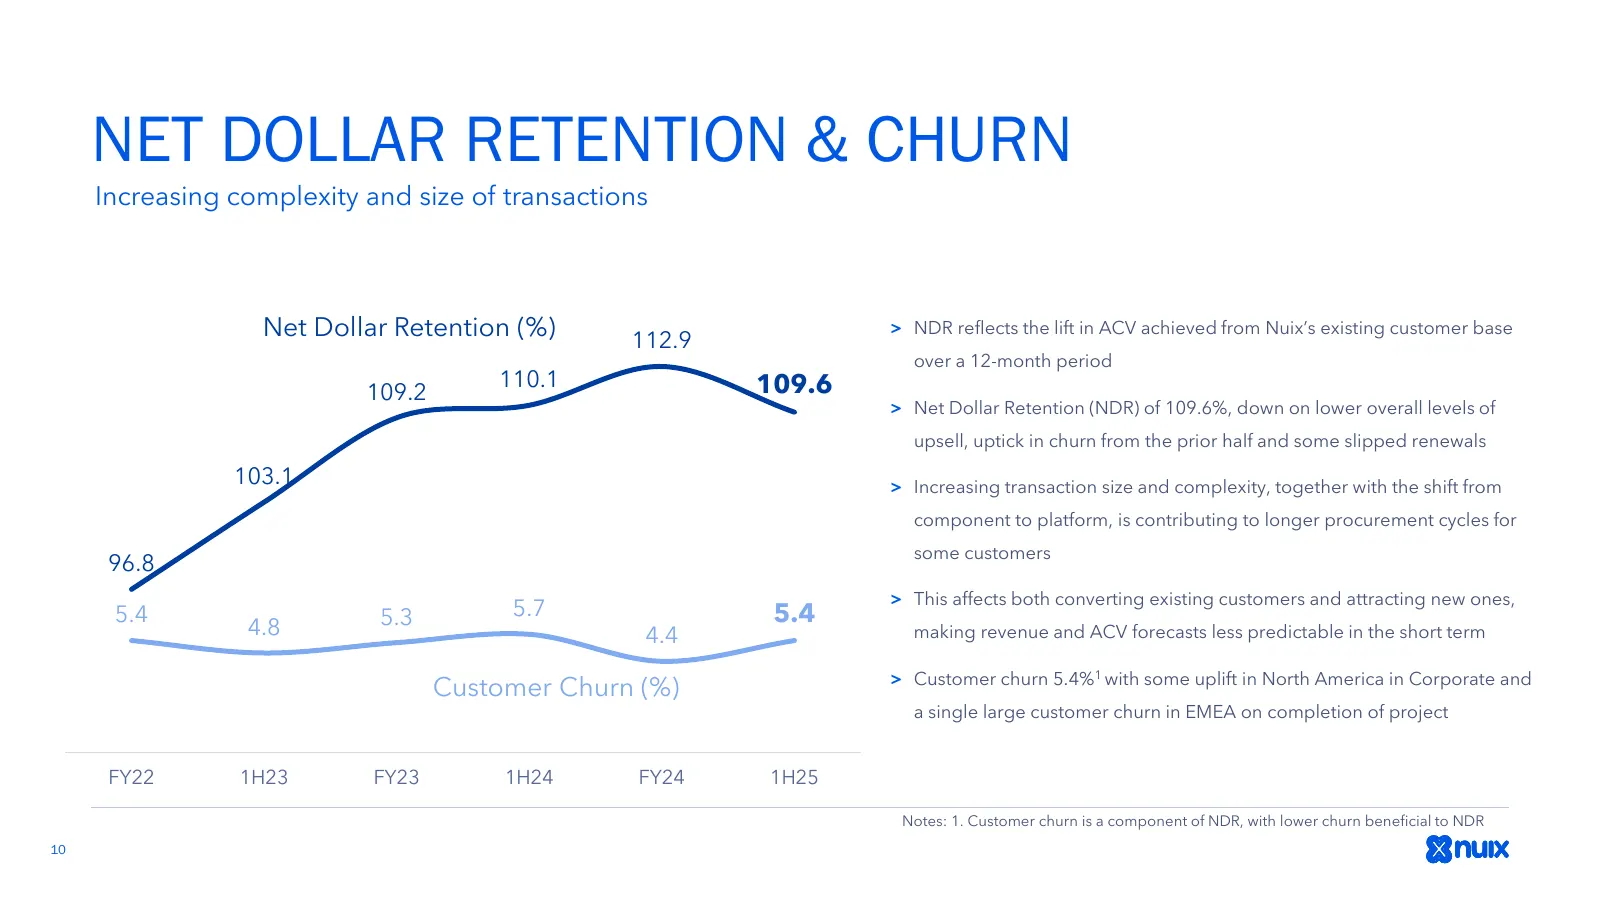
Slide 10: Net Dollar Retention & Churn
NET DOLLAR RETENTION & CHURN Increasing complexity and size of transactions 115 Net Dollar Retention (%) 112.9 > NDR reflects the lift in ACV achieved from Nuix’s existing customer base 20 over a 12-month period 110.1 109.6 18 109.2 110 > Net Dollar Retention (NDR) of 109.6%, down on lower overall l
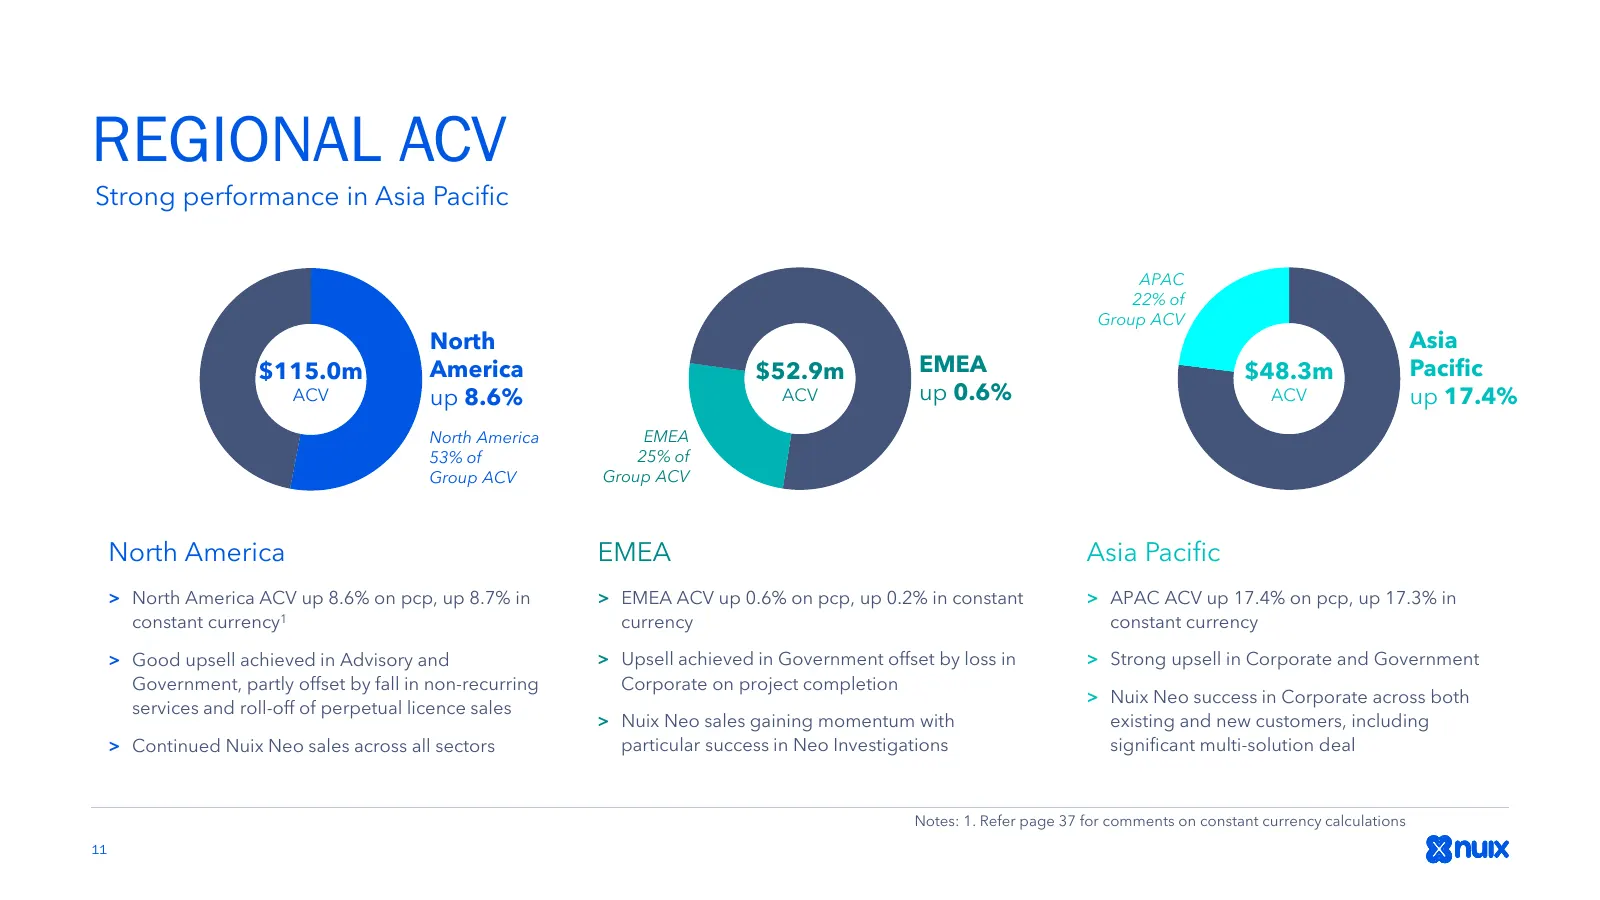
Slide 11: Regional ACV
REGIONAL ACV Strong performance in Asia Pacific APAC 22% of Group ACV North Asia $115.0m America $52.9m EMEA $48.3m Pacific ACV up 8.6% ACV up 0.6% ACV up 17.4% North America EMEA 53% of 25% of Group ACV Group ACV North America EMEA Asia Pacific > North America ACV up 8.6% on pcp, up 8.7% in > EMEA
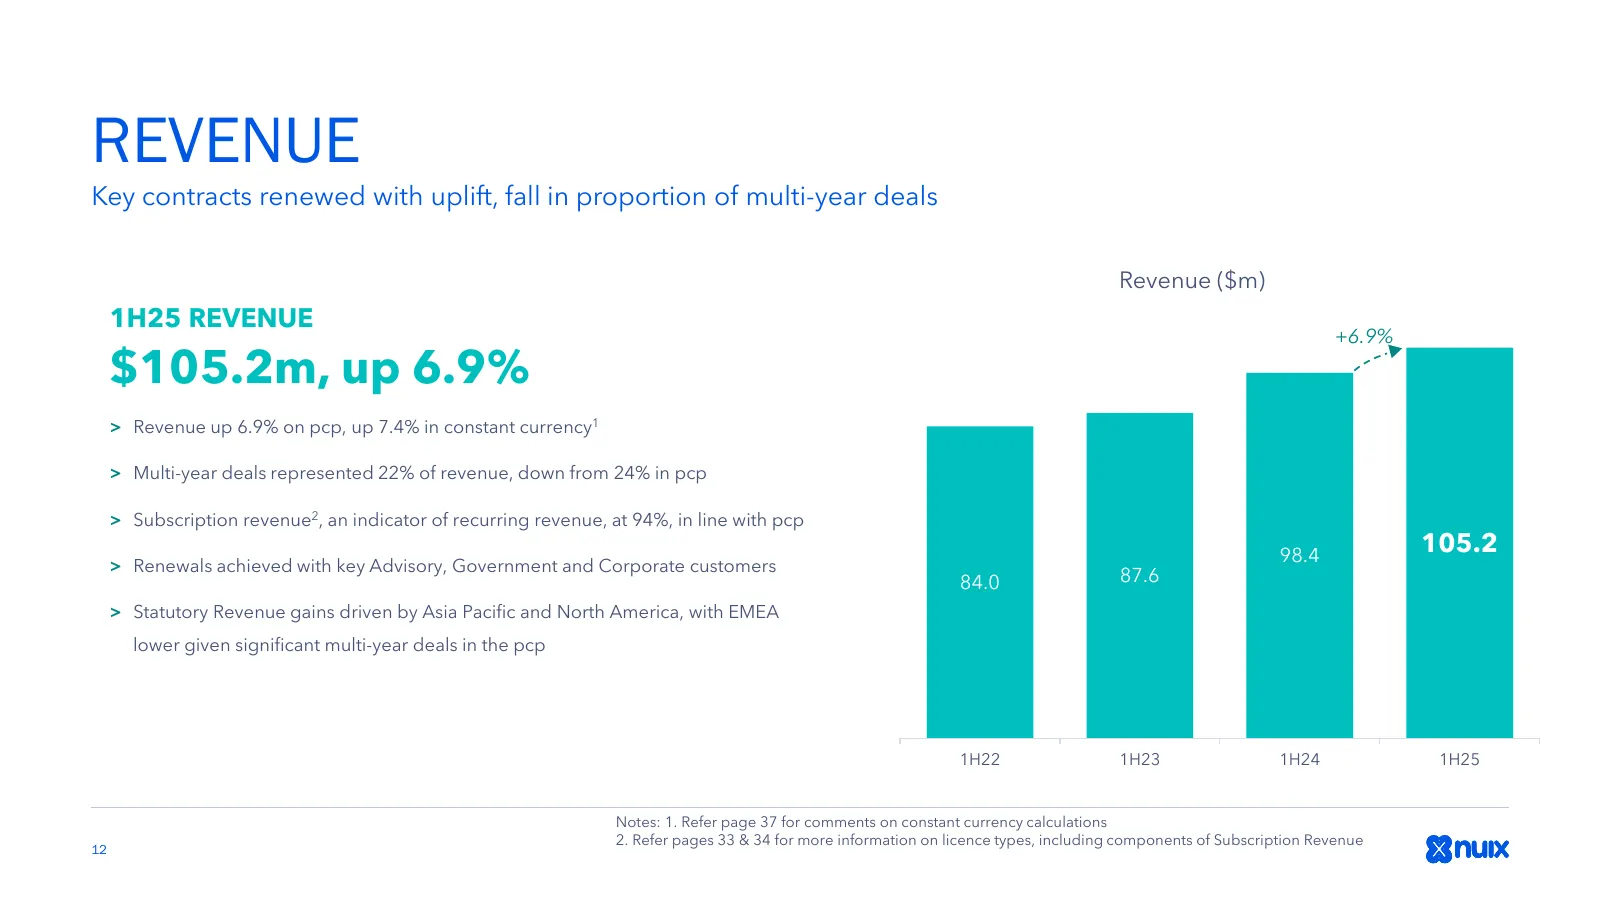
Slide 12: Revenue
REVENUE Key contracts renewed with uplift, fall in proportion of multi-year deals 120.0 Revenue ($m) 1H25 REVENUE +6.9% $105.2m, up 6.9% 100.0 > Revenue up 6.9% on pcp, up 7.4% in constant currency1 80.0 > Multi-year deals represented 22% of revenue, down from 24% in pcp > Subscription revenue2, an
Slide 13: Research & Development
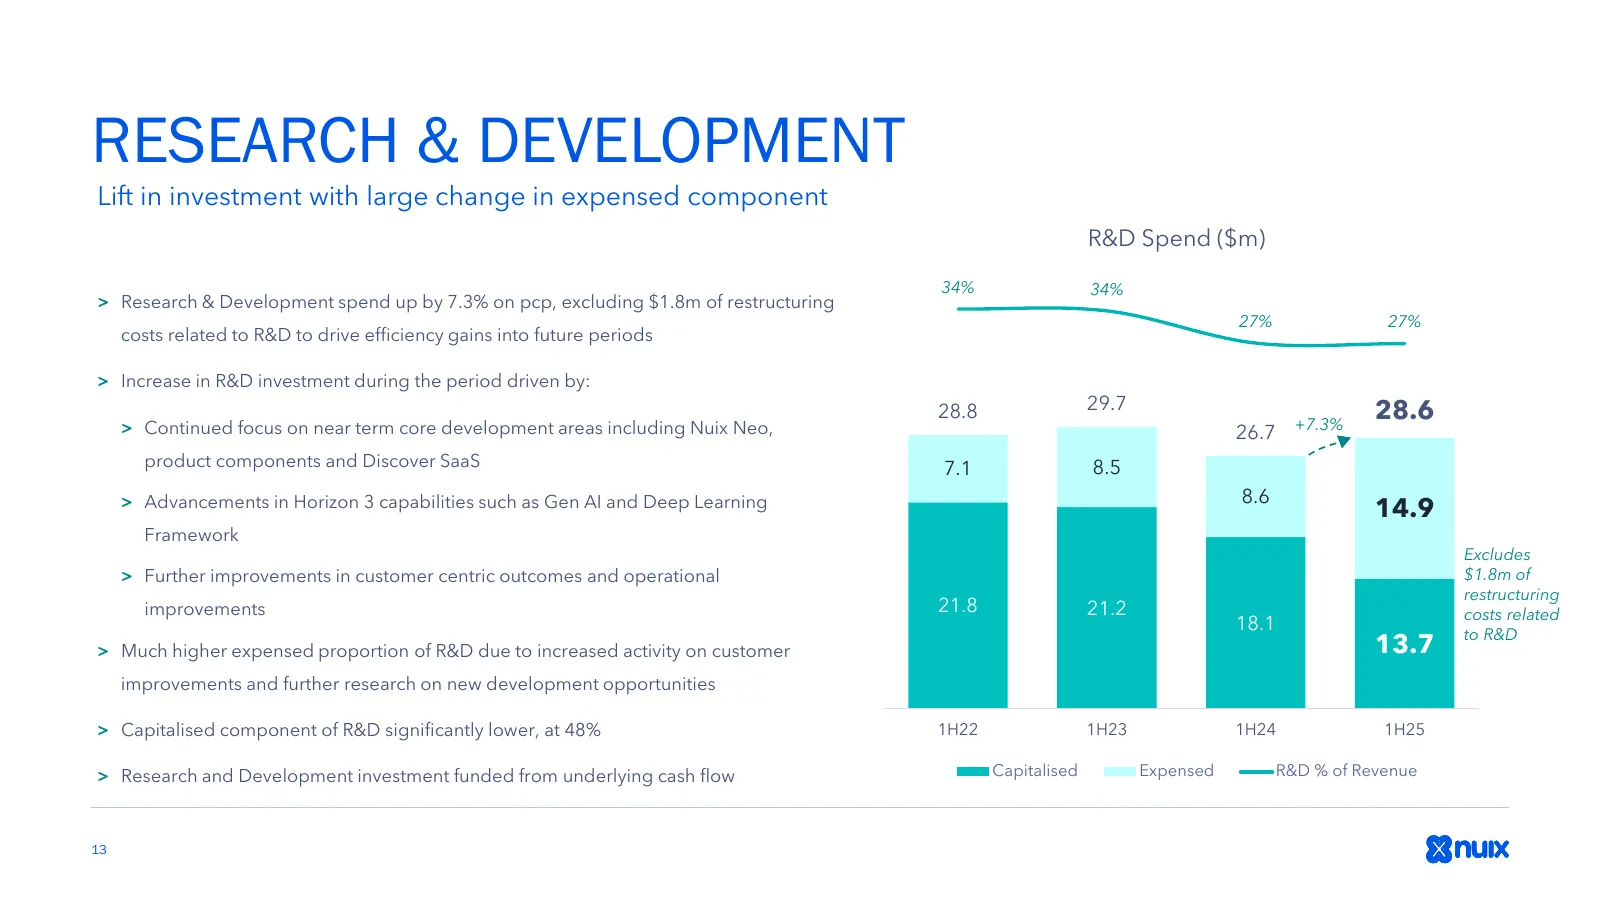
RESEARCH & DEVELOPMENT Lift in investment with large change in expensed component 50.0 R&D Spend ($m) 50% 45.0 34% 34% 40% > Research & Development spend up by 7.3% on pcp, excluding $1.8m of restructuring 40.0 27% 27% 30% costs related to R&D to drive efficiency gains into future periods > Increase
Slide 14: Cash EBITDA
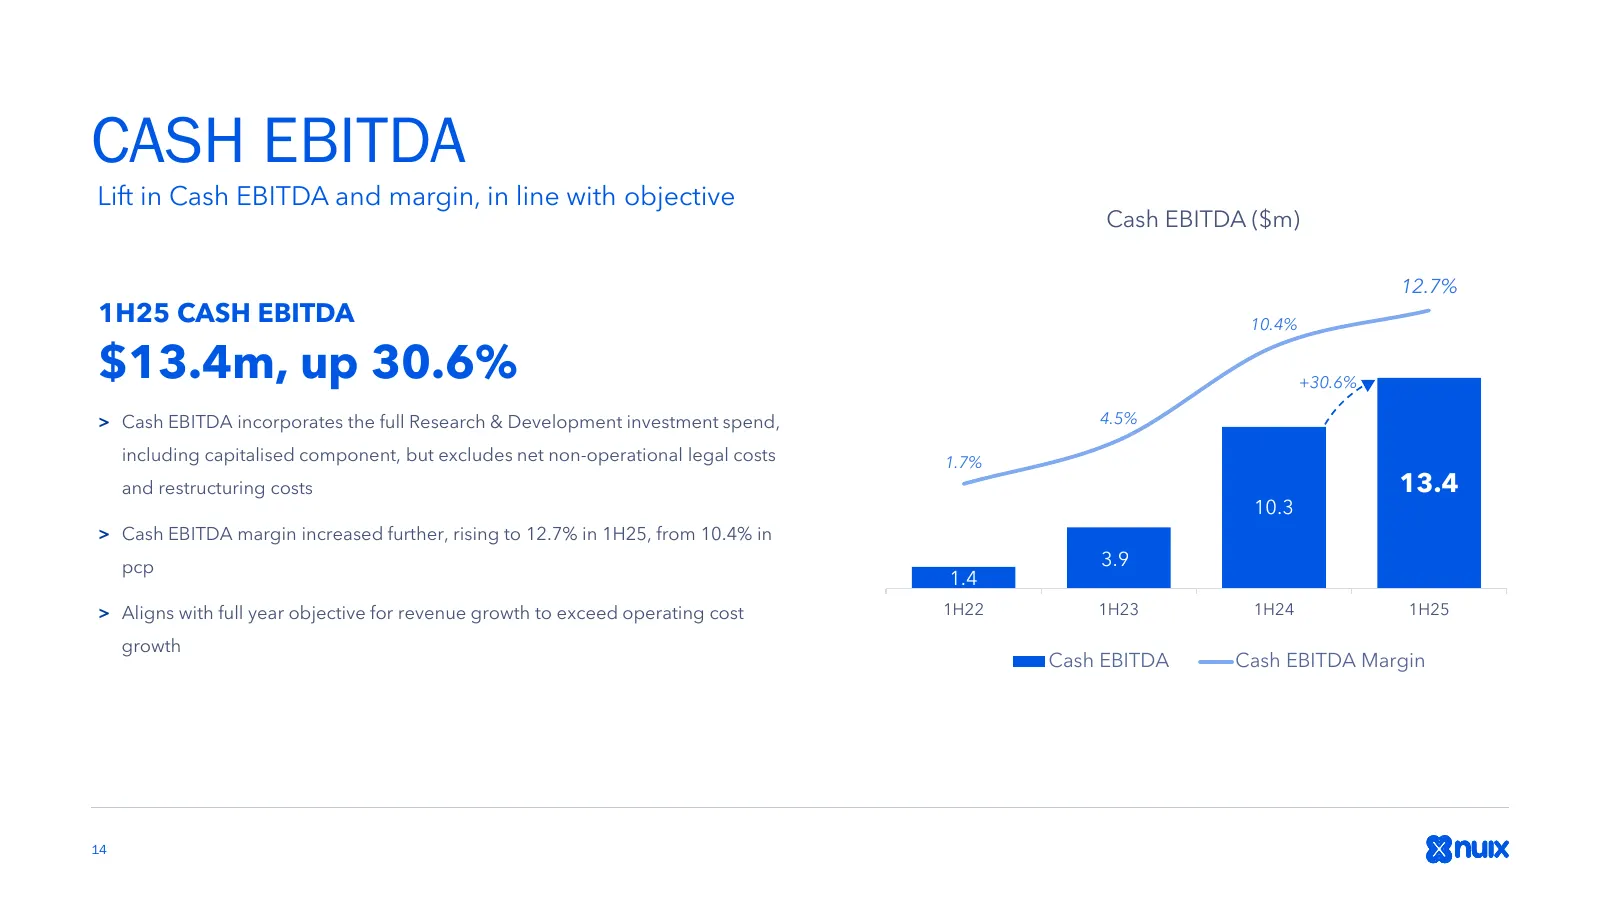
CASH EBITDA Lift in Cash EBITDA and margin, in line with objective Cash EBITDA ($m) 20.0 15.0% 12.7% 18.0 1H25 CASH EBITDA 10.4% 16.0 $13.4m, up 30.6% 14.0 +30.6% 10.0% 12.0 > Cash EBITDA incorporates the full Research & Development investment spend, 4.5% 10.0 5.0% including capitalised component, b
Slide 15: EBITDA
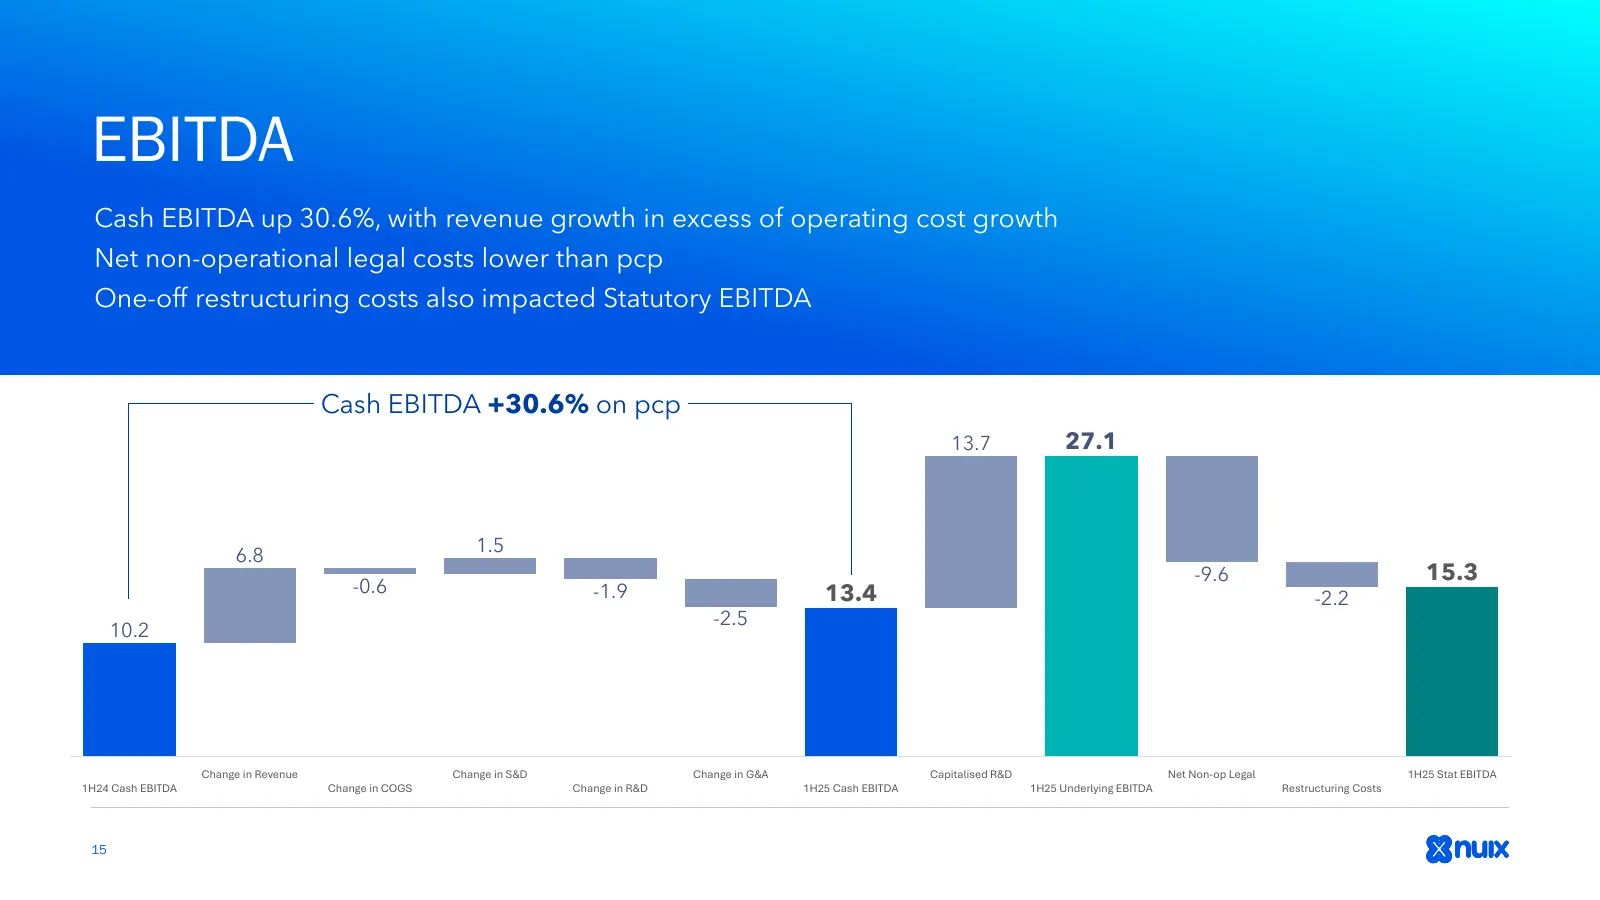
EBITDA Cash EBITDA up 30.6%, with revenue growth in excess of operating cost growth Net non-operational legal costs lower than pcp One-off restructuring costs also impacted Statutory EBITDA Cash EBITDA +30.6% on pcp 13.7 27.1 6.8 1.5 -9.6 15.3 -0.6 -1.9 13.4 -2.2 -2.5 10.2 Change in Revenue Change i
Slide 16: Income Statement
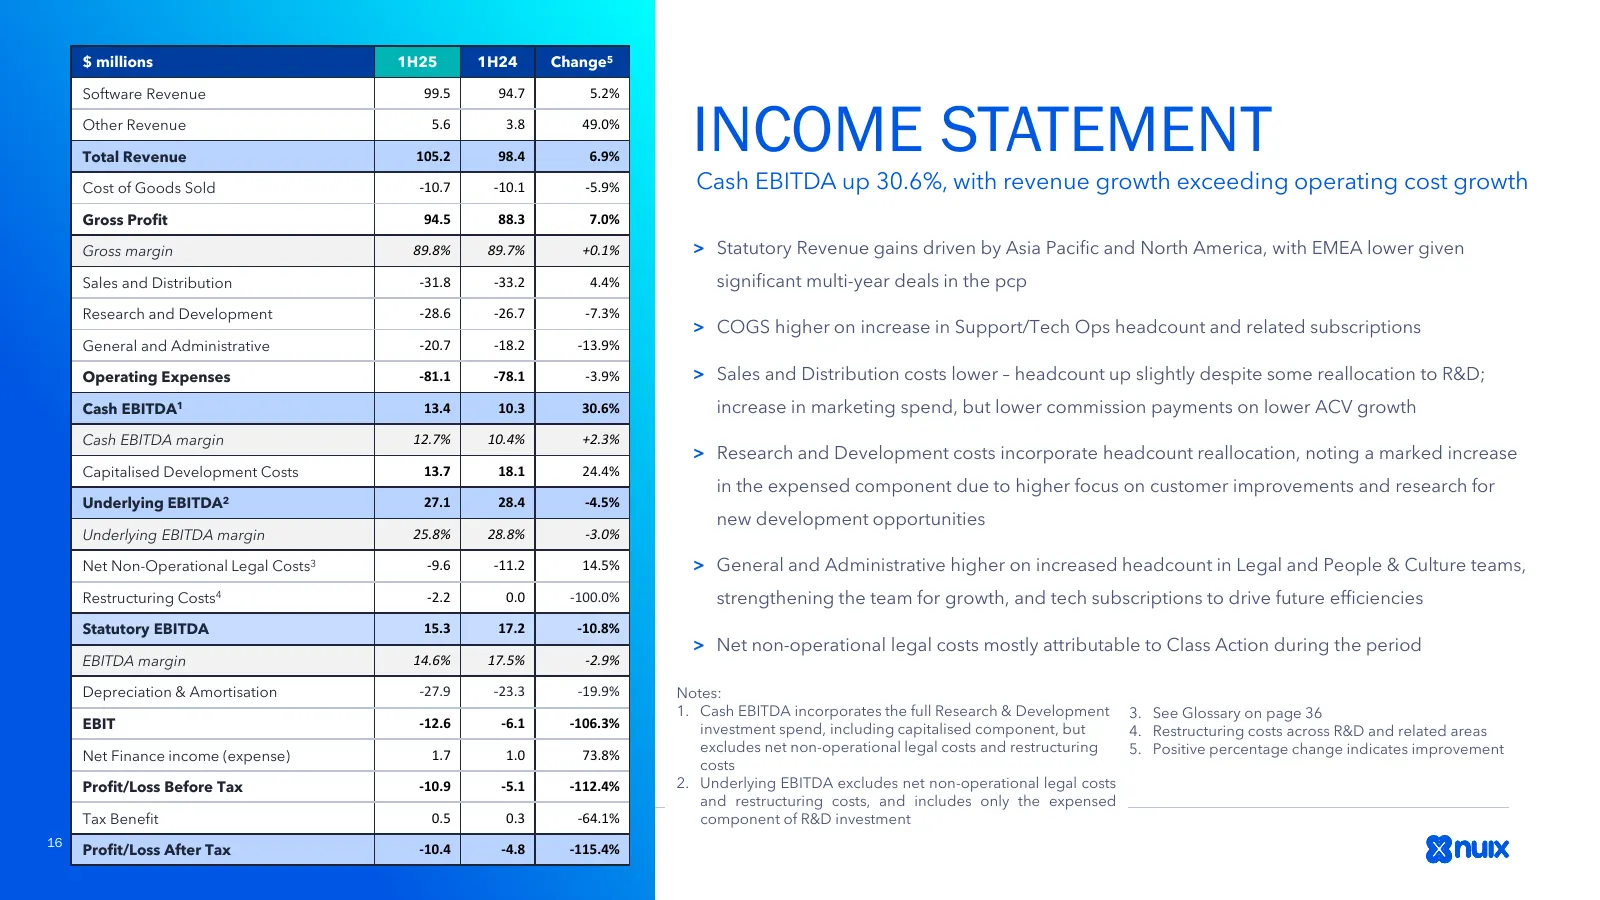
$ millions 1H25 1H24 Change5 Software Revenue 99.5 94.7 5.2% Other Revenue Total Revenue 5.6 105.2 3.8 98.4 49.0% 6.9% INCOME STATEMENT Cost of Goods Sold -10.7 -10.1 -5.9% Cash EBITDA up 30.6%, with revenue growth exceeding operating cost growth Gross Profit 94.5 88.3 7.0% Gross margin 89.8% 89.7%
Slide 17: Free Cash Flow
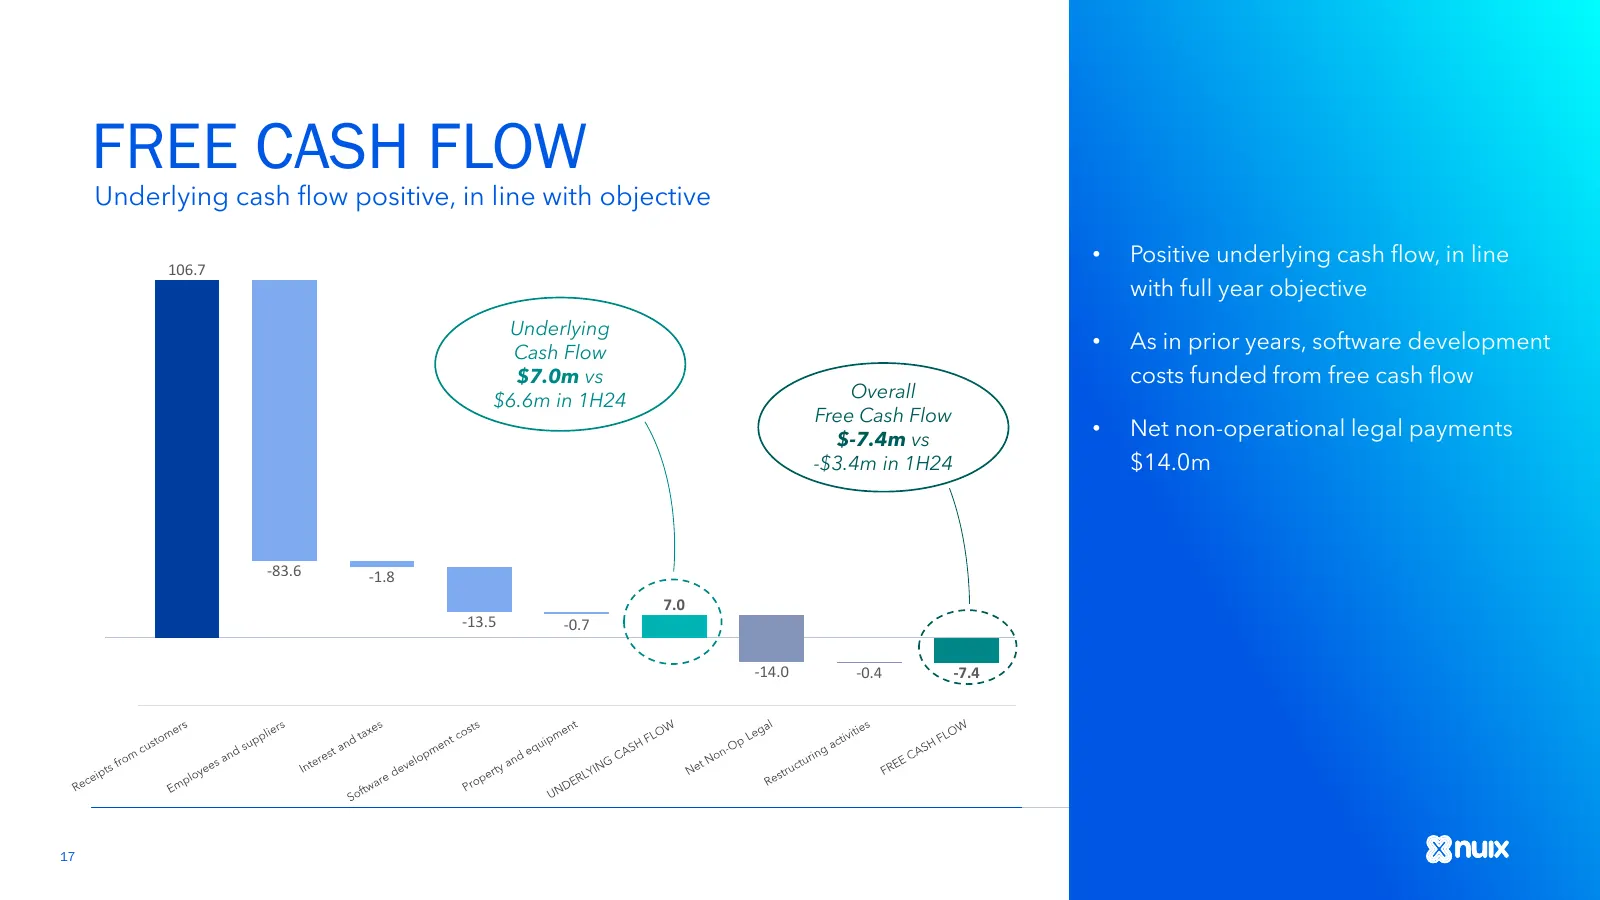
FREE CASH FLOW Underlying cash flow positive, in line with objective • Positive underlying cash flow, in line 106.7 with full year objective Underlying Cash Flow • As in prior years, software development $7.0m vs costs funded from free cash flow $6.6m in 1H24 Overall Free Cash Flow $-7.4m vs • Net n

Slide 18: 3. Strategy Update
3. STRATEGY UPDATE JONATHAN RUBINSZTEIN CHIEF EXECUTIVE OFFICER
Slide 19: Launched FY24
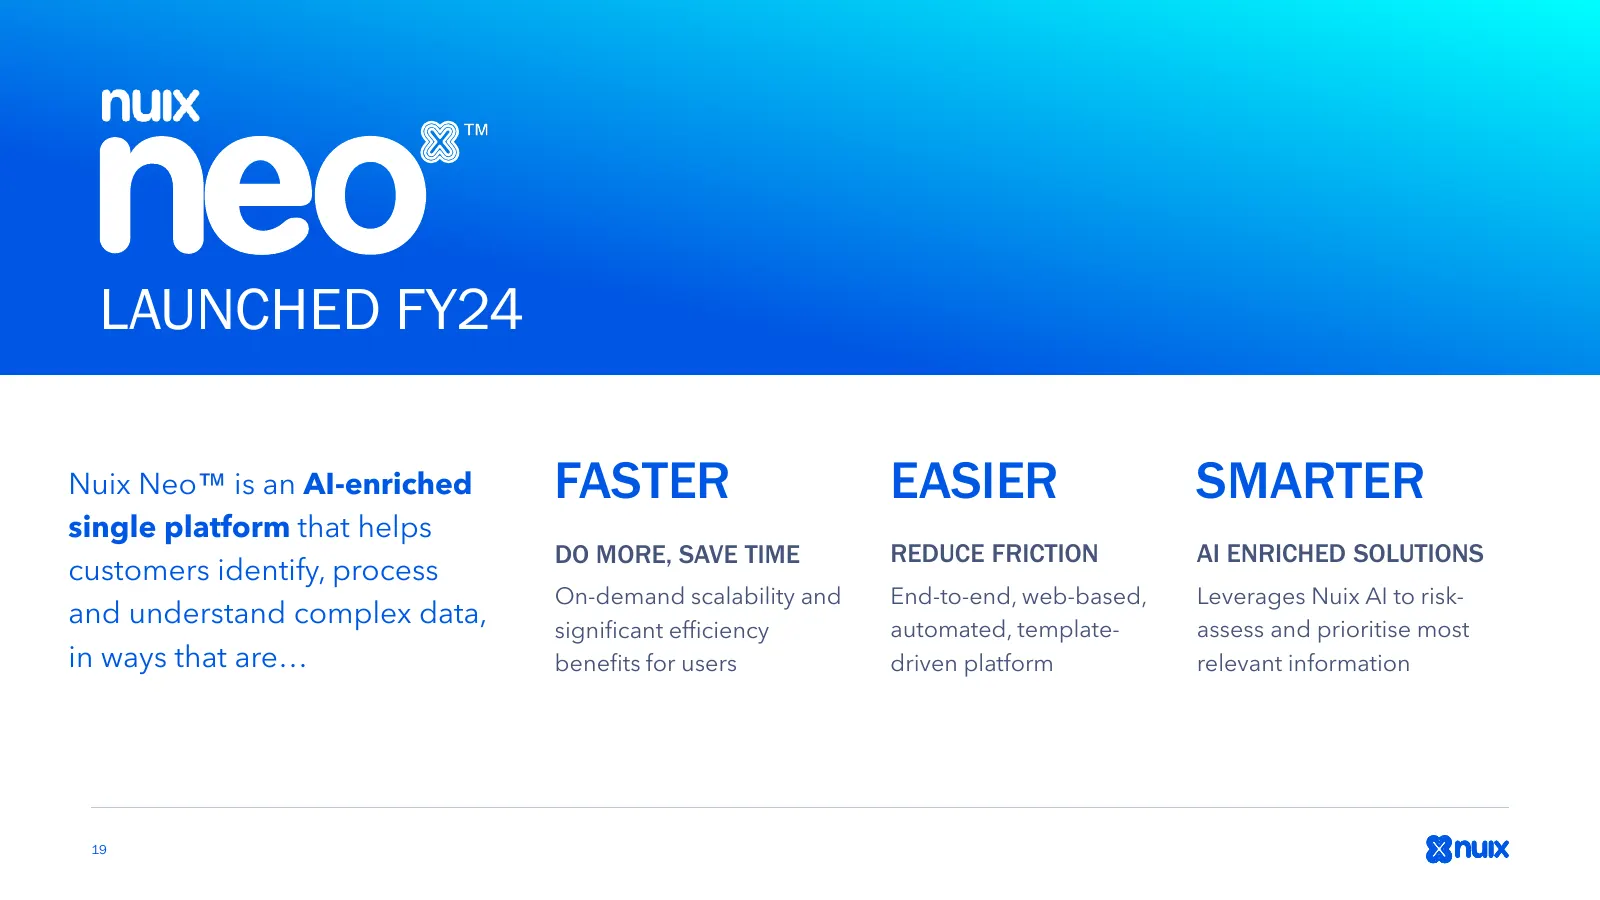
LAUNCHED FY24 Nuix Neo is an AI-enriched FASTER EASIER SMARTER single platform that helps DO MORE, SAVE TIME REDUCE FRICTION AI ENRICHED SOLUTIONS customers identify, process On-demand scalability and End-to-end, web-based, Leverages Nuix AI to risk- and understand complex data, significant efficien
Slide 20: Nuix Neo
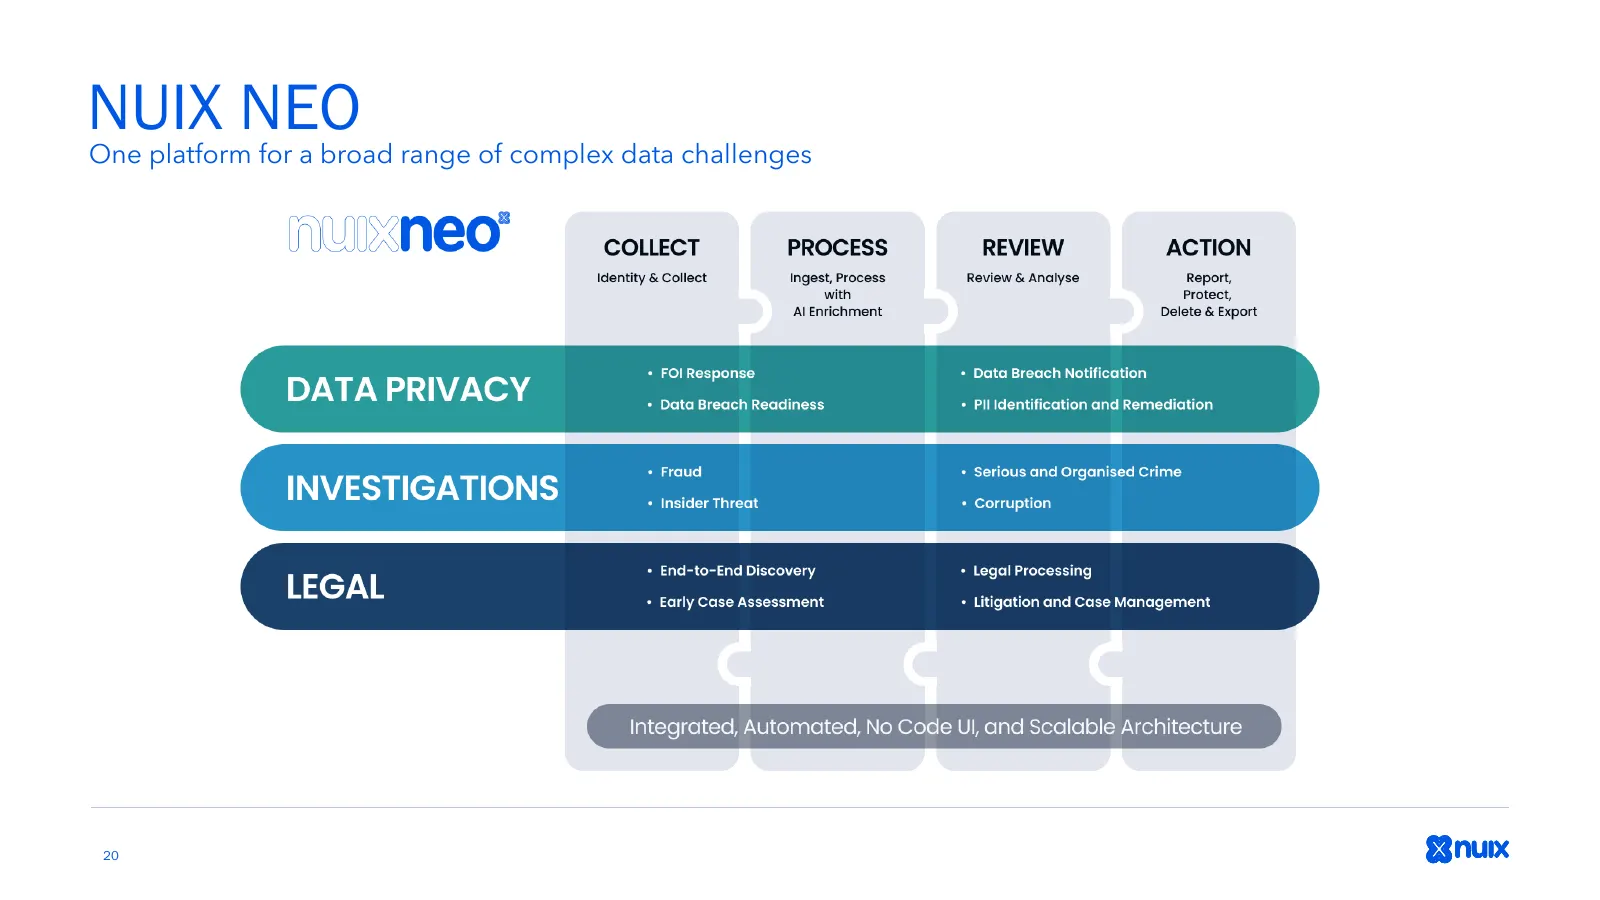
NUIX NEO One platform for a broad range of complex data challenges 20
Slide 21: Nuix Neo ACV
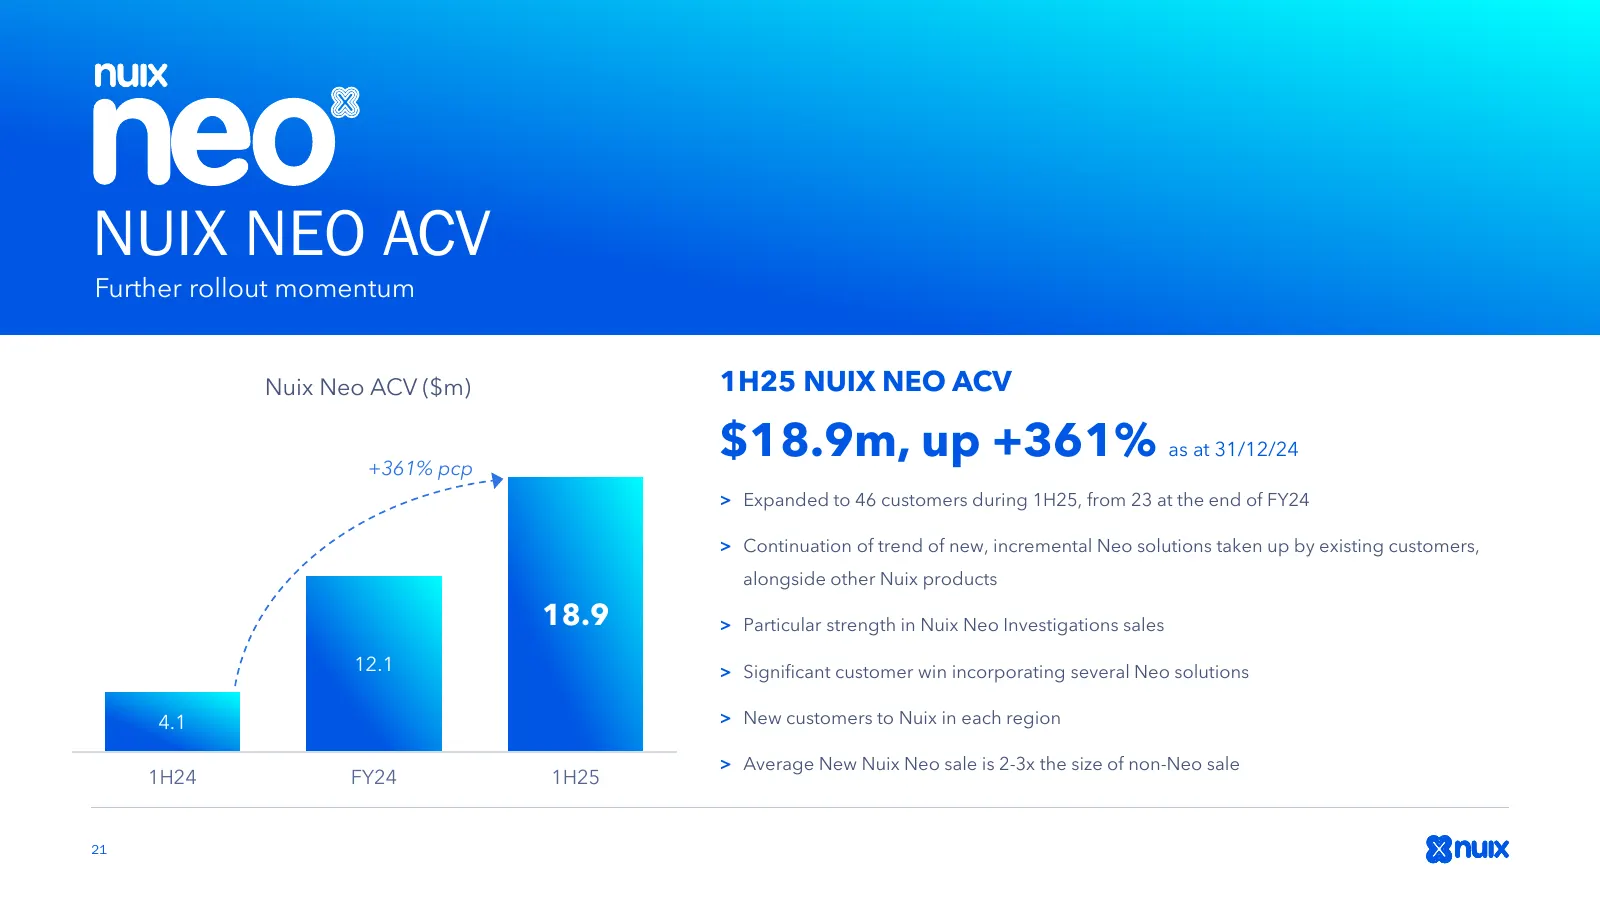
NUIX NEO ACV Further rollout momentum Nuix Neo ACV ($m) 1H25 NUIX NEO ACV +361% pcp $18.9m, up +361% as at 31/12/24 > Expanded to 46 customers during 1H25, from 23 at the end of FY24 > Continuation of trend of new, incremental Neo solutions taken up by existing customers, alongside other Nuix produc
Slide 22: Technology Delivery Update
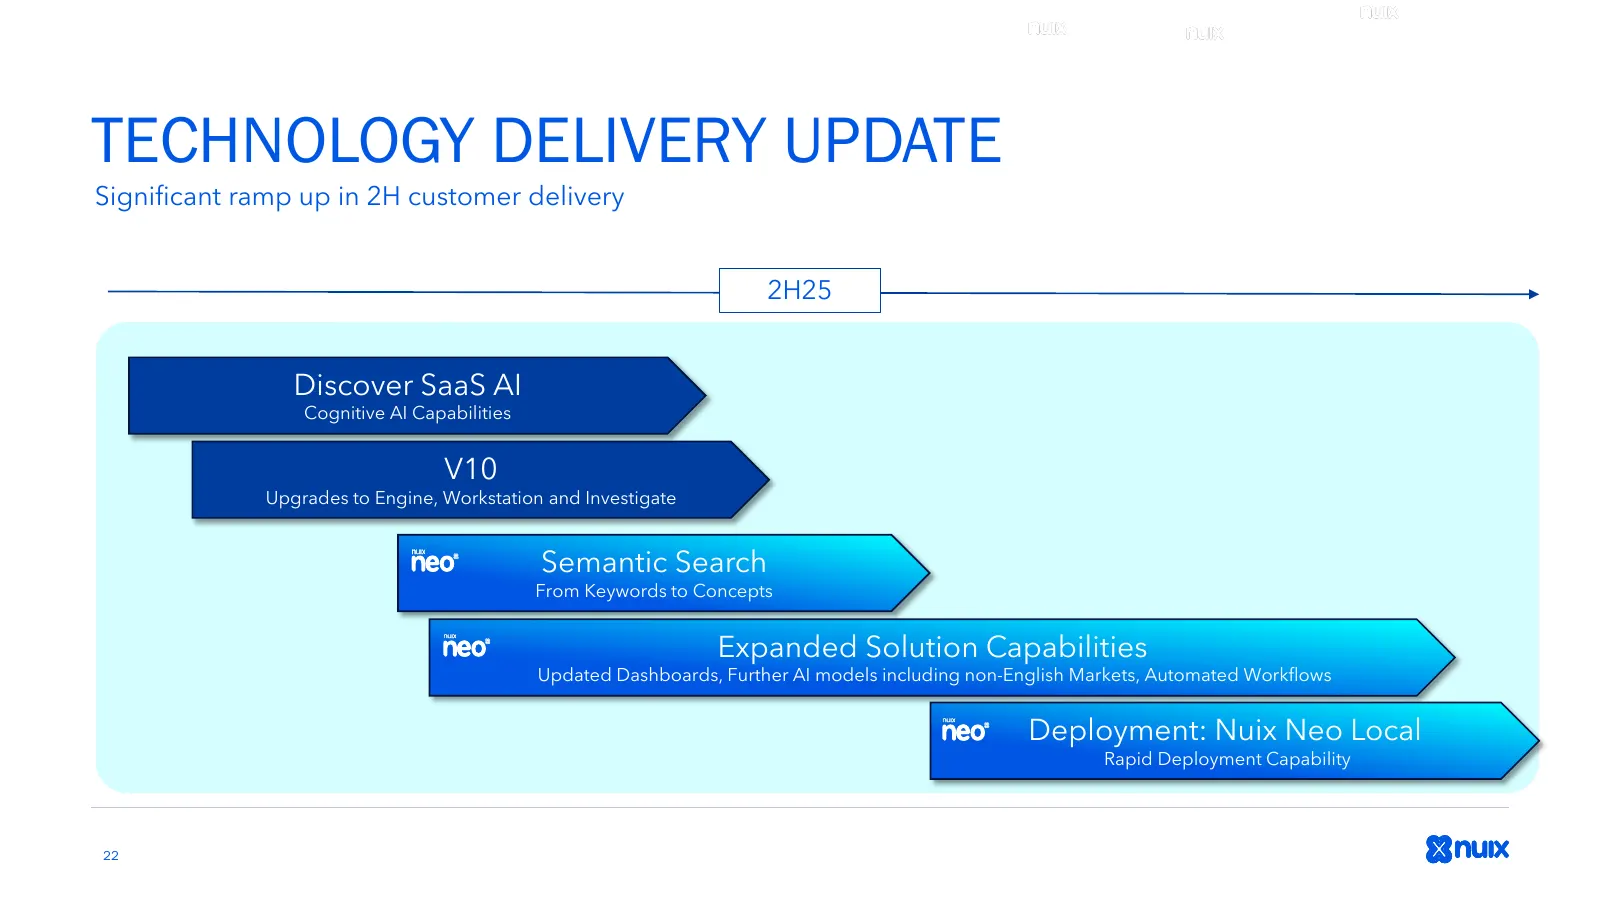
TECHNOLOGY DELIVERY UPDATE Significant ramp up in 2H customer delivery 2H25 Discover SaaS AI Cognitive AI Capabilities V10 Upgrades to Engine, Workstation and Investigate Semantic Search From Keywords to Concepts Expanded Solution Capabilities Updated Dashboards, Further AI models including non-Engl
Slide 23: Technology Restructure
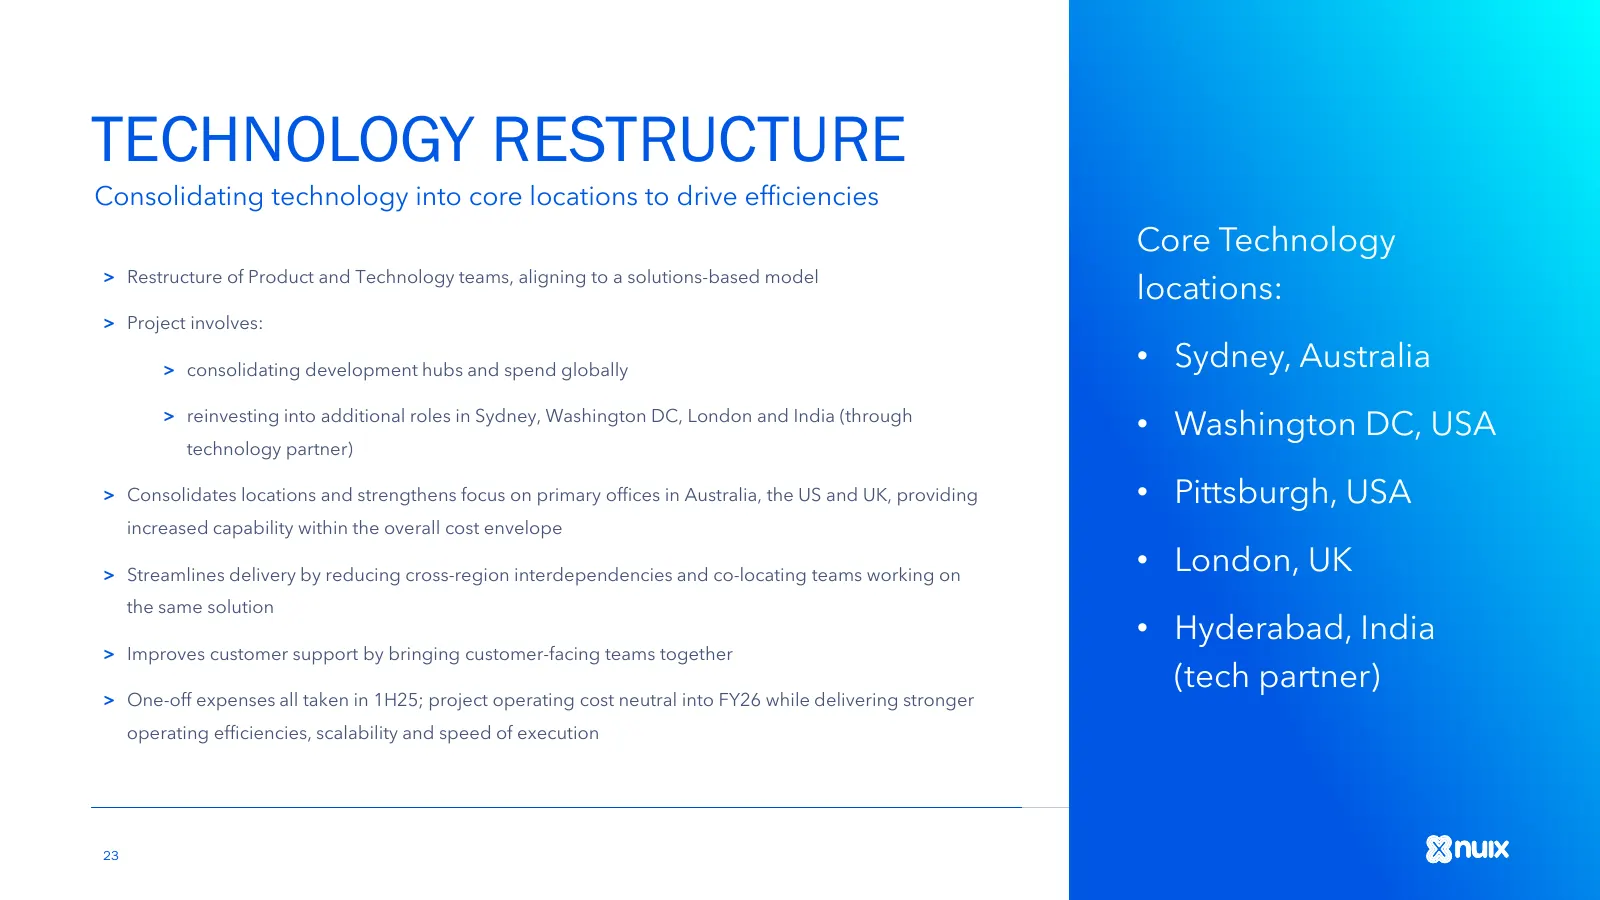
TECHNOLOGY RESTRUCTURE Consolidating technology into core locations to drive efficiencies Nuix aims to be underlying free cash flow Core Technology > Restructure of Product and Technology teams, aligning to a solutions-based model neutral locations: > Project involves: > consolidating development hu
Slide 24: Deep Learning Framework
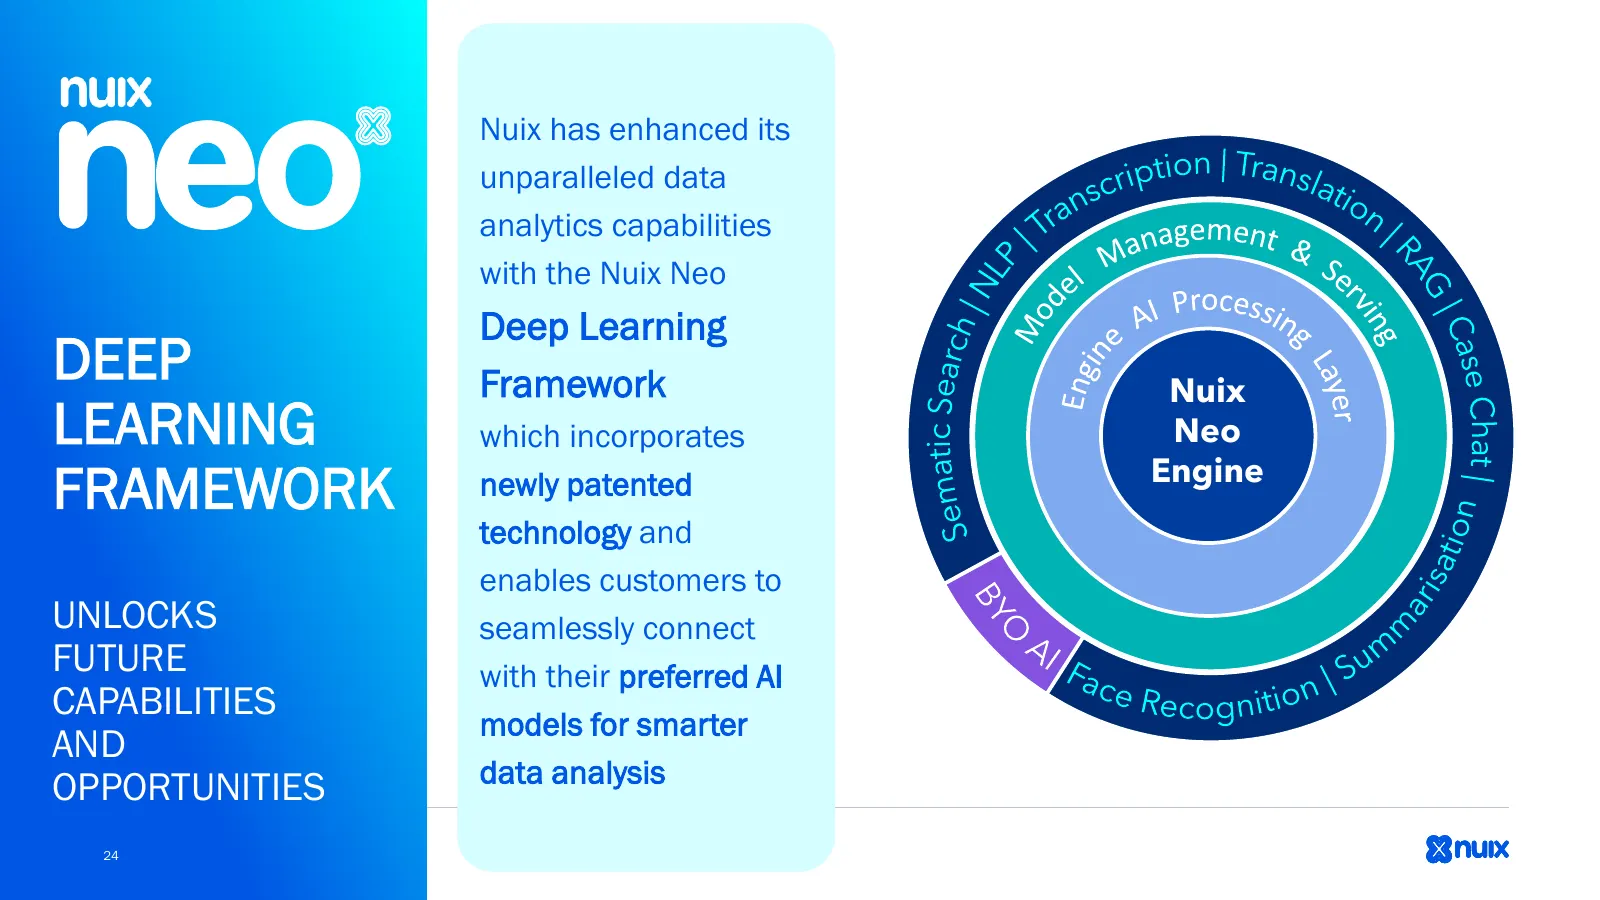
Nuix has enhanced its unparalleled data analytics capabilities with the Nuix Neo Deep Learning DEEP Framework Nuix LEARNING which incorporates Neo Engine FRAMEWORK newly patented technology and enables customers to UNLOCKS seamlessly connect FUTURE with their preferred AI CAPABILITIES models for sma
Slide 25: Shifting Further to Higher Value Contracts
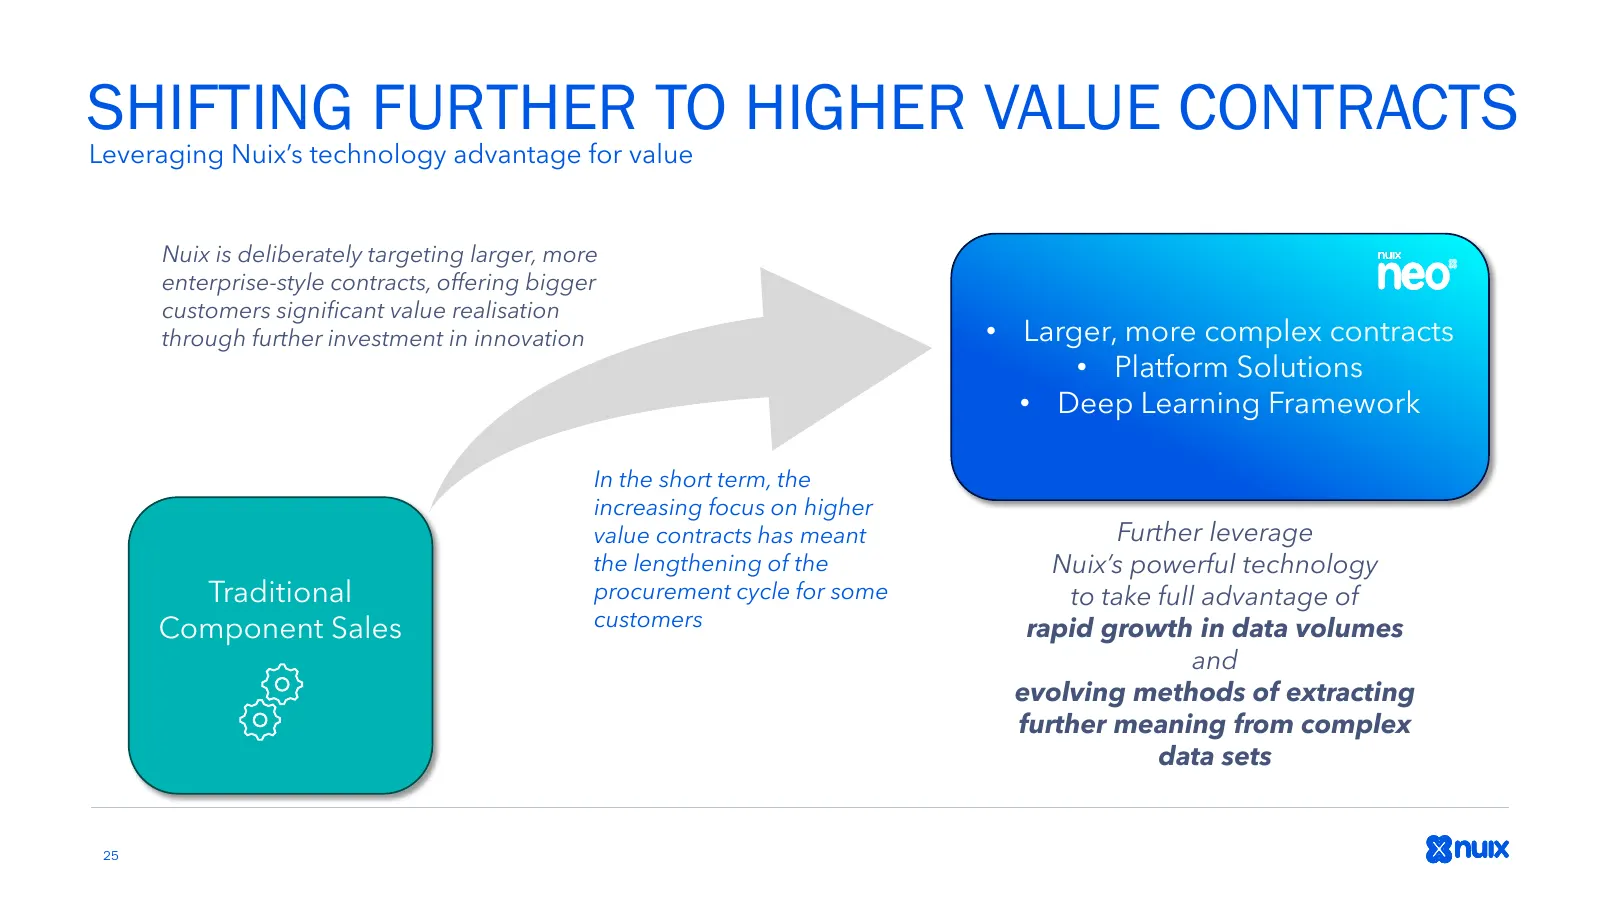
SHIFTING FURTHER TO HIGHER VALUE CONTRACTS Leveraging Nuix’s technology advantage for value Nuix is deliberately targeting larger, more enterprise-style contracts, offering bigger customers significant value realisation through further investment in innovation • Larger, more complex contracts • Plat

Slide 26: 4. Outlook
4. OUTLOOK JONATHAN RUBINSZTEIN CHIEF EXECUTIVE OFFICER
Slide 27: Outlook
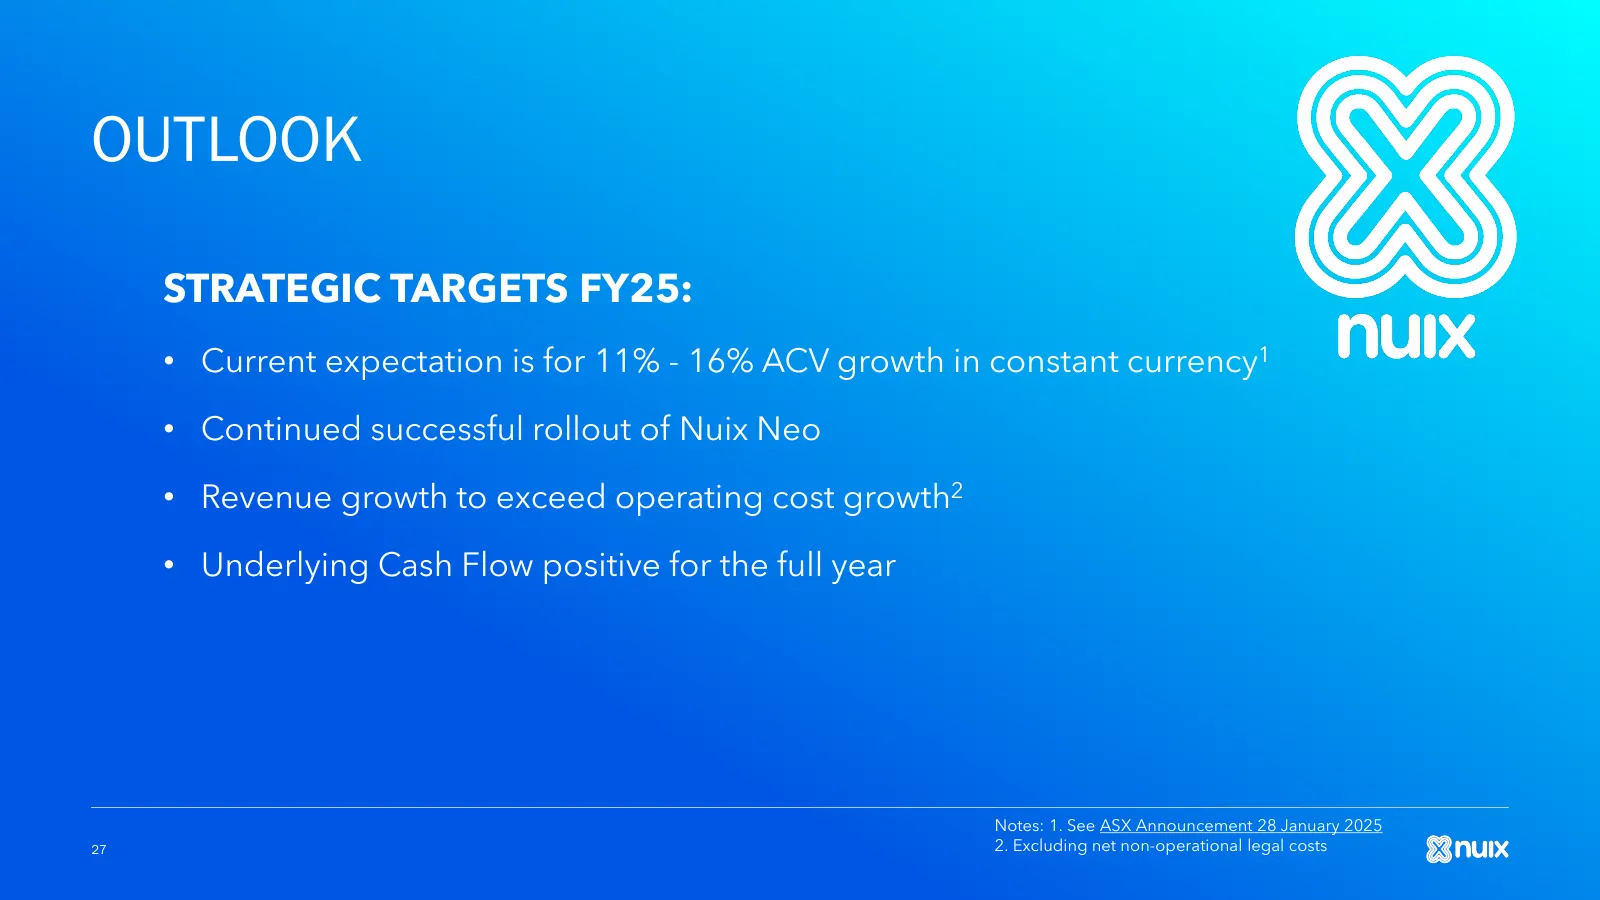
OUTLOOK STRATEGIC TARGETS FY25: • Current expectation is for 11% - 16% ACV growth in constant currency1 • Continued successful rollout of Nuix Neo • Revenue growth to exceed operating cost growth2 • Underlying Cash Flow positive for the full year Notes: 1. See ASX Announcement 28 January 2025 27 2.

Slide 28: Q&A
Q&A 28

Slide 29: Appendix
APPENDIX Snux
Slide 30: Balance Sheet
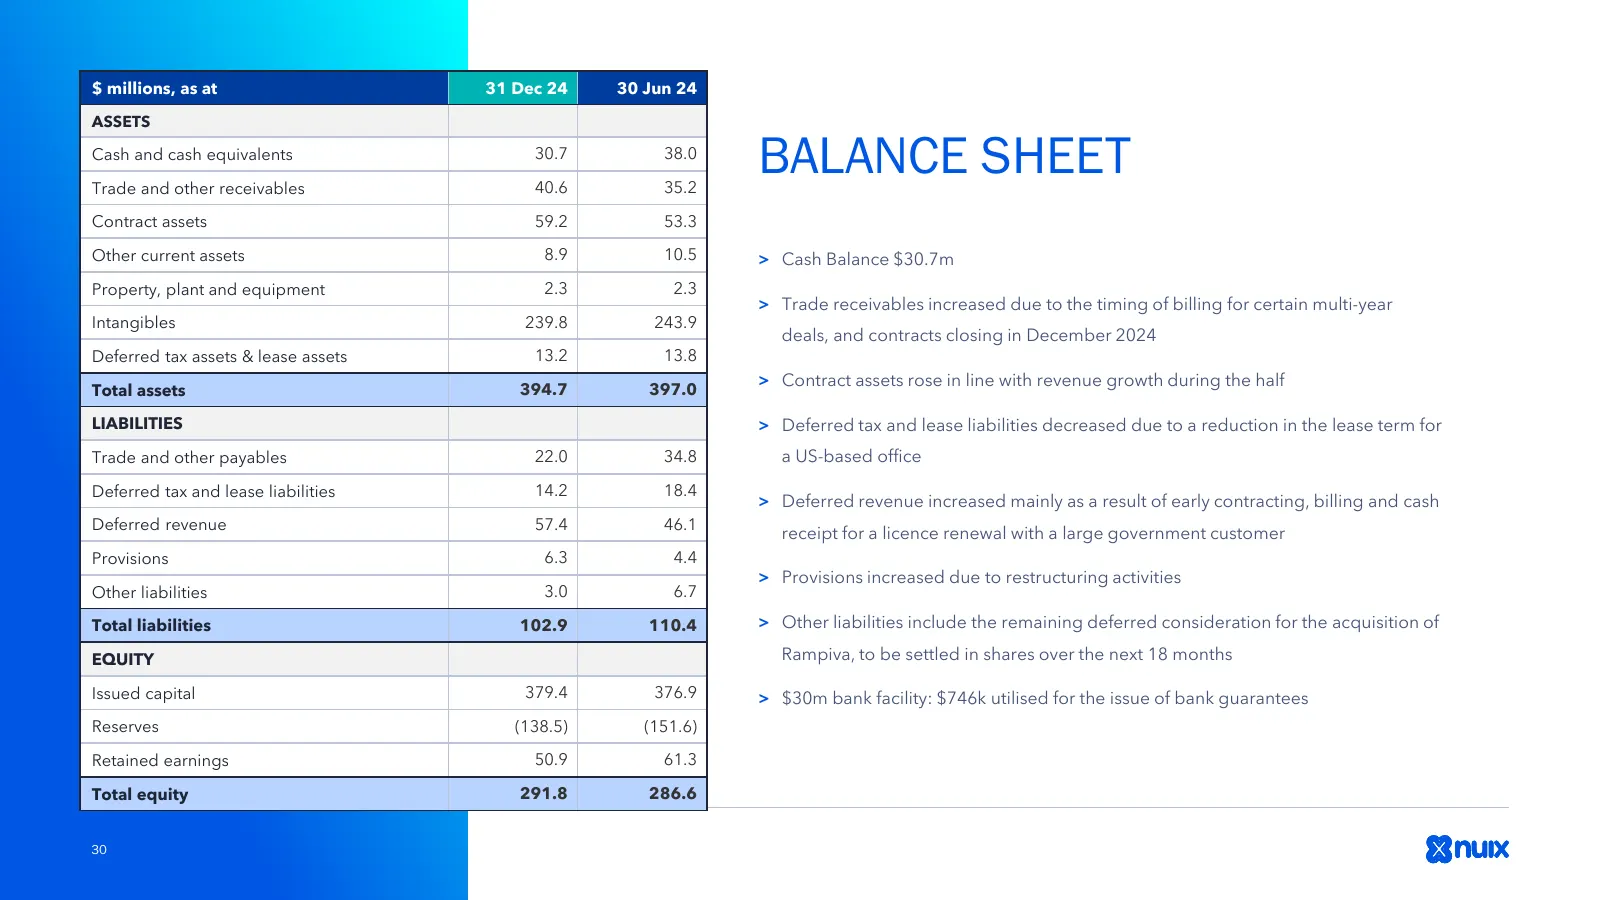
$ millions, as at 31 Dec 24 30 Jun 24 ASSETS Cash and cash equivalents Trade and other receivables 30.7 40.6 38.0 35.2 BALANCE SHEET Contract assets 59.2 53.3 Other current assets 8.9 10.5 > Cash Balance $30.7m Property, plant and equipment 2.3 2.3 > Trade receivables increased due to the timing of
Slide 31: Customer Base
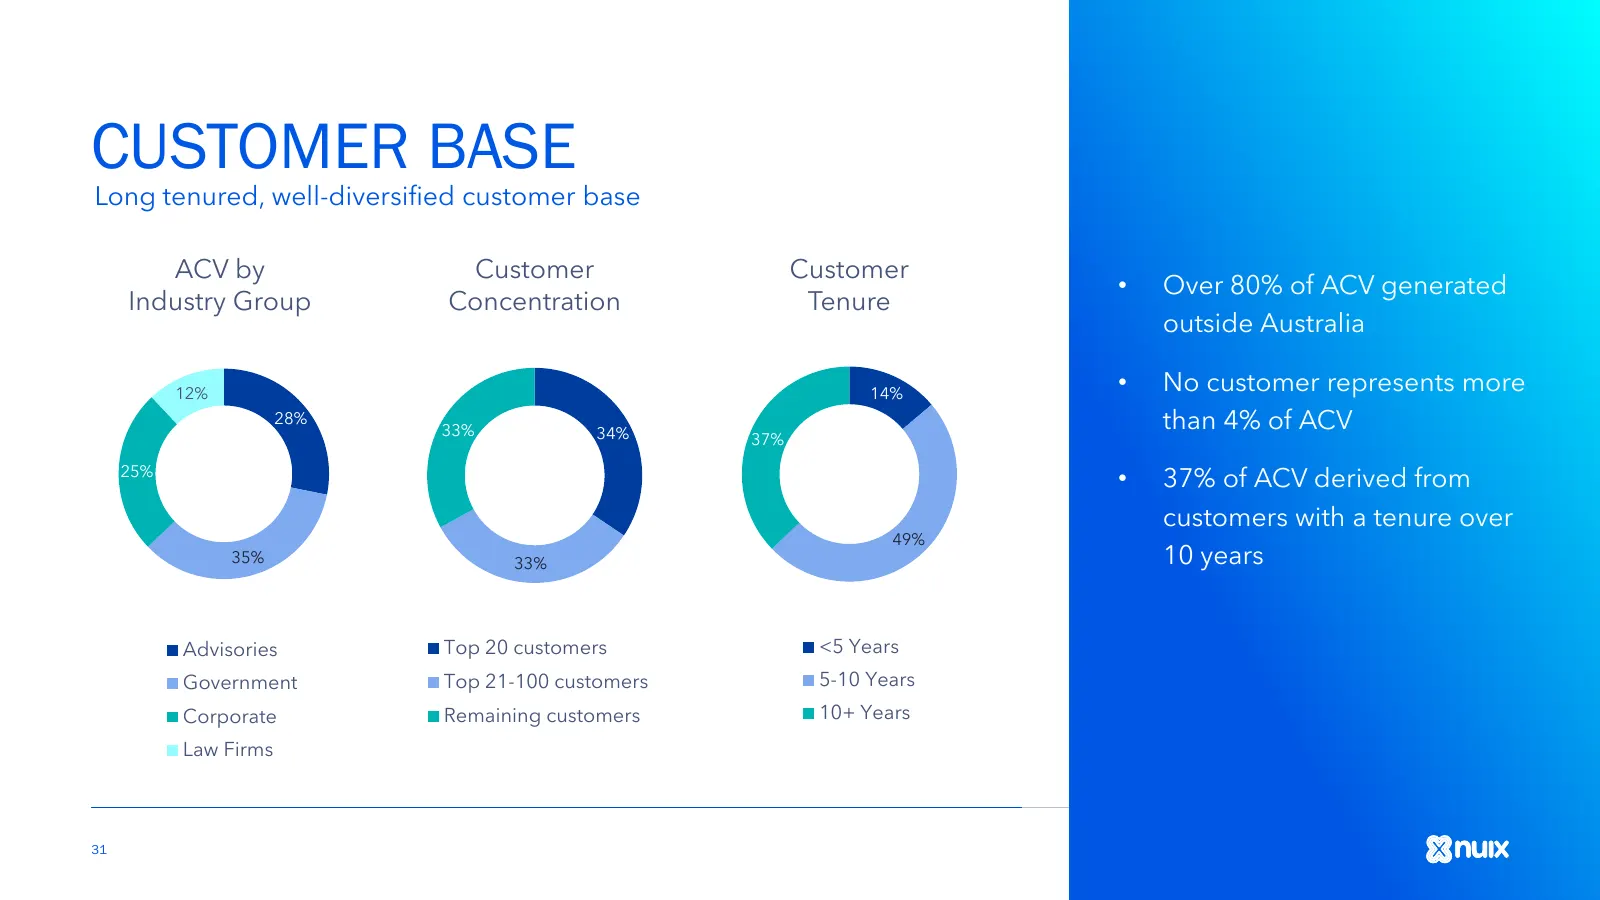
CUSTOMER BASE Long tenured, well-diversified customer base ACV by Customer Customer • Over 80% of ACV generated Industry Group Concentration Tenure outside Australia 12% 14% • No customer represents more 28% 33% 34% than 4% of ACV 37% 25% • 37% of ACV derived from customers with a tenure over 49% 35
Slide 32: ACV by Licence Type
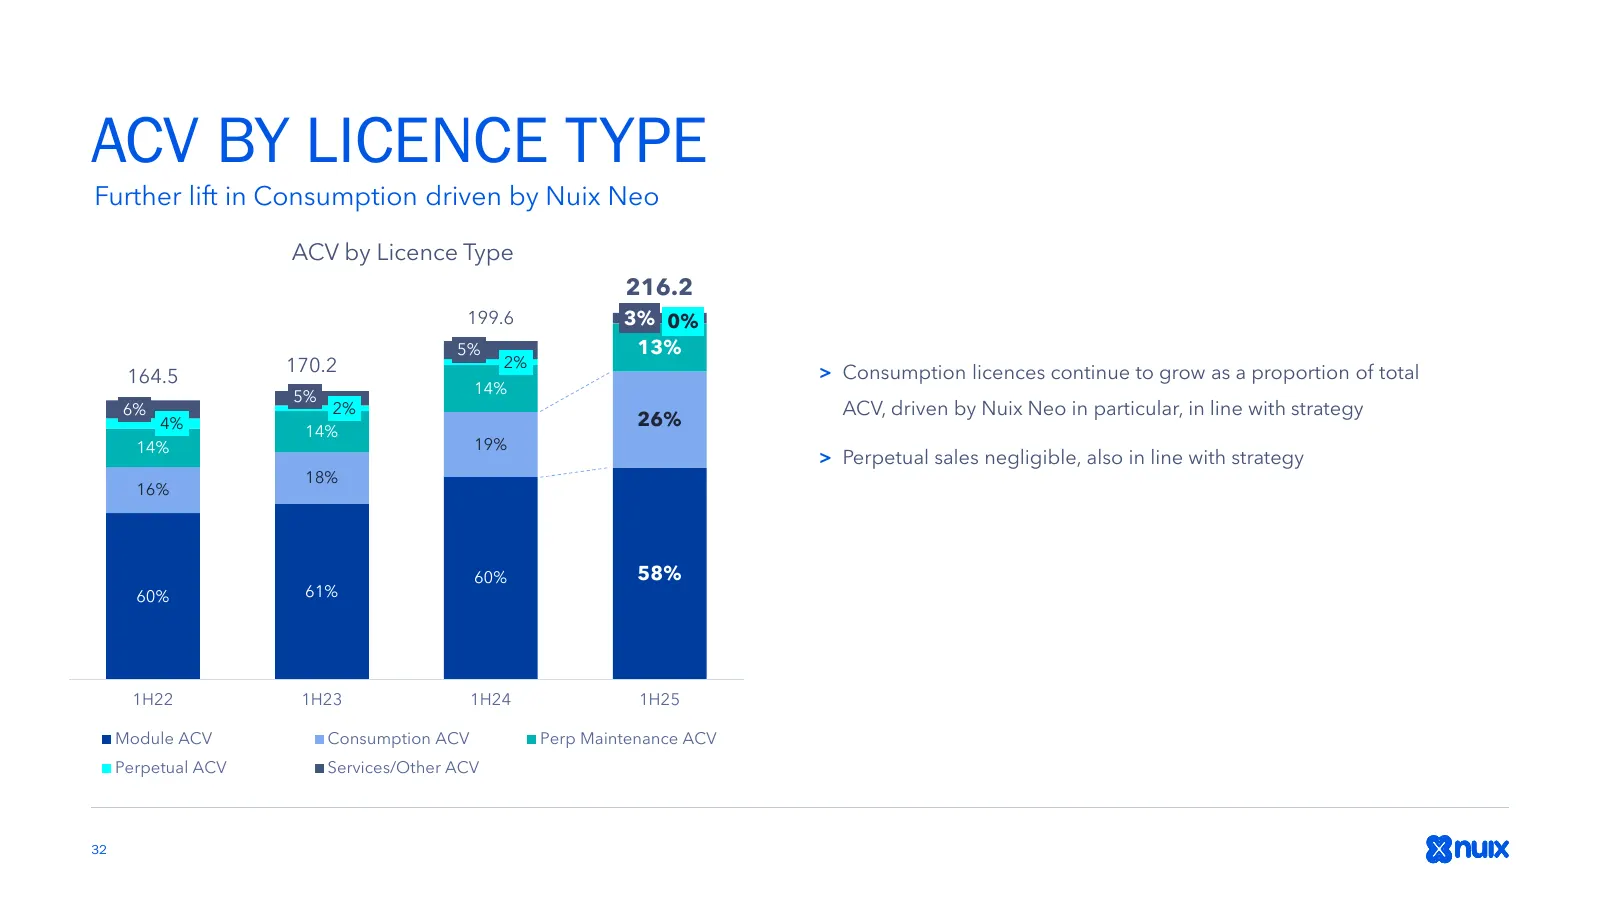
ACV BY LICENCE TYPE Further lift in Consumption driven by Nuix Neo ACV by Licence Type 216.2 199.6 3% 0% 5% 13% 170.2 2% 164.5 > Consumption licences continue to grow as a proportion of total 5% 14% 6% 2% ACV, driven by Nuix Neo in particular, in line with strategy 4% 26% 14% 14% 19% > Perpetual sal
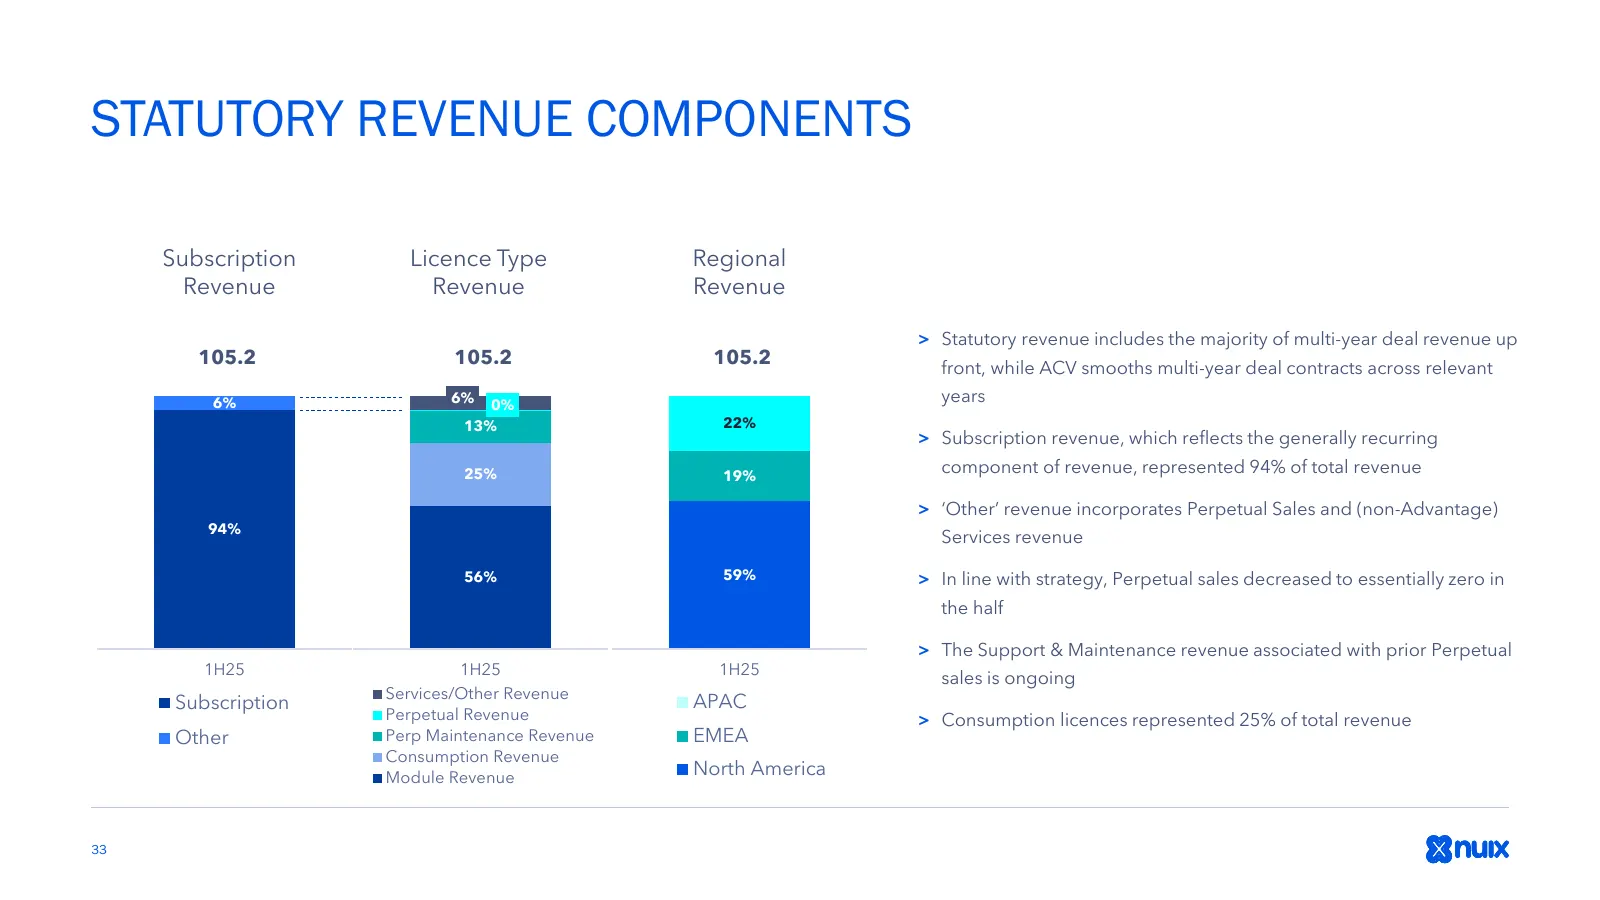
Slide 33: Statutory Revenue Components
STATUTORY REVENUE COMPONENTS Subscription Licence Type Regional Revenue Revenue Revenue > Statutory revenue includes the majority of multi-year deal revenue up 105.2 105.2 105.2 front, while ACV smooths multi-year deal contracts across relevant 6% 6% 0% years 13% 22% > Subscription revenue, which re
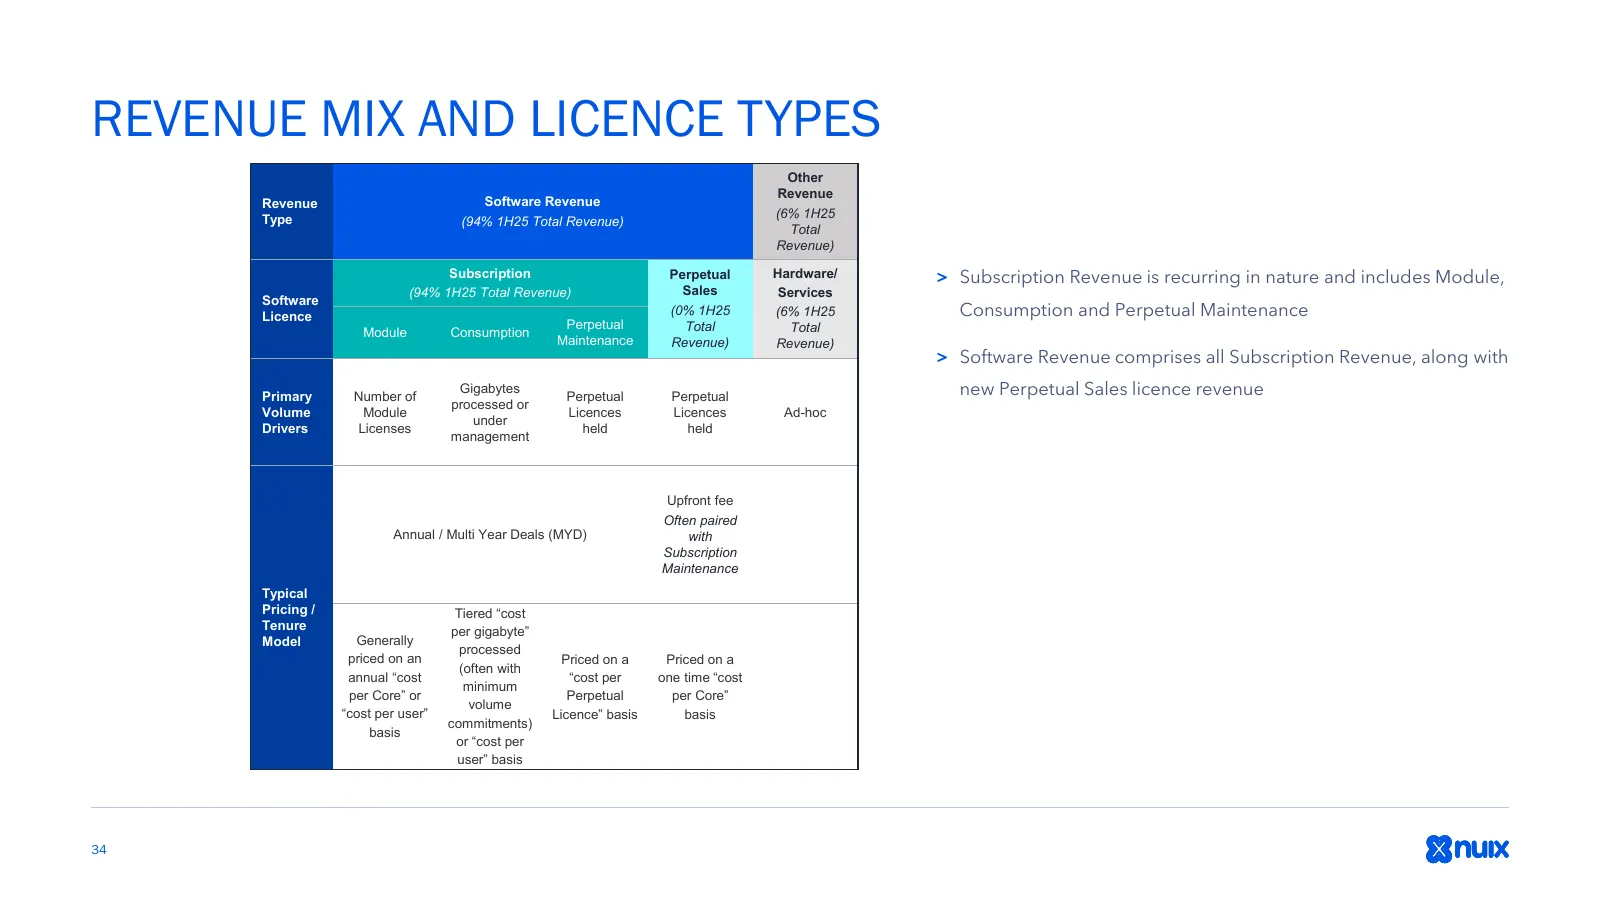
Slide 34: Revenue Mix and Licence Types
REVENUE MIX AND LICENCE TYPES Other Revenue Revenue Software Revenue Type (6% 1H25 (94% 1H25 Total Revenue) Total Revenue) Subscription Perpetual Hardware/ > Subscription Revenue is recurring in nature and includes Module, (94% 1H25 Total Revenue) Sales Services Software Licence (0% 1H25 (6% 1H25 Co
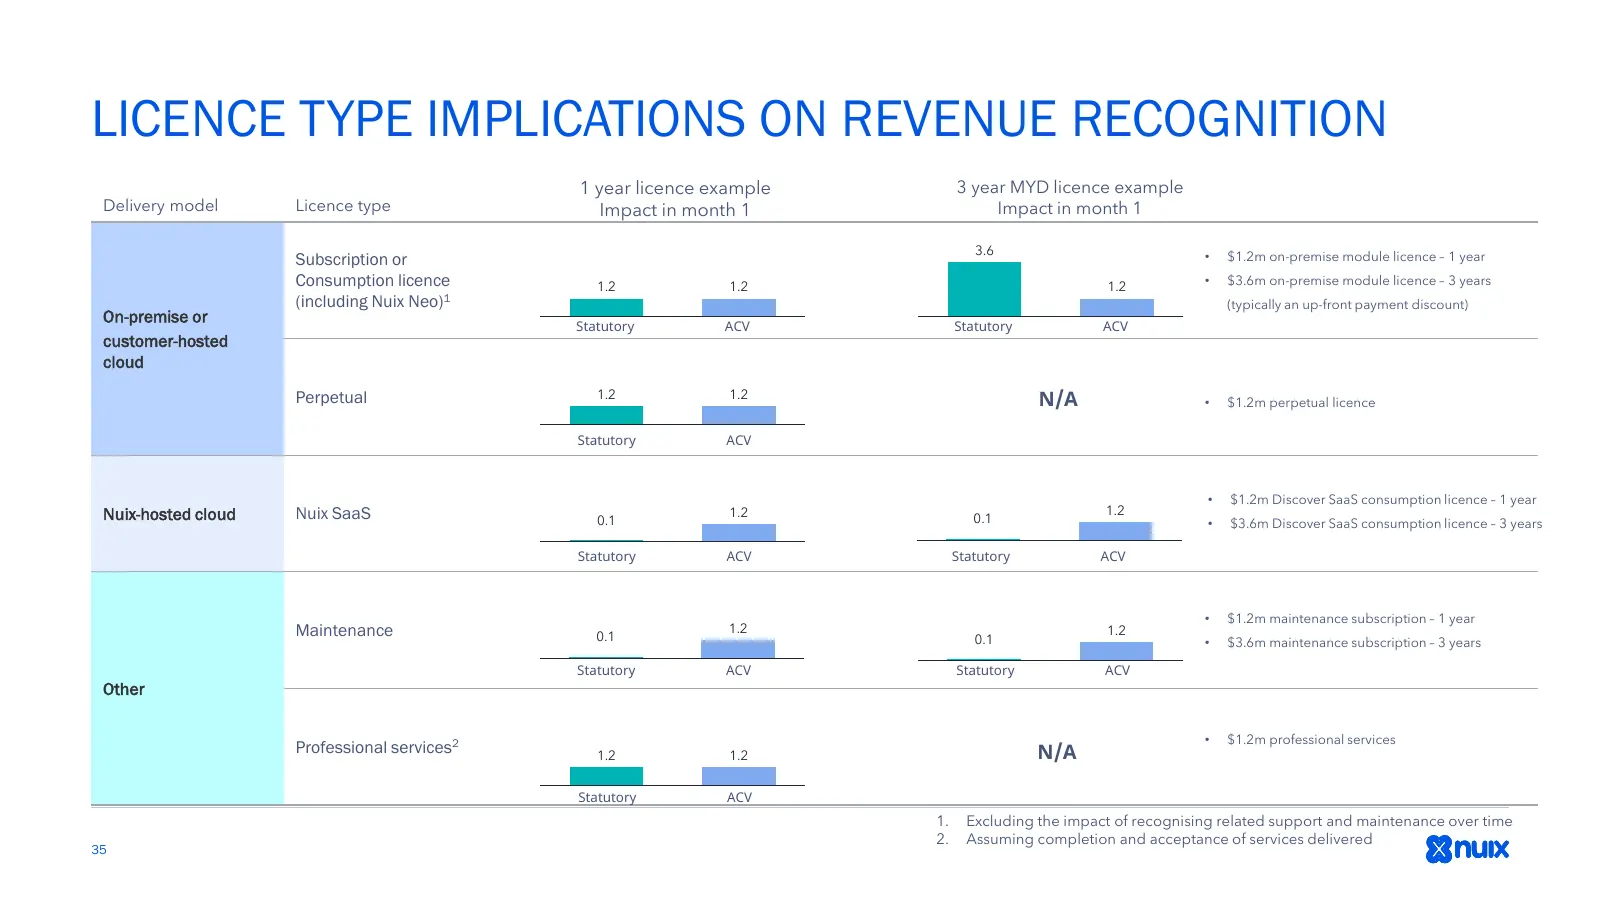
Slide 35: Licence Type Implications on Revenue Recognition
LICENCE TYPE IMPLICATIONS ON REVENUE RECOGNITION 1 year licence example 3 year MYD licence example Delivery model Licence type Impact in month 1 Impact in month 1 3.6 • $1.2m on-premise module licence – 1 year Subscription or Consumption licence 1.2 1.2 1.2 • $3.6m on-premise module licence – 3 year
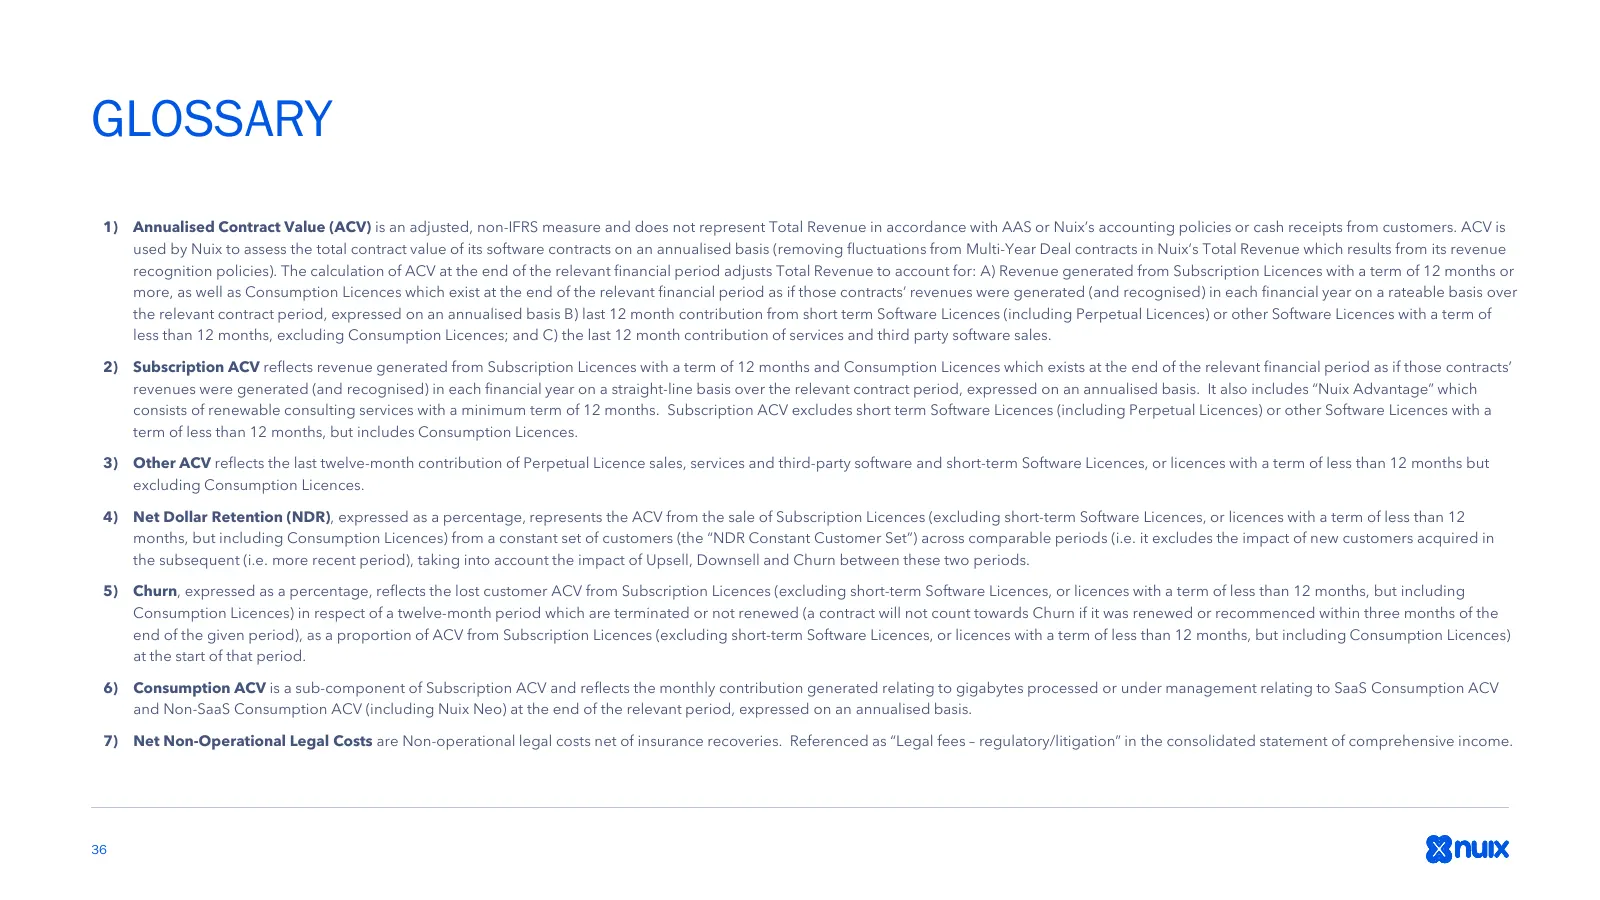
Slide 36: Glossary
GLOSSARY 1) Annualised Contract Value (ACV) is an adjusted, non-IFRS measure and does not represent Total Revenue in accordance with AAS or Nuix’s accounting policies or cash receipts from customers. ACV is used by Nuix to assess the total contract value of its software contracts on an annualised ba
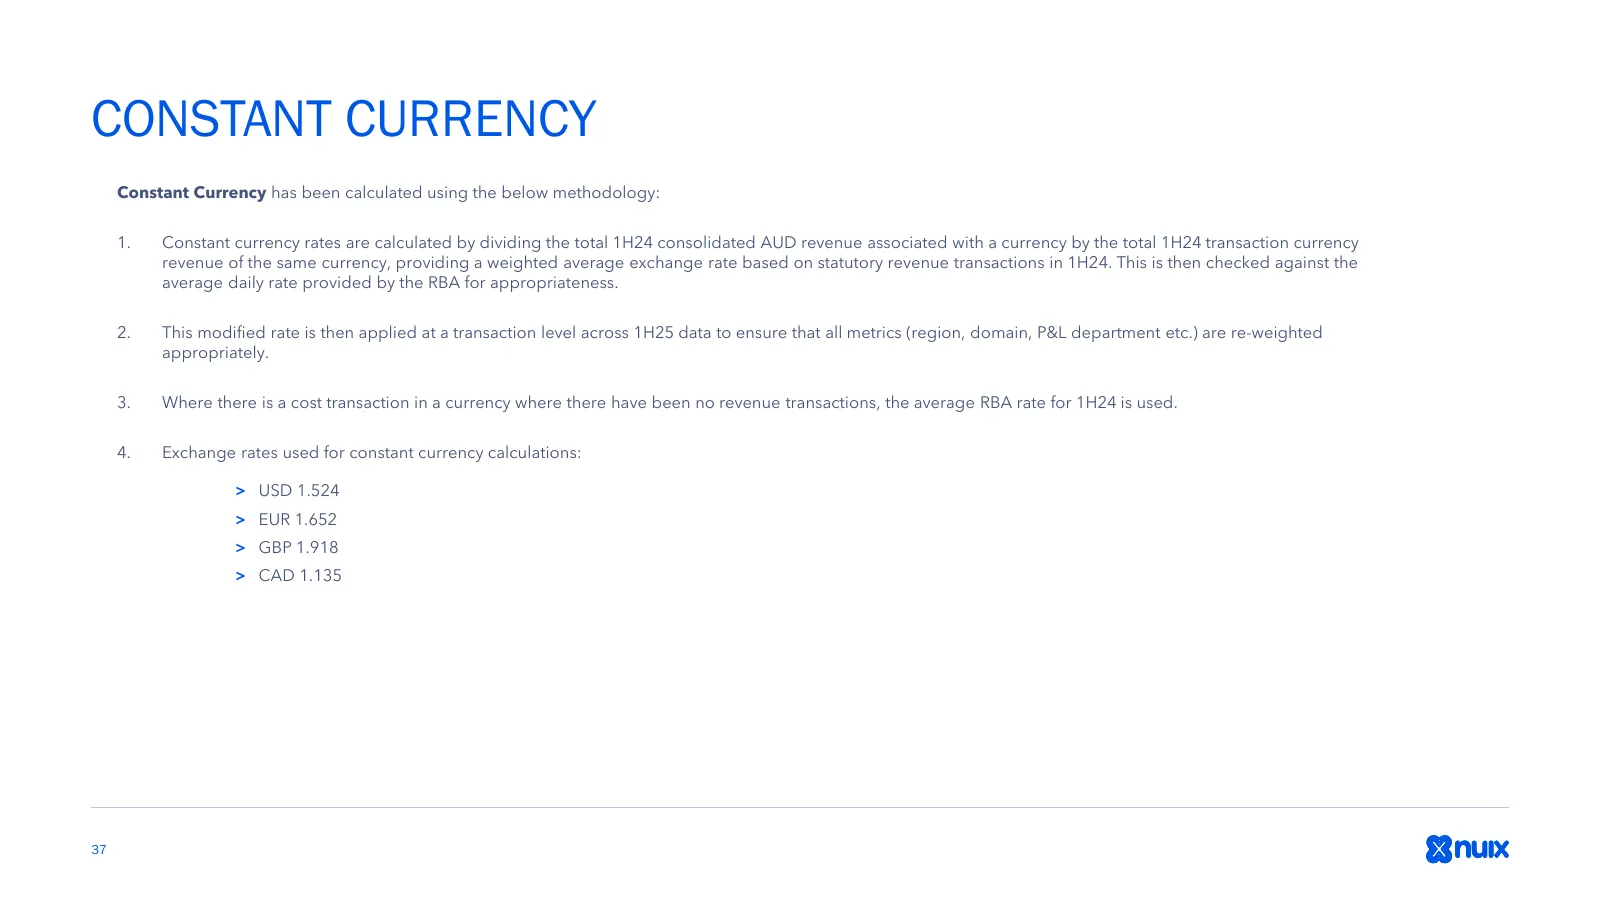
Slide 37: Constant Currency
CONSTANT CURRENCY Constant Currency has been calculated using the below methodology: 1. Constant currency rates are calculated by dividing the total 1H24 consolidated AUD revenue associated with a currency by the total 1H24 transaction currency revenue of the same currency, providing a weighted aver
Slide 38: Disclaimer
DISCLAIMER The material contained in this document is a presentation of general information about Nuix Limited’s activities current as at the date of this presentation (24 February 2025). It is provided in summary and does not purport to be complete. This information has been prepared by Nuix Limite
Source: ASX announcement via 6ix News
More decks from Nuix Ltd.
 FY2026 Earnings Presentation54 slides · Aug 24, 2026
 Q2 2026 Earnings Presentation42 slides · Feb 24, 2026
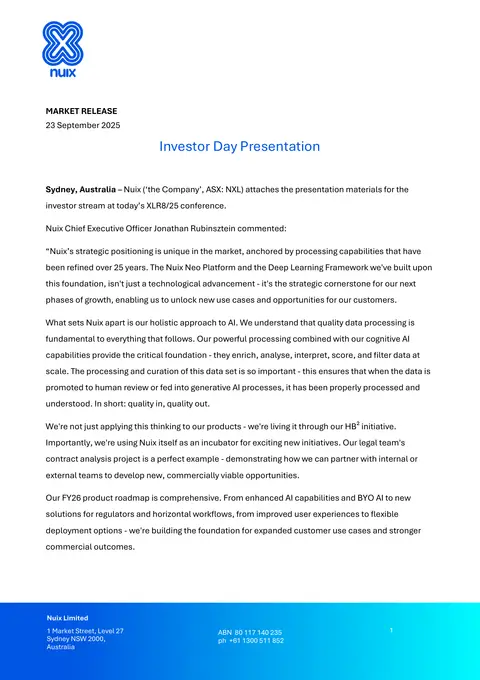 Investor Day (September 2025)37 slides · Sep 23, 2025
 FY2025 Earnings Presentation37 slides · Aug 25, 2025
 Investor Day (September 2024)28 slides · Sep 4, 2024
 FY2024 Earnings Presentation40 slides · Aug 19, 2024