BNC Bancorp — 2015 Sterne Agee Financial Institutions Investor Conference
35 slides from BNC Bancorp's conference presentation, Feb 11, 2015
Slide 1: 2015 Sterne Agee Financial Institutions Investor Conference
2015 Sterne Agee Financial Institutions Investor Conference
Slide 2: Building Premier Franchise in the Carolinas & Virginia
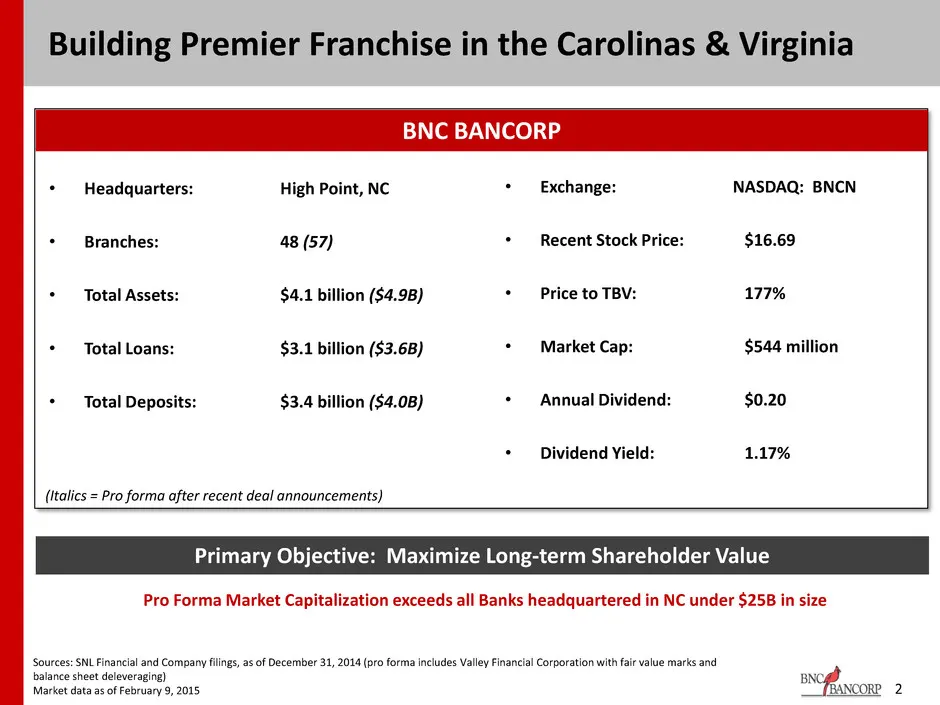
Building Premier Franchise in the Carolinas & Virginia 2 • Exchange: • Recent Stock Price: • Price to TBV: • Market Cap: • Annual Dividend: • Dividend Yield: NASDAQ: BNCN $16.69 177% $544 million $0.20 1.17% Pro Forma Market Capitalization exceeds all Banks headquartered in NC under $25B in size Pri
Slide 3: Analysts' Top Pick for 2015
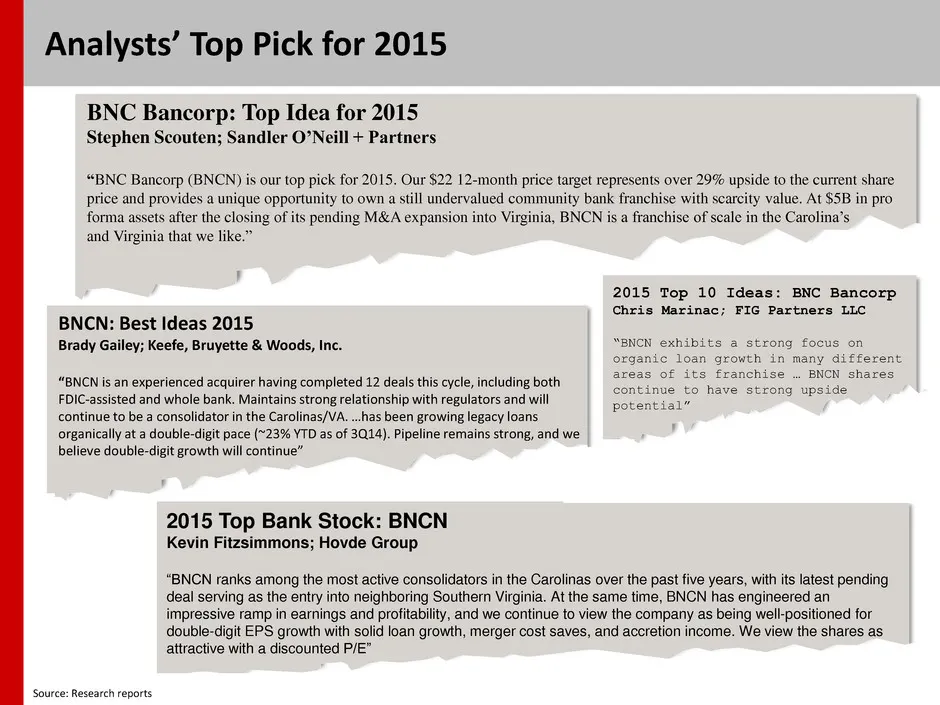
3 Analysts’ Top Pick for 2015 BNC Bancorp: Top Idea for 2015 Stephen Scouten; Sandler O’Neill + Partners “BNC Bancorp (BNCN) is our top pick for 2015. Our $22 12-month price target represents over 29% upside to the current share price and provides a unique opportunity to own a still undervalued comm
Slide 4: Analyst Coverage
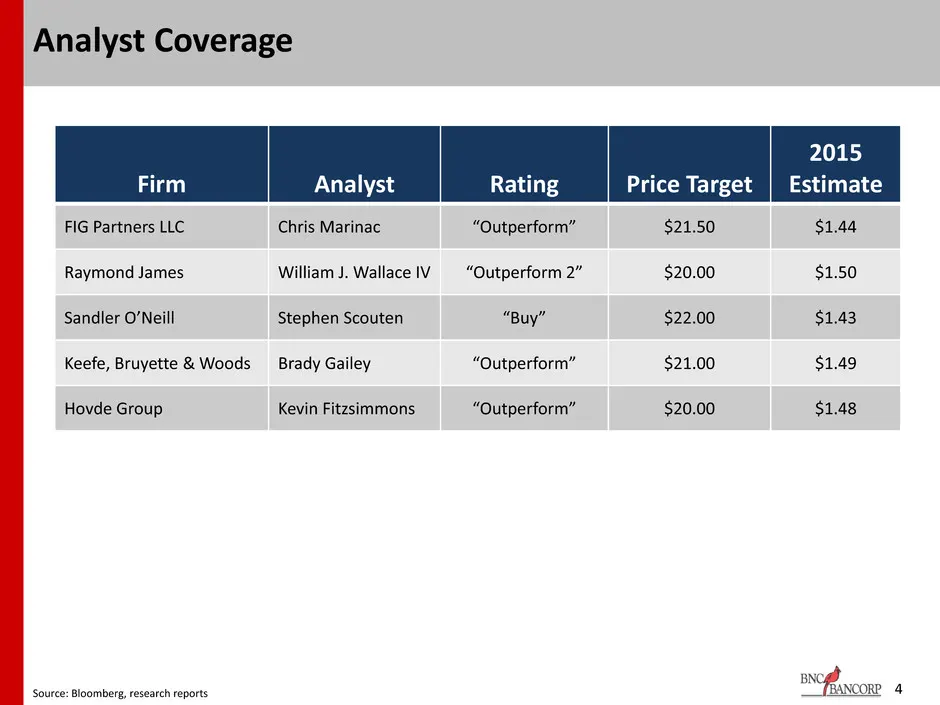
4 Analyst Coverage Firm Analyst Rating Price Target 2015 Estimate FIG Partners LLC Chris Marinac “Outperform” $21.50 $1.44 Raymond James William J. Wallace IV “Outperform 2” $20.00 $1.50 Sandler O’Neill Stephen Scouten “Buy” $22.00 $1.43 Keefe, Bruyette & Woods Brady Gailey “Outperform” $21.00 $1.49
Slide 5: Investment Thesis
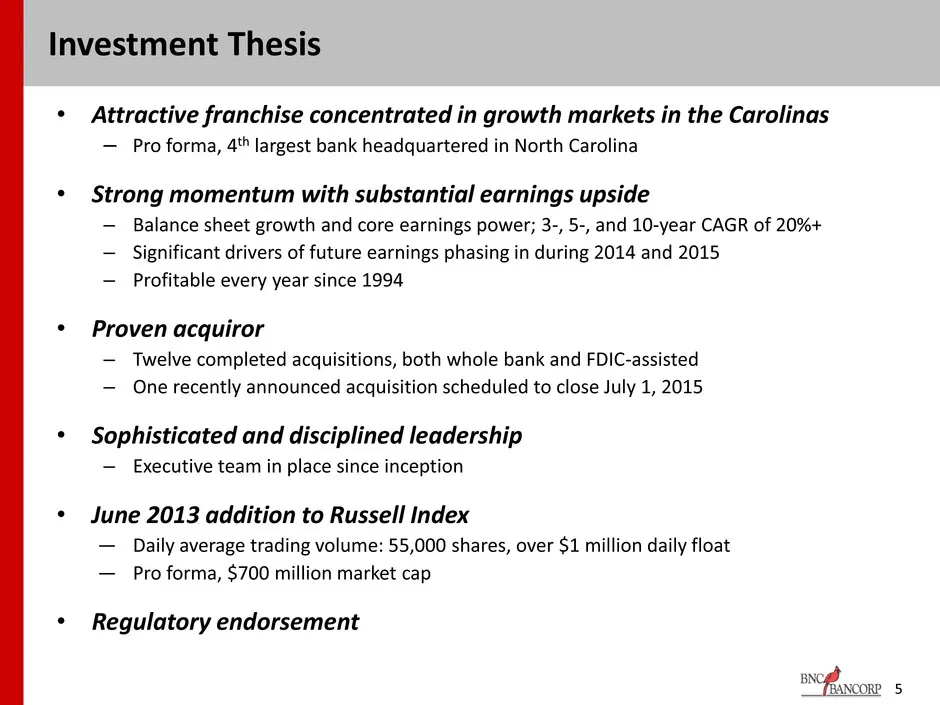
• Attractive franchise concentrated in growth markets in the Carolinas – Pro forma, 4th largest bank headquartered in North Carolina • Strong momentum with substantial earnings upside – Balance sheet growth and core earnings power; 3-, 5-, and 10-year CAGR of 20%+ – Significant drivers of future ear
Slide 6: Well Managed Banking Franchise in High-Growth Markets Throughout the Carolinas
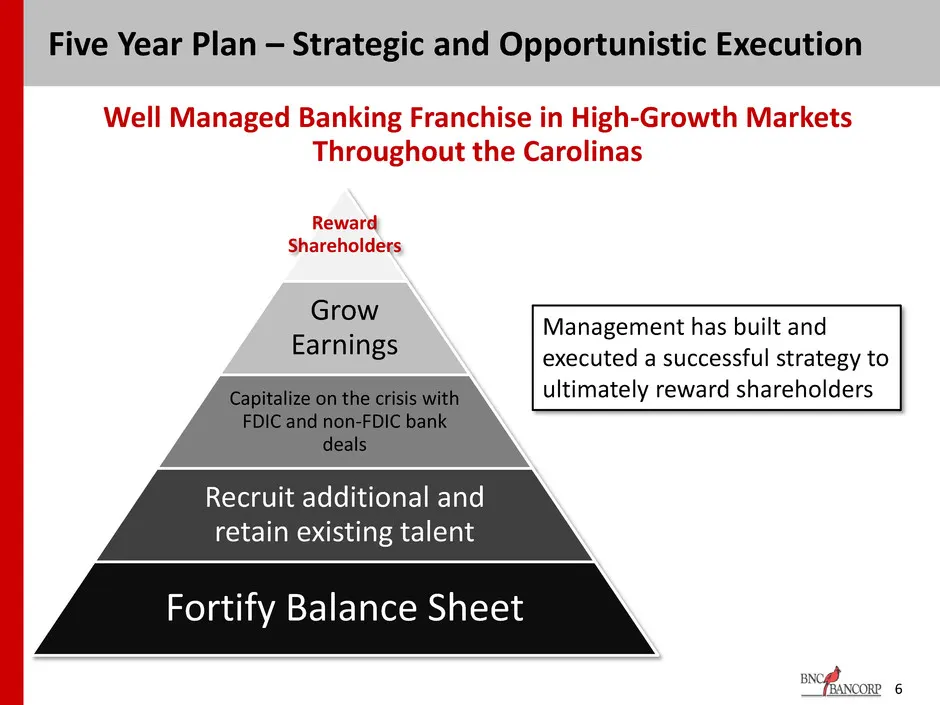
Well Managed Banking Franchise in High-Growth Markets Throughout the Carolinas Five Year Plan – Strategic and Opportunistic Execution 6 Reward Shareholders Grow Earnings Capitalize on the crisis with FDIC and non-FDIC bank deals Recruit additional and retain existing talent Fortify Balance Sheet Man
Slide 7: The Two Phases of Creating Value
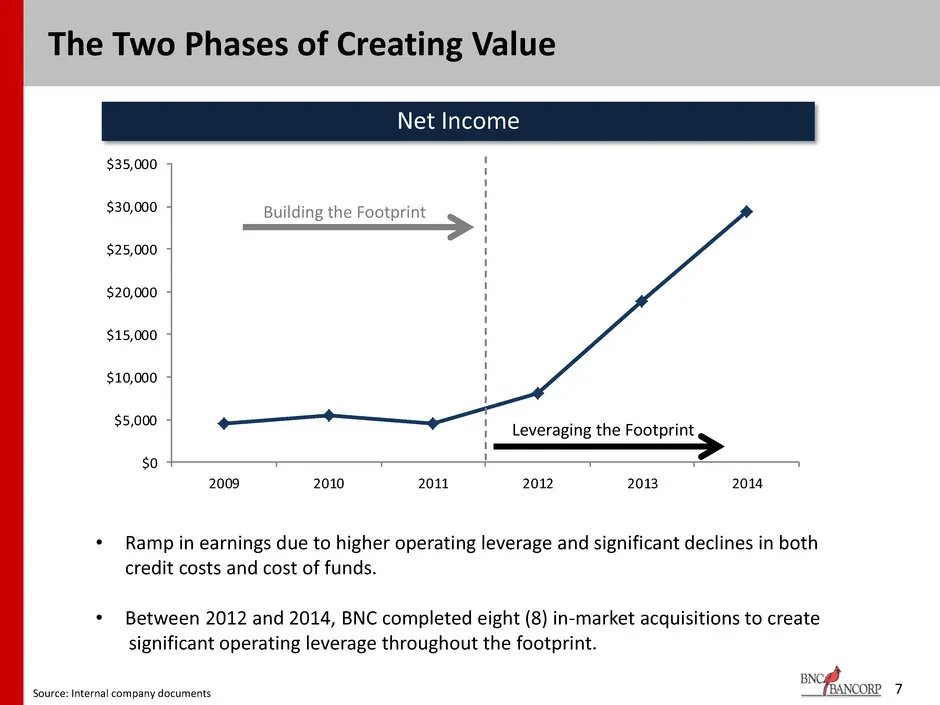
$0 $5,000 $10,000 $15,000 $20,000 $25,000 $30,000 $35,000 2009 2010 2011 2012 2013 2014 7 The Two Phases of Creating Value • Ramp in earnings due to higher operating leverage and significant declines in both credit costs and cost of funds. • Between 2012 and 2014, BNC completed eight (8) in-market a
Slide 8: Attractive Franchise Concentrated in Growth Markets throughout the Carolinas and Virginia
Attractive Franchise Concentrated in Growth Markets throughout the Carolinas and Virginia
Slide 9: Formidable Presence in Virginia & the Carolinas
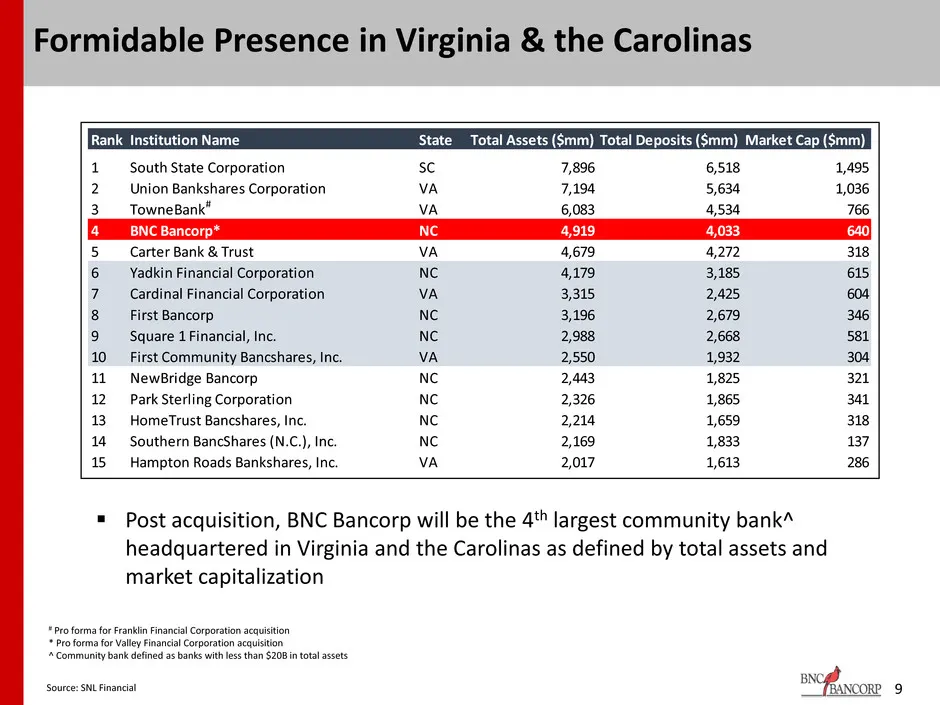
9 Formidable Presence in Virginia & the Carolinas Post acquisition, BNC Bancorp will be the 4th largest community bank^ headquartered in Virginia and the Carolinas as defined by total assets and market capitalization # Pro forma for Franklin Financial Corporation acquisition * Pro forma for Valley
Slide 10: Consistent Record of Growth
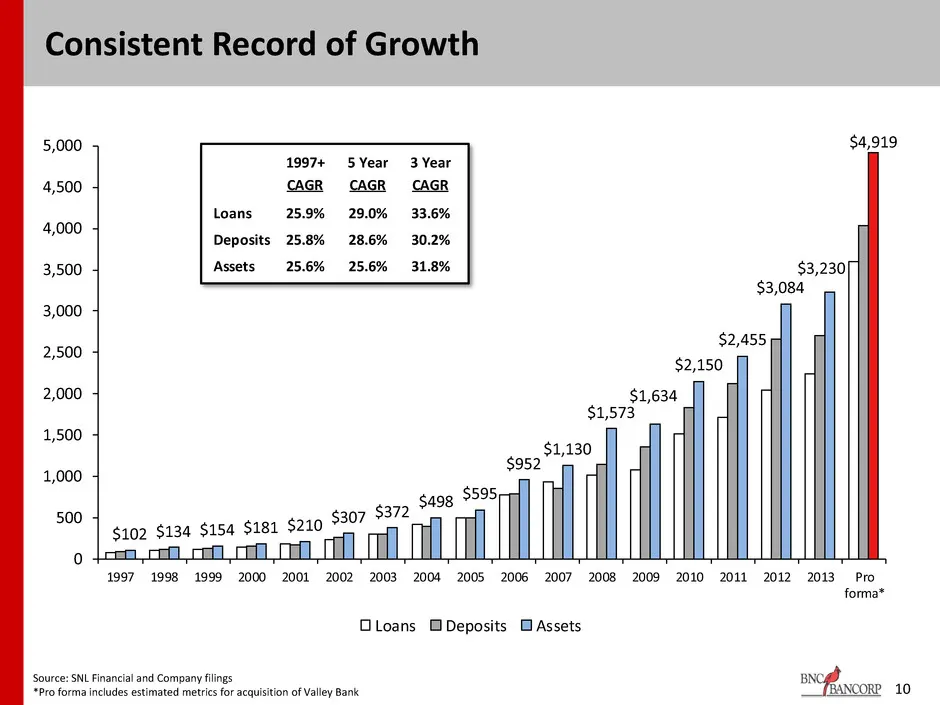
$102 $134 $154 $181 $210 $307 $372 $498 $595 $952 $1,130 $1,573 $1,634 $2,150 $2,455 $3,084 $3,230 $4,919 0 500 1,000 1,500 2,000 2,500 3,000 3,500 4,000 4,500 5,000 1997 1998 1999 2000 2001 2002 2003 2004 2005 2006 2007 2008 2009 2010 2011 2012 2013 Pro forma* Loans Deposits Assets Source: SNL Fina
Slide 11: Branch footprint map
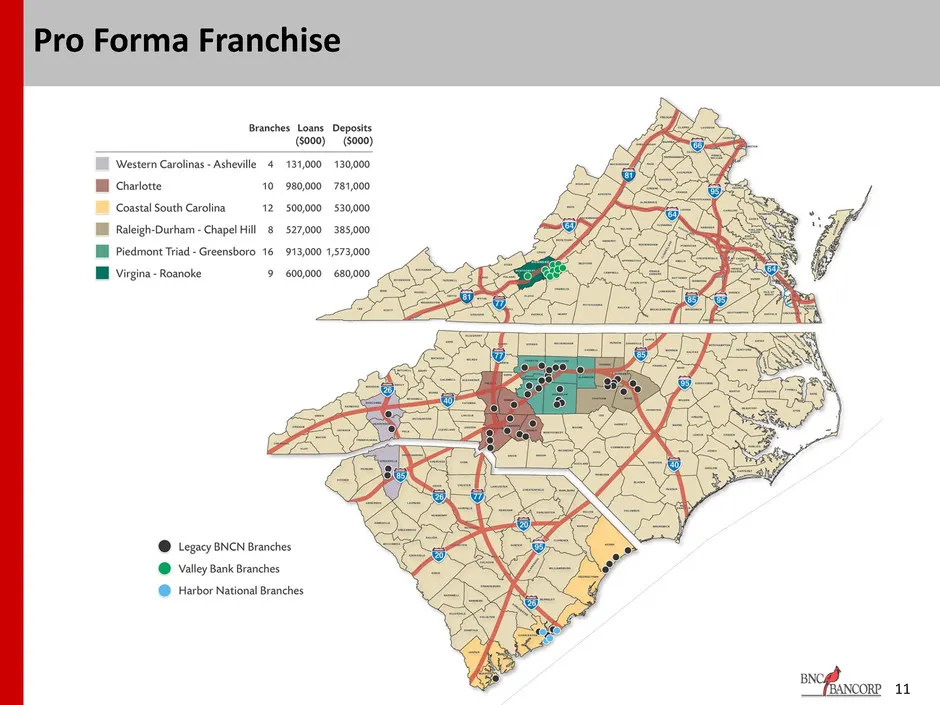
[BE Western Carolinas - Ash BH Charlotte Coastal South Carolina I Raleigh-Durham -Chapel Hill 8 527,000 385,000 Il Piedmont Triad - Greensboro 16 913,000 1, © Legacy BNCN Branches © Valley Bank Branches @ Harbor National Branches
Slide 12: Attractive Markets
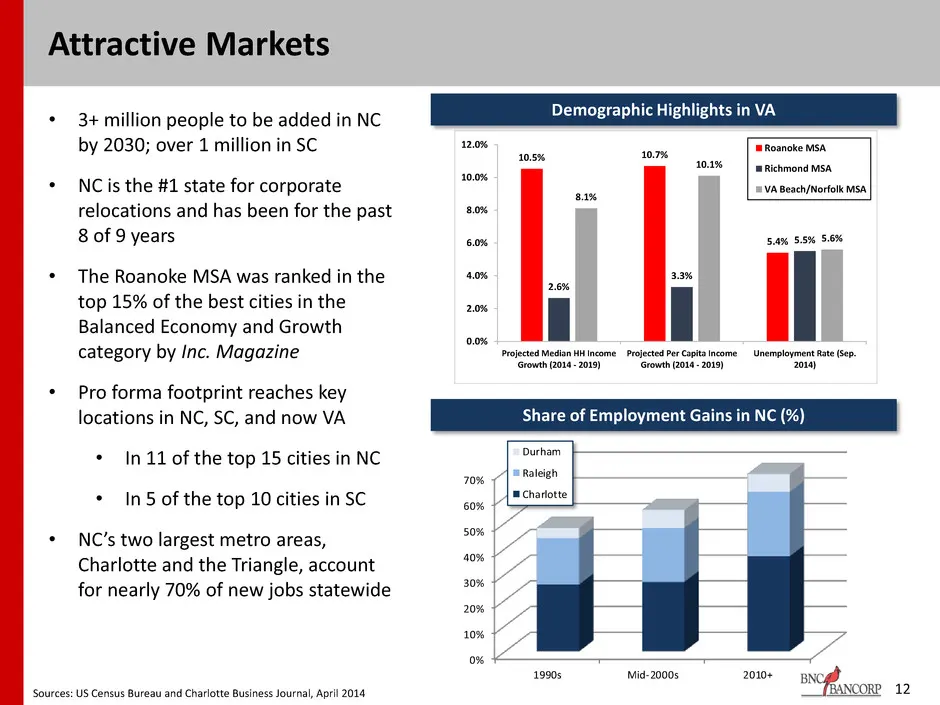
12 Attractive Markets • 3+ million people to be added in NC by 2030; over 1 million in SC • NC is the #1 state for corporate relocations and has been for the past 8 of 9 years • The Roanoke MSA was ranked in the top 15% of the best cities in the Balanced Economy and Growth category by Inc. Magazine
Slide 13: Strong Organic Loan Growth
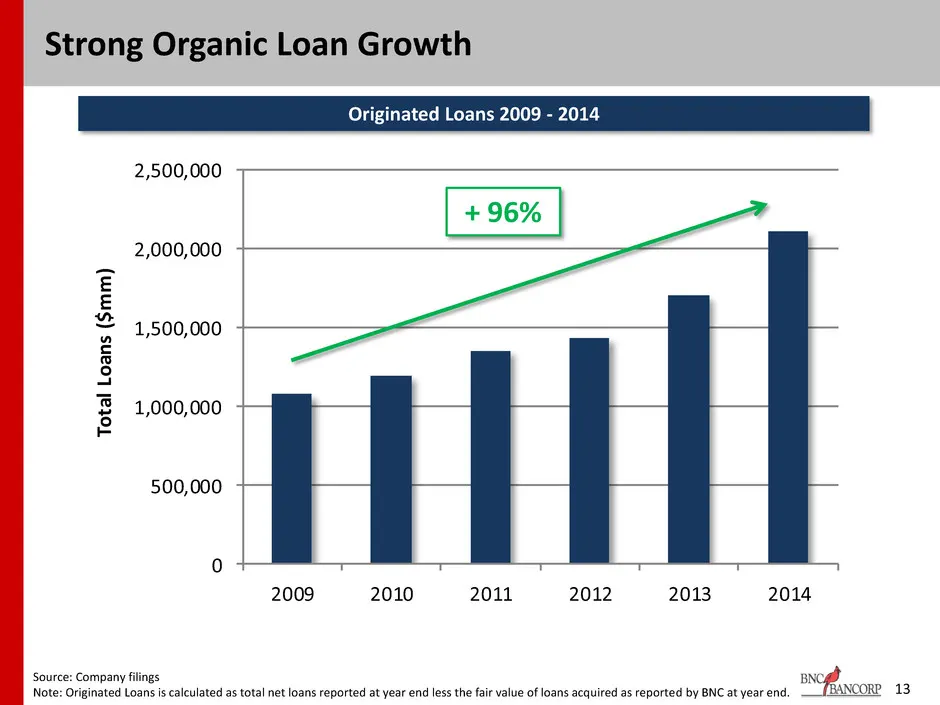
0 500,000 1,000,000 1,500,000 2,000,000 2,500,000 2009 2010 2011 2012 2013 2014 To tal Lo an s ( $m m) 13 Strong Organic Loan Growth Source: Company filings Note: Originated Loans is calculated as total net loans reported at year end less the fair value of loans acquired as reported by BNC at year e
Slide 14: Improving Funding Mix
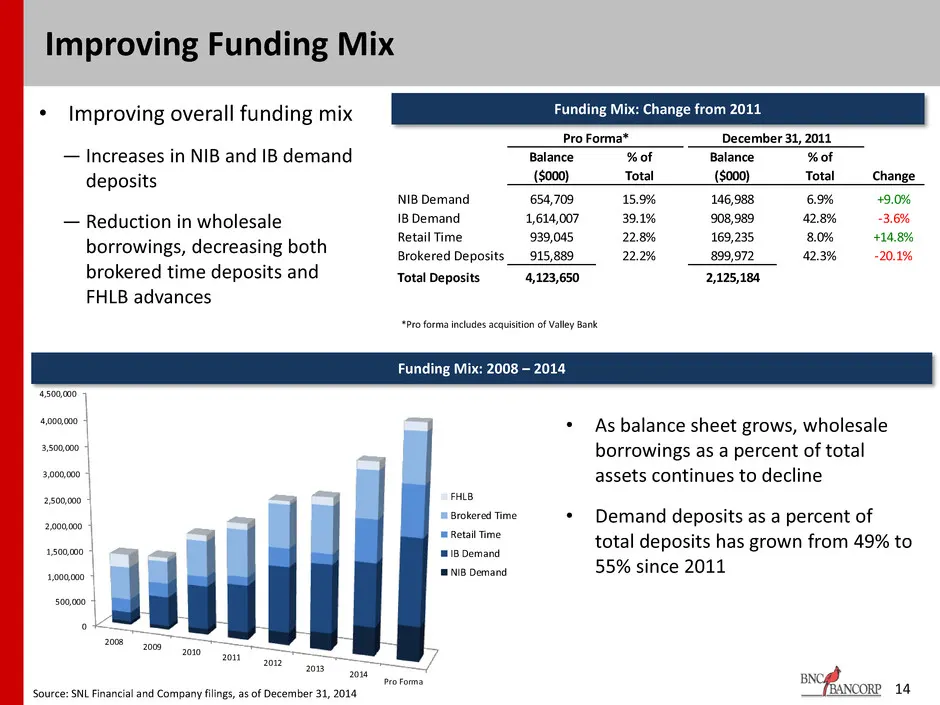
14 Improving Funding Mix Funding Mix: 2008 – 2014 Funding Mix: Change from 2011 • Improving overall funding mix ― Increases in NIB and IB demand deposits ― Reduction in wholesale borrowings, decreasing both brokered time deposits and FHLB advances • As balance sheet grows, wholesale borrowings as a
Slide 15: Strong Earnings Momentum
BNC ~___(BANCORP Strong Earnings Momentum
Slide 16: Earnings Per Share Ramping as Planned
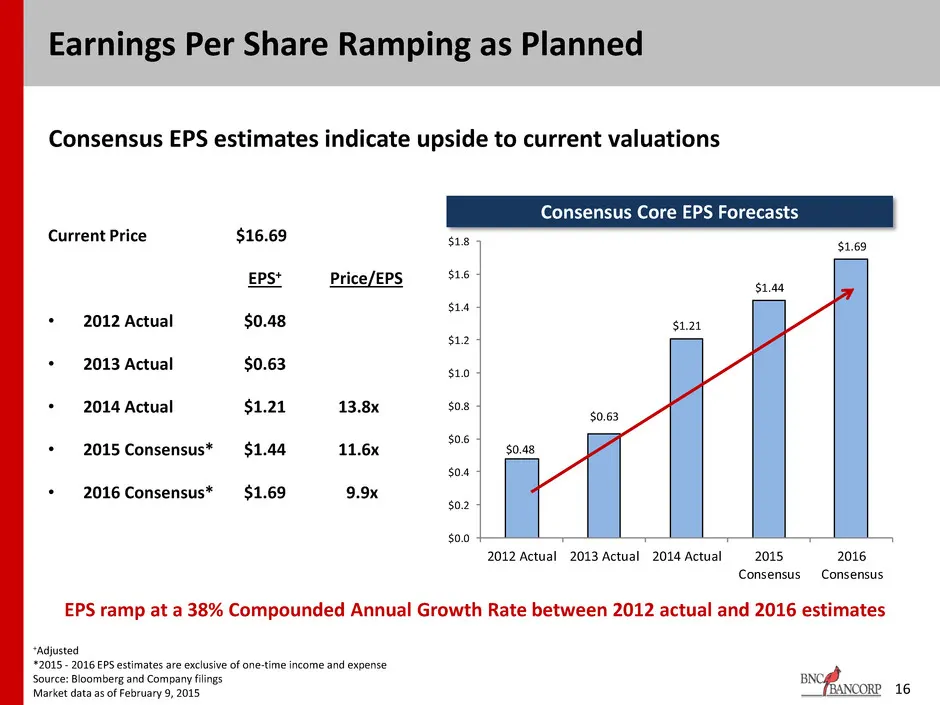
Earnings Per Share Ramping as Planned Current Price $16.69 EPS+ Price/EPS • 2012 Actual $0.48 • 2013 Actual $0.63 • 2014 Actual $1.21 13.8x • 2015 Consensus* $1.44 11.6x • 2016 Consensus* $1.69 9.9x Consensus EPS estimates indicate upside to current valuations +Adjusted *2015 - 2016 EPS estimates ar
Slide 17: Outstanding Net Interest Margin
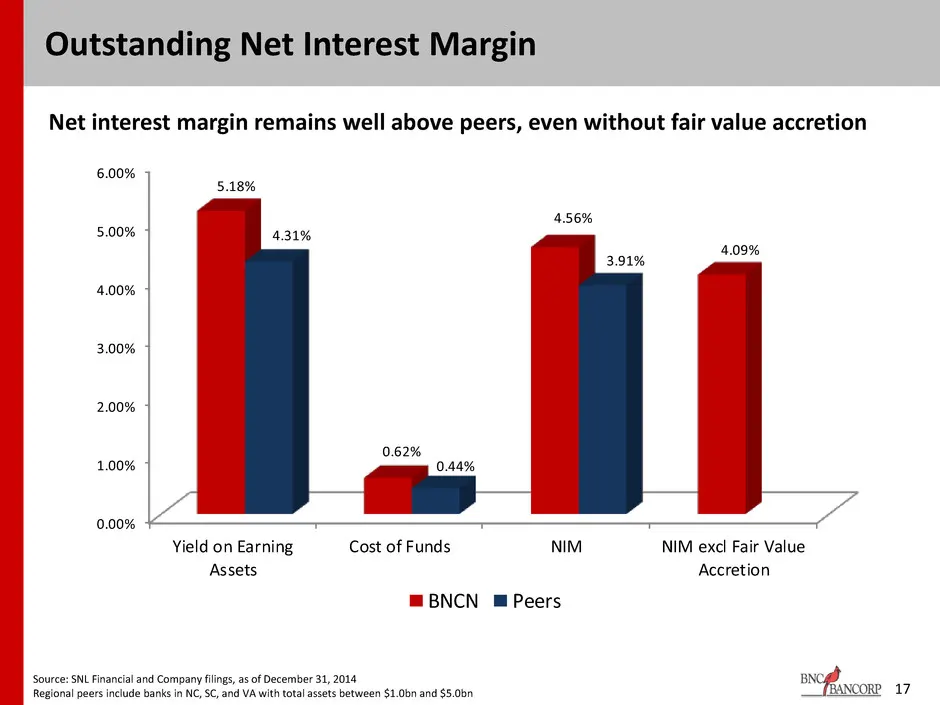
17 Outstanding Net Interest Margin Net interest margin remains well above peers, even without fair value accretion Source: SNL Financial and Company filings, as of December 31, 2014 Regional peers include banks in NC, SC, and VA with total assets between $1.0bn and $5.0bn 0.00% 1.00% 2.00% 3.00% 4.0
Slide 18: Stable Fair Value Accretion Income
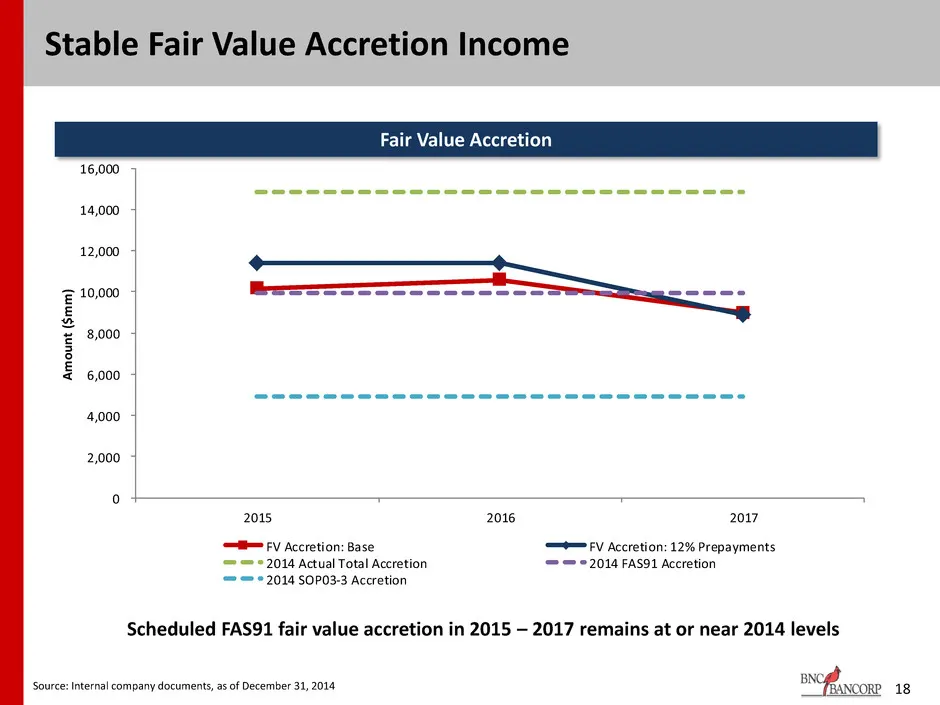
18 Stable Fair Value Accretion Income 0 2,000 4,000 6,000 8,000 10,000 12,000 14,000 16,000 2015 2016 2017 Am ou nt ($m m) FV Accretion: Base FV Accretion: 12% Prepayments 2014 Actual Total Accretion 2014 FAS91 Accretion 2014 SOP03-3 Accretion Source: Internal company documents, as of December 31, 2
Slide 19: Acquiror of Choice
BNCA ~__ {BANCORP “Acquiror of Choice”
Slide 20: Acquisition Experience
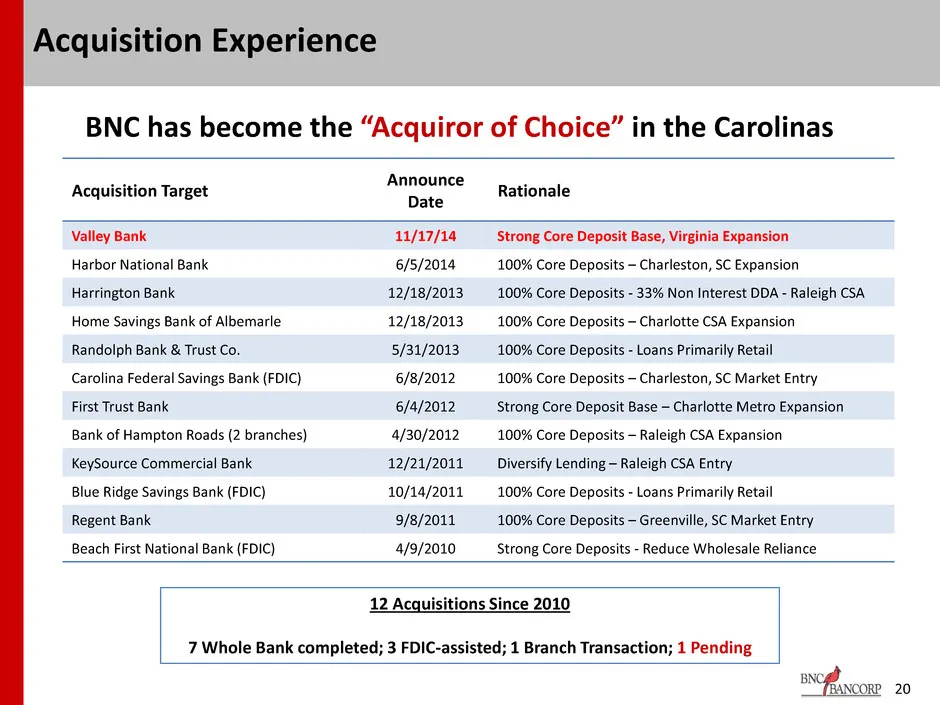
20 Acquisition Experience 12 Acquisitions Since 2010 7 Whole Bank completed; 3 FDIC-assisted; 1 Branch Transaction; 1 Pending Acquisition Target Announce Date Rationale Valley Bank 11/17/14 Strong Core Deposit Base, Virginia Expansion Harbor National Bank 6/5/2014 100% Core Deposits – Charleston, SC
Slide 21: Efficient Integration of Acquired Franchises
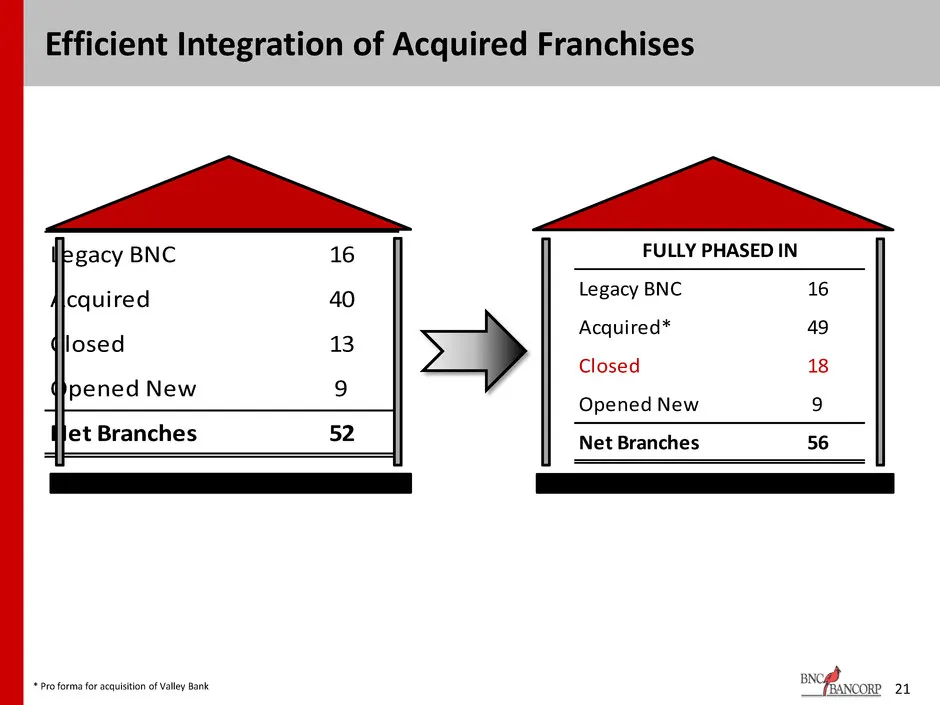
21 Efficient Integration of Acquired Franchises CURRENT NETWORK Legacy BNC 16 Acquired 40 Closed 13 Opened New 9 Net Branches 52 FULLY PHASED IN Legacy BNC 16 Acquired* 49 Closed 18 Opened New 9 Net Branches 56 * Pro forma for acquisition of Valley Bank
Slide 22: Investment in Talent to Support Growth
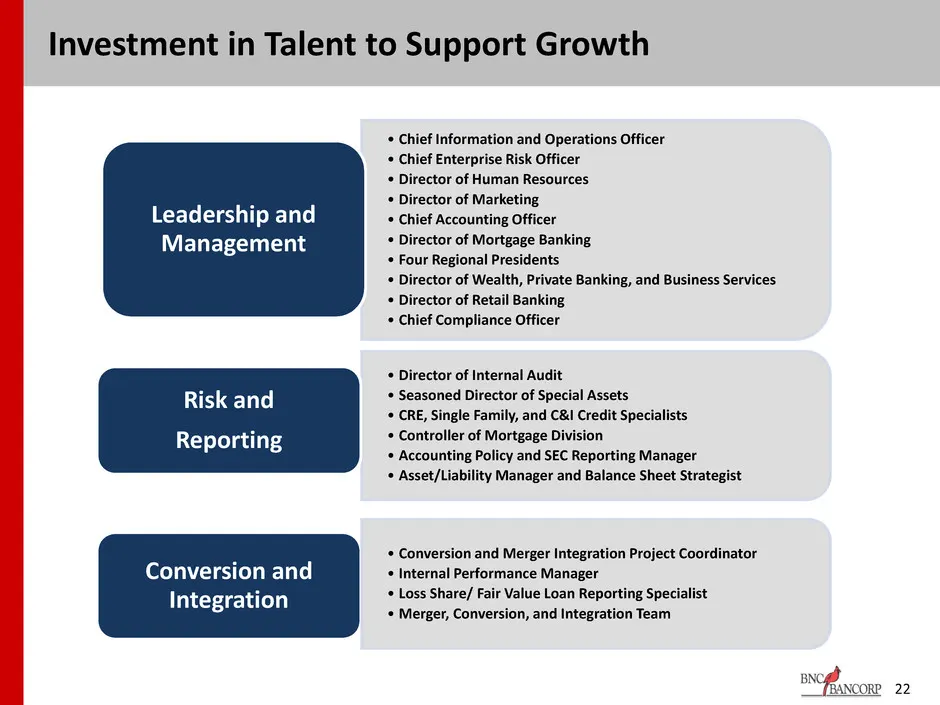
22 Investment in Talent to Support Growth • Chief Information and Operations Officer • Chief Enterprise Risk Officer • Director of Human Resources • Director of Marketing • Chief Accounting Officer • Director of Mortgage Banking • Four Regional Presidents • Director of Wealth, Private Banking, and B
Slide 23: Recent Acquisitions
BNC ___ {BANCORP Recent Acquisitions
Slide 24: Recently Announced Transaction Benefits
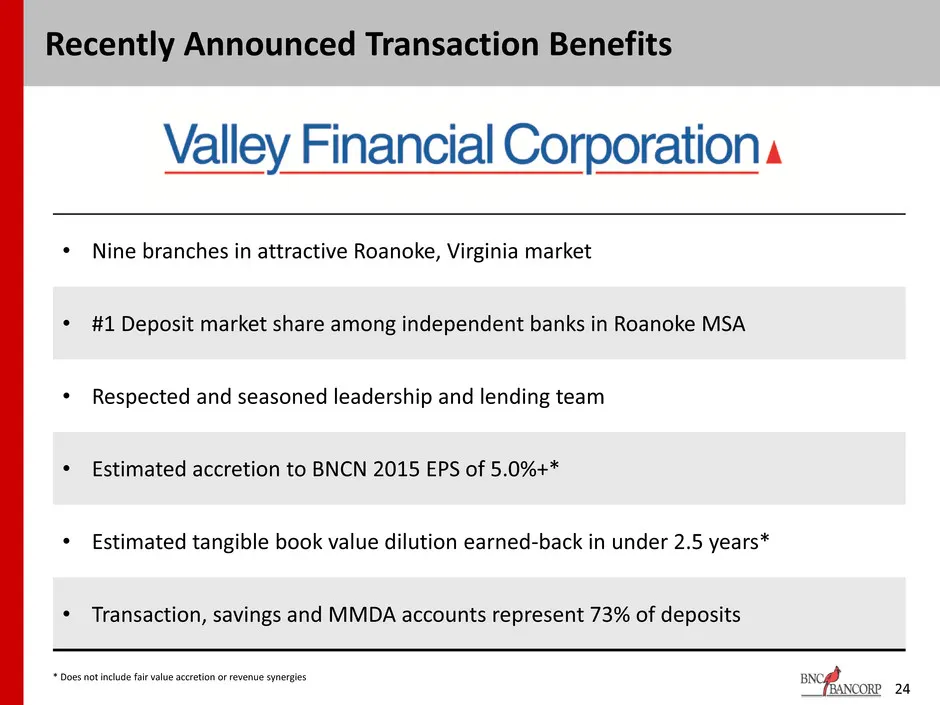
• Nine branches in attractive Roanoke, Virginia market • #1 Deposit market share among independent banks in Roanoke MSA • Respected and seasoned leadership and lending team • Estimated accretion to BNCN 2015 EPS of 5.0%+* • Estimated tangible book value dilution earned-back in under 2.5 years* • Tra
Slide 25: Transaction Assumptions
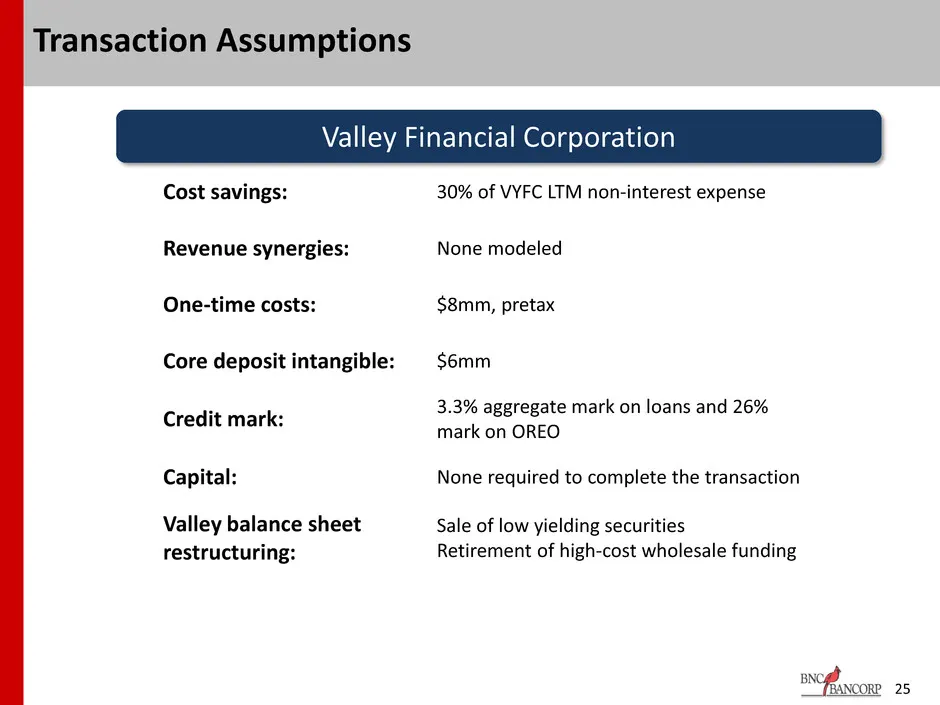
25 Transaction Assumptions Cost savings: 30% of VYFC LTM non-interest expense Revenue synergies: None modeled One-time costs: $8mm, pretax Core deposit intangible: $6mm Credit mark: 3.3% aggregate mark on loans and 26% mark on OREO Capital: None required to complete the transaction Valley balance sh
Slide 26: Credit Highlights
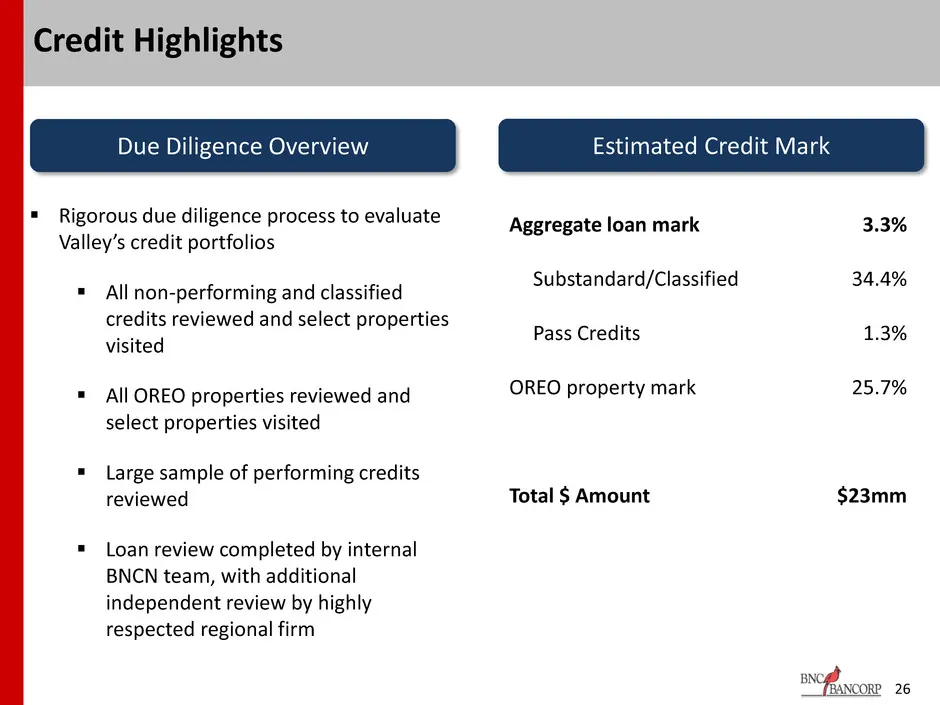
26 Credit Highlights Due Diligence Overview Estimated Credit Mark Rigorous due diligence process to evaluate Valley’s credit portfolios All non-performing and classified credits reviewed and select properties visited All OREO properties reviewed and select properties visited Large sample of
Slide 27: Valley Financial Corporation – Market Share
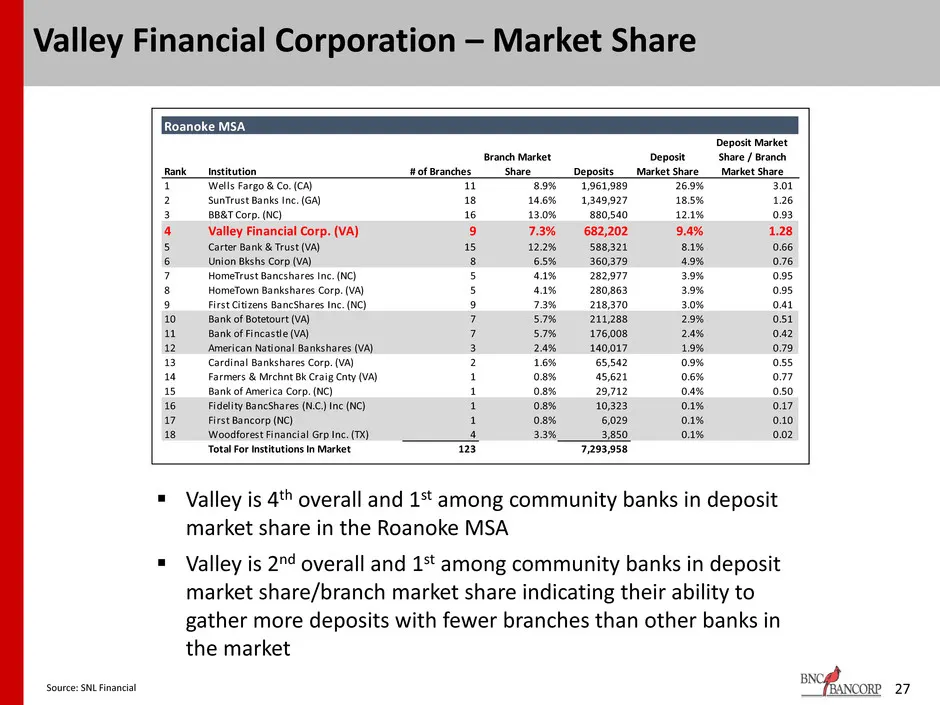
27 Valley Financial Corporation – Market Share Valley is 4th overall and 1st among community banks in deposit market share in the Roanoke MSA Valley is 2nd overall and 1st among community banks in deposit market share/branch market share indicating their ability to gather more deposits with fewe
Slide 28: Financial Appendix
BNCA ~__ {BANCORP Financial Appendix
Slide 29: Summary Financial Results
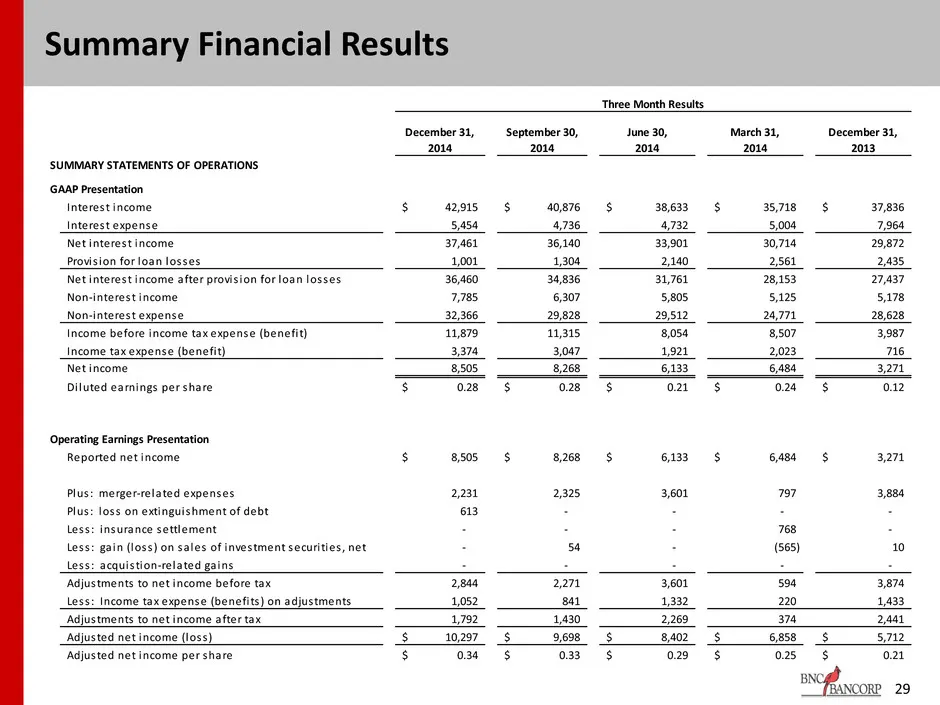
29 Summary Financial Results December 31, 2014 September 30, 2014 June 30, 2014 March 31, 2014 December 31, 2013 GAAP Presentation Interest income 42,915$ 40,876$ 38,633$ 35,718$ 37,836$ Interest expense 5,454 4,736 4,732 5,004 7,964 Net interest income 37,461 36,140 33,901 30,714 29,872 Provis ion
Slide 30: Performance Metrics
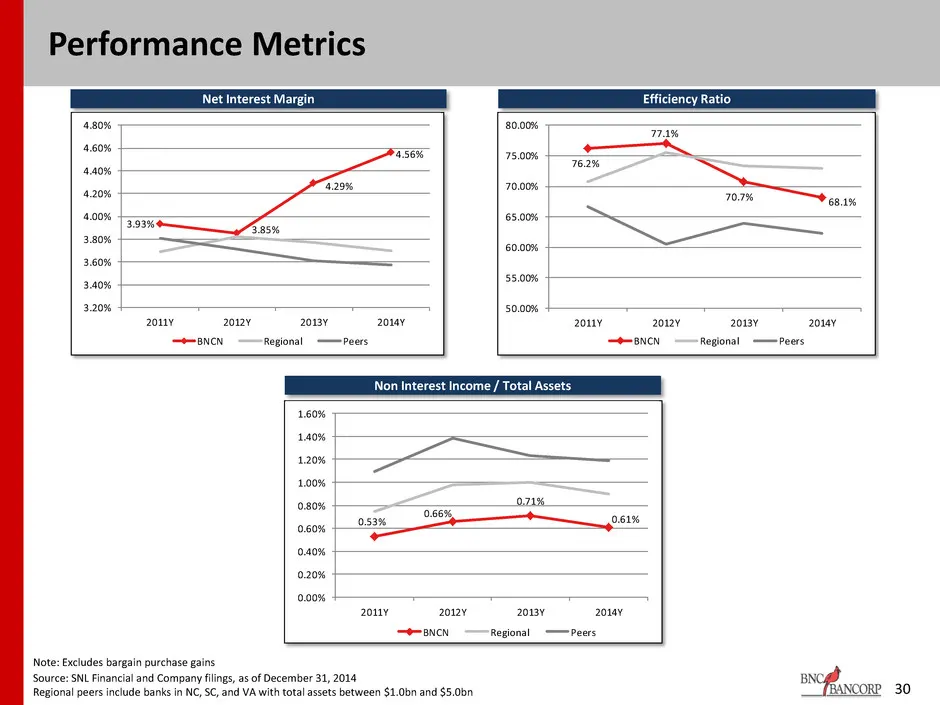
3.93% 3.85% 4.29% 4.56% 3.20% 3.40% 3.60% 3.80% 4.00% 4.20% 4.40% 4.60% 4.80% 2011Y 2012Y 2013Y 2014Y BNCN Regional Peers 76.2% 77.1% 70.7% 68.1% 50.00% 55.00% 60.00% 65.00% 70.00% 75.00% 80.00% 2011Y 2012Y 2013Y 2014Y BNCN Regional Peers 0.53% 0.66% 0.71% 0.61% 0.00% 0.20% 0.40% 0.60% 0.80% 1.00% 1
Slide 31: Pro Forma Loans and Deposits
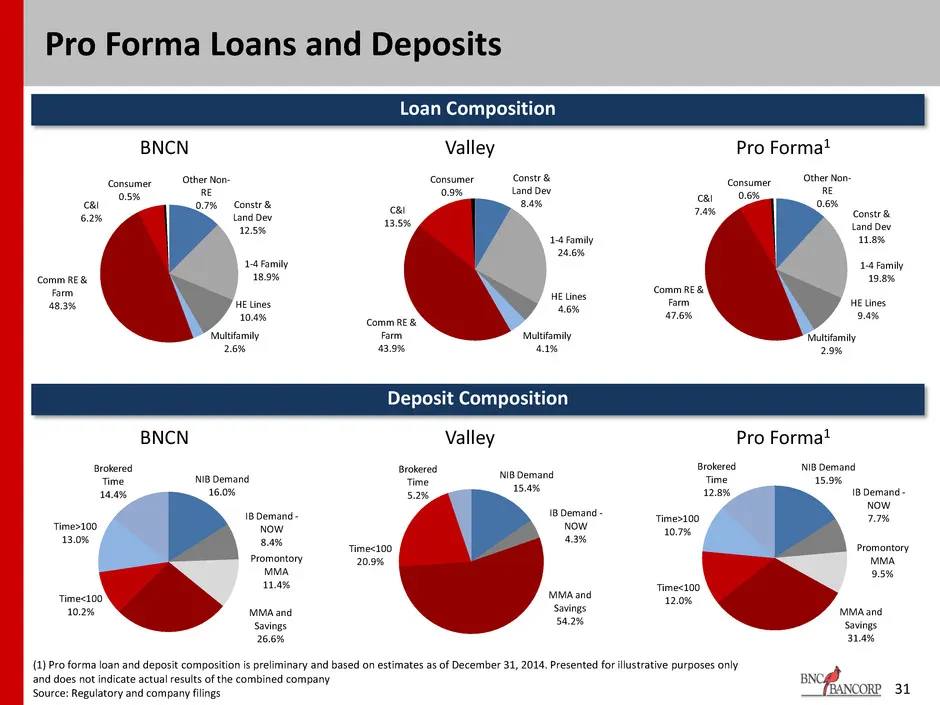
Pro Forma Loans and Deposits Loan Composition 31 (1) Pro forma loan and deposit composition is preliminary and based on estimates as of December 31, 2014. Presented for illustrative purposes only and does not indicate actual results of the combined company Source: Regulatory and company filings Cons
Slide 32: Loan Portfolio Breakdown
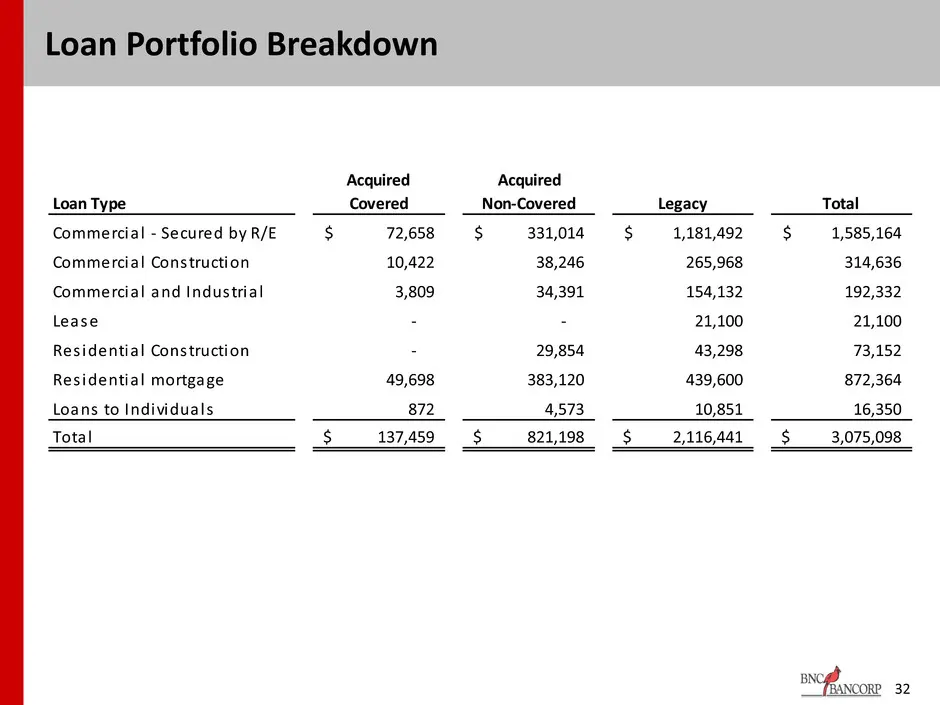
32 Loan Portfolio Breakdown Acquired Covered Acquired Non-Covered Legacy Total Commercia l - Secured by R/E 72,658$ 331,014$ 1,181,492$ 1,585,164$ Commercia l Construction 10,422 38,246 265,968 314,636 Commercia l and Industria l 3,809 34,391 154,132 192,332 Lease - - 21,100 21,100 Res identia l Con
Slide 33: Loan Portfolio Breakdown
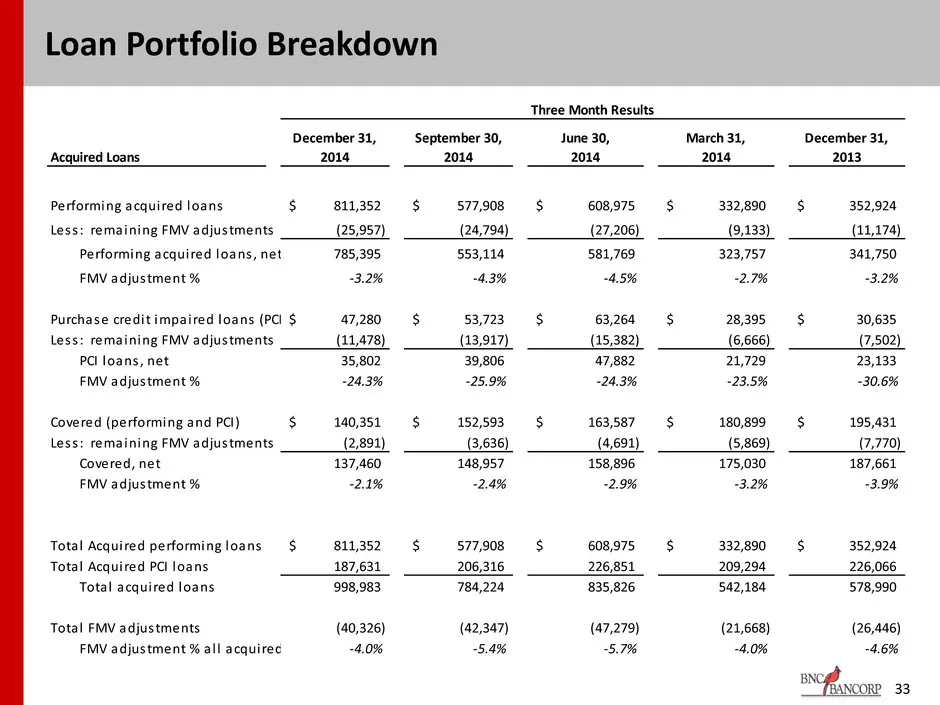
33 Loan Portfolio Breakdown December 31, 2014 September 30, 2014 June 30, 2014 March 31, 2014 December 31, 2013 Performing acquired loans 811,352$ 577,908$ 608,975$ 332,890$ 352,924$ Less : remaining FMV adjustments (25,957) (24,794) (27,206) (9,133) (11,174) Performing acquired loans , net 785,395
Slide 34: Loan Portfolio Breakdown
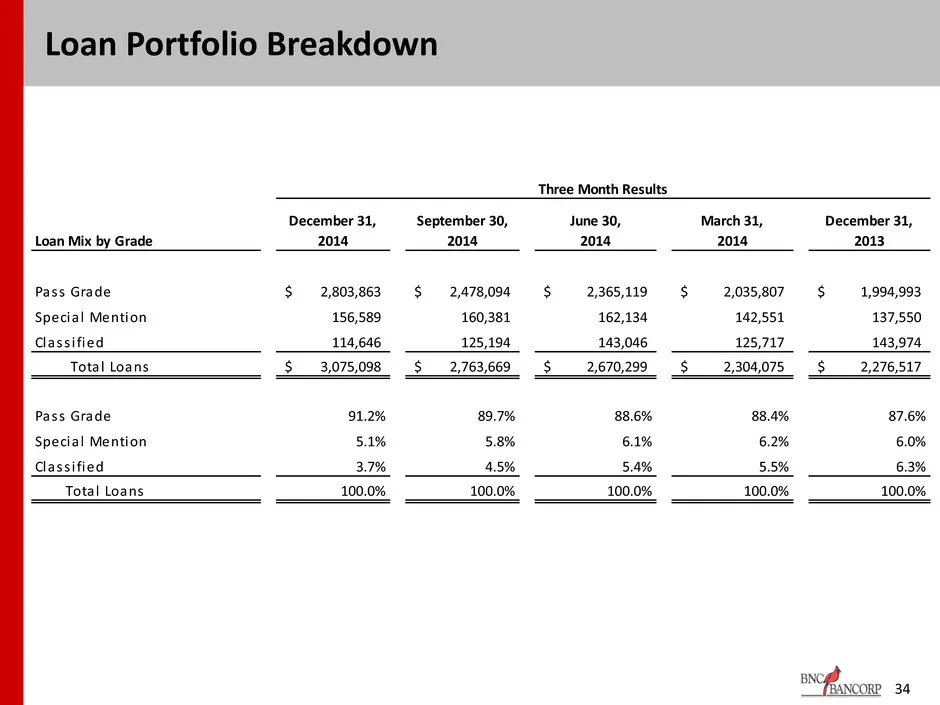
34 Loan Portfolio Breakdown December 31, 2014 September 30, 2014 June 30, 2014 March 31, 2014 December 31, 2013 Pass Grade 2,803,863$ 2,478,094$ 2,365,119$ 2,035,807$ 1,994,993$ Specia l Mention 156,589 160,381 162,134 142,551 137,550 Class i fied 114,646 125,194 143,046 125,717 143,974 Total Loans
Slide 35: Forward Looking Statements
35 Forward Looking Statements This presentation contains certain forward-looking information about BNC Bancorp and subsidiaries (collectively, “BNCN”) that is intended to be covered by the safe harbor for “forward-looking statements” provided by the Private Securities Litigation Reform Act of 1995.
Source: SEC EDGAR · 8-K filed Feb 11, 2015
More decks from BNC Bancorp
 Merger or Acquisition (January 2017)37 slides · Jan 23, 2017
 Stephens Inc. Carolinas Roadshow - Charlotte November 201637 slides · Nov 8, 2016
 IPO Roadshow (July 2016)28 slides · Jul 20, 2016
 2016 Gulf South Bank Conference37 slides · May 2, 2016
 Merger or Acquisition (November 2015)32 slides · Nov 16, 2015
 Merger or Acquisition (August 2015)24 slides · Aug 14, 2015