BNC Bancorp — 2016 Gulf South Bank Conference
37 slides from BNC Bancorp's conference presentation, May 2, 2016
Slide 1: 2016 Gulf South Bank Conference
2016 Gulf South Bank Conference May 2-3, 2016
Slide 2: BNC Bancorp Overview
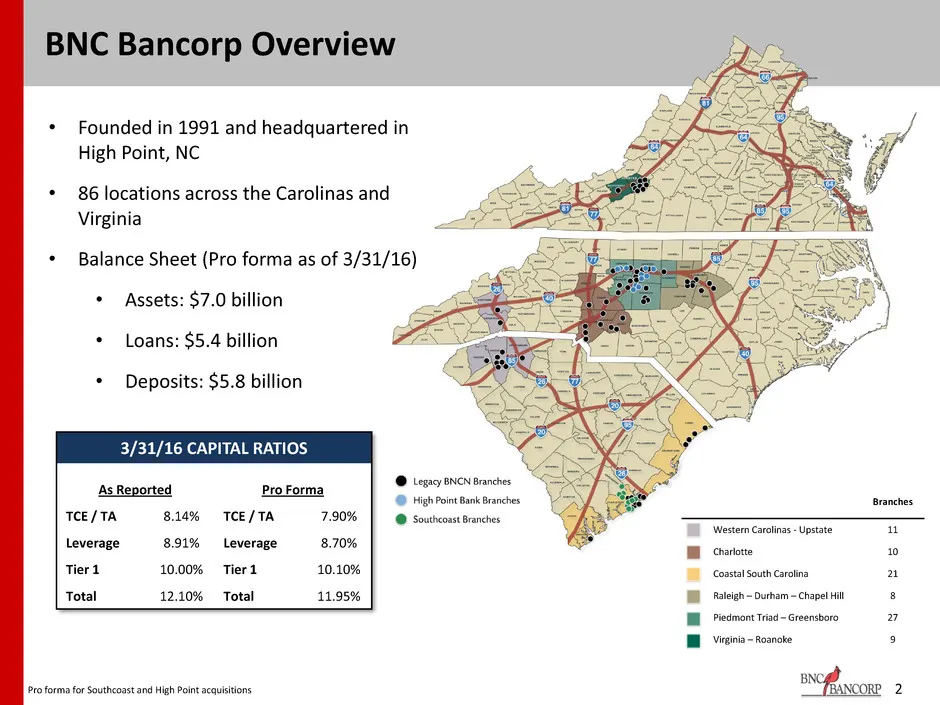
2 BNC Bancorp Overview • Founded in 1991 and headquartered in High Point, NC • 86 locations across the Carolinas and Virginia • Balance Sheet (Pro forma as of 3/31/16) • Assets: $7.0 billion • Loans: $5.4 billion • Deposits: $5.8 billion 3/31/16 CAPITAL RATIOS As Reported Pro Forma TCE / TA 8.14% TC
Slide 3: Building Premier Franchise in the Carolinas & Virginia
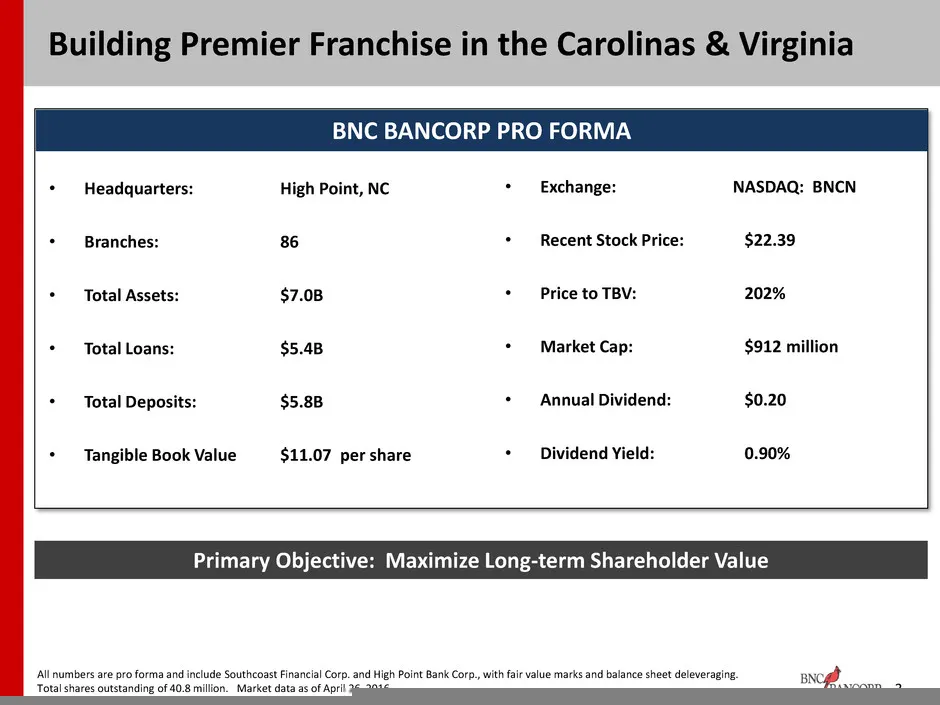
Building Premier Franchise in the Carolinas & Virginia 3 • Headquarters: • Branches: • Total Assets: • Total Loans: • Total Deposits: • Tangible Book Value High Point, NC 86 $7.0B $5.4B $5.8B $11.07 per share • Exchange: • Recent Stock Price: • Price to TBV: • Market Cap: • Annual Dividend: • Divide
Slide 4: Investment Thesis
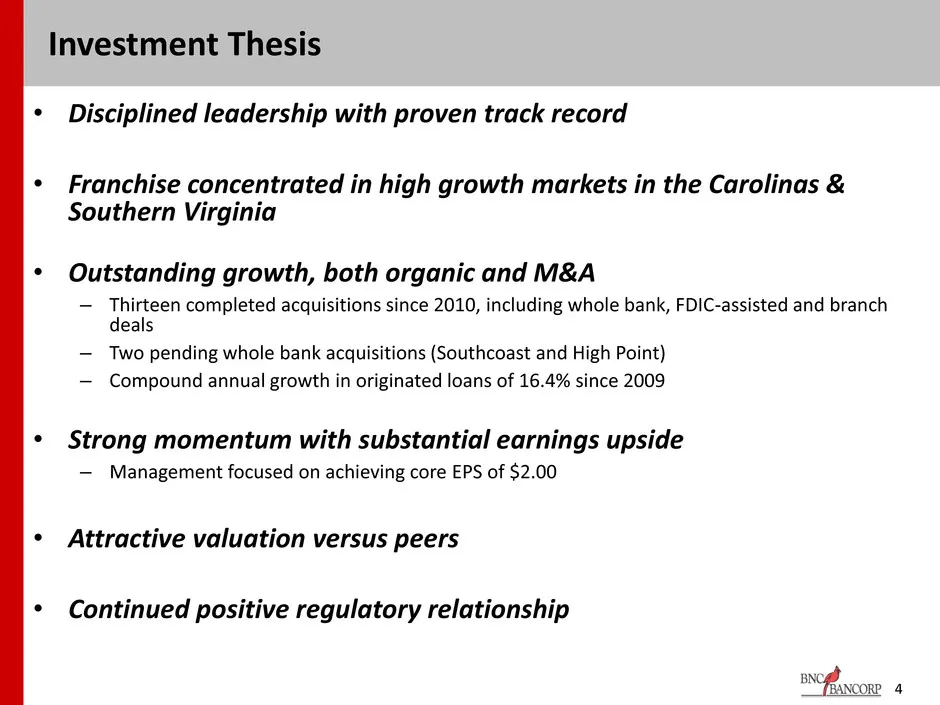
• Disciplined leadership with proven track record • Franchise concentrated in high growth markets in the Carolinas & Southern Virginia • Outstanding growth, both organic and M&A – Thirteen completed acquisitions since 2010, including whole bank, FDIC-assisted and branch deals – Two pending whole ban
Slide 5: Franchise Concentrated in Attractive Markets
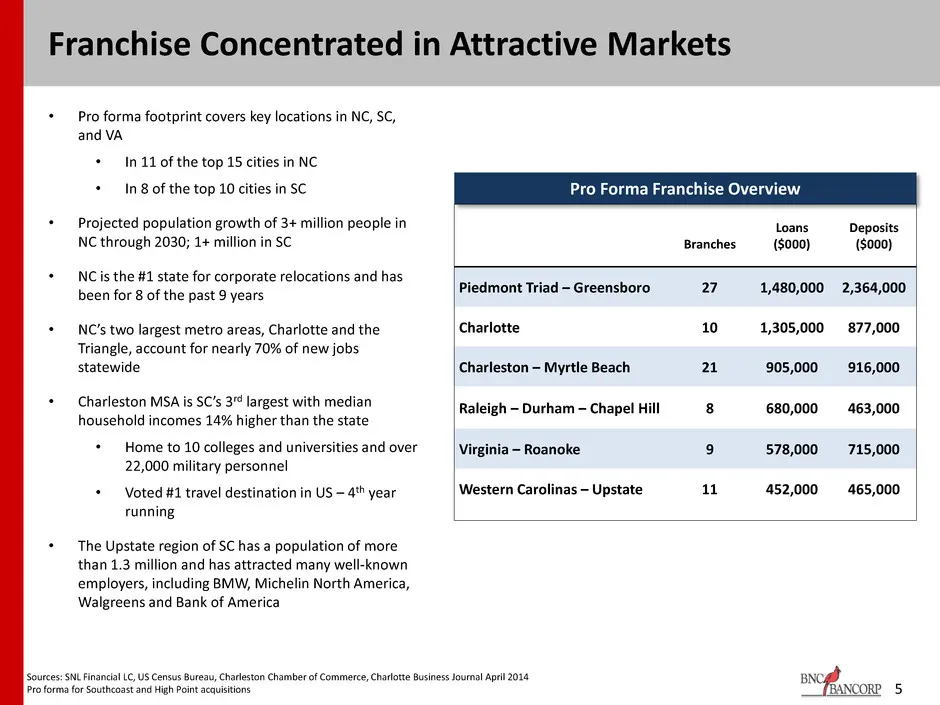
5 Franchise Concentrated in Attractive Markets • Pro forma footprint covers key locations in NC, SC, and VA • In 11 of the top 15 cities in NC • In 8 of the top 10 cities in SC • Projected population growth of 3+ million people in NC through 2030; 1+ million in SC • NC is the #1 state for corporate
Slide 6: Consistent Acquisition Discipline
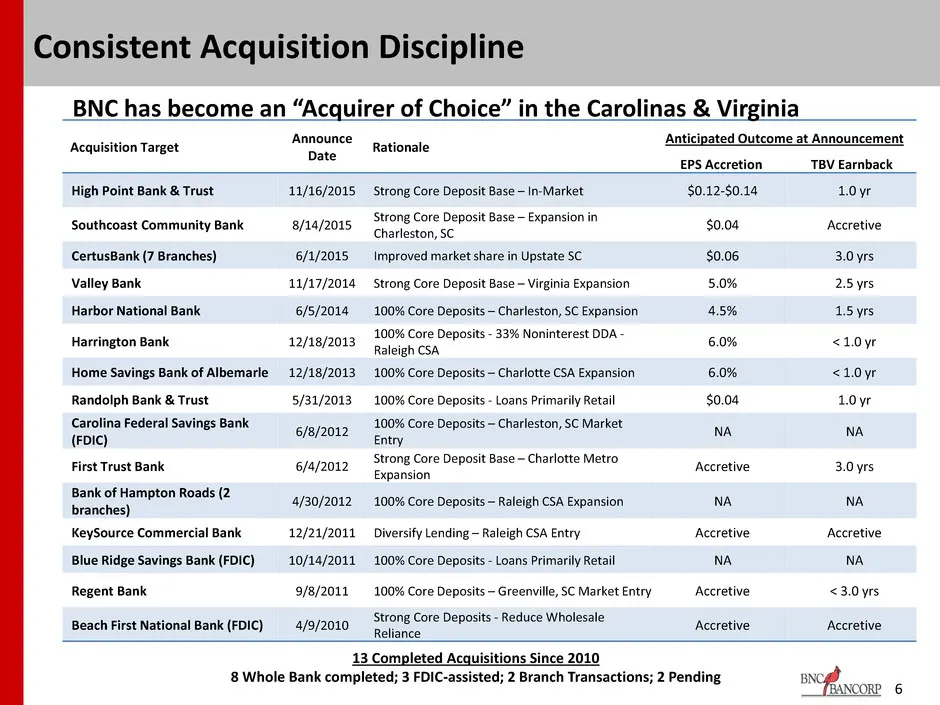
6 Consistent Acquisition Discipline 13 Completed Acquisitions Since 2010 8 Whole Bank completed; 3 FDIC-assisted; 2 Branch Transactions; 2 Pending Acquisition Target Announce Date Rationale Anticipated Outcome at Announcement EPS Accretion TBV Earnback High Point Bank & Trust 11/16/2015 Strong Core
Slide 7: Consistent Record of Growth
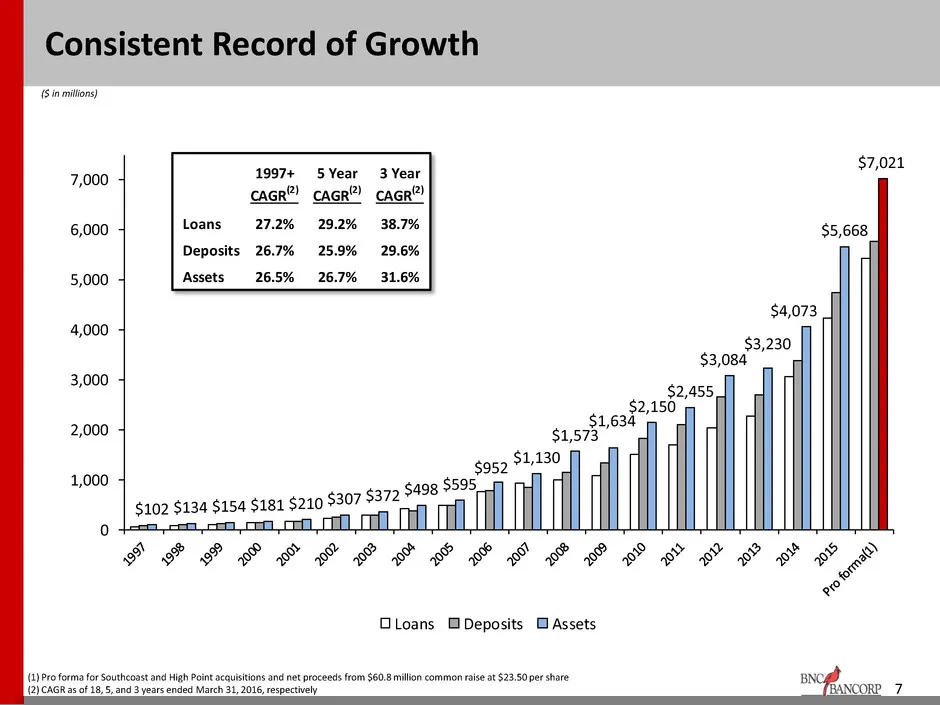
$102 $134 $154 $181 $210 $307 $372 $498 $595 $952 $1,130 $1,573 $1,634 $2,150 $2,455 $3,084 $3,230 $4,073 $5,668 $7,021 0 1,000 2,000 3,000 4,000 5,000 6,000 7,000 Loans Deposits Assets 7 Consistent Record of Growth ($ in millions) (1) Pro forma for Southcoast and High Point acquisitions and net pro
Slide 8: Growth in Originated Loans
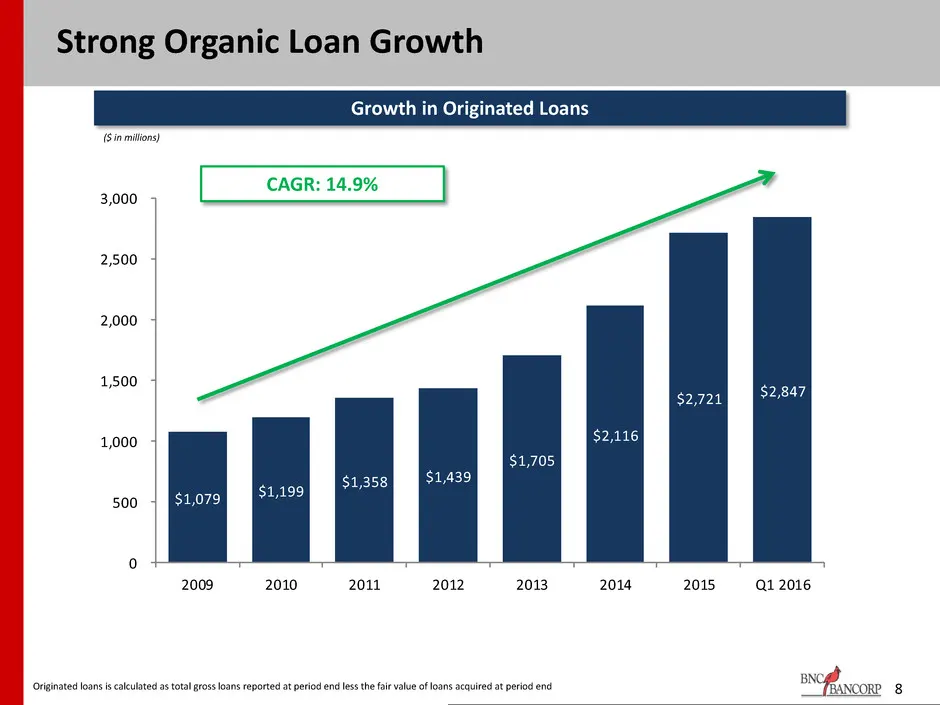
Growth in Originated Loans Strong Organic Loan Growth ($ in millions) 8 CAGR: 14.9% Originated loans is calculated as total gross loans reported at period end less the fair value of loans acquired at period end $1,079 $1,199 $1,358 $1,439 $1,705 $2,116 $2,721 $2,847 0 500 1,000 1,500 2,000 2,500 3,0
Slide 9: Earnings Per Share Ramping as Planned
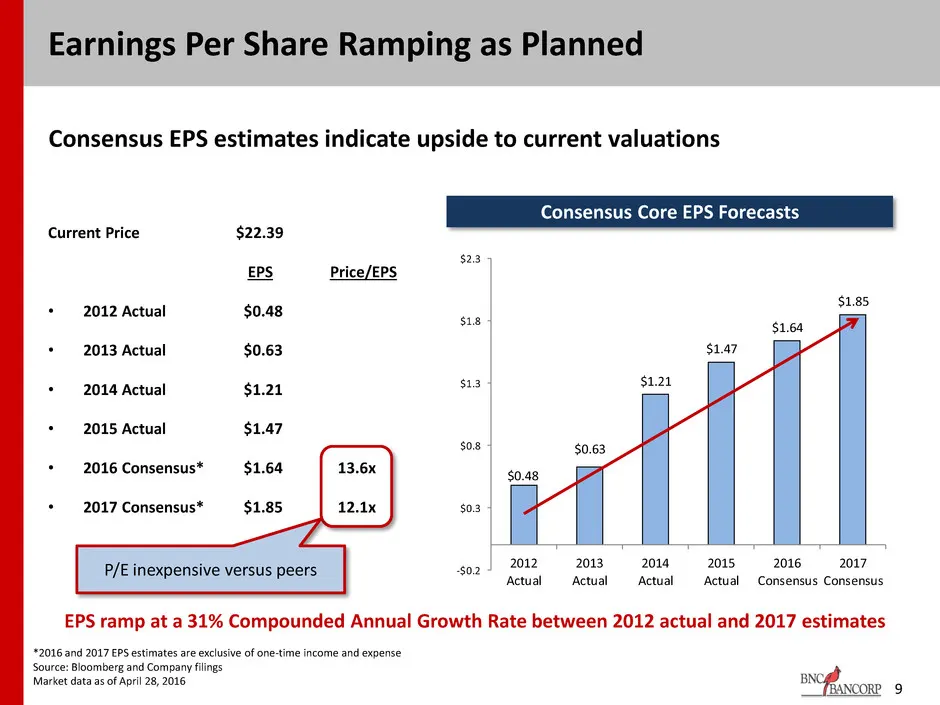
Current Price $22.39 EPS Price/EPS • 2012 Actual $0.48 • 2013 Actual $0.63 • 2014 Actual $1.21 • 2015 Actual $1.47 • 2016 Consensus* $1.64 13.6x • 2017 Consensus* $1.85 12.1x P/E inexpensive versus peers Earnings Per Share Ramping as Planned Consensus EPS estimates indicate upside to current valuati
Slide 10: Strong Net Interest Margin with Stable Fair Value Accretion
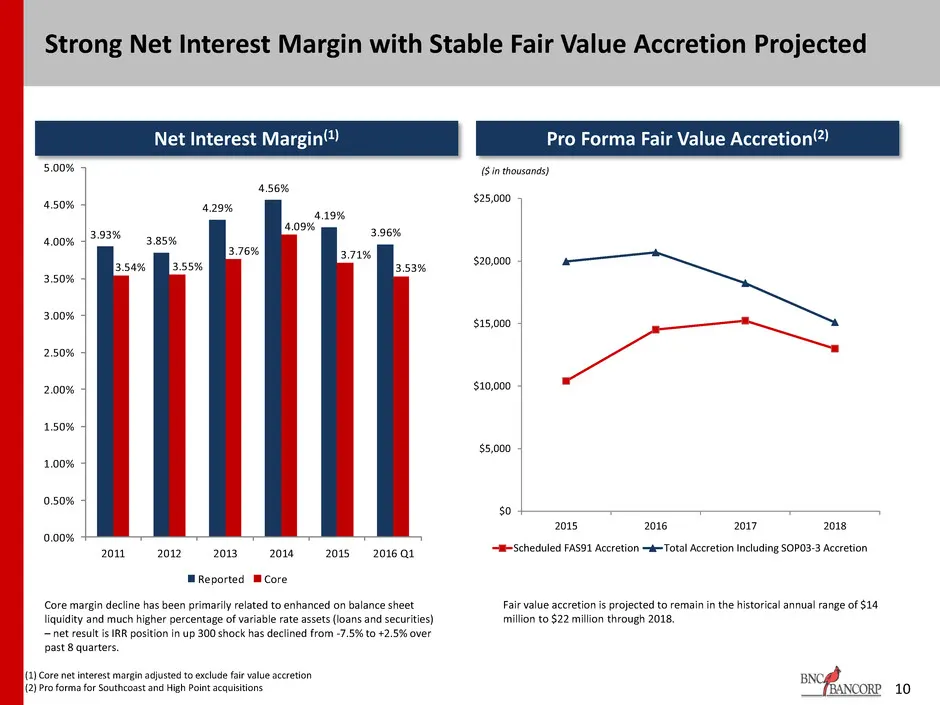
3.93% 3.85% 4.29% 4.56% 4.19% 3.96% 3.54% 3.55% 3.76% 4.09% 3.71% 3.53% 0.00% 0.50% 1.00% 1.50% 2.00% 2.50% 3.00% 3.50% 4.00% 4.50% 5.00% 2011 2012 2013 2014 2015 2016 Q1 Reported Core 10 Strong Net Interest Margin with Stable Fair Value Accretion Projected Net Interest Margin(1) Pro Forma Fair Valu
Slide 11: Driving Efficiency Through Scale and Noninterest Income Expansion
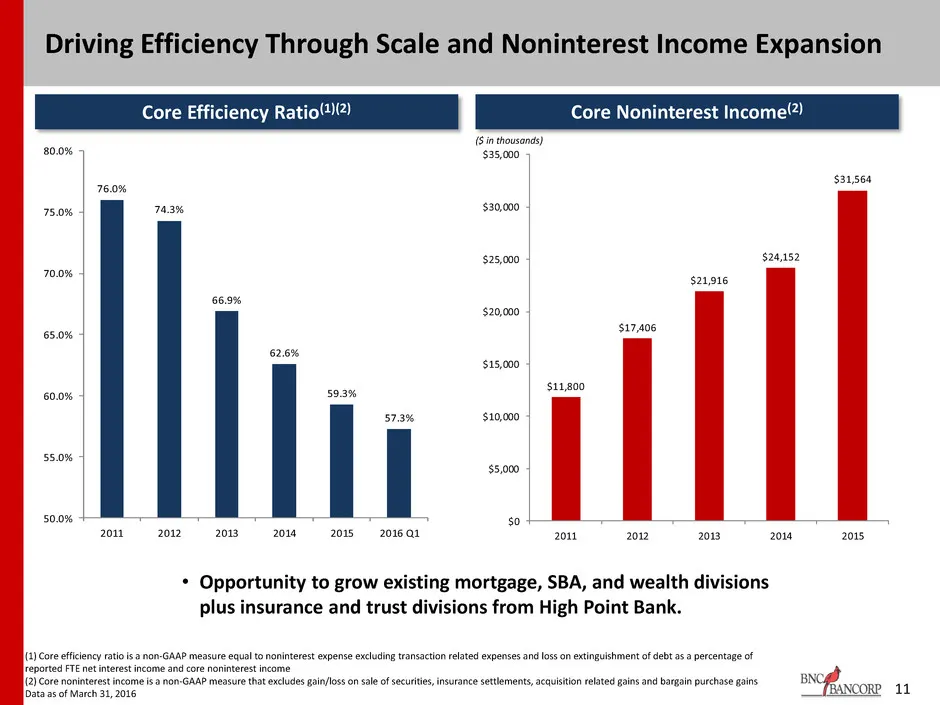
76.0% 74.3% 66.9% 62.6% 59.3% 57.3% 50.0% 55.0% 60.0% 65.0% 70.0% 75.0% 80.0% 2011 2012 2013 2014 2015 2016 Q1 11 Driving Efficiency Through Scale and Noninterest Income Expansion Core Efficiency Ratio(1)(2) Core Noninterest Income(2) (1) Core efficiency ratio is a non-GAAP measure equal to noninter
Slide 12: Diversified and Quality Loan Portfolio
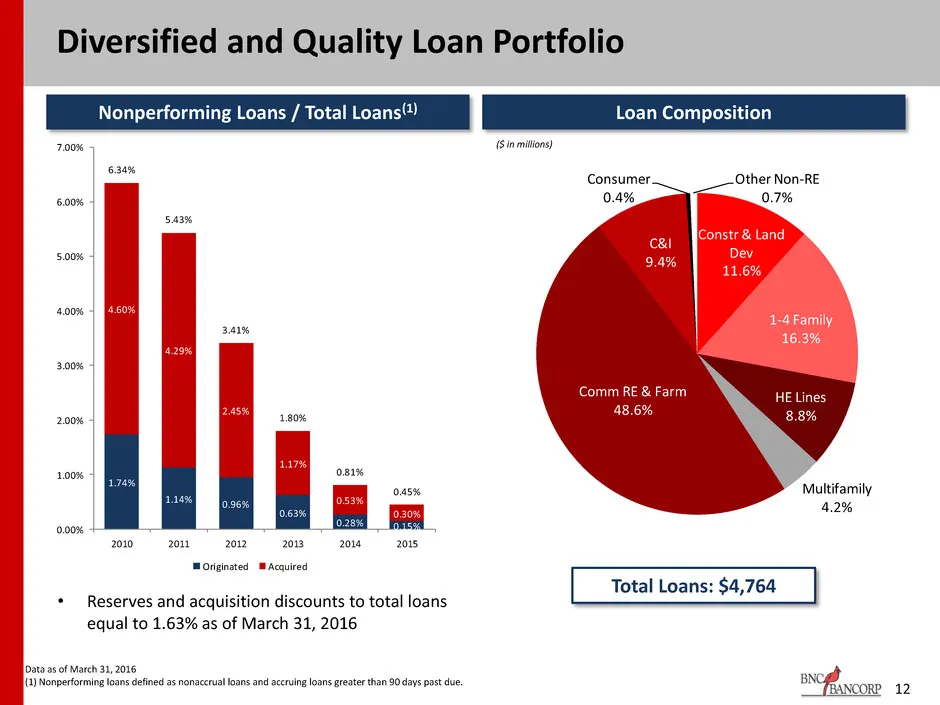
Diversified and Quality Loan Portfolio Data as of March 31, 2016 (1) Nonperforming loans defined as nonaccrual loans and accruing loans greater than 90 days past due. 12 Nonperforming Loans / Total Loans(1) • Reserves and acquisition discounts to total loans equal to 1.63% as of March 31, 2016 Loan
Slide 13: Well-Balanced Core Deposit Portfolio
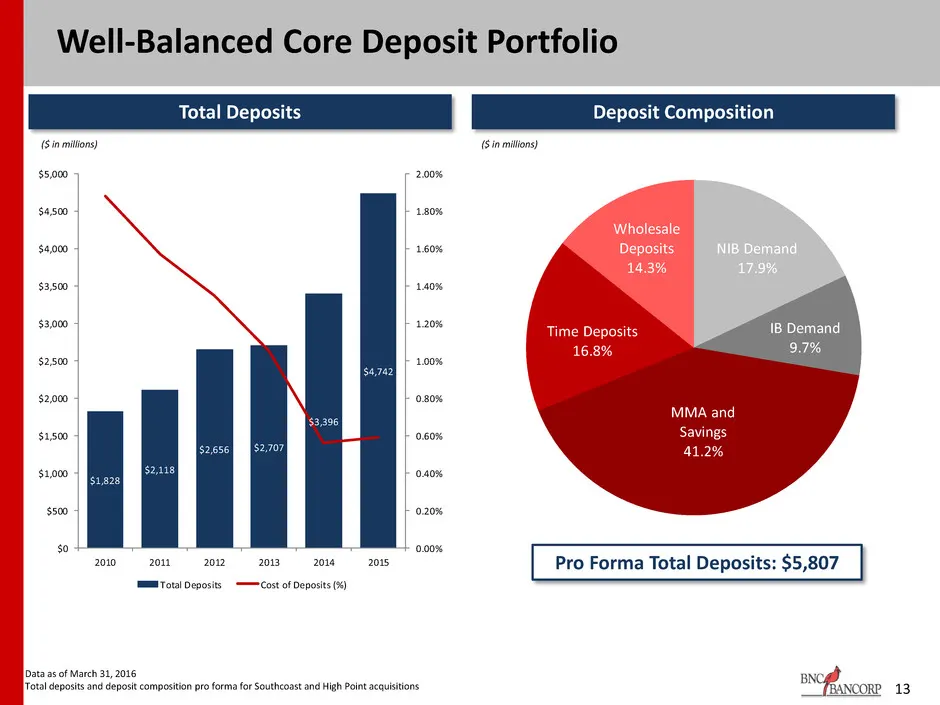
Well-Balanced Core Deposit Portfolio ($ in millions) 13 Total Deposits Deposit Composition Data as of March 31, 2016 Total deposits and deposit composition pro forma for Southcoast and High Point acquisitions Pro Forma Total Deposits: $5,807 ($ in millions) ($ in millions) $1,828 $2,118 $2,656 $2,70
Slide 14: BNCN Entering Peer Group with Highest Valuations
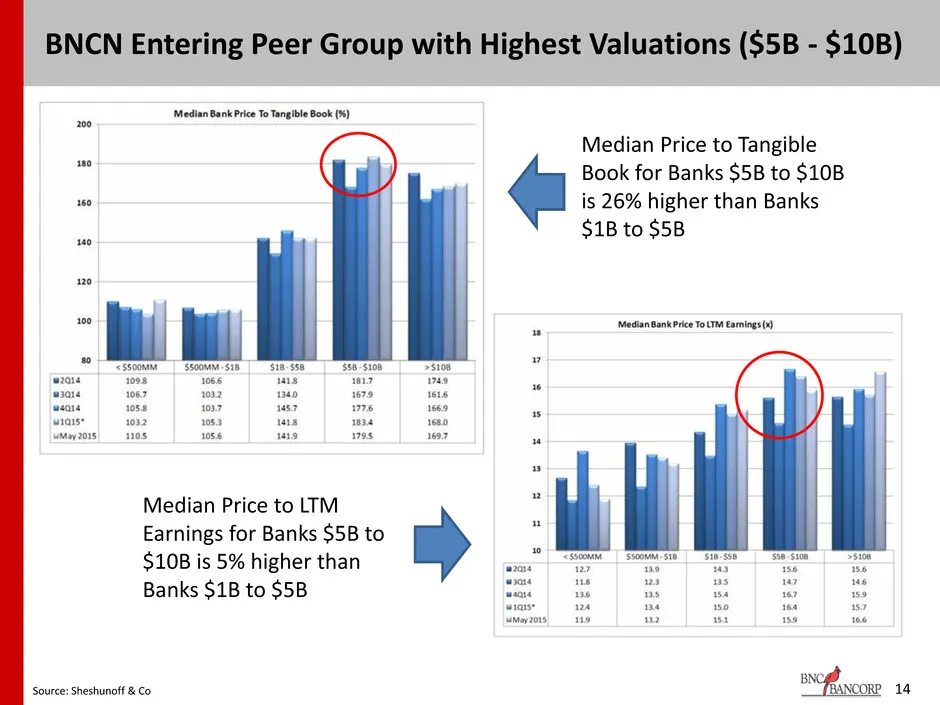
14 BNCN Entering Peer Group with Highest Valuations ($5B - $10B) Source: Sheshunoff & Co Median Price to Tangible Book for Banks $5B to $10B is 26% higher than Banks $1B to $5B Median Price to LTM Earnings for Banks $5B to $10B is 5% higher than Banks $1B to $5B
Slide 15: Financial Metrics
Financial Metrics
Slide 16: Transaction
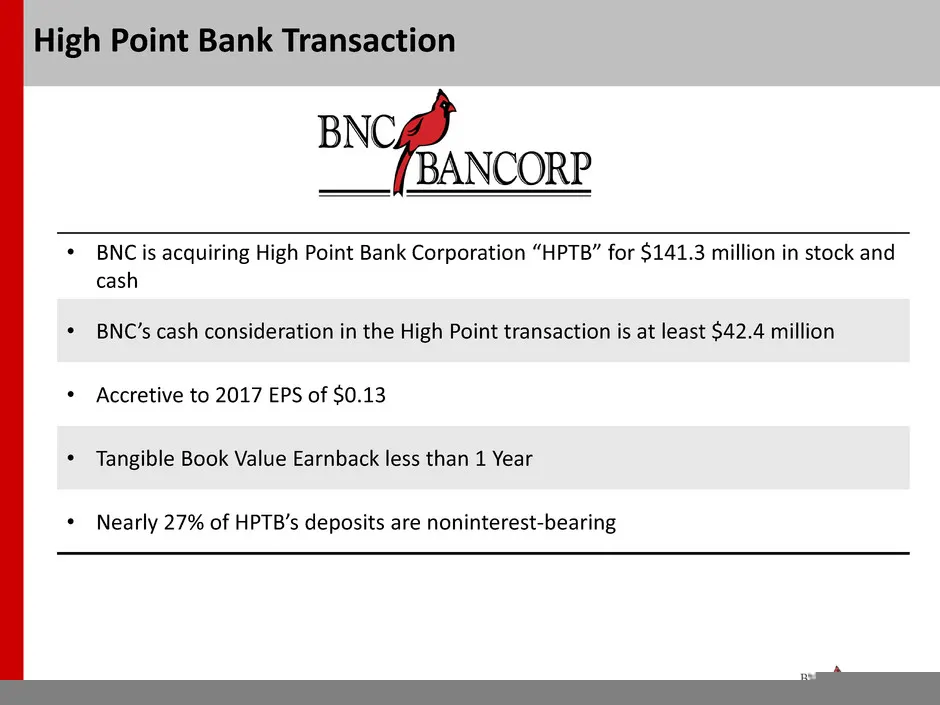
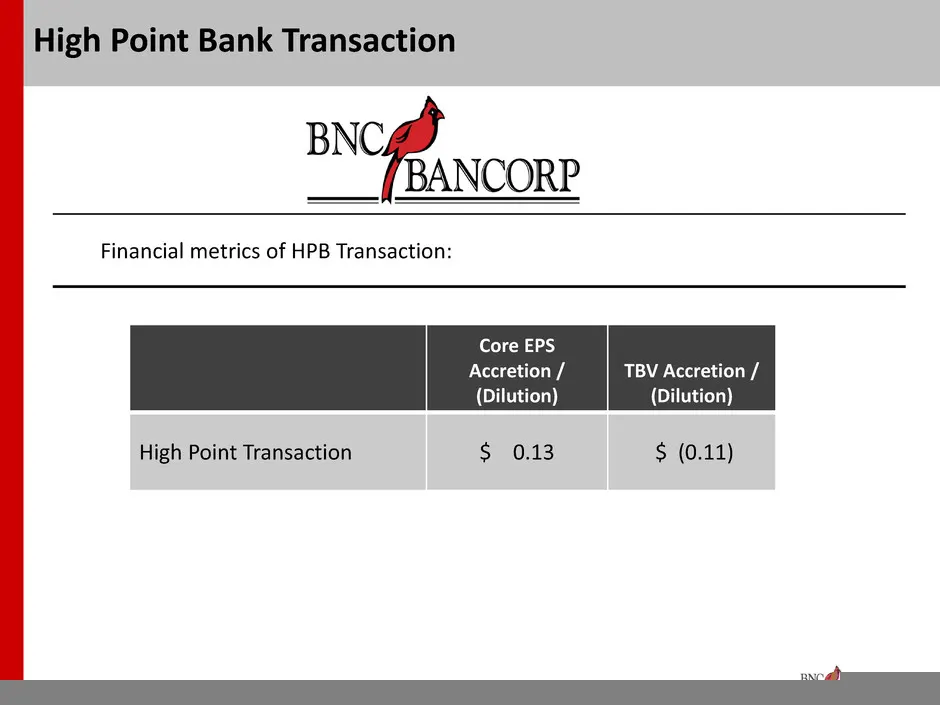
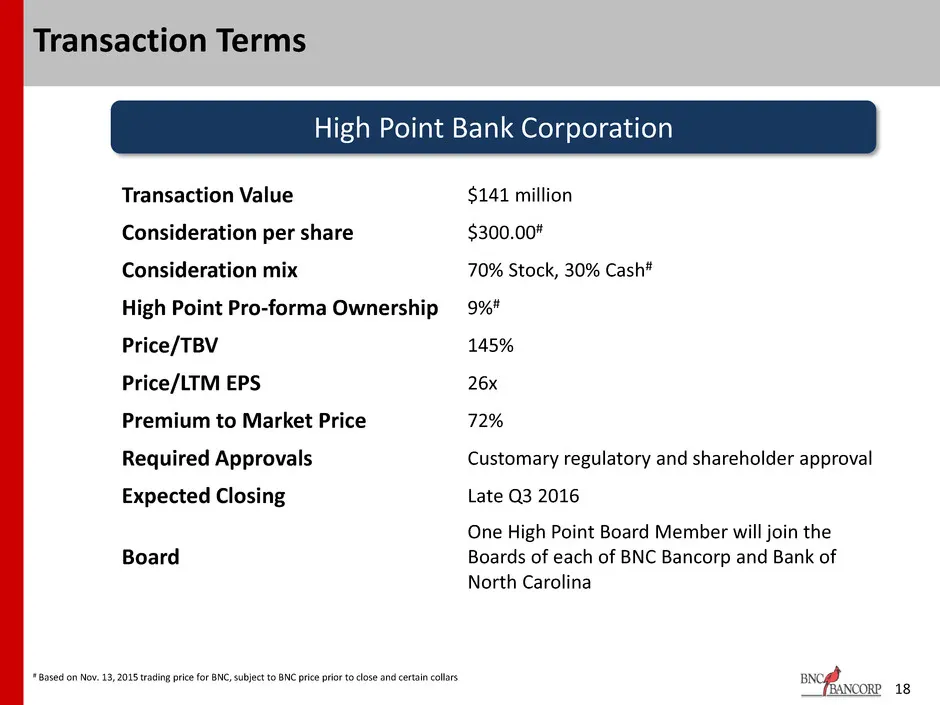
• BNC is acquiring High Point Bank Corporation “HPTB” for $141.3 million in stock and cash • BNC’s cash consideration in the High Point transaction is at least $42.4 million • Accretive to 2017 EPS of $0.13 • Tangible Book Value Earnback less than 1 Year • Nearly 27% of HPTB’s deposits are nonintere
Slide 17: Financial metrics of HPB Transaction
Financial metrics of HPB Transaction: 17 High Point Bank Transaction Core EPS Accretion / (Dilution) TBV Accretion / (Dilution) High Point Transaction $ 0.13 $ (0.11)
Slide 18: Transaction Terms
18 Transaction Terms # Based on Nov. 13, 2015 trading price for BNC, subject to BNC price prior to close and certain collars High Point Bank Corporation Transaction Value $141 million Consideration per share $300.00# Consideration mix 70% Stock, 30% Cash# High Point Pro-forma Ownership 9%# Price/TBV
Slide 19: Transaction Assumptions
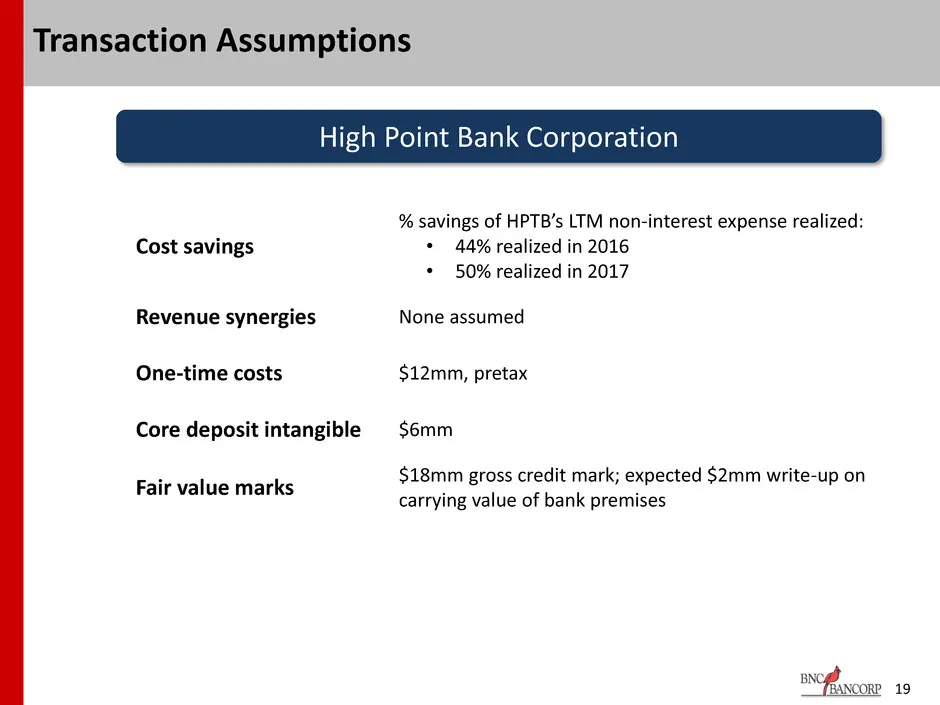
19 Transaction Assumptions Cost savings % savings of HPTB’s LTM non-interest expense realized: • 44% realized in 2016 • 50% realized in 2017 Revenue synergies None assumed One-time costs $12mm, pretax Core deposit intangible $6mm Fair value marks $18mm gross credit mark; expected $2mm write-up on ca
Slide 20: Consideration and exchange ratio terms
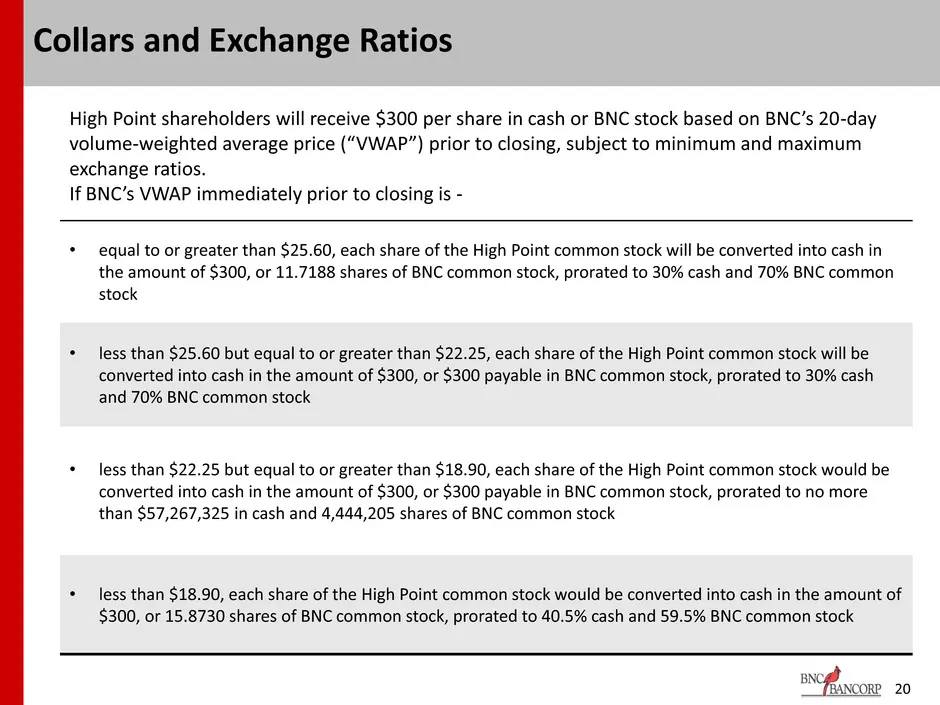
High Point shareholders will receive $300 per share in cash or BNC stock based on BNC’s 20-day volume-weighted average price (“VWAP”) prior to closing, subject to minimum and maximum exchange ratios. If BNC’s VWAP immediately prior to closing is - • equal to or greater than $25.60, each share of the
Slide 21: Benefits to BNC Franchise Value
Benefits to BNC Franchise Value
Slide 22: Benefits to BNC Franchise
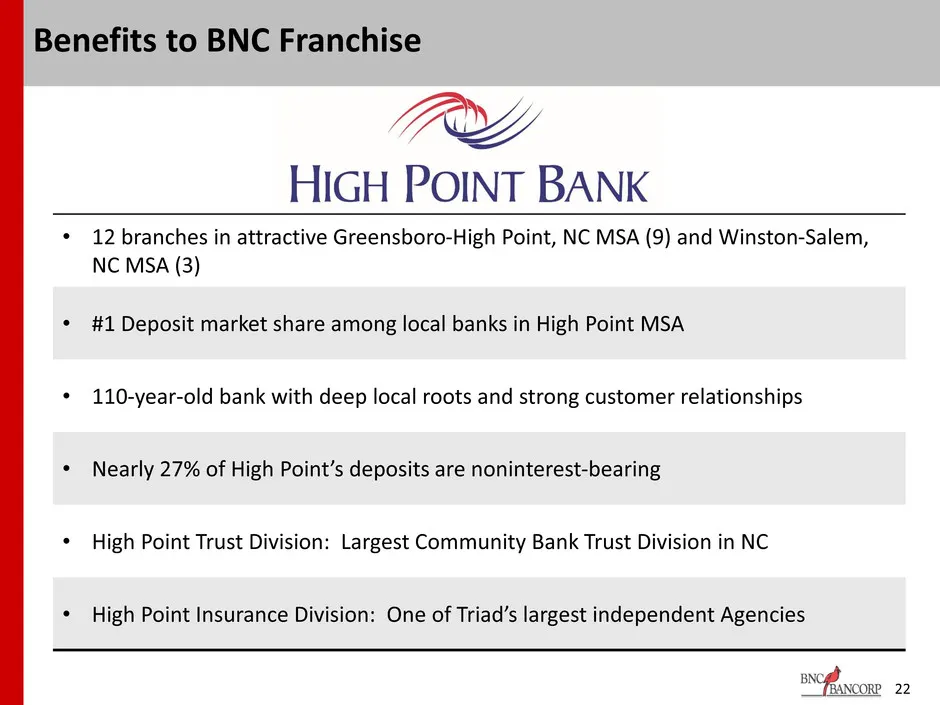
• 12 branches in attractive Greensboro-High Point, NC MSA (9) and Winston-Salem, NC MSA (3) • #1 Deposit market share among local banks in High Point MSA • 110-year-old bank with deep local roots and strong customer relationships • Nearly 27% of High Point’s deposits are noninterest-bearing • High P
Slide 23: Trust and Brokerage Divisions
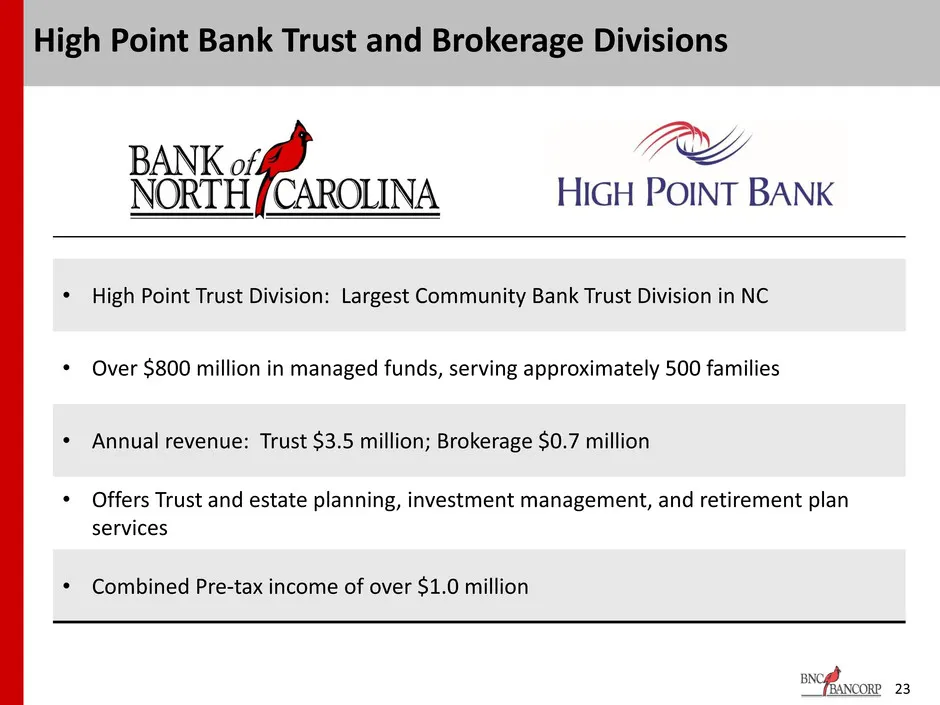
• High Point Trust Division: Largest Community Bank Trust Division in NC • Over $800 million in managed funds, serving approximately 500 families • Annual revenue: Trust $3.5 million; Brokerage $0.7 million • Offers Trust and estate planning, investment management, and retirement plan services • Com
Slide 24: Insurance Division
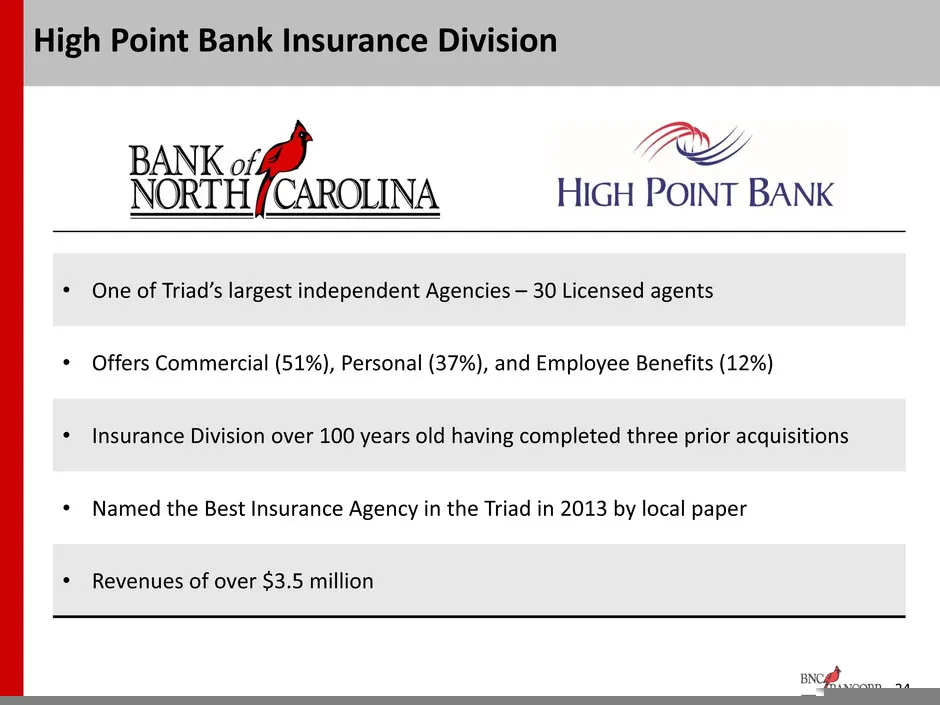
• One of Triad’s largest independent Agencies – 30 Licensed agents • Offers Commercial (51%), Personal (37%), and Employee Benefits (12%) • Insurance Division over 100 years old having completed three prior acquisitions • Named the Best Insurance Agency in the Triad in 2013 by local paper • Revenues
Slide 25: Operational Synergies
• Both BNC and High Point are on the same core system – JHA Silverlake • Concentration of Seasoned Talent in Support Areas proficient at JHA Silverlake • High Point has state-of-the-art Operations Center with adequate space to support future growth • Provides space and talent to combine loan and dep
Slide 26: Corporation Overview
High Point Bank Corporation Overview
Slide 27: Corporation – Overview
27 High Point Bank Corporation – Overview Founded in High Point, NC in 1905 Quality core deposit franchise Current balance sheet built solely through organic growth Largest community bank trust department in North Carolina More than $800mm in managed funds, approximately 500 families Six
Slide 28: Corporation – Overview (cont.)
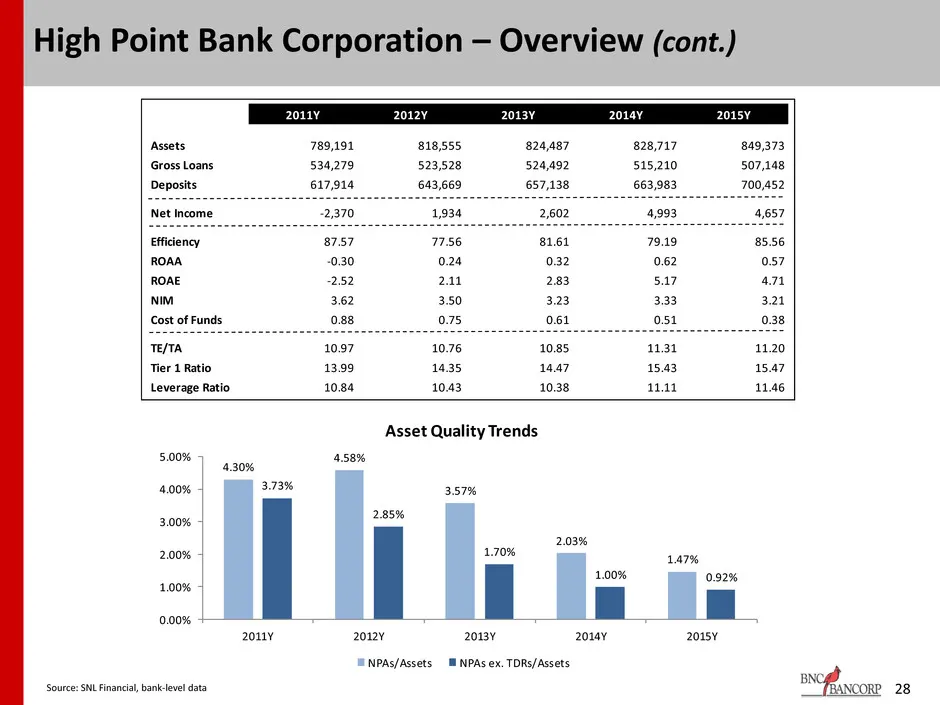
28 High Point Bank Corporation – Overview (cont.) Source: SNL Financial, bank-level data 4.30% 4.58% 3.57% 2.03% 1.47% 3.73% 2.85% 1.70% 1.00% 0.92% 0.00% 1.00% 2.00% 3.00% 4.00% 5.00% 2011Y 2012Y 2013Y 2014Y 2015Y Asset Quality Trends NPAs/Assets NPAs ex. TDRs/Assets 2011Y 2012Y 2013Y 2014Y 2015Y A
Slide 29: Greensboro-High Point Market Share
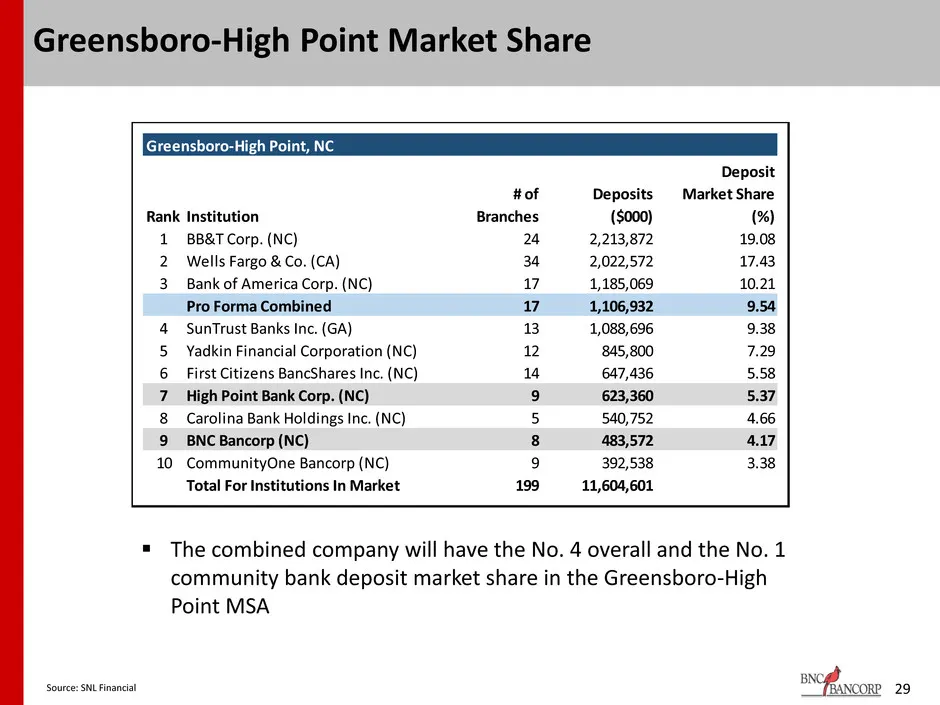
29 Greensboro-High Point Market Share The combined company will have the No. 4 overall and the No. 1 community bank deposit market share in the Greensboro-High Point MSA Source: SNL Financial Greensboro-High Point, NC Rank Institution # of Branches Deposits ($000) Deposit Market Share (%) 1 BB&T C
Slide 30: Appendix
BNC ~__ {BANCORP Appen dix
Slide 31: Commercial Real Estate
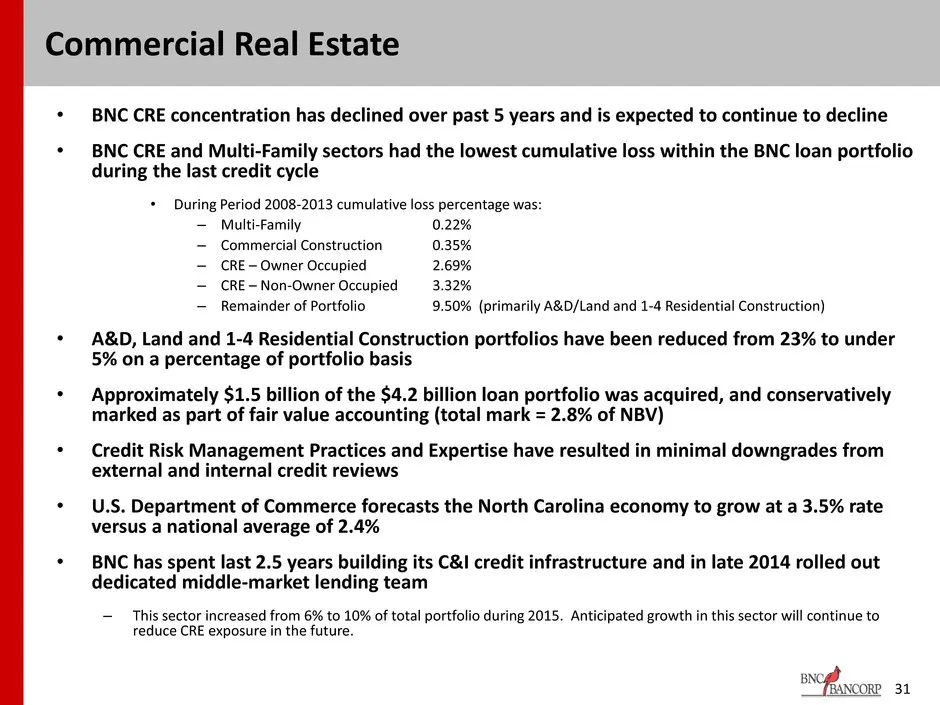
31 Commercial Real Estate • BNC CRE concentration has declined over past 5 years and is expected to continue to decline • BNC CRE and Multi-Family sectors had the lowest cumulative loss within the BNC loan portfolio during the last credit cycle • During Period 2008-2013 cumulative loss percentage wa
Slide 32: Historical Loan Portfolio Trends
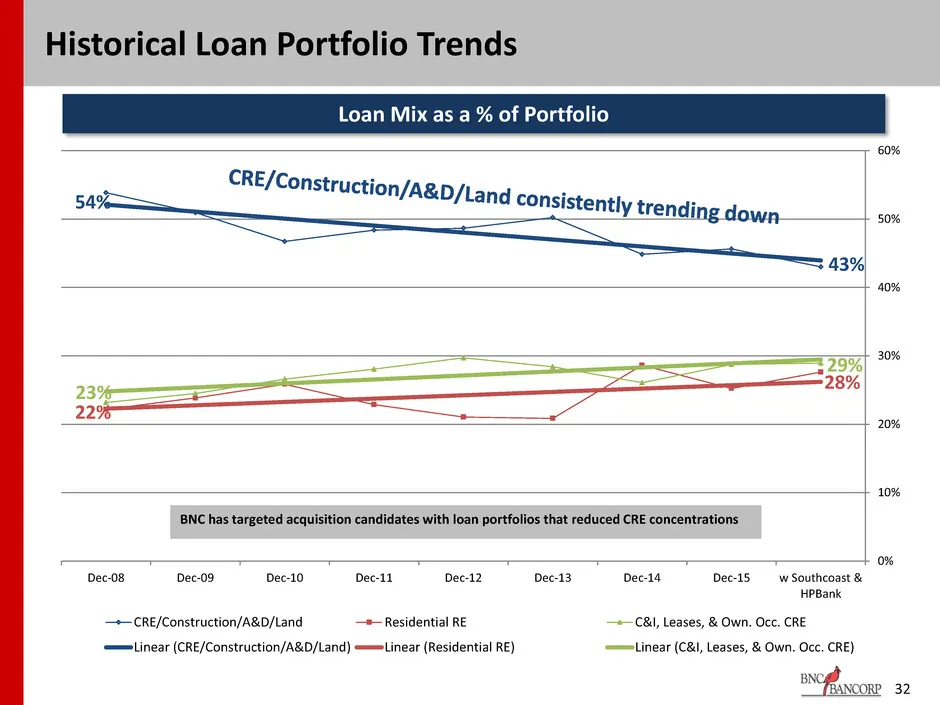
43% 54% 28% 22% 29% 23% 0% 10% 20% 30% 40% 50% 60% w Southcoast & HPBank Dec-15Dec-14Dec-13Dec-12Dec-11Dec-10Dec-09Dec-08 CRE/Construction/A&D/Land Residential RE C&I, Leases, & Own. Occ. CRE Linear (CRE/Construction/A&D/Land) Linear (Residential RE) Linear (C&I, Leases, & Own. Occ. CRE) BNC has tar
Slide 33: Cumulative Loan Loss Percentage – Prior Credit Cycle
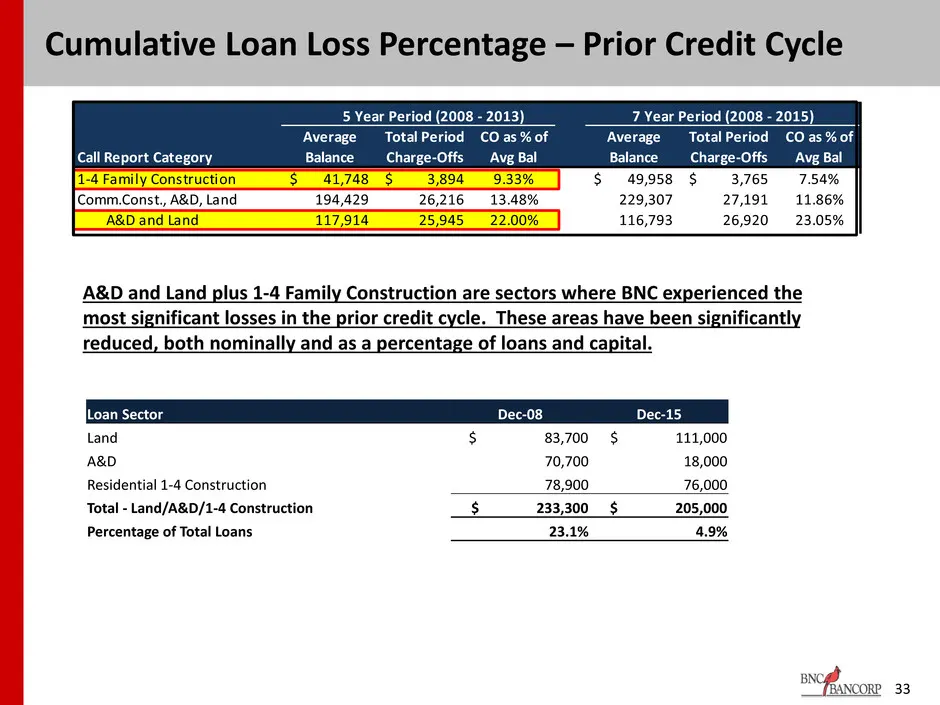
33 5 Year Period (2008 - 2013) 7 Year Period (2008 - 2015) Average Total Period CO as % of Average Total Period CO as % of Call Report Category Balance Charge-Offs Avg Bal Balance Charge-Offs Avg Bal 1-4 Family Construction 41,748$ 3,894$ 9.33% 49,958$ 3,765$ 7.54% Comm.Const., A&D, Land 194,429 26,
Slide 34: Conservative Credit Marks – Additional Capital Buffer
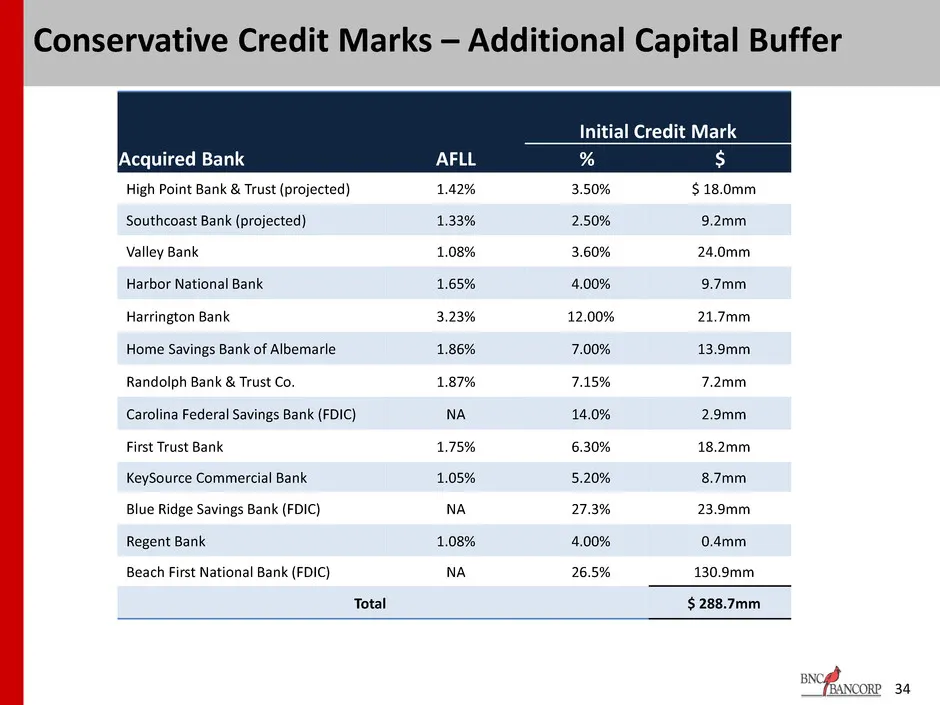
34 Conservative Credit Marks – Additional Capital Buffer Initial Credit Mark Acquired Bank AFLL % $ High Point Bank & Trust (projected) 1.42% 3.50% $ 18.0mm Southcoast Bank (projected) 1.33% 2.50% 9.2mm Valley Bank 1.08% 3.60% 24.0mm Harbor National Bank 1.65% 4.00% 9.7mm Harrington Bank 3.23% 12.00
Slide 35: CRE Concentration Management
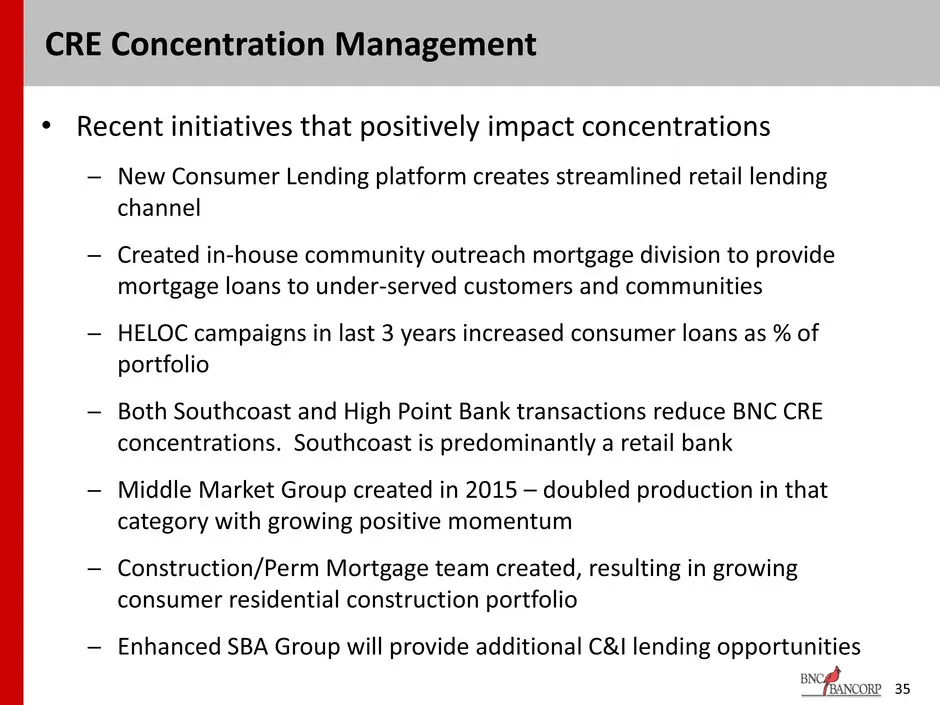
35 CRE Concentration Management • Recent initiatives that positively impact concentrations ─ New Consumer Lending platform creates streamlined retail lending channel ─ Created in-house community outreach mortgage division to provide mortgage loans to under-served customers and communities ─ HELOC ca
Slide 36: Investor Contacts
36 Investor Contacts Richard D. Callicutt II President & Chief Executive Officer David B. Spencer Senior Executive Vice President & Chief Financial Officer BNC Bancorp 3980 Premier Drive, Suite 210 High Point, NC 27265 (366) 869-9200 www.bncbancorp.com
Slide 37: Forward Looking Statements
37 Forward Looking Statements This presentation contains certain forward-looking information about BNC that is intended to be covered by the safe harbor for “forward-looking statements” provided by the Private Securities Litigation Reform Act of 1995. All statements other than statements of historic
Source: SEC EDGAR · 8-K filed May 2, 2016
More decks from BNC Bancorp
 Merger or Acquisition (January 2017)37 slides · Jan 23, 2017
 Stephens Inc. Carolinas Roadshow - Charlotte November 201637 slides · Nov 8, 2016
 IPO Roadshow (July 2016)28 slides · Jul 20, 2016
 Merger or Acquisition (November 2015)32 slides · Nov 16, 2015
 Merger or Acquisition (August 2015)24 slides · Aug 14, 2015
 KBW Community Bank Investor Conference July 201517 slides · Jul 28, 2015