Reliant Bancorp — Commerce Union Bancshares — Raymond James Emerging Bank Symposium September 2017
51 slides from Reliant Bancorp's conference presentation, Sep 7, 2017

Slide 1: Raymond James Emerging Bank Symposium September 2017
Raymond James Emerging Bank Symposium September 2017 Nasdaq: CUBN
Slide 2: Safe Harbor Statements: Forward Looking Statements
Safe Harbor Statements Forward Looking StatementsAll statements, other than statements of historical fact, included in this presentation are statements of “forward-looking statements” by Commerce Union Bancshares, Inc. (“Commerce Union”) within the meaning of Section 27A of the Securities Act of 193
Slide 3: Safe Harbor Statements: Notice to prospective investors
Safe Harbor Statements Notice to prospective investorsThe information contained herein is a summary and it is not complete. It has been prepared for use only in connection with a private placement (the “Placement”) of securities (the “Securities”) of Commerce Union. The Securities have not been regi
Slide 4: Safe Harbor Statements: Non-GAAP Financial Measures
Safe Harbor Statements Non-GAAP Financial MeasuresThis investor presentation contains certain financial measures that are not measures recognized under U.S. generally accepted accounting principles (GAAP) and, therefore, are considered non-GAAP financial measures. Commerce Union’s and Community Firs

Slide 5: Company Overview
Company Overview September 2017
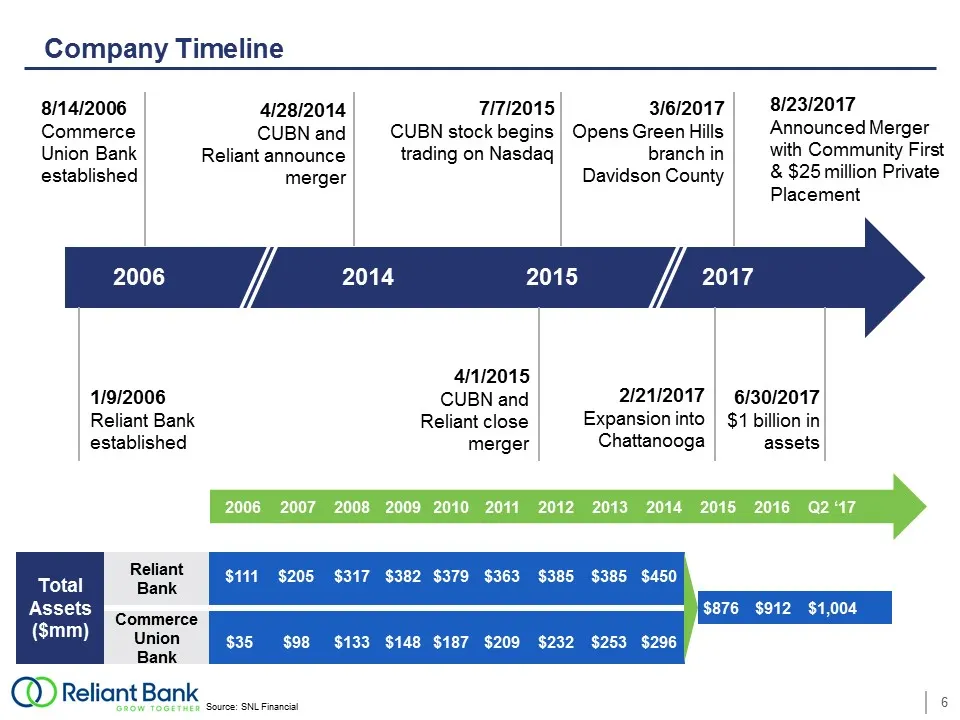
Slide 6: Company Timeline
Company Timeline Source: SNL Financial 2006 2014 2015 2017 8/14/2006Commerce Union Bank established 4/1/2015CUBN and Reliant close merger 4/28/2014CUBN and Reliant announce merger 7/7/2015CUBN stock begins trading on Nasdaq 3/6/2017Opens Green Hills branch in Davidson County Total Assets($mm) Relian
Slide 7: Reliant Bank Franchise Overview
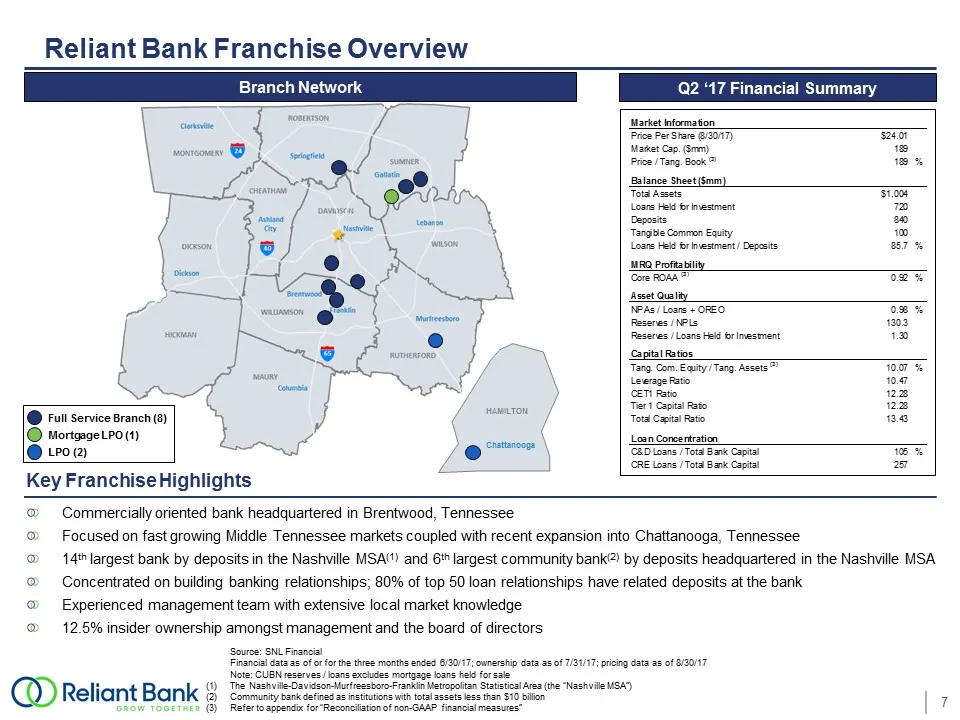
Reliant Bank Franchise Overview Source: SNL Financial Financial data as of or for the three months ended 6/30/17; ownership data as of 7/31/17; pricing data as of 8/30/17Note: CUBN reserves / loans excludes mortgage loans held for saleThe Nashville-Davidson-Murfreesboro-Franklin Metropolitan Statist
Slide 8: Experienced Management Team
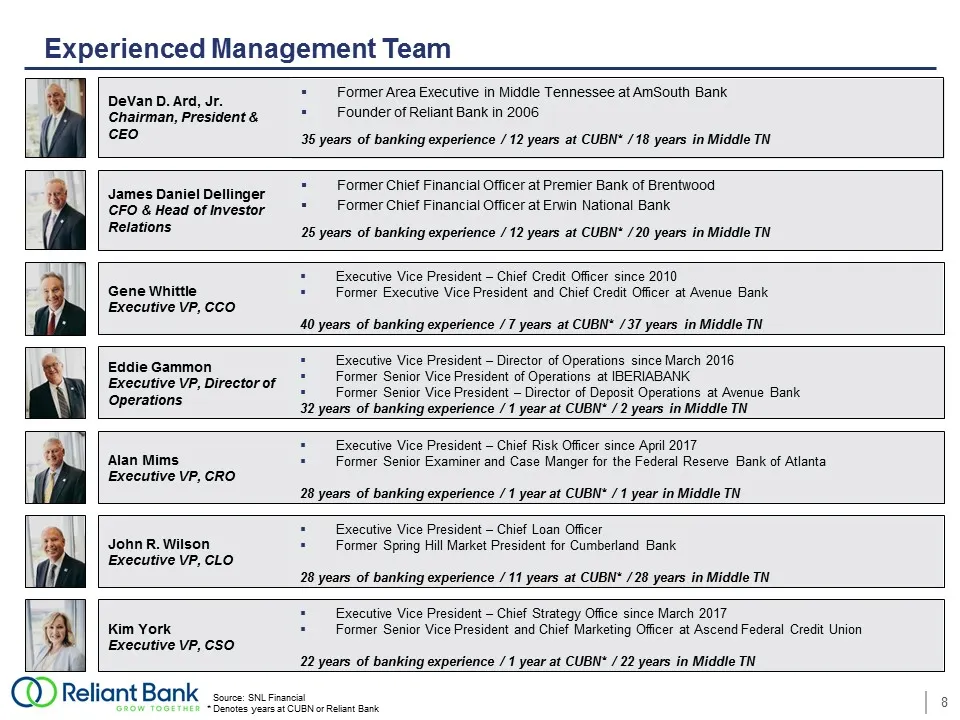
Experienced Management Team Source: SNL Financial* Denotes years at CUBN or Reliant Bank DeVan D. Ard, Jr.Chairman, President & CEO Former Area Executive in Middle Tennessee at AmSouth BankFounder of Reliant Bank in 2006 35 years of banking experience / 12 years at CUBN* / 18 years in Middle TN Jame
Slide 9: Brand Standards Critical to Our Success
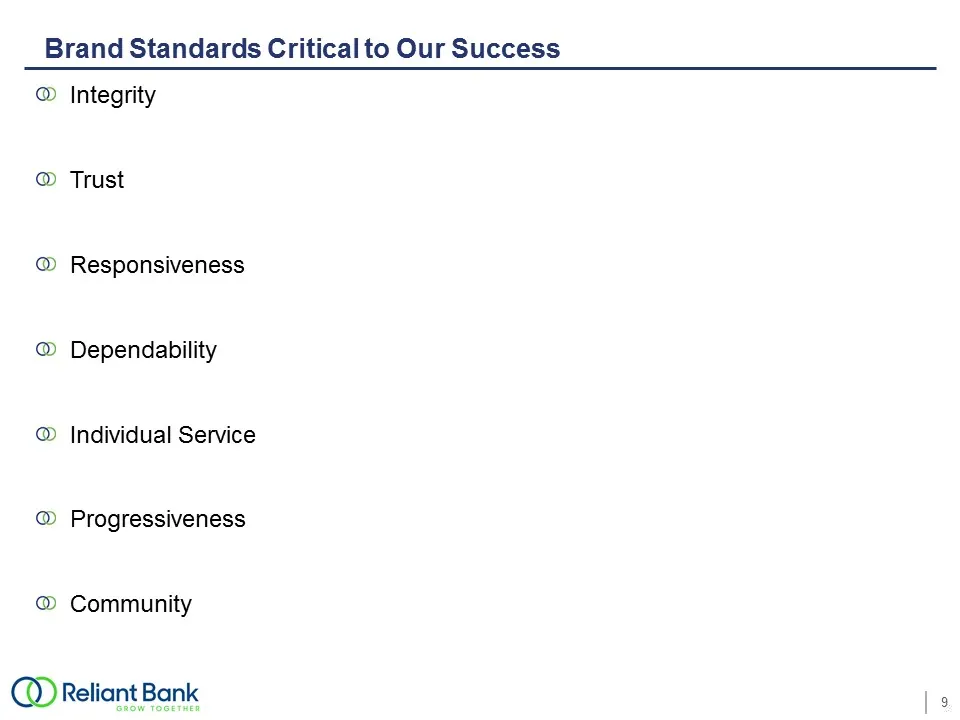
Brand Standards Critical to Our Success Integrity TrustResponsivenessDependability Individual Service ProgressivenessCommunity
Slide 10: Nashville Deposit Market Share
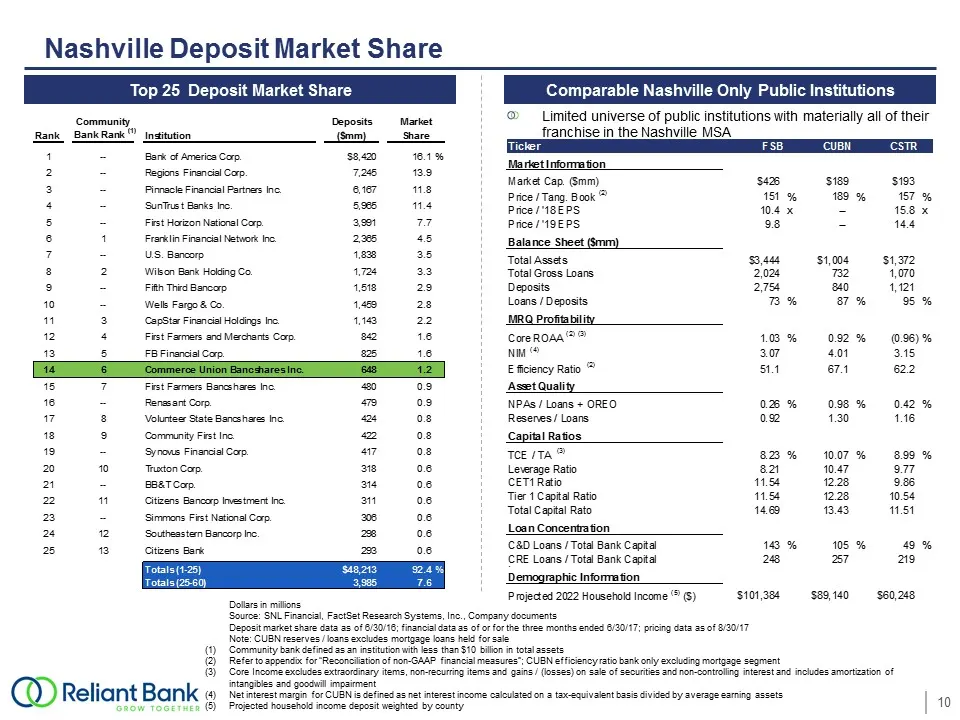
Nashville Deposit Market Share Dollars in millionsSource: SNL Financial, FactSet Research Systems, Inc., Company documentsDeposit market share data as of 6/30/16; financial data as of or for the three months ended 6/30/17; pricing data as of 8/30/17Note: CUBN reserves / loans excludes mortgage loans
Slide 11: Nashville MSA Demographics
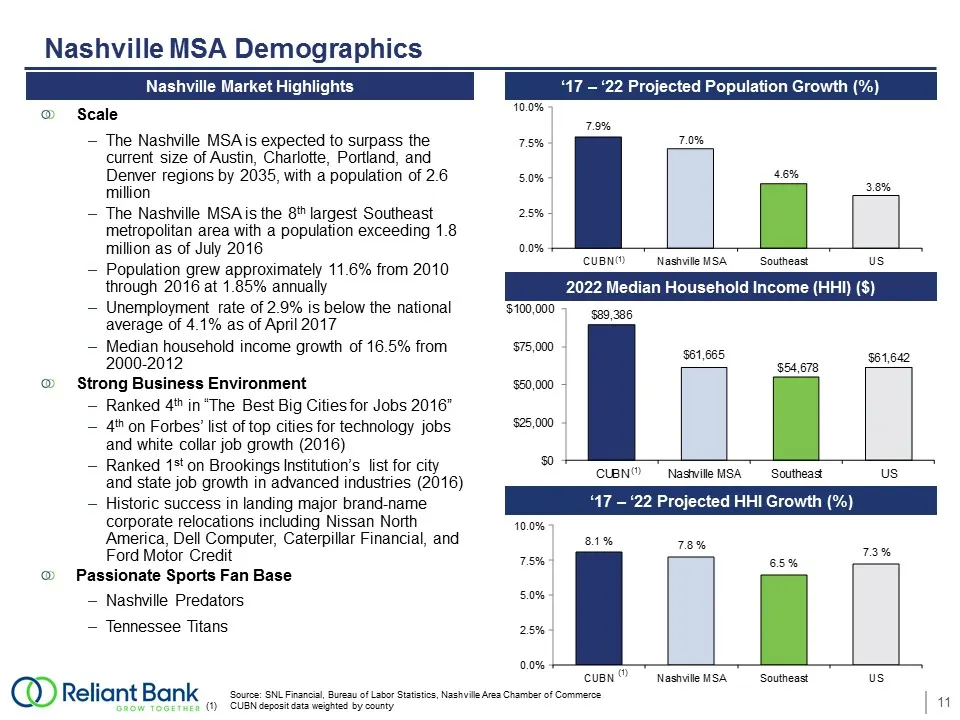
Nashville MSA Demographics Source: SNL Financial, Bureau of Labor Statistics, Nashville Area Chamber of CommerceCUBN deposit data weighted by county Nashville Market Highlights 2022 Median Household Income (HHI) ($) ‘17 – ‘22 Projected HHI Growth (%) ‘17 – ‘22 Projected Population Growth (%) ScaleTh
Slide 12: Lending Platform
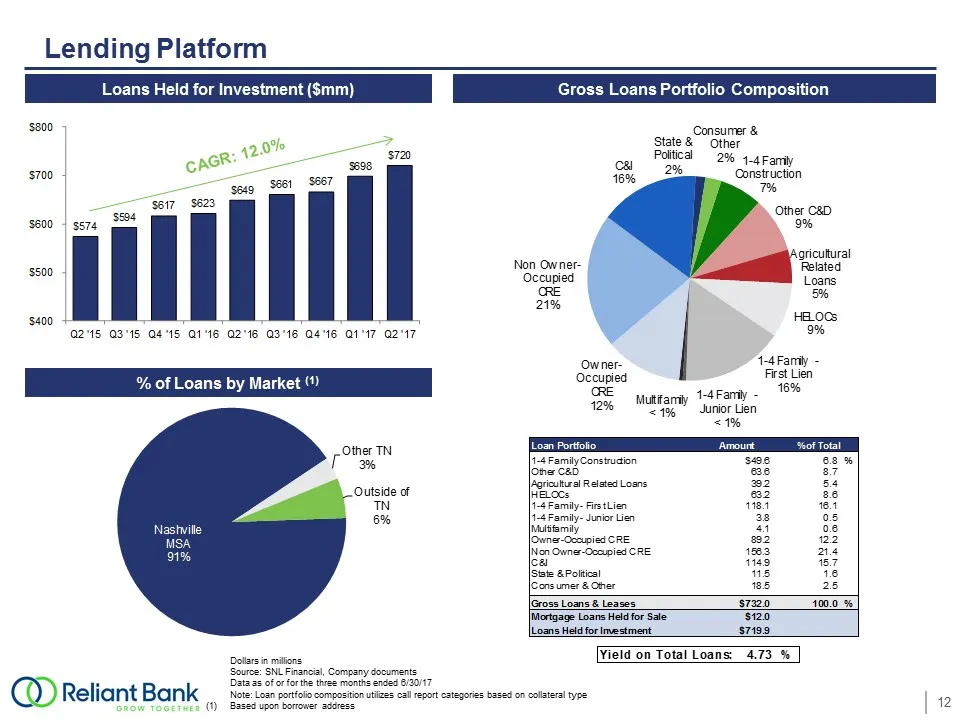
Lending Platform Dollars in millionsSource: SNL Financial, Company documentsData as of or for the three months ended 6/30/17Note: Loan portfolio composition utilizes call report categories based on collateral typeBased upon borrower address % of Loans by Market (1) Gross Loans Portfolio Composition
Slide 13: Diversified C&D and CRE Loan Portfolios
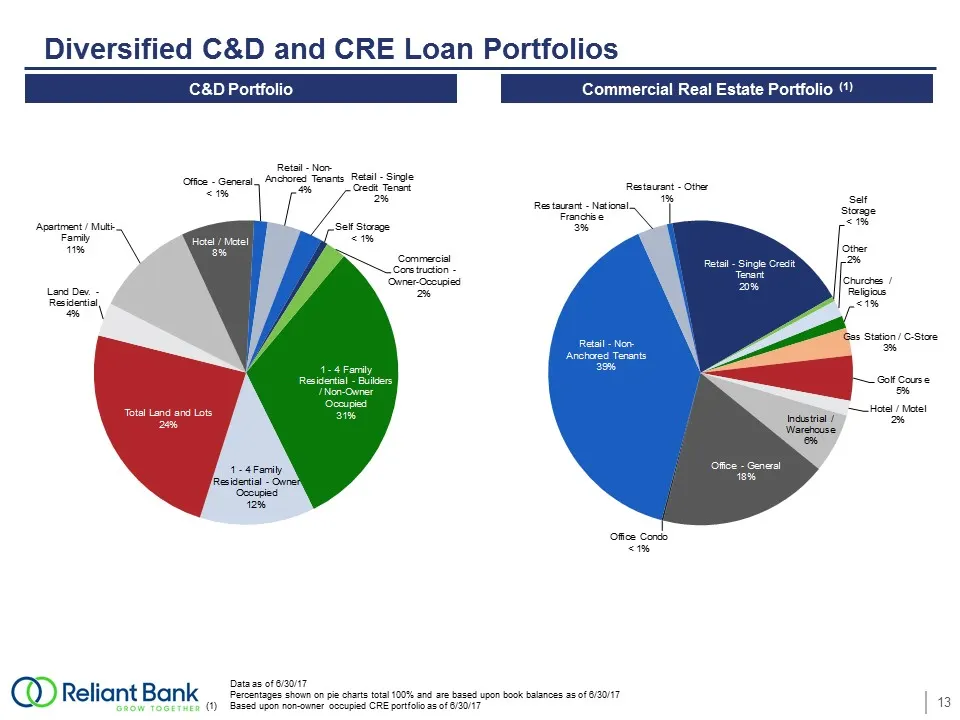
Diversified C&D and CRE Loan Portfolios Data as of 6/30/17Percentages shown on pie charts total 100% and are based upon book balances as of 6/30/17 Based upon non-owner occupied CRE portfolio as of 6/30/17 Commercial Real Estate Portfolio (1) C&D Portfolio
Slide 14: Asset Quality
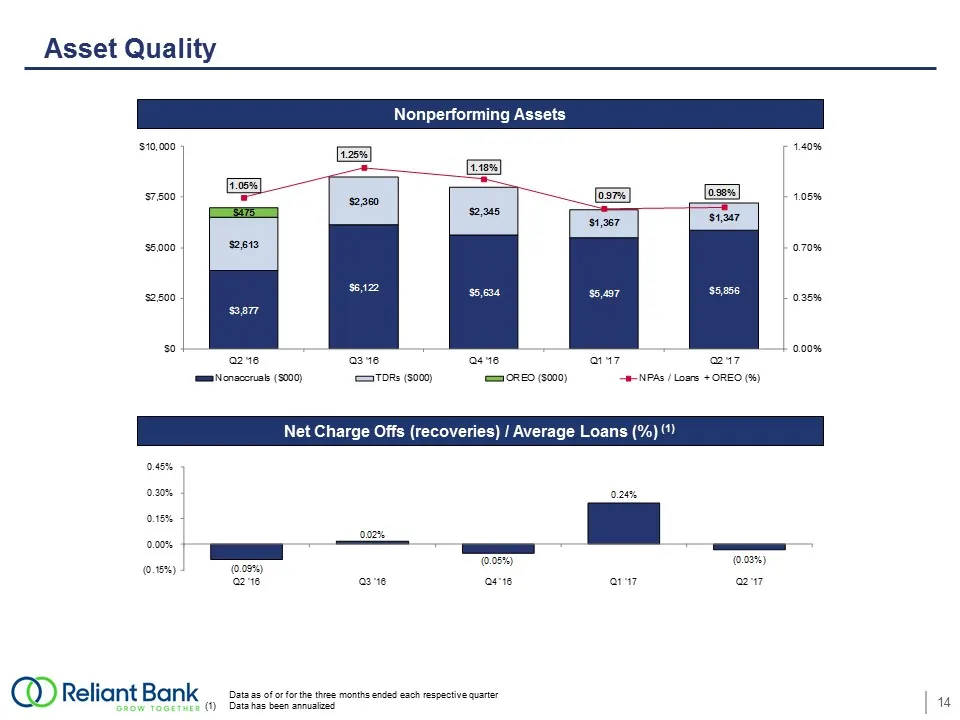
Asset Quality Data as of or for the three months ended each respective quarterData has been annualized Nonperforming Assets Net Charge Offs (recoveries) / Average Loans (%) (1)
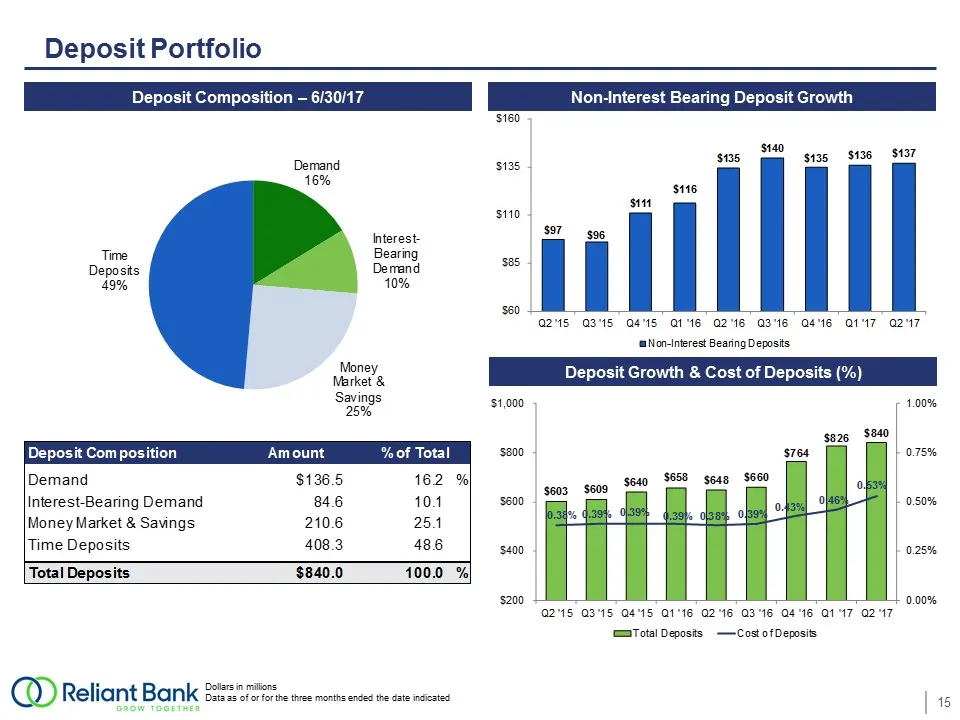
Slide 15: Deposit Portfolio
Deposit Portfolio Dollars in millionsData as of or for the three months ended the date indicated Deposit Composition – 6/30/17 Non-Interest Bearing Deposit Growth Deposit Growth & Cost of Deposits (%)
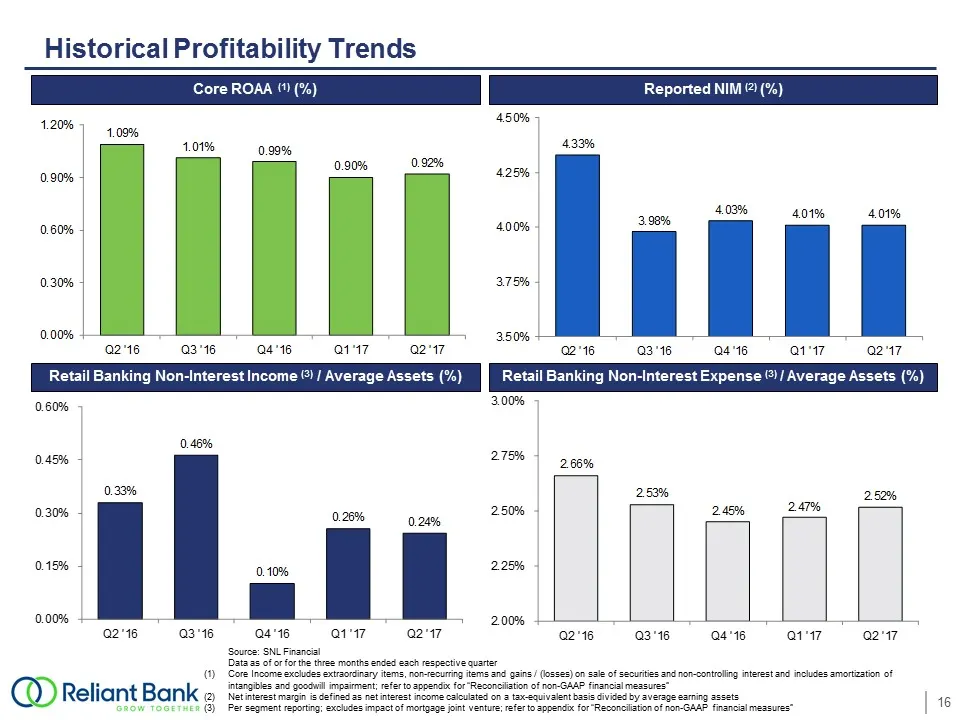
Slide 16: Historical Profitability Trends
Core ROAA (1) (%) Historical Profitability Trends Source: SNL Financial Data as of or for the three months ended each respective quarterCore Income excludes extraordinary items, non-recurring items and gains / (losses) on sale of securities and non-controlling interest and includes amortization of i
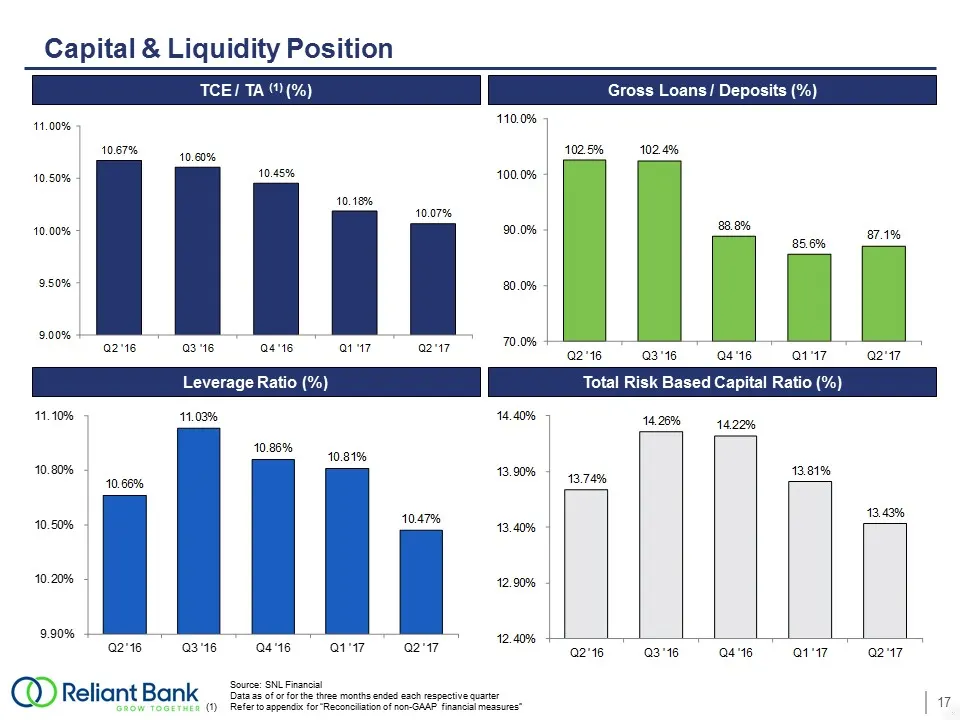
Slide 17: Capital & Liquidity Position
Capital & Liquidity Position Source: SNL FinancialData as of or for the three months ended each respective quarterRefer to appendix for “Reconciliation of non-GAAP financial measures” TCE / TA (1) (%) Gross Loans / Deposits (%) Leverage Ratio (%) Total Risk Based Capital Ratio (%)
Slide 18: Merger of Commerce Union Bancshares, Inc. & Community First, Inc.
Merger of Commerce Union Bancshares, Inc. & Community First, Inc. September 2017
Slide 19: Transaction Rationale
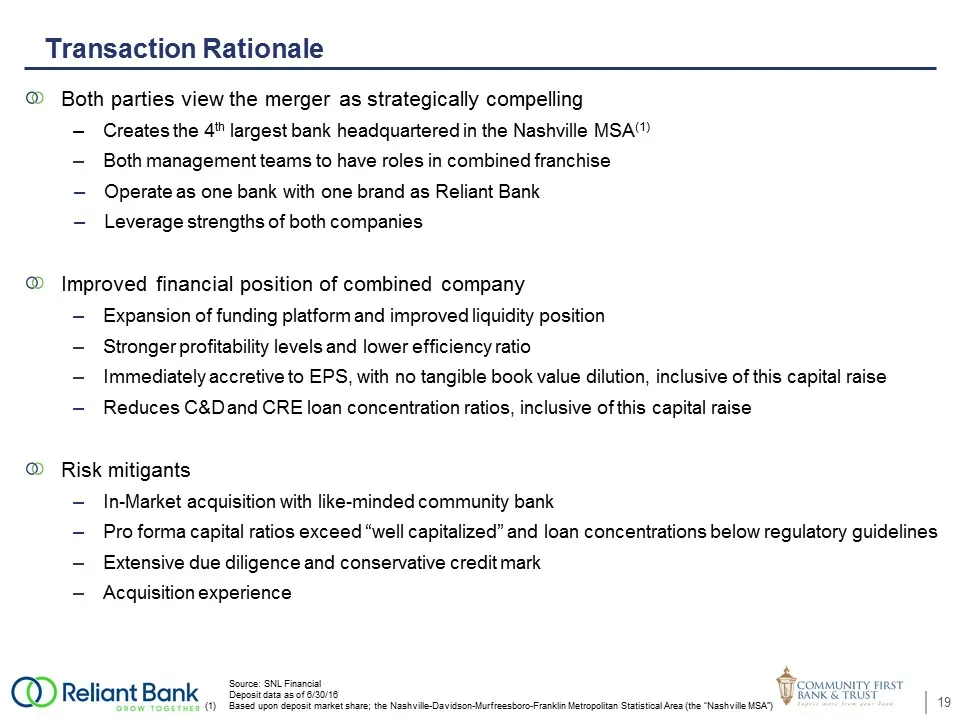
Transaction Rationale Both parties view the merger as strategically compellingCreates the 4th largest bank headquartered in the Nashville MSA(1) Both management teams to have roles in combined franchiseOperate as one bank with one brand as Reliant BankLeverage strengths of both companiesImproved fin
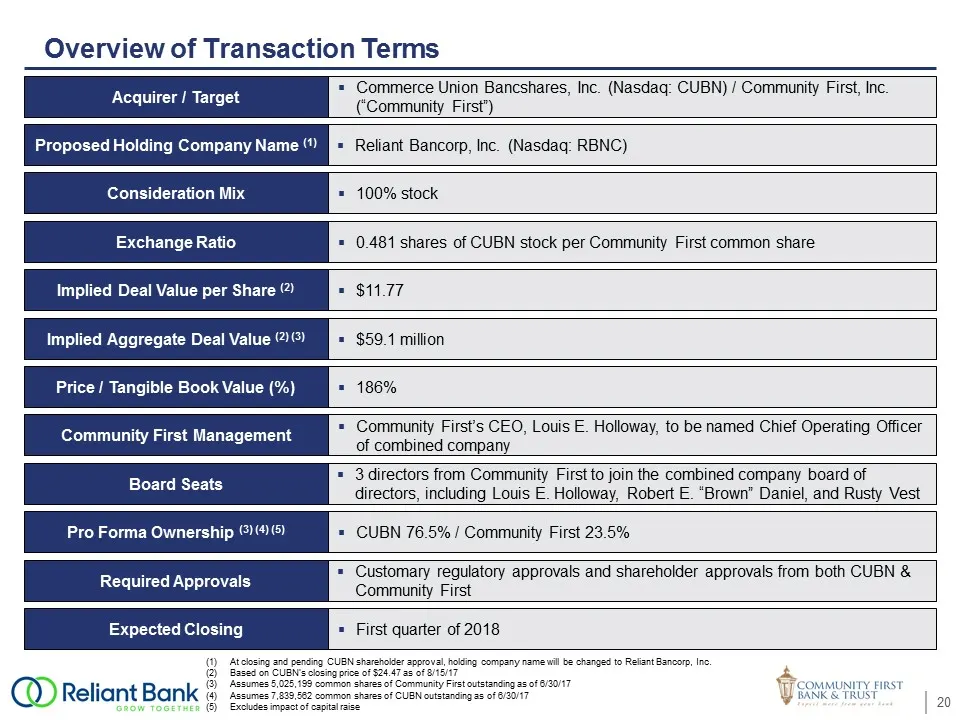
Slide 20: Overview of Transaction Terms
Overview of Transaction Terms At closing and pending CUBN shareholder approval, holding company name will be changed to Reliant Bancorp, Inc.Based on CUBN’s closing price of $24.47 as of 8/15/17Assumes 5,025,199 common shares of Community First outstanding as of 6/30/17Assumes 7,839,562 common share
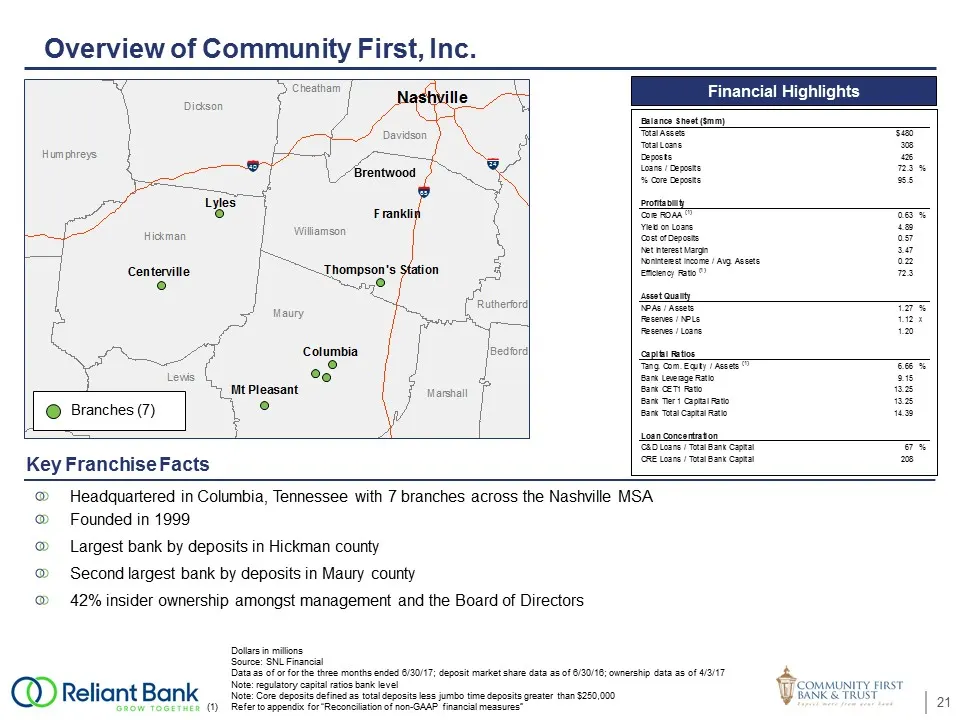
Slide 21: Overview of Community First, Inc.
Overview of Community First, Inc. Dollars in millionsSource: SNL FinancialData as of or for the three months ended 6/30/17; deposit market share data as of 6/30/16; ownership data as of 4/3/17Note: regulatory capital ratios bank levelNote: Core deposits defined as total deposits less jumbo time depo
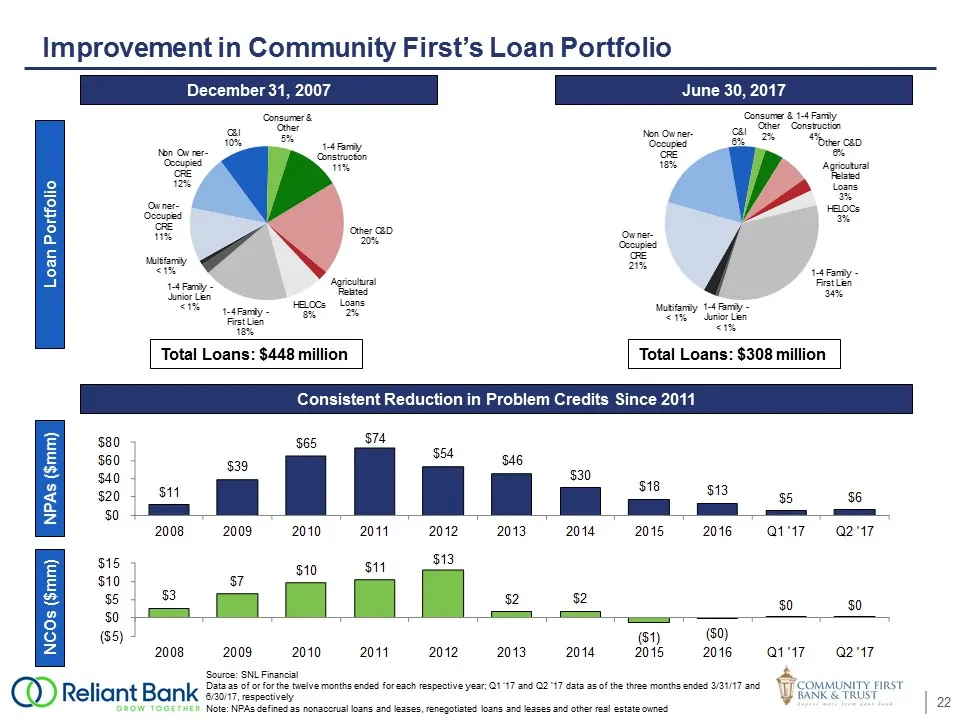
Slide 22: Improvement in Community First's Loan Portfolio
Improvement in Community First’s Loan Portfolio Source: SNL FinancialData as of or for the twelve months ended for each respective year; Q1 ‘17 and Q2 ’17 data as of the three months ended 3/31/17 and6/30/17, respectivelyNote: NPAs defined as nonaccrual loans and leases, renegotiated loans and lease
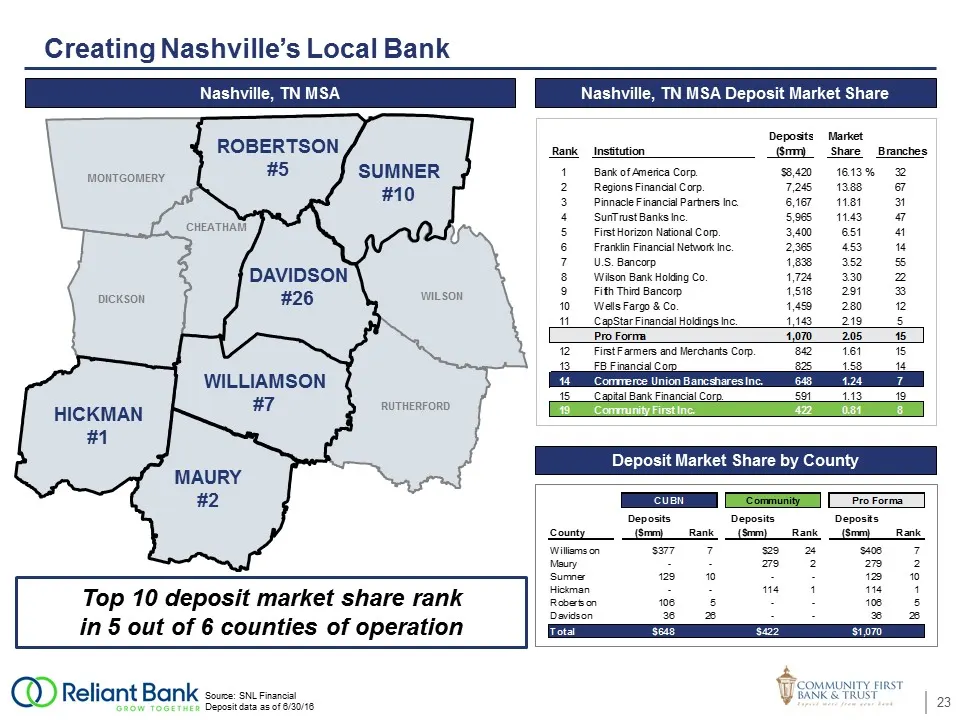
Slide 23: Creating Nashville's Local Bank
Creating Nashville’s Local Bank Source: SNL FinancialDeposit data as of 6/30/16 Deposit Market Share by County RUTHERFORD CHEATHAM DICKSON MONTGOMERY WILSON ROBERTSON#5 WILLIAMSON#7 MAURY#2 HICKMAN#1 SUMNER#10 DAVIDSON#26 Nashville, TN MSA Deposit Market Share Top 10 deposit market share rank in 5 o
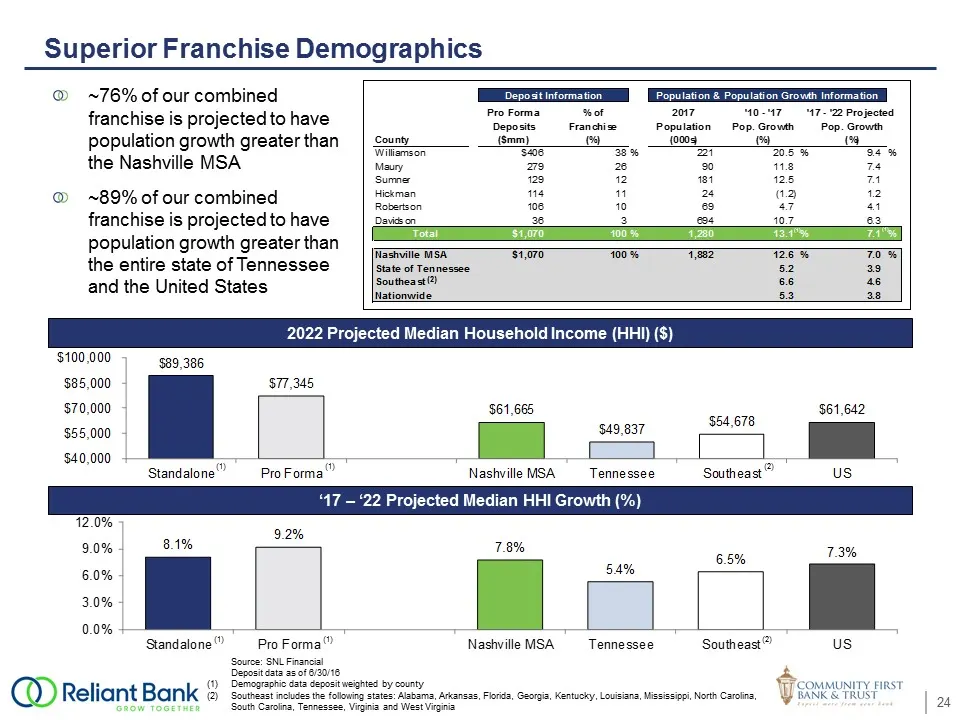
Slide 24: Superior Franchise Demographics
Superior Franchise Demographics ~76% of our combined franchise is projected to have population growth greater than the Nashville MSA~89% of our combined franchise is projected to have population growth greater than the entire state of Tennessee and the United States Source: SNL FinancialDeposit data
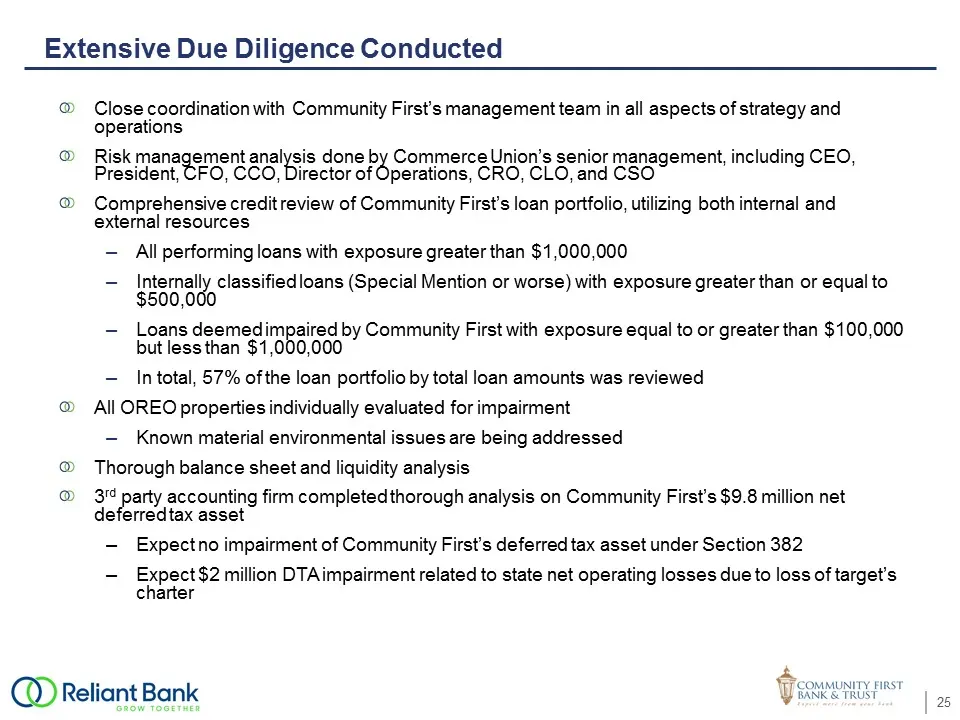
Slide 25: Extensive Due Diligence Conducted
Extensive Due Diligence Conducted Close coordination with Community First’s management team in all aspects of strategy and operationsRisk management analysis done by Commerce Union’s senior management, including CEO, President, CFO, CCO, Director of Operations, CRO, CLO, and CSOComprehensive credit
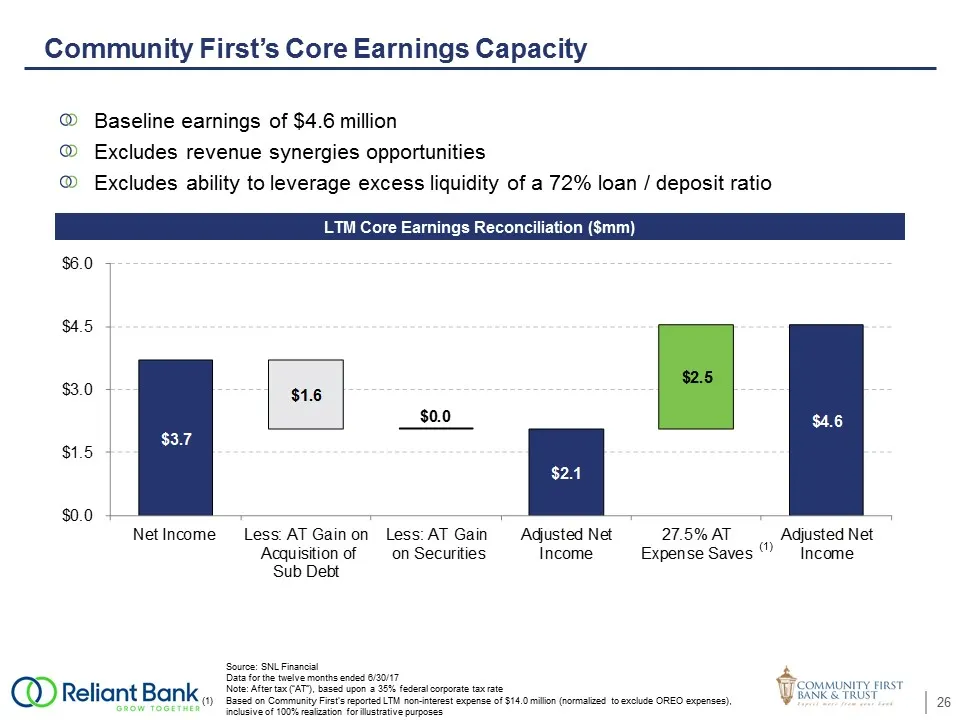
Slide 26: Community First's Core Earnings Capacity
Community First’s Core Earnings Capacity Baseline earnings of $4.6 millionExcludes revenue synergies opportunitiesExcludes ability to leverage excess liquidity of a 72% loan / deposit ratio Source: SNL Financial Data for the twelve months ended 6/30/17 Note: After tax (“AT”), based upon a 35% federa
Slide 27: Key Transaction Assumptions
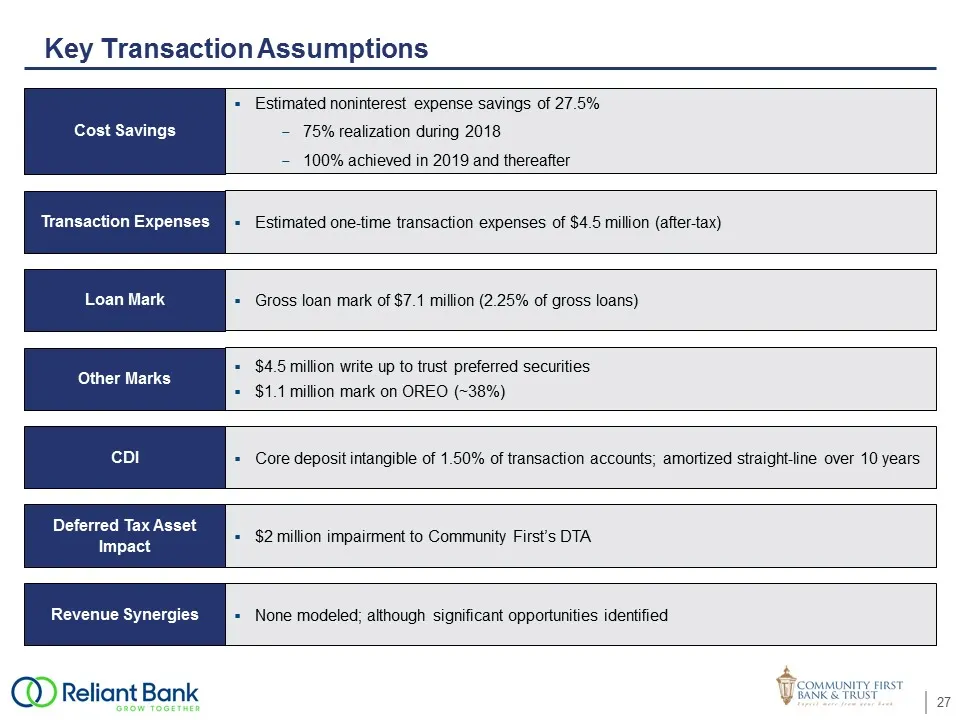
Key Transaction Assumptions Cost Savings Transaction Expenses Estimated one-time transaction expenses of $4.5 million (after-tax) Loan Mark Gross loan mark of $7.1 million (2.25% of gross loans) Estimated noninterest expense savings of 27.5%75% realization during 2018100% achieved in 2019 and therea
Slide 28: Static Pro Forma Balance Sheet
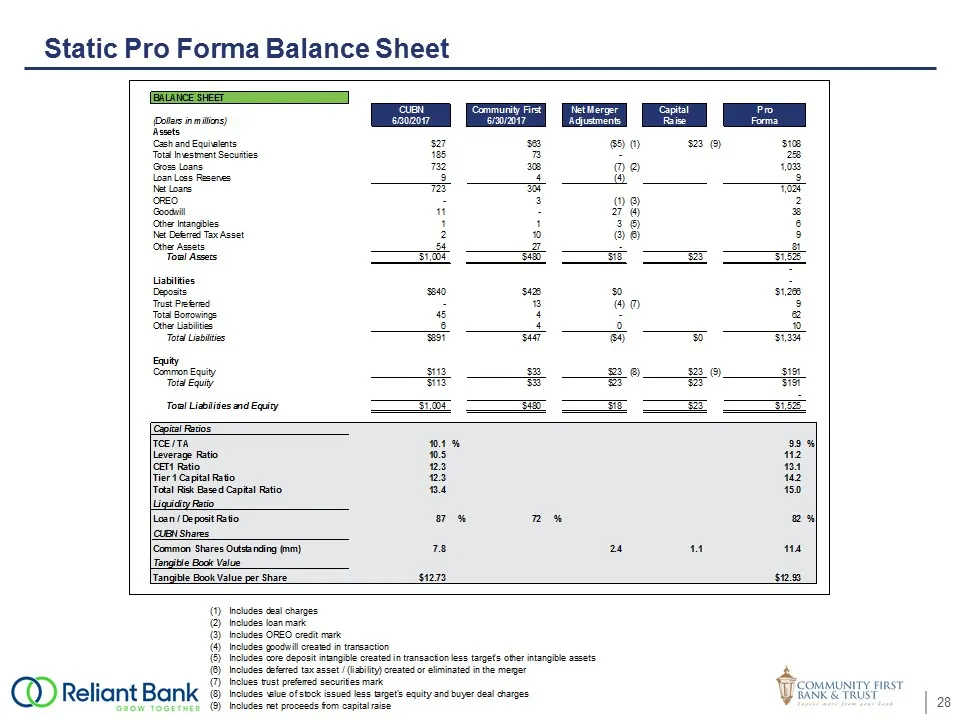
Static Pro Forma Balance Sheet
Slide 29: Estimated Pro Forma Financial Metrics
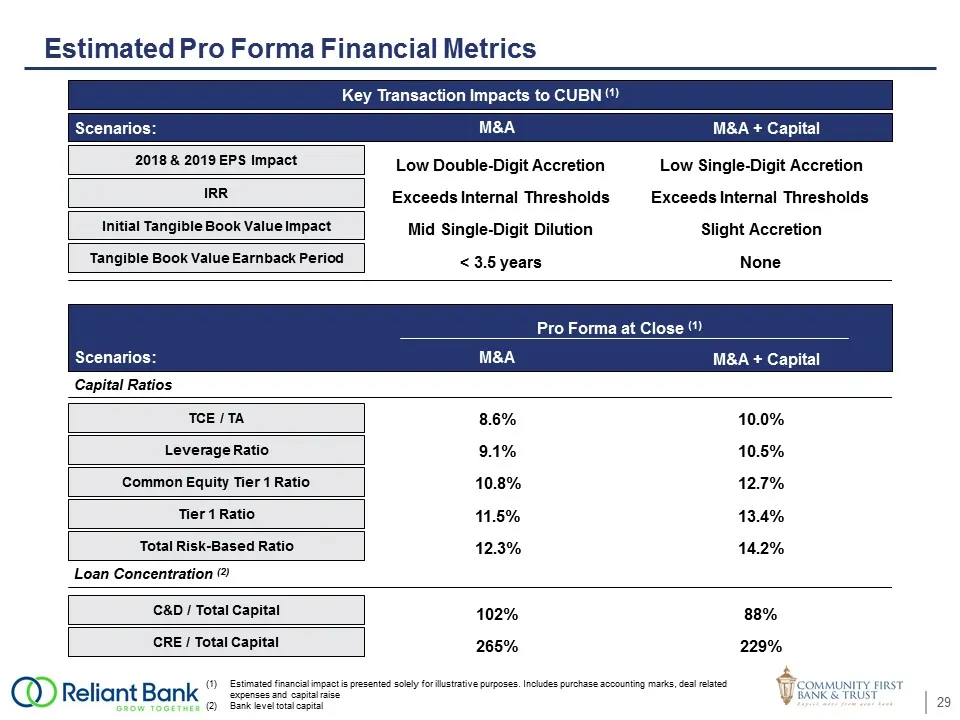
Estimated Pro Forma Financial Metrics Estimated financial impact is presented solely for illustrative purposes. Includes purchase accounting marks, deal related expenses and capital raiseBank level total capital Key Transaction Impacts to CUBN (1) 2018 & 2019 EPS Impact IRR Initial Tangible Book Val
Slide 30: Combined Company Overview
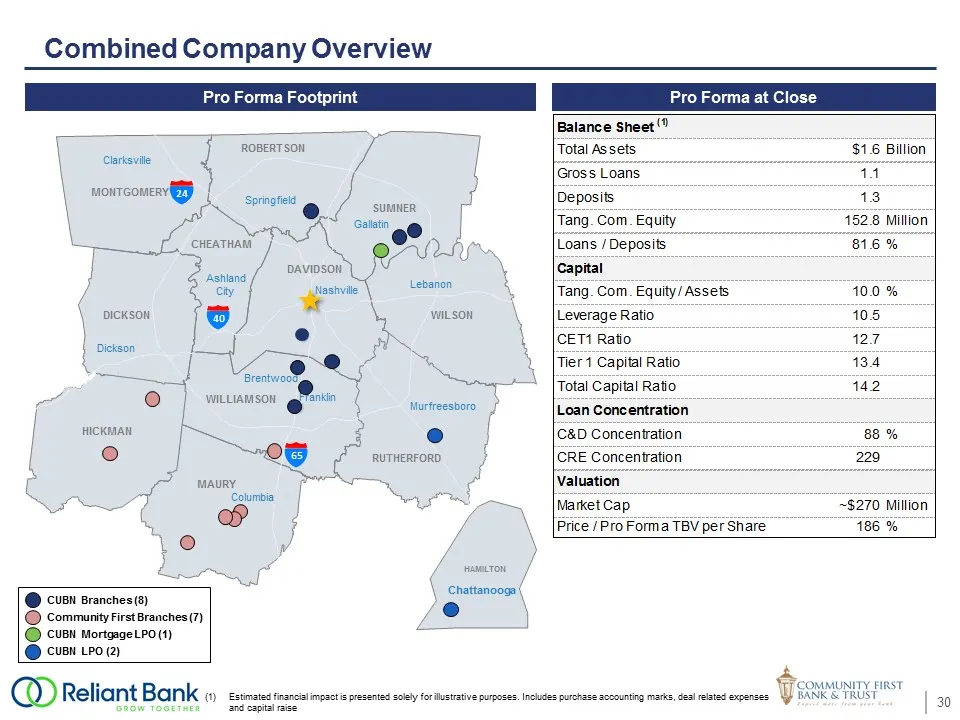
CUBN Branches (8)Community First Branches (7)CUBN Mortgage LPO (1)CUBN LPO (2) Combined Company Overview Pro Forma at Close Estimated financial impact is presented solely for illustrative purposes. Includes purchase accounting marks, deal related expenses and capital raise MONTGOMERY ROBERTSON SUMNE
Slide 31: Summary
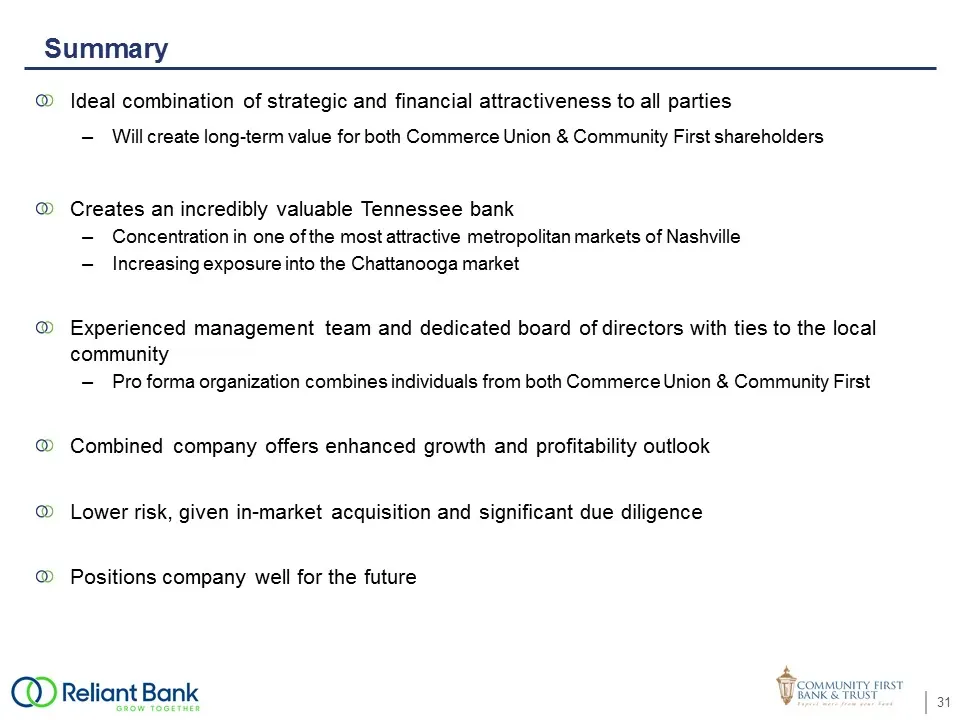
Summary Ideal combination of strategic and financial attractiveness to all partiesWill create long-term value for both Commerce Union & Community First shareholdersCreates an incredibly valuable Tennessee bankConcentration in one of the most attractive metropolitan markets of NashvilleIncreasing exp
Slide 32: Appendix
()) Reliant Bank GROW TOGETHER Appendix September 2017 COMMUNITY FIRST BANK & TRUST Expect more from your bank V
Slide 33: Pro Forma Loan Portfolio (GAAP)
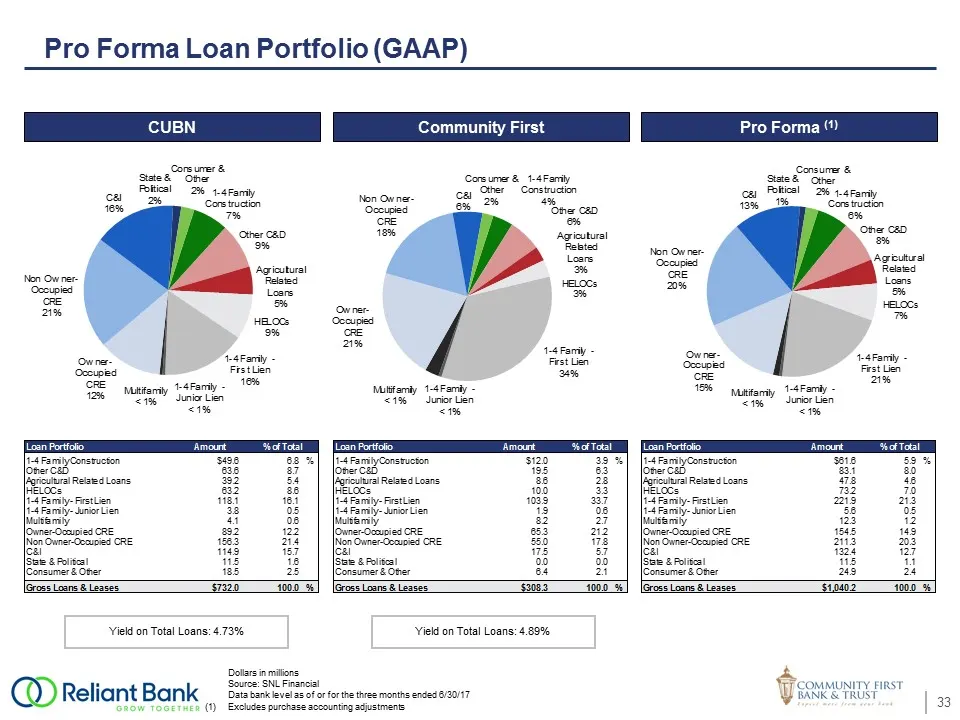
Pro Forma Loan Portfolio (GAAP) Dollars in millions Source: SNL Financial Data bank level as of or for the three months ended 6/30/17(1) Excludes purchase accounting adjustments Yield on Total Loans: 4.73% Yield on Total Loans: 4.89% CUBN Community First Pro Forma (1)
Slide 34: Pro Forma Deposit Portfolio (GAAP)
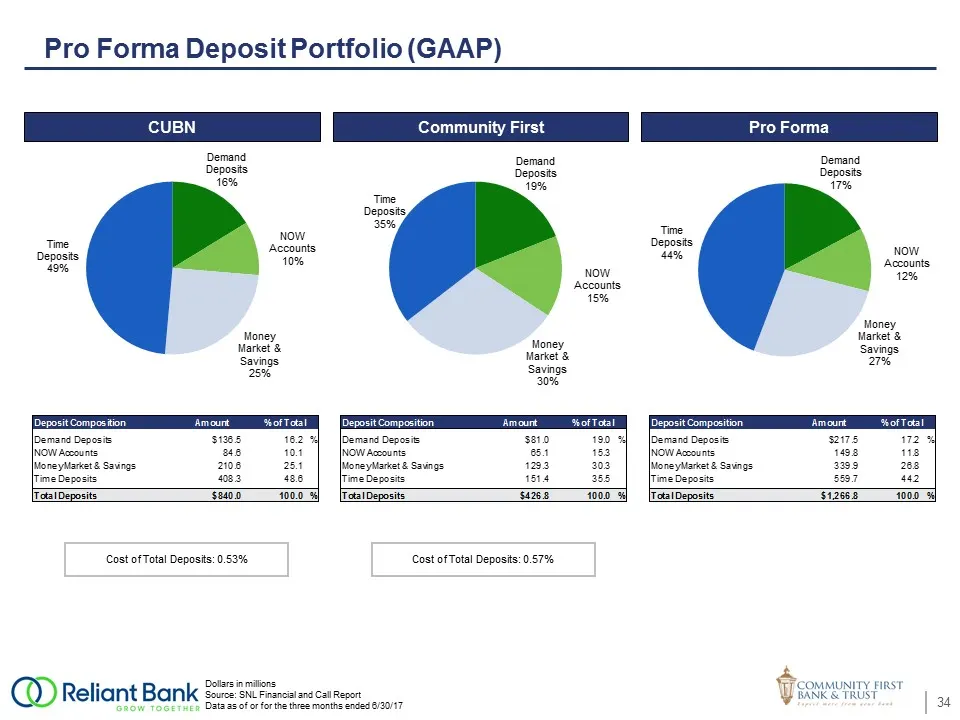
Pro Forma Deposit Portfolio (GAAP) CUBN Dollars in millionsSource: SNL Financial and Call ReportData as of or for the three months ended 6/30/17 Community First Pro Forma Cost of Total Deposits: 0.53% Cost of Total Deposits: 0.57%
Slide 35: Reliant Bank's Mortgage Banking Business
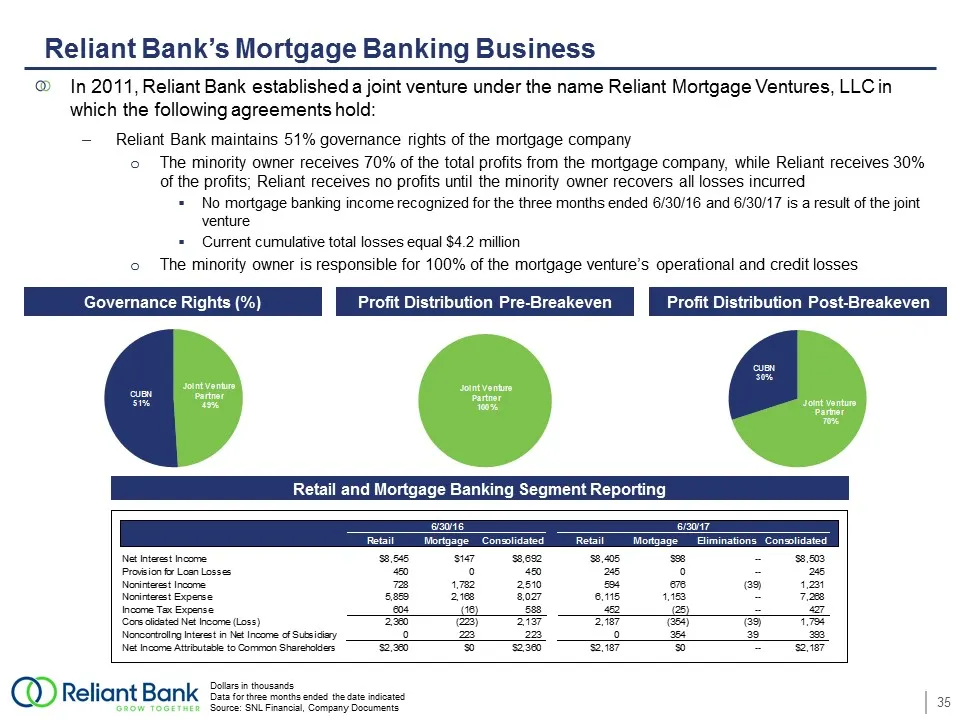
Reliant Bank’s Mortgage Banking Business Dollars in thousandsData for three months ended the date indicatedSource: SNL Financial, Company Documents Retail and Mortgage Banking Segment Reporting Governance Rights (%) Profit Distribution Pre-Breakeven Profit Distribution Post-Breakeven In 2011, Relian
Slide 36: Historical Financials
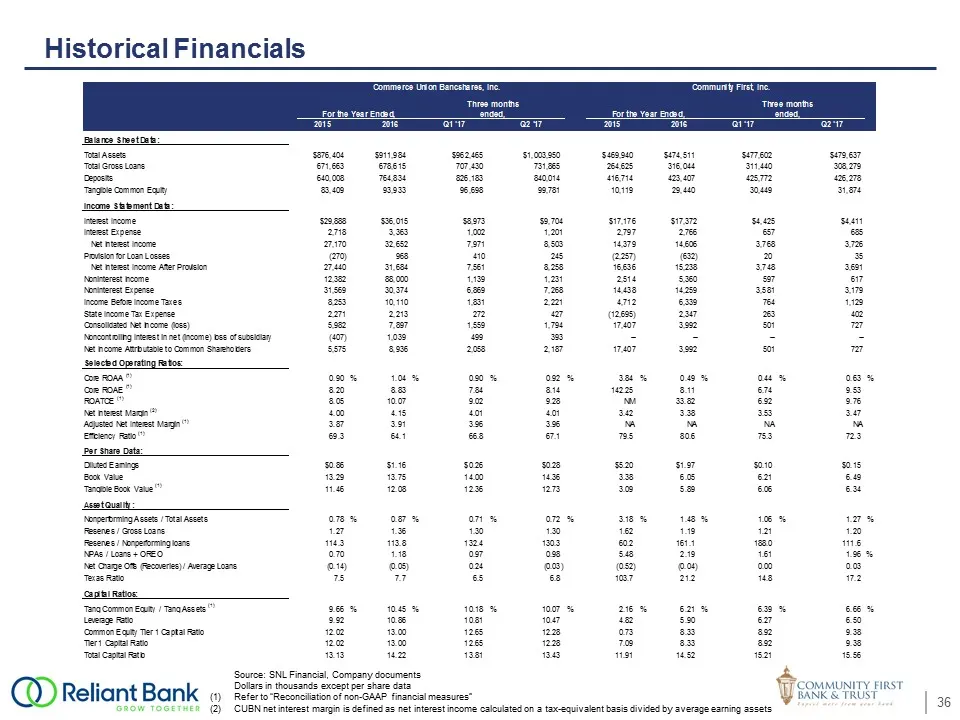
Historical Financials Source: SNL Financial, Company documentsDollars in thousands except per share data Refer to “Reconciliation of non-GAAP financial measures” CUBN net interest margin is defined as net interest income calculated on a tax-equivalent basis divided by average earning assets
Slide 37: Revenue Growth and Profitability
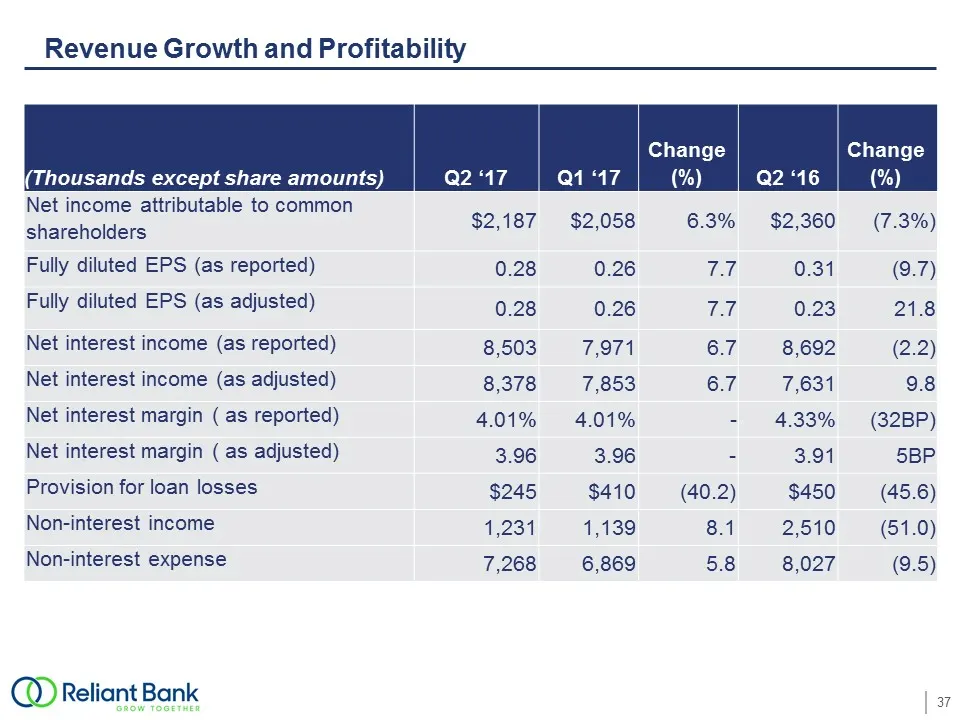
Revenue Growth and Profitability (Thousands except share amounts) Q2 ‘17 Q1 ‘17 Change(%) Q2 ‘16 Change(%) Net income attributable to common shareholders $2,187 $2,058 6.3% $2,360 (7.3%) Fully diluted EPS (as reported) 0.28 0.26 7.7 0.31 (9.7) Fully diluted EPS (as adjusted) 0.28 0.26 7.7 0.23 21.8
Slide 38: Adjusted Net Income Attributable to Common Shareholders
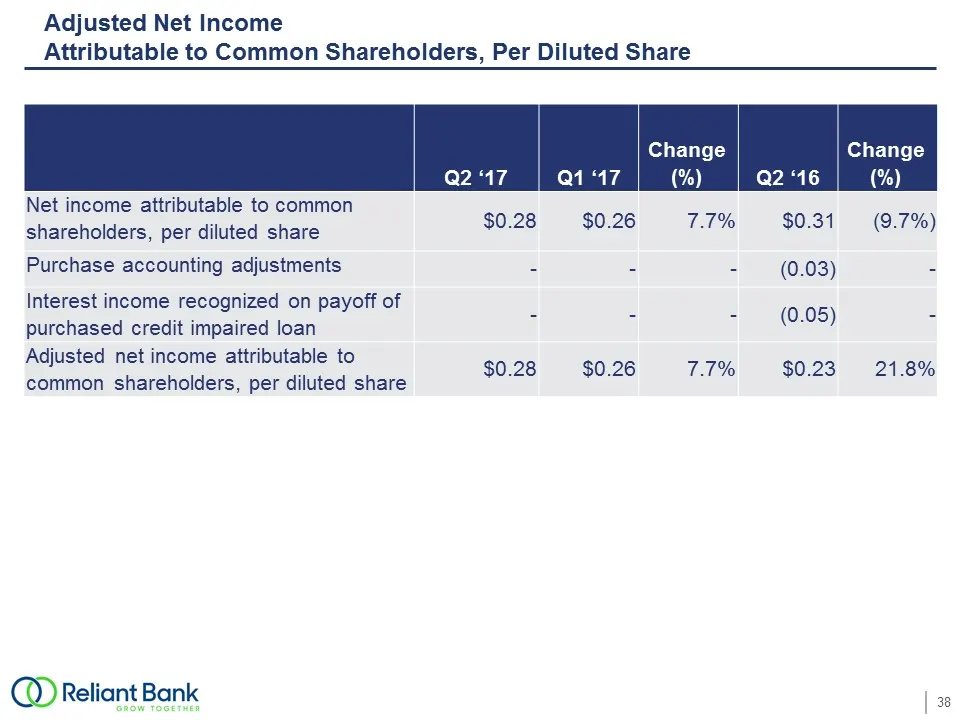
Adjusted Net IncomeAttributable to Common Shareholders, Per Diluted Share Q2 ‘17 Q1 ‘17 Change(%) Q2 ‘16 Change(%) Net income attributable to common shareholders, per diluted share $0.28 $0.26 7.7% $0.31 (9.7%) Purchase accounting adjustments - - - (0.03) - Interest income recognized on payoff of pu
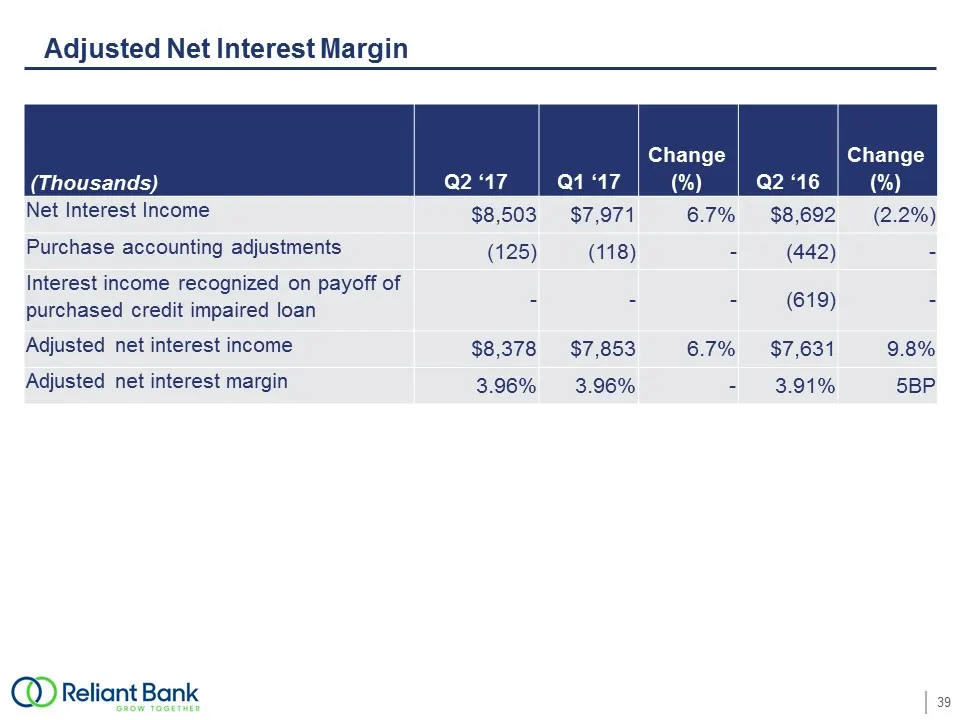
Slide 39: Adjusted Net Interest Margin
(Thousands) Q2 ‘17 Q1 ‘17 Change(%) Q2 ‘16 Change(%) Net Interest Income $8,503 $7,971 6.7% $8,692 (2.2%) Purchase accounting adjustments (125) (118) - (442) - Interest income recognized on payoff of purchased credit impaired loan - - - (619) - Adjusted net interest income $8,378 $7,853 6.7% $7,631
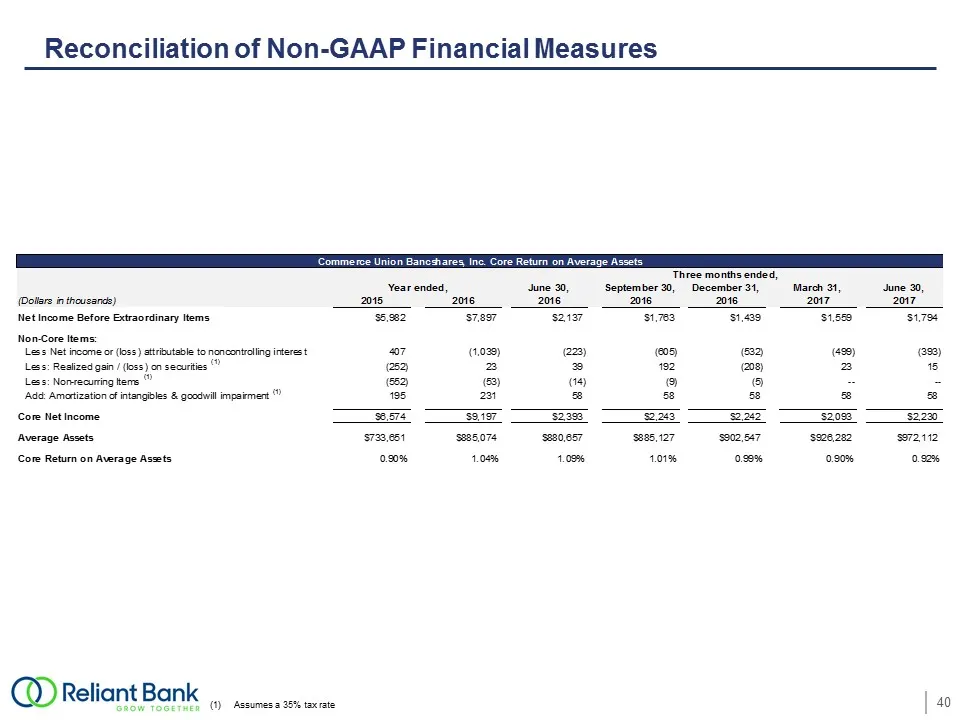
Slide 40: Reconciliation of Non-GAAP Financial Measures
Reconciliation of Non-GAAP Financial Measures Assumes a 35% tax rate
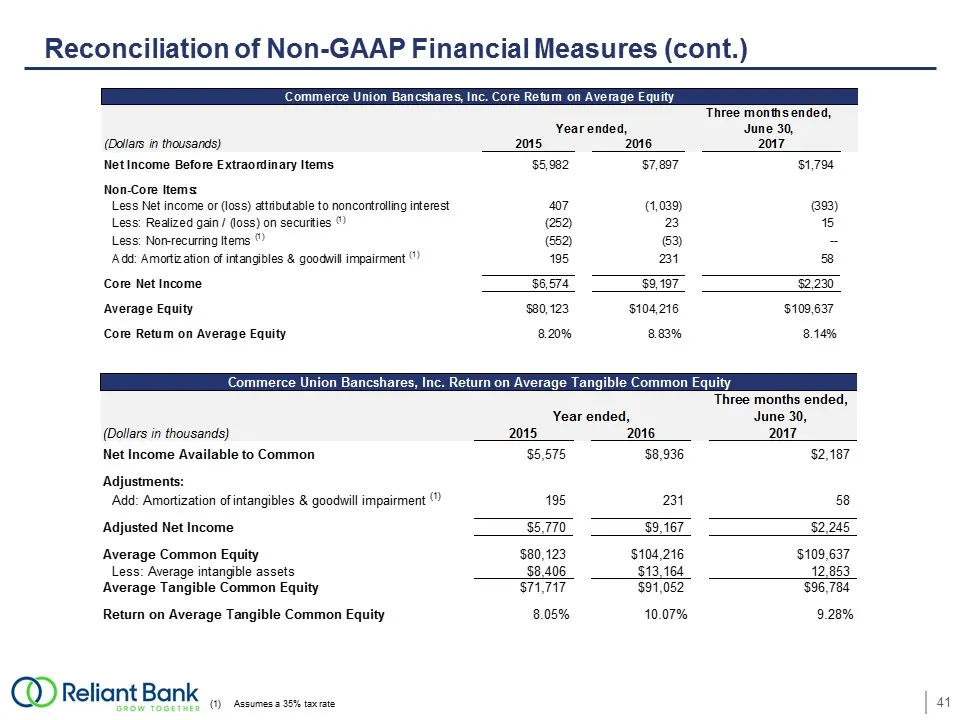
Slide 41: Reconciliation of Non-GAAP Financial Measures (cont.)
Reconciliation of Non-GAAP Financial Measures (cont.) Assumes a 35% tax rate
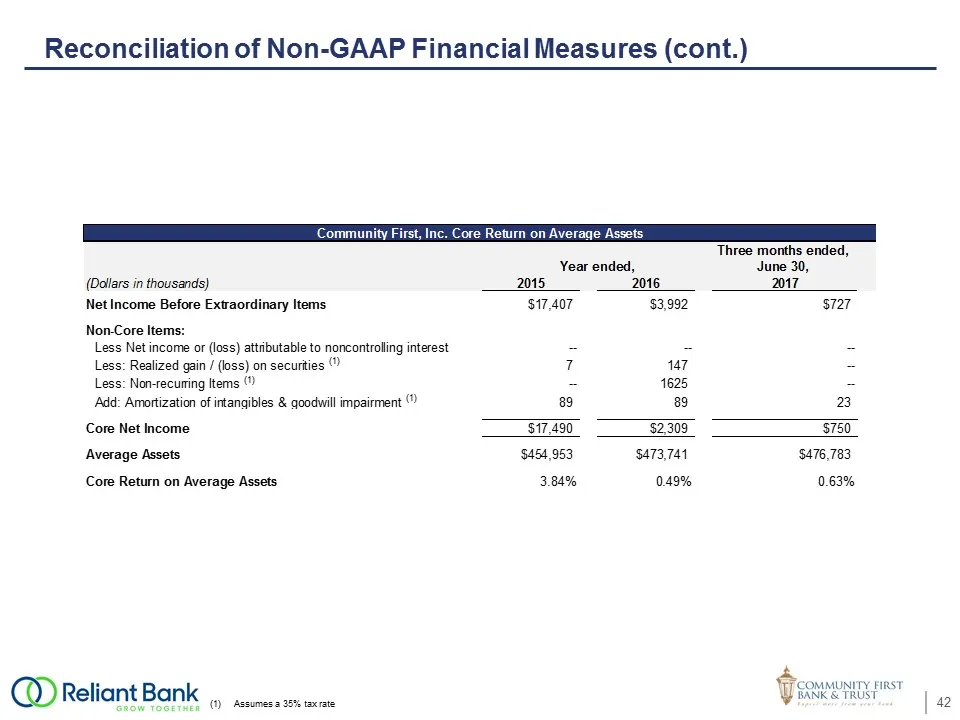
Slide 42: Reconciliation of Non-GAAP Financial Measures (cont.)
Reconciliation of Non-GAAP Financial Measures (cont.) Assumes a 35% tax rate
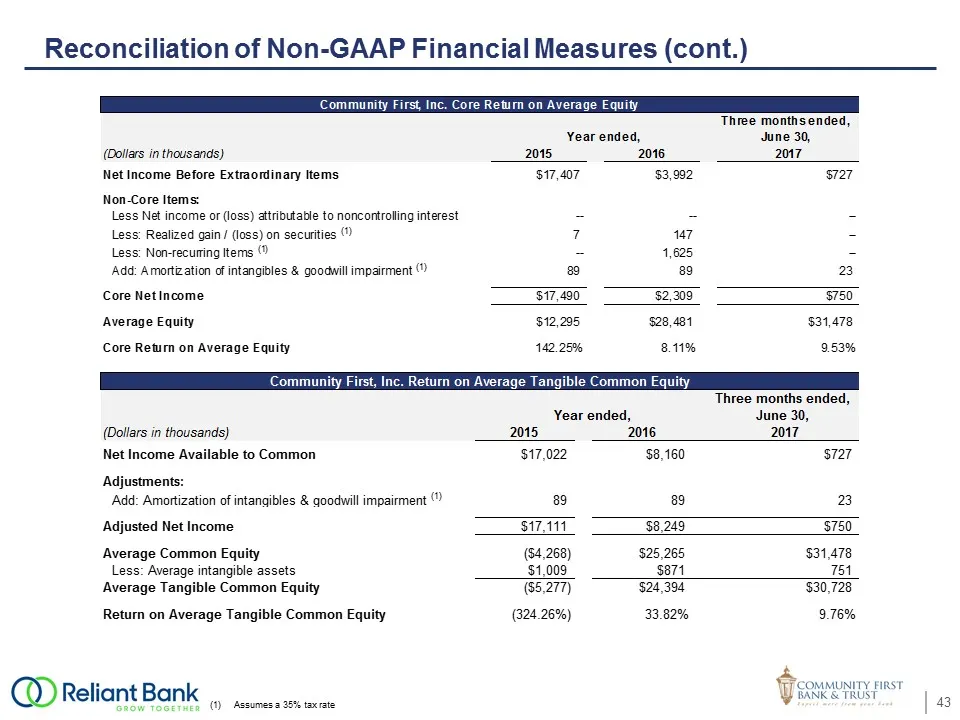
Slide 43: Reconciliation of Non-GAAP Financial Measures (cont.)
Reconciliation of Non-GAAP Financial Measures (cont.) Assumes a 35% tax rate
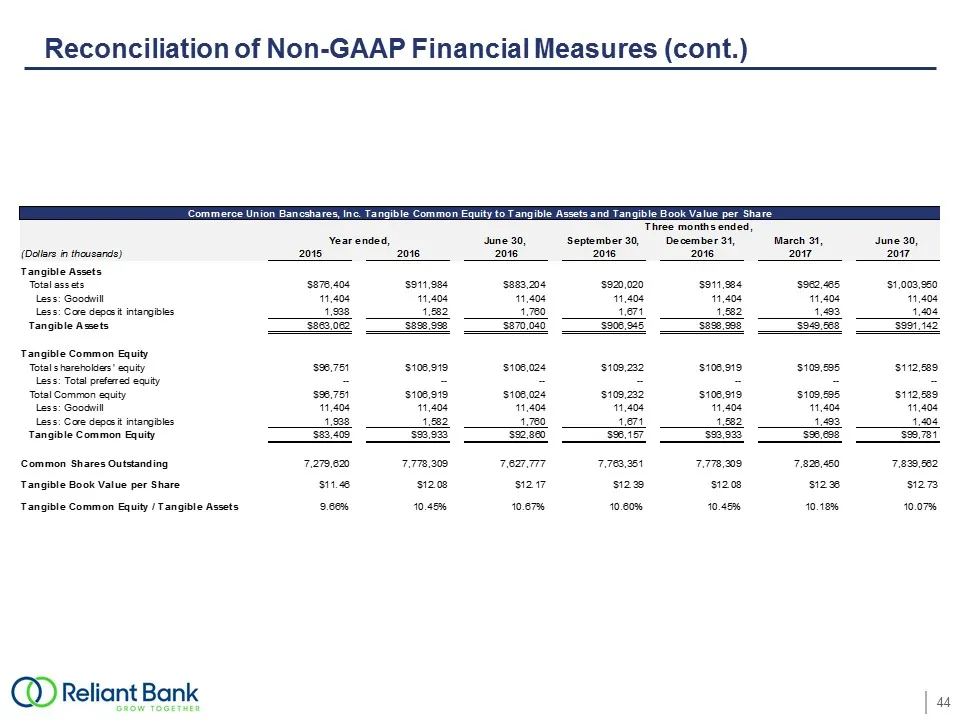
Slide 44: Reconciliation of Non-GAAP Financial Measures (cont.)
Reconciliation of Non-GAAP Financial Measures (cont.)
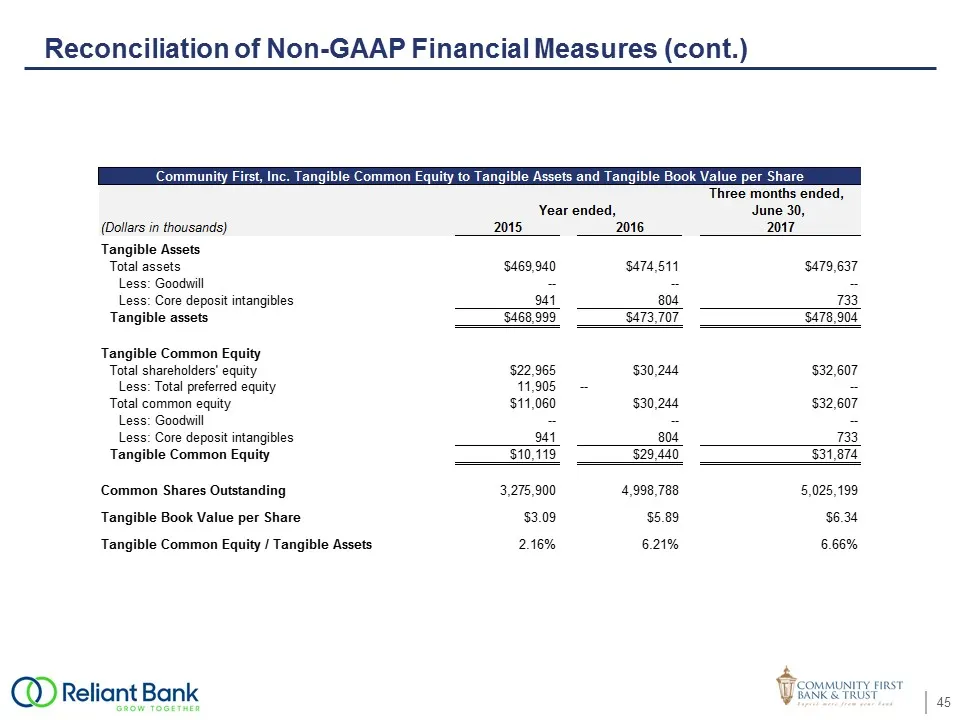
Slide 45: Reconciliation of Non-GAAP Financial Measures (cont.)
Reconciliation of Non-GAAP Financial Measures (cont.)
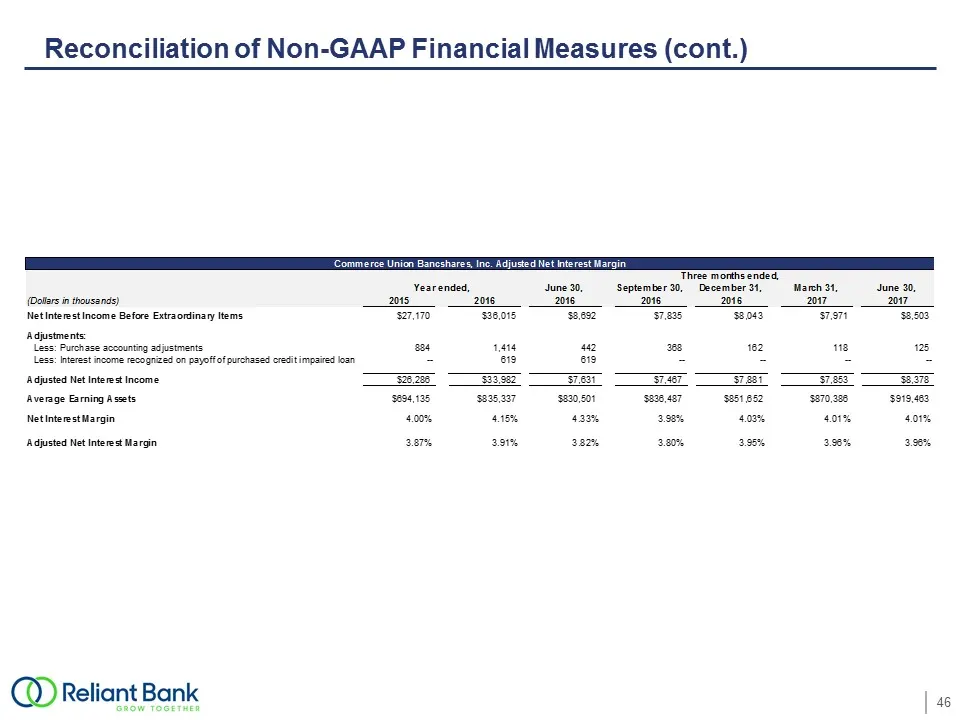
Slide 46: Reconciliation of Non-GAAP Financial Measures (cont.)
Reconciliation of Non-GAAP Financial Measures (cont.)
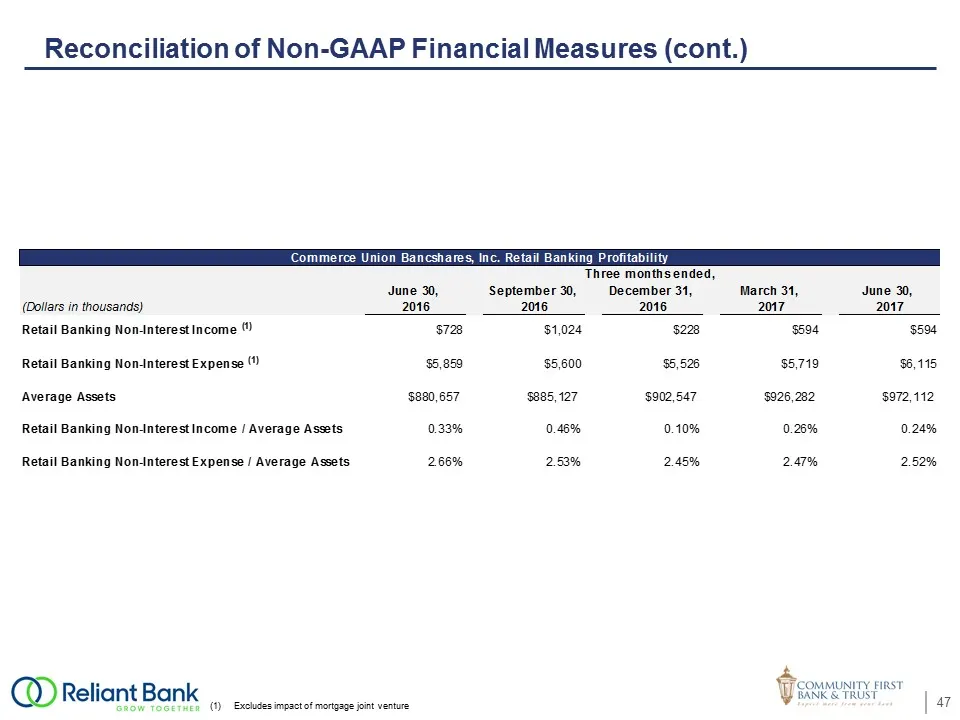
Slide 47: Reconciliation of Non-GAAP Financial Measures (cont.)
Reconciliation of Non-GAAP Financial Measures (cont.) Excludes impact of mortgage joint venture
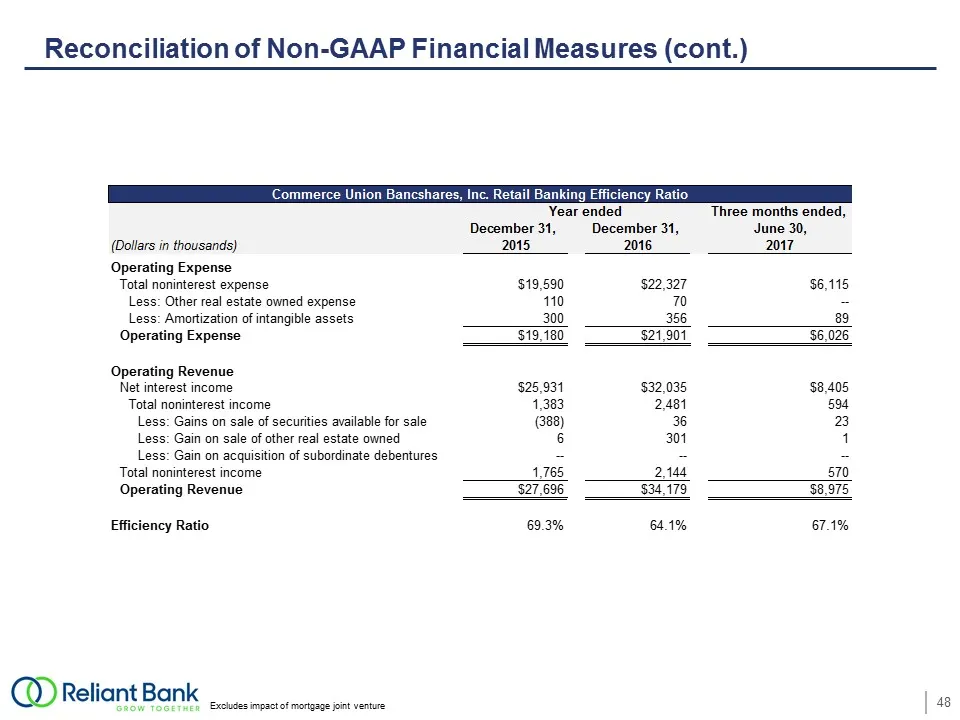
Slide 48: Reconciliation of Non-GAAP Financial Measures (cont.)
Reconciliation of Non-GAAP Financial Measures (cont.) Excludes impact of mortgage joint venture
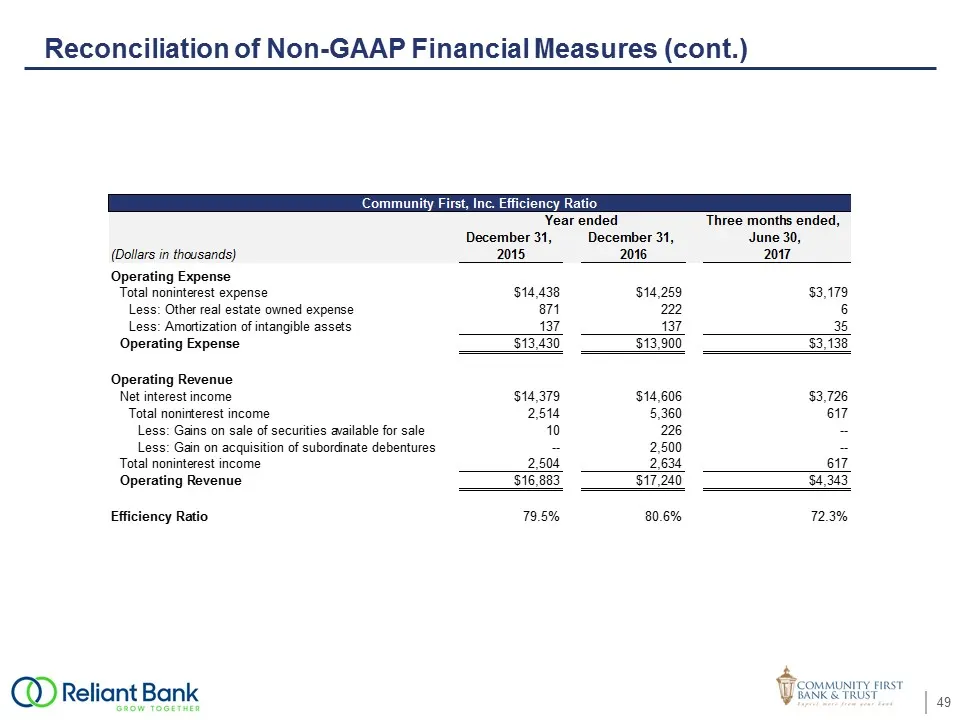
Slide 49: Reconciliation of Non-GAAP Financial Measures (cont.)
Reconciliation of Non-GAAP Financial Measures (cont.)
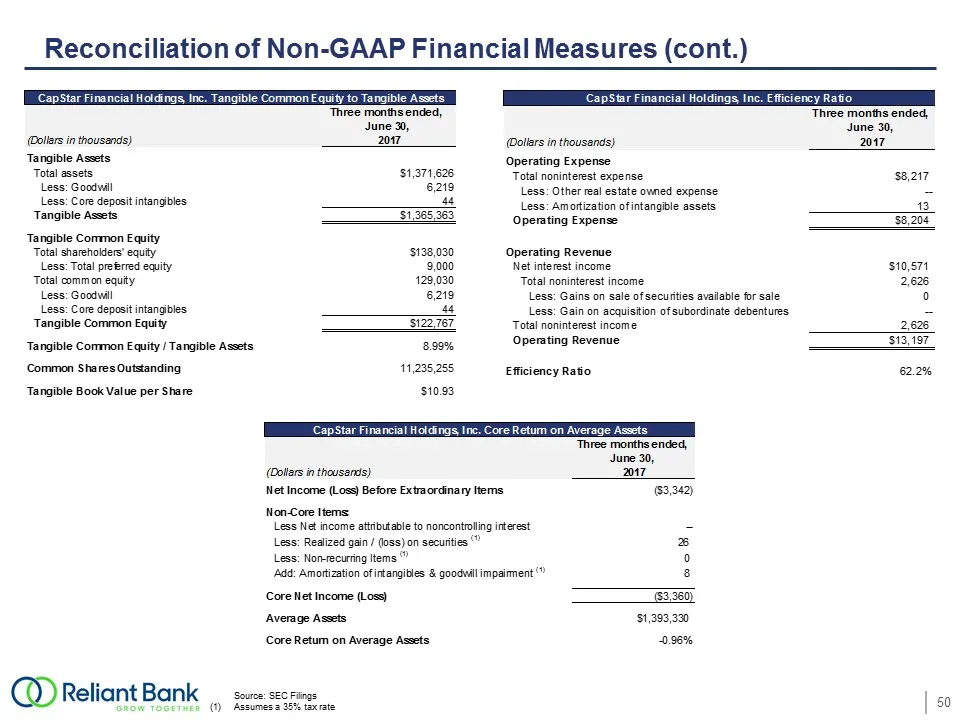
Slide 50: Reconciliation of Non-GAAP Financial Measures (cont.)
Reconciliation of Non-GAAP Financial Measures (cont.) Source: SEC Filings Assumes a 35% tax rate
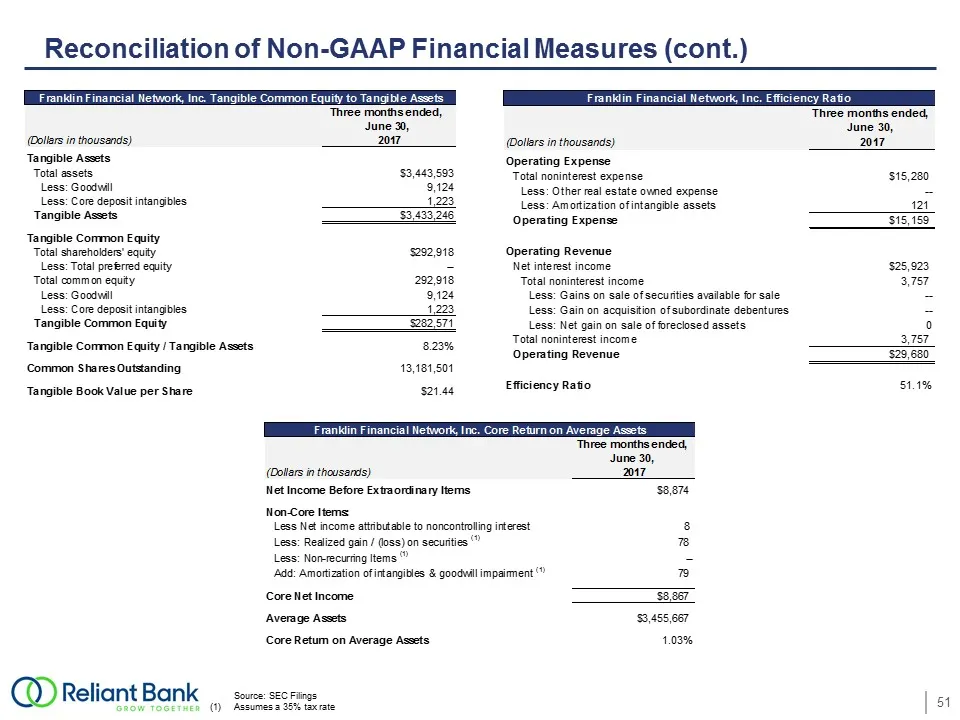
Slide 51: Reconciliation of Non-GAAP Financial Measures (cont.)
Reconciliation of Non-GAAP Financial Measures (cont.) Source: SEC FilingsAssumes a 35% tax rate
Source: SEC EDGAR · 8-K filed Sep 7, 2017
More decks from Reliant Bancorp Inc
 Q3 2021 Earnings Presentation29 slides · Oct 21, 2021
 Q2 2021 Earnings Presentation28 slides · Jul 21, 2021
 Merger or Acquisition (July 2021)13 slides · Jul 15, 2021
 Gulf South Bank Conference 202128 slides · Apr 30, 2021
 Q1 2021 Earnings Presentation18 slides · Apr 22, 2021
 Raymond James Virtual Investor Meetings 202130 slides · Mar 10, 2021