Atlantic Capital Bancshares Inc
Atlantic Capital Bancshares — Investor Presentation (May 2019)
13 slides from Atlantic Capital Bancshares's investor presentation, May 16, 2019

Slide 1: Atlantic Capital
v Atlantic Capital
Slide 2: Forward-Looking Statements
Forward-Looking Statements This presentation contains forward-looking statements within the meaning of section 27A of the Securities Act of 1933, as amended, and section 21E of the Securities Exchange Act of 1934, as amended. These forward-looking statements reflect our current views with respect to
Slide 3: Non-GAAP Financial Information
Non-GAAP Financial Information Statements included in this annual report include non-GAAP financial measures and should be read along with the accompanying tables, which provide a reconciliation of non-GAAP financial measures to GAAP financial measures. Atlantic Capital management uses non-GAAP fina
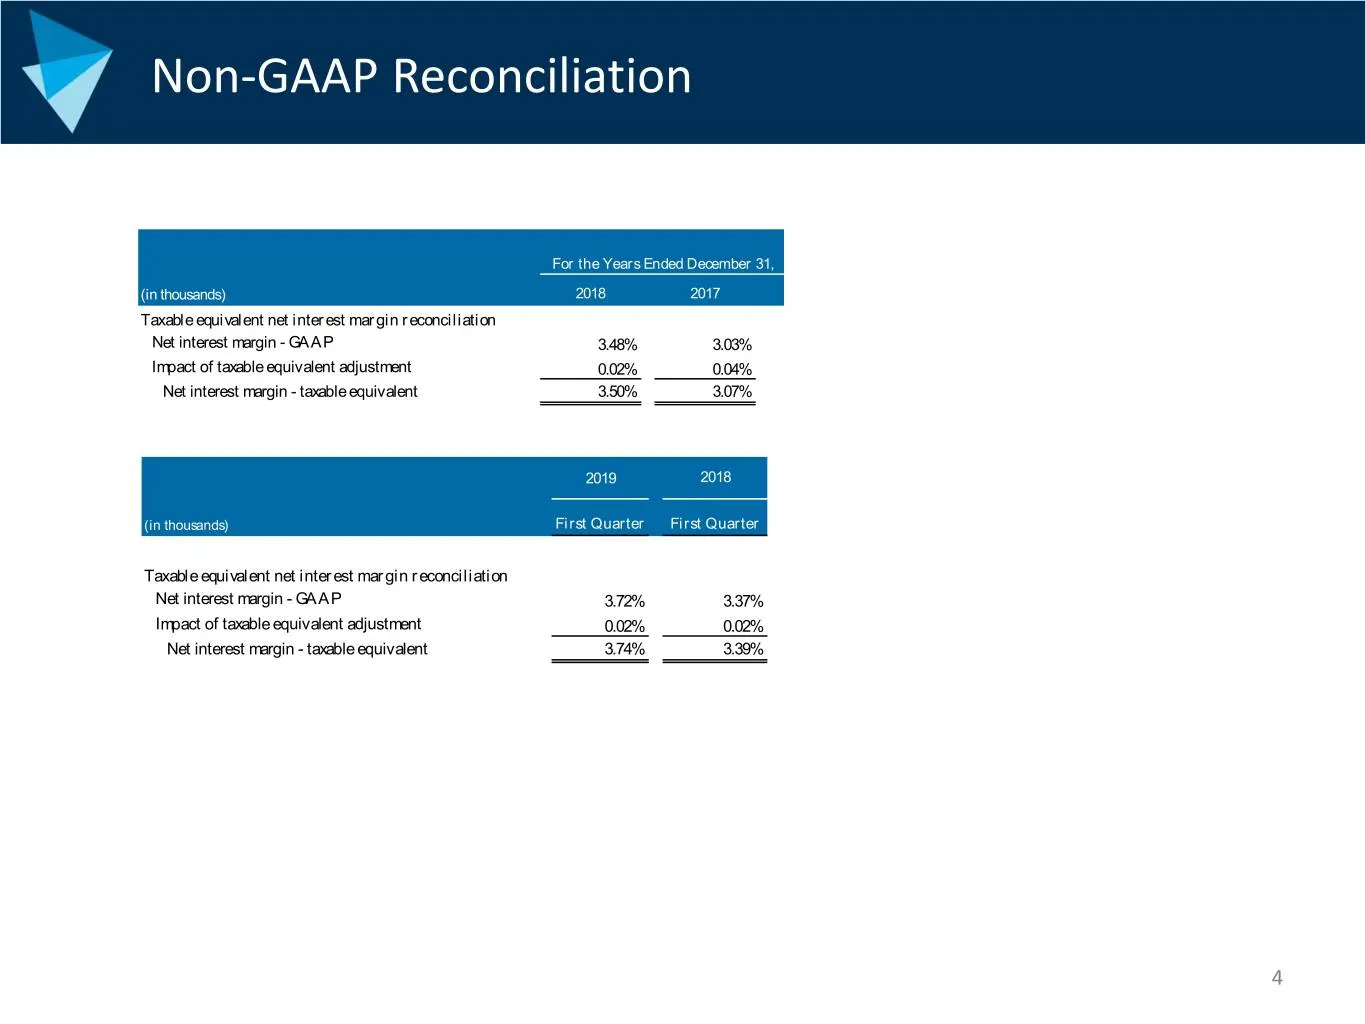
Slide 4: Non-GAAP Reconciliation
Non-GAAP Reconciliation For the Years Ended December 31, (in thousands) 2018 2017 Taxable equivalent net interest margin reconciliation Net interest margin - GAAP 3.48% 3.03% Impact of taxable equivalent adjustment 0.02% 0.04% Net interest margin - taxable equivalent 3.50% 3.07% 2019 2018 (in thousa

Slide 5: Atlantic Capital
v Atlantic Capital
Slide 6: We Fuel Prosperity
We Fuel Prosperity WE ARE A team of talented, experienced and entrepreneurial bankers WE SERVE Clients who value high-touch relationships and deep expertise WE WIN With creativity, expertise, teamwork, humility, and confidence 6
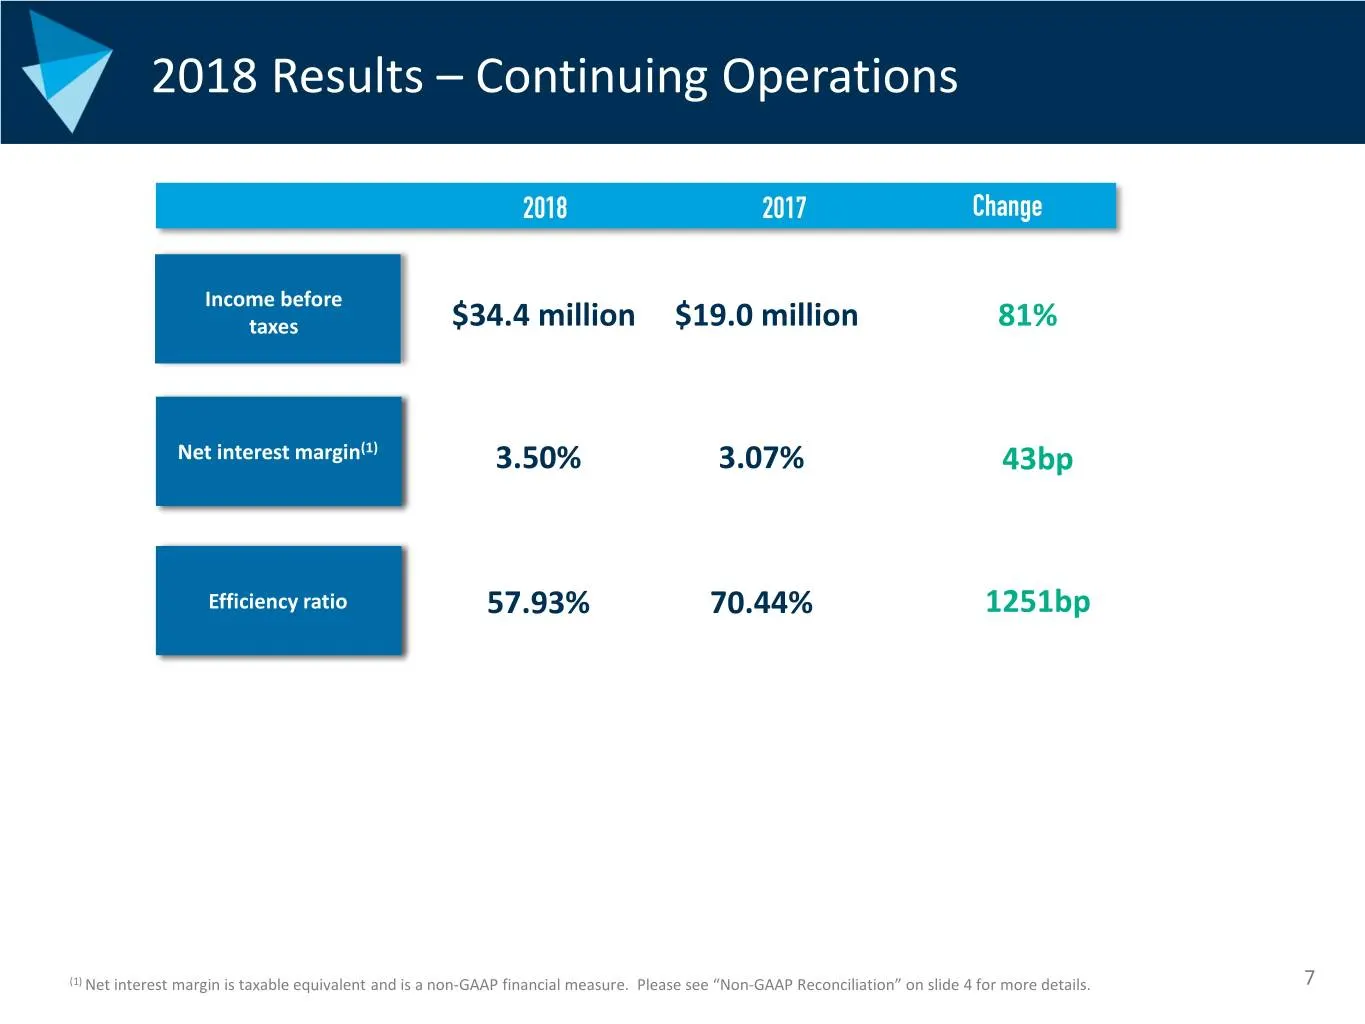
Slide 7: 2018 Results – Continuing Operations
2018 Results – Continuing Operations 2018 2017 Change Income before taxes $34.4 million $19.0 million 81% Net interest margin(1) 3.50% 3.07% 43bp Efficiency ratio 57.93% 70.44% 1251bp (1) Net interest margin is taxable equivalent and is a non-GAAP financial measure. Please see “Non-GAAP Reconciliati
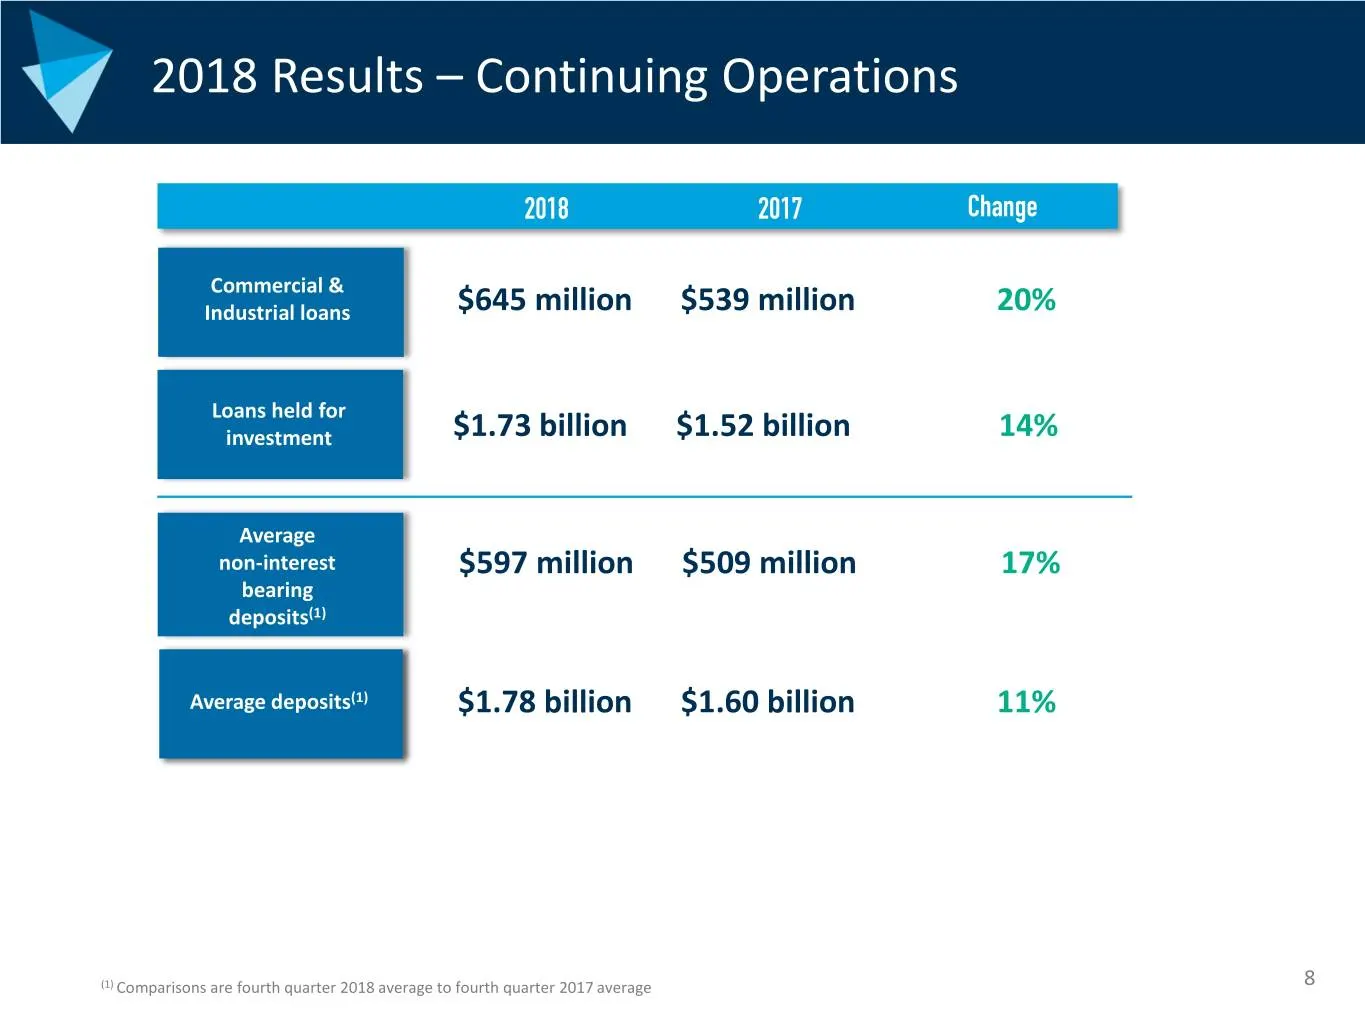
Slide 8: 2018 Results – Continuing Operations
2018 Results – Continuing Operations 2018 2017 Change Commercial & Industrial loans $645 million $539 million 20% Loans held for investment $1.73 billion $1.52 billion 14% Average non-interest $597 million $509 million 17% bearing deposits(1) Average deposits(1) $1.78 billion $1.60 billion 11% (1) C
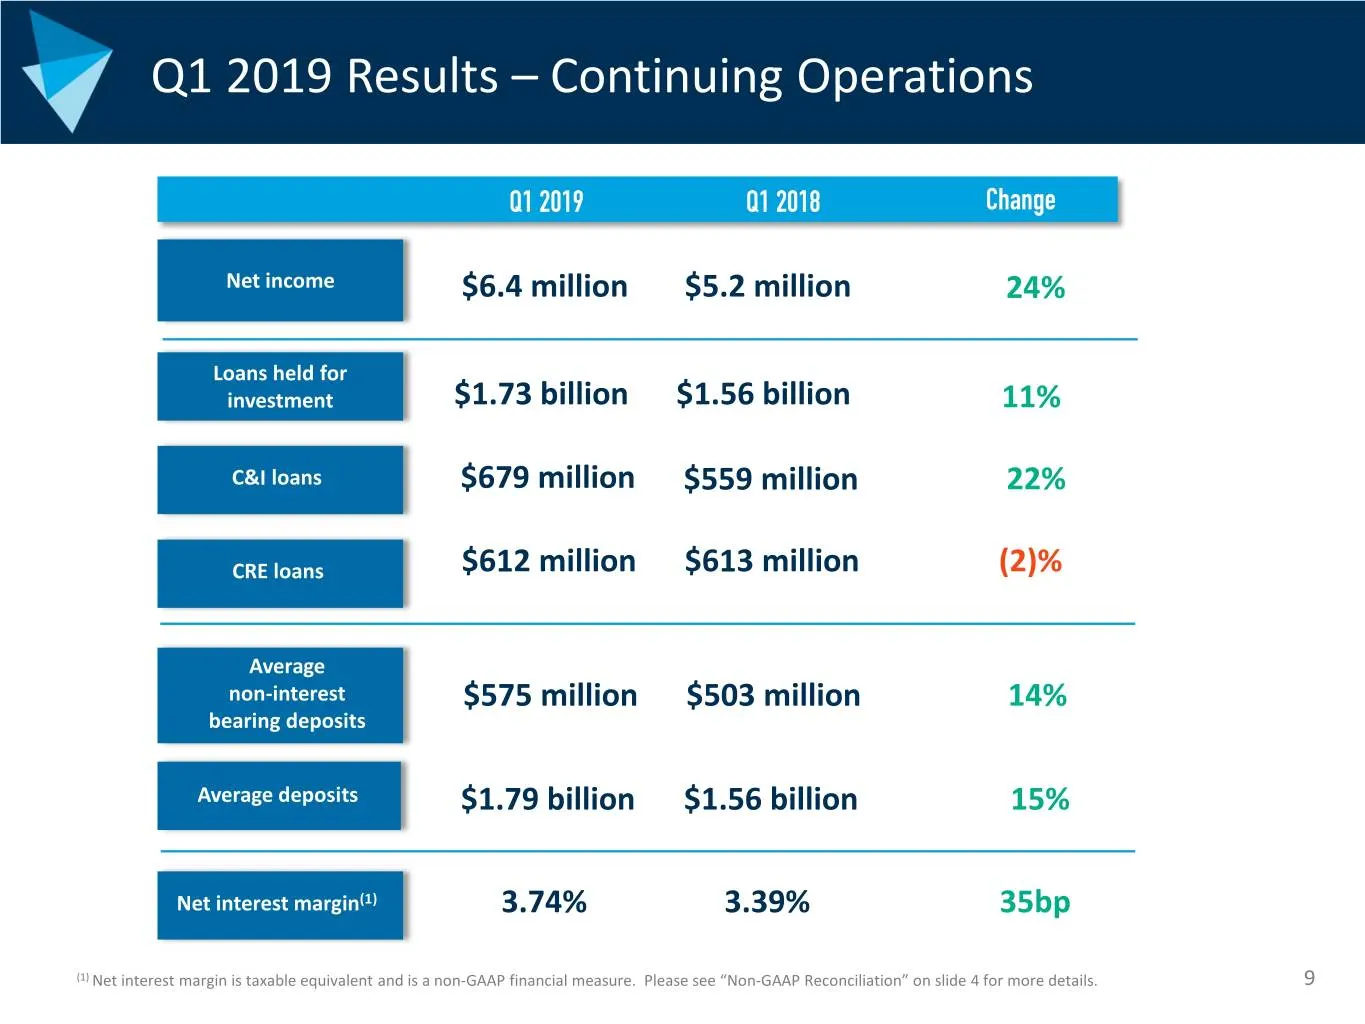
Slide 9: Q1 2019 Results – Continuing Operations
Q1 2019 Results – Continuing Operations Q1 2019 Q1 2018 Change Net income $6.4 million $5.2 million 24% Loans held for investment $1.73 billion $1.56 billion 11% C&I loans $679 million $559 million 22% CRE loans $612 million $613 million (2)% Average non-interest $575 million $503 million 14% bearin
Slide 10: Atlantic Capital
v Atlantic Capital 10
Slide 11: We Serve Growth Markets
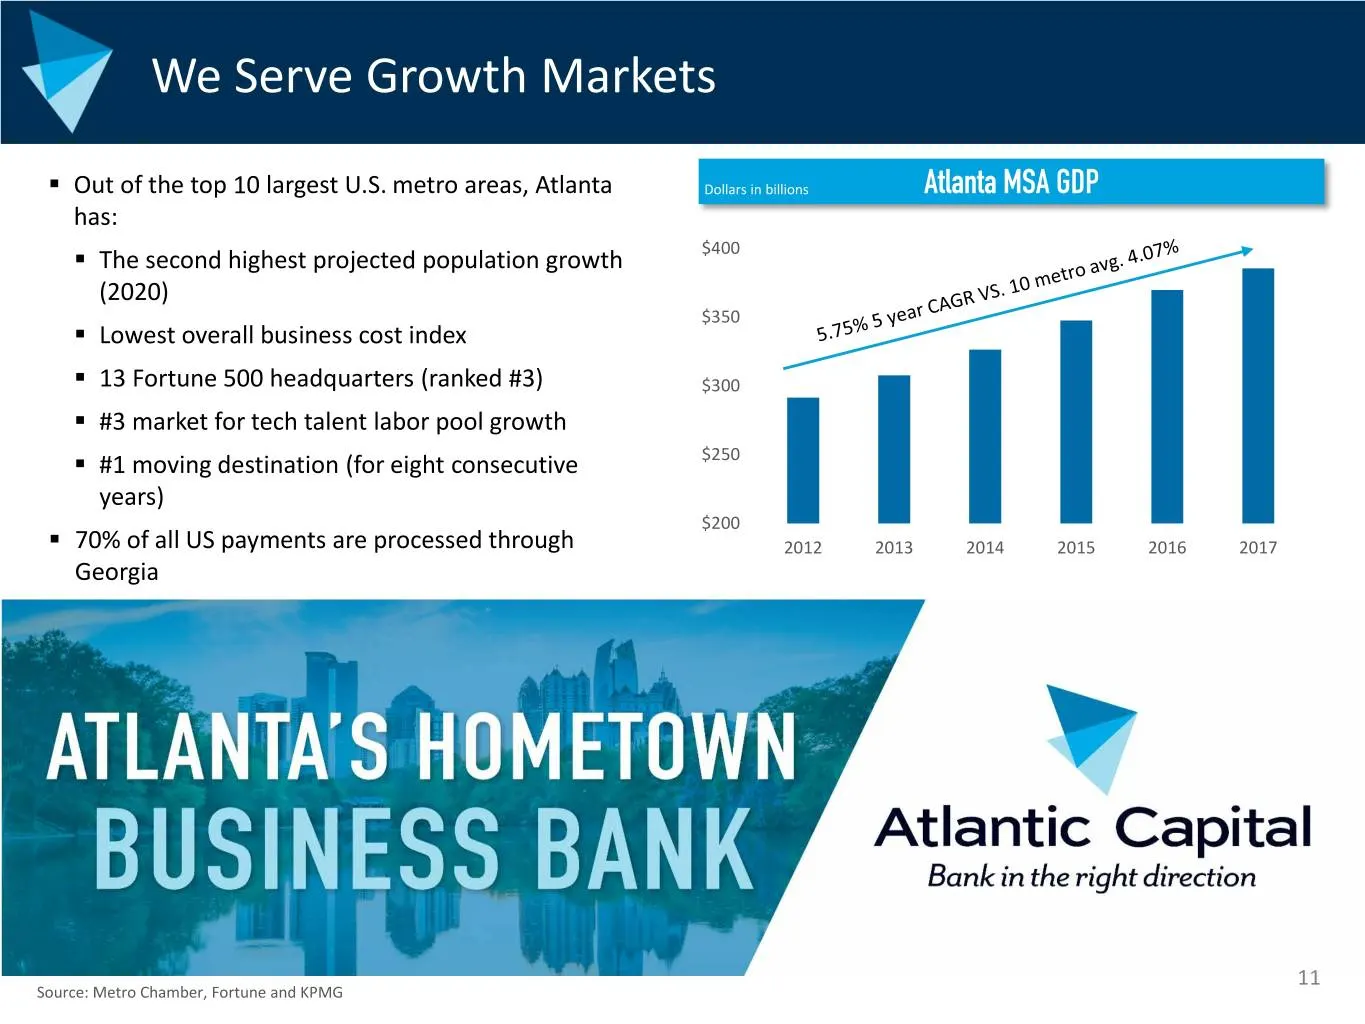
We Serve Growth Markets . Out of the top 10 largest U.S. metro areas, Atlanta Dollars in billions Atlanta MSA GDP has: . The second highest projected population growth $400 (2020) $350 . Lowest overall business cost index . 13 Fortune 500 headquarters (ranked #3) $300 . #3 market for tech talent lab
Slide 12: Growing Specialty Businesses
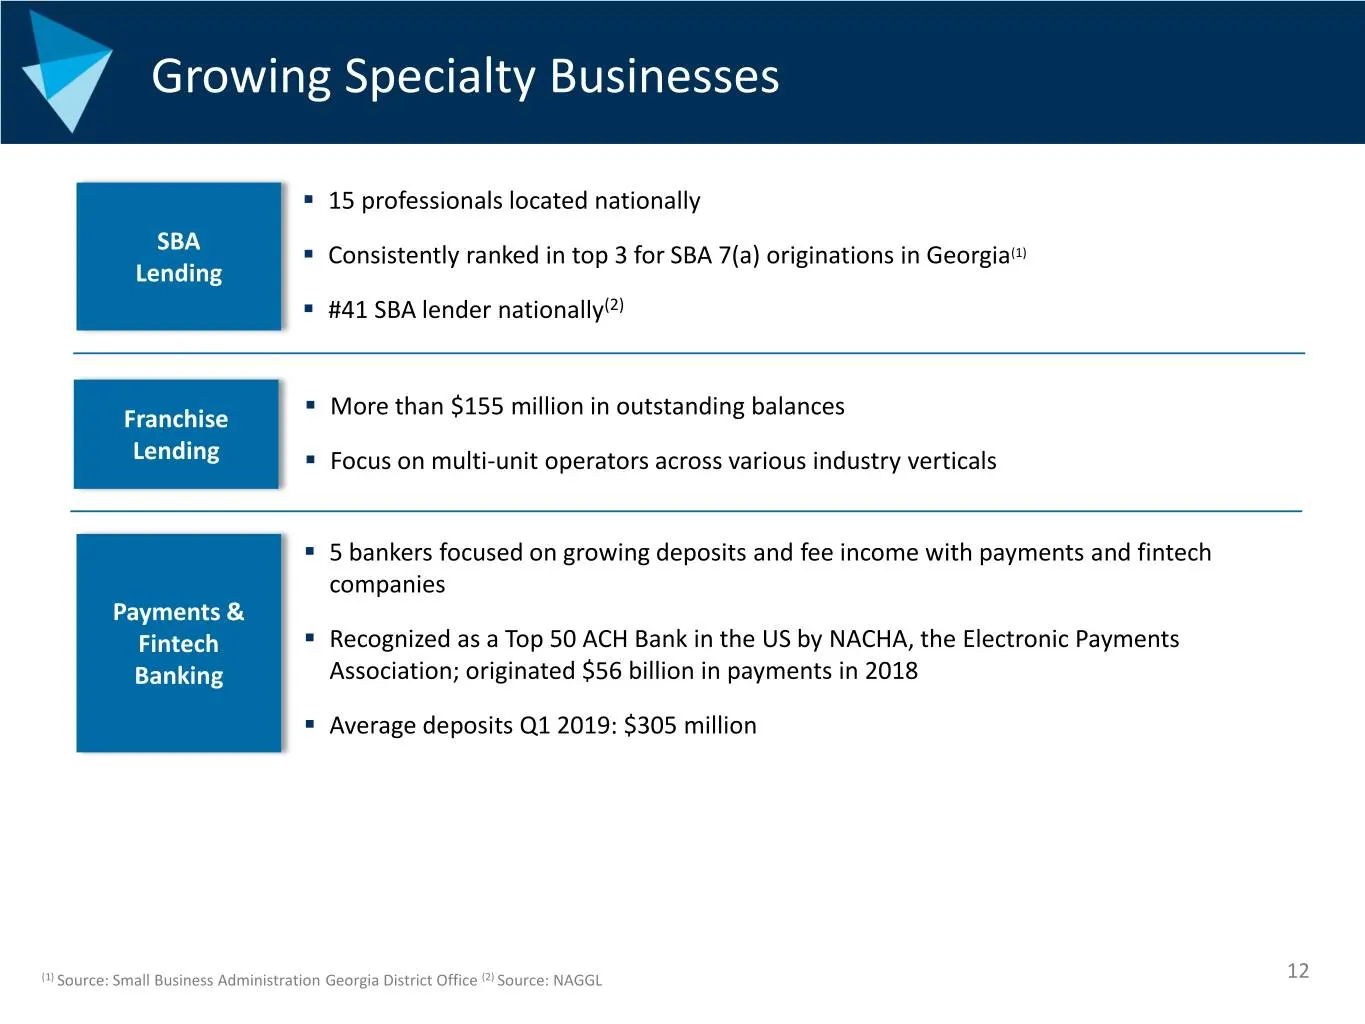
Growing Specialty Businesses . 15 professionals located nationally SBA . Consistently ranked in top 3 for SBA 7(a) originations in Georgia(1) Lending . #41 SBA lender nationally(2) . Franchise More than $155 million in outstanding balances Lending . Focus on multi-unit operators across various indus
Slide 13: Atlantic Capital
v Atlantic Capital is
Source: SEC EDGAR · 8-K filed May 16, 2019
More decks from Atlantic Capital Bancshares Inc
 Q4 2021 Earnings Presentation27 slides · Jan 24, 2022
 Q3 2021 Earnings Presentation30 slides · Oct 27, 2021
 Q3 2021 Earnings Presentation40 slides · Oct 27, 2021
 Q2 2021 Earnings Presentation33 slides · Jul 23, 2021
 Merger or Acquisition (July 2021)16 slides · Jul 23, 2021
 Q2 2021 Earnings Presentation39 slides · Jul 23, 2021