Endesa S.A. · BME:ELE
Endesa — H1 2003 Earnings Presentation
37 slides from Endesa's earnings presentation, Jul 30, 2003
Slide 1: 2003 First Half Results
2003 First Half Results July 30th, 2003 1
Slide 2: 1H 2003 Results: Delivering 2002-2006 Strategic Plan
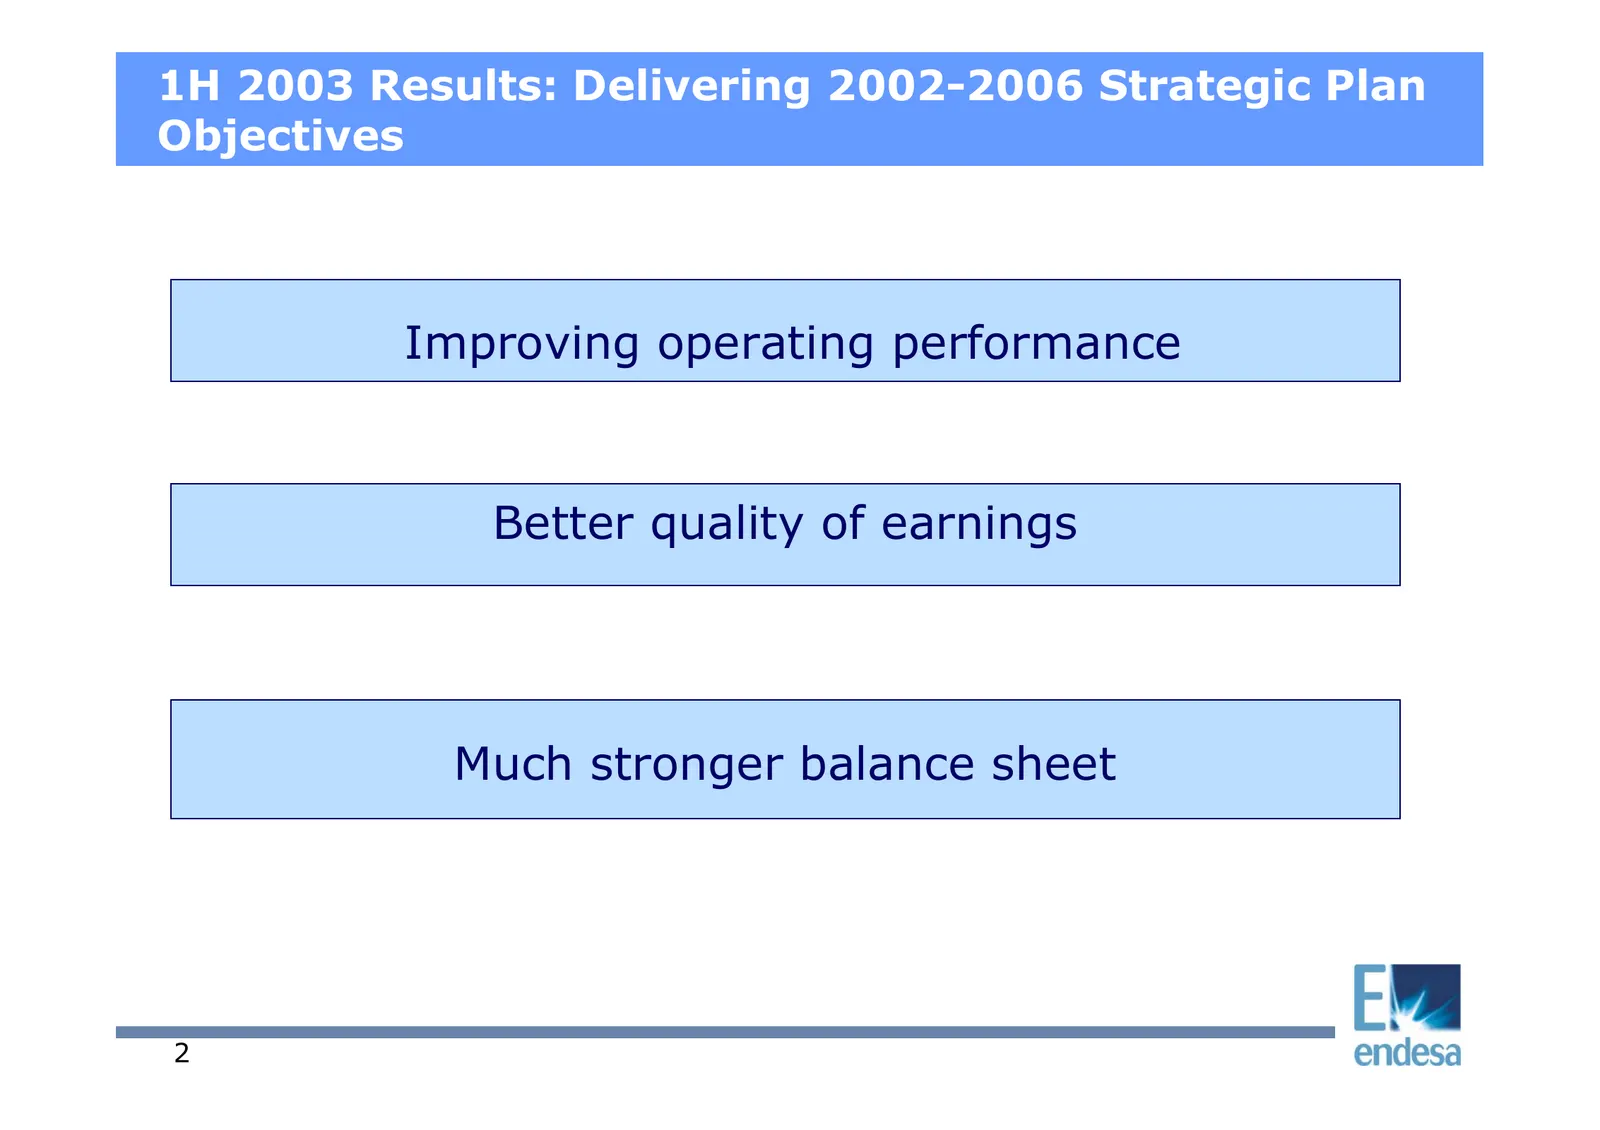
1H 2003 Results: Delivering 2002-2006 Strategic Plan Objectives Improving operating performance Better quality of earnings Much stronger balance sheet 2
Slide 3: 1H 2003 EBIT: Positive Consolidated Operating Performance
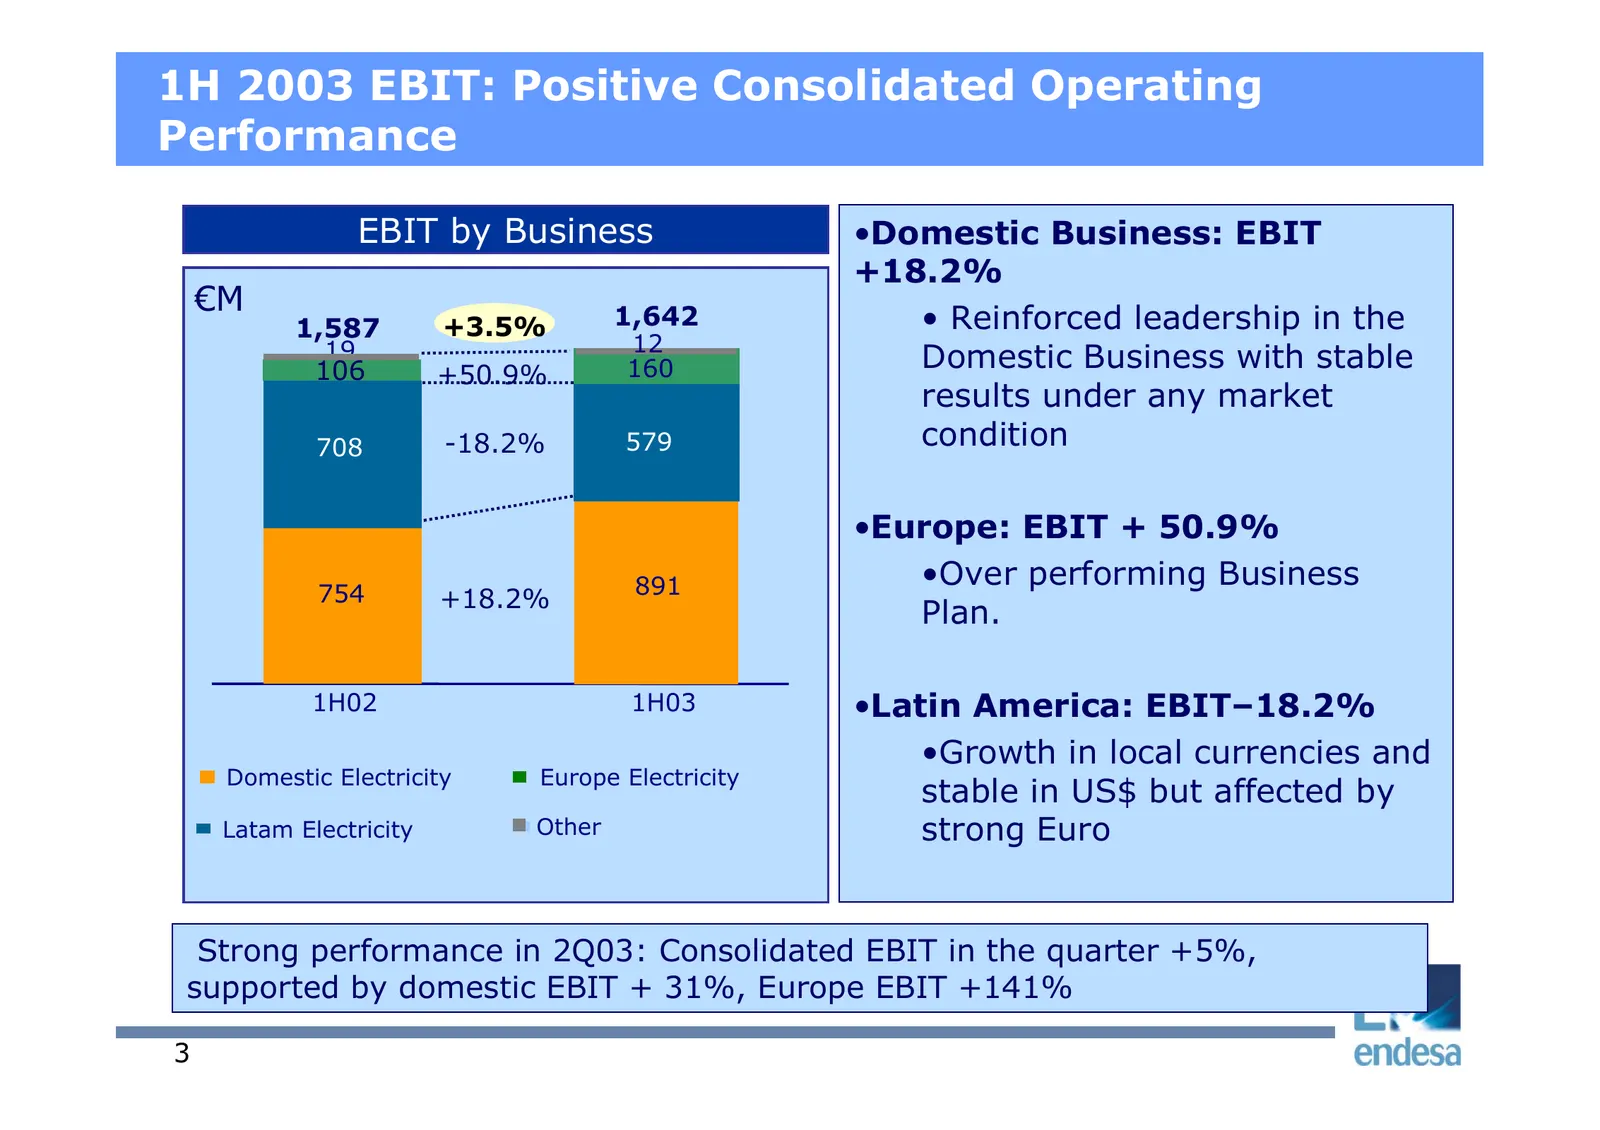
1H 2003 EBIT: Positive Consolidated Operating Performance EBIT by Business •Domestic Business: EBIT +18.2% €M 1,587 +3.5% 1,642 • Reinforced leadership in the 19 12 106 106 +50.9% 160 Domestic Business with stable results under any market 708 -18.2% 579 condition •Europe: EBIT + 50.9% 891 •Over perf
Slide 4: 1H 2003: Solid Results and Strategic Focus - Better quality of earnings
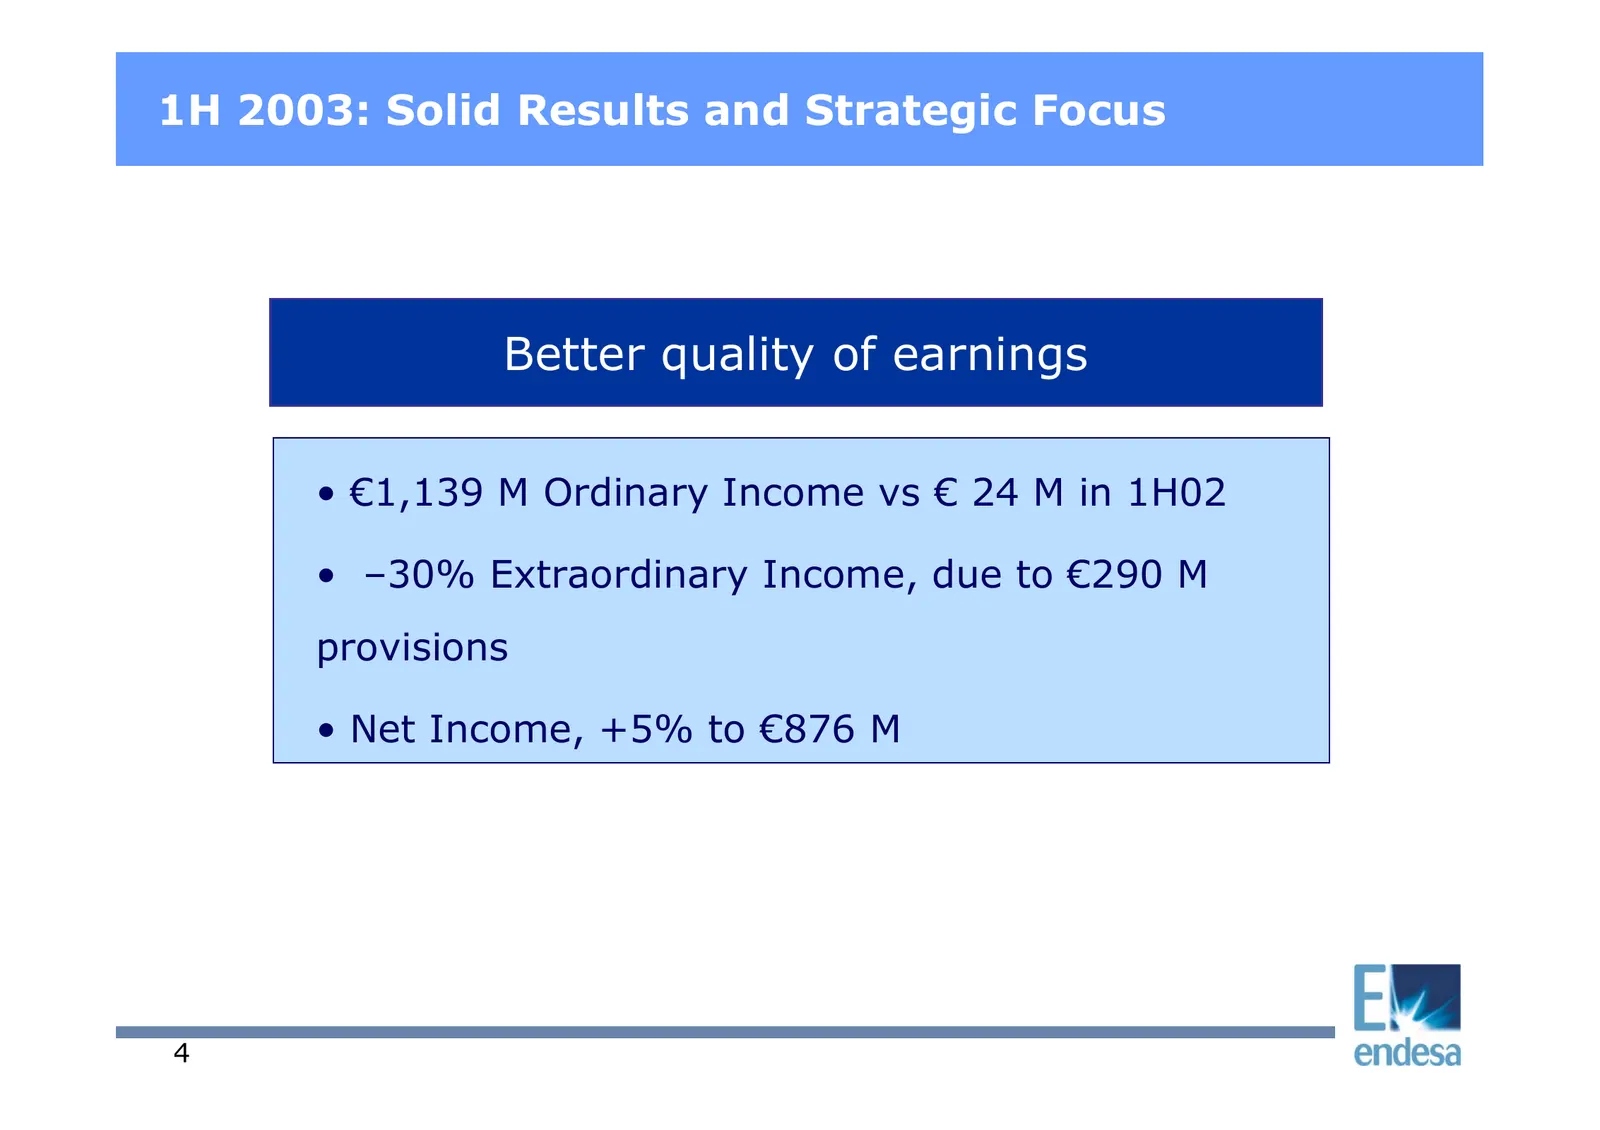
1H 2003: Solid Results and Strategic Focus Better quality of earnings • €1,139 M Ordinary Income vs € 24 M in 1H02 • –30% Extraordinary Income, due to €290 M provisions • Net Income, +5% to €876 M 4
Slide 5: 1H 2003: Solid Results and Strategic Focus - Much stronger balance sheet
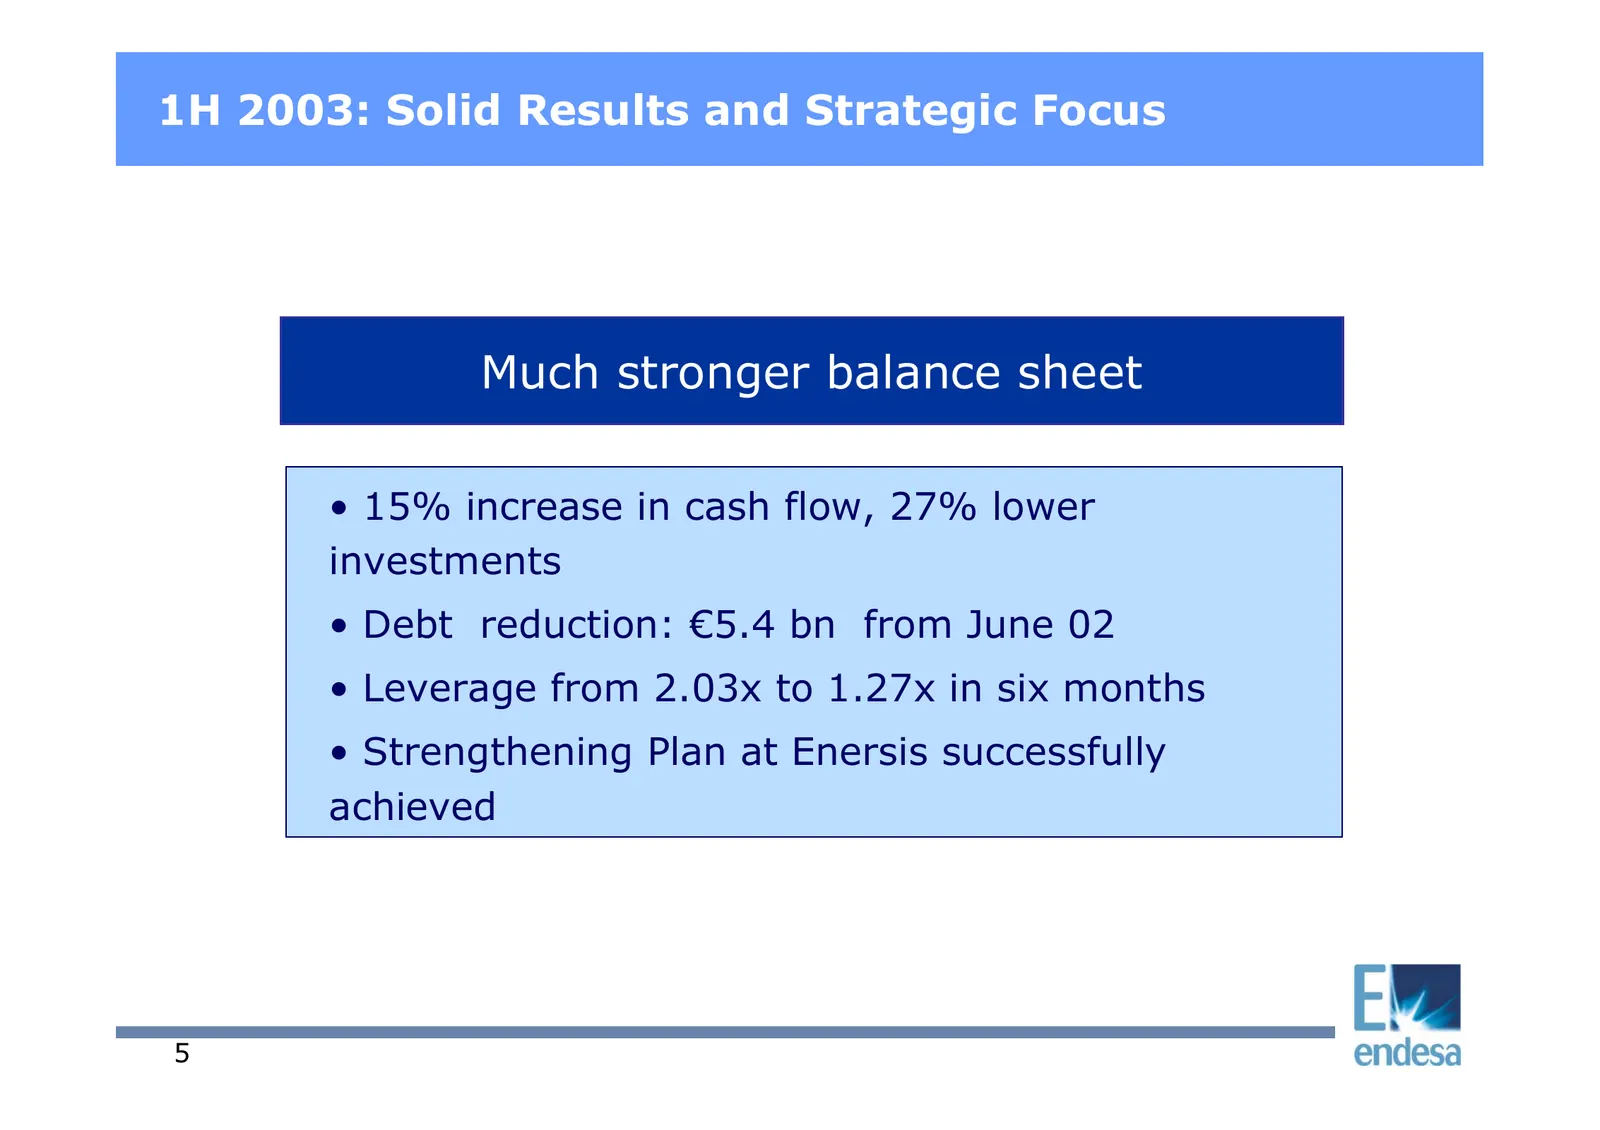
1H 2003: Solid Results and Strategic Focus Much stronger balance sheet • 15% increase in cash flow, 27% lower investments • Debt reduction: €5.4 bn from June 02 • Leverage from 2.03x to 1.27x in six months • Strengthening Plan at Enersis successfully achieved 5
Slide 6: Domestic EBIT: Strong Performance
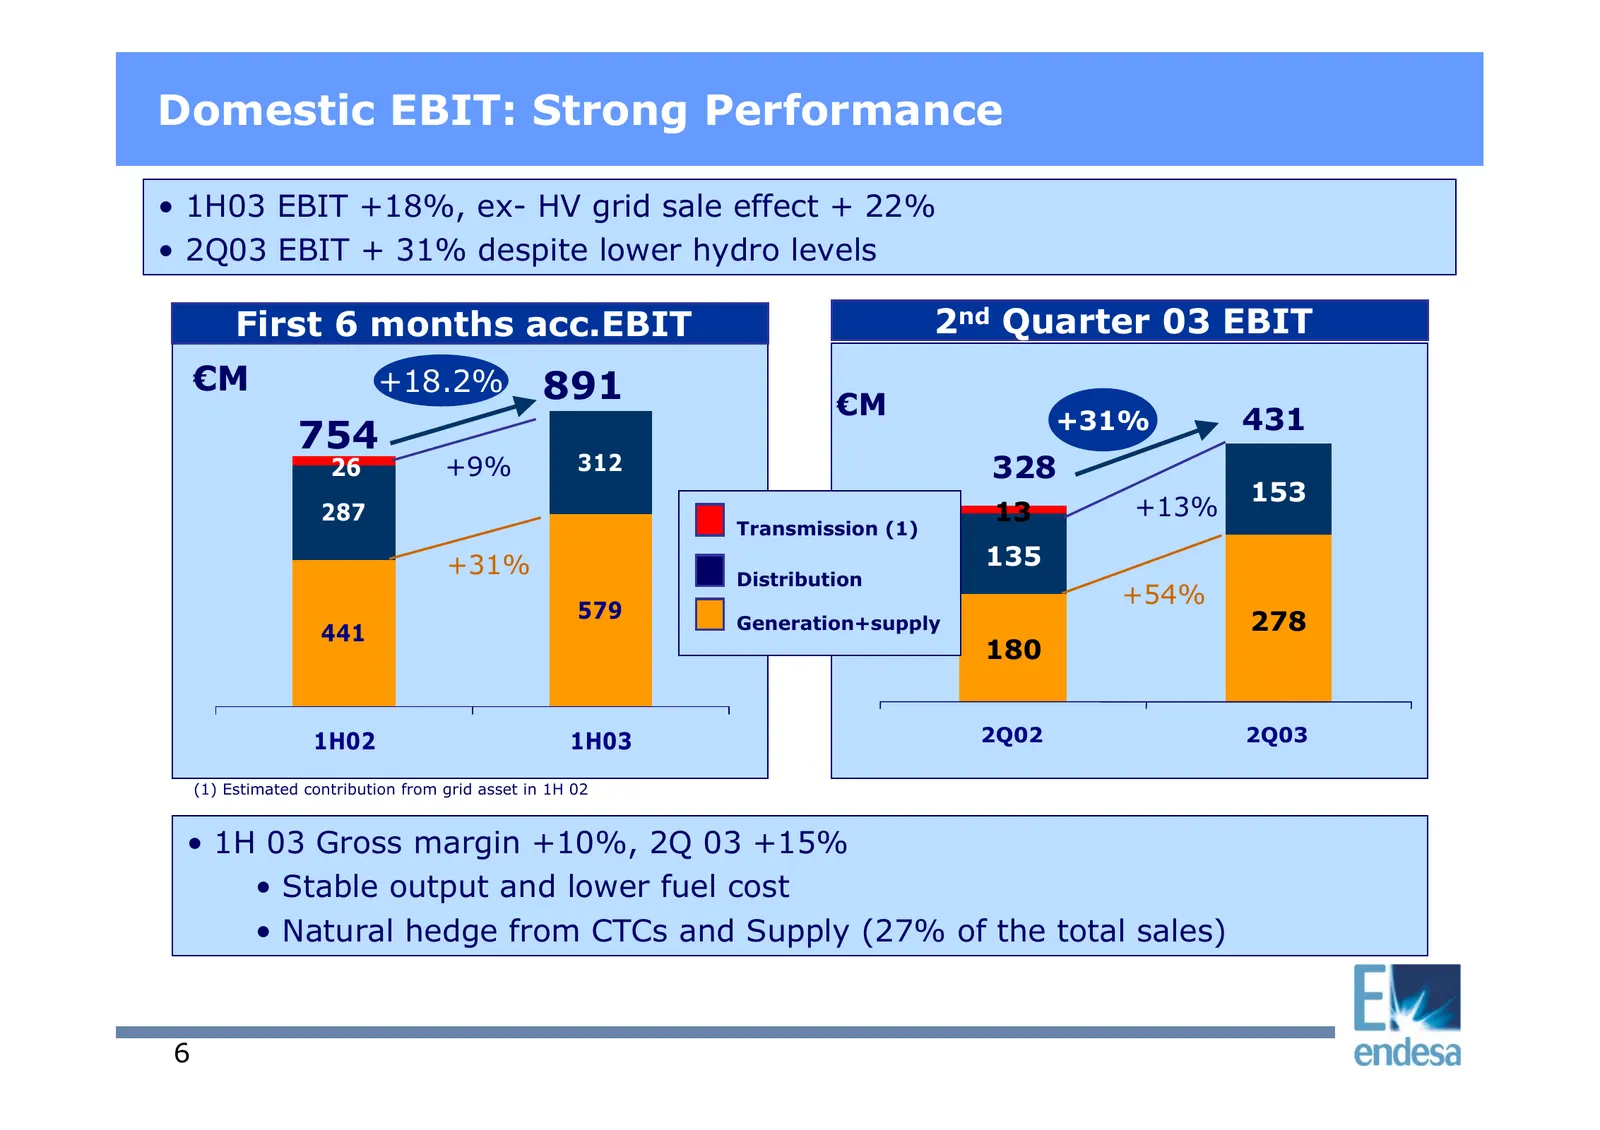
Domestic EBIT: Strong Performance • 1H03 EBIT +18%, ex- HV grid sale effect + 22% • 2Q03 EBIT + 31% despite lower hydro levels First 6 months acc.EBIT 2nd Quarter 03 EBIT €M +18.2% 891 €M +31% 431 754 26 +9% 312 328 153 287 13 +13% Transmission (1) +31% 135 Distribution +54% 579 Generation+supply 27
Slide 7: Spain: Better Performance due to Flexible and Competitive Generation Mix
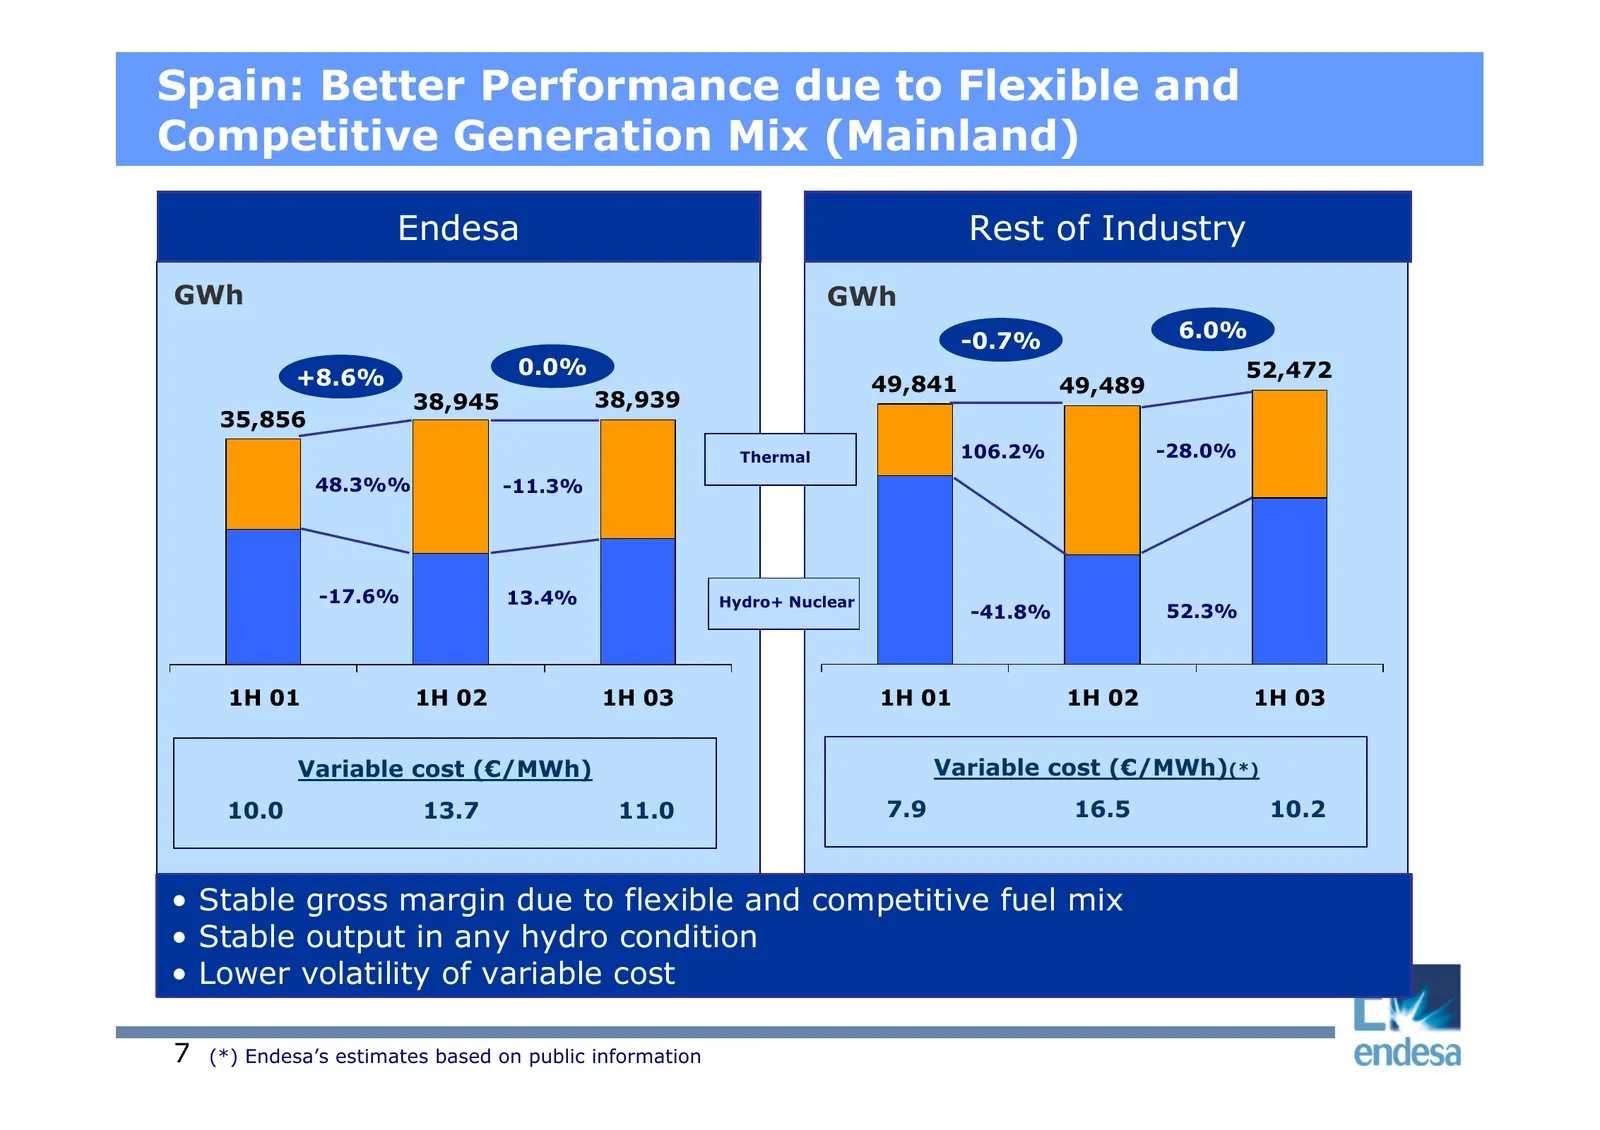
Spain: Better Performance due to Flexible and Competitive Generation Mix (Mainland) Endesa Rest of Industry GWh GWh -0.7% 6.0% +8.6% 0.0% 52,472 49,841 49,489 38,945 38,939 35,856 Thermal 106.2% -28.0% 48.3%% -11.3% -17.6% 13.4% Hydro+ Nuclear -41.8% 52.3% 1H 01 1H 02 1H 03 1H 01 1H 02 1H 03 Variabl
Slide 8: Spain: Supply Focused on Profitability and Retention of Market Leadership
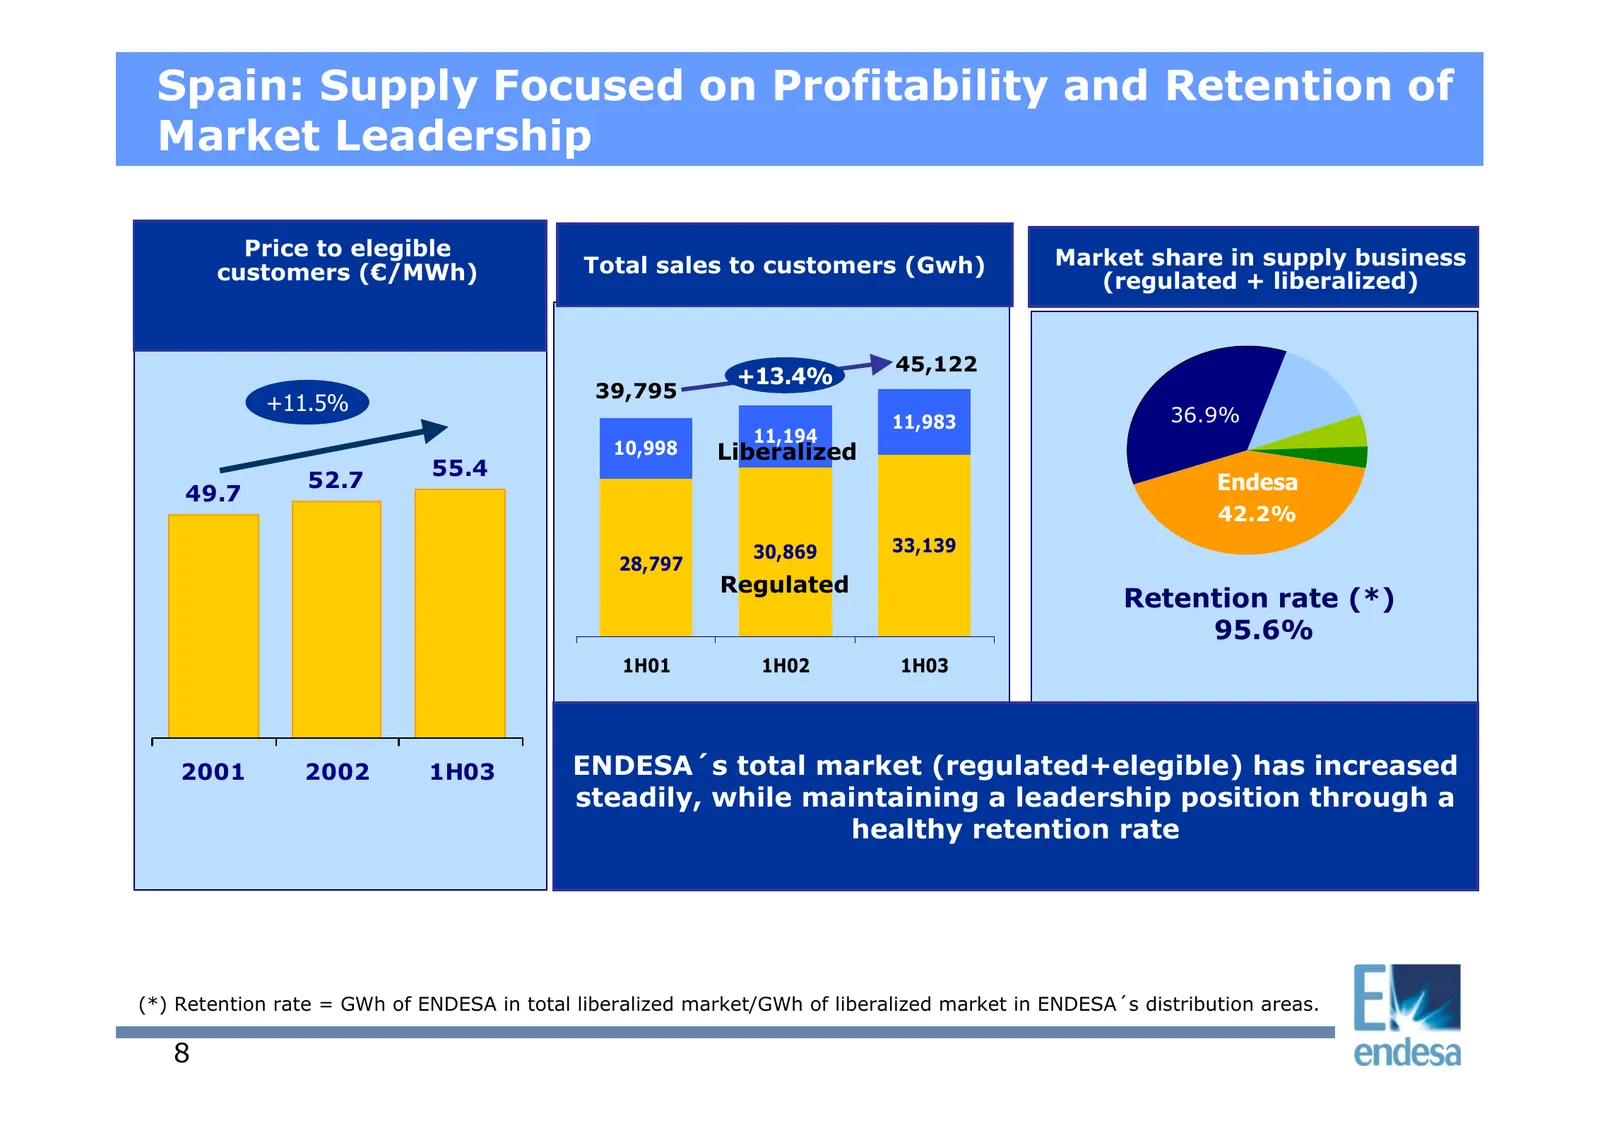
Spain: Supply Focused on Profitability and Retention of Market Leadership Price to elegible Market share in supply business customers (€/MWh) Total sales to customers (Gwh) (regulated + liberalized) 45,122 +13.4% 39,795 +11.5% 11,983 36.9% 11,194 10,998 Liberalized 55.4 52.7 Endesa 49.7 42.2% 30,869
Slide 9: Spain: Growth Continues in Domestic Business
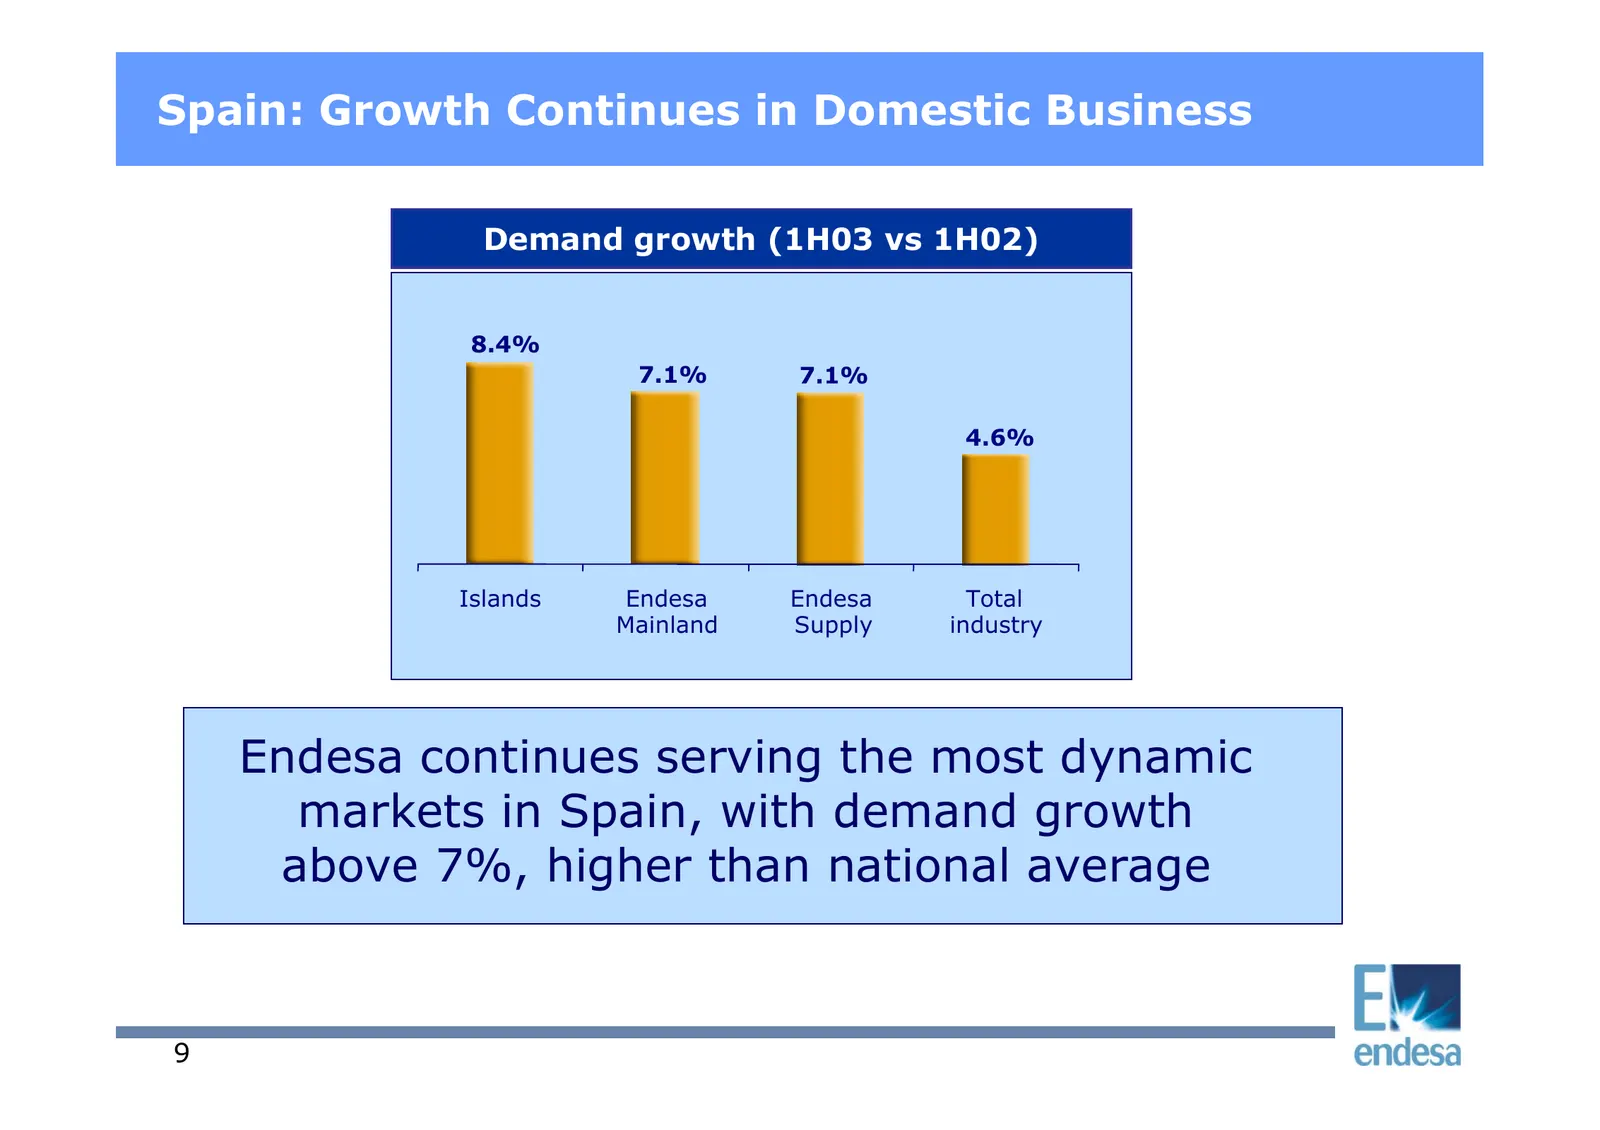
Spain: Growth Continues in Domestic Business Demand growth (1H03 vs 1H02) 8.4% 7.1% 7.1% 4.6% Islands Endesa Endesa Total Mainland Supply industry Endesa continues serving the most dynamic markets in Spain, with demand growth above 7%, higher than national average 9
Slide 10: Spain: Reinforcing Leadership in Generation
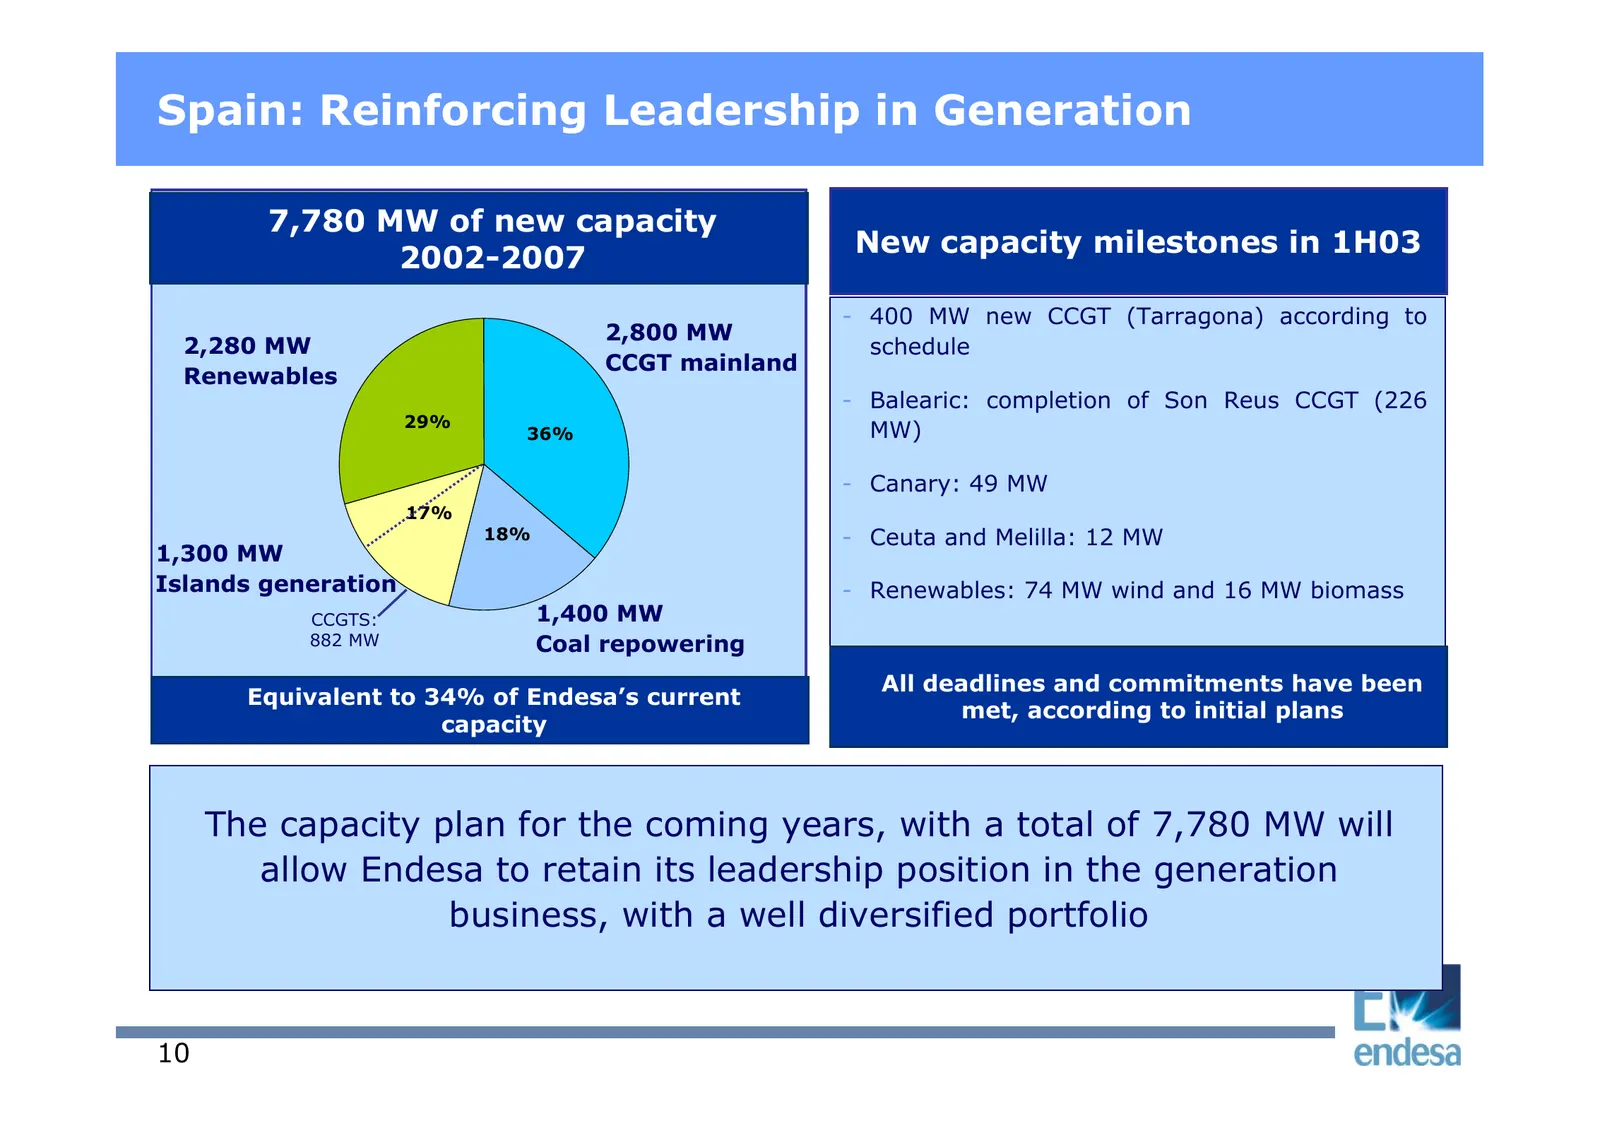
Spain: Reinforcing Leadership in Generation 7,780 MW of new capacity 2002-2007 New capacity milestones in 1H03 - 400 MW new CCGT (Tarragona) according to 2,800 MW 2,280 MW schedule CCGT mainland Renewables - Balearic: completion of Son Reus CCGT (226 29% 36% MW) - Canary: 49 MW 17% 18% - Ceuta and M
Slide 11: Gas in Spain: Two new Contracts Reinforce Gas Procurement Portfolio
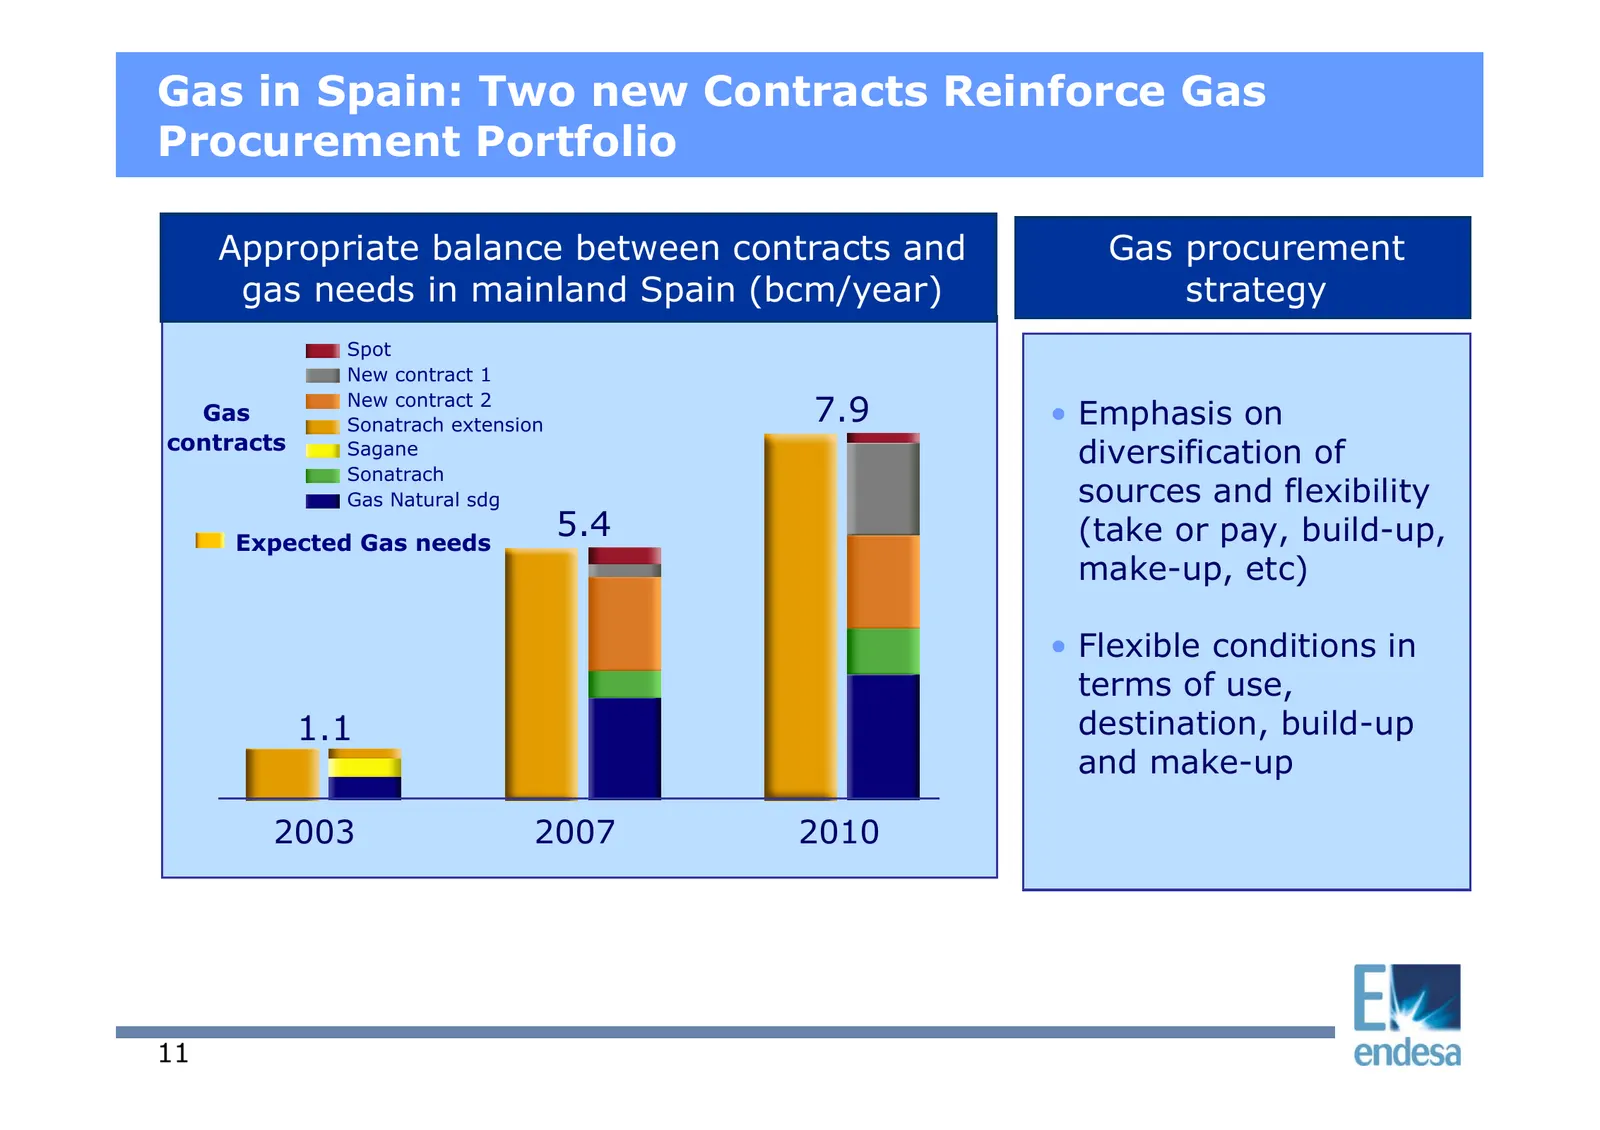
Gas in Spain: Two new Contracts Reinforce Gas Procurement Portfolio Appropriate balance between contracts and Gas procurement gas needs in mainland Spain (bcm/year) strategy Spot New contract 1 Gas New contract 2 Sonatrach extension 7.9 • Emphasis on contracts Sagane diversification of Sonatrach Gas
Slide 12: Gas in Spain: Largest Electricity Player in the Gas Market
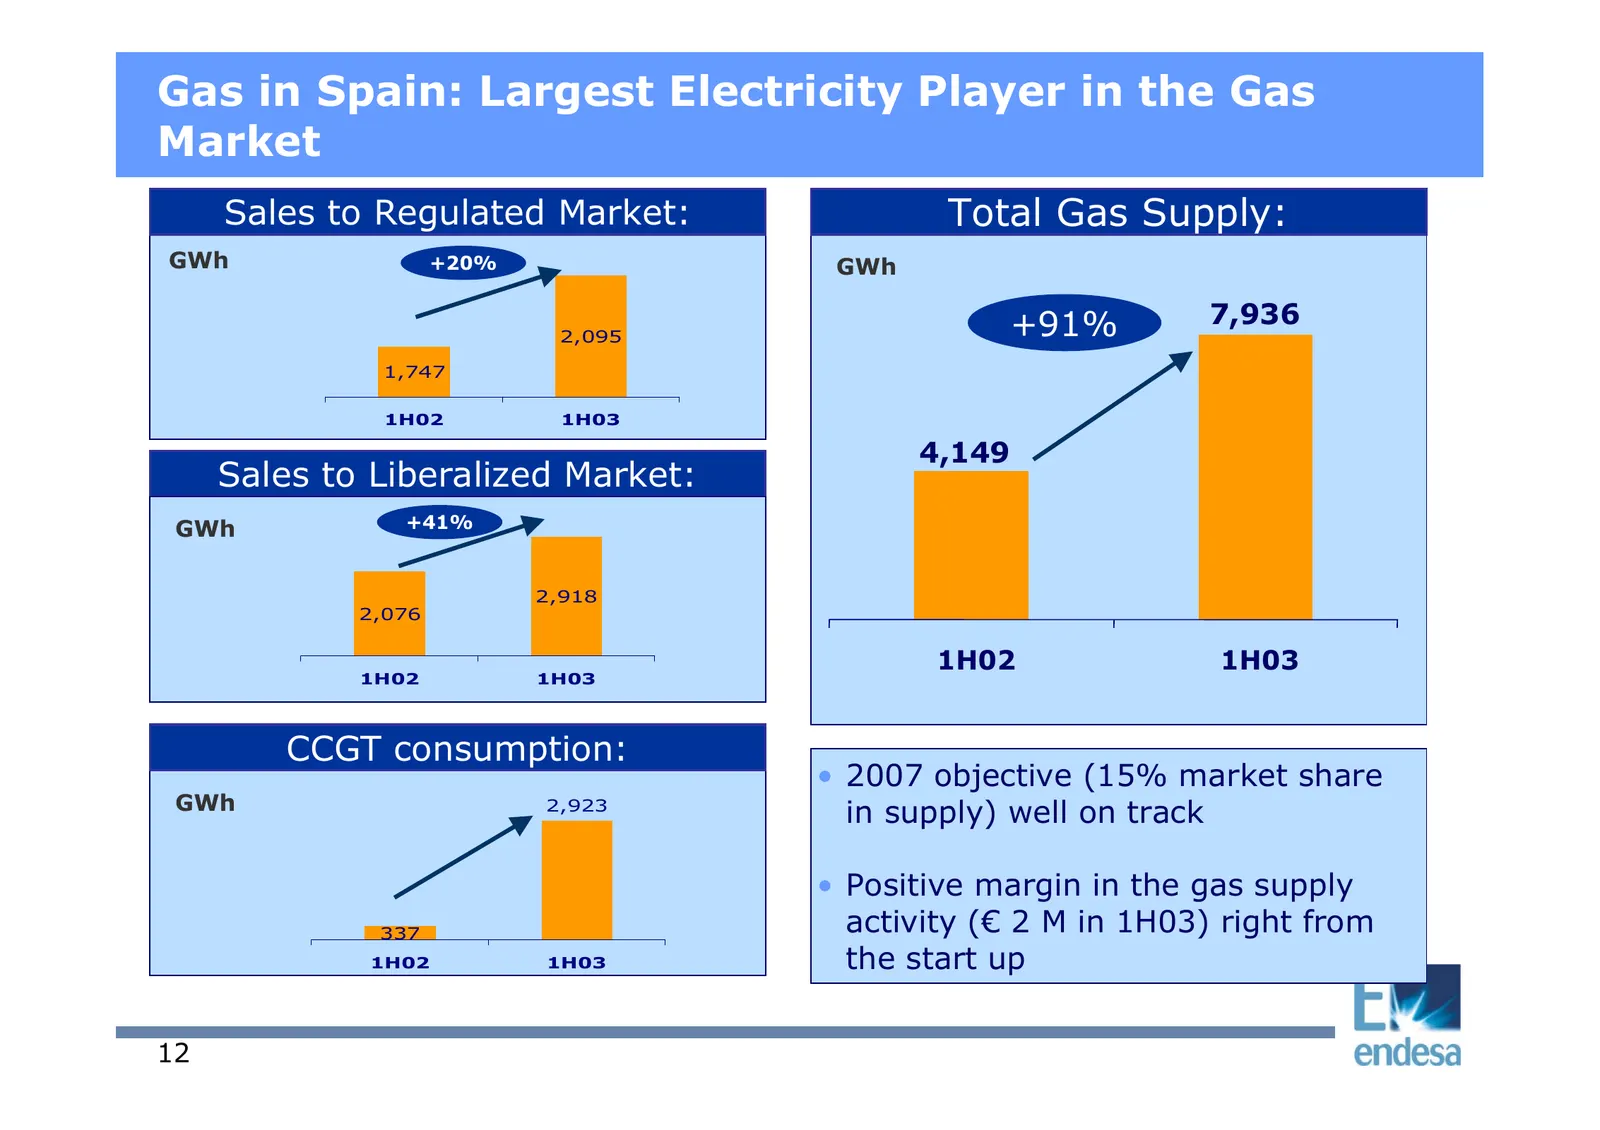
Gas in Spain: Largest Electricity Player in the Gas Market Sales to Regulated Market: Total Gas Supply: GWh +20% GWh +91% 7,936 2,095 1,747 1H02 1H03 4,149 Sales to Liberalized Market: GWh +41% 2,918 2,076 1H02 1H03 1H02 1H03 CCGT consumption: • 2007 objective (15% market share GWh 2,923 in supply)
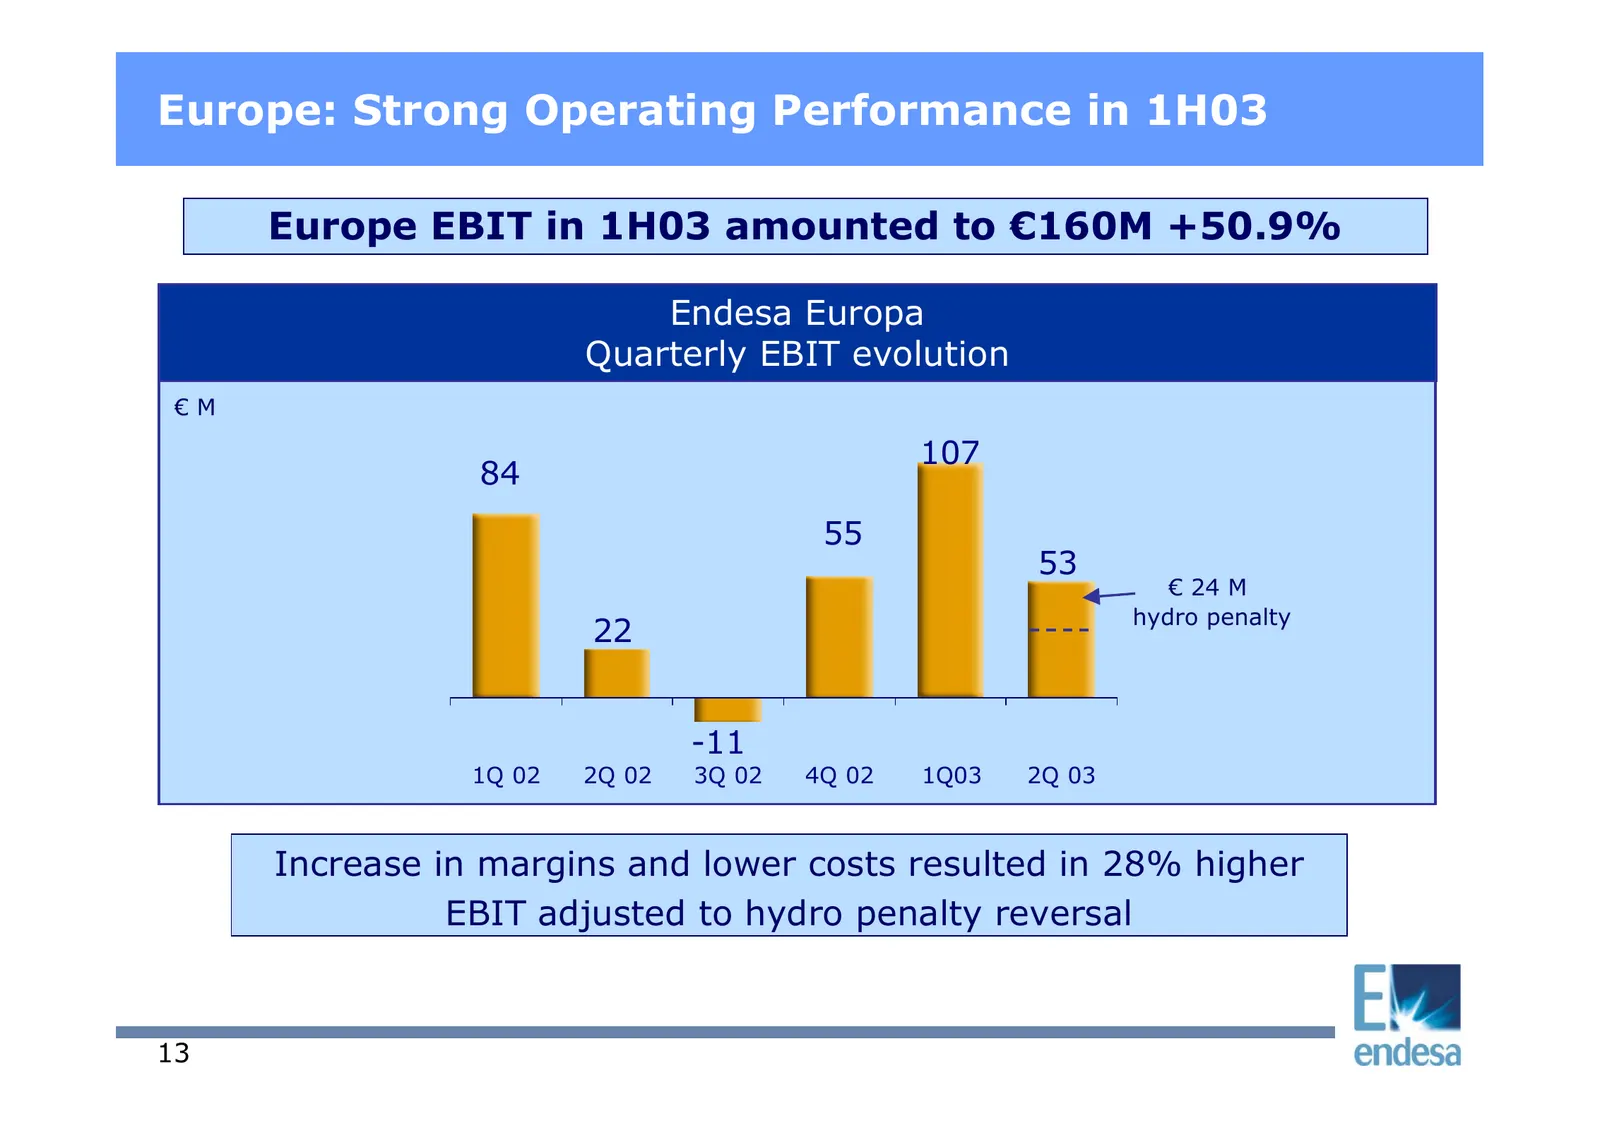
Slide 13: Europe: Strong Operating Performance in 1H03
Europe: Strong Operating Performance in 1H03 Europe EBIT in 1H03 amounted to €160M +50.9% Endesa Europa Quarterly EBIT evolution €M 107 84 55 53 € 24 M hydro penalty 22 -11 1Q 02 2Q 02 3Q 02 4Q 02 1Q03 2Q 03 Increase in margins and lower costs resulted in 28% higher EBIT adjusted to hydro penalty re
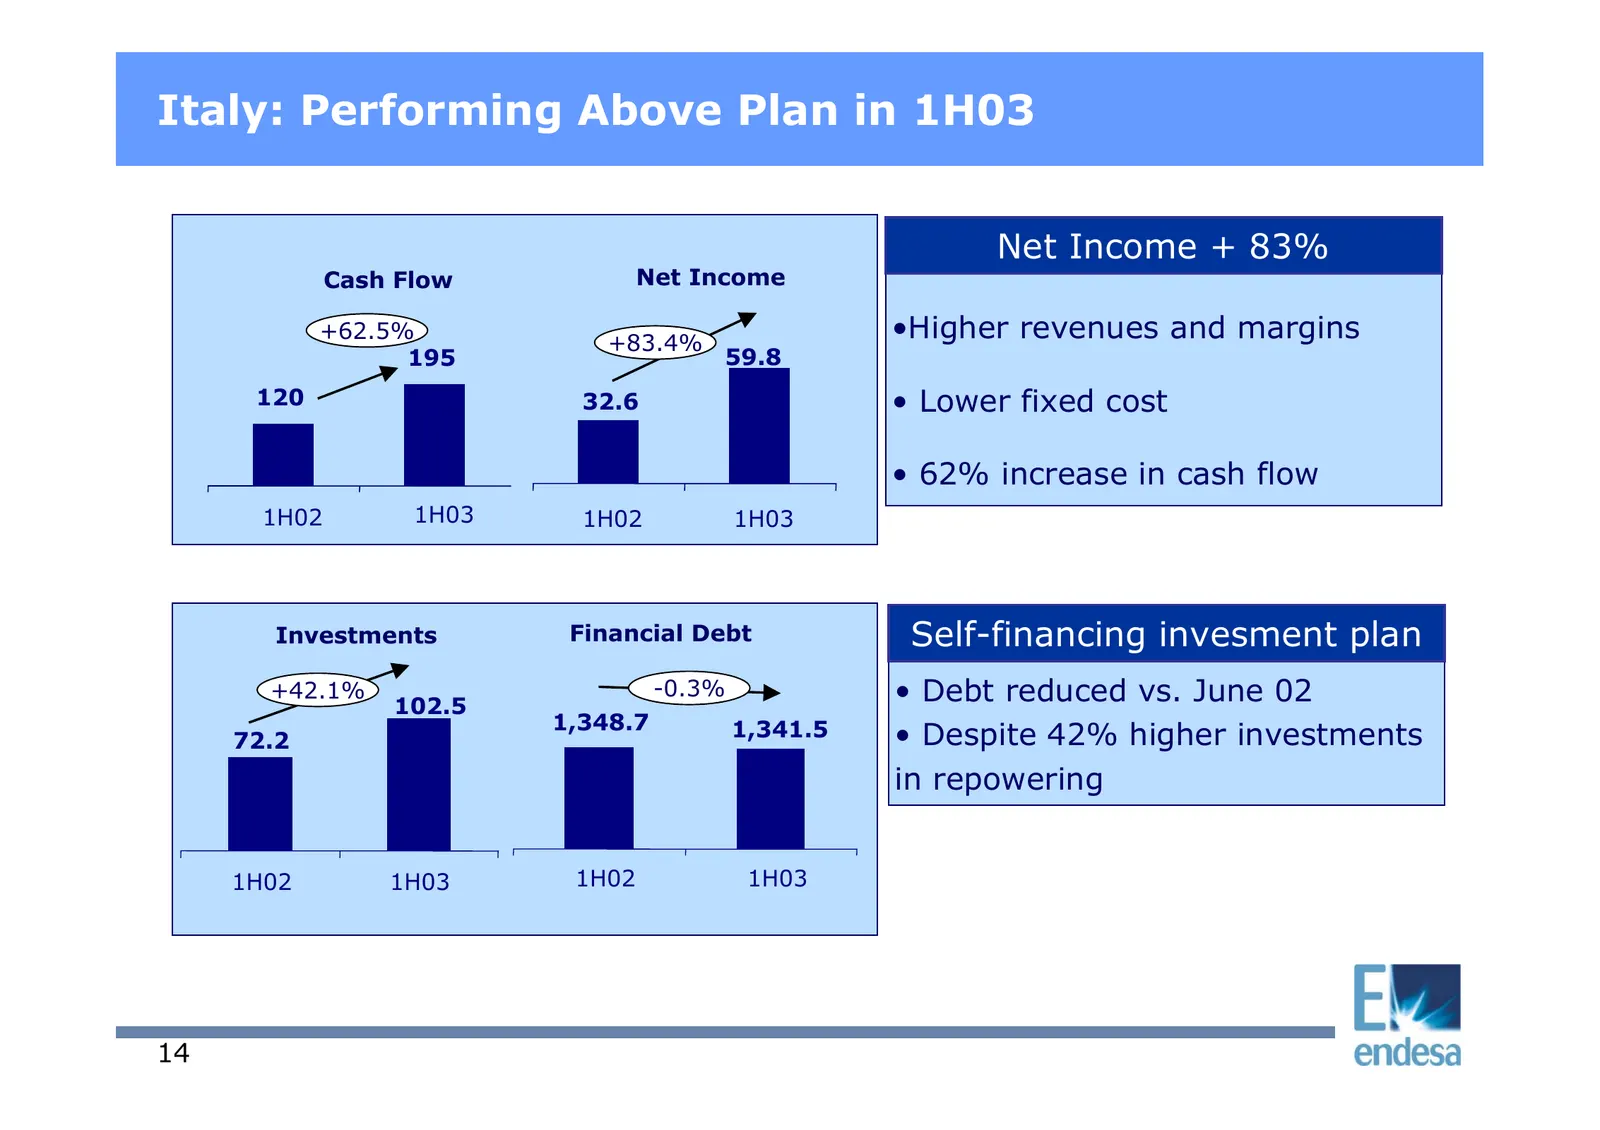
Slide 14: Italy: Performing Above Plan in 1H03
Italy: Performing Above Plan in 1H03 Net Income + 83% Cash Flow Net Income +62.5% +83.4% •Higher revenues and margins 195 59.8 120 32.6 • Lower fixed cost • 62% increase in cash flow 1H02 1H03 1H02 1H03 Investments Financial Debt Self-financing invesment plan +42.1% 102.5 -0.3% • Debt reduced vs. Ju
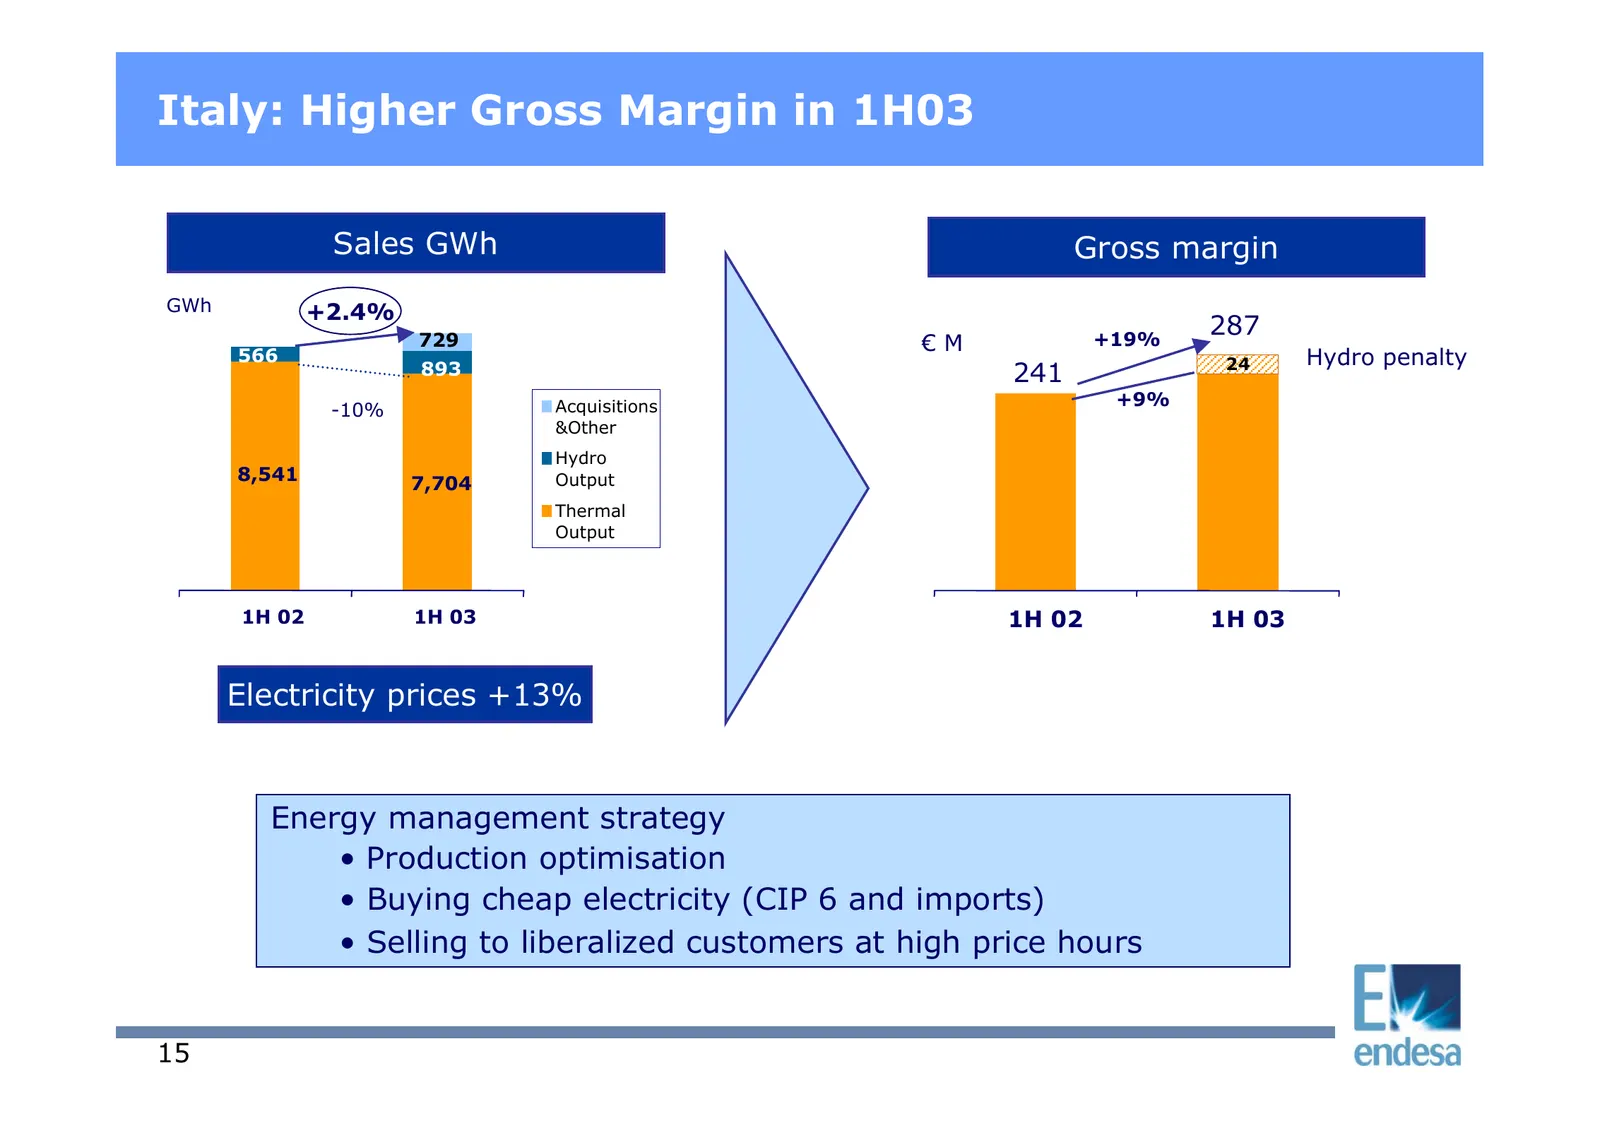
Slide 15: Italy: Higher Gross Margin in 1H03
Italy: Higher Gross Margin in 1H03 Sales GWh Gross margin GWh +2.4% 729 +19% 287 €M 566 24 Hydro penalty 893 241 Acquisitions +9% -10% &Other Hydro 8,541 7,704 Output Thermal Output 1H 02 1H 03 1H 02 1H 03 Electricity prices +13% Energy management strategy • Production optimisation • Buying cheap el
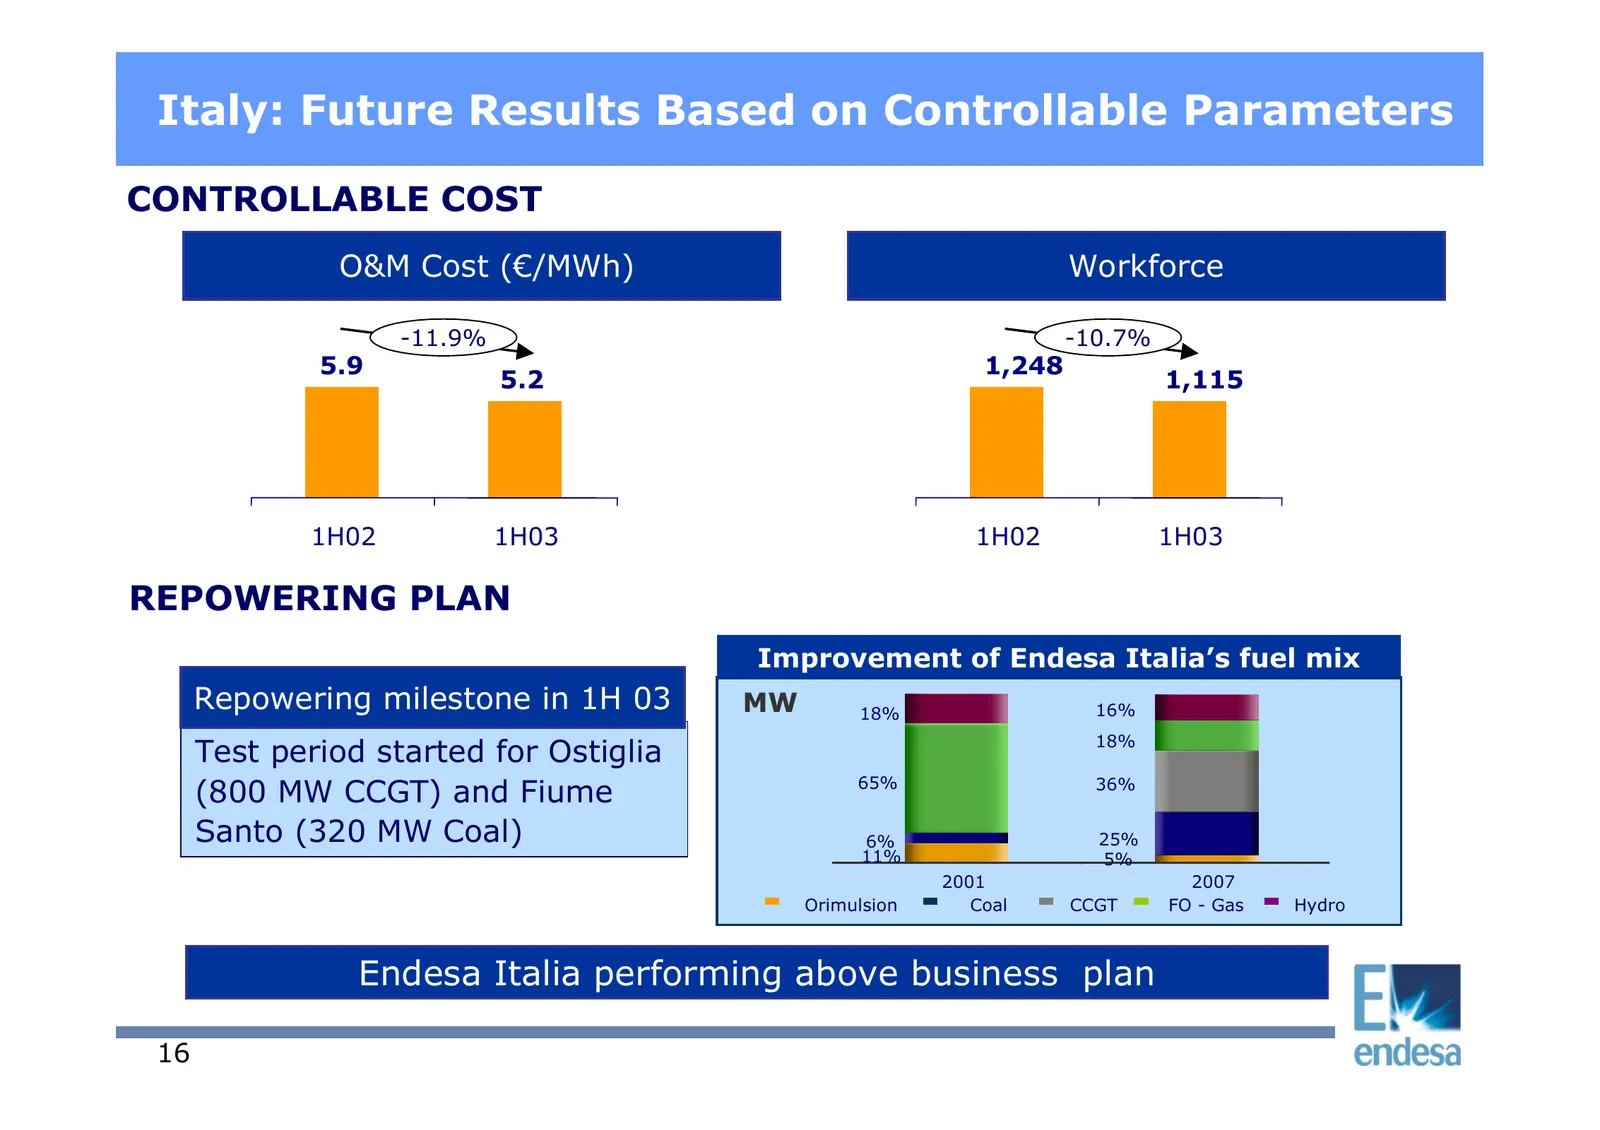
Slide 16: Italy: Future Results Based on Controllable Parameters
Italy: Future Results Based on Controllable Parameters CONTROLLABLE COST O&M Cost (€/MWh) Workforce -11.9% -10.7% 5.9 1,248 5.2 1,115 1H02 1H03 1H02 1H03 REPOWERING PLAN Improvement of Endesa Italia’s fuel mix Repowering milestone in 1H 03 MW 18% 16% 18% Test period started for Ostiglia (800 MW CCGT
Slide 17: Latin America: Upside Potential in a Changing Cycle
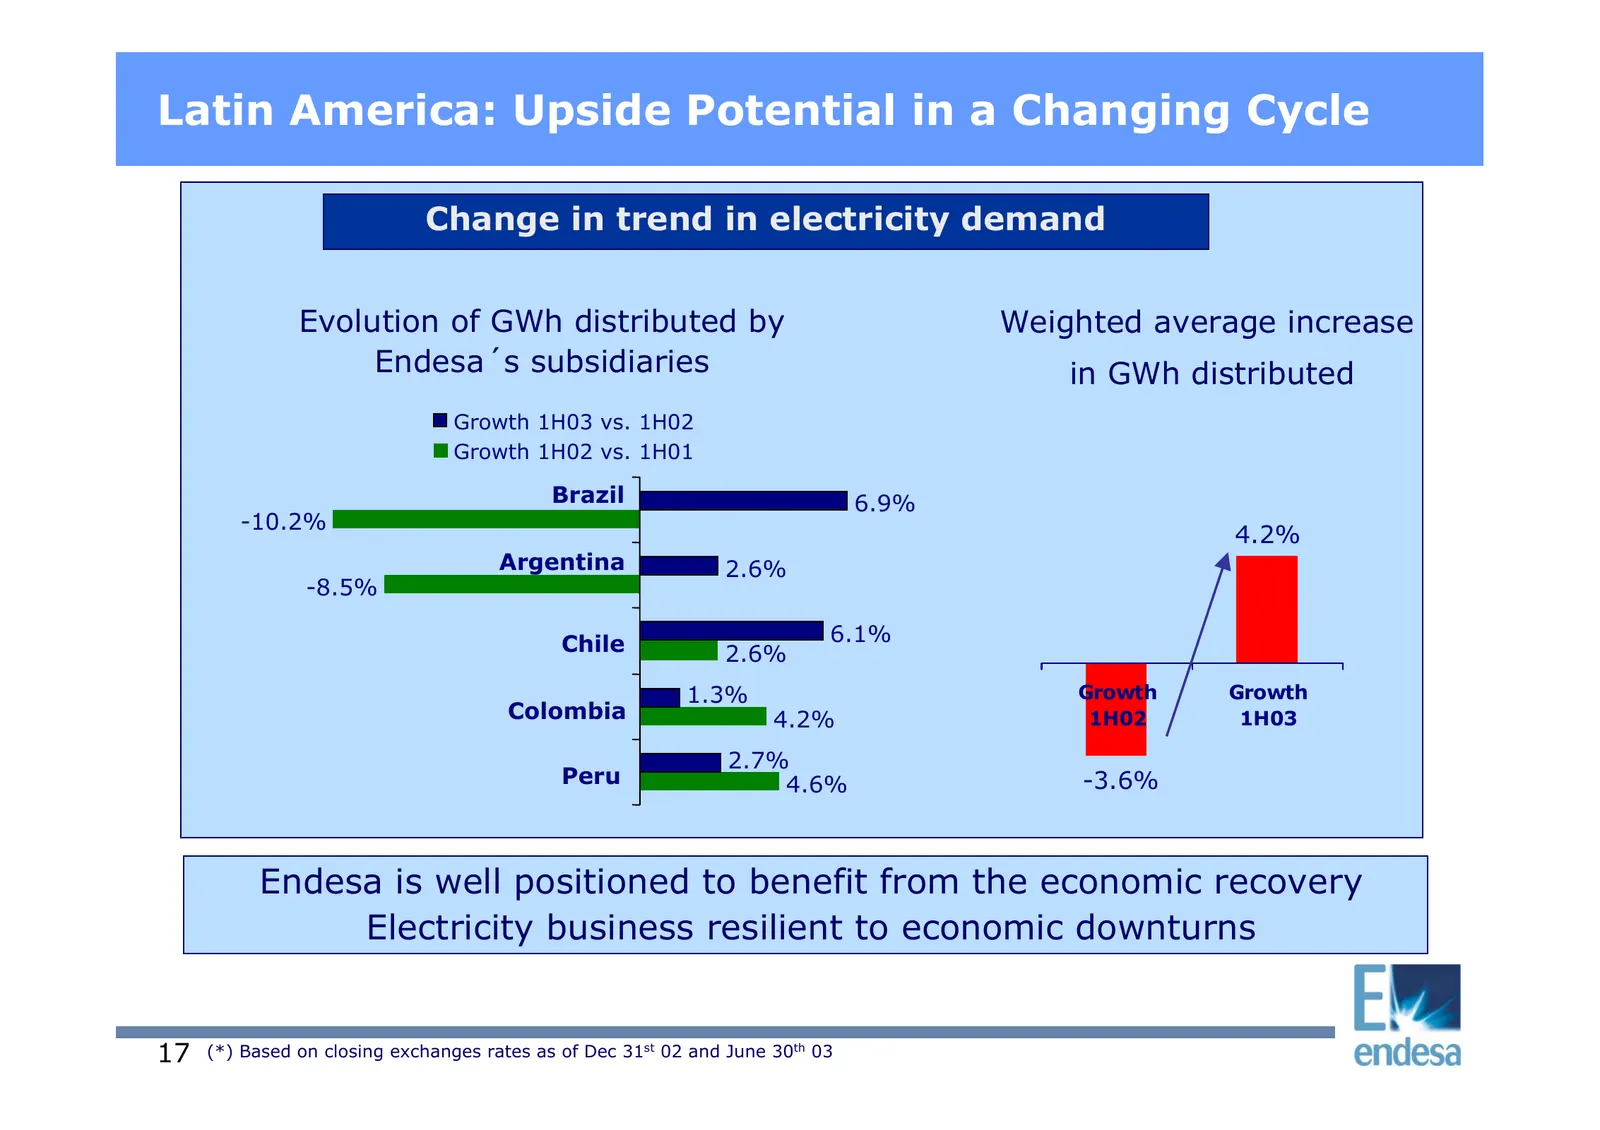
Latin America: Upside Potential in a Changing Cycle Change in trend in electricity demand Evolution of GWh distributed by Weighted average increase Endesa´s subsidiaries in GWh distributed Growth 1H03 vs. 1H02 Growth 1H02 vs. 1H01 Brazil 6.9% -10.2% 4.2% Argentina 2.6% -8.5% Chile 6.1% 2.6% 1.3% Gro
Slide 18: Latin America: EBIT Stable in US$ but Affected by Strong Euro
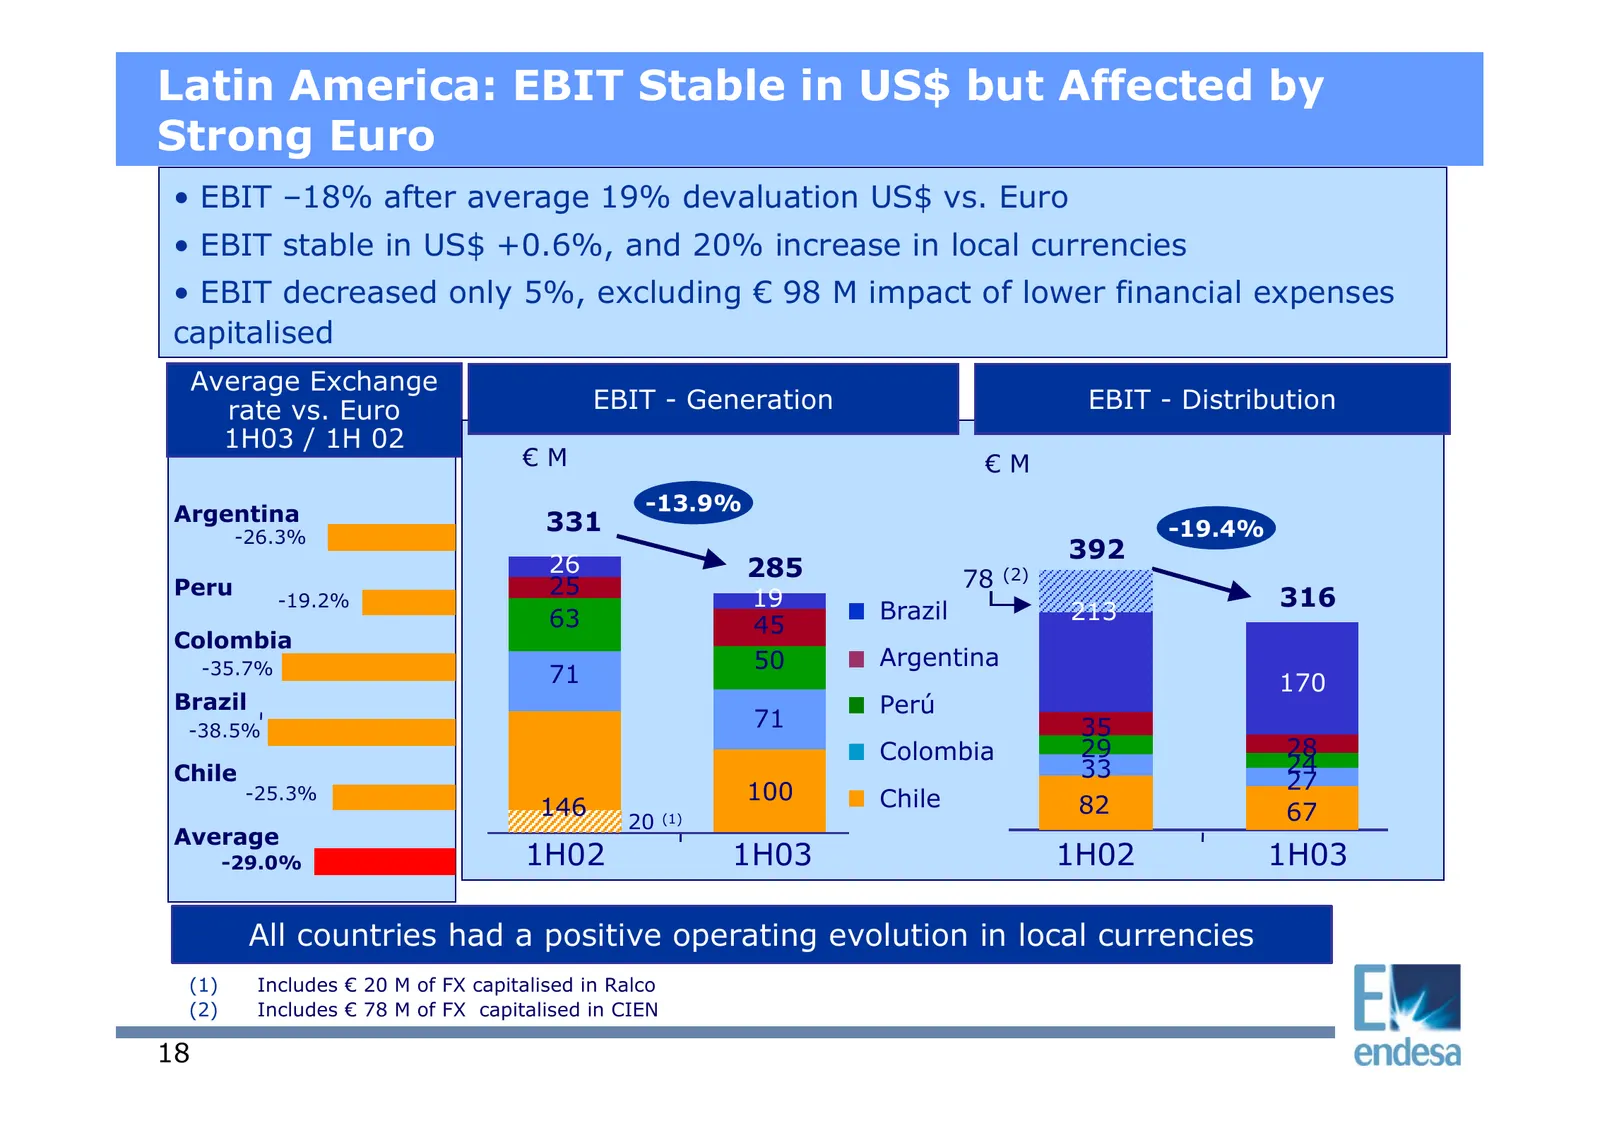
Latin America: EBIT Stable in US$ but Affected by Strong Euro • EBIT –18% after average 19% devaluation US$ vs. Euro • EBIT stable in US$ +0.6%, and 20% increase in local currencies • EBIT decreased only 5%, excluding € 98 M impact of lower financial expenses capitalised Average Exchange rate vs. Eu
Slide 19: Latin America: Currency Impact
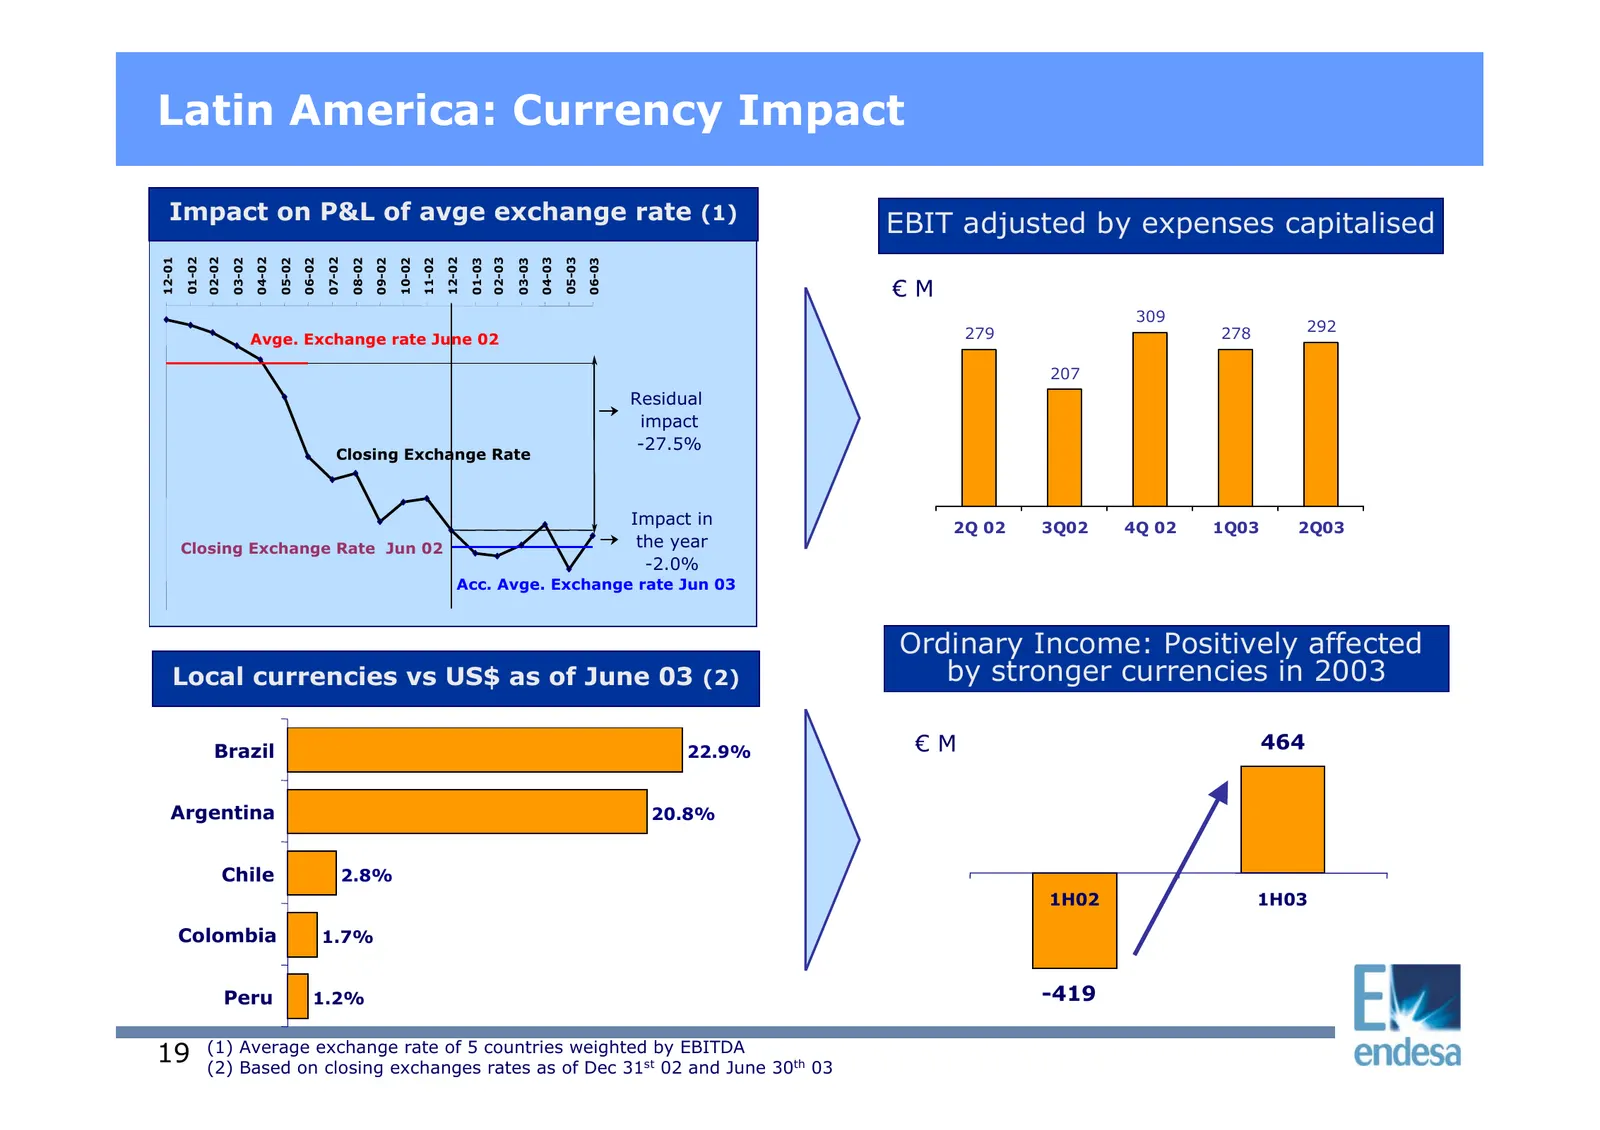
Latin America: Currency Impact Impact on P&L of avge exchange rate (1) EBIT adjusted by expenses capitalised 01-02 05-03 12-01 02-02 04-02 07-02 12-02 02-03 04-03 03-02 05-02 06-02 08-02 09-02 10-02 11-02 01-03 03-03 06-03 €M 309 279 278 292 Avge. Exchange rate June 02 207 Residual impact -27.5% Clo
Slide 20: Enersis: Successful Delivery of Strengthening Plan Targets
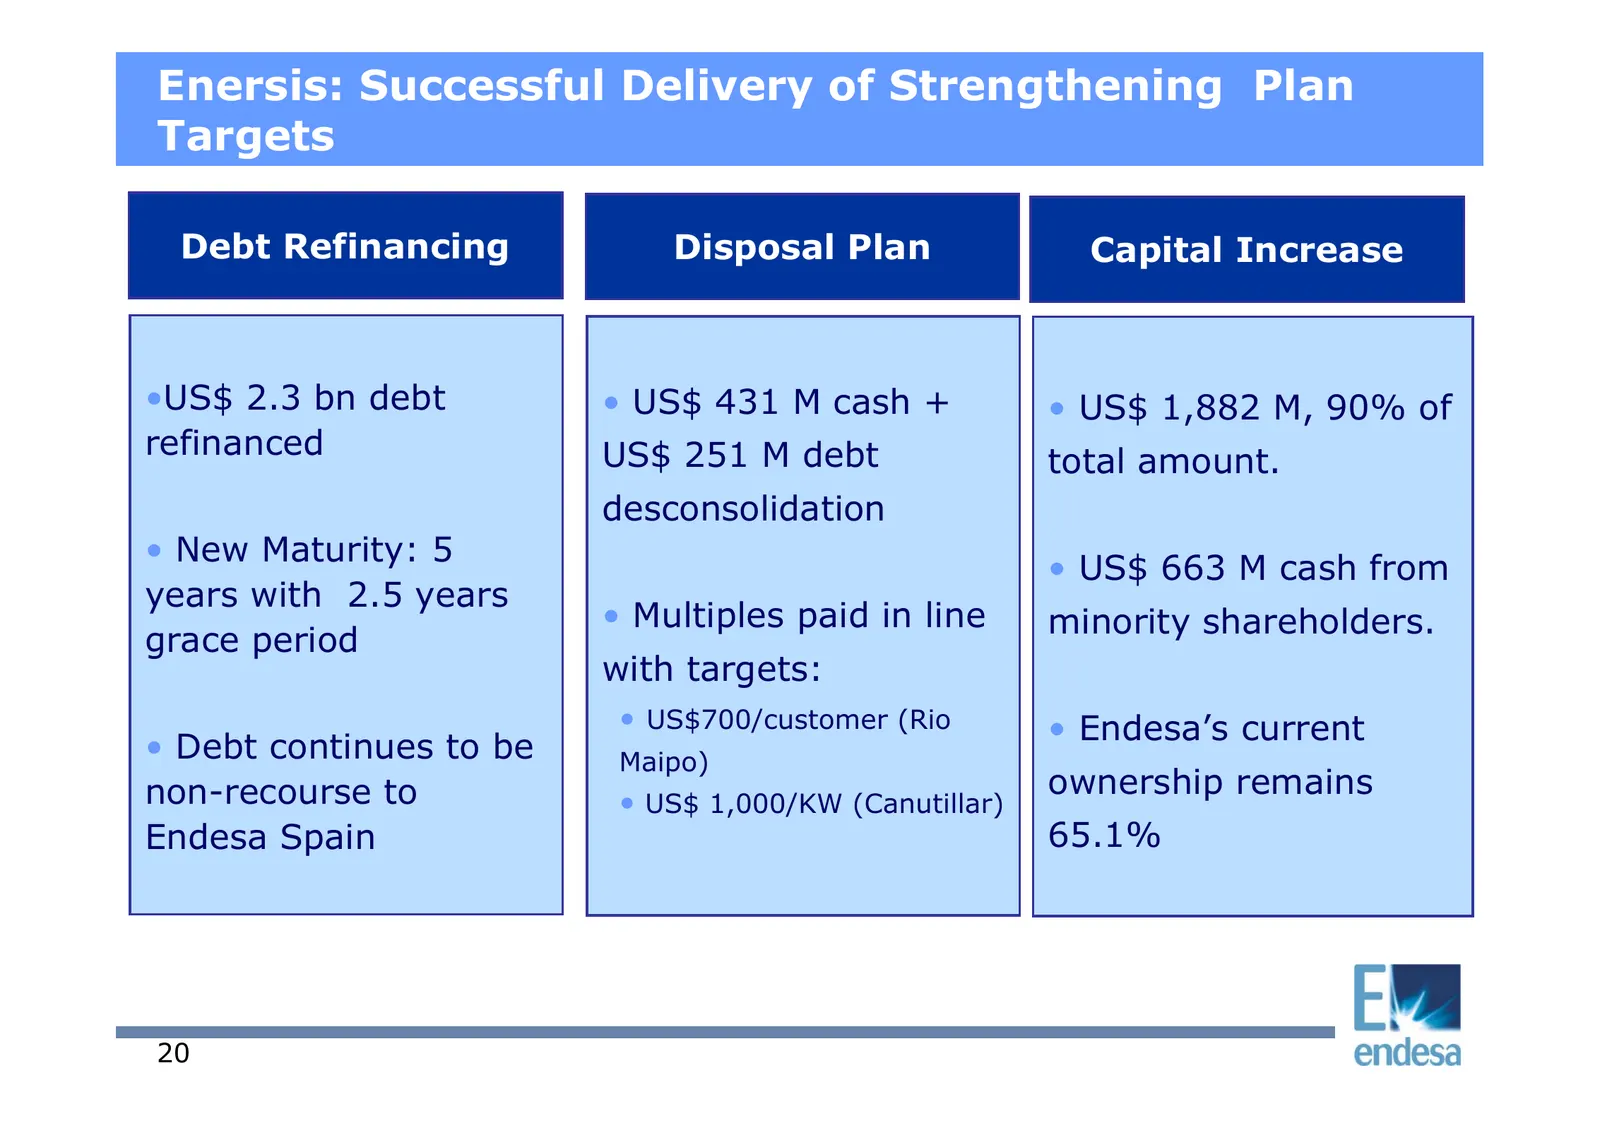
Enersis: Successful Delivery of Strengthening Plan Targets Debt Refinancing Disposal Plan Capital Increase •US$ 2.3 bn debt • US$ 431 M cash + • US$ 1,882 M, 90% of refinanced US$ 251 M debt total amount. desconsolidation • New Maturity: 5 • US$ 663 M cash from years with 2.5 years • Multiples paid
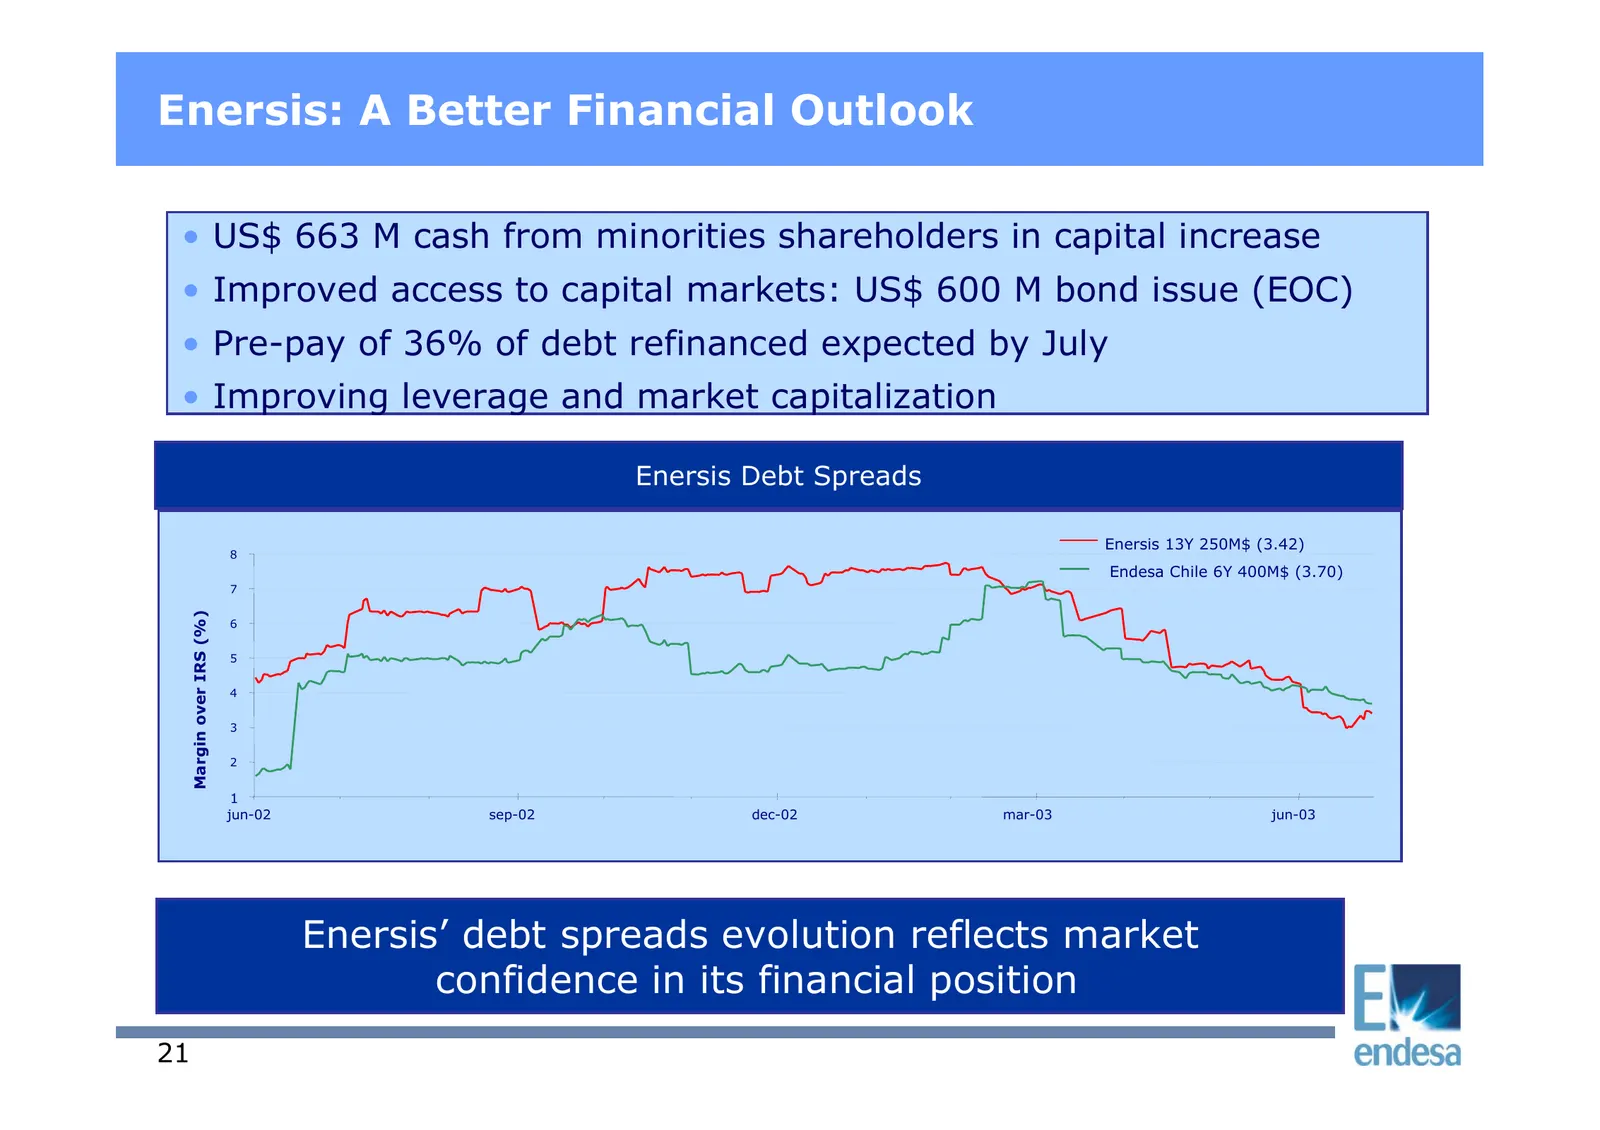
Slide 21: Enersis: A Better Financial Outlook
Enersis: A Better Financial Outlook • US$ 663 M cash from minorities shareholders in capital increase • Improved access to capital markets: US$ 600 M bond issue (EOC) • Pre-pay of 36% of debt refinanced expected by July • Improving leverage and market capitalization Enersis Debt Spreads Enersis 13Y
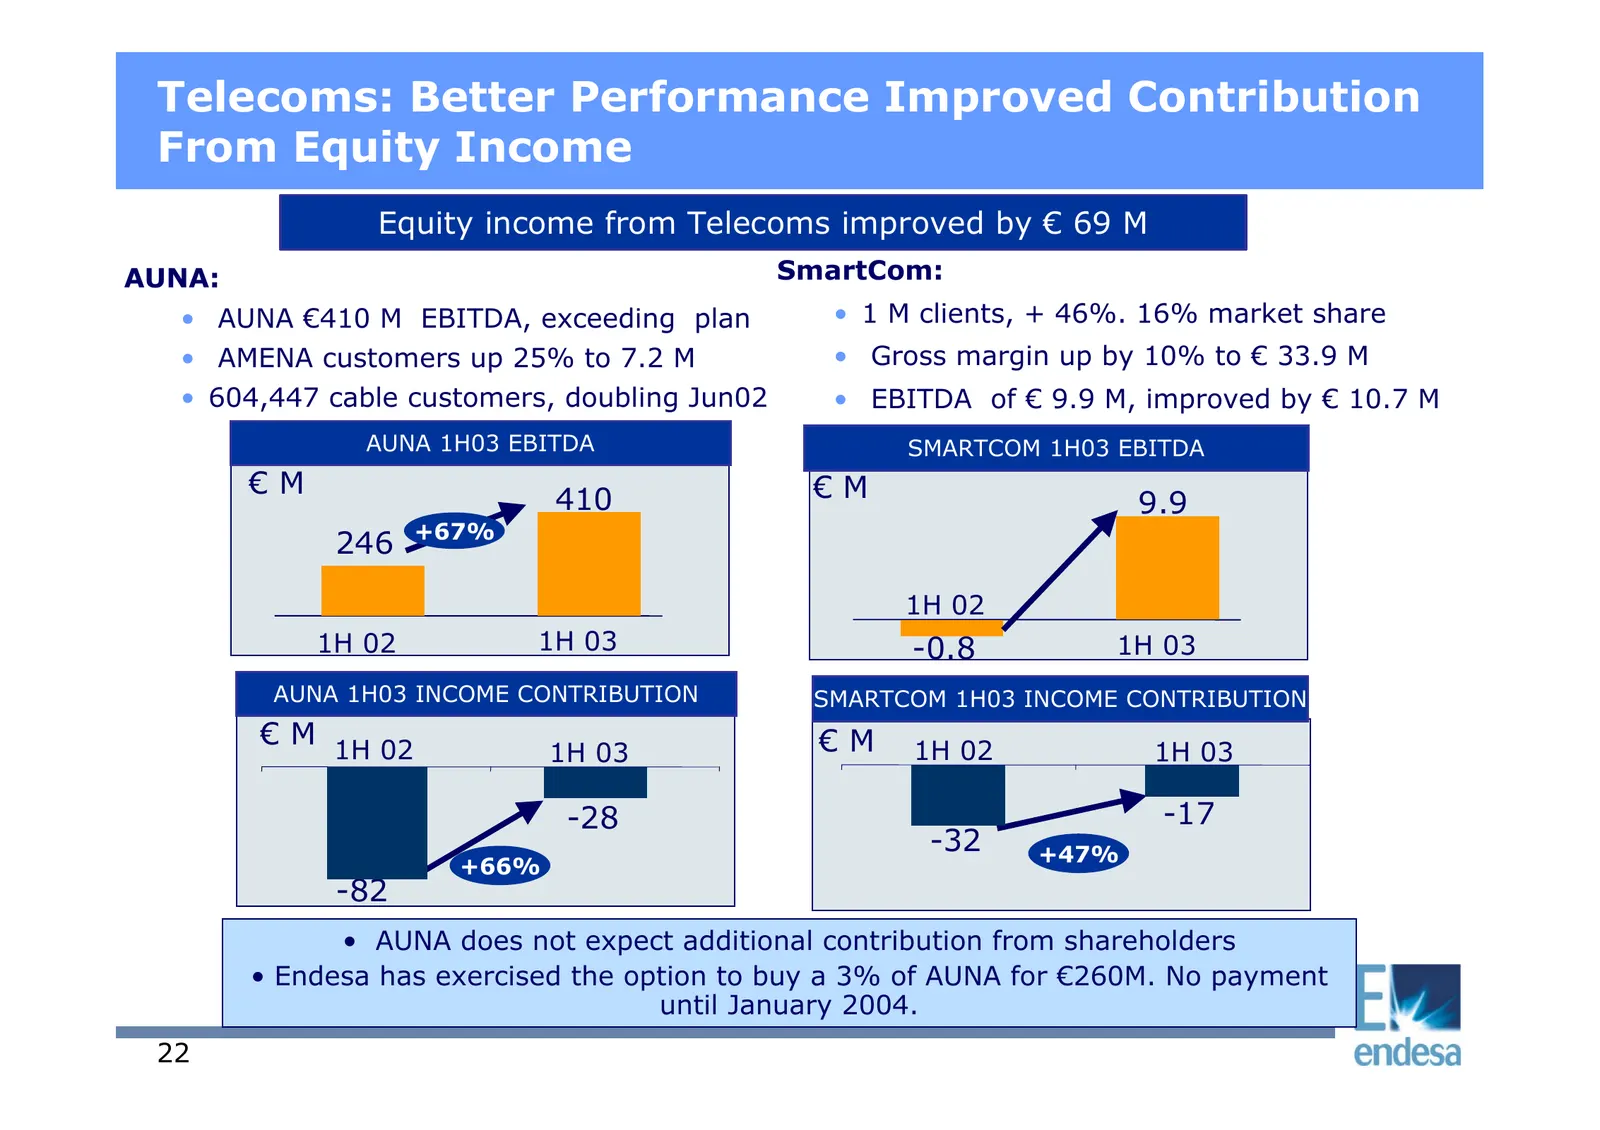
Slide 22: Telecoms: Better Performance, Improved Contribution From Equity Income
Telecoms: Better Performance Improved Contribution From Equity Income Equity income from Telecoms improved by € 69 M AUNA: SmartCom: • AUNA €410 M EBITDA, exceeding plan • 1 M clients, + 46%. 16% market share • AMENA customers up 25% to 7.2 M • Gross margin up by 10% to € 33.9 M • 604,447 cable cust
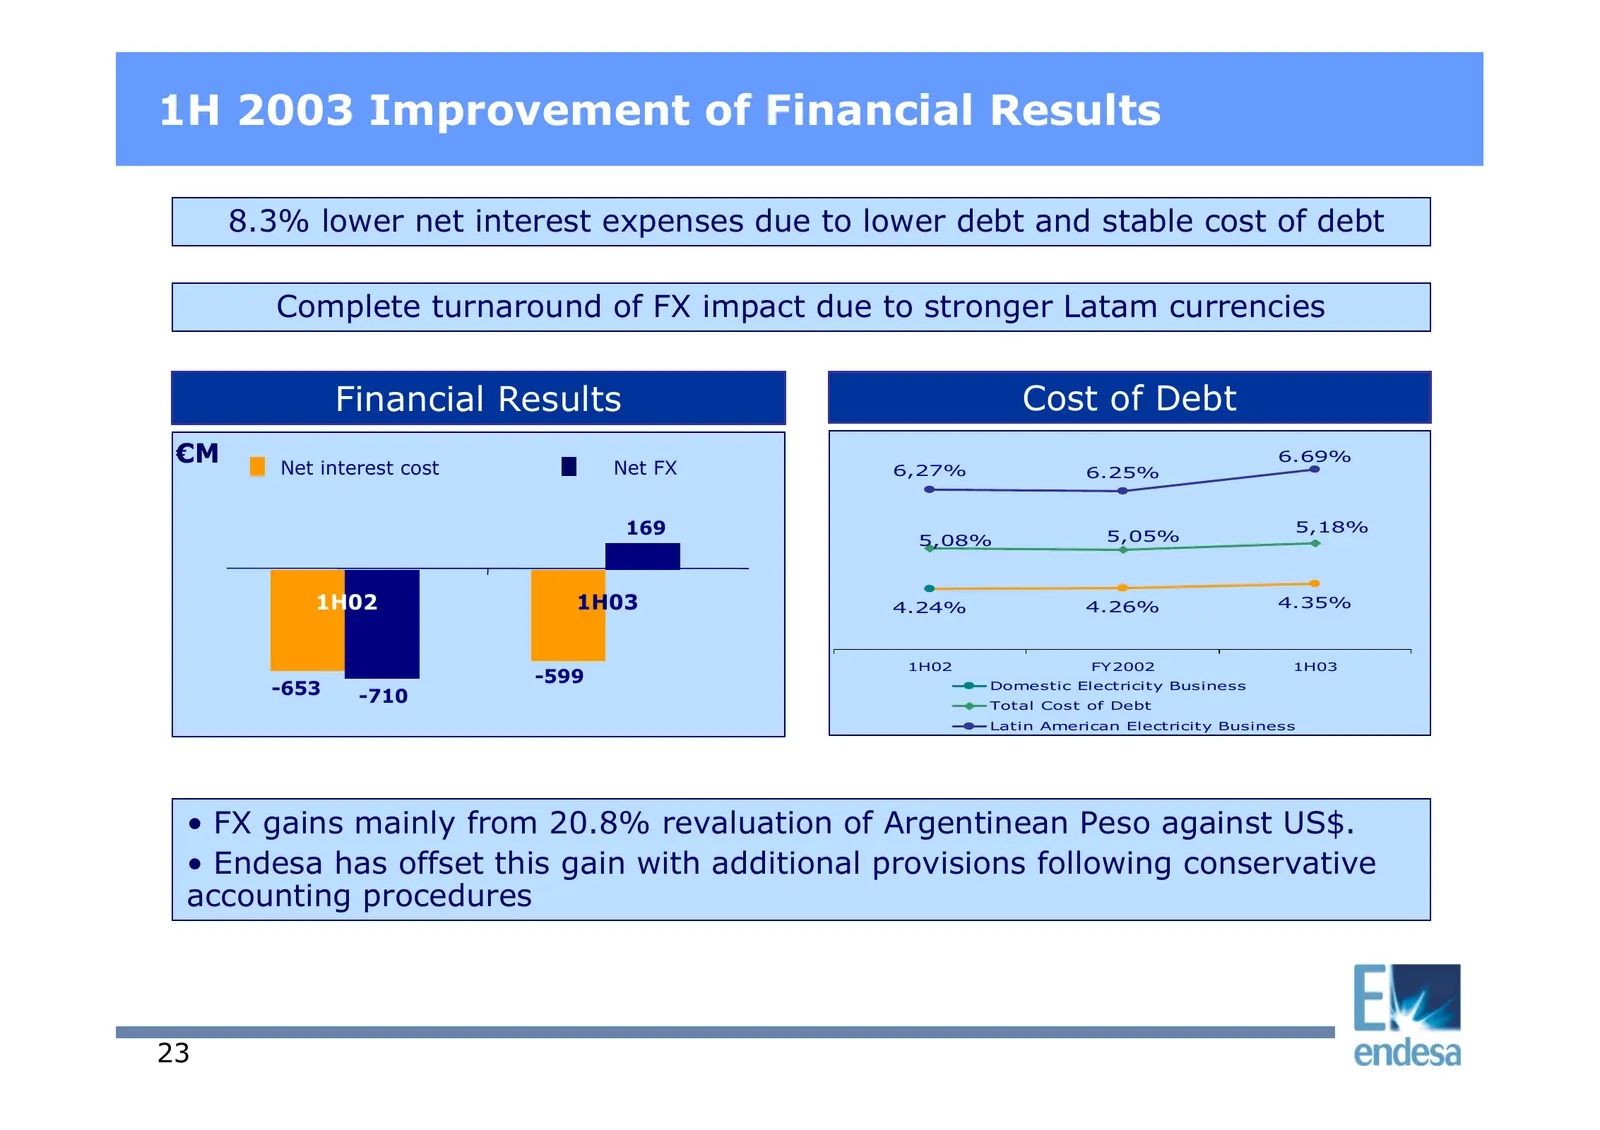
Slide 23: 1H 2003 Improvement of Financial Results
1H 2003 Improvement of Financial Results 8.3% lower net interest expenses due to lower debt and stable cost of debt Complete turnaround of FX impact due to stronger Latam currencies Financial Results Cost of Debt €M Net interest cost Net FX 6.69% 6,27% 6.25% 169 5,05% 5,18% 5,08% 1H02 1H03 4.24% 4.2
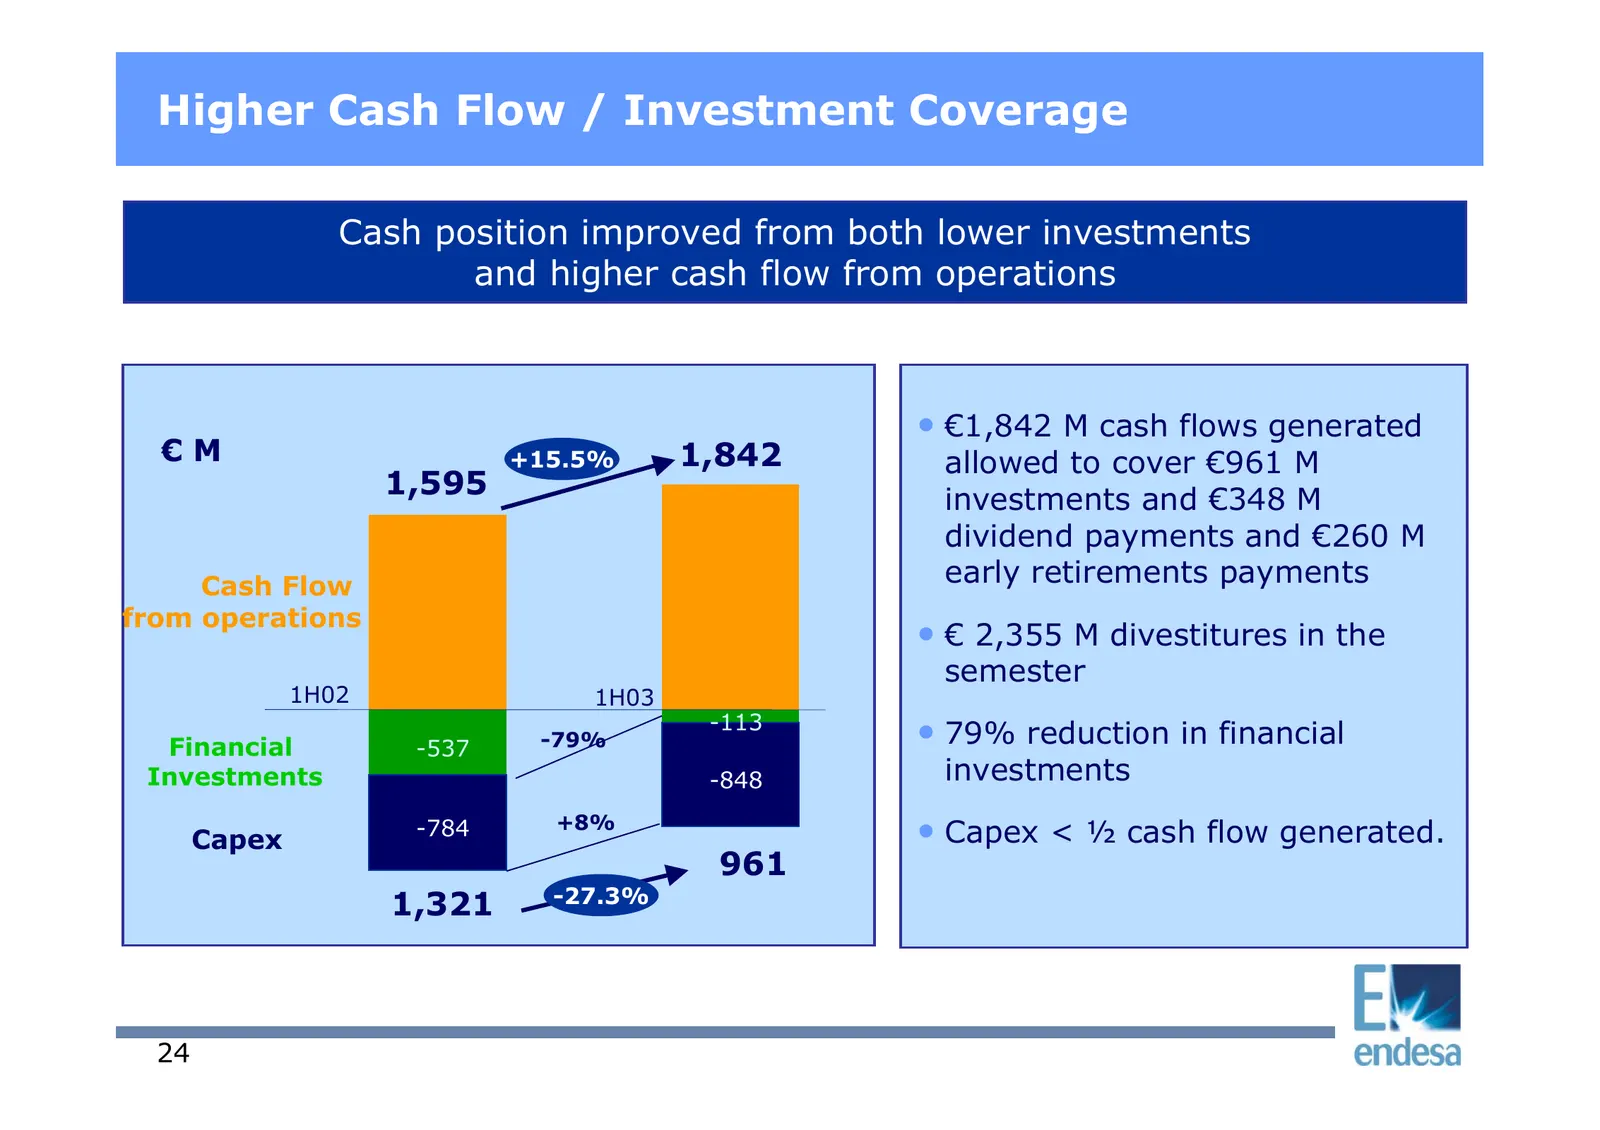
Slide 24: Higher Cash Flow / Investment Coverage
Higher Cash Flow / Investment Coverage Cash position improved from both lower investments and higher cash flow from operations • €1,842 M cash flows generated €M +15.5% 1,842 allowed to cover €961 M 1,595 investments and €348 M dividend payments and €260 M Cash Flow early retirements payments from o
Slide 25: Capex: Organic Growth in Spain and Europe
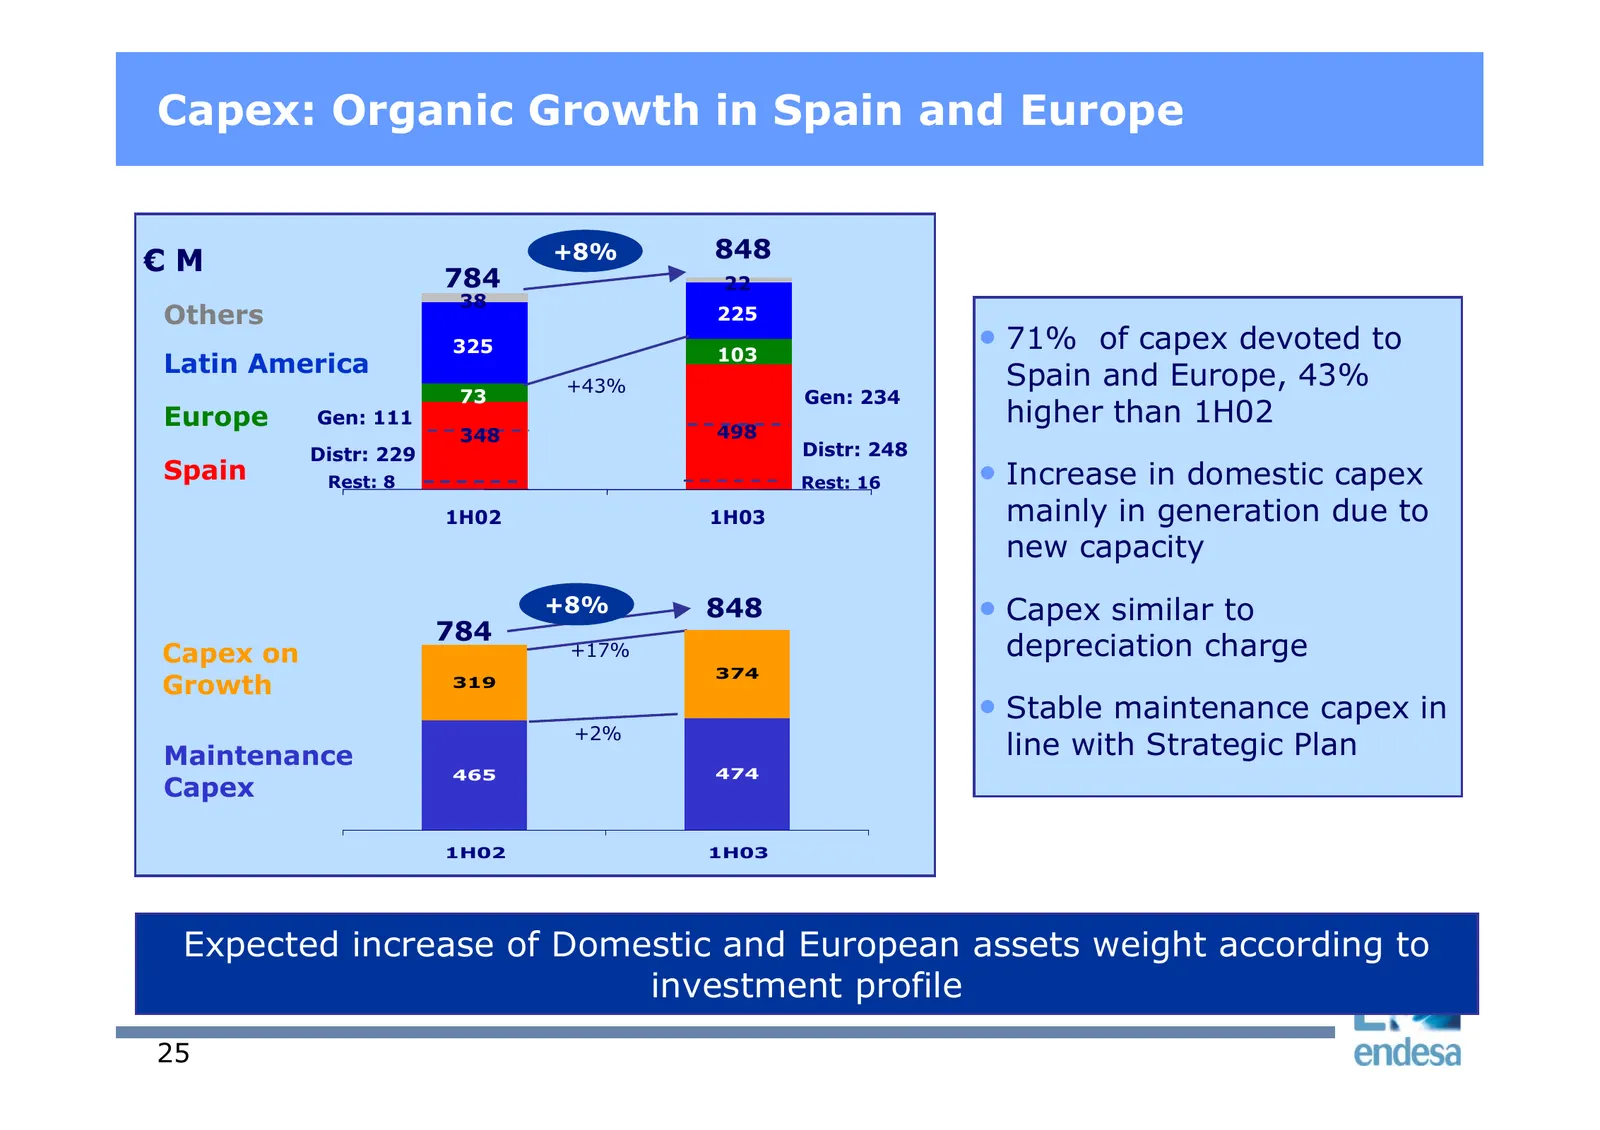
Capex: Organic Growth in Spain and Europe €M +8% 848 784 22 38 Others 225 325 103 • 71% of capex devoted to Latin America Spain and Europe, 43% +43% 73 Gen: 234 Europe Gen: 111 higher than 1H02 348 498 Distr: 229 Distr: 248 Spain Rest: 8 Rest: 16 • Increase in domestic capex 1H02 1H03 mainly in gene
Slide 26: Divestments: Fast Delivery of Divestiture Targets
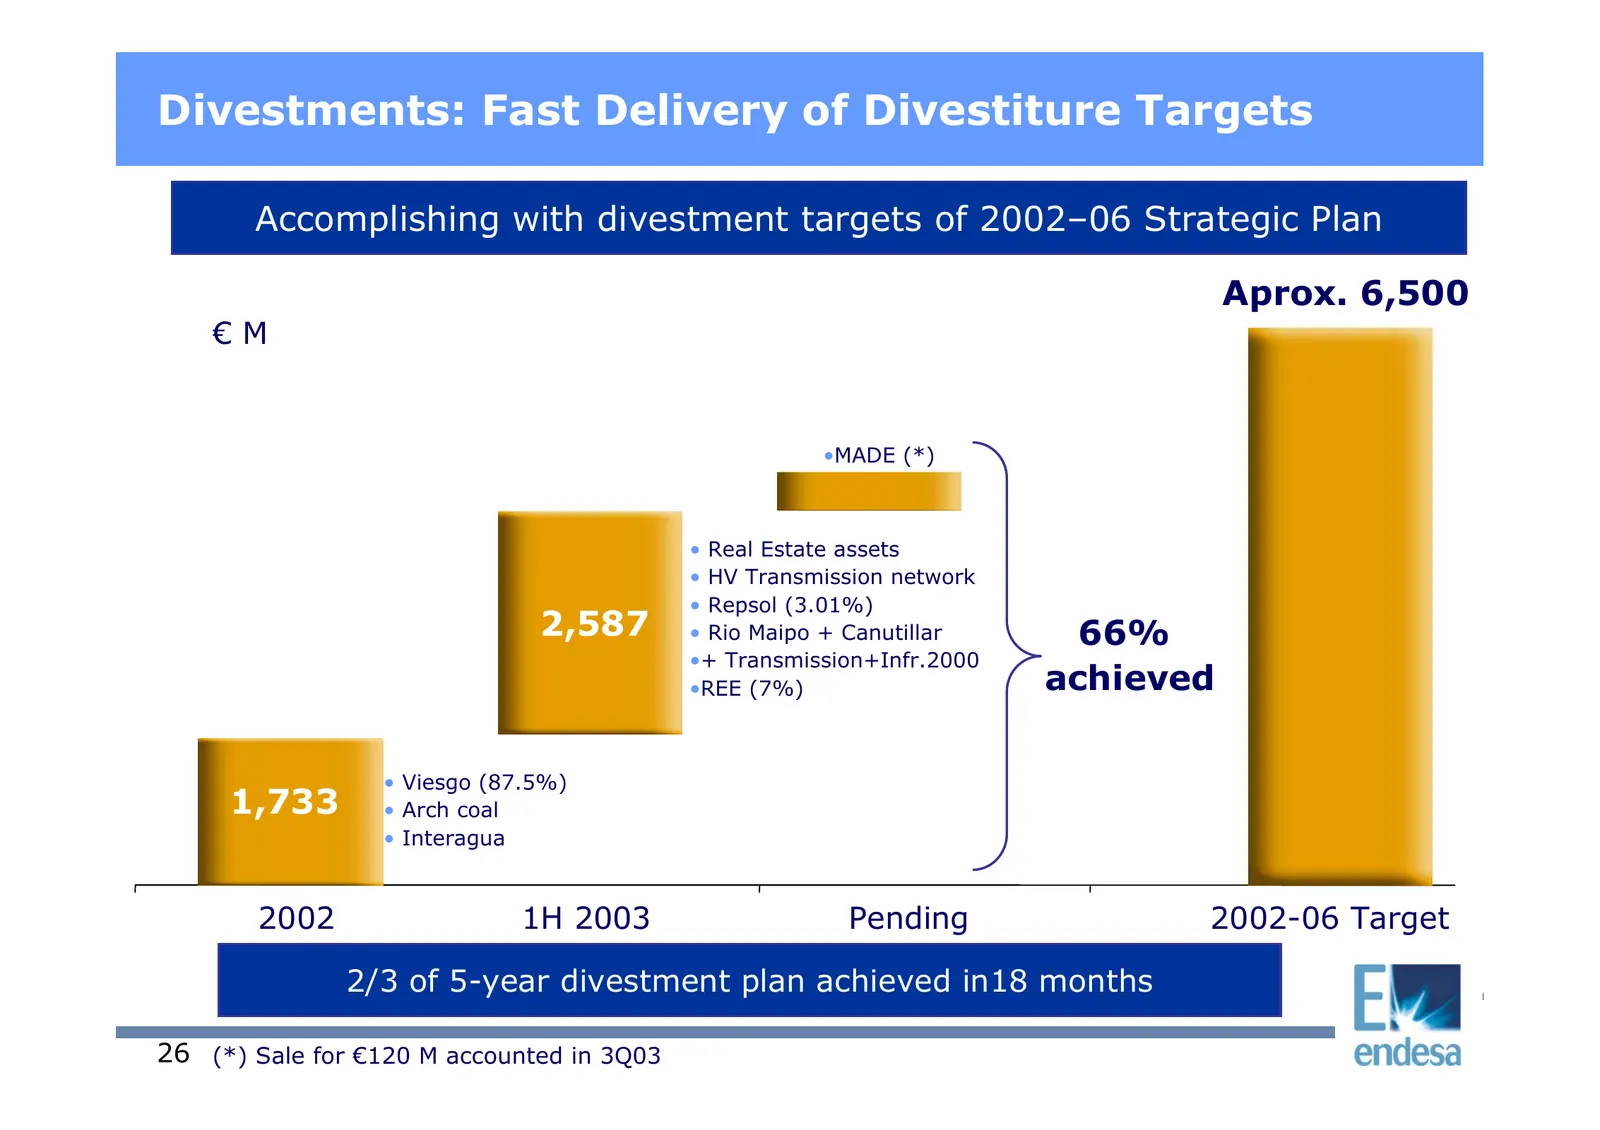
Divestments: Fast Delivery of Divestiture Targets Accomplishing with divestment targets of 2002–06 Strategic Plan Aprox. 6,500 €M •MADE (*) • Real Estate assets • HV Transmission network • Repsol (3.01%) 2,587 • Rio Maipo + Canutillar 66% •+ Transmission+Infr.2000 •REE (7%) achieved • Viesgo (87.5%)
Slide 27: Debt: Additional 20.8% Reduction in 1H03
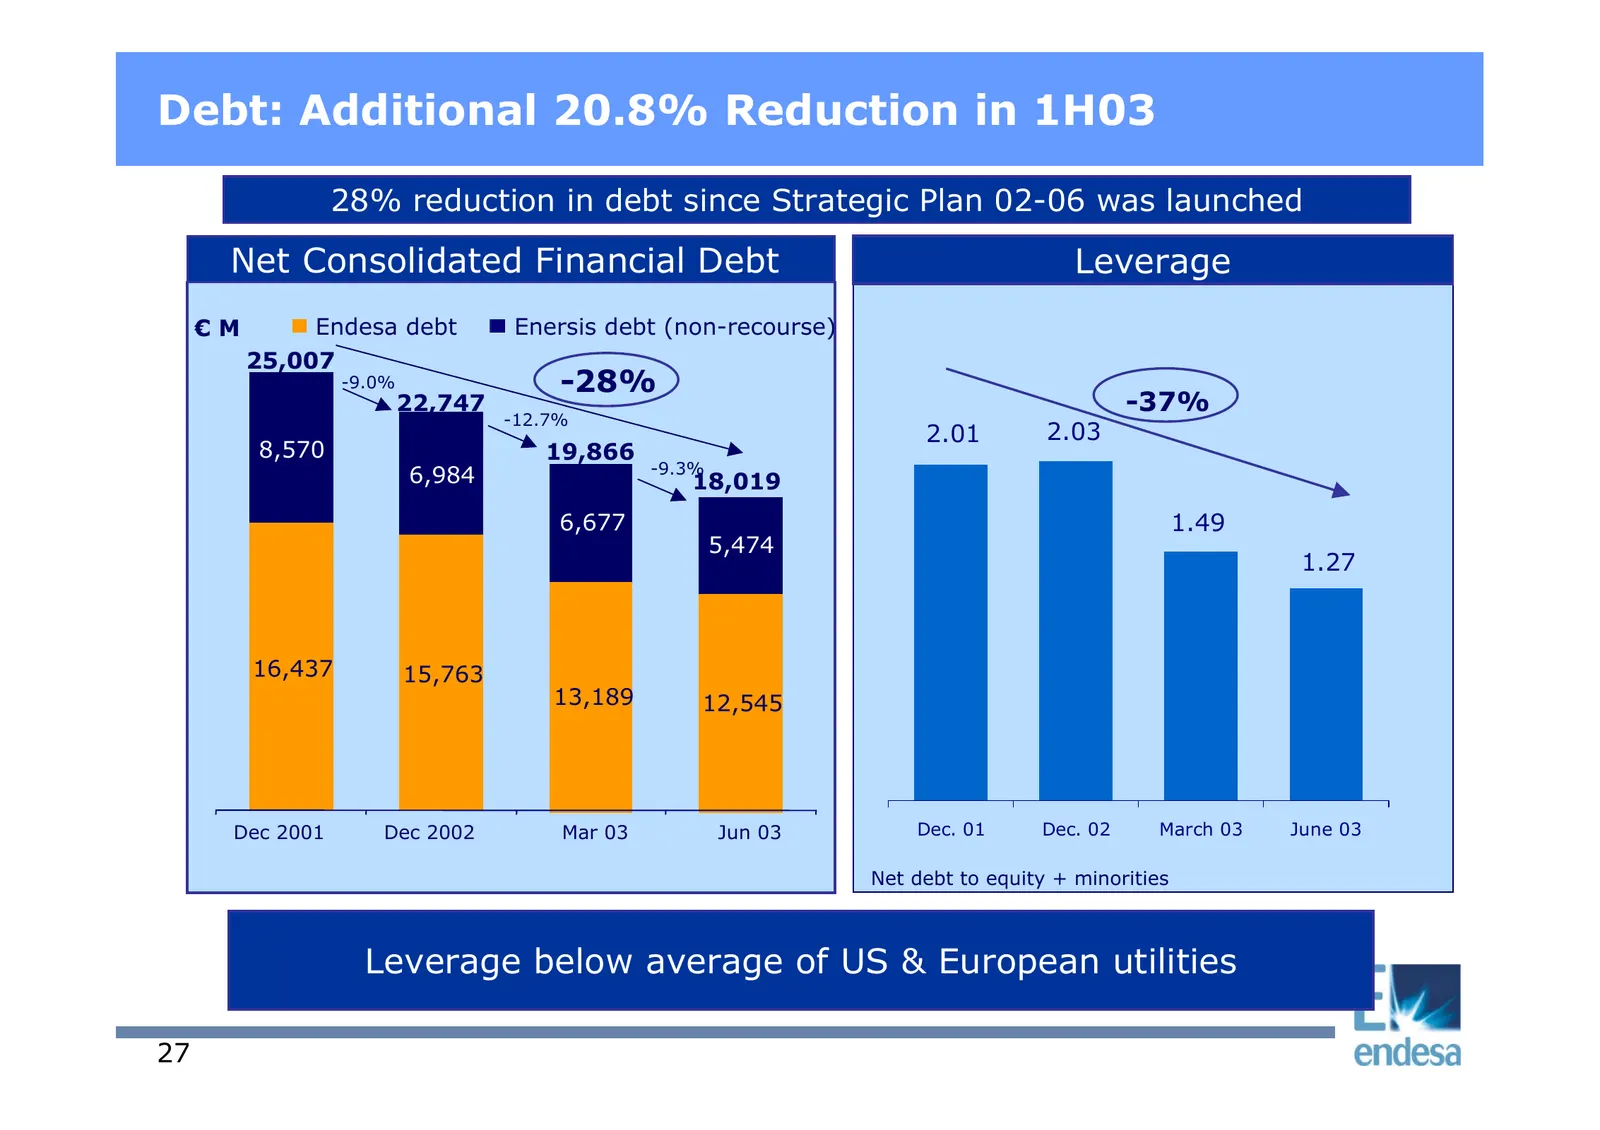
Debt: Additional 20.8% Reduction in 1H03 28% reduction in debt since Strategic Plan 02-06 was launched Net Consolidated Financial Debt Leverage €M Endesa debt Enersis debt (non-recourse) 25,007 -9.0% -28% 22,747 -37% -12.7% 2.01 2.03 8,570 19,866 -9.3% 6,984 18,019 6,677 1.49 5,474 1.27 16,437 15,76
Slide 28: Debt: Proactive Management of Financial Risk
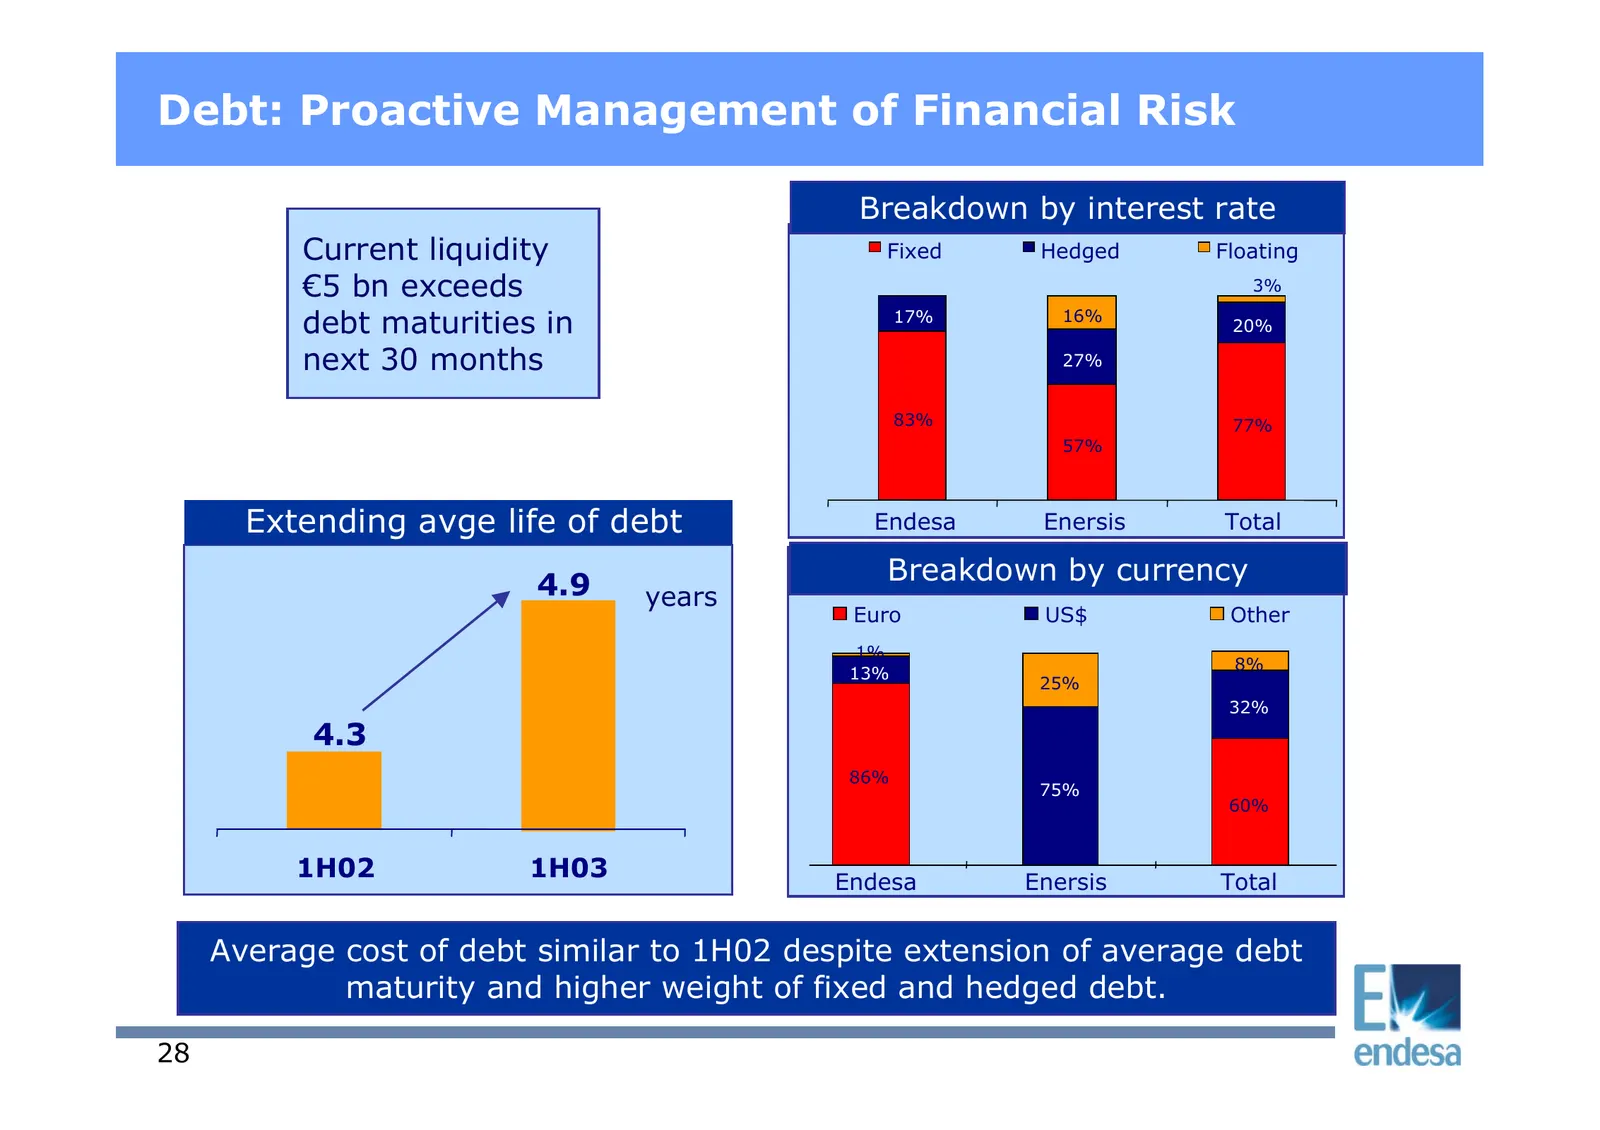
Debt: Proactive Management of Financial Risk Breakdown by interest rate Current liquidity Fixed Hedged Floating €5 bn exceeds 3% debt maturities in 17% 16% 20% next 30 months 27% 83% 77% 57% Extending avge life of debt Endesa Enersis Total 4.9 Breakdown by currency years Euro US$ Other 1% 8% 13% 25%
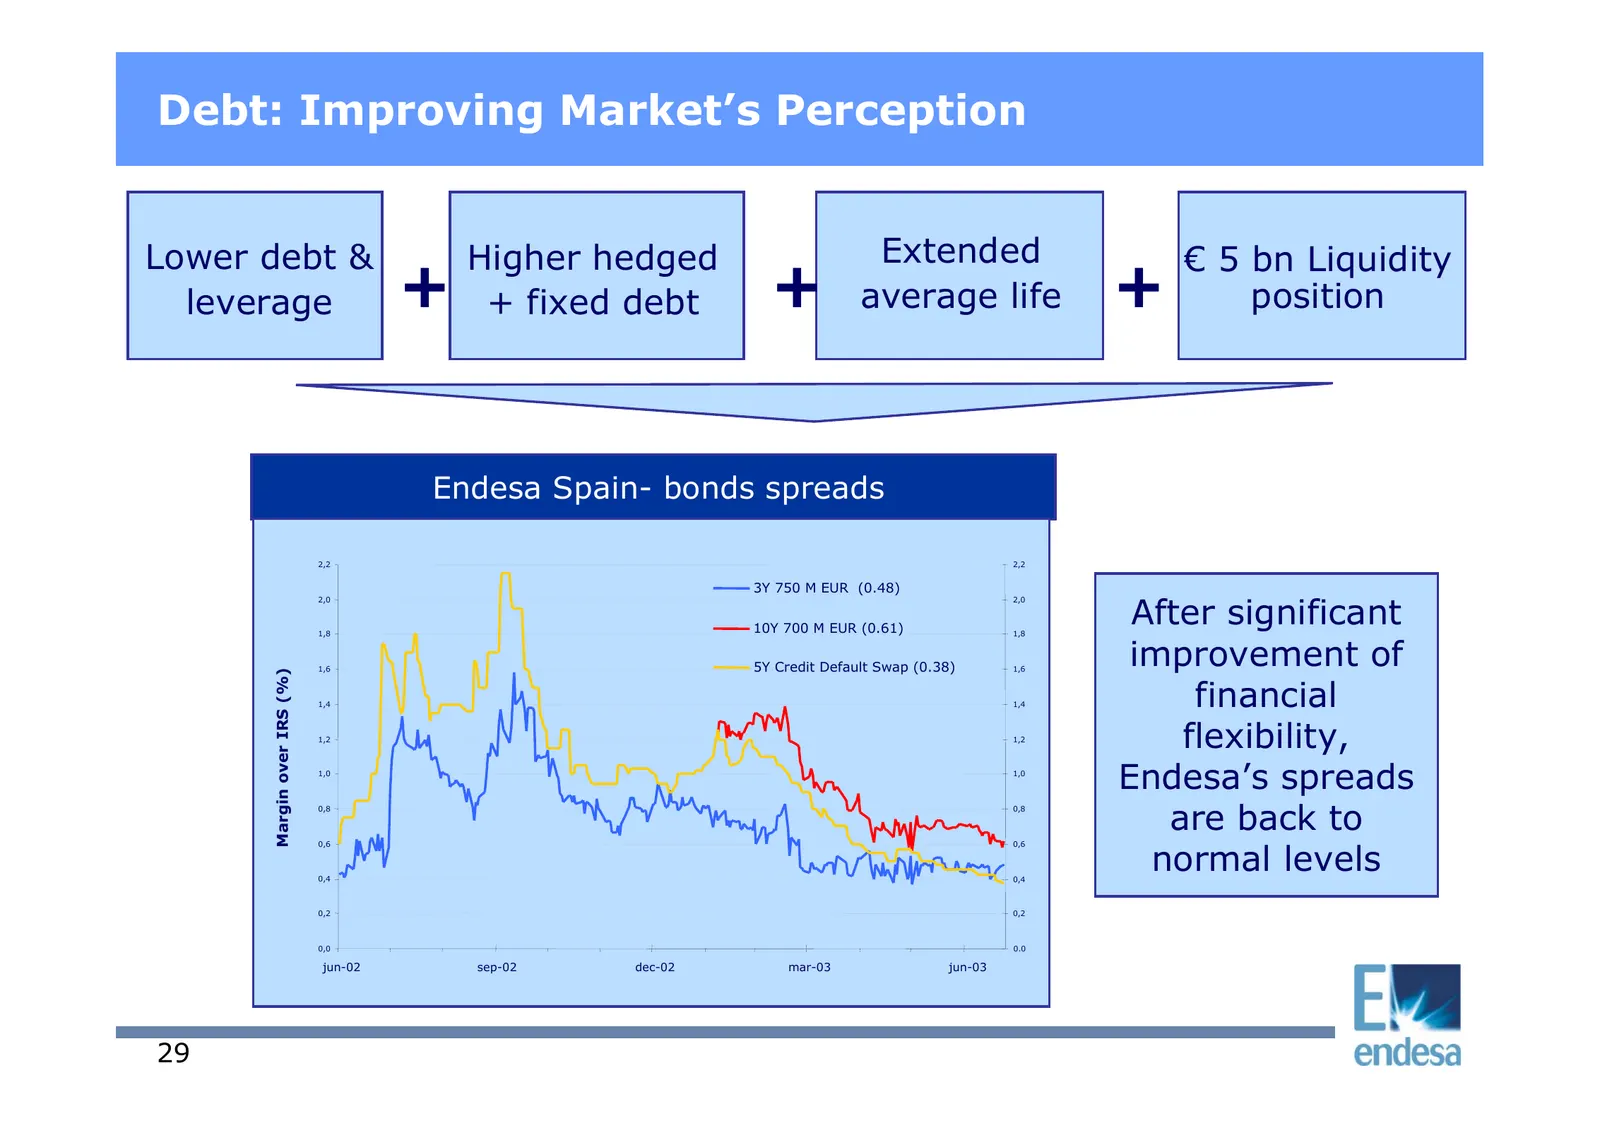
Slide 29: Debt: Improving Market's Perception
Debt: Improving Market’s Perception Lower debt & Higher hedged Extended € 5 bn Liquidity leverage + + fixed debt + average life + position Endesa Spain- bonds spreads 2,2 2,2 3Y 750 M EUR (0.48) After significant 2,0 2,0 1,8 10Y 700 M EUR (0.61) 1,8 1,6 5Y Credit Default Swap (0.38) 1,6 improvement
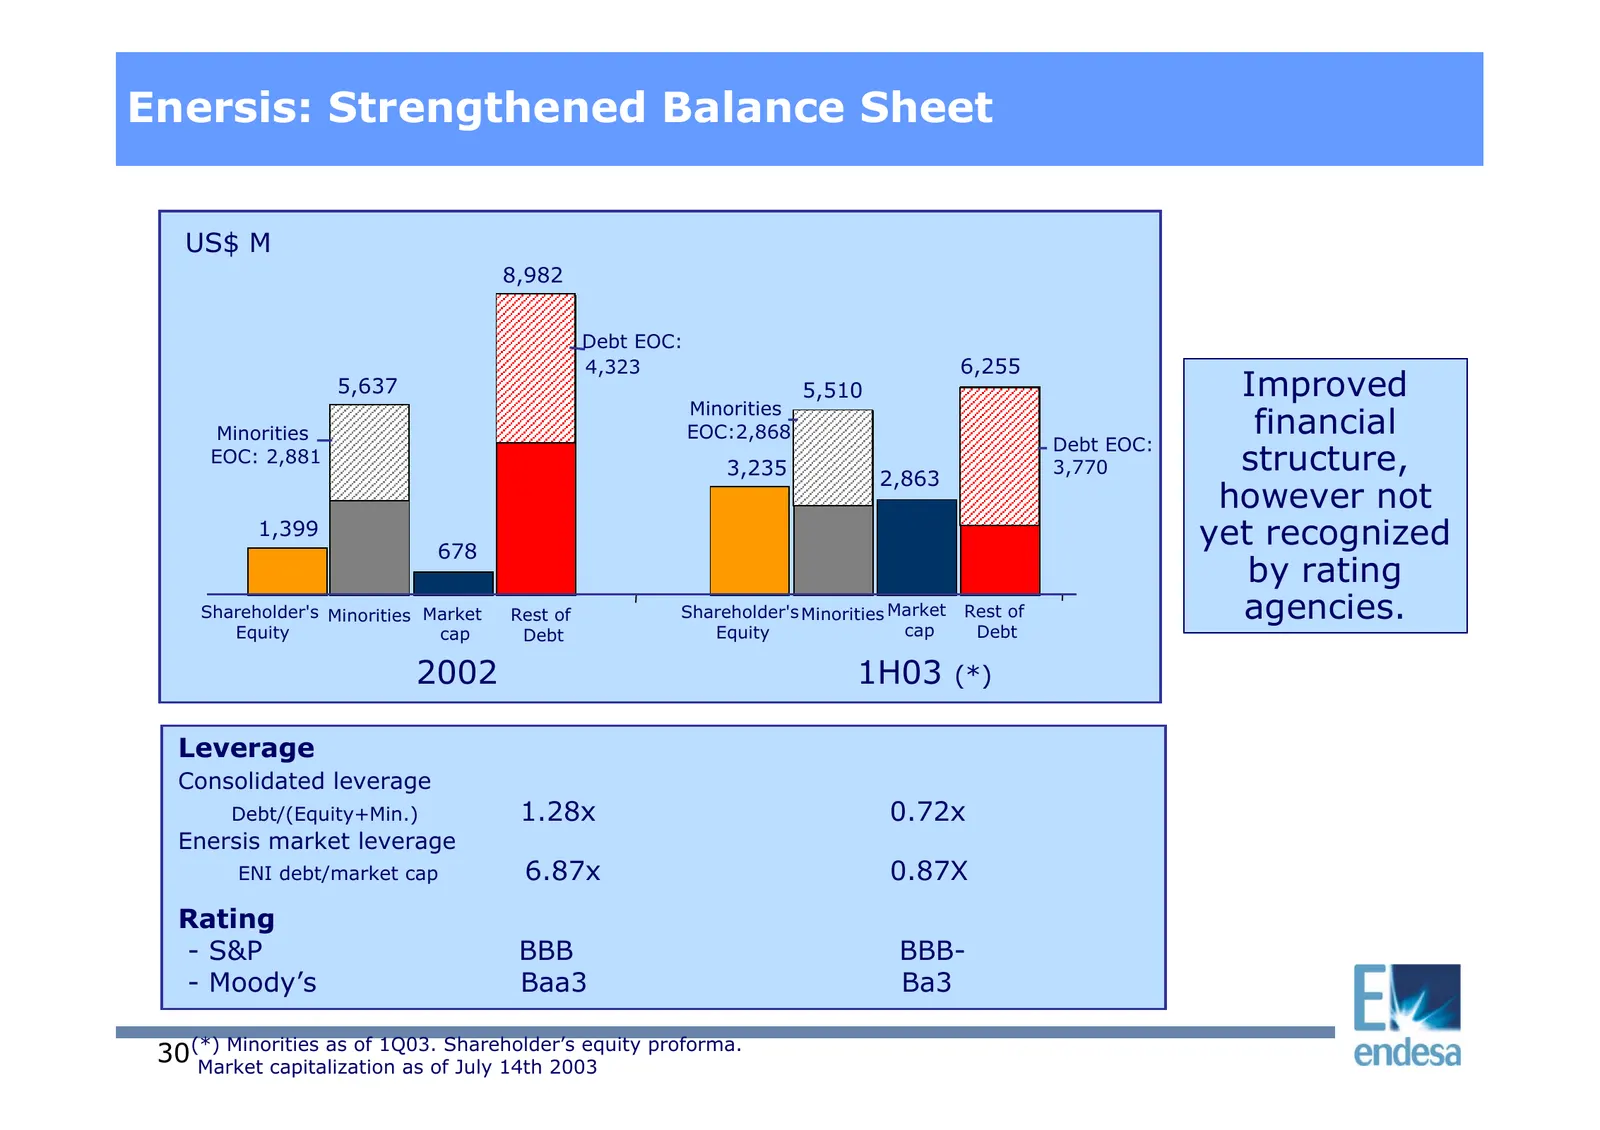
Slide 30: Enersis: Strengthened Balance Sheet
Enersis: Strengthened Balance Sheet US$ M 8,982 Debt EOC: 4,323 6,255 5,637 5,510 Improved Minorities Minorities EOC:2,868 financial Debt EOC: EOC: 2,881 3,235 2,863 3,770 structure, however not 1,399 678 yet recognized by rating Shareholder's Minorities Market Rest of Shareholder's Minorities Marke
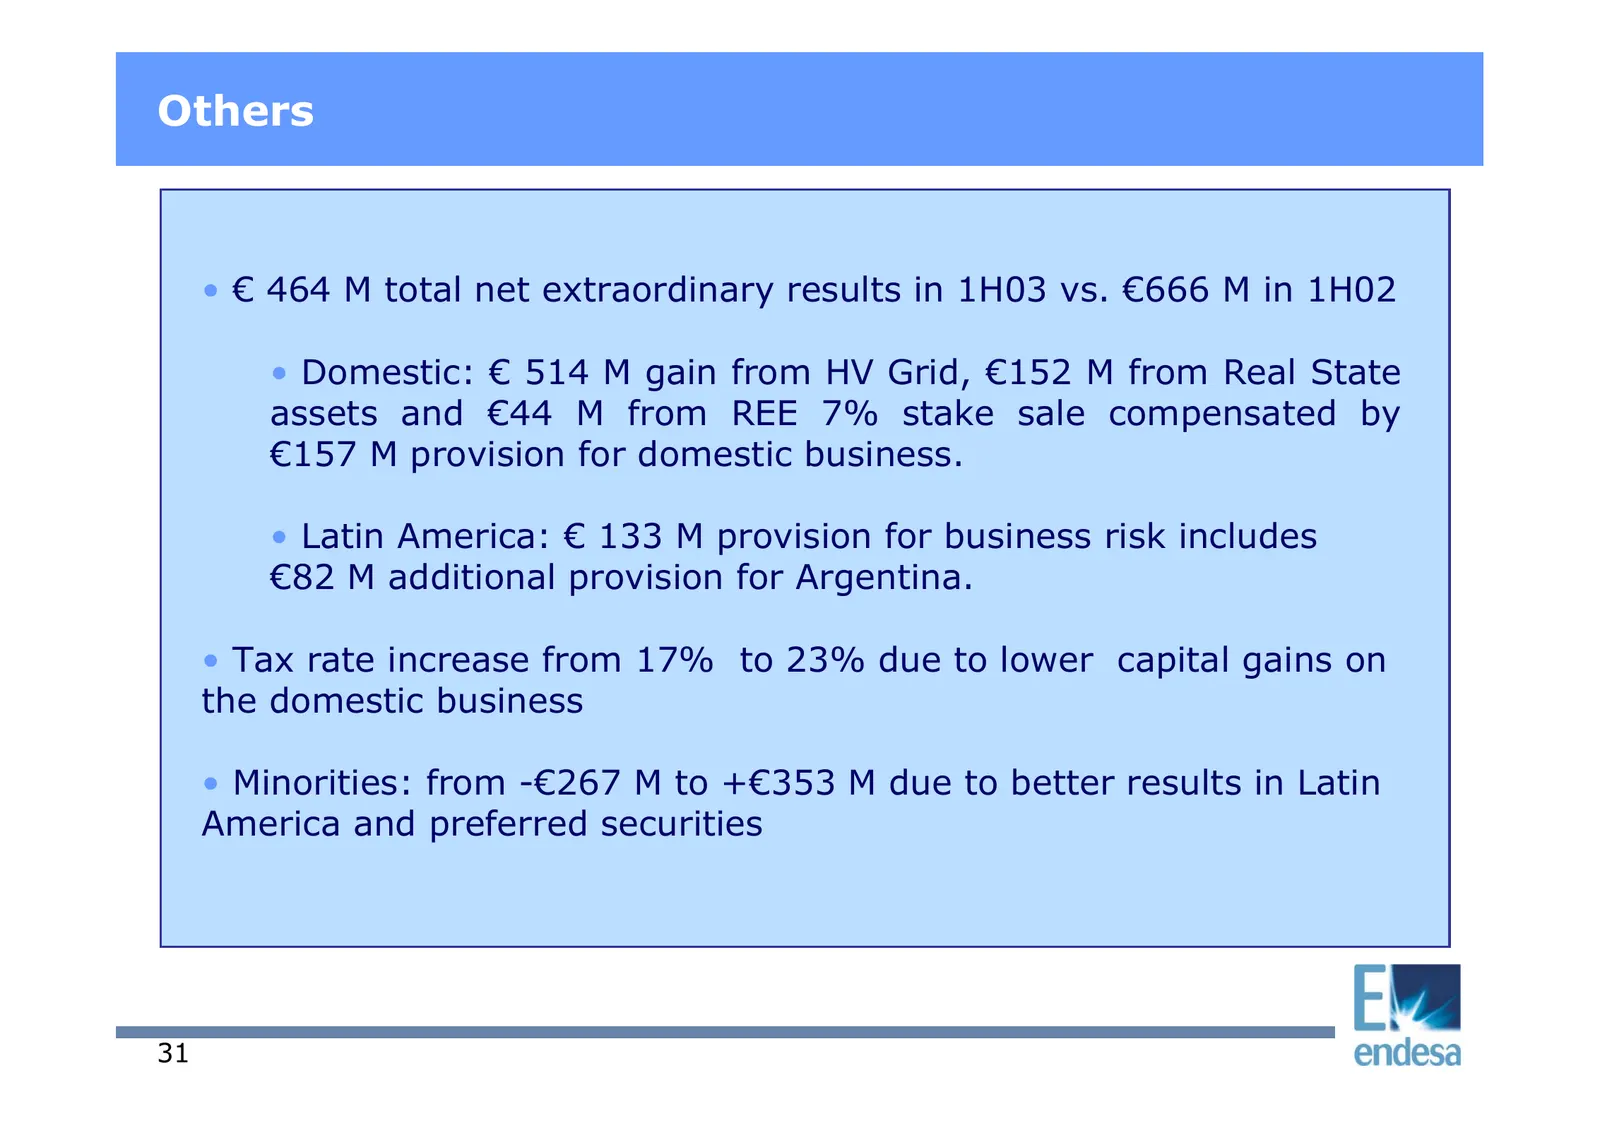
Slide 31: Others
Others • € 464 M total net extraordinary results in 1H03 vs. €666 M in 1H02 • Domestic: € 514 M gain from HV Grid, €152 M from Real State assets and €44 M from REE 7% stake sale compensated by €157 M provision for domestic business. • Latin America: € 133 M provision for business risk includes €82 M
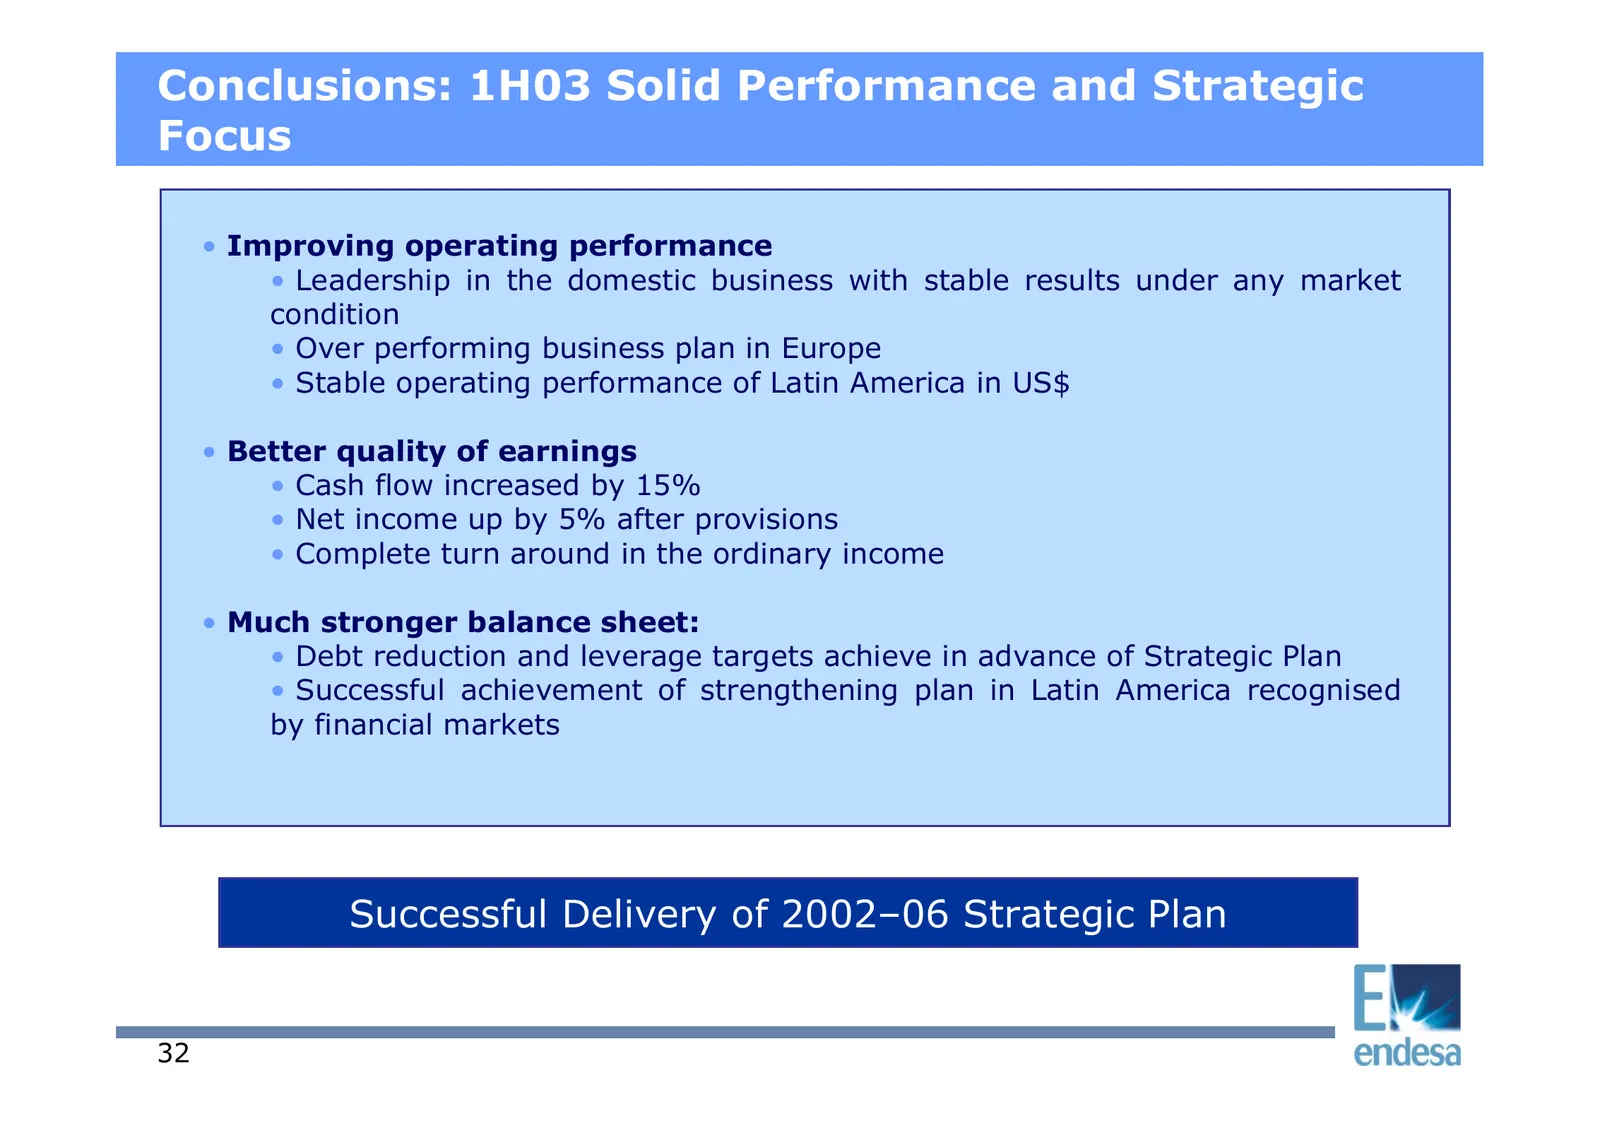
Slide 32: Conclusions: 1H03 Solid Performance and Strategic Focus
Conclusions: 1H03 Solid Performance and Strategic Focus • Improving operating performance • Leadership in the domestic business with stable results under any market condition • Over performing business plan in Europe • Stable operating performance of Latin America in US$ • Better quality of earnings
Slide 33: Appendix
By endesa Appendix July 2003 By eee 33 endesa
Slide 34: Highlights for 1H 2003
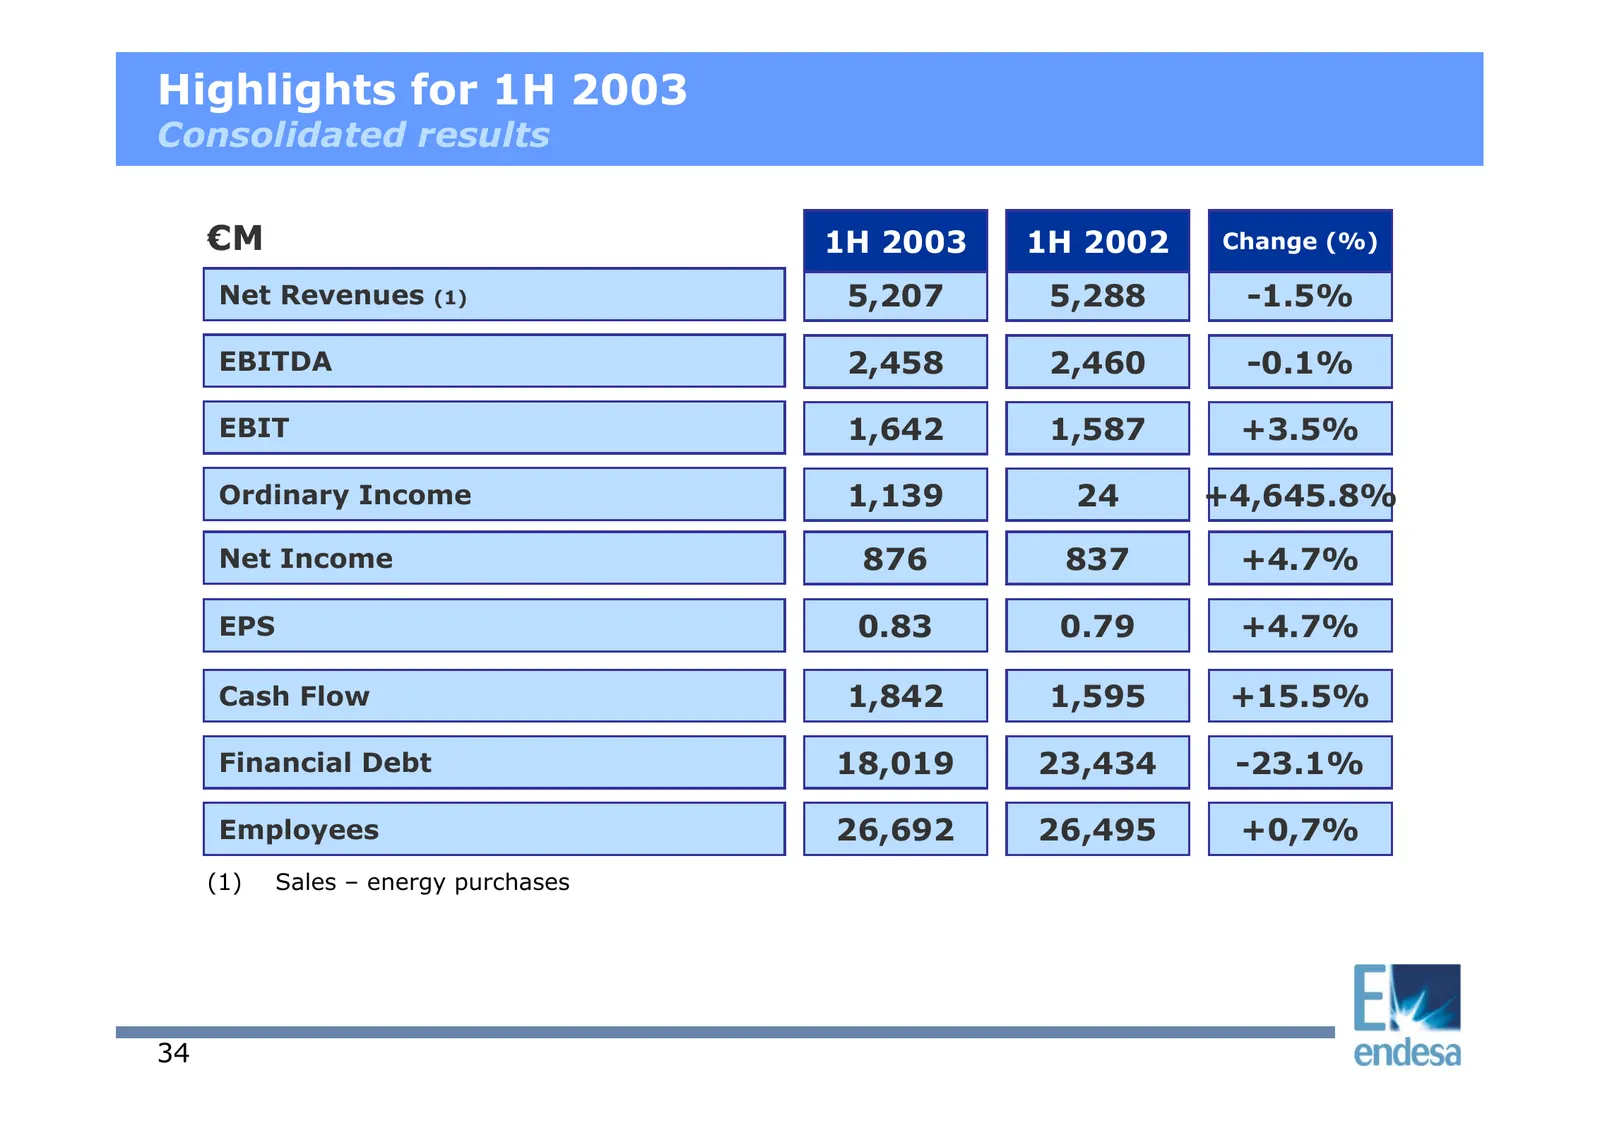
Highlights for 1H 2003 Consolidated results €M 1H 2003 1H 2002 Change (%) Net Revenues (1) 5,207 5,288 -1.5% EBITDA 2,458 2,460 -0.1% EBIT 1,642 1,587 +3.5% Ordinary Income 1,139 24 +4,645.8% Net Income 876 837 +4.7% EPS 0.83 0.79 +4.7% Cash Flow 1,842 1,595 +15.5% Financial Debt 18,019 23,434 -23.1
Slide 35: Highlights for 1H 2003: Breakdown by line of business
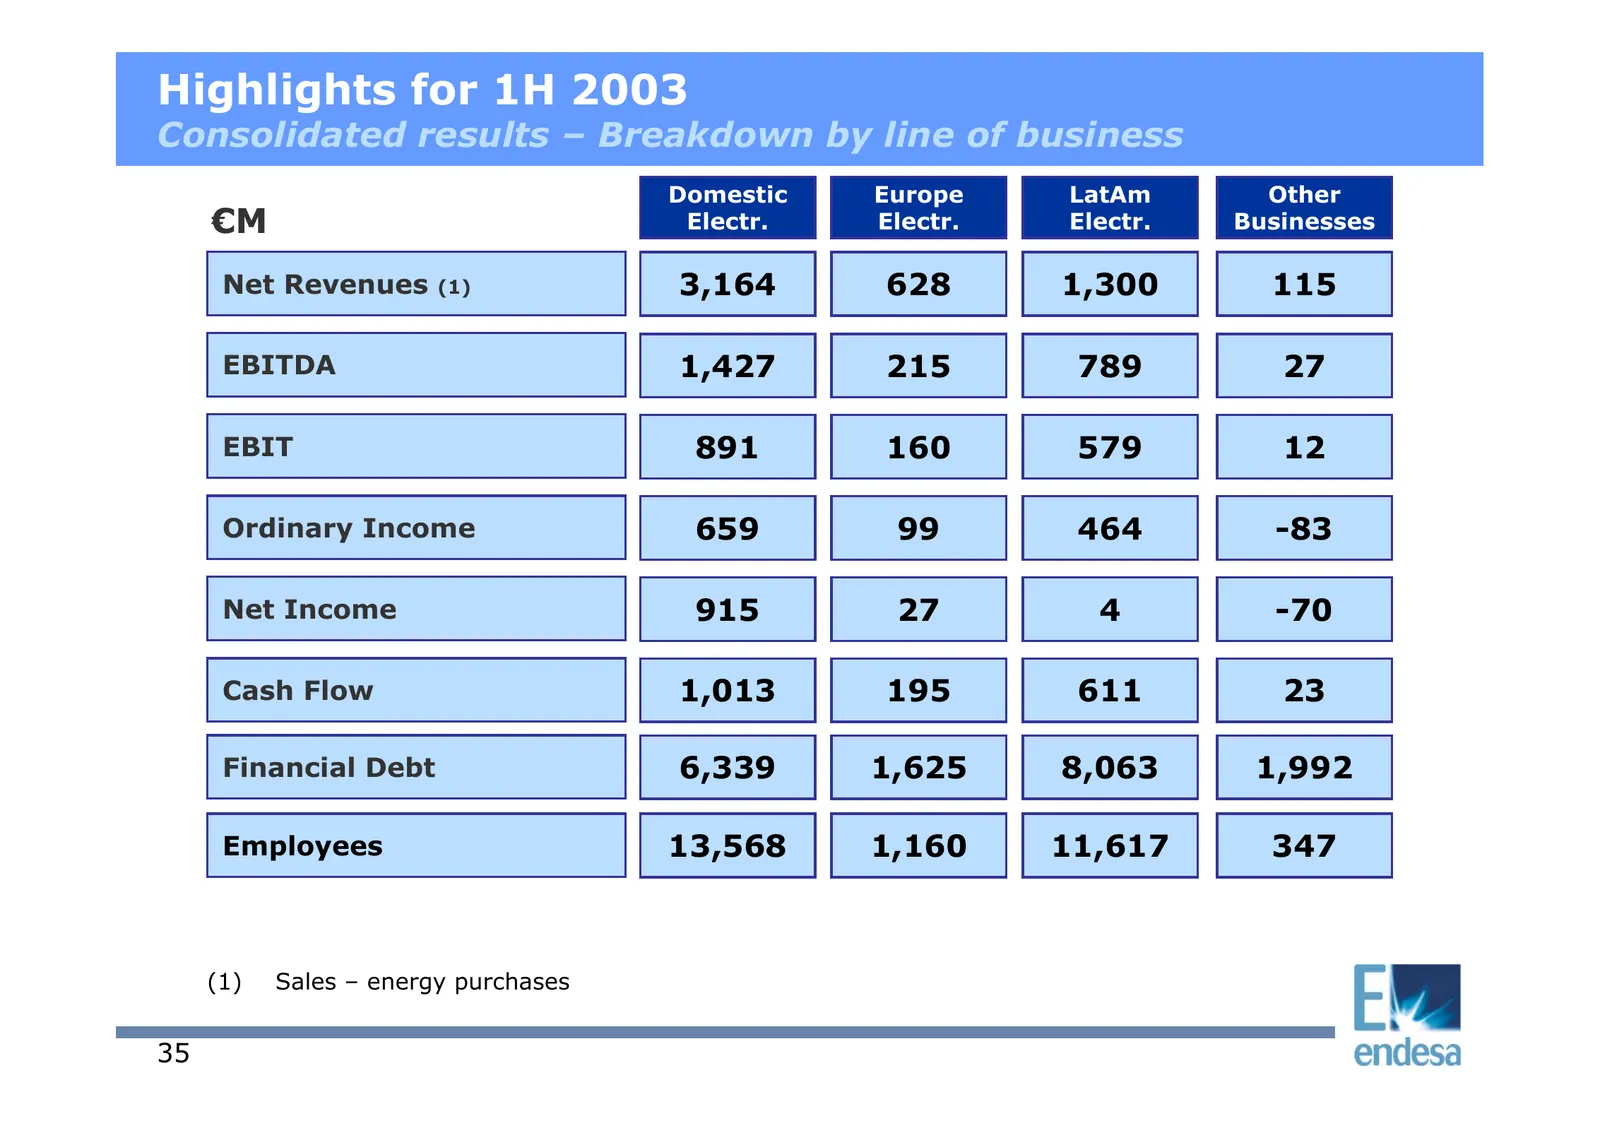
Highlights for 1H 2003 Consolidated results – Breakdown by line of business Domestic Europe LatAm Other €M Electr. Electr. Electr. Businesses Net Revenues (1) 3,164 628 1,300 115 EBITDA 1,427 215 789 27 EBIT 891 160 579 12 Ordinary Income 659 99 464 -83 Net Income 915 27 4 -70 Cash Flow 1,013 195 61
Slide 36: Forward-looking Statements
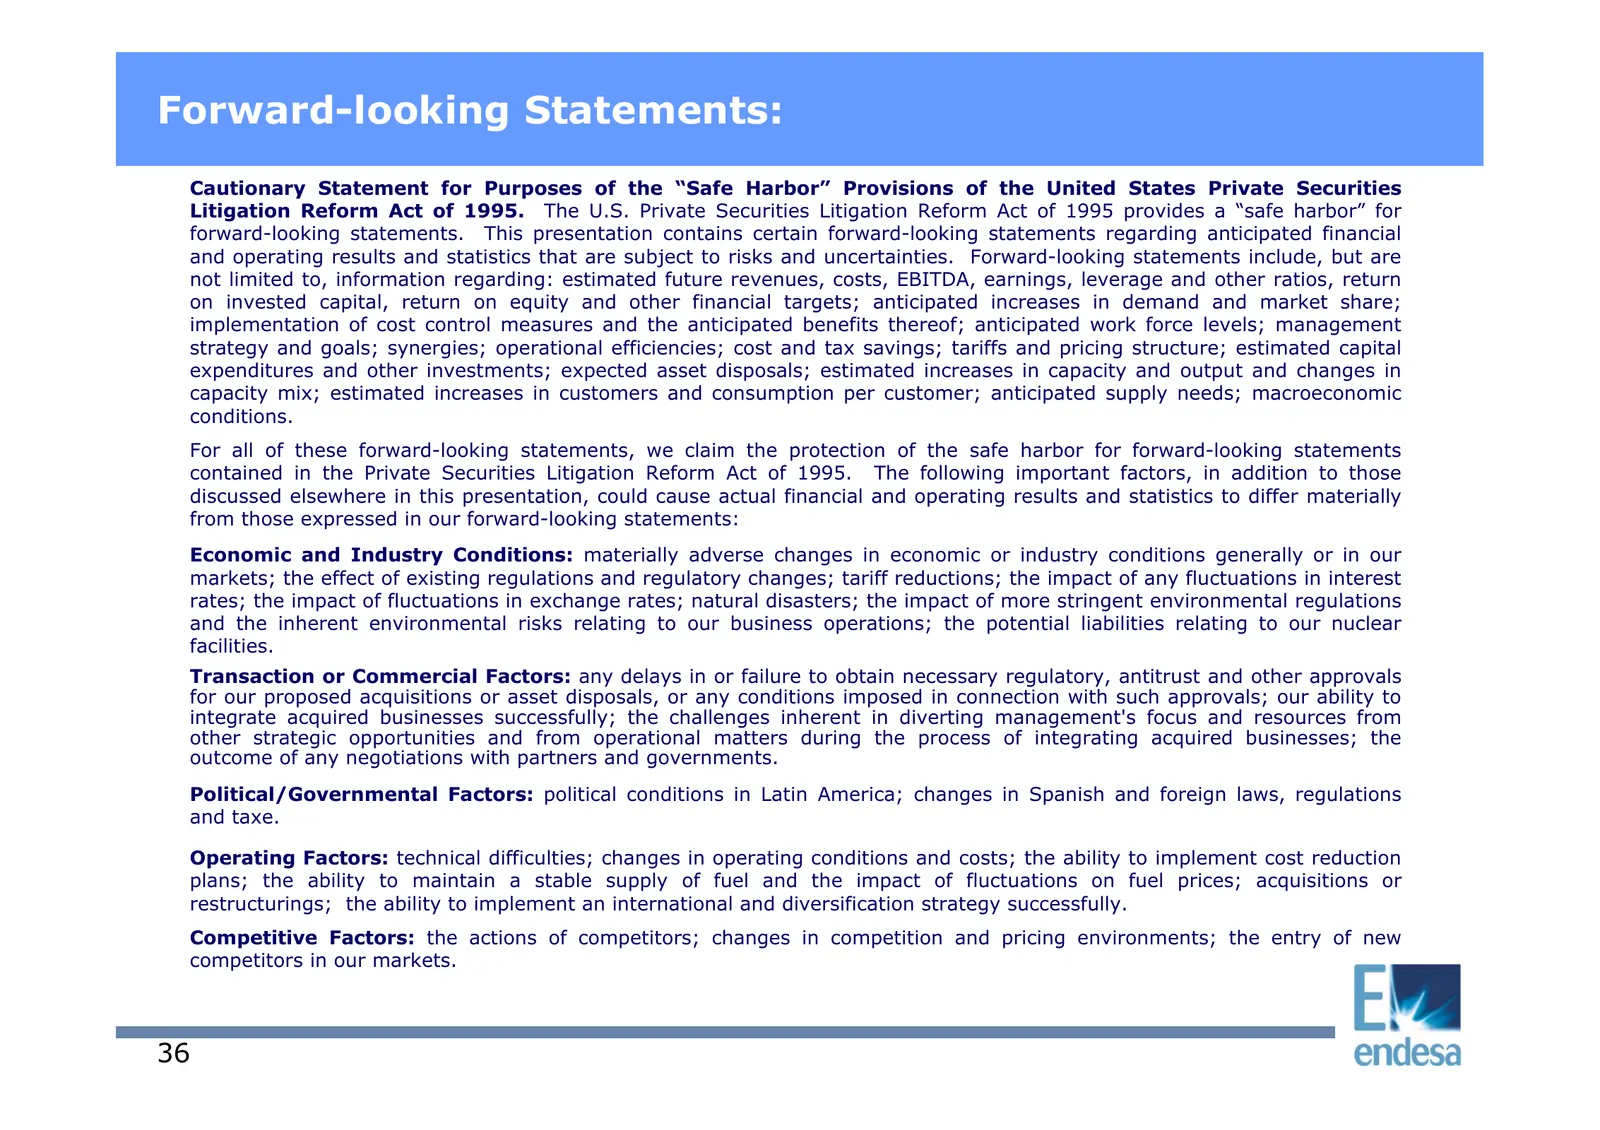
Forward-looking Statements: Cautionary Statement for Purposes of the “Safe Harbor” Provisions of the United States Private Securities Litigation Reform Act of 1995. The U.S. Private Securities Litigation Reform Act of 1995 provides a “safe harbor” for forward-looking statements. This presentation co
Slide 37: 2003 First Half Results
2003 First Half Results July 2003 37
Source: Internet Archive copy of endesa.com
More decks from Endesa S.A.
 9M 2026 Earnings Presentation28 slides · Oct 28, 2026
 H1 2026 Earnings Presentation30 slides · Jul 29, 2026
 H1 2026 Earnings Presentation30 slides · Jul 29, 2026
 Q1 2026 Earnings Presentation27 slides · May 6, 2026
 Q1 2026 Earnings Presentation27 slides · May 6, 2026
 Investor Day (February 2026)49 slides · Feb 24, 2026