Curo — Stephens Annual Investor Conference 2020
38 slides from Curo's conference presentation, Nov 16, 2020

Slide 1: November 2020 Stephens Annual Investor Conference
November 2020 Stephens Annual Investor Conference
Slide 2: Disclaimer
Disclaimer IMPORTANT: You must read the following information before continuing to the rest of the presentation, which is being provided to you for informational purposes only. Forward-Looking Statements This presentation contains forward-looking statements. These forward-looking statements include

Slide 3: Company Introduction
Company Introduction 3
Slide 4: Serving the Evolving Needs of the Non-Prime Customer
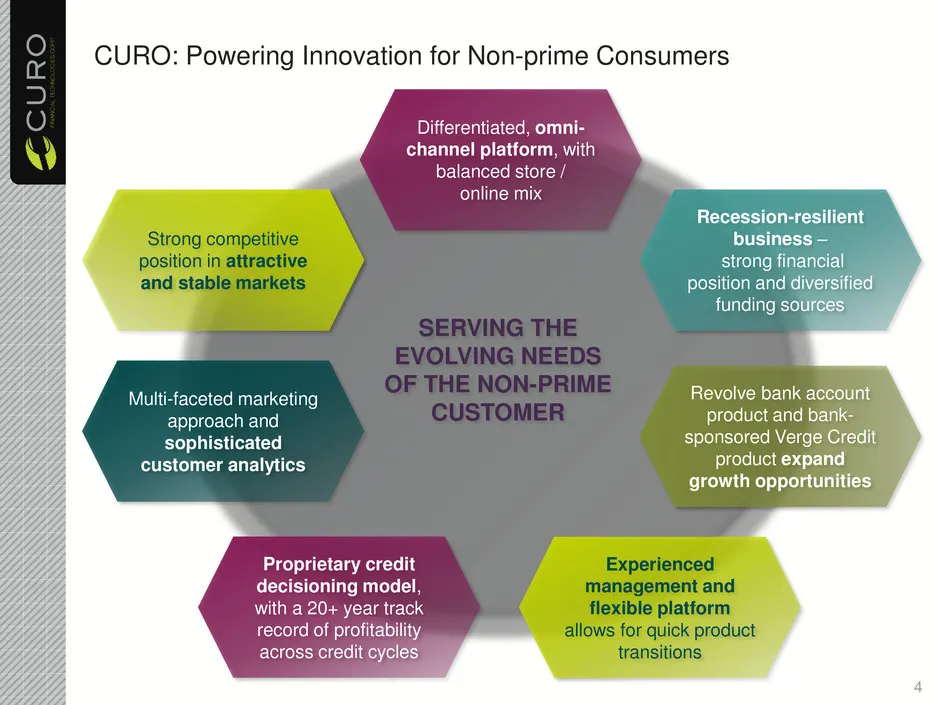
SERVING THE EVOLVING NEEDS OF THE NON-PRIME CUSTOMER CURO: Powering Innovation for Non-prime Consumers Differentiated, omni- channel platform, with balanced store / online mix Recession-resilient business – strong financial position and diversified funding sources Proprietary credit decisioning mode
Slide 5: CURO at a Glance
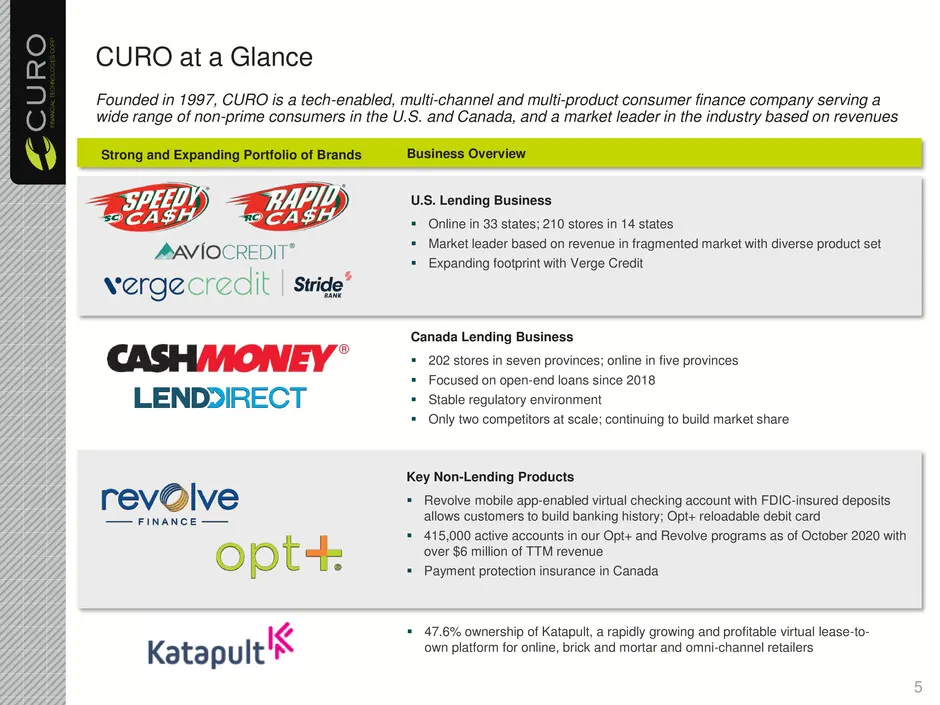
CURO at a Glance Founded in 1997, CURO is a tech-enabled, multi-channel and multi-product consumer finance company serving a wide range of non-prime consumers in the U.S. and Canada, and a market leader in the industry based on revenues Canada Lending Business 202 stores in seven provinces; online
Slide 6: CURO's Place in the Alternative Financial Product Market
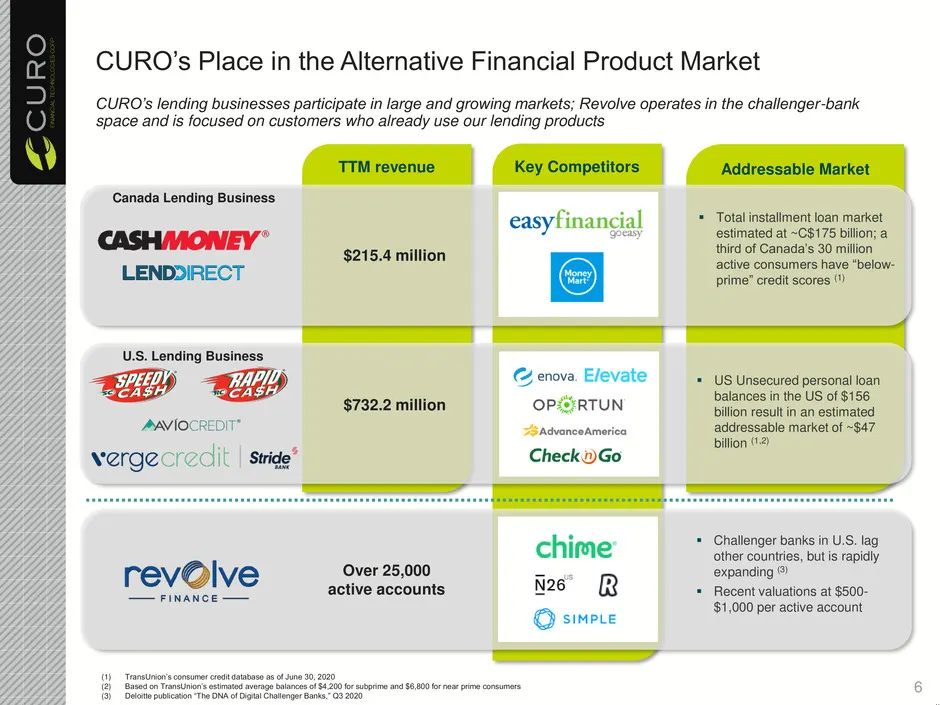
Addressable MarketKey CompetitorsTTM revenue CURO’s Place in the Alternative Financial Product Market CURO’s lending businesses participate in large and growing markets; Revolve operates in the challenger-bank space and is focused on customers who already use our lending products 6 $215.4 million
Slide 7: Comprehensive Product Offerings and Diversified Revenue
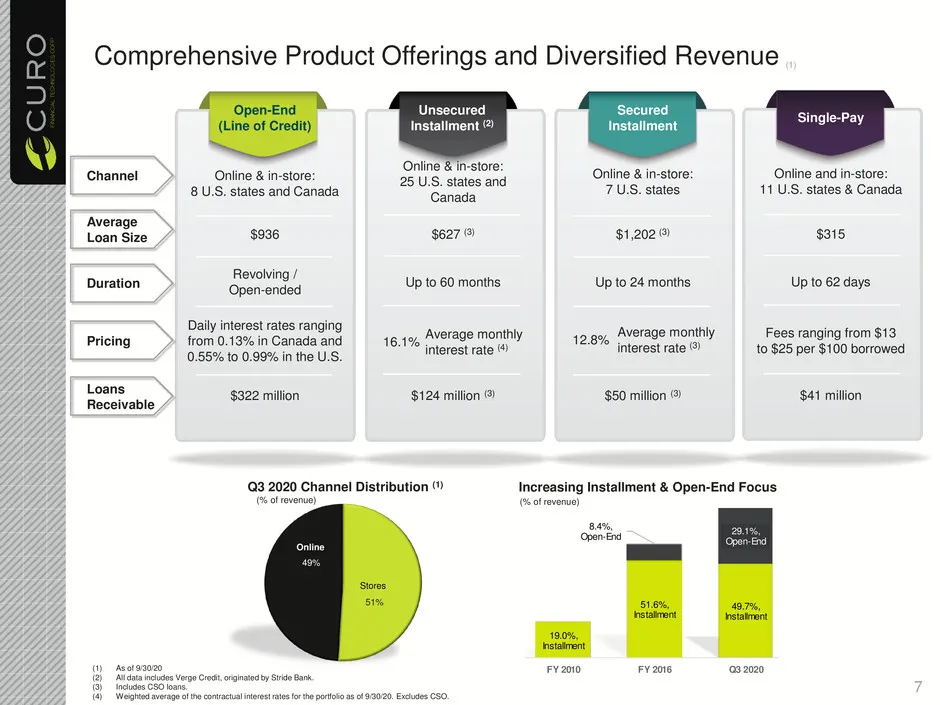
Comprehensive Product Offerings and Diversified Revenue (1) (1) As of 9/30/20 (2) All data includes Verge Credit, originated by Stride Bank. (3) Includes CSO loans. (4) Weighted average of the contractual interest rates for the portfolio as of 9/30/20. Excludes CSO. Q3 2020 Channel Distribution (1)
Slide 8: Drive Channel, Product and Geographic Diversification
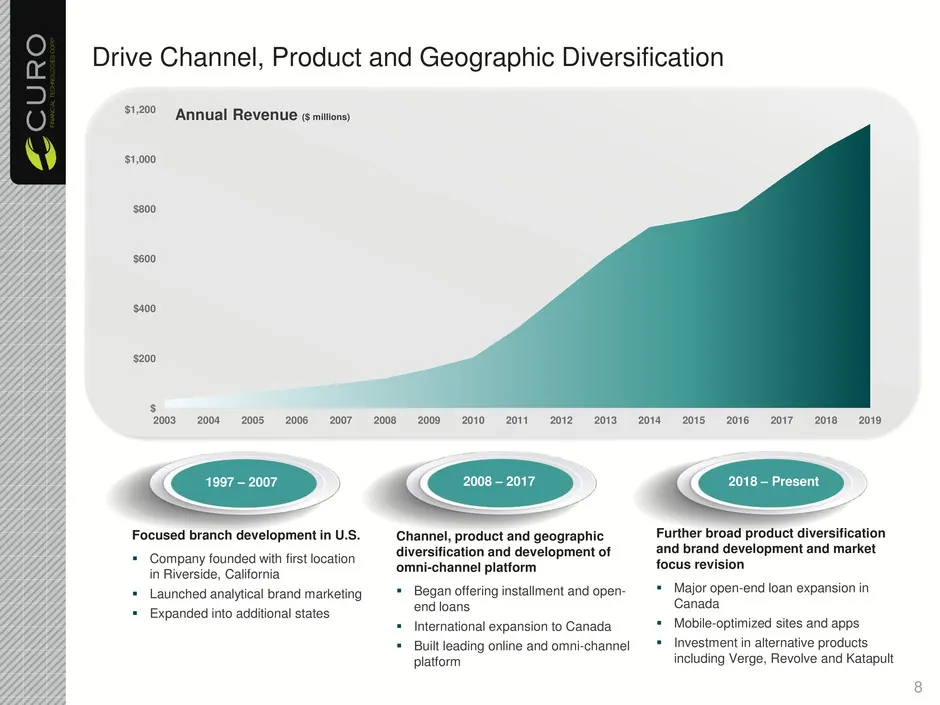
$ $200 $400 $600 $800 $1,000 $1,200 2003 2004 2005 2006 2007 2008 2009 2010 2011 2012 2013 2014 2015 2016 2017 2018 2019 Drive Channel, Product and Geographic Diversification 1997 – 2007 2008 – 2017 2018 – Present Annual Revenue ($ millions) Focused branch development in U.S. Company founded with
Slide 9: Evolving Geographic and Product Mix
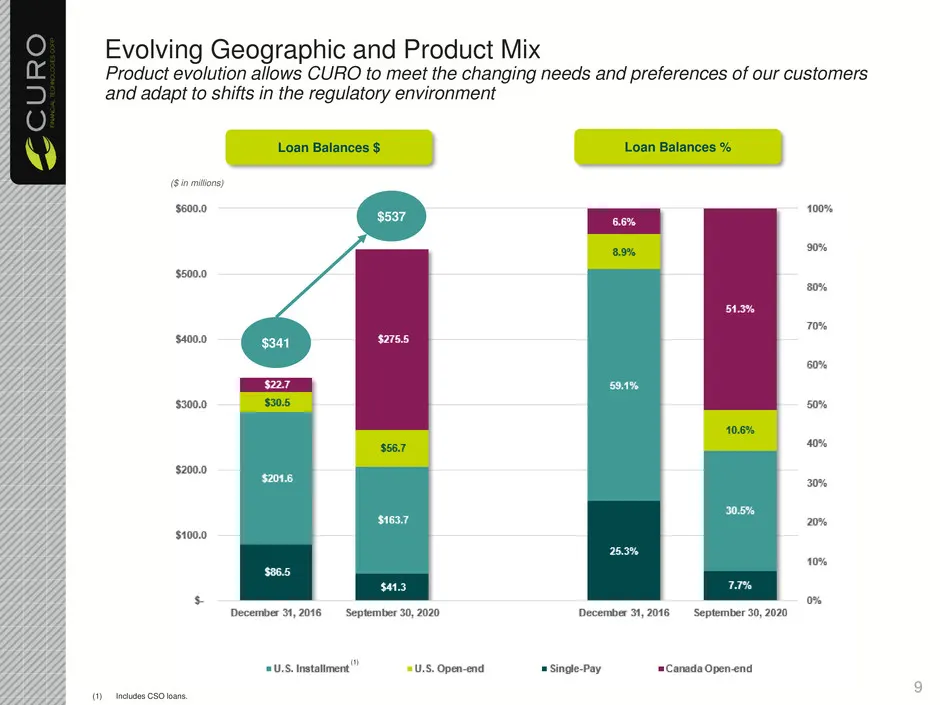
Evolving Geographic and Product Mix Product evolution allows CURO to meet the changing needs and preferences of our customers and adapt to shifts in the regulatory environment Loan Balances $ Loan Balances % $341 $537 ($ in millions) 9 (1) (1) Includes CSO loans.
Slide 10: Evolving Geographic, Channel and Product Mix
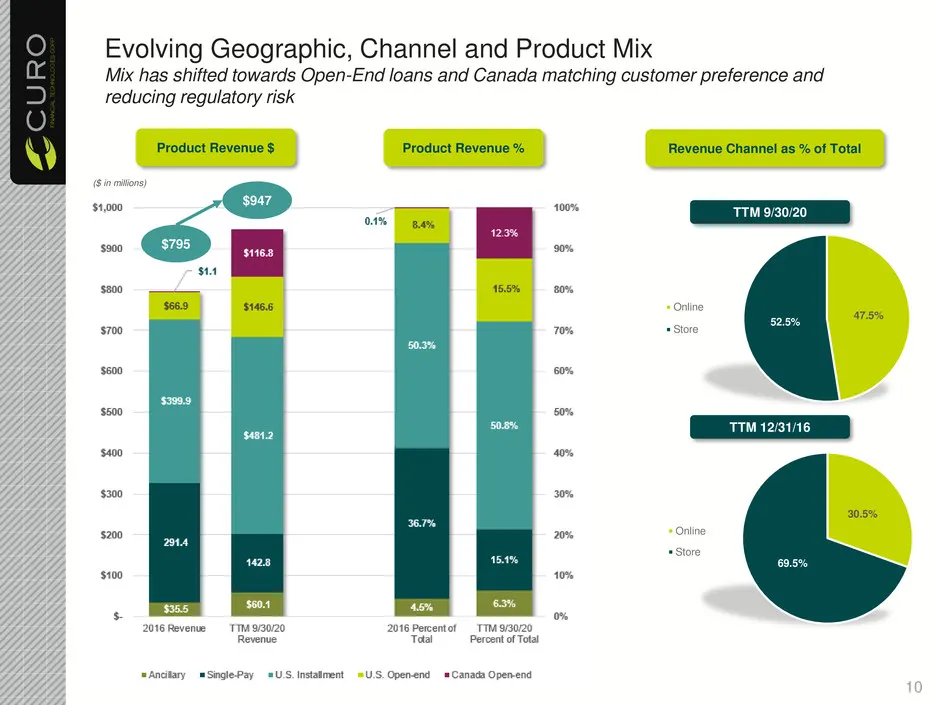
Evolving Geographic, Channel and Product Mix Mix has shifted towards Open-End loans and Canada matching customer preference and reducing regulatory risk Product Revenue $ Product Revenue % $795 $947 ($ in millions) 10 Revenue Channel as % of Total TTM 9/30/20 TTM 12/31/16 47.5% 52.5% Online Store 30
Slide 11: Canadian Product Mix Shift Creates Value
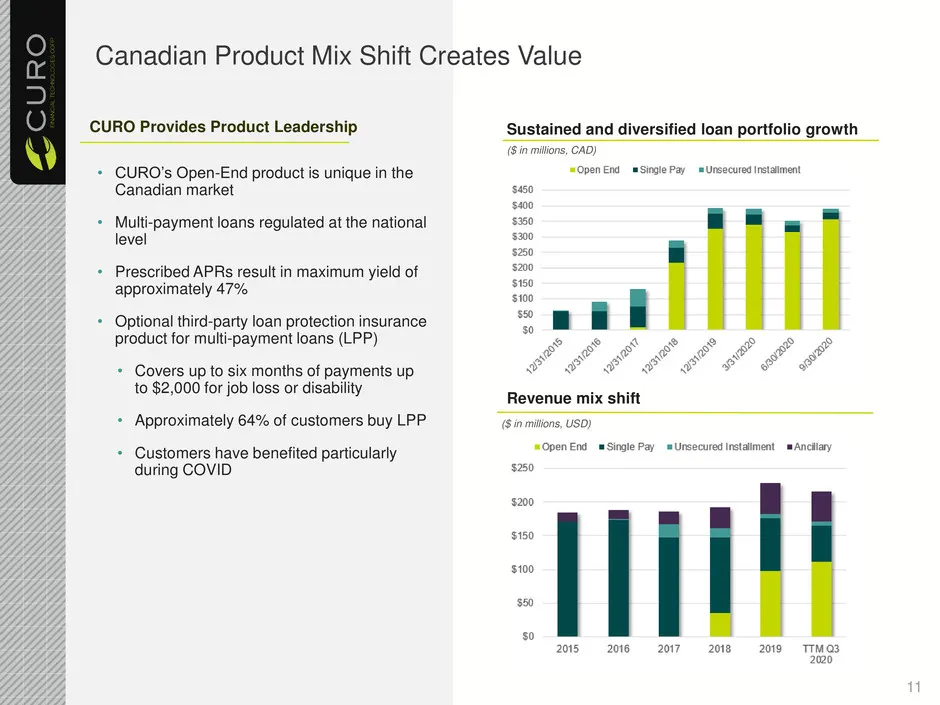
Canadian Product Mix Shift Creates Value • CURO’s Open-End product is unique in the Canadian market • Multi-payment loans regulated at the national level • Prescribed APRs result in maximum yield of approximately 47% • Optional third-party loan protection insurance product for multi-payment loans (L
Slide 12: Comparative Value in Canadian Market
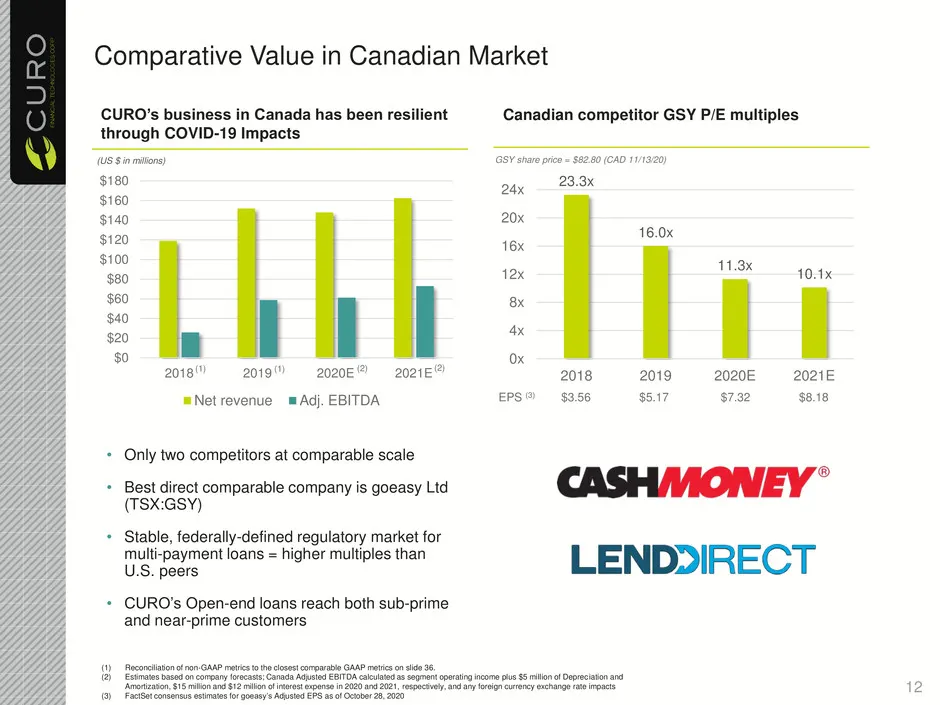
Comparative Value in Canadian Market CURO’s business in Canada has been resilient through COVID-19 Impacts Canadian competitor GSY P/E multiples (US $ in millions) • Only two competitors at comparable scale • Best direct comparable company is goeasy Ltd (TSX:GSY) • Stable, federally-defined regulato
Slide 13: Execute on New Growth Opportunities
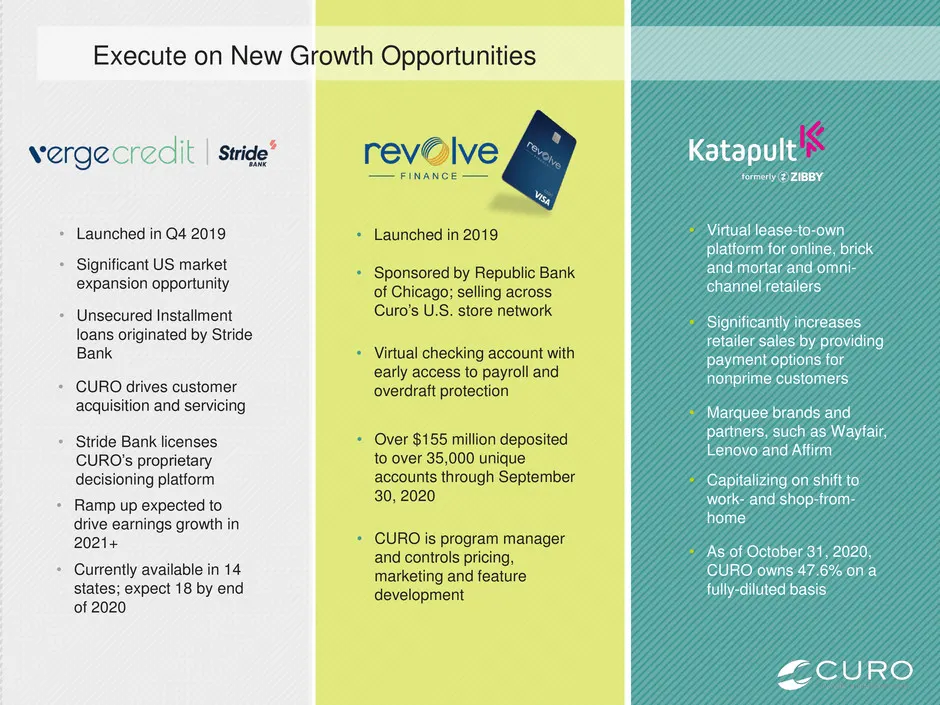
• Virtual lease-to-own platform for online, brick and mortar and omni- channel retailers • Significantly increases retailer sales by providing payment options for nonprime customers • Marquee brands and partners, such as Wayfair, Lenovo and Affirm Execute on New Growth Opportunities • Launched in 20

Slide 14: Market Overview
Market Overview 14
Slide 15: The U.S. Personal Loan Market is Large and Growing
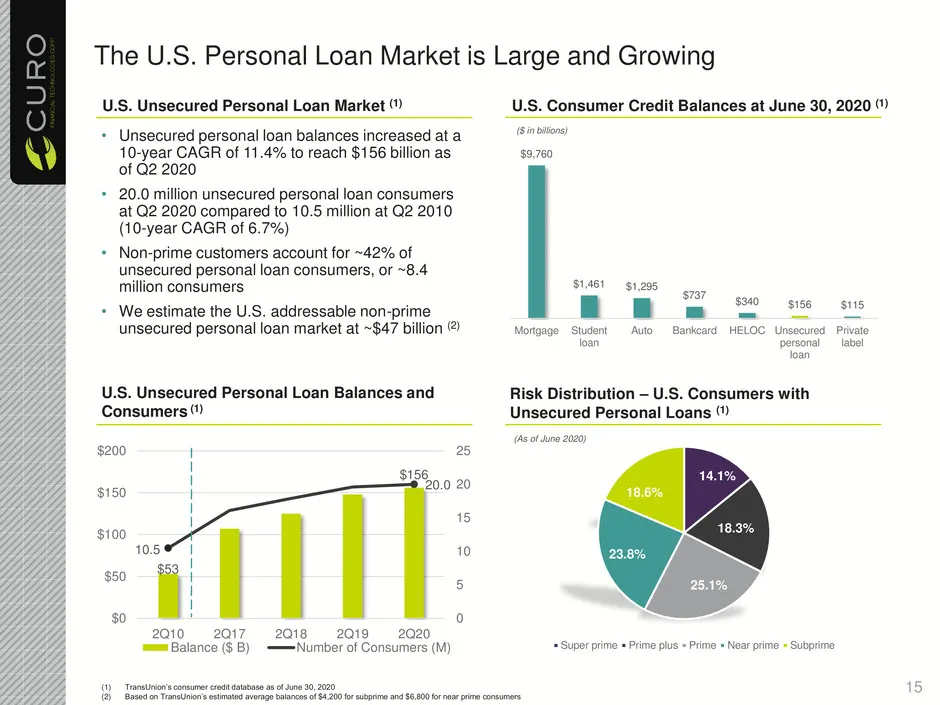
The U.S. Personal Loan Market is Large and Growing (1) TransUnion’s consumer credit database as of June 30, 2020 (2) Based on TransUnion’s estimated average balances of $4,200 for subprime and $6,800 for near prime consumers U.S. Consumer Credit Balances at June 30, 2020 (1) U.S. Unsecured Personal
Slide 16: Large Addressable U.S. Market Remains Underserved
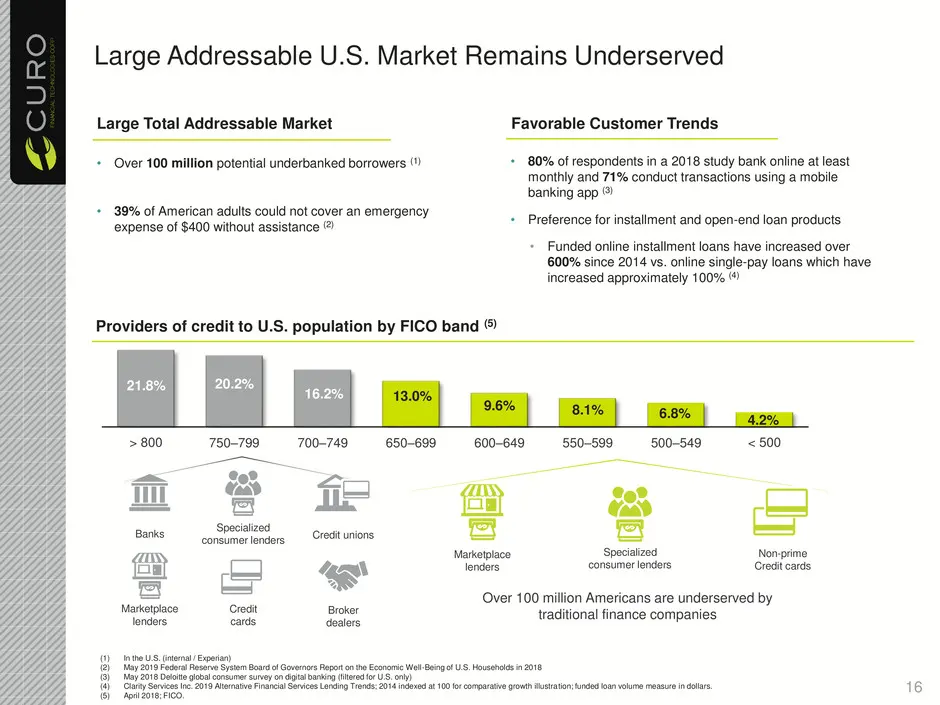
Large Addressable U.S. Market Remains Underserved 21.8% 20.2% 16.2% 13.0% 9.6% 8.1% 6.8% 4.2% > 800 750–799 700–749 650–699 600–649 550–599 500–549 < 500 Providers of credit to U.S. population by FICO band (5) Over 100 million Americans are underserved by traditional finance companies Specialized co
Slide 17: Evolving U.S. Competitive Landscape
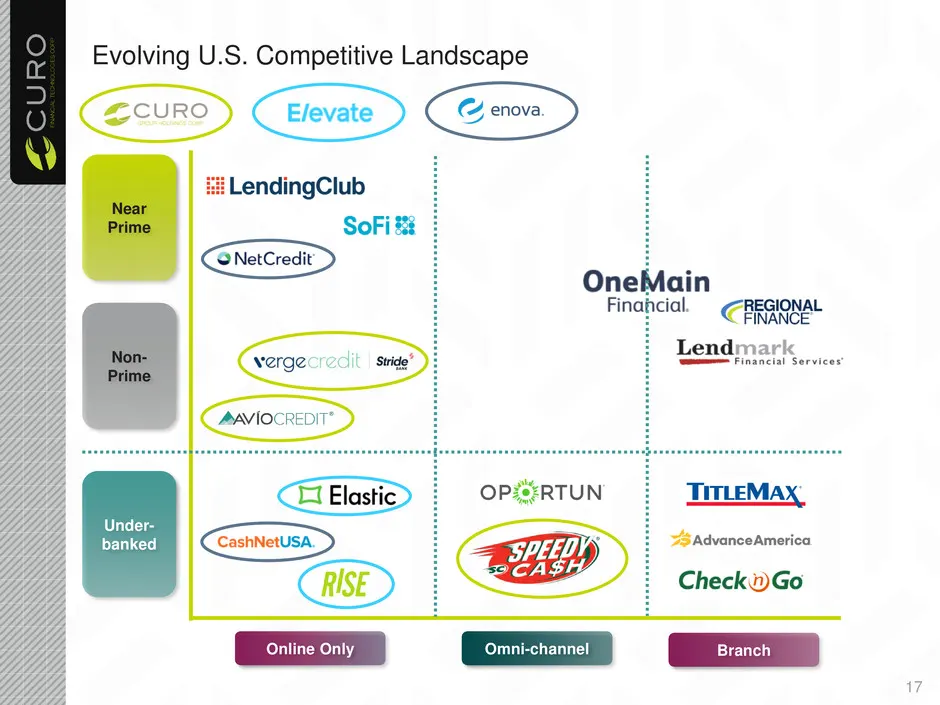
Evolving U.S. Competitive Landscape Online Only Omni-channel Near Prime Non- Prime Under- banked Branch 17
Slide 18: FinTech is Taking Share From Banks, Credit Unions and Traditional Finance Companies
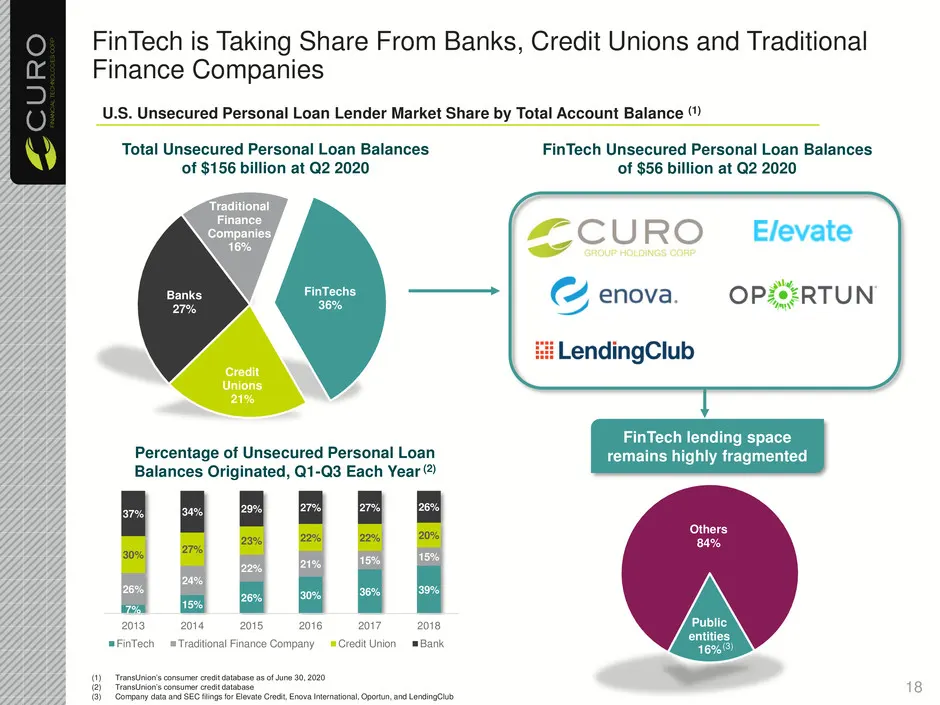
7% 15% 26% 30% 36% 39%26% 24% 22% 21% 15% 15% 30% 27% 23% 22% 22% 20% 37% 34% 29% 27% 27% 26% 2013 2014 2015 2016 2017 2018 FinTech Traditional Finance Company Credit Union Bank 18 FinTech is Taking Share From Banks, Credit Unions and Traditional Finance Companies (1) TransUnion’s consumer credit da
Slide 19: The Canadian Consumer Loan Market is Similarly Attractive
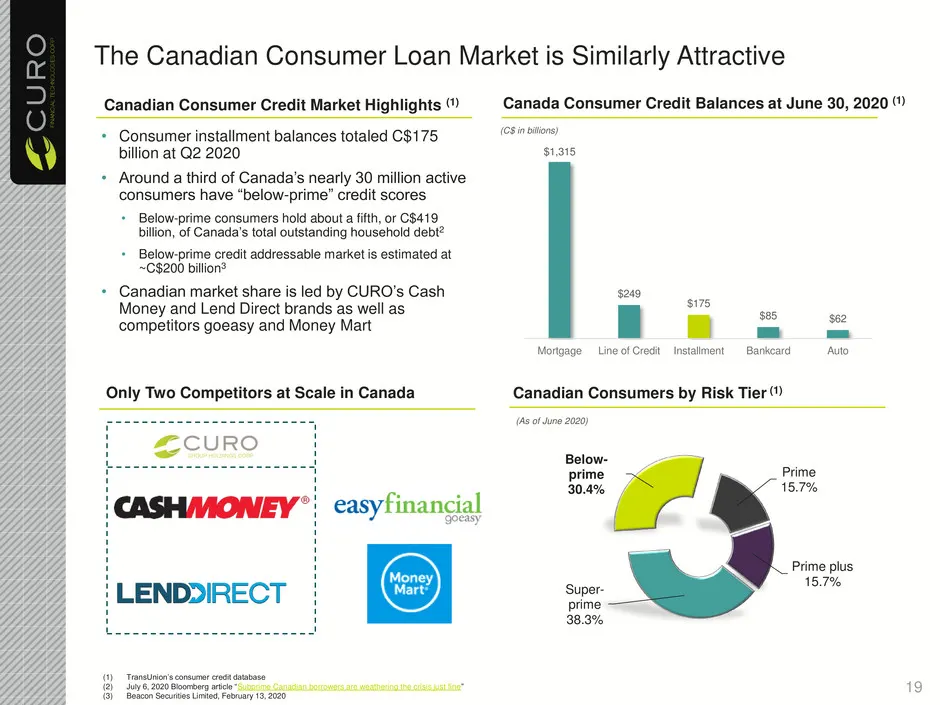
The Canadian Consumer Loan Market is Similarly Attractive (1) TransUnion’s consumer credit database (2) July 6, 2020 Bloomberg article “Subprime Canadian borrowers are weathering the crisis just fine” (3) Beacon Securities Limited, February 13, 2020 Canada Consumer Credit Balances at June 30, 2020 (

Slide 20: Customer Health
Customer Health 20
Slide 21: The Consumer is Demonstrating Resiliency
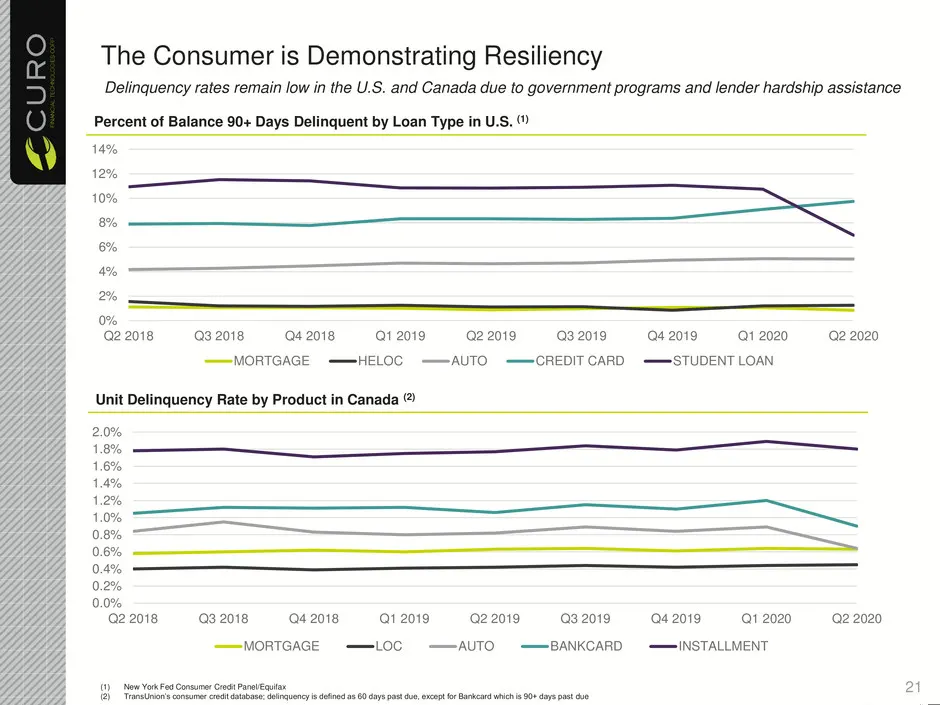
0.0% 0.2% 0.4% 0.6% 0.8% 1.0% 1.2% 1.4% 1.6% 1.8% 2.0% Q2 2018 Q3 2018 Q4 2018 Q1 2019 Q2 2019 Q3 2019 Q4 2019 Q1 2020 Q2 2020 MORTGAGE LOC AUTO BANKCARD INSTALLMENT The Consumer is Demonstrating Resiliency Delinquency rates remain low in the U.S. and Canada due to government programs and lender har
Slide 22: Stimulus Support Impacts Non-prime Consumers
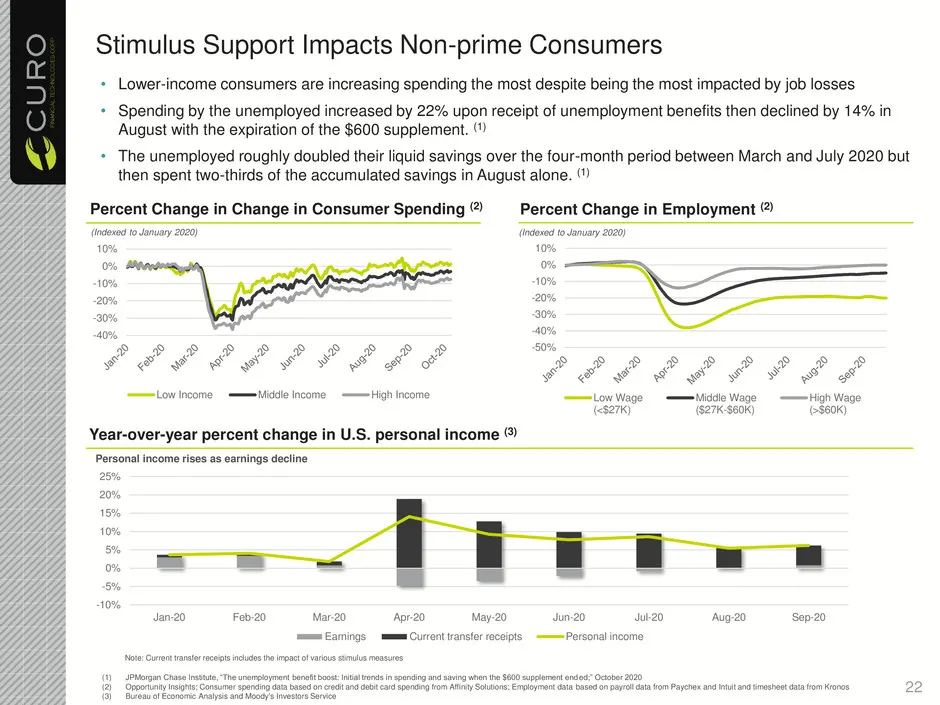
• Lower-income consumers are increasing spending the most despite being the most impacted by job losses • Spending by the unemployed increased by 22% upon receipt of unemployment benefits then declined by 14% in August with the expiration of the $600 supplement. (1) • The unemployed roughly doubled
Slide 23: Subprime Credit Card Limits Cut as Banks Tighten
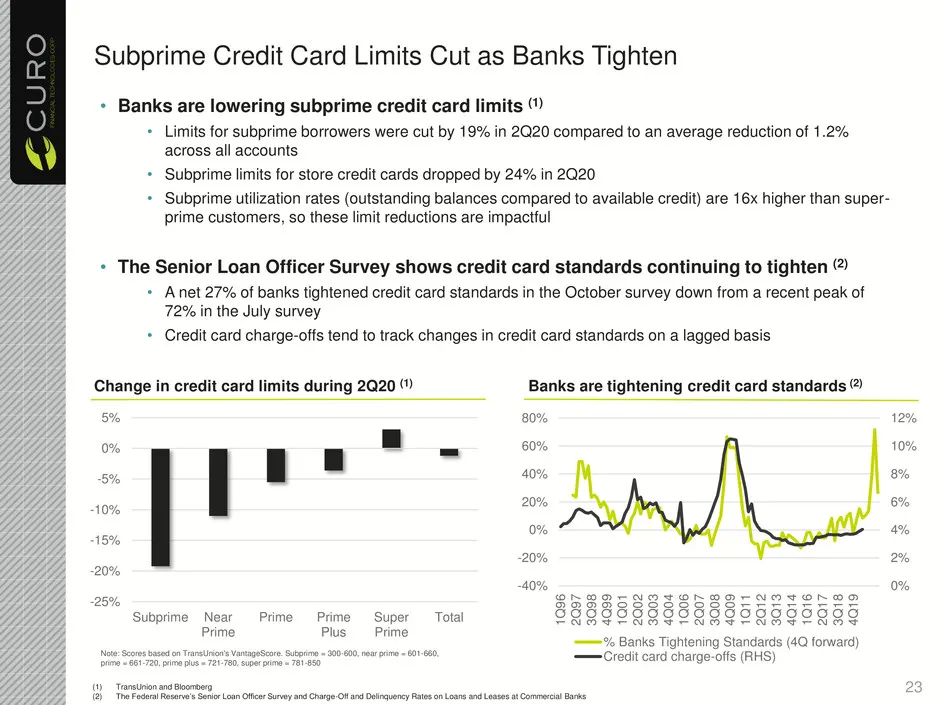
Subprime Credit Card Limits Cut as Banks Tighten Change in credit card limits during 2Q20 (1) Banks are tightening credit card standards (2) (1) TransUnion and Bloomberg (2) The Federal Reserve’s Senior Loan Officer Survey and Charge-Off and Delinquency Rates on Loans and Leases at Commercial Banks
Slide 24: Consumer spending/activity stabilizing after rebounding off the lows
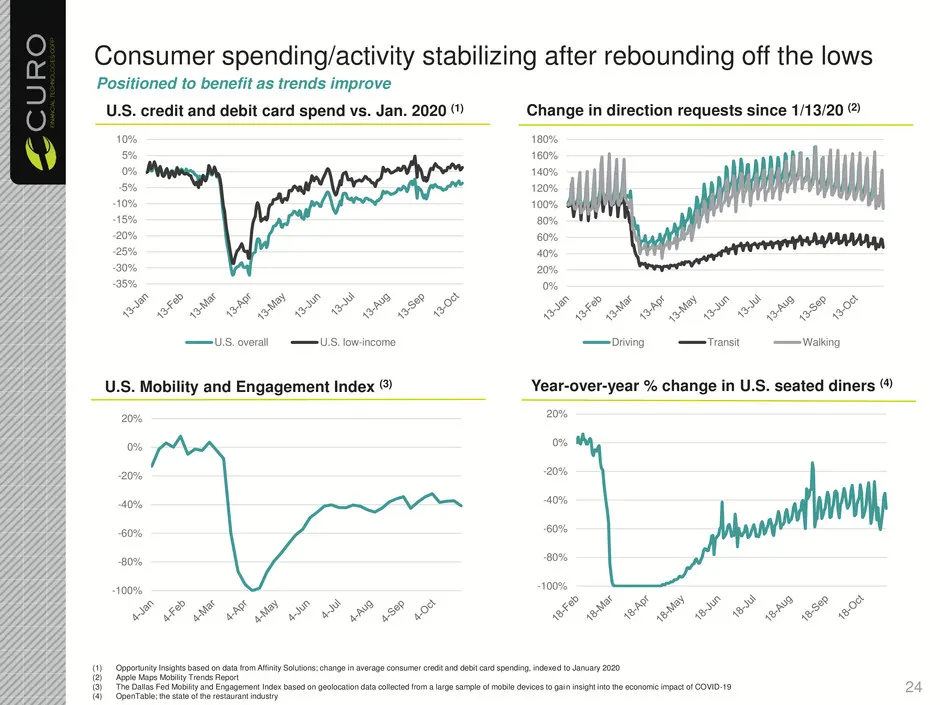
Consumer spending/activity stabilizing after rebounding off the lows U.S. Mobility and Engagement Index (3) Positioned to benefit as trends improve Year-over-year % change in U.S. seated diners (4) U.S. credit and debit card spend vs. Jan. 2020 (1) (1) Opportunity Insights based on data from Affinit

Slide 25: Company Performance during COVID-19
Company Performance during COVID-19 25
Slide 26: Operating Highlights
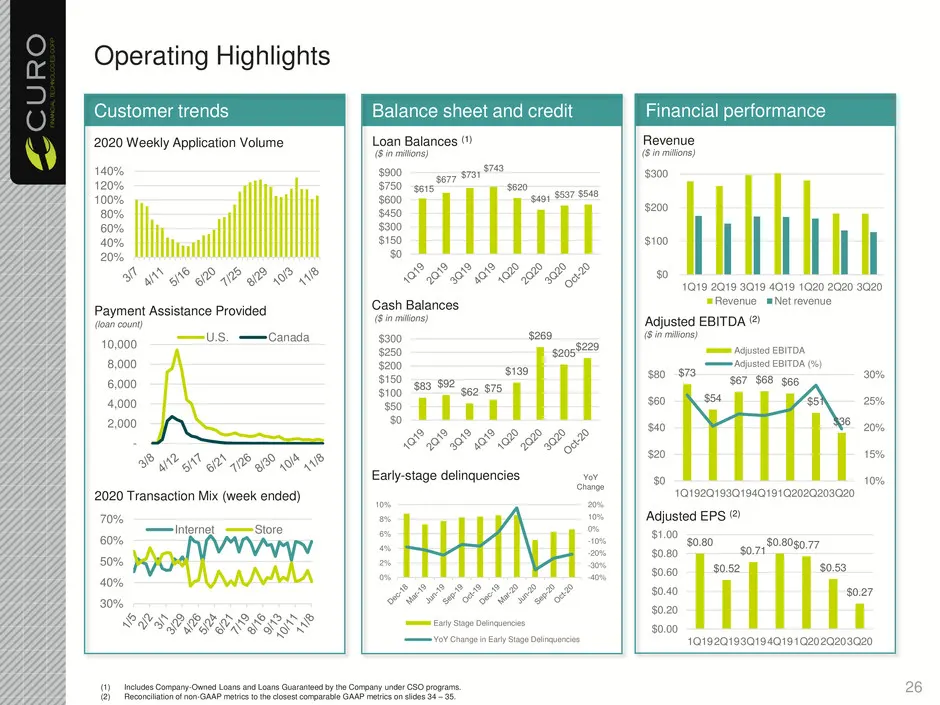
Operating Highlights Customer trends 2020 Weekly Application Volume Loan Balances (1) Balance sheet and credit Financial performance (1) Includes Company-Owned Loans and Loans Guaranteed by the Company under CSO programs. (2) Reconciliation of non-GAAP metrics to the closest comparable GAAP metrics
Slide 27: Customers are Managing their Finances Prudently
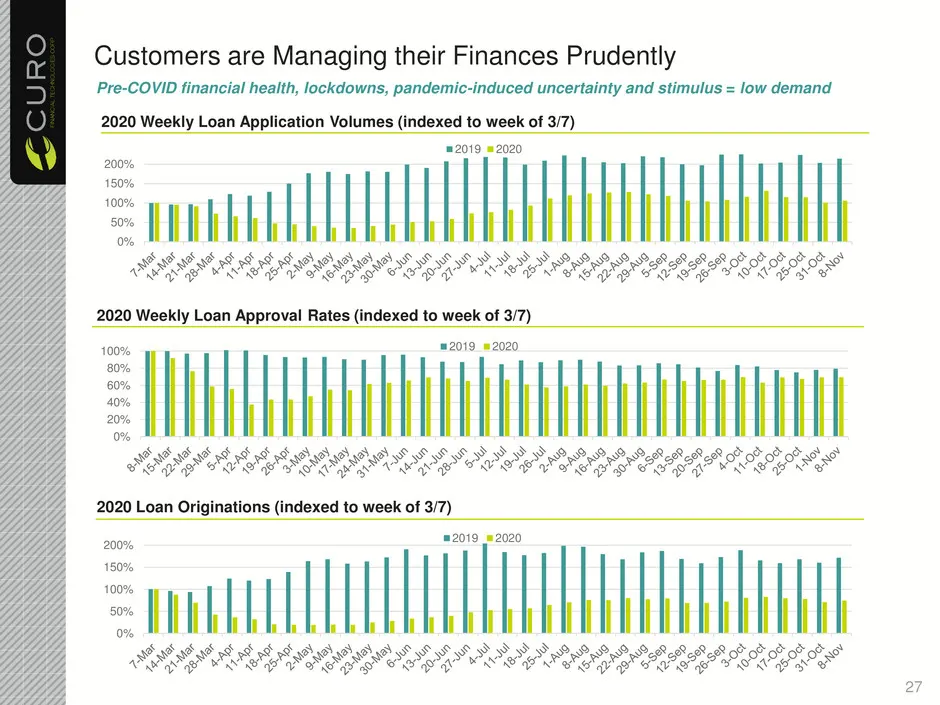
Customers are Managing their Finances Prudently 2020 Weekly Loan Application Volumes (indexed to week of 3/7) 2020 Weekly Loan Approval Rates (indexed to week of 3/7) Pre-COVID financial health, lockdowns, pandemic-induced uncertainty and stimulus = low demand 2020 Loan Originations (indexed to week
Slide 28: Customers are Managing their Finances Prudently (cont'd)
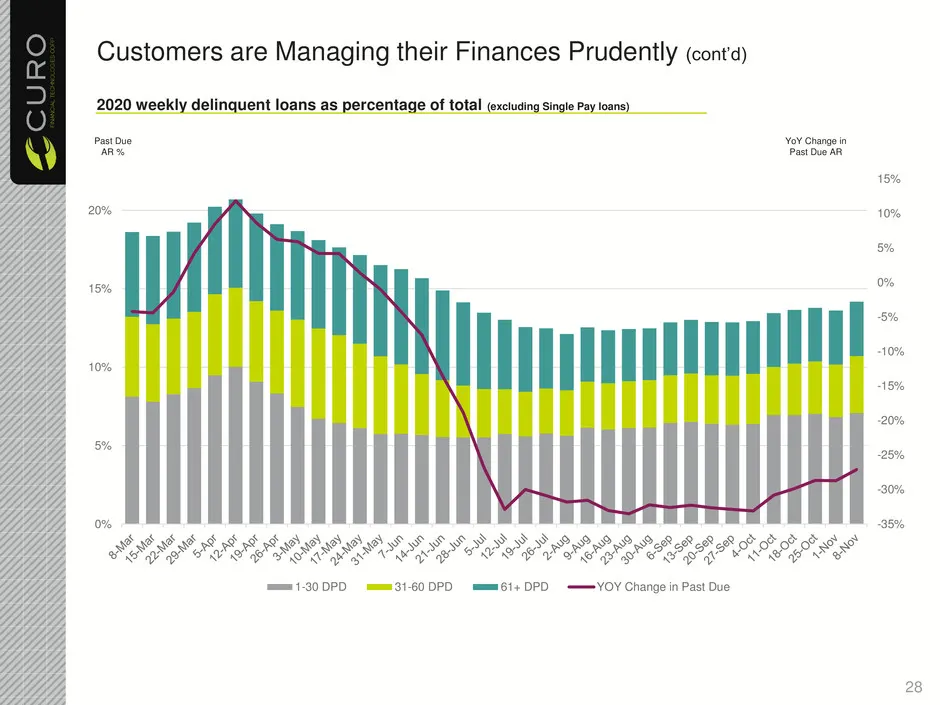
2020 weekly delinquent loans as percentage of total (excluding Single Pay loans) Customers are Managing their Finances Prudently (cont’d) YoY Change in Past Due AR Past Due AR % -35% -30% -25% -20% -15% -10% -5% 0% 5% 10% 15% 0% 5% 10% 15% 20% 1-30 DPD 31-60 DPD 61+ DPD YOY Change in Past Due 28
Slide 29: Continuing to Manage Expenses Carefully
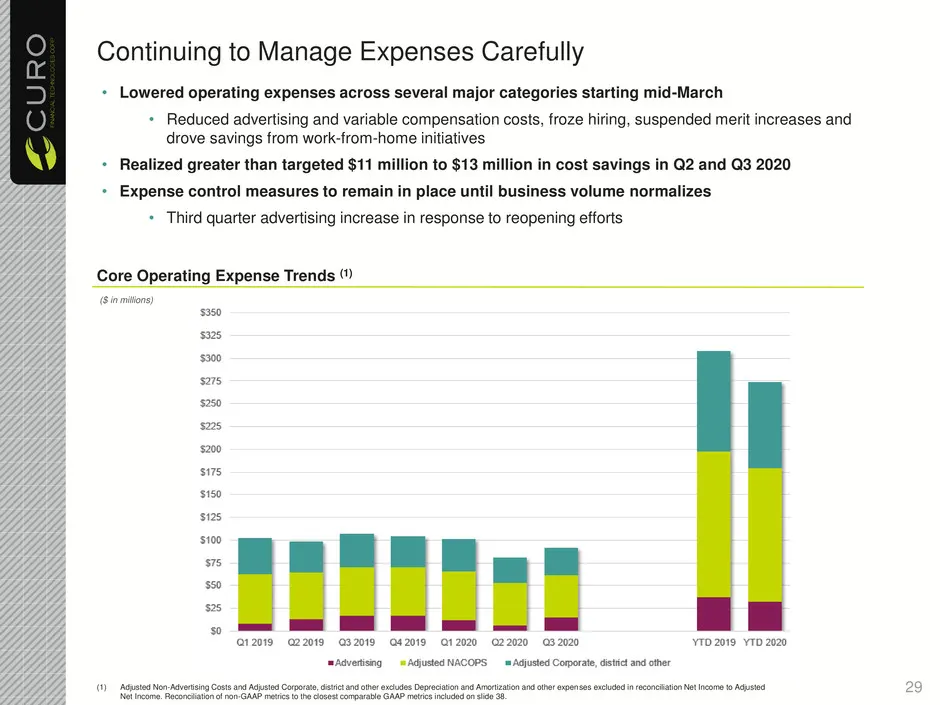
Core Operating Expense Trends (1) Continuing to Manage Expenses Carefully ($ in millions) (1) Adjusted Non-Advertising Costs and Adjusted Corporate, district and other excludes Depreciation and Amortization and other expenses excluded in reconciliation Net Income to Adjusted Net Income. Reconciliati
Slide 30: Strong Debt Capitalization and Liquidity
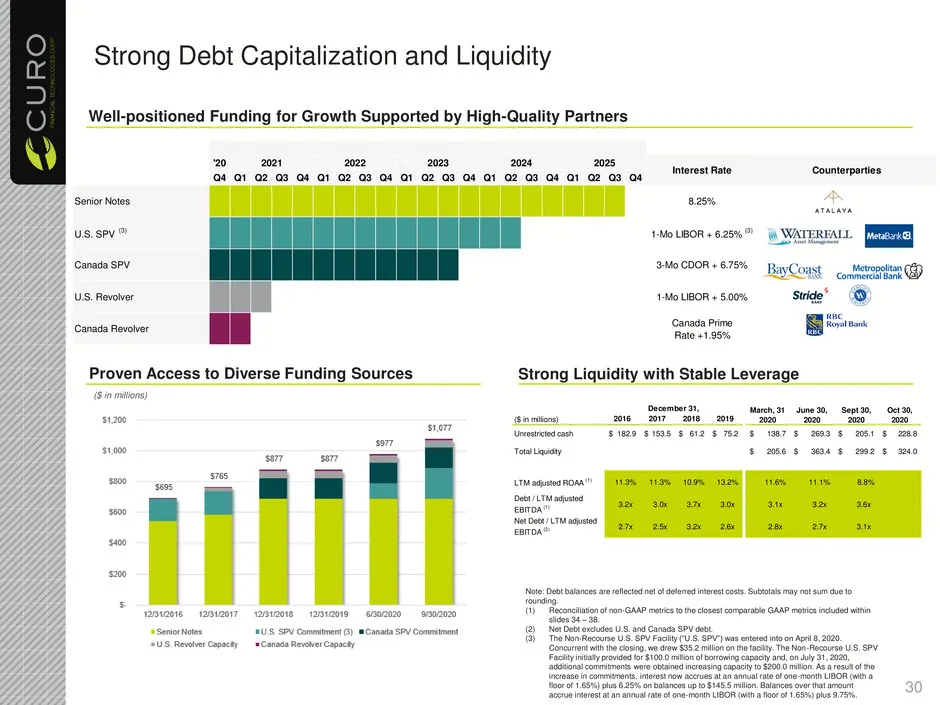
Strong Debt Capitalization and Liquidity Note: Debt balances are reflected net of deferred interest costs. Subtotals may not sum due to rounding. (1) Reconciliation of non-GAAP metrics to the closest comparable GAAP metrics included within slides 34 – 38. (2) Net Debt excludes U.S. and Canada SPV de
Slide 31: COVID-19 Customer Care Plan
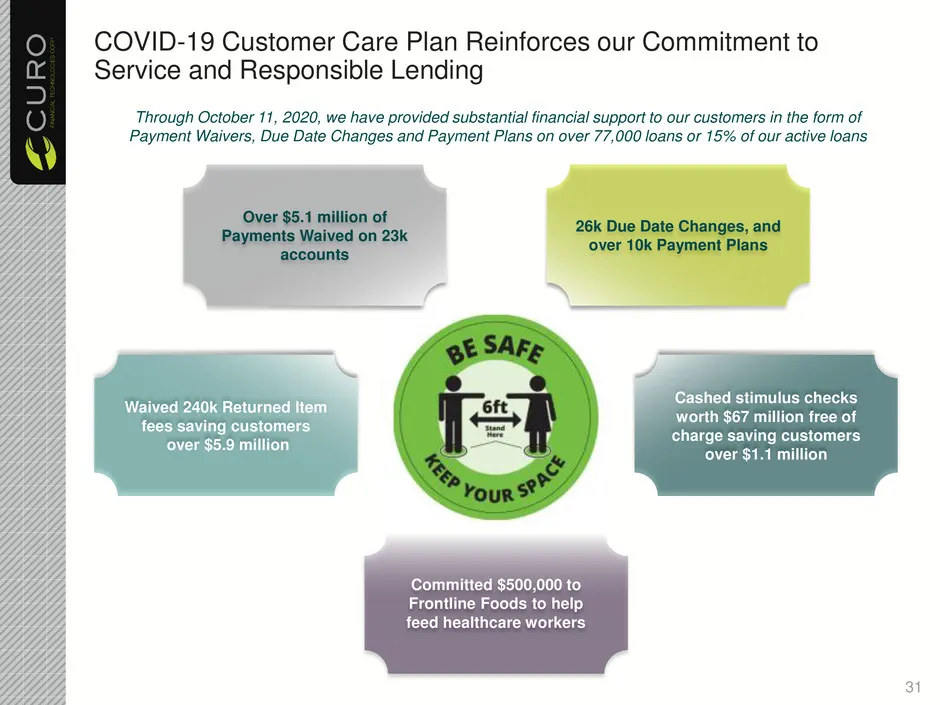
COVID-19 Customer Care Plan Reinforces our Commitment to Service and Responsible Lending Waived 240k Returned Item fees saving customers over $5.9 million Cashed stimulus checks worth $67 million free of charge saving customers over $1.1 million 26k Due Date Changes, and over 10k Payment Plans Over
Slide 32: Trends to Watch for Remainder of 2020
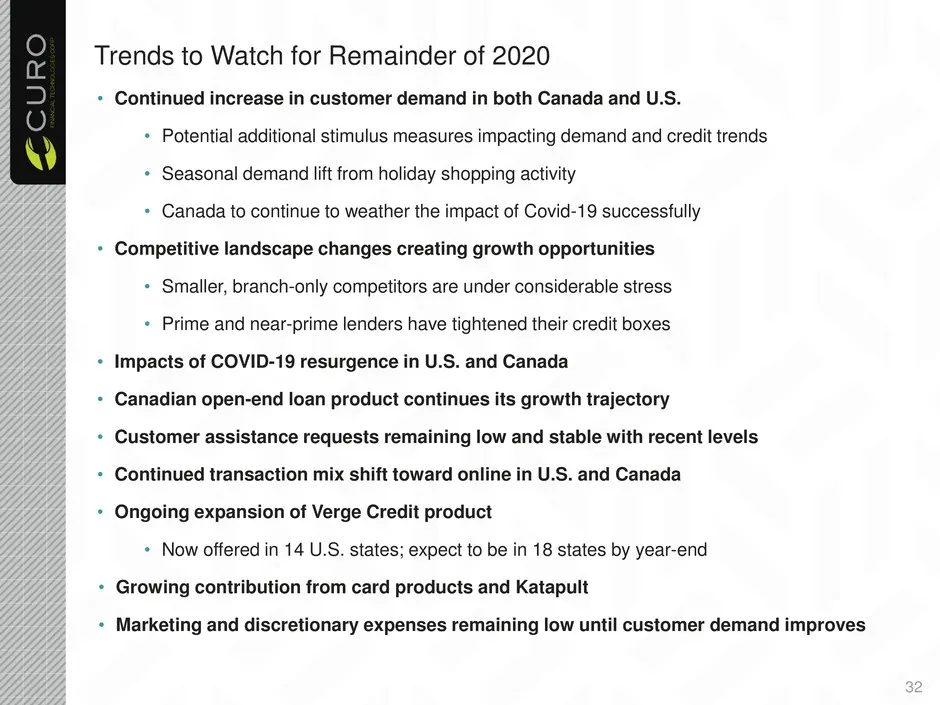
Trends to Watch for Remainder of 2020 • Continued increase in customer demand in both Canada and U.S. • Potential additional stimulus measures impacting demand and credit trends • Seasonal demand lift from holiday shopping activity • Canada to continue to weather the impact of Covid-19 successfully

Slide 33: Appendix
Appendix 33
Slide 34: Historical Consolidated Adjusted EBITDA Reconciliation
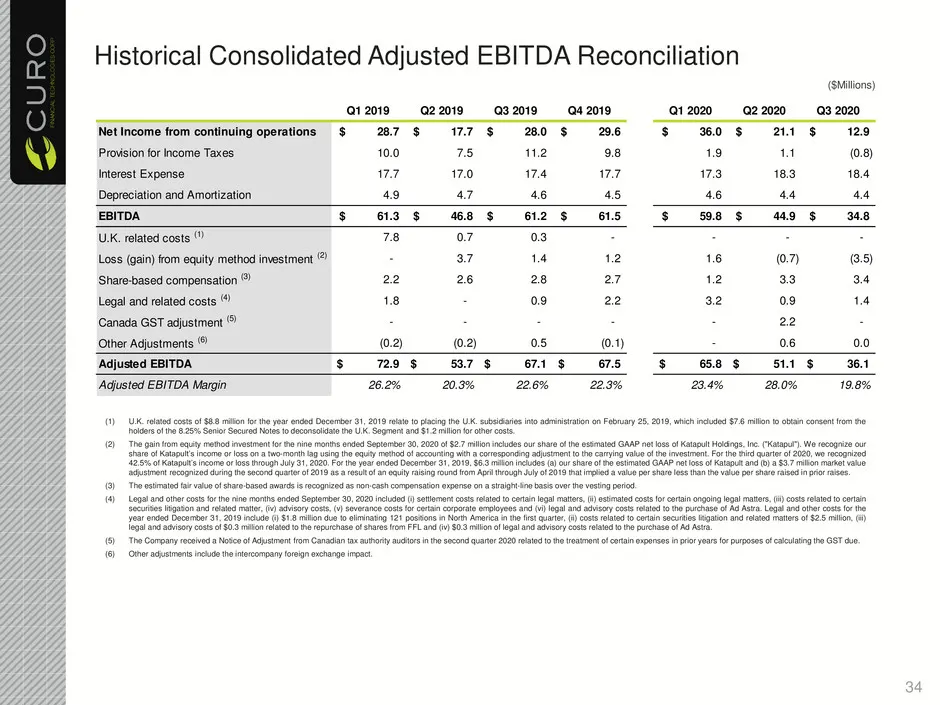
Historical Consolidated Adjusted EBITDA Reconciliation ($Millions) (1) U.K. related costs of $8.8 million for the year ended December 31, 2019 relate to placing the U.K. subsidiaries into administration on February 25, 2019, which included $7.6 million to obtain consent from the holders of the 8.25%
Slide 35: Historical Consolidated Adjusted Net Income Reconciliation
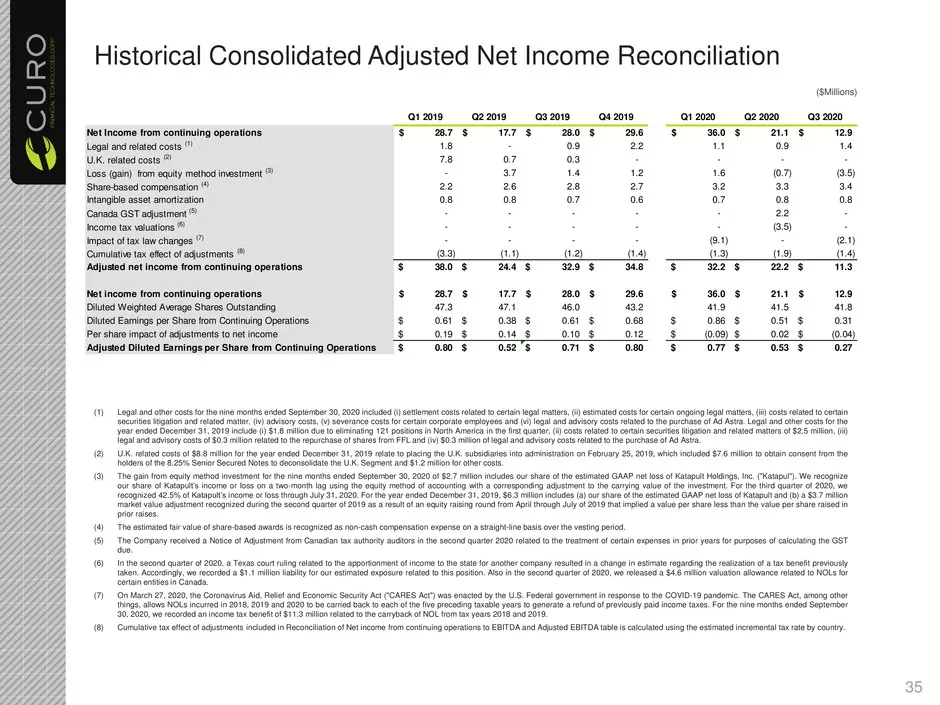
Historical Consolidated Adjusted Net Income Reconciliation ($Millions) (1) Legal and other costs for the nine months ended September 30, 2020 included (i) settlement costs related to certain legal matters, (ii) estimated costs for certain ongoing legal matters, (iii) costs related to certain securit
Slide 36: Canada Adjusted EBITDA Reconciliation
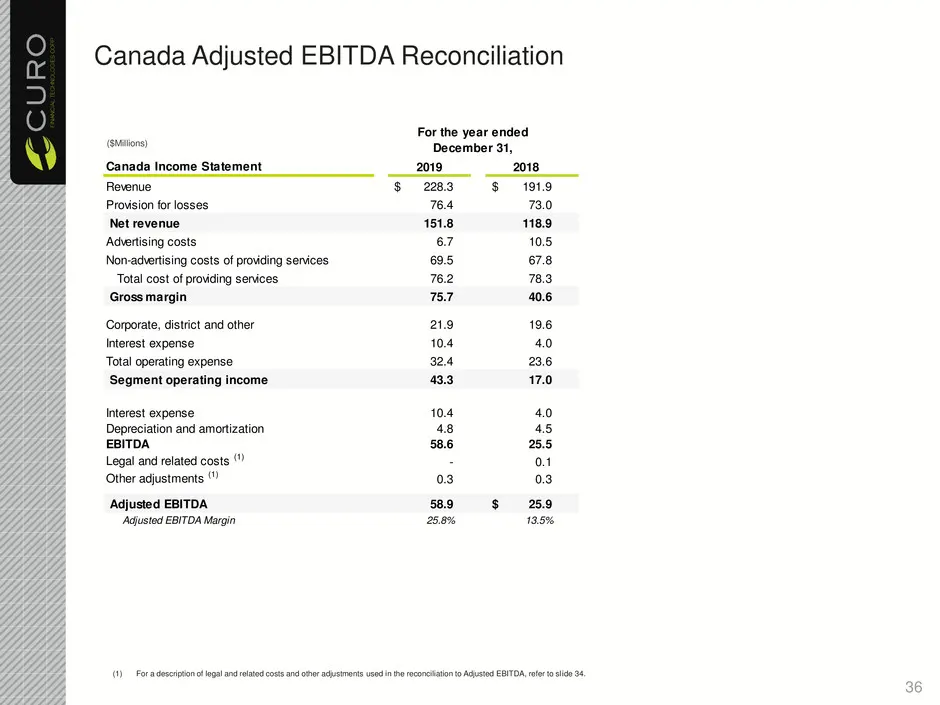
Canada Adjusted EBITDA Reconciliation ($Millions) Canada Income Statement Revenue 228.3$ 191.9$ Provision for losses 76.4 73.0 Net revenue 151.8 118.9 Advertising costs 6.7 10.5 Non-advertising costs of providing services 69.5 67.8 Total cost of providing services 76.2 78.3 Gross margin 75.7 40.6 Co
Slide 37: Historical Gross Combined Loan Receivables and Adjusted ROAA Reconciliations
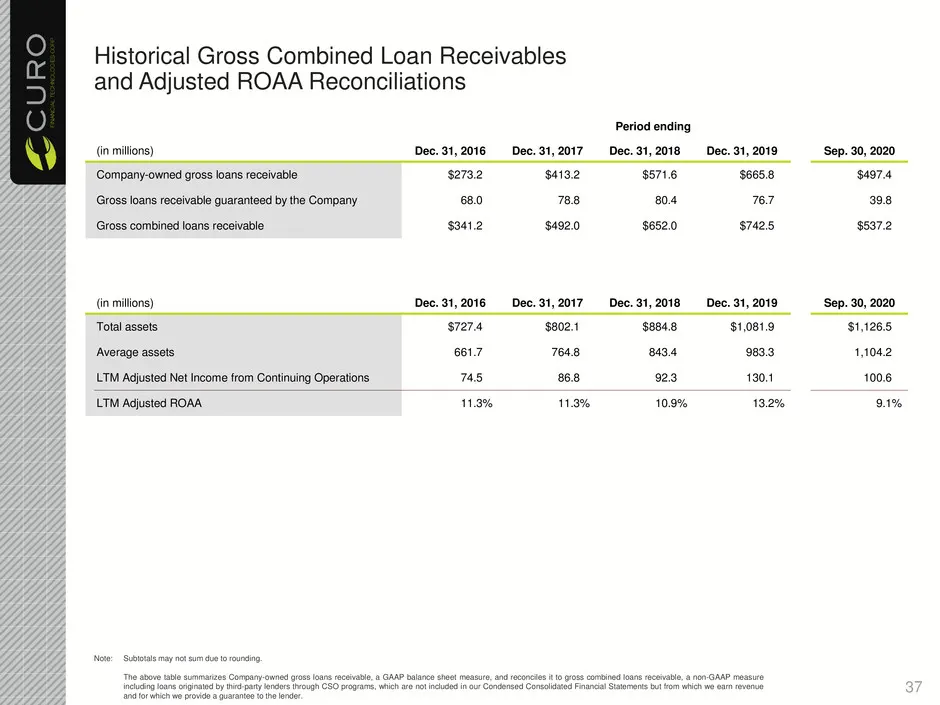
Historical Gross Combined Loan Receivables and Adjusted ROAA Reconciliations Note: Subtotals may not sum due to rounding. The above table summarizes Company-owned gross loans receivable, a GAAP balance sheet measure, and reconciles it to gross combined loans receivable, a non-GAAP measure including
Slide 38: Core Operating Expense Reconciliation
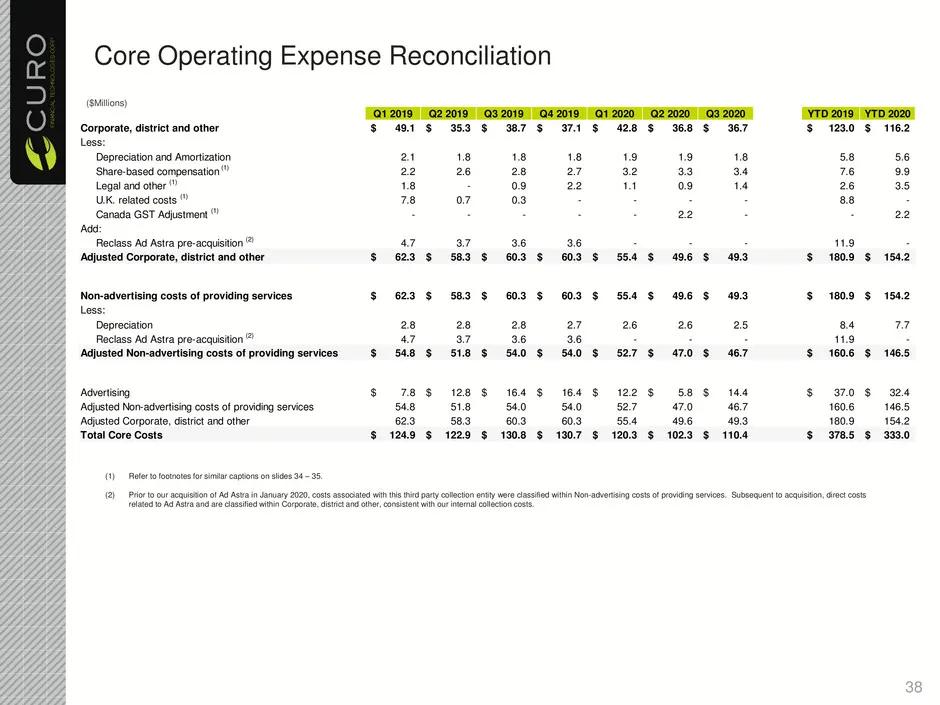
Core Operating Expense Reconciliation (1) Refer to footnotes for similar captions on slides 34 – 35. (2) Prior to our acquisition of Ad Astra in January 2020, costs associated with this third party collection entity were classified within Non-advertising costs of providing services. Subsequent to ac
Source: SEC EDGAR · 8-K filed Nov 16, 2020
More decks from Curo Group Holdings Corp
 Q4 2023 Earnings Presentation21 slides · Feb 12, 2024
 Investor Presentation (November 2023)15 slides · Nov 13, 2023
 Q3 2023 Earnings Presentation20 slides · Nov 2, 2023
 Debt Investor Presentation (October 2023)21 slides · Oct 23, 2023
 Investor Presentation (September 2023)15 slides · Sep 25, 2023
 Q2 2023 Earnings Presentation21 slides · Aug 3, 2023