Perion Network Ltd · NASDAQ:PERI
Perion Network — FY2013 Earnings Presentation
26 slides from Perion Network's earnings presentation, March 2014
Slide 1: Perion Network
Perion Network (NASDAQ: PERI) March 2014
Slide 2: Safe Harbor Statement
Safe Harbor Statement This presentation contains historical information and forward-looking statements within the meaning of The Private Securities Litigation Reform Act of 1995 with respect to the business, financial condition and results of operations of Perion. The words “will”, “believe,” “expec
Slide 3: Quick Facts
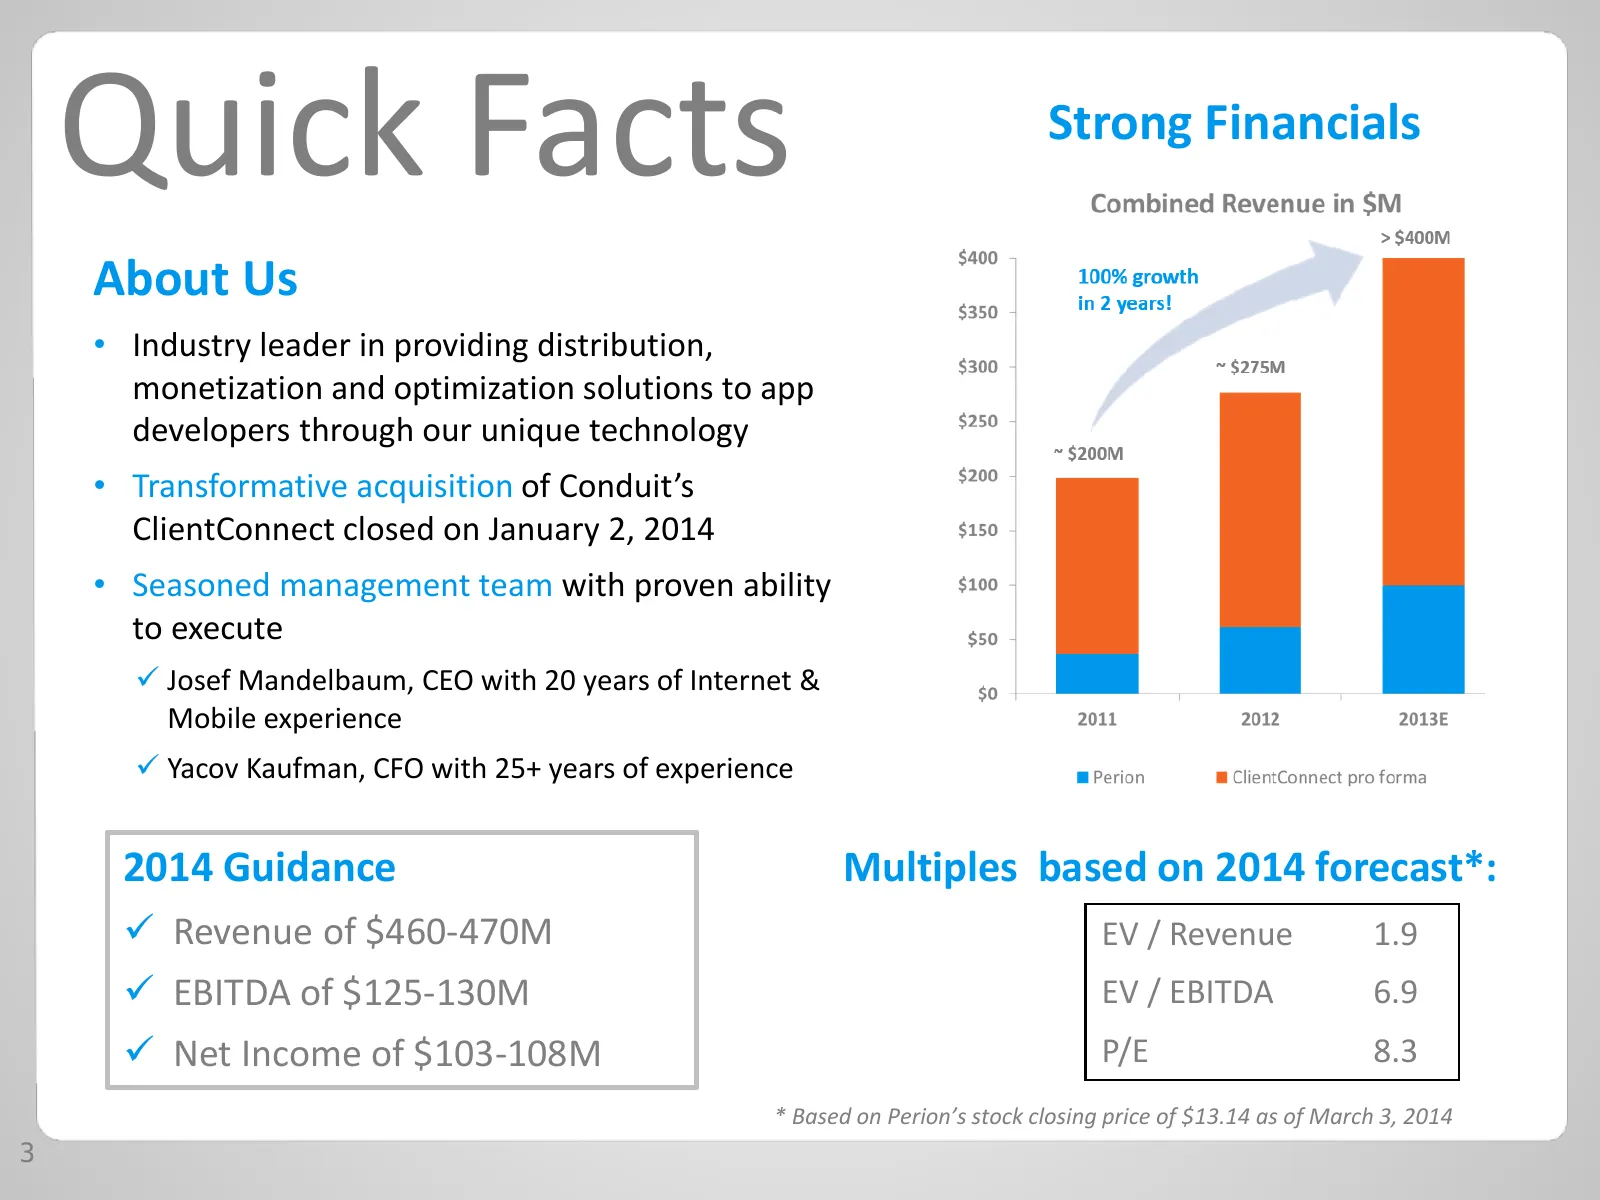
Quick Facts Strong Financials About Us • Industry leader in providing distribution, monetization and optimization solutions to app developers through our unique technology • Transformative acquisition of Conduit’s ClientConnect closed on January 2, 2014 • Seasoned management team with proven ability
Slide 4: What We Do...
What We Do...
Slide 5: Our Mission
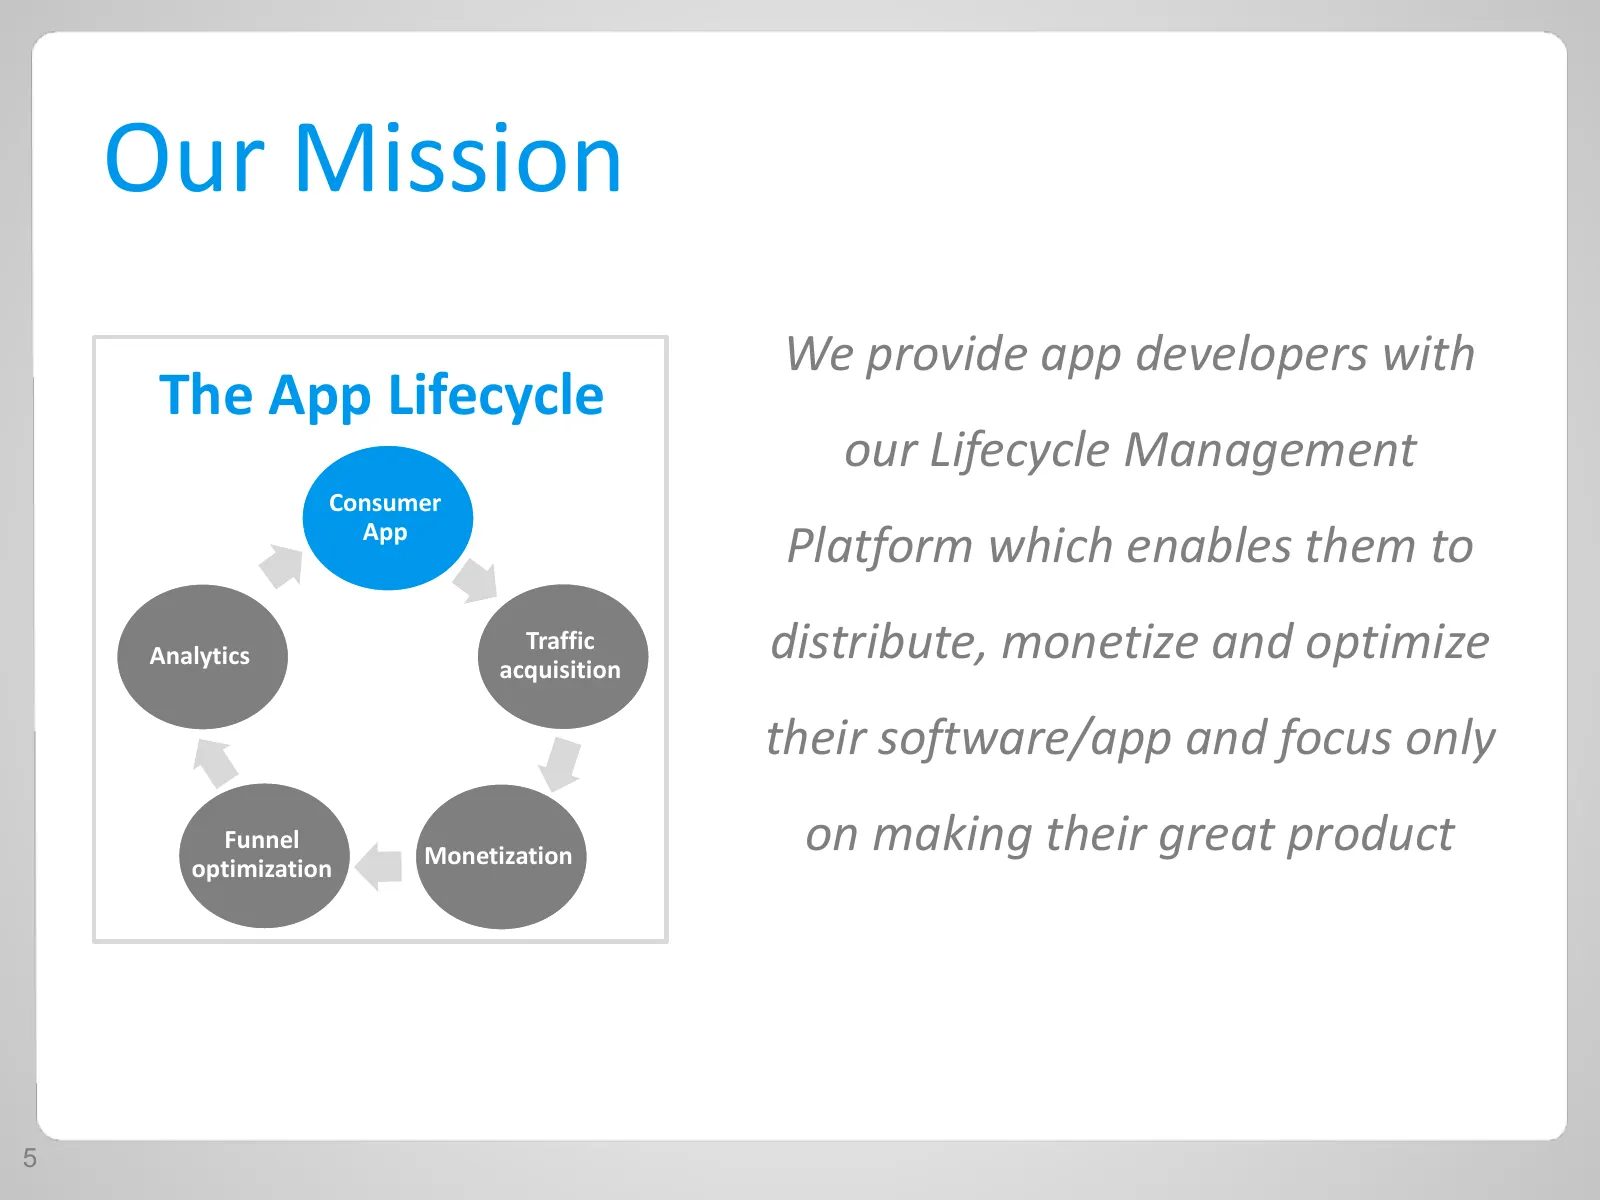
Our Mission We provide app developers with The App Lifecycle our Lifecycle Management Consumer App Platform which enables them to Analytics Traffic acquisition distribute, monetize and optimize their software/app and focus only Funnel Monetization on making their great product optimization 5
Slide 6: Developers are Faced with Increased Challenges
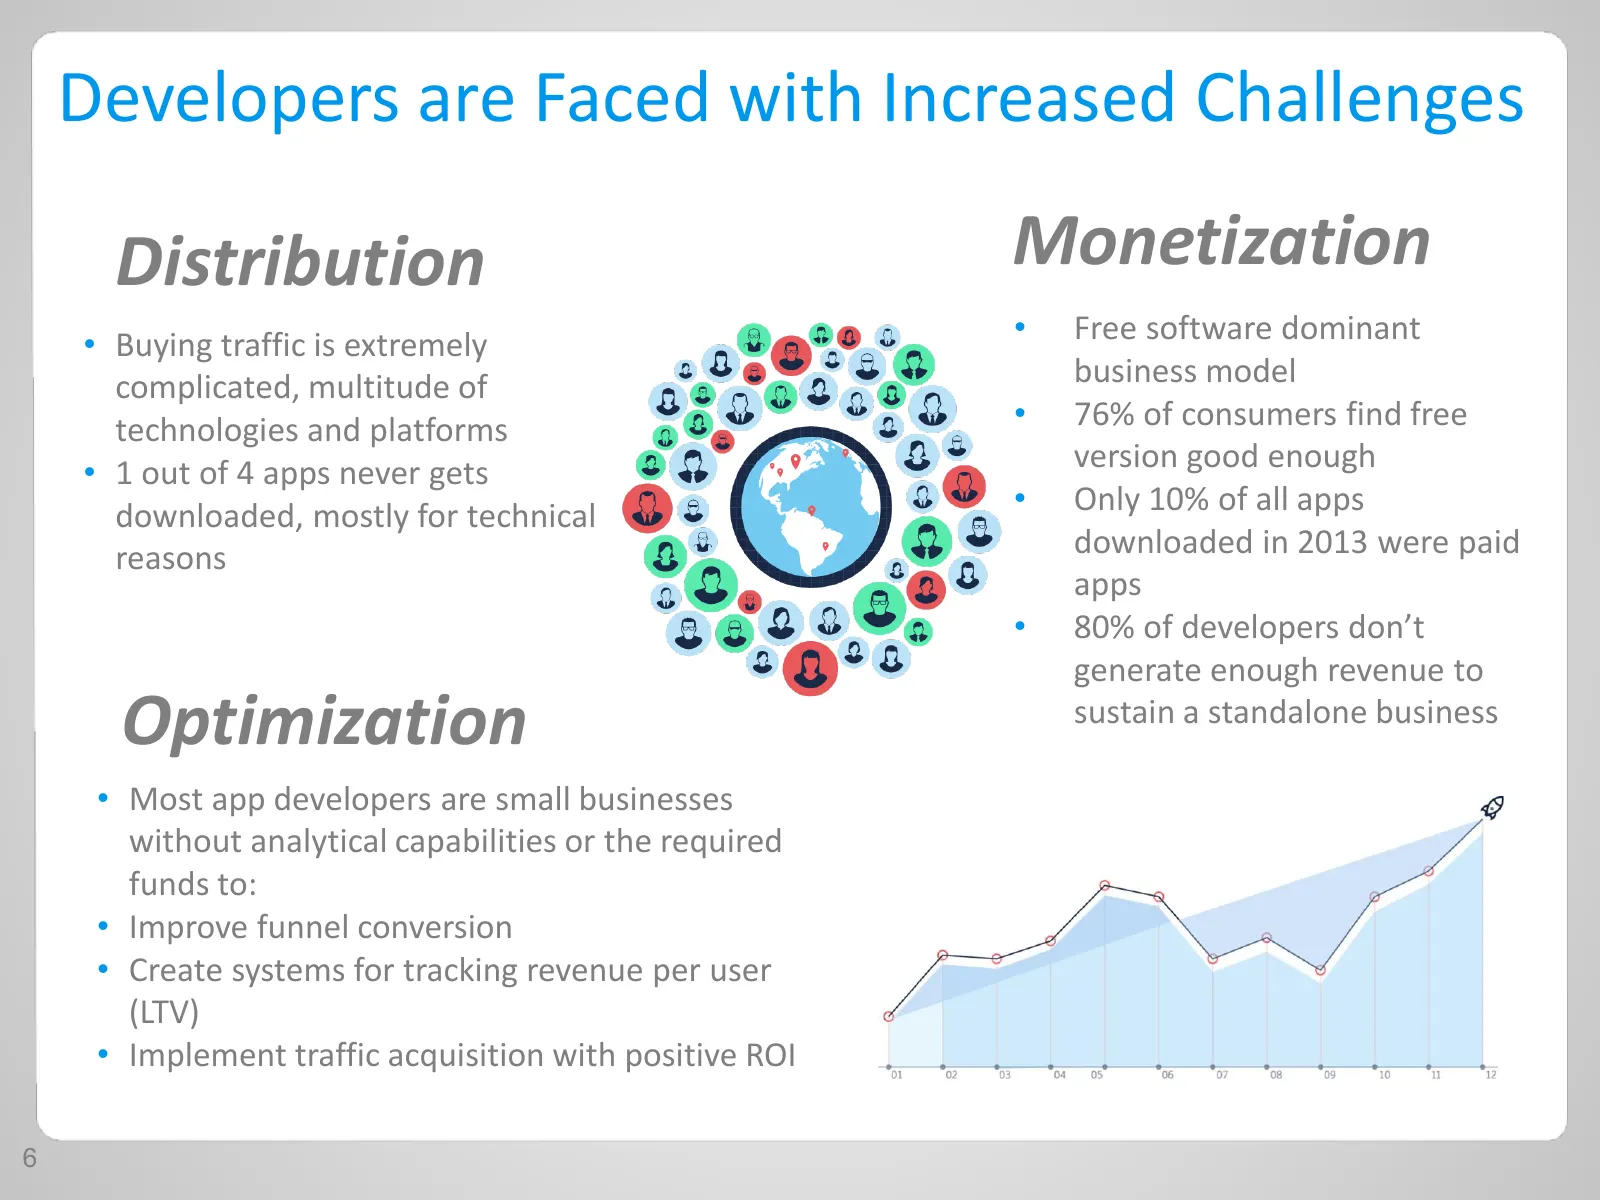
Developers are Faced with Increased Challenges Distribution Monetization • Buying traffic is extremely • Free software dominant complicated, multitude of business model technologies and platforms • 76% of consumers find free • 1 out of 4 apps never gets version good enough downloaded, mostly for tec
Slide 7: These Challenges Are Cross Platform
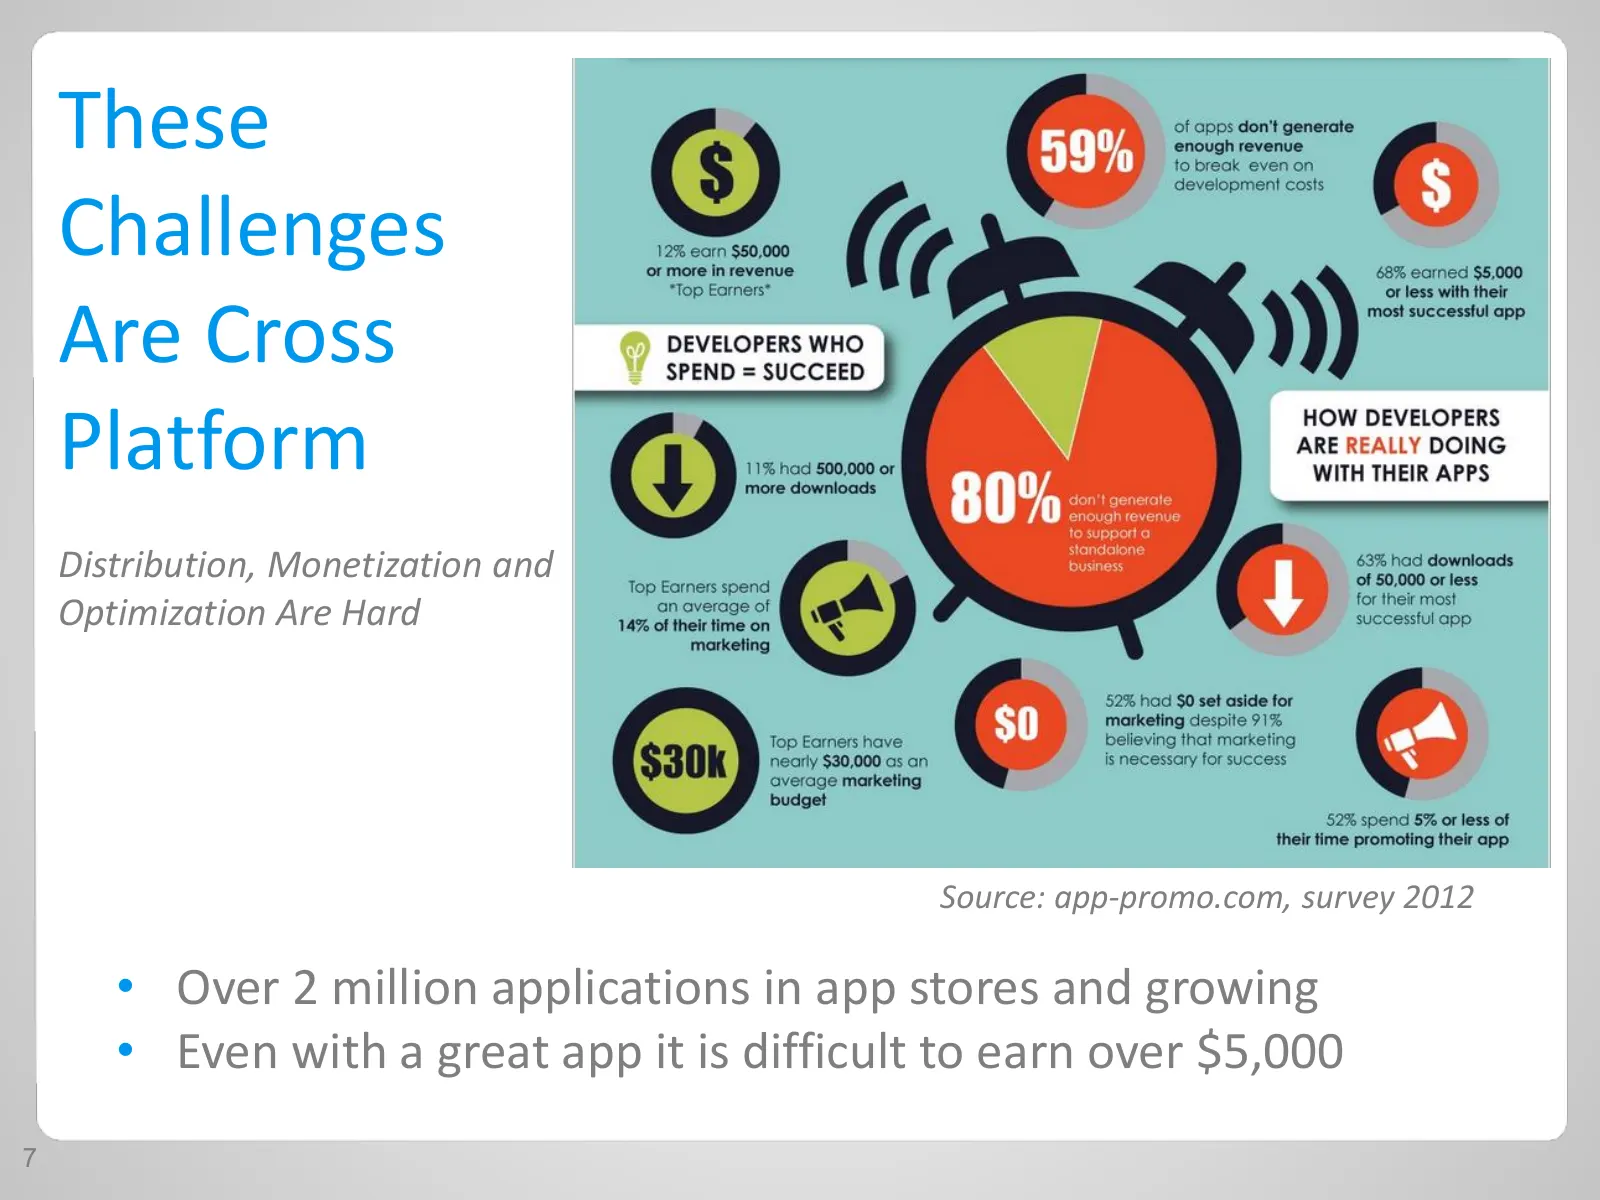
These Challenges Are Cross Platform Distribution, Monetization and Optimization Are Hard Source: app-promo.com, survey 2012 • Over 2 million applications in app stores and growing • Even with a great app it is difficult to earn over $5,000 7
Slide 8: Our Unique Solution: Our Lifecycle Management Platform (LMP)
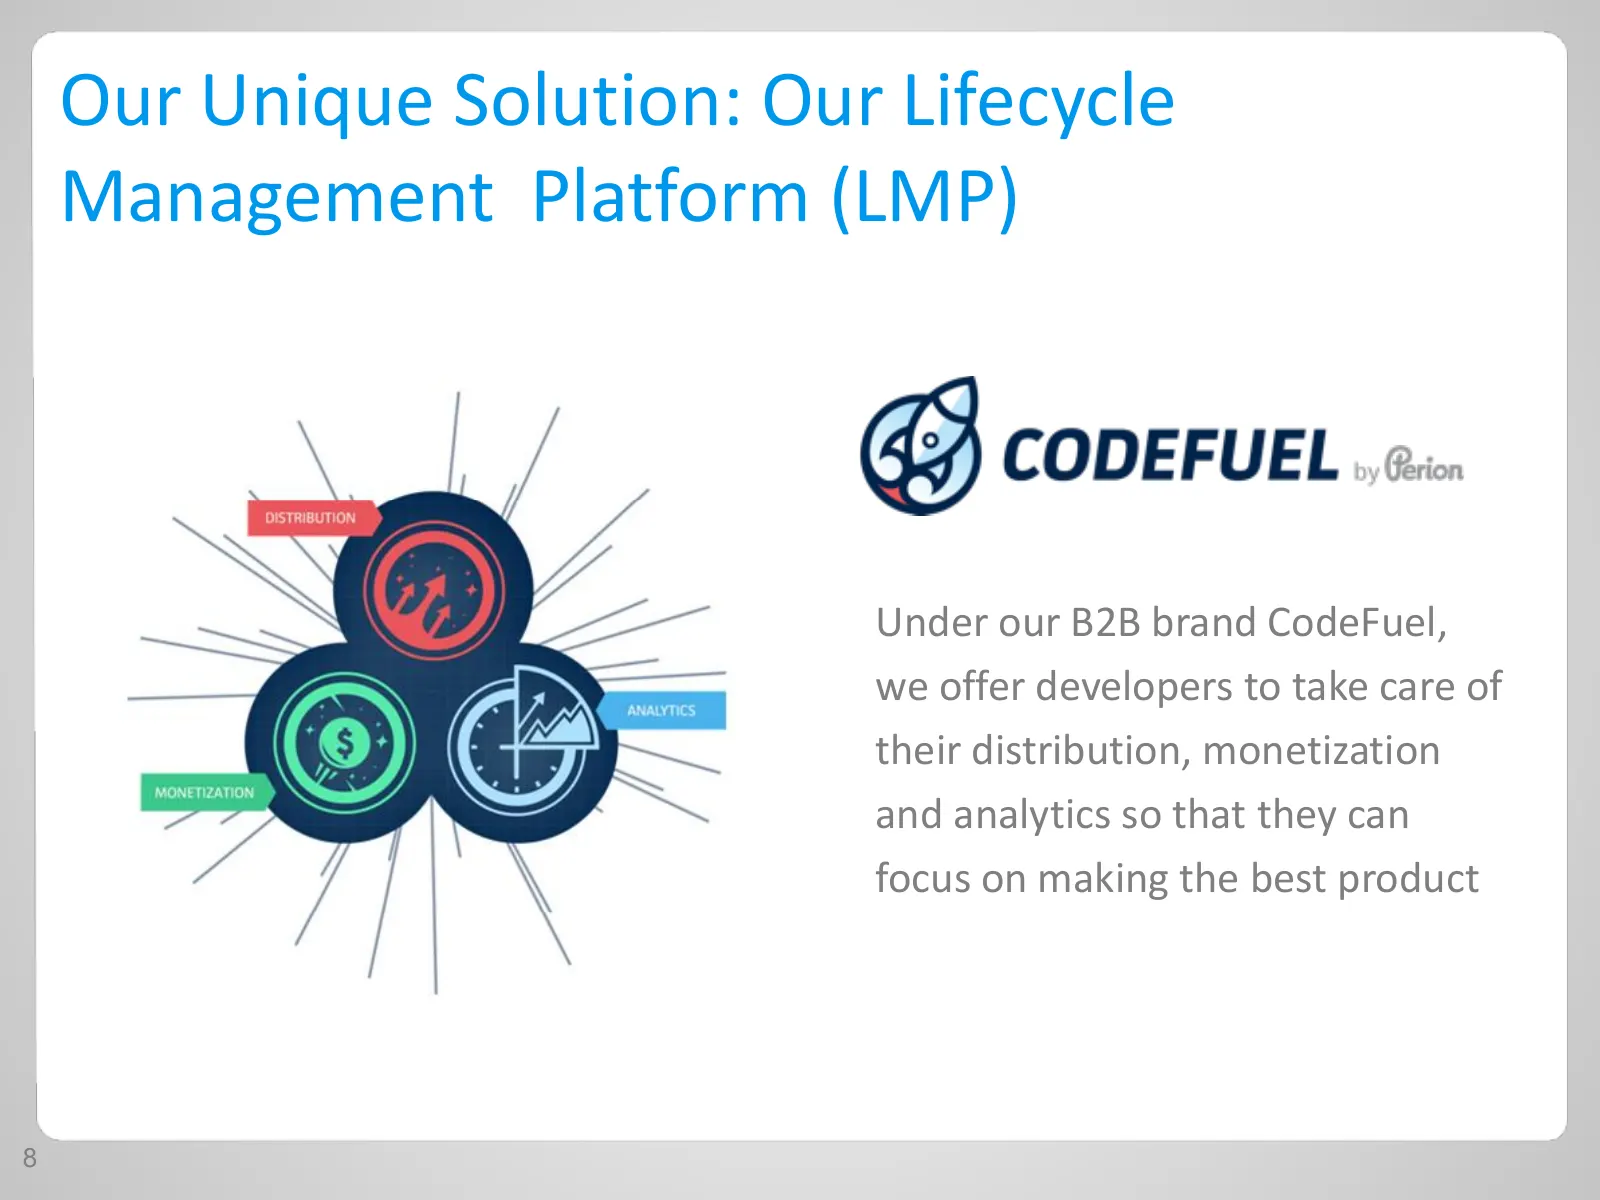
Our Unique Solution: Our Lifecycle Management Platform (LMP) Under our B2B brand CodeFuel, we offer developers to take care of their distribution, monetization and analytics so that they can focus on making the best product 8
Slide 9: Our Leading Monetization Solutions
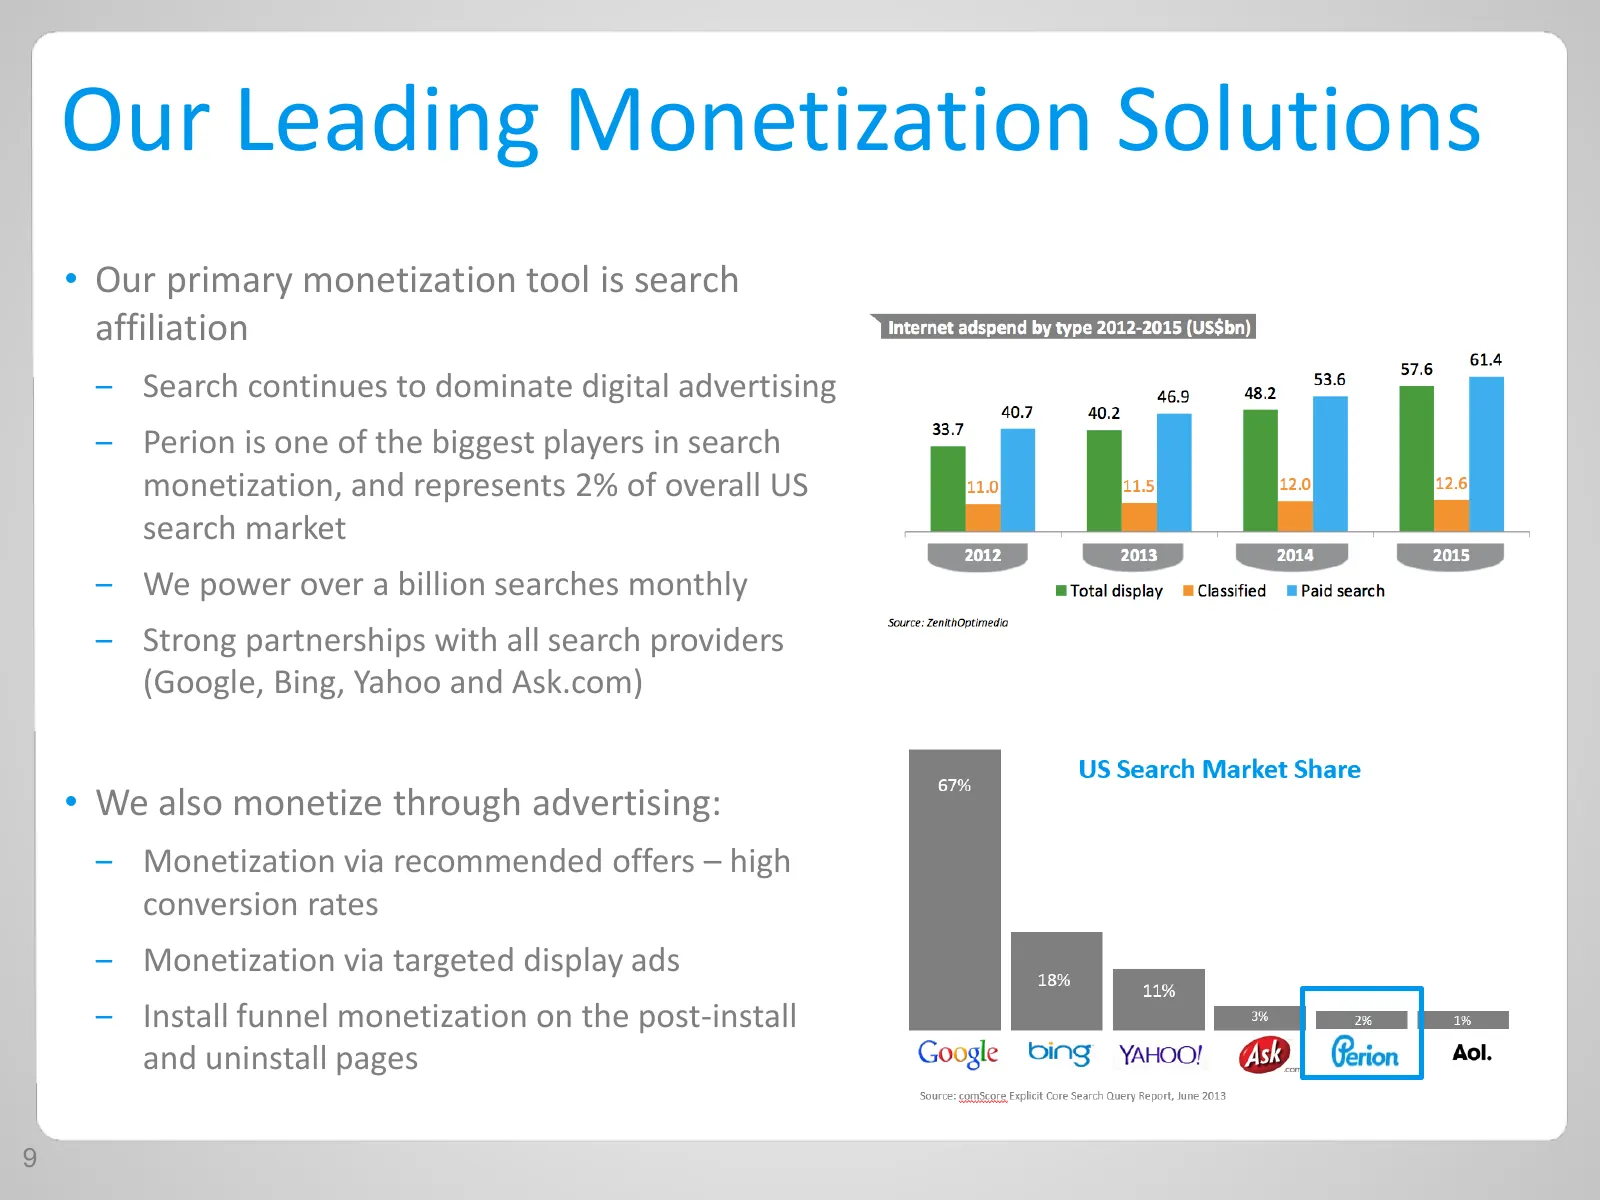
Our Leading Monetization Solutions • Our primary monetization tool is search affiliation ‒ Search continues to dominate digital advertising ‒ Perion is one of the biggest players in search monetization, and represents 2% of overall US search market ‒ We power over a billion searches monthly ‒ Strong
Slide 10: Our Distribution Solution: Install Fuel
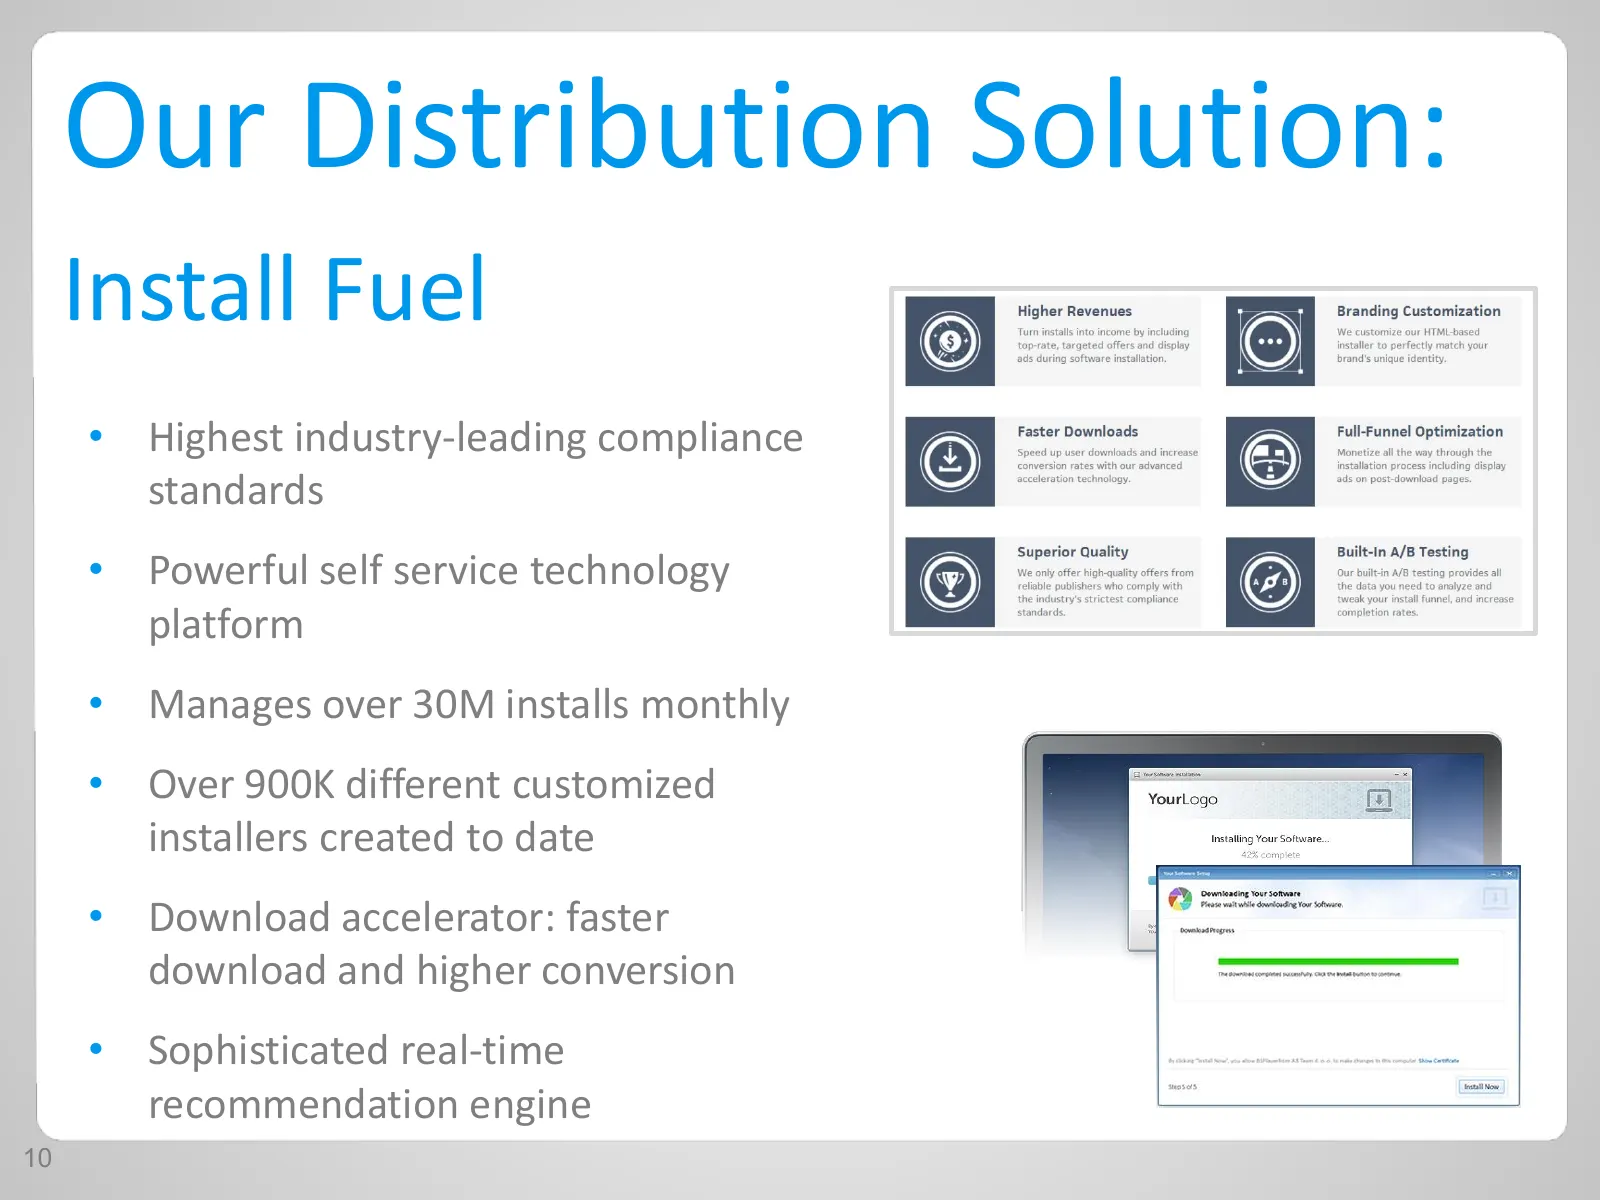
Our Distribution Solution: Install Fuel • Highest industry-leading compliance standards • Powerful self service technology platform • Manages over 30M installs monthly • Over 900K different customized installers created to date • Download accelerator: faster download and higher conversion • Sophisti
Slide 11: Our Distribution Solution – Future Features
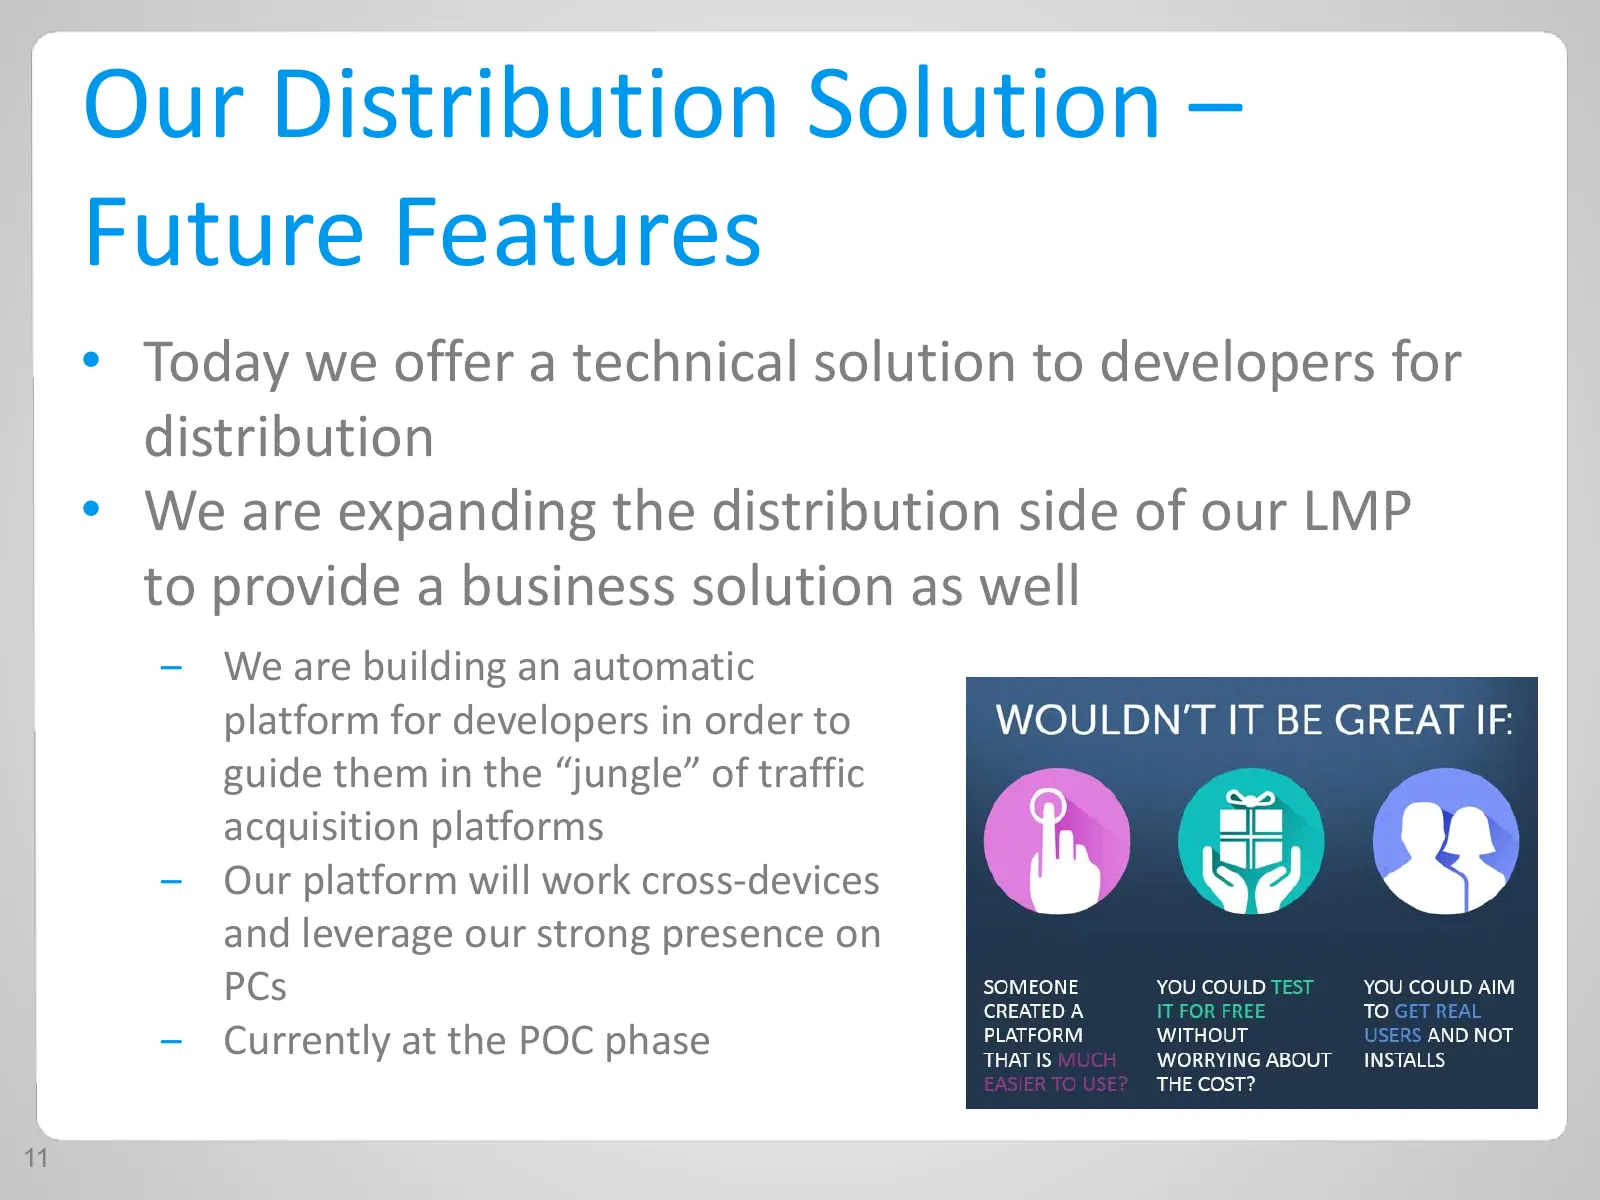
Our Distribution Solution – Future Features • Today we offer a technical solution to developers for distribution • We are expanding the distribution side of our LMP to provide a business solution as well ‒ We are building an automatic platform for developers in order to guide them in the “jungle” of
Slide 12: Analytics Solution: Our Control Center
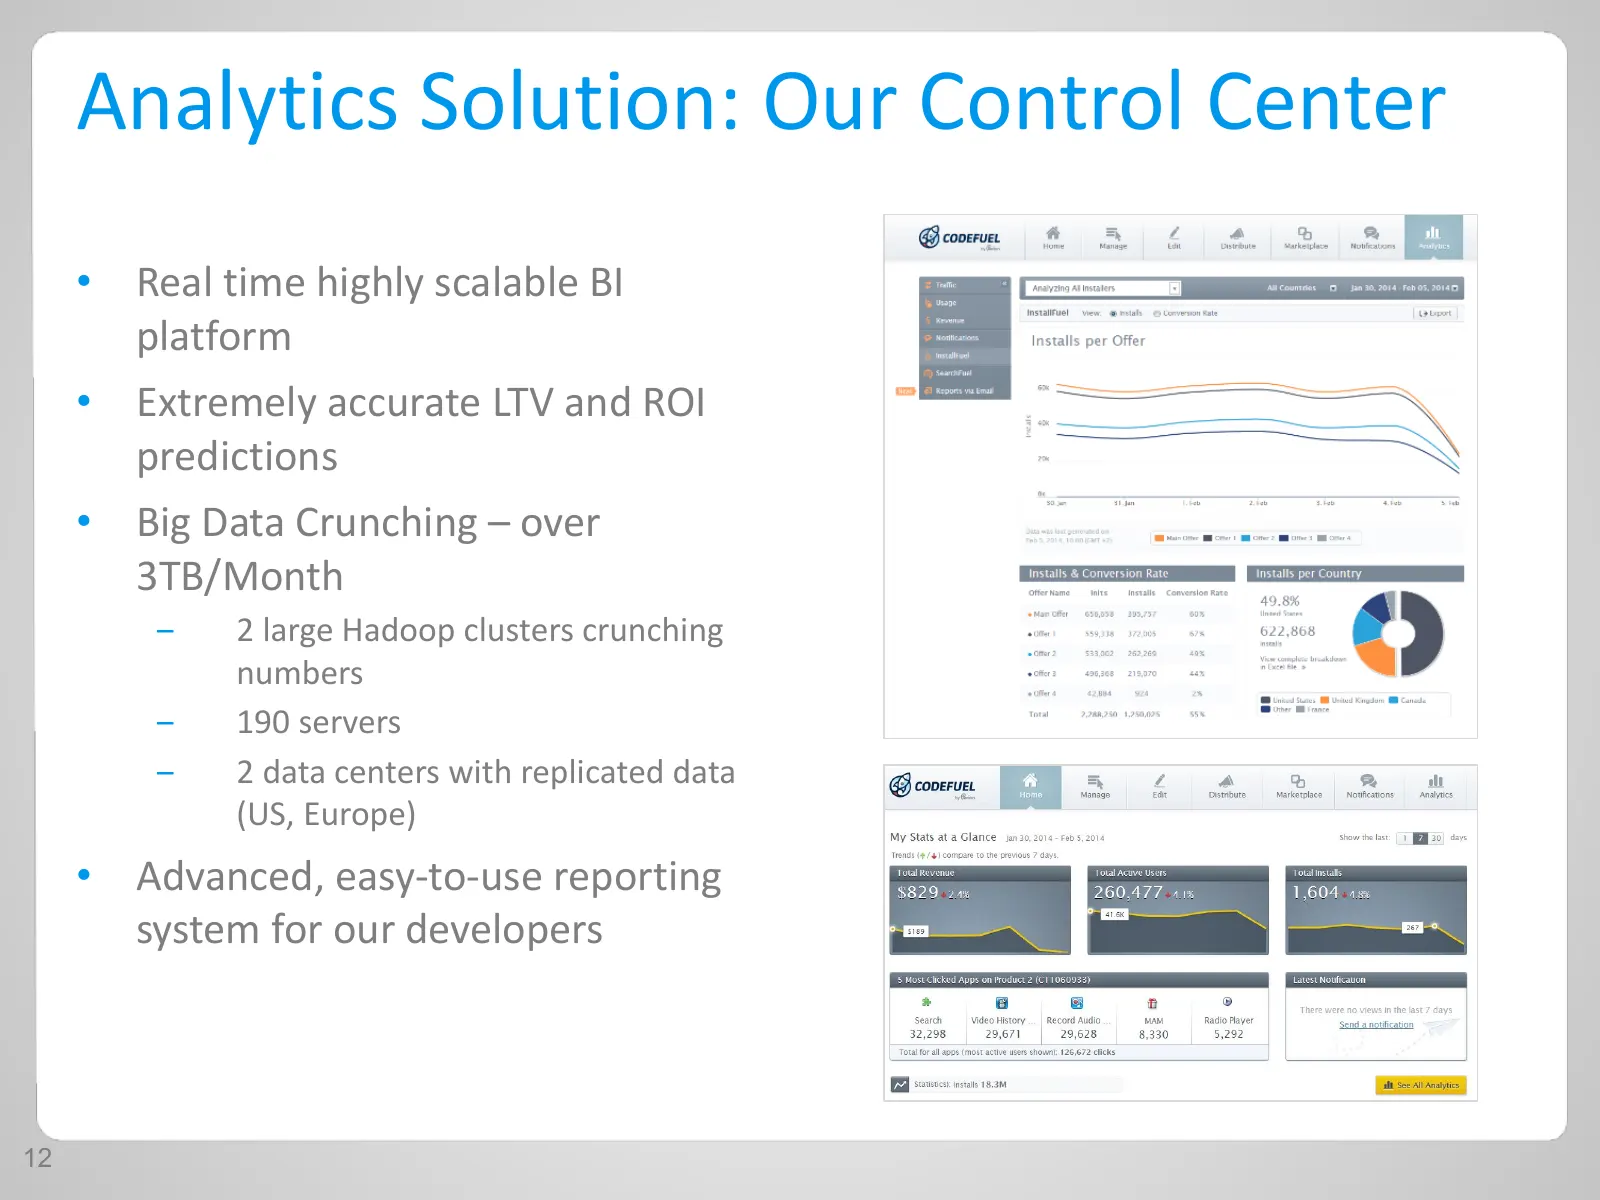
Analytics Solution: Our Control Center • Real time highly scalable BI platform • Extremely accurate LTV and ROI predictions • Big Data Crunching – over 3TB/Month ‒ 2 large Hadoop clusters crunching numbers ‒ 190 servers ‒ 2 data centers with replicated data (US, Europe) • Advanced, easy-to-use repor
Slide 13: What Makes Us Different
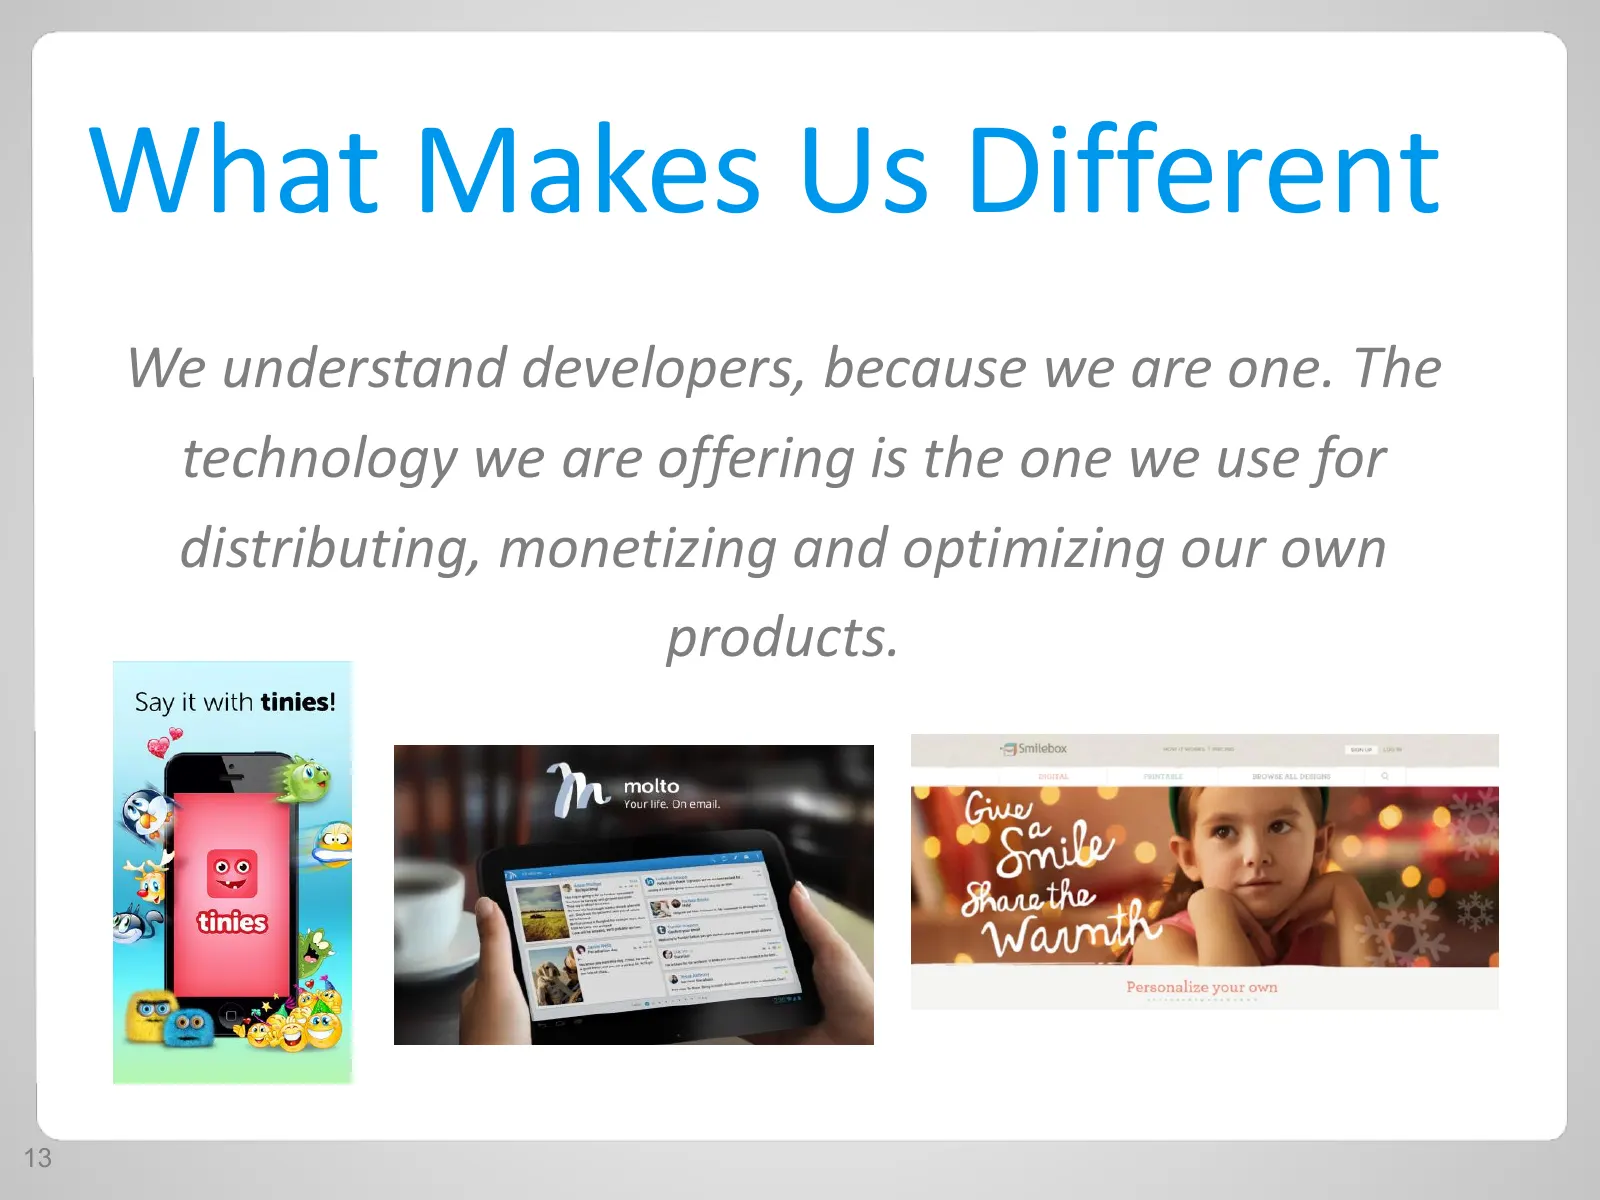
What Makes Us Different We understand developers, because we are one. The technology we are offering is the one we use for distributing, monetizing and optimizing our own products. 13

Slide 14: Looking Ahead…
Looking Ahead… 14
Slide 15: Material Upside for Mobile Advertising
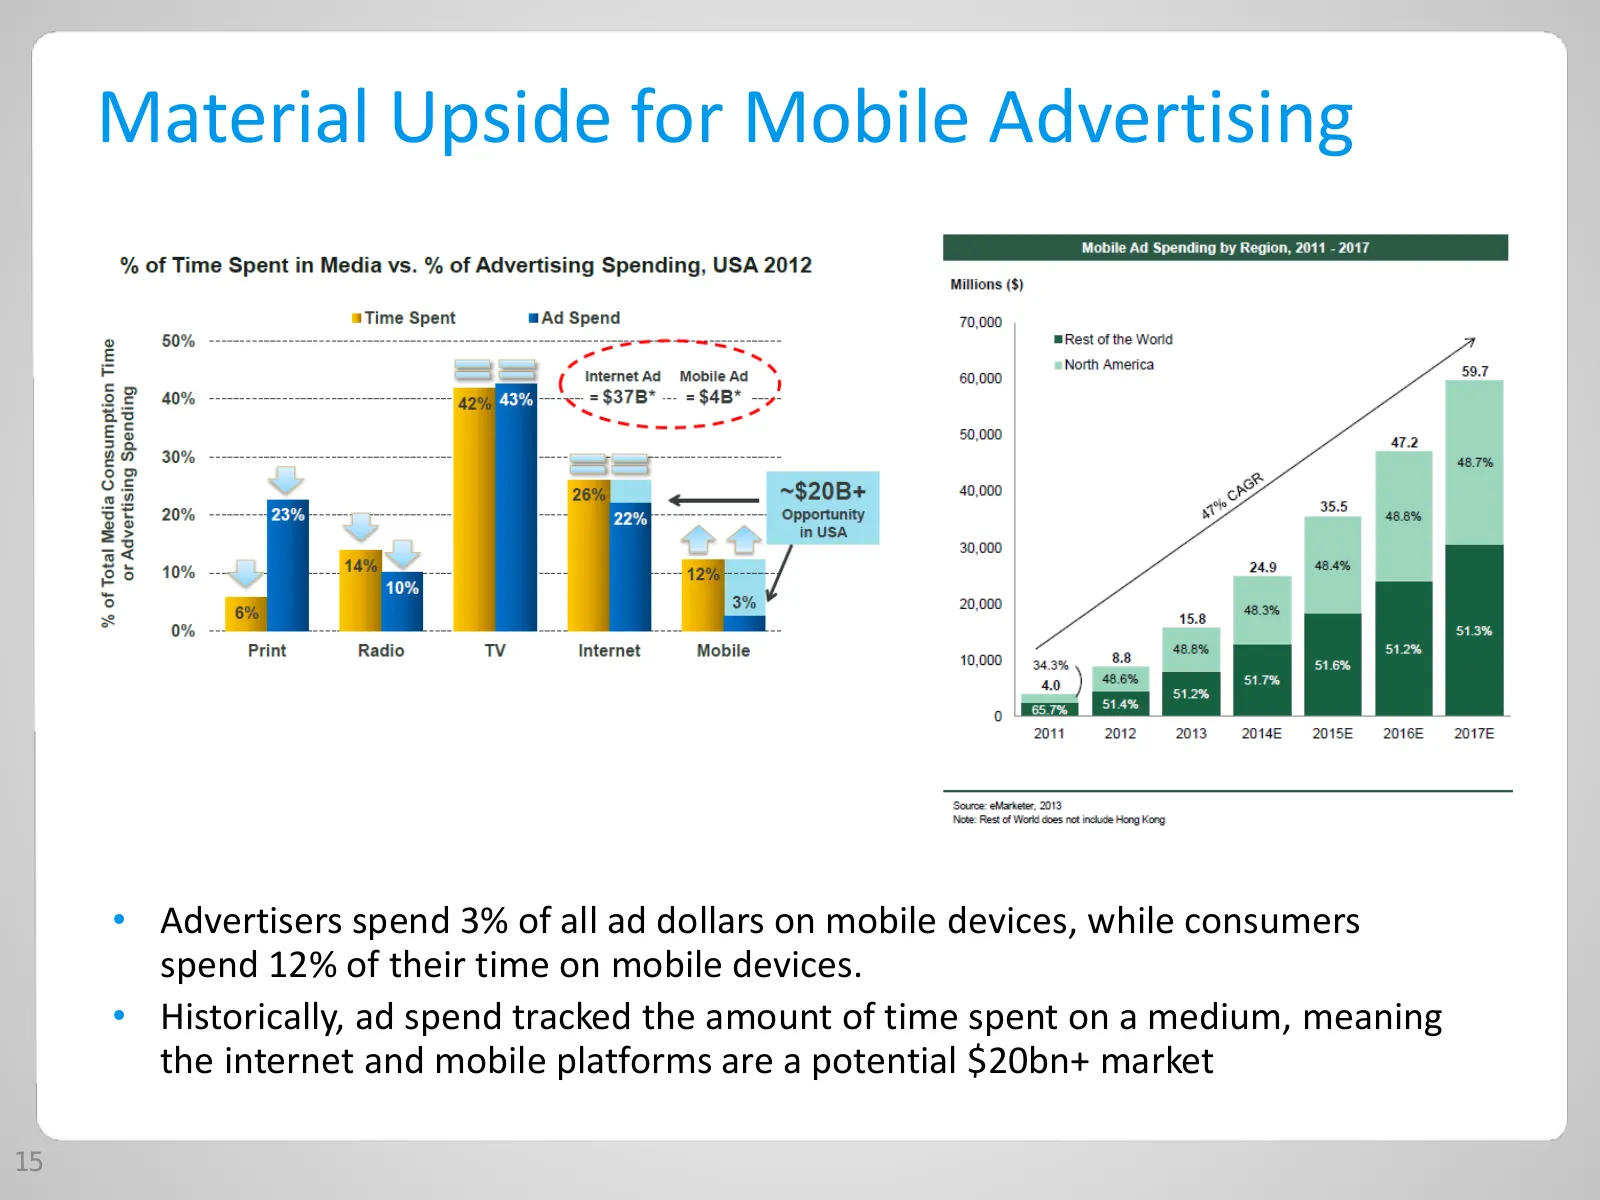
Material Upside for Mobile Advertising • Advertisers spend 3% of all ad dollars on mobile devices, while consumers spend 12% of their time on mobile devices. • Historically, ad spend tracked the amount of time spent on a medium, meaning the internet and mobile platforms are a potential $20bn+ market
Slide 16: Rise of Programmatic Display Advertising
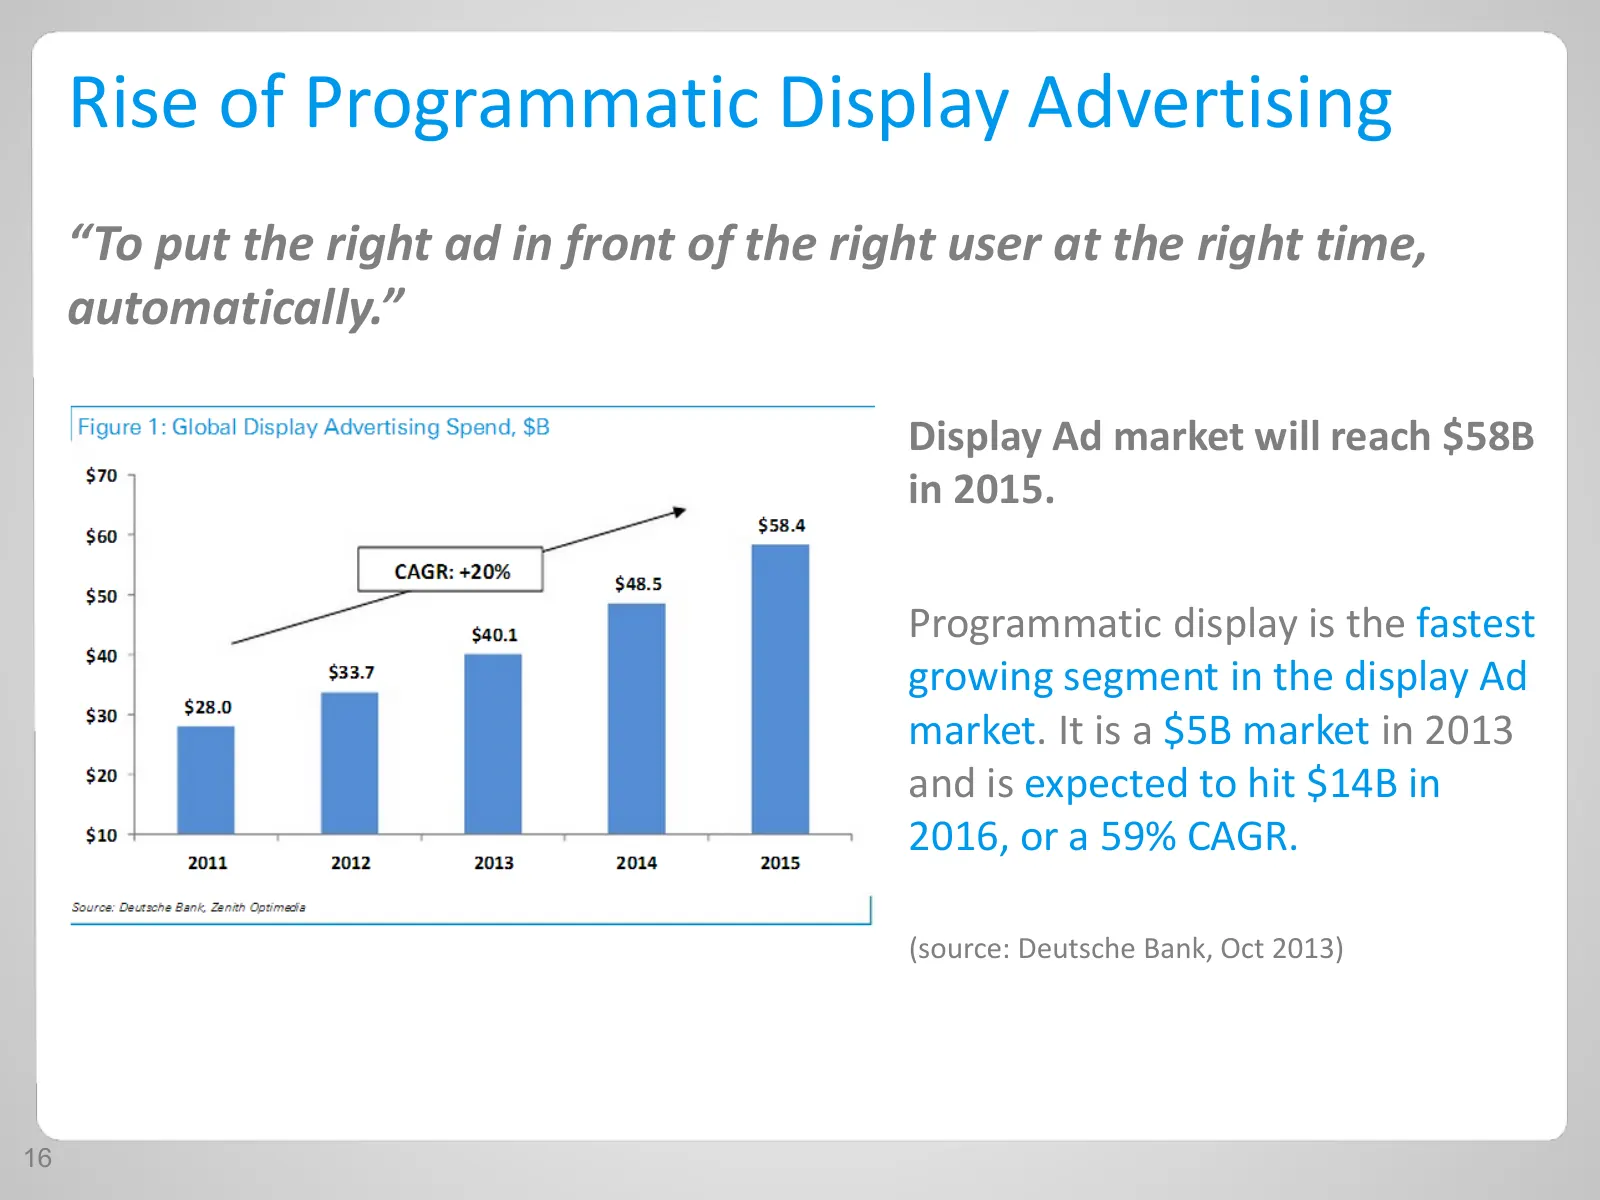
Rise of Programmatic Display Advertising “To put the right ad in front of the right user at the right time, automatically.” Display Ad market will reach $58B in 2015. Programmatic display is the fastest growing segment in the display Ad market. It is a $5B market in 2013 and is expected to hit $14B
Slide 17: Growth Driver: Mobile Expansion
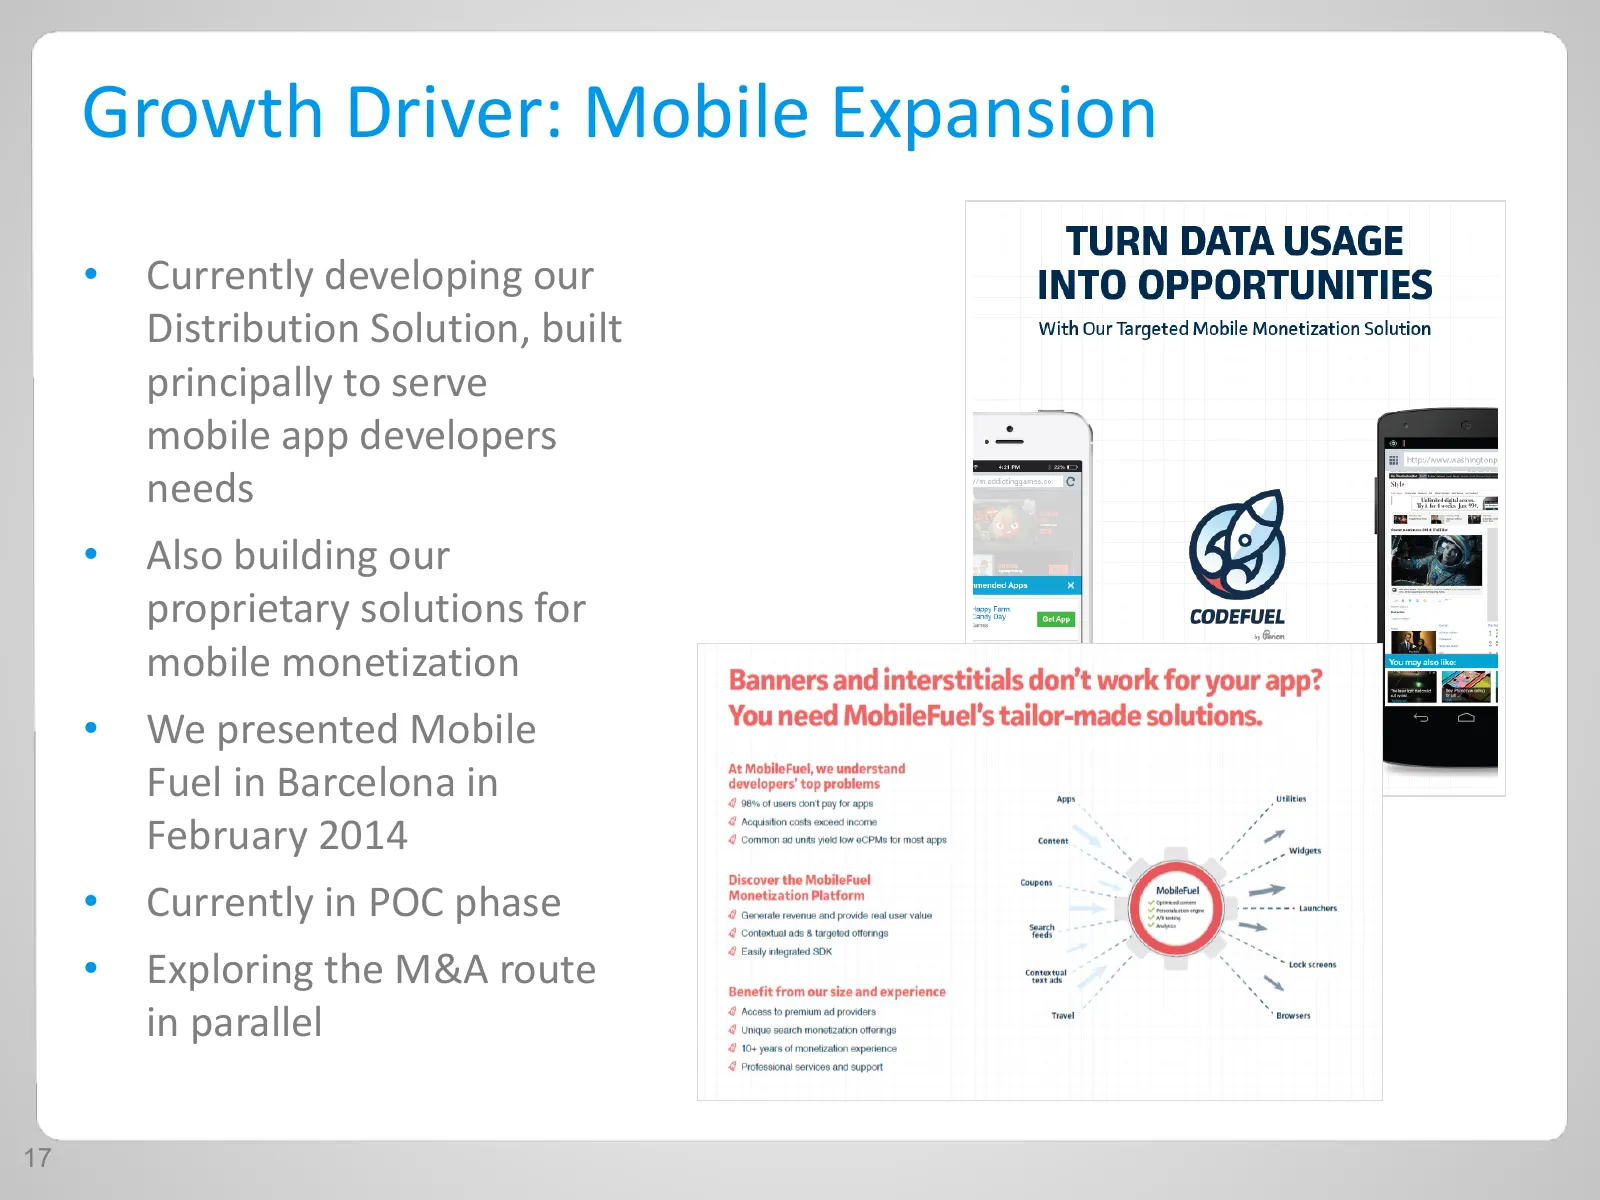
Growth Driver: Mobile Expansion • Currently developing our Distribution Solution, built principally to serve mobile app developers needs • Also building our proprietary solutions for mobile monetization • We presented Mobile Fuel in Barcelona in February 2014 • Currently in POC phase • Exploring the
Slide 18: Organic Growth Driver: Data Driven Advertising
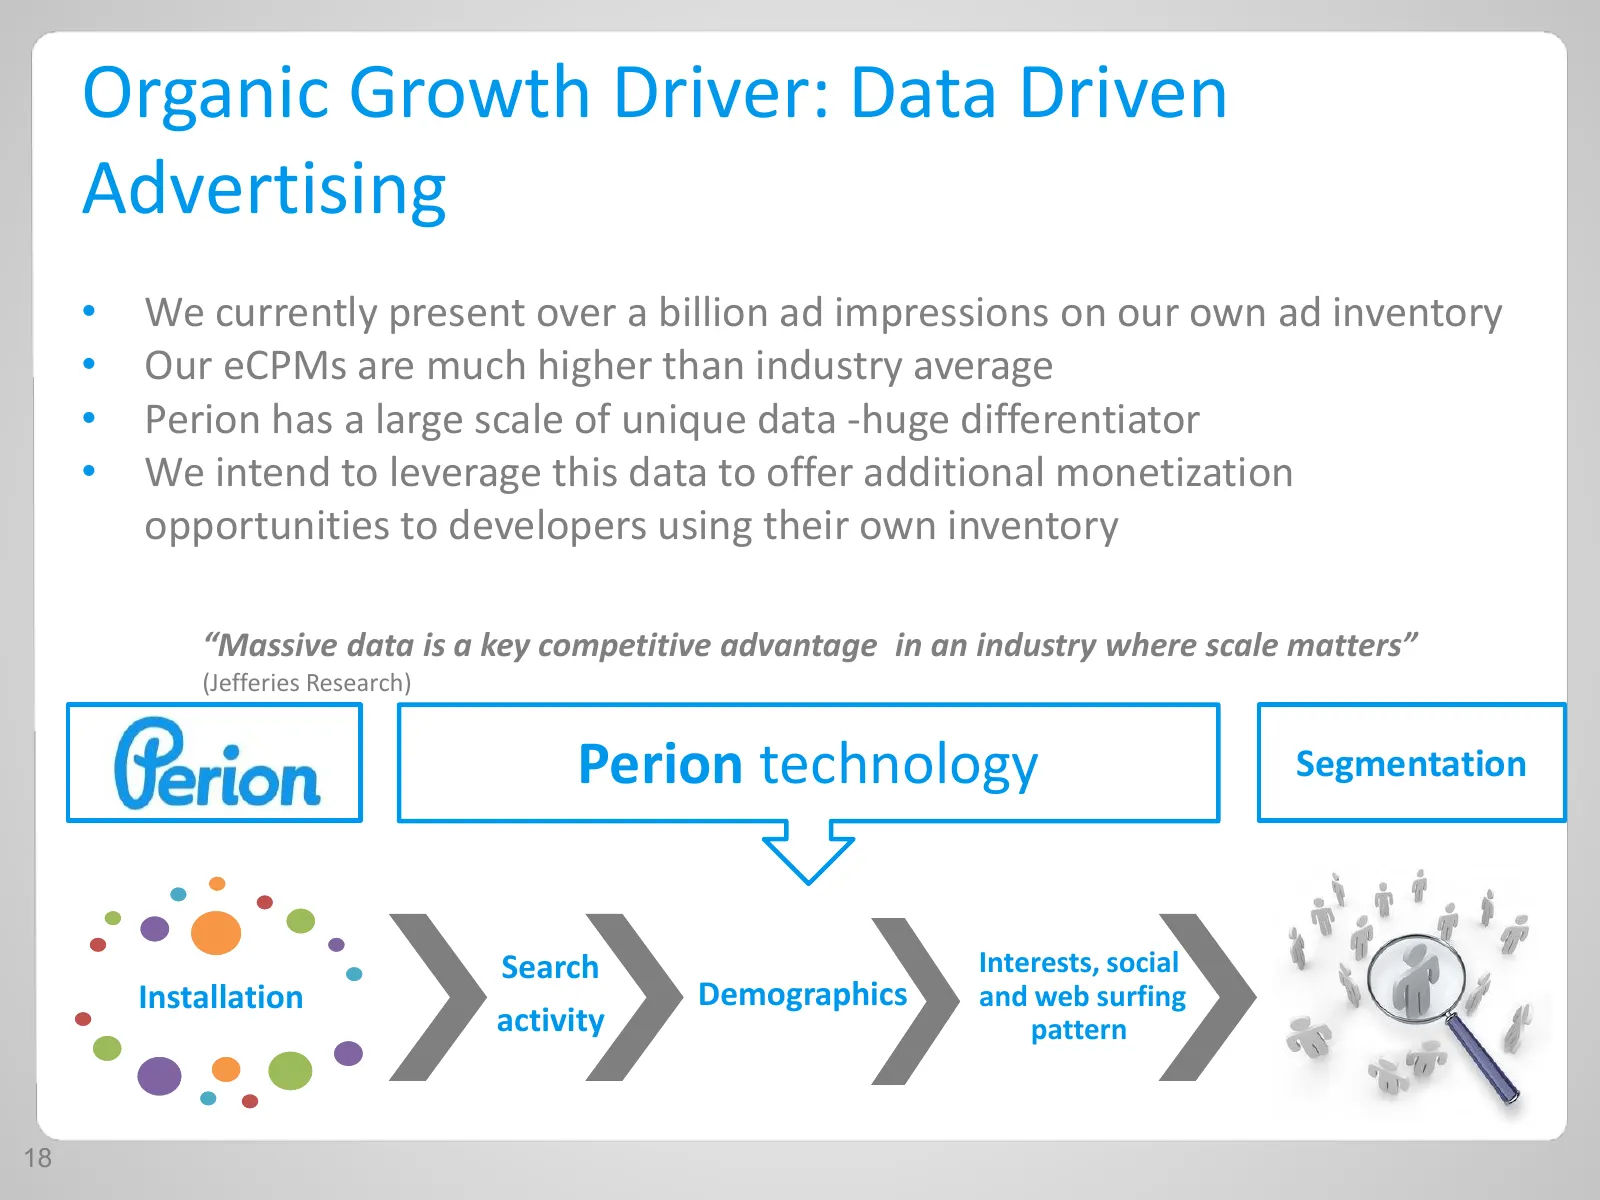
Organic Growth Driver: Data Driven Advertising • We currently present over a billion ad impressions on our own ad inventory • Our eCPMs are much higher than industry average • Perion has a large scale of unique data -huge differentiator • We intend to leverage this data to offer additional monetizat

Slide 19: Growth Driver: Expanding our Global Footprint
Growth Driver: Expanding our Global Footprint • Strong and recognized B2B brand • Present at all the biggest industry conferences • Our LMP is a unique offering for developers • Strong momentum and increase in market share 19
Slide 20: Financial Highlights
Financial Highlights 20
Slide 21: Perion & ClientConnect 2013 Financial Results
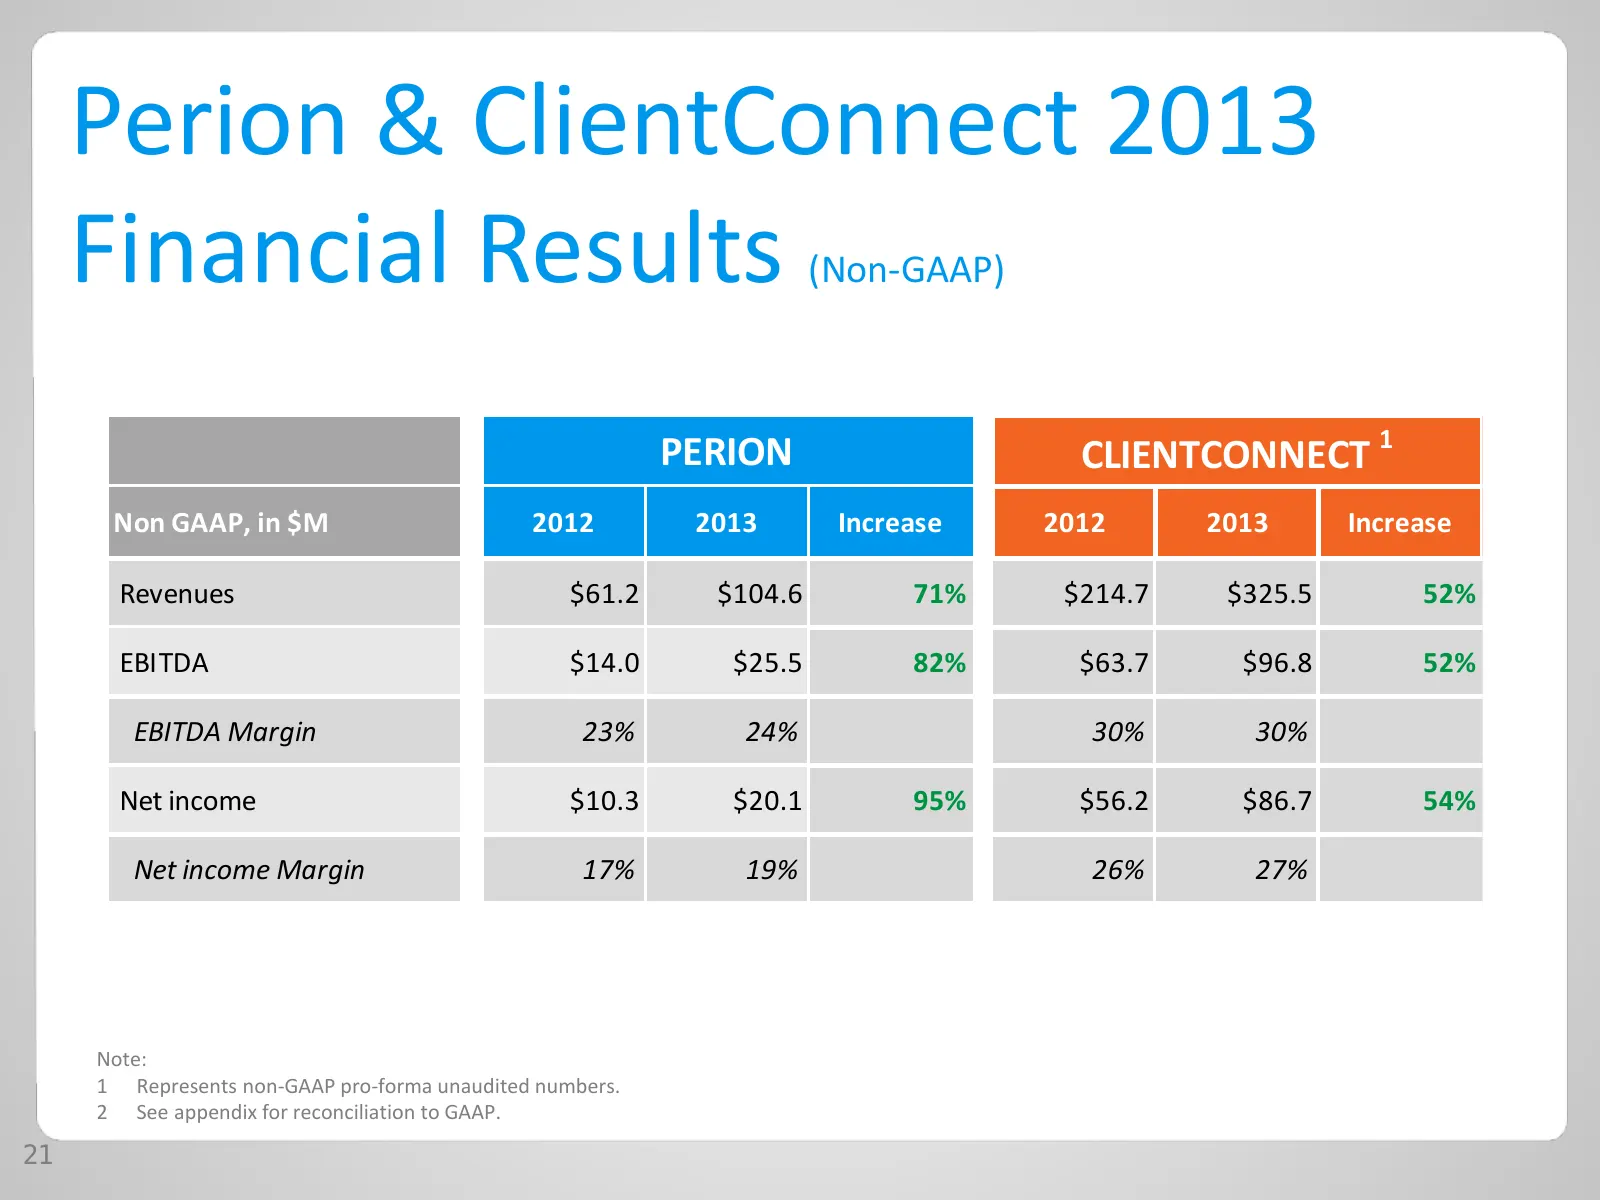
Perion & ClientConnect 2013 Financial Results (Non-GAAP) PERION CLIENTCONNECT 1 Non GAAP, in $M 2012 2013 Increase 2012 2013 Increase Revenues $61.2 $104.6 71% $214.7 $325.5 52% EBITDA $14.0 $25.5 82% $63.7 $96.8 52% EBITDA Margin 23% 24% 30% 30% Net income $10.3 $20.1 95% $56.2 $86.7 54% Net income
Slide 22: Pro Forma Combined Revenue Snapshot
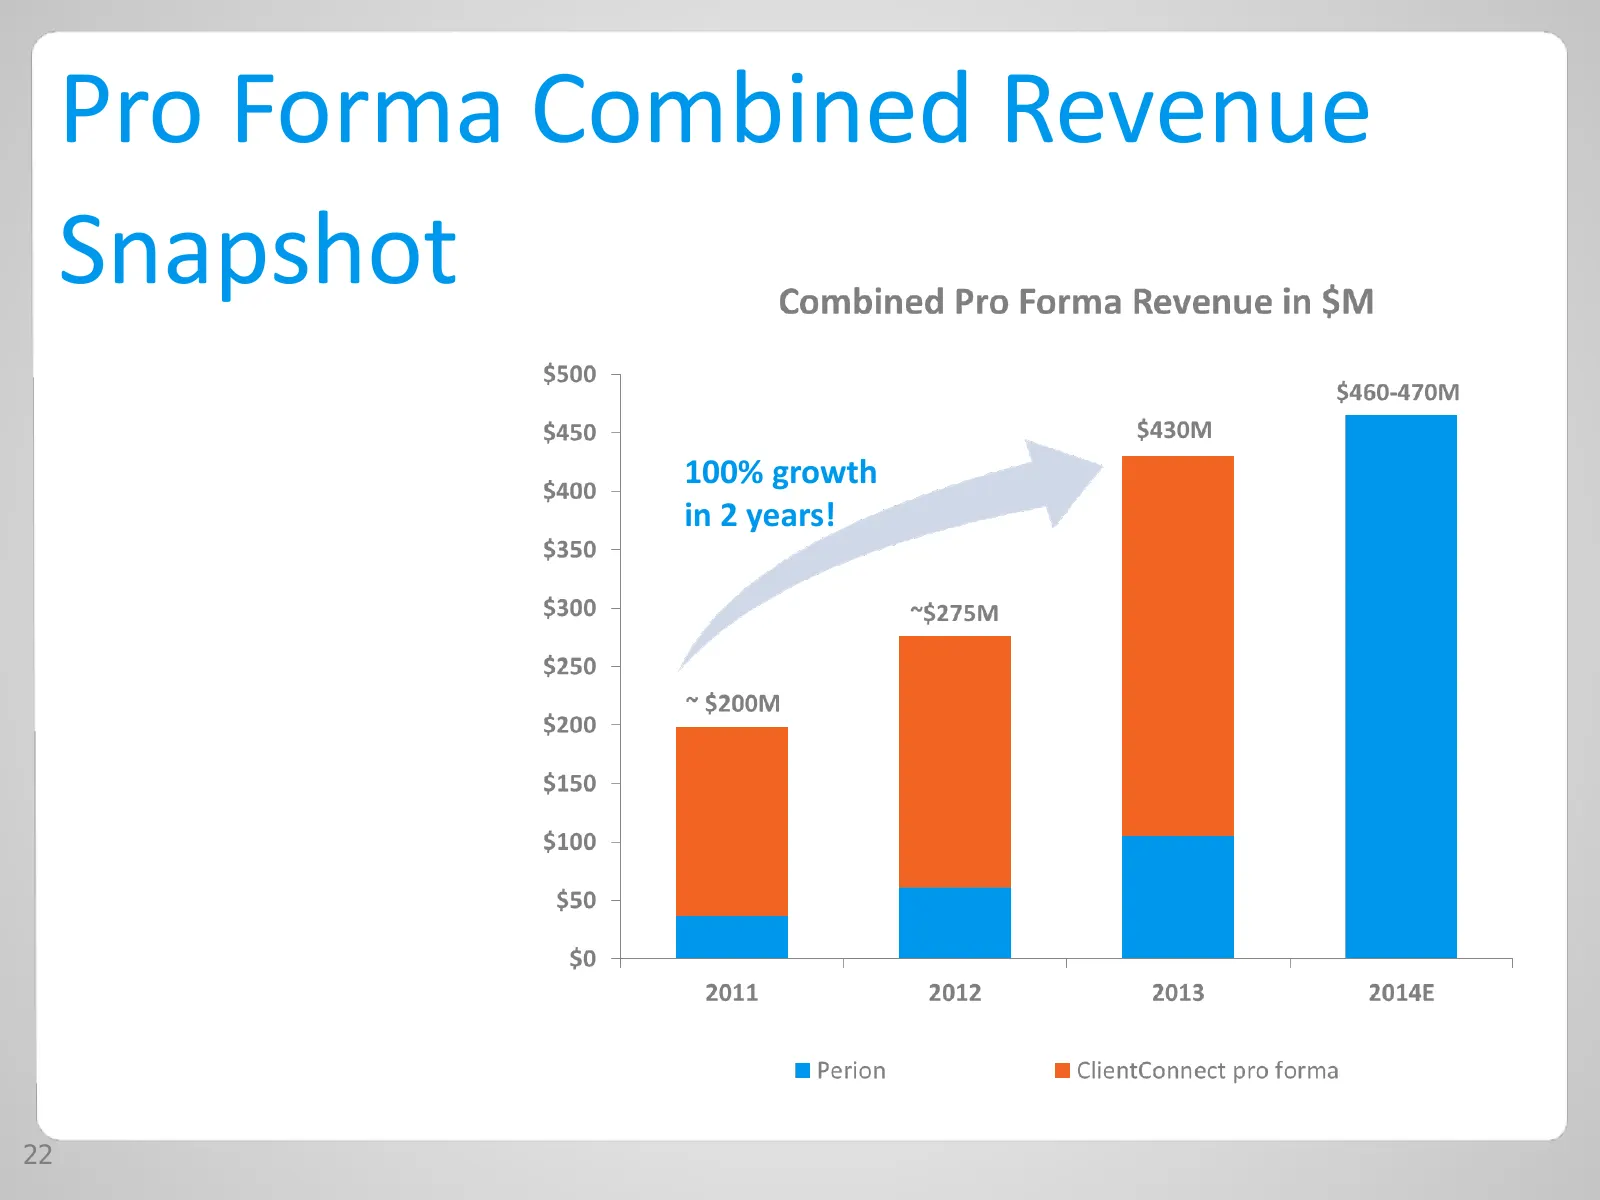
Pro Forma Combined Revenue Snapshot 100% growth in 2 years! 22
Slide 23: Key Takeaways…
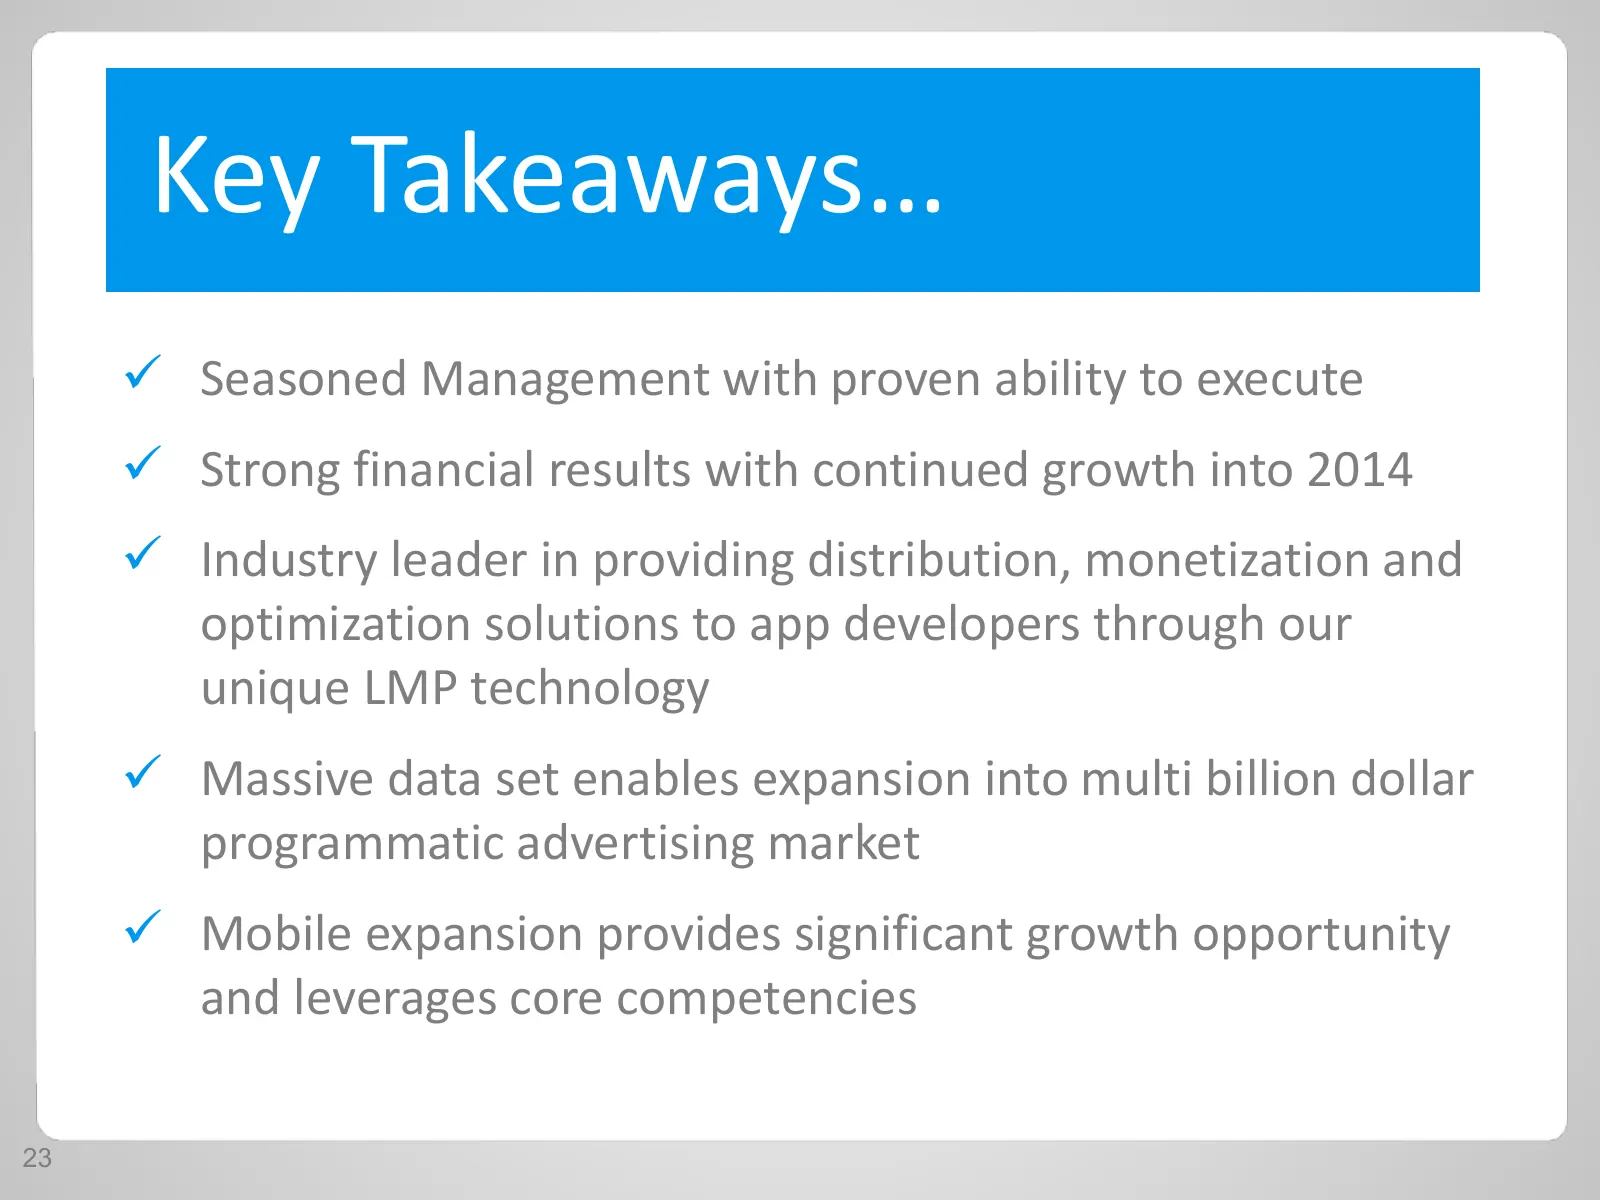
Key Takeaways… Seasoned Management with proven ability to execute Strong financial results with continued growth into 2014 Industry leader in providing distribution, monetization and optimization solutions to app developers through our unique LMP technology Massive data set enables expansion
Slide 24: Appendix: GAAP Reconciliation
Appendix: GAAP Reconciliation 24
Slide 25: GAAP Reconciliation
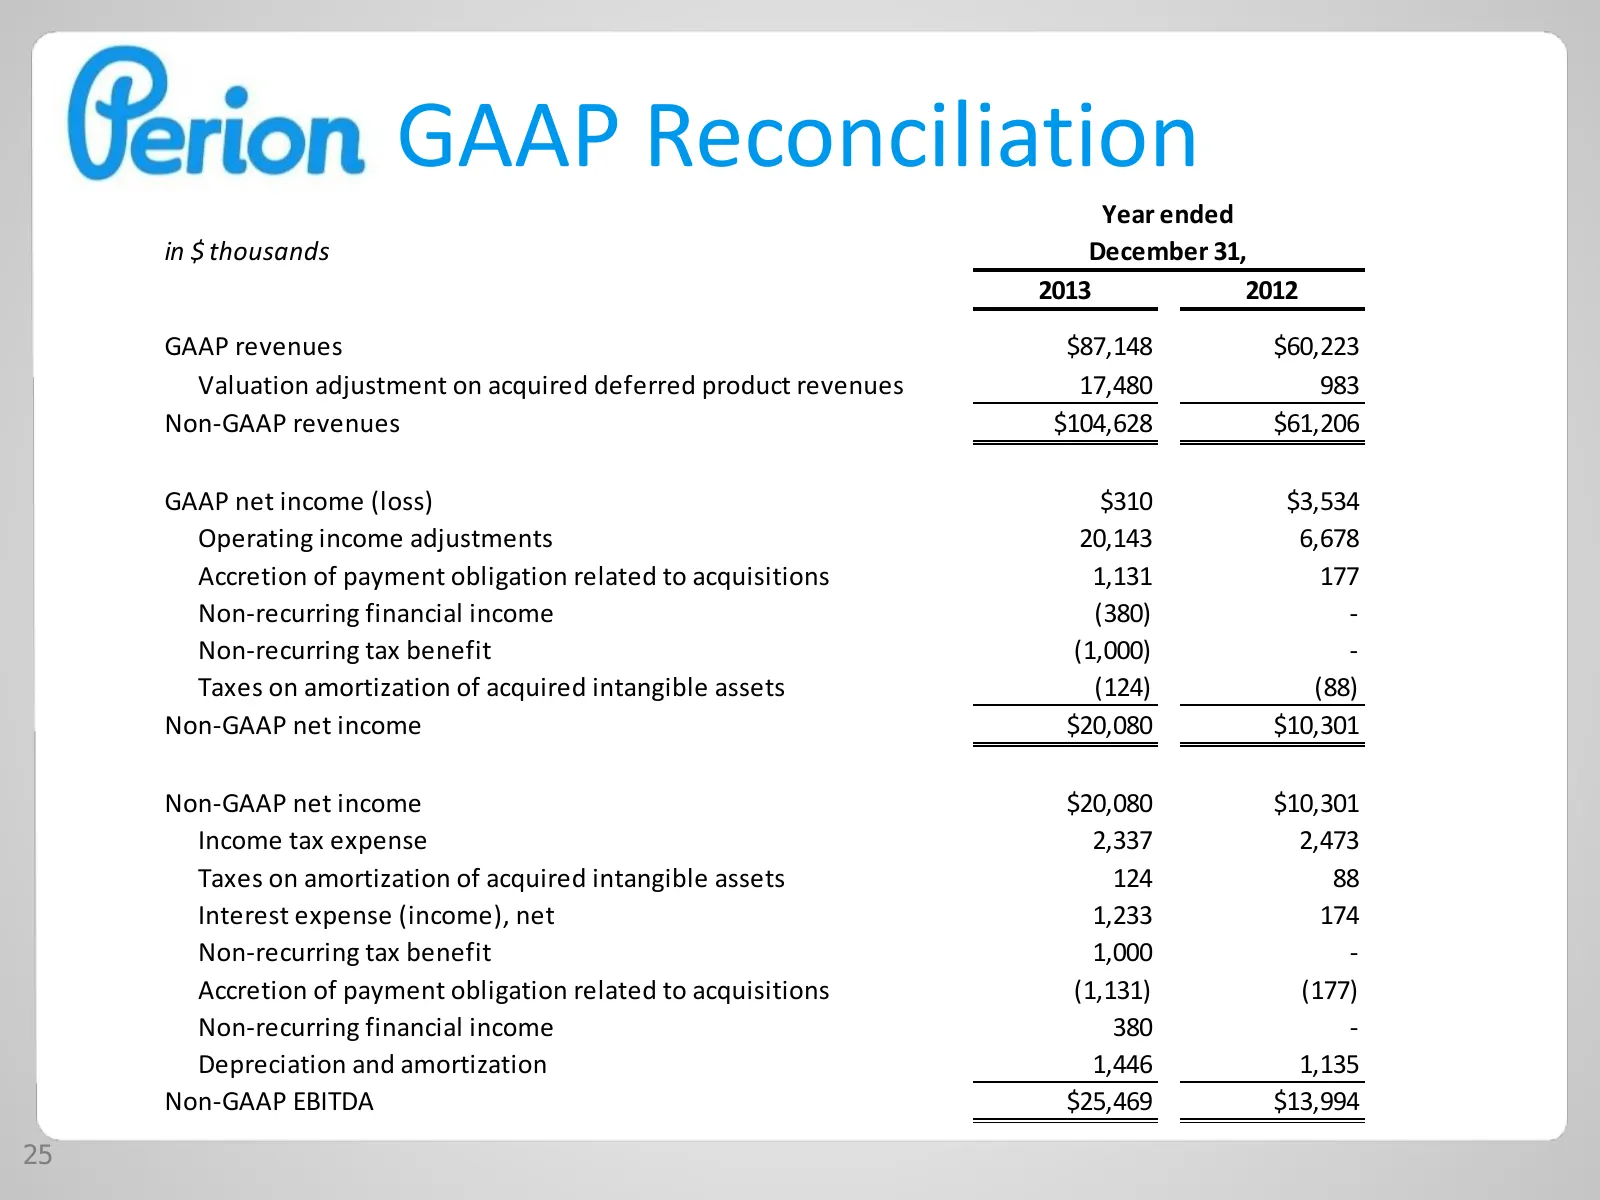
GAAP Reconciliation Year ended in $ thousands December 31, 2013 2012 GAAP revenues $87,148 $60,223 Valuation adjustment on acquired deferred product revenues 17,480 983 Non-GAAP revenues $104,628 $61,206 GAAP net income (loss) $310 $3,534 Operating income adjustments 20,143 6,678 Accretion of paymen
Slide 26: GAAP Reconciliation
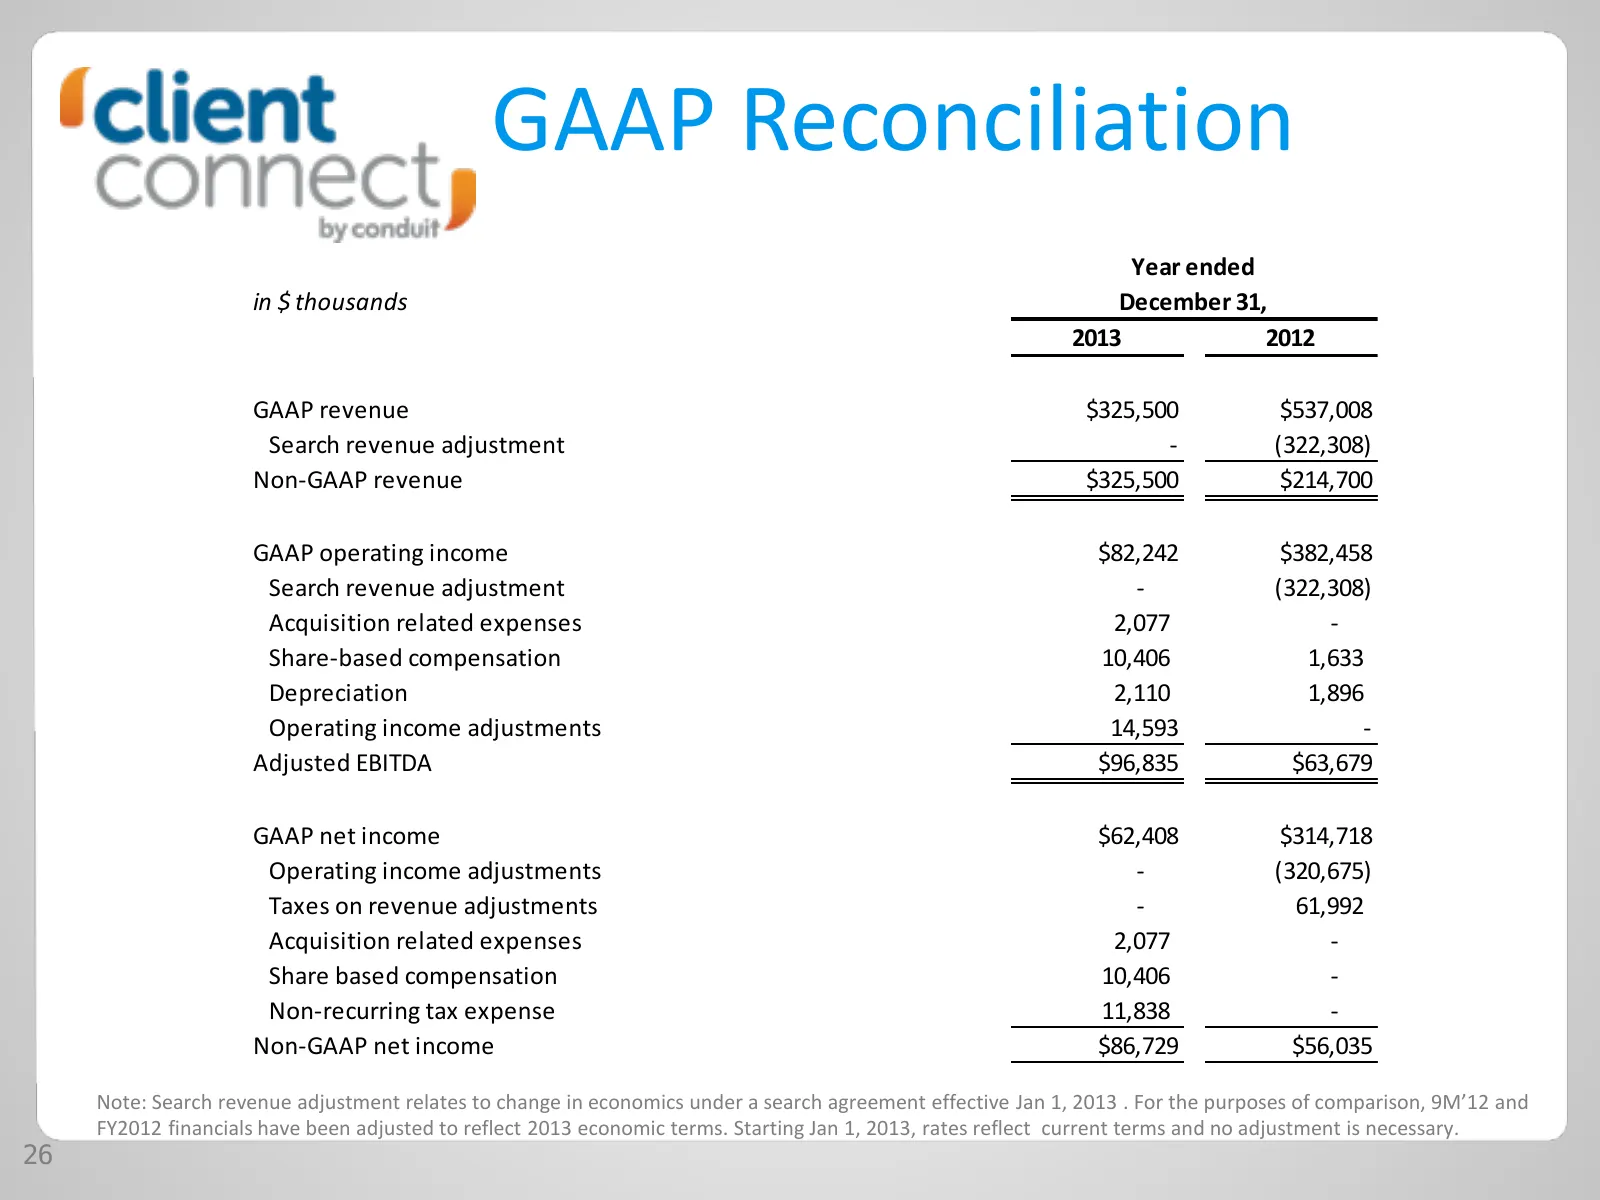
GAAP Reconciliation Year ended in $ thousands December 31, 2013 2012 GAAP revenue $325,500 $537,008 Search revenue adjustment - (322,308) Non-GAAP revenue $325,500 $214,700 GAAP operating income $82,242 $382,458 Search revenue adjustment - (322,308) Acquisition related expenses 2,077 - Share-based c
Source: Internet Archive copy of perion.com
More decks from Perion Network Ltd
 Q2 2026 Earnings Presentation43 slides · Aug 10, 2026
 Investor Presentation (August 2026)83 slides · August 2026
 Investor Presentation (June 2026)80 slides · Jun 29, 2026
 Q1 2026 Earnings Presentation39 slides · May 20, 2026
 Q4 2025 Earnings Presentation54 slides · Feb 18, 2026
 Q3 2025 Earnings Presentation40 slides · Nov 12, 2025