Samsara Inc. · NYSE:IOT
Samsara — Investor Day (June 2026)
80 slides from Samsara's investor day presentation, Jun 24, 2026

Slide 1: June 24, 2026 • Las Vegas, NV
June 24, 2026 • Las Vegas, NV
Slide 2: Disclaimer and Statement Regarding Use of Non-GAAP Measures
Disclaimer and Statement Regarding Use of Non-GAAP Measures This presentation contains forward-looking statements within the meaning of Section 27A of the Securities Act of 1933 and The trademarks included herein are the property of the owners thereof and are used for reference purposes only. Such u
Slide 3: Agenda
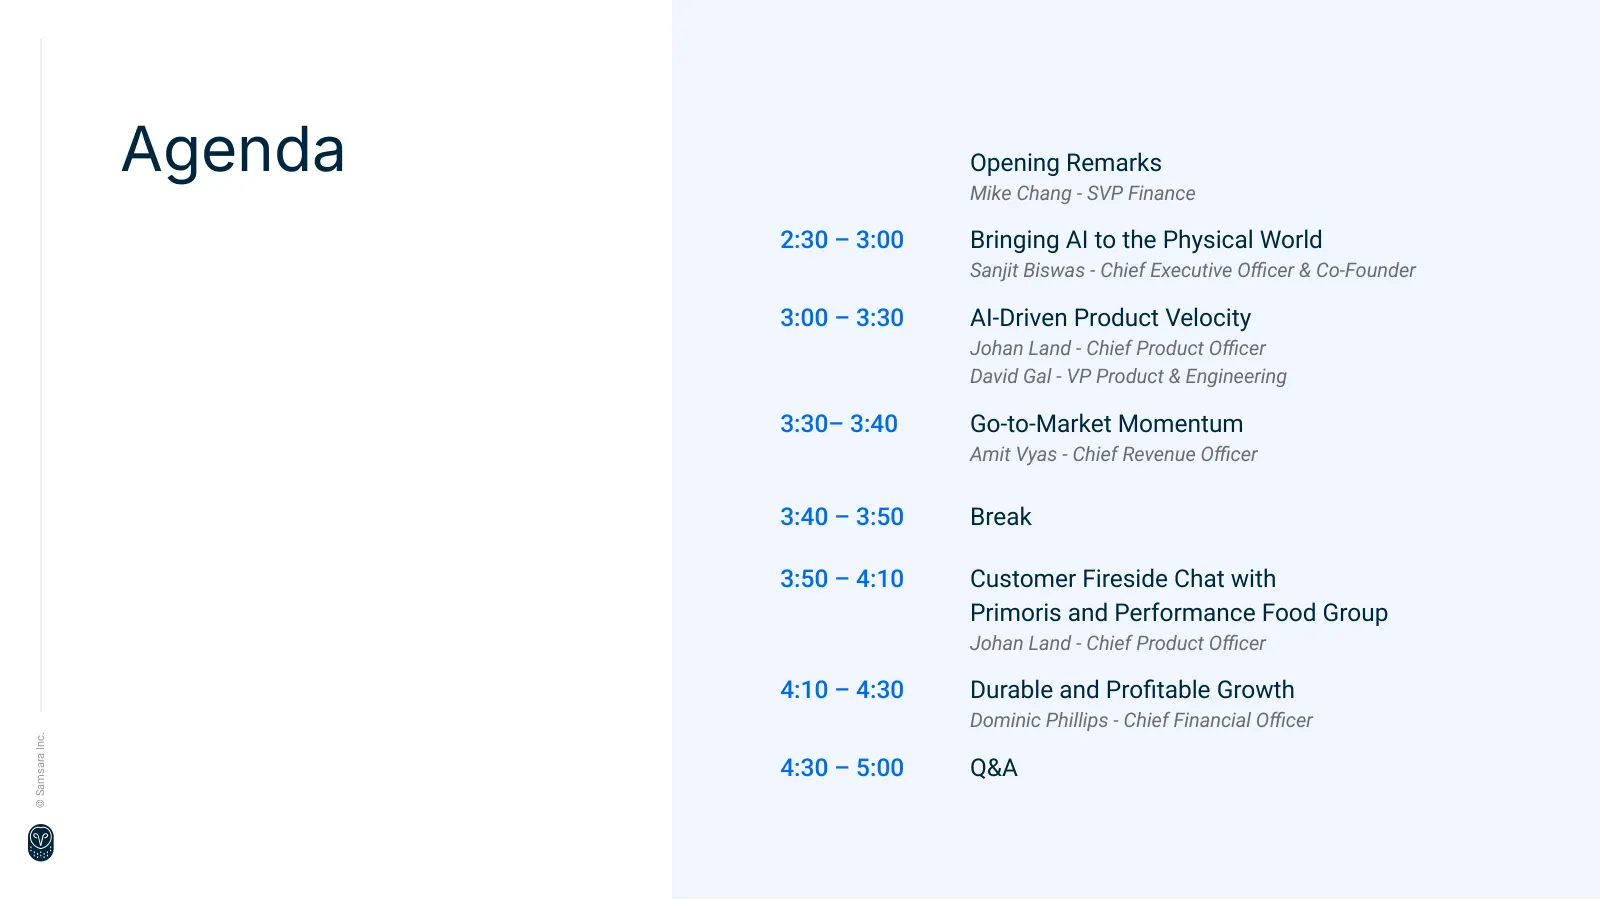
Agenda Agenda Opening Remarks Mike Chang - SVP Finance 2:30 – 3:00 Bringing AI to the Physical World Sanjit Biswas - Chief Executive Officer & Co-Founder 3:00 – 3:30 AI-Driven Product Velocity Johan Land - Chief Product Officer David Gal - VP Product & Engineering 3:30– 3:40 Go-to-Market Momentum Amit V

Slide 4: Bringing AI to the Physical World
Bringing AI to the Physical World Sanjit Biswas Chief Executive Officer & Co-Founder
Slide 5: Our Mission
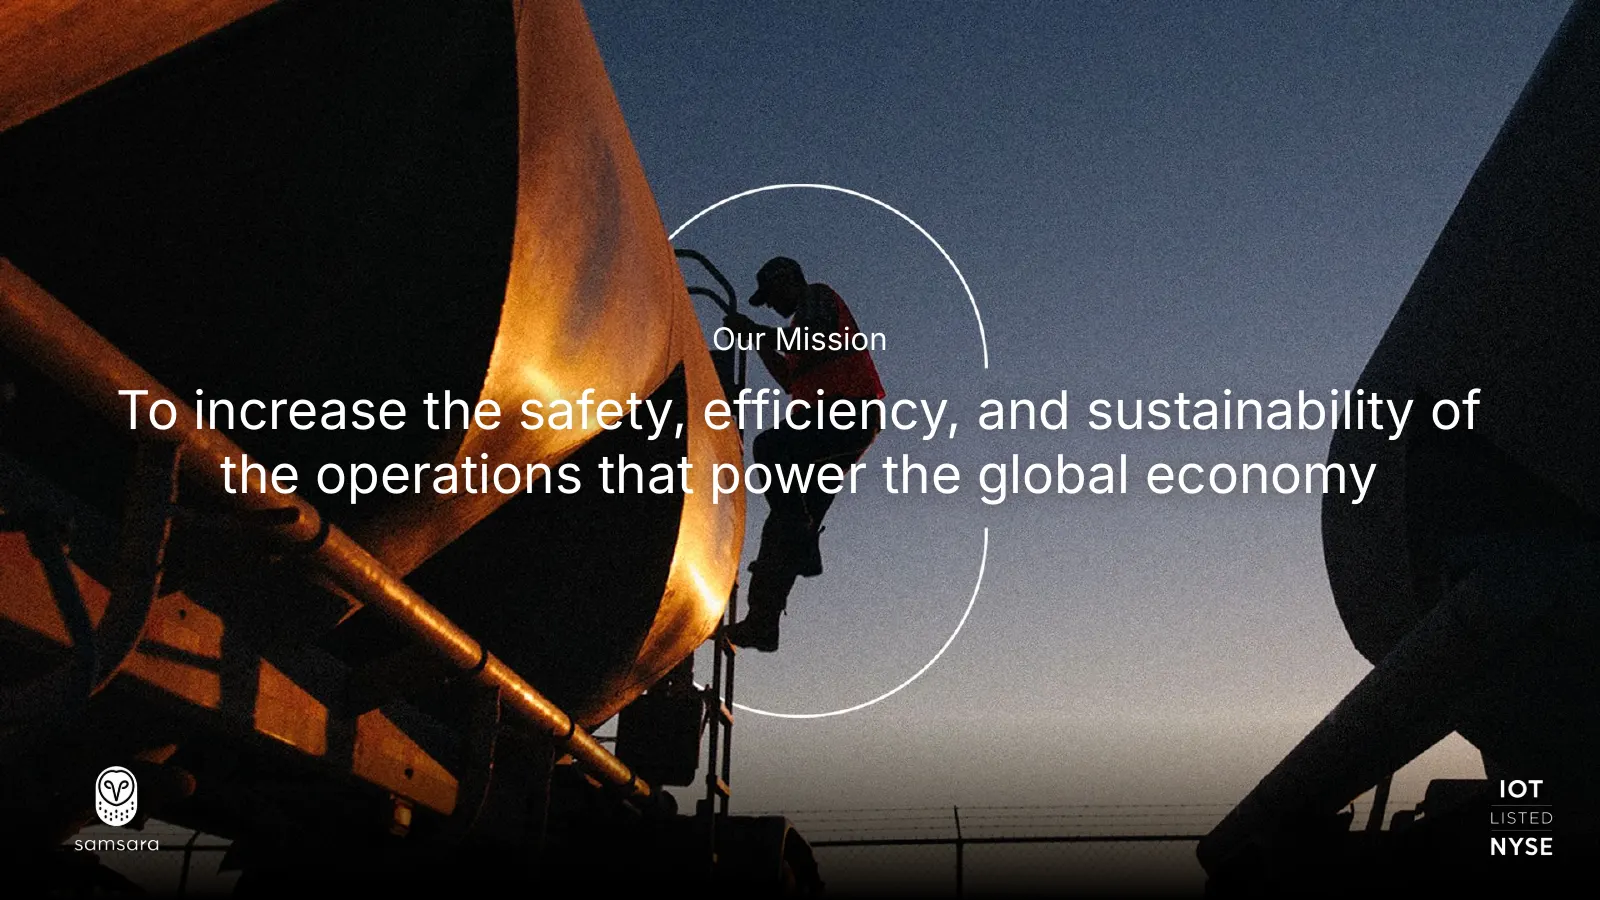
Our Mission To increase the safety, efficiency, and sustainability of the operations that power the global economy
Slide 6: AI is transitioning from the digital to the physical world
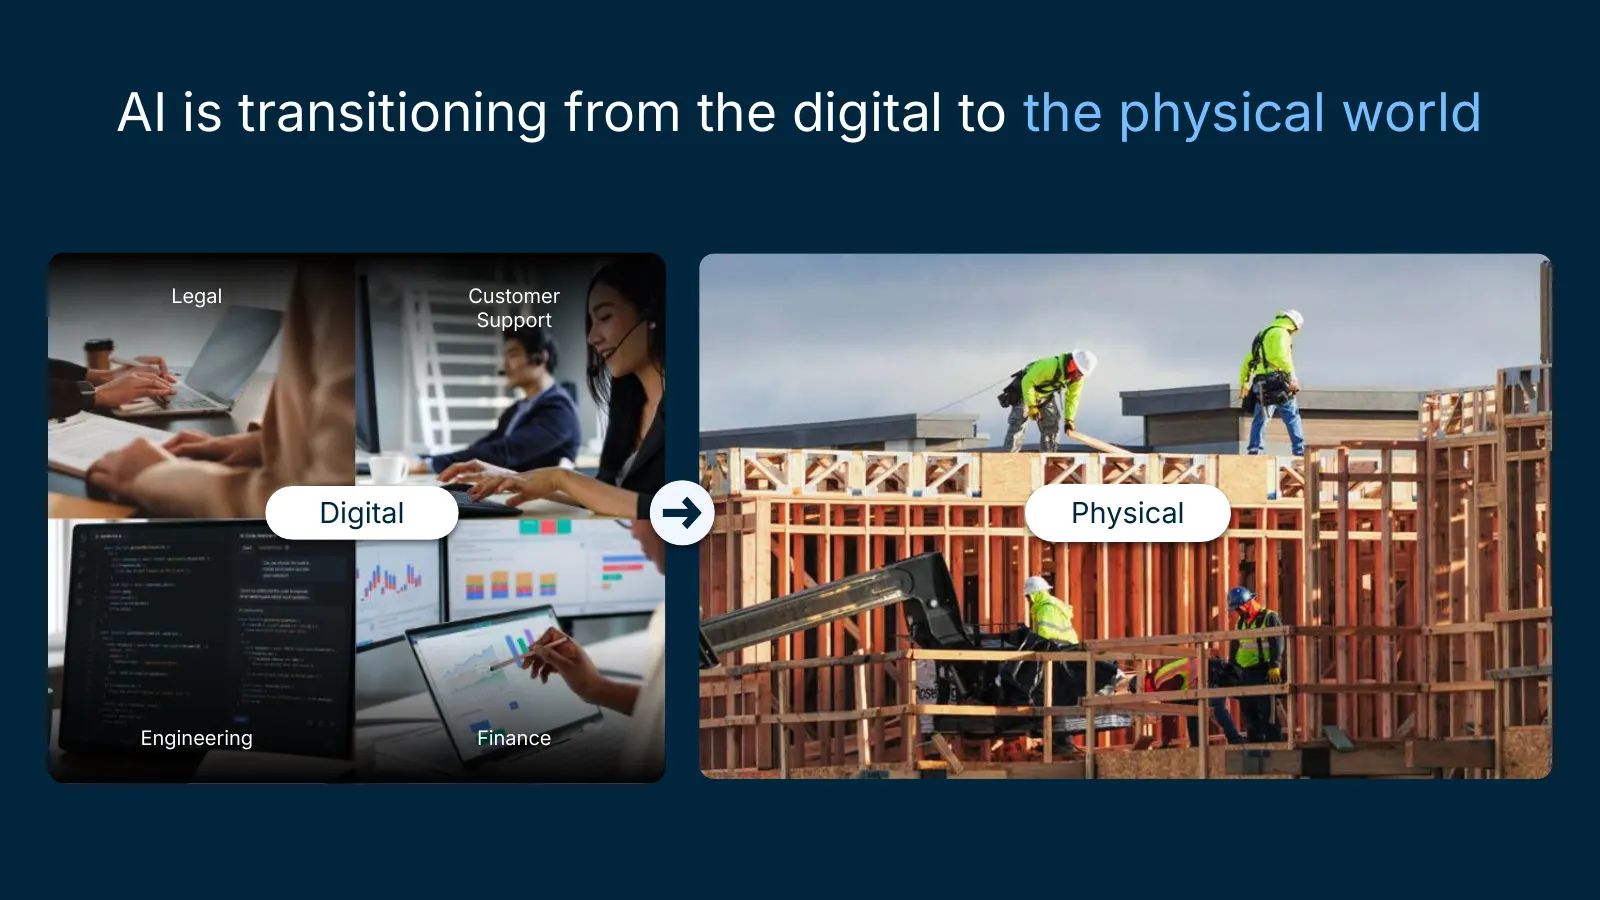
AI is transitioning from the digital to the physical world Legal Customer Support Digital Physical Engineering Finance
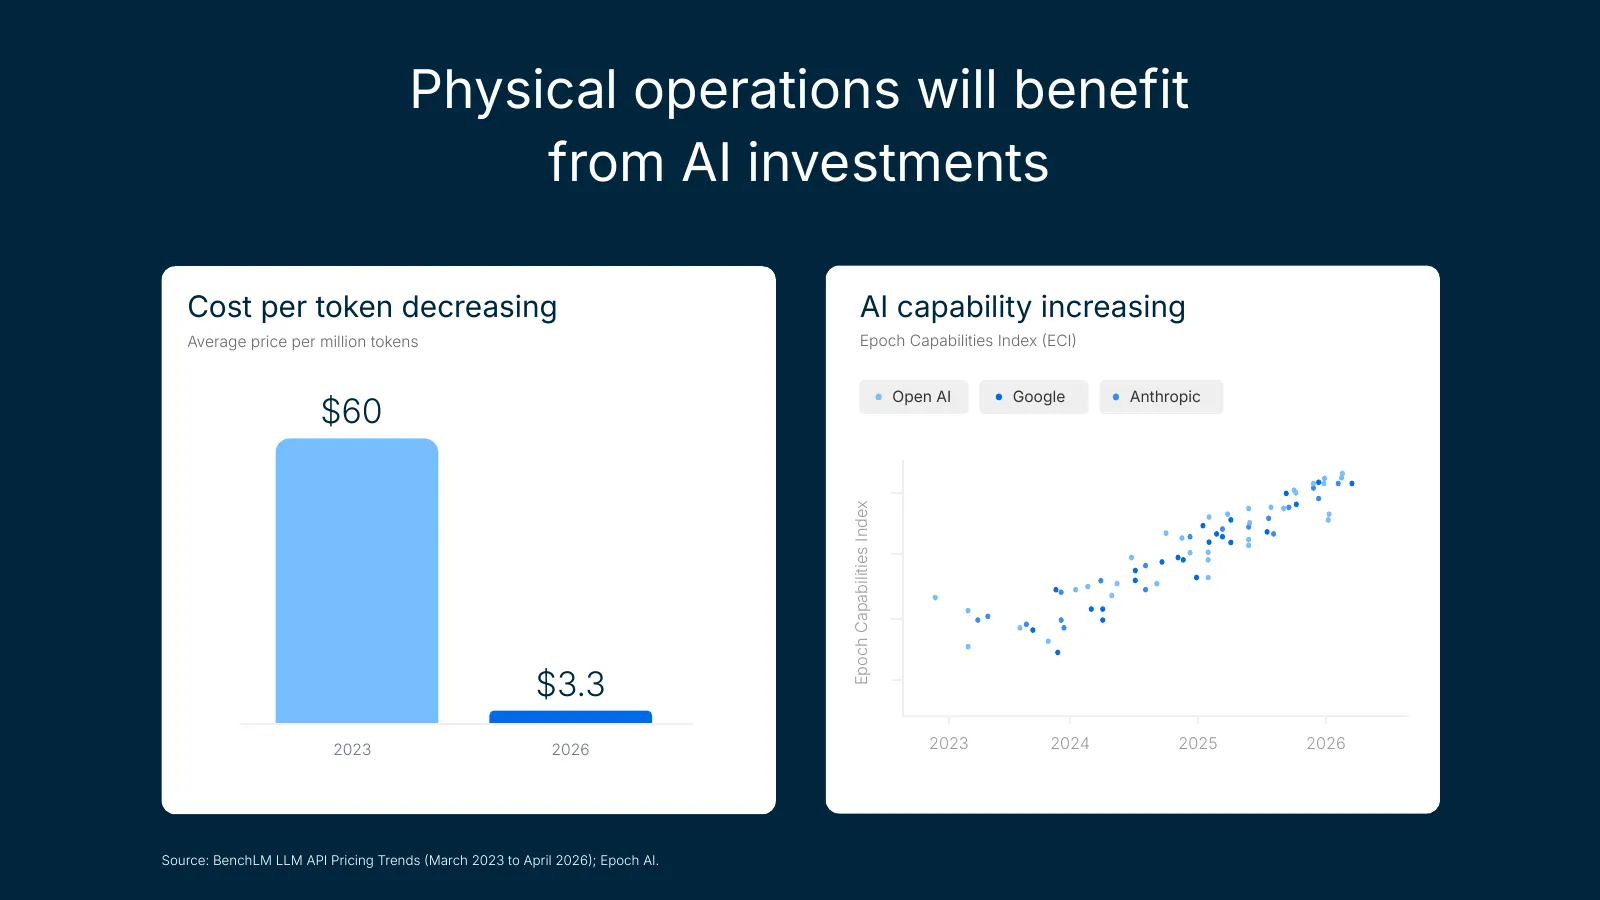
Slide 7: Physical operations will benefit from AI investments
Physical operations will benefit from AI investments Cost per token decreasing AI capability increasing Average price per million tokens Epoch Capabilities Index ECI Open AI Google Anthropic $60 Epoch Capabilities Index $3.3 2023 2026 2023 2024 2025 2026 Source: BenchLM LLM API Pricing Trends Mar
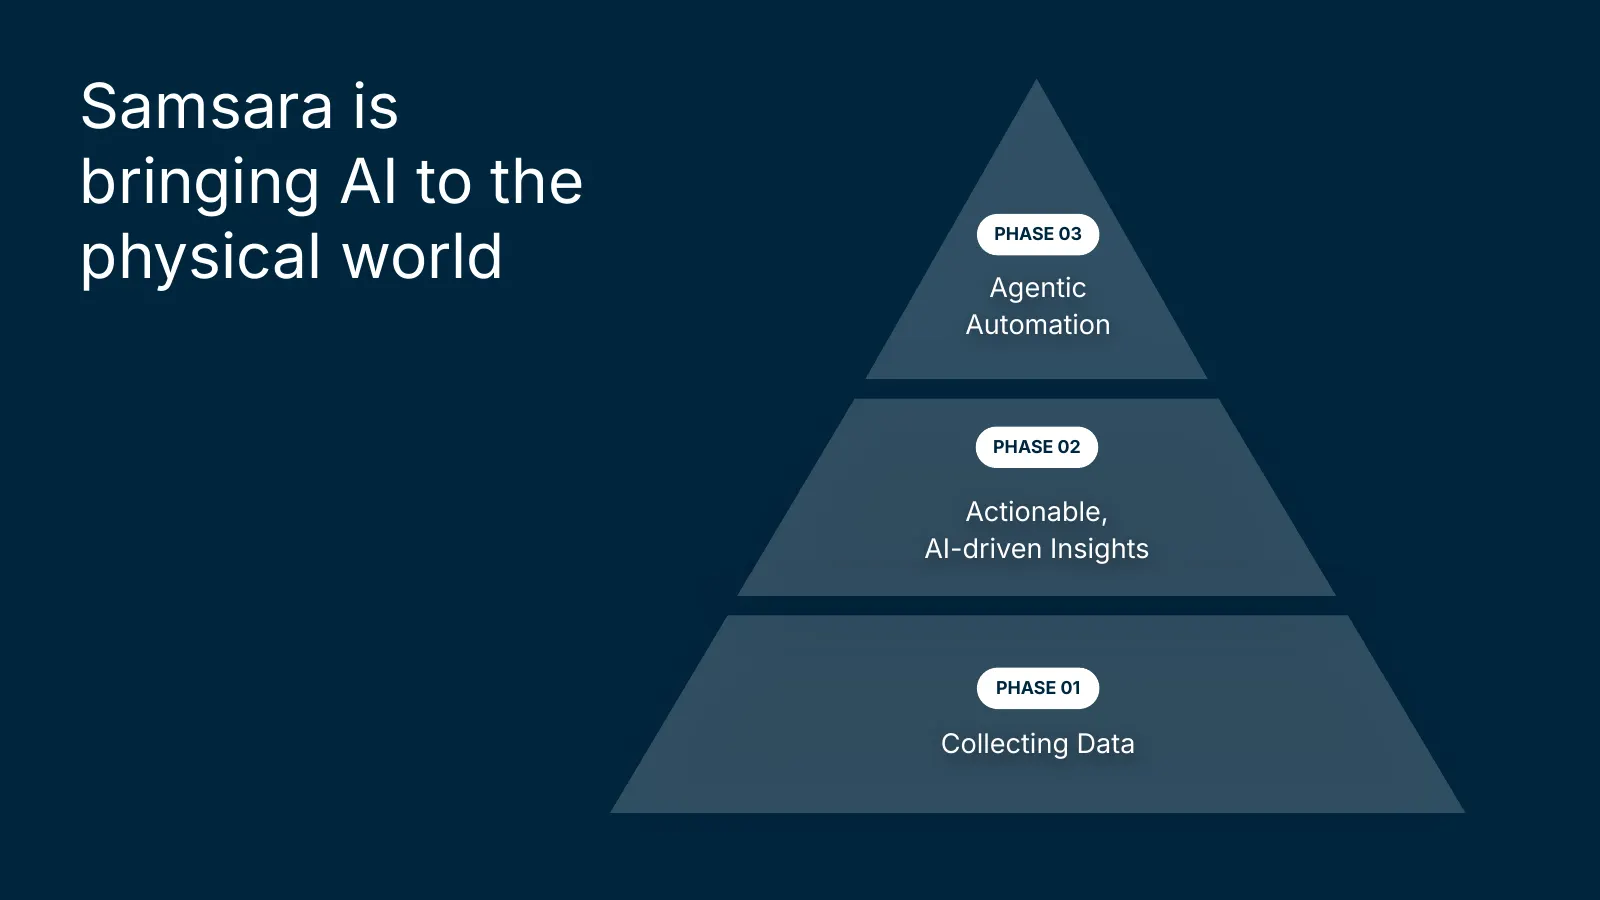
Slide 8: Samsara is bringing AI to the physical world
Samsara is bringing AI to the physical world PHASE 03 Agentic Automation PHASE 02 Actionable, AI-driven Insights PHASE 01 Collecting Data

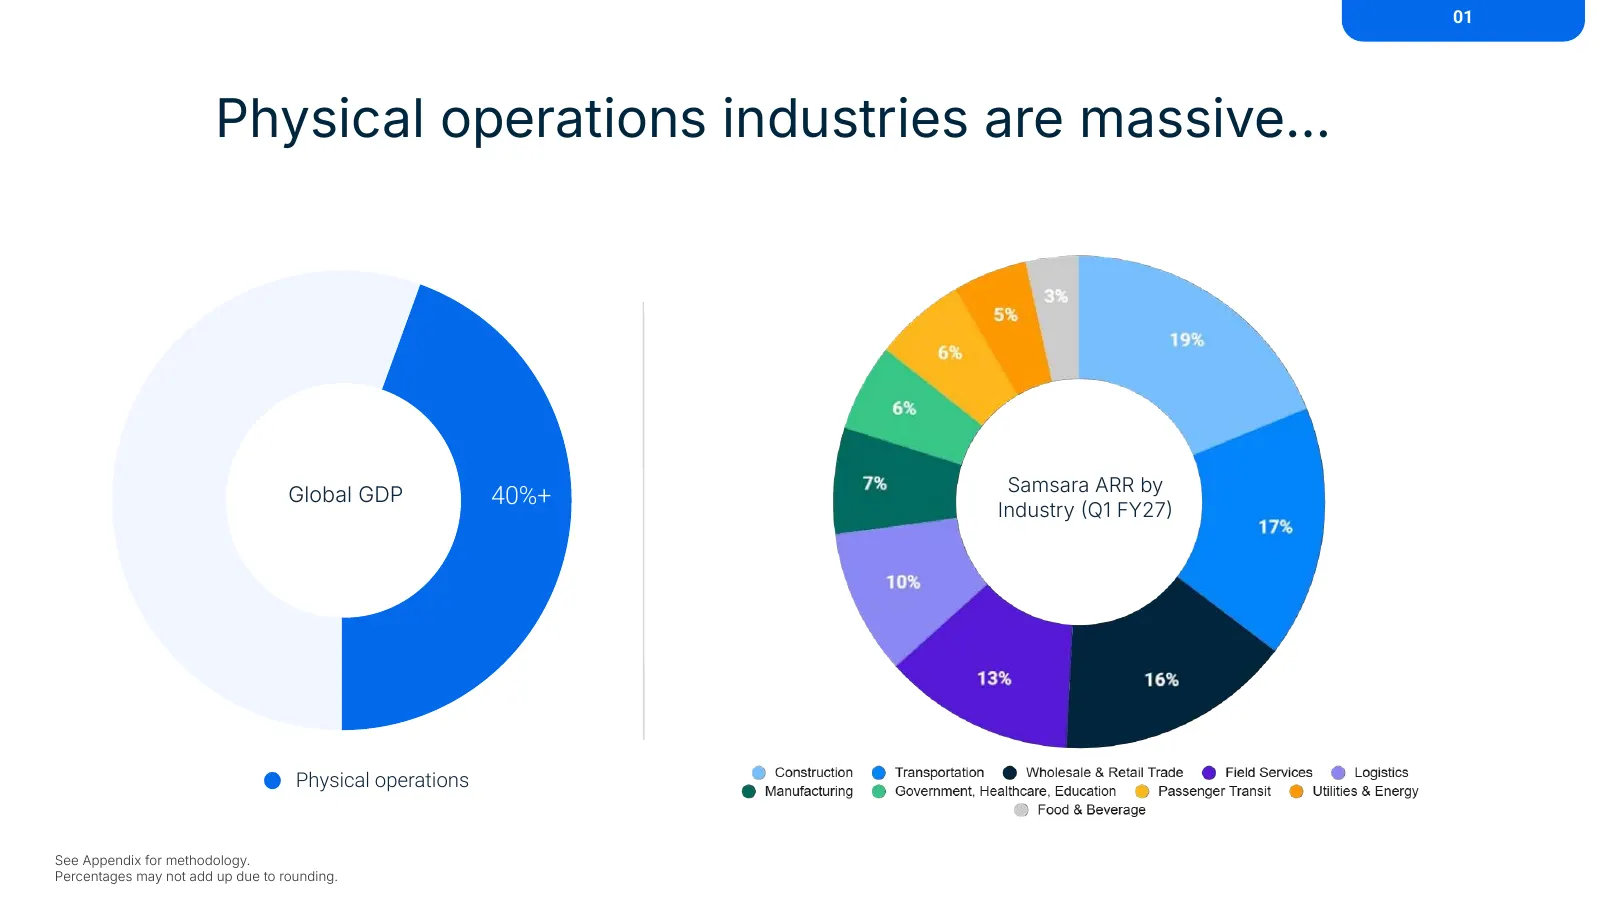
Slide 9: Physical operations represents 40% of Global GDP
Phase 01 Physical operations represents 40% of Global GDP
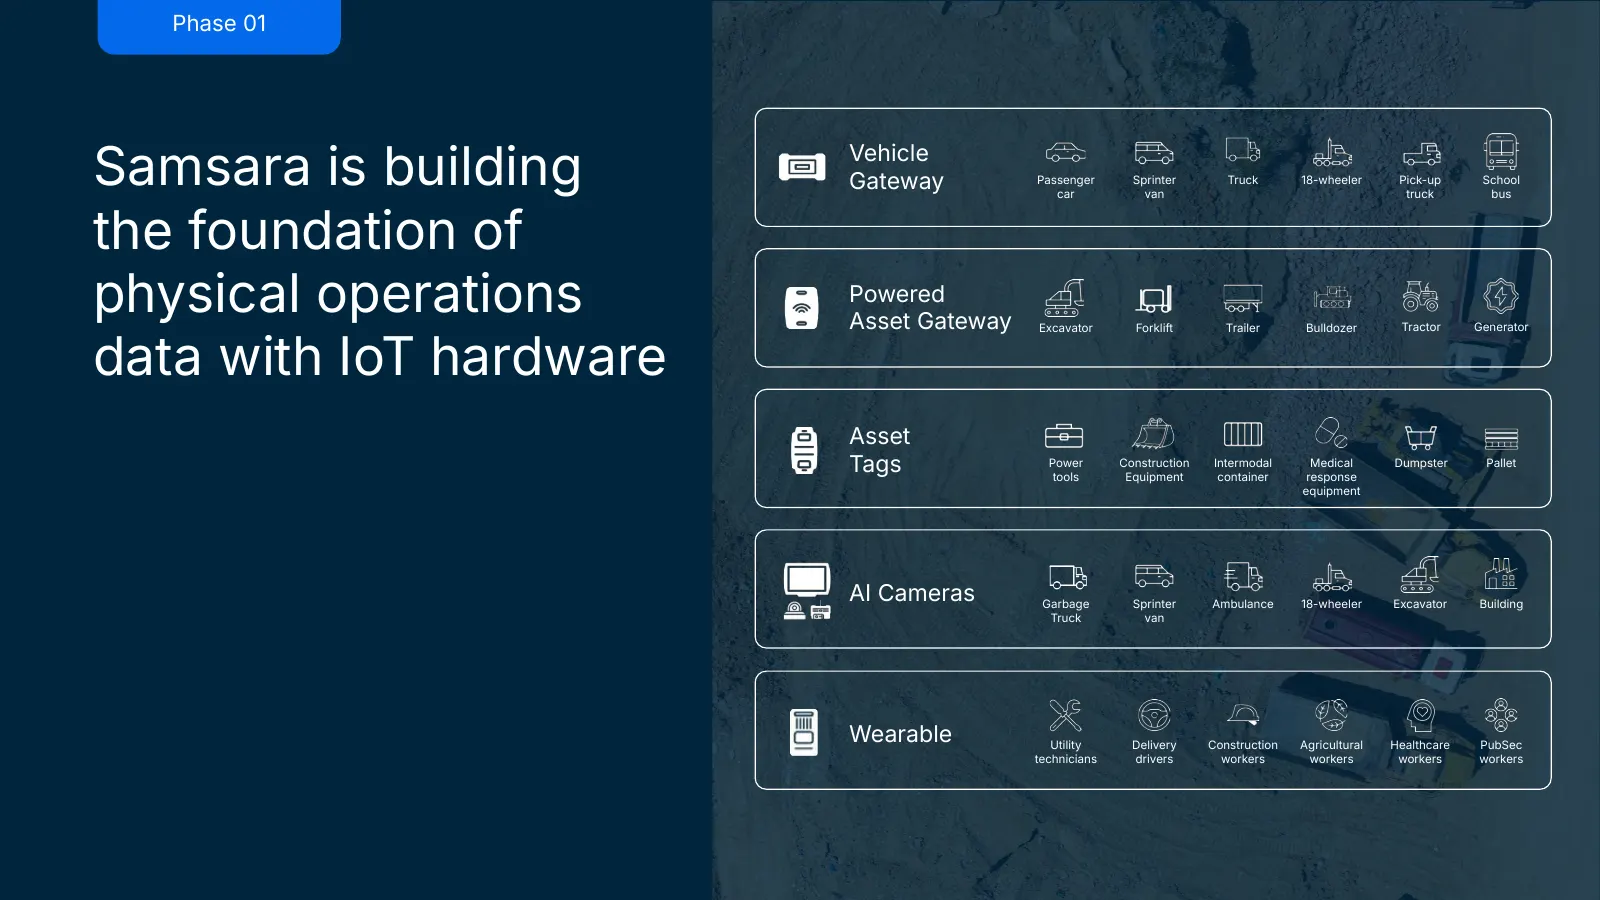
Slide 10: Samsara is building the foundation of physical operations
Phase 01 Samsara is building Vehicle Gateway Passenger car Sprinter van Truck 18-wheeler Pick-up truck School bus the foundation of physical operations Powered Asset Gateway Excavator Forklift Trailer Bulldozer Tractor Generator data with IoT hardware Asset Tags Power tools Construction Equipment In
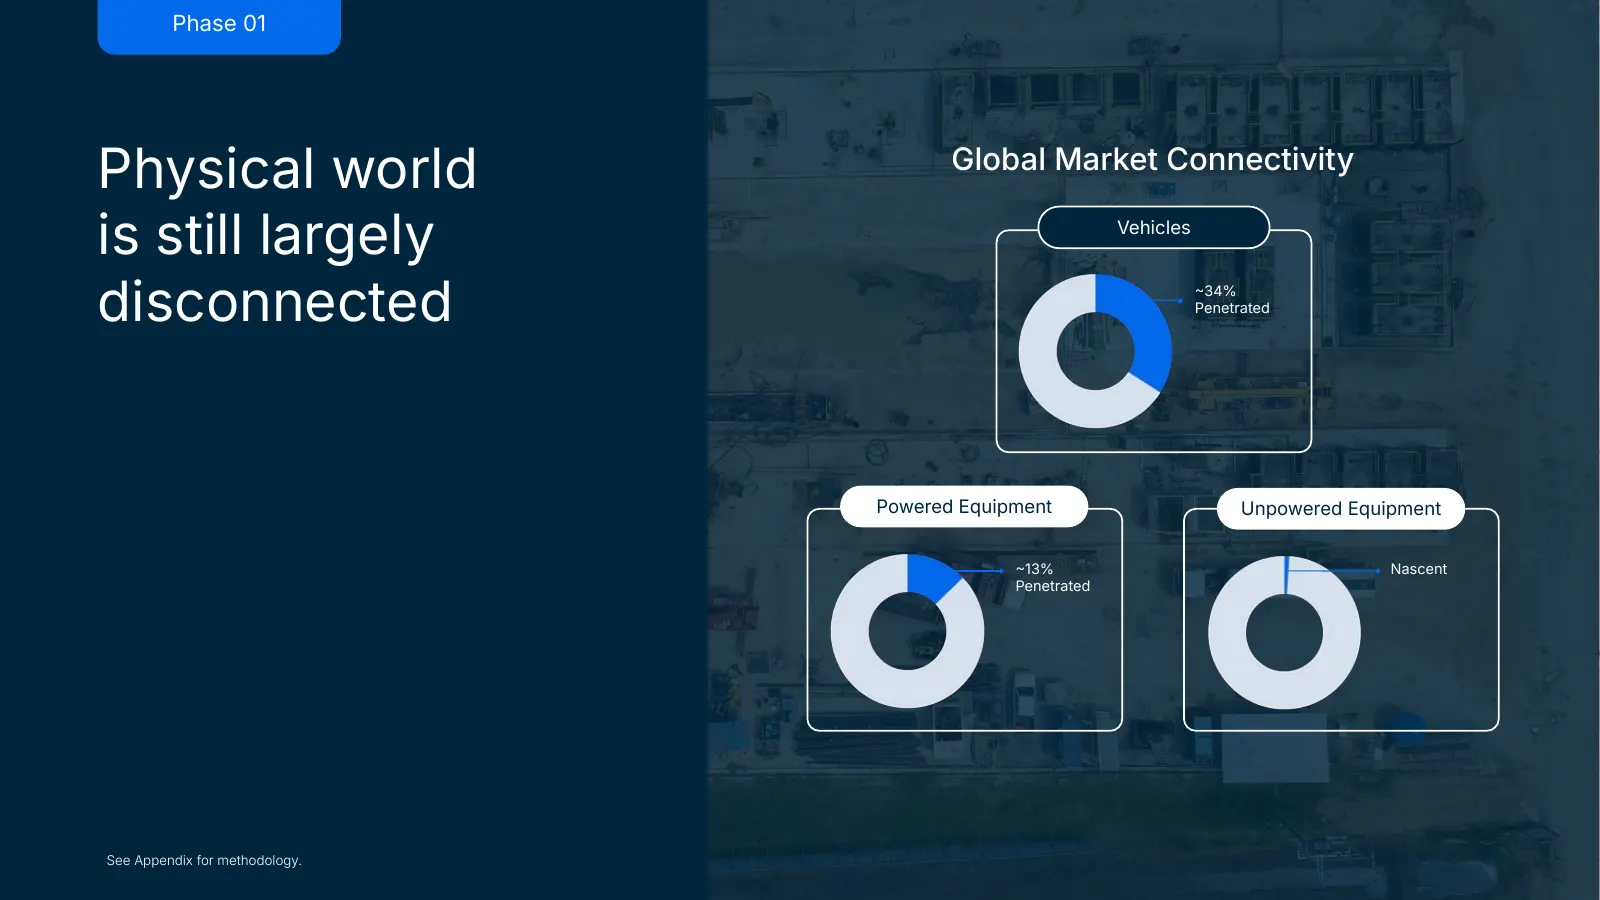
Slide 11: Physical world is still largely disconnected
Phase 01 Physical world Global Market Connectivity is still largely Vehicles disconnected 34% Penetrated Powered Equipment Unpowered Equipment 13% Nascent Penetrated See Appendix for methodology.
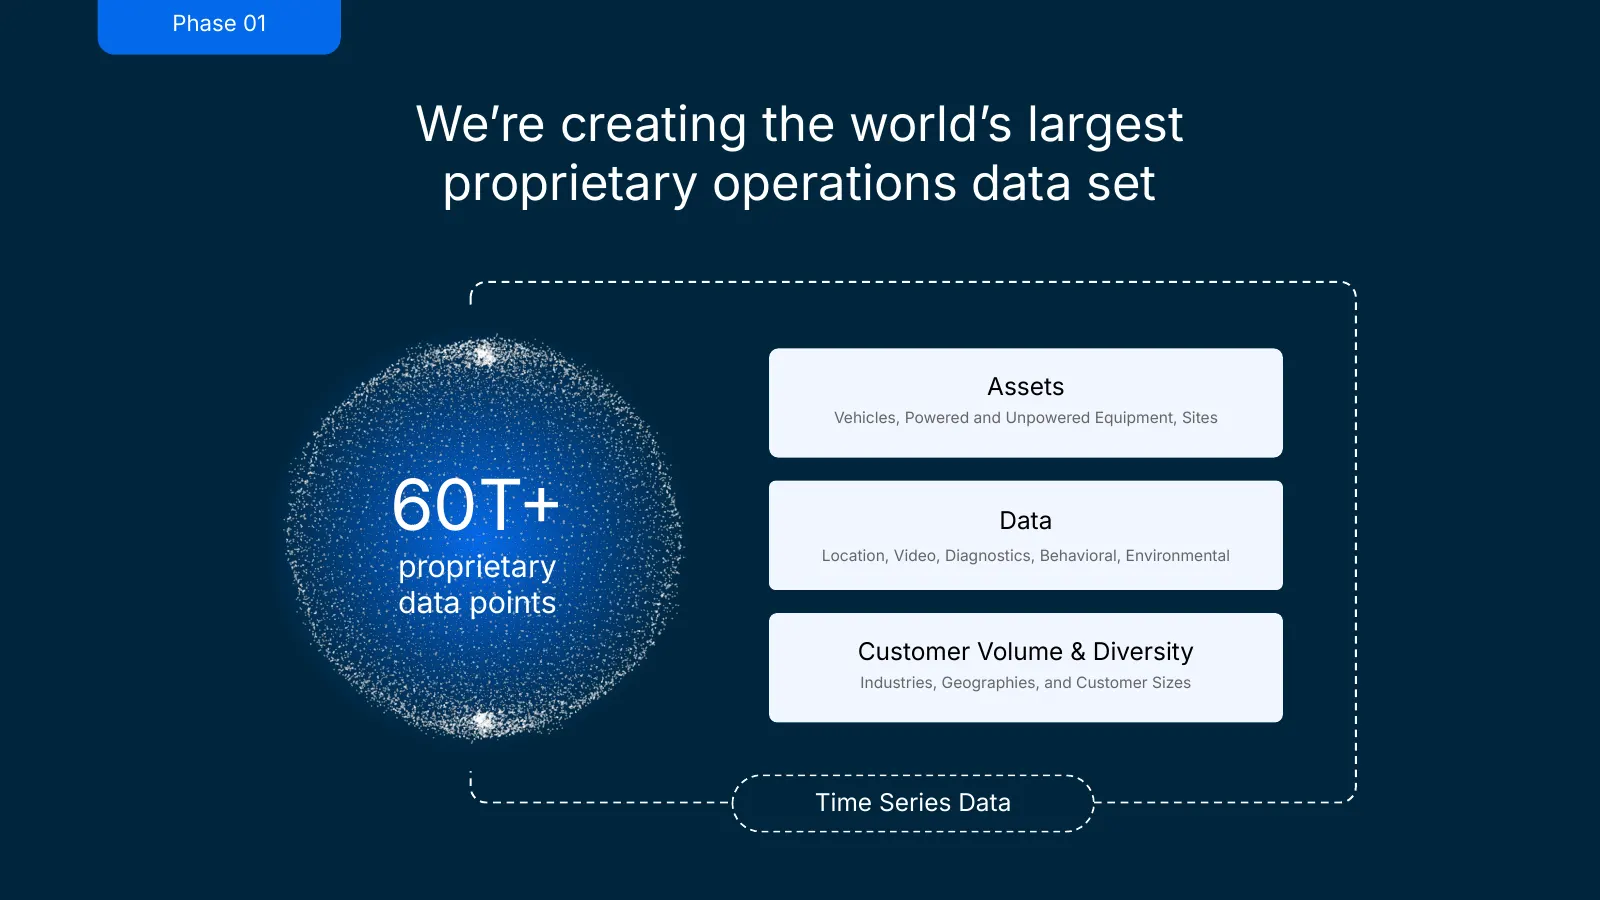
Slide 12: We're creating the world's largest proprietary operations data set
Phase 01 Weʼre creating the worldʼs largest proprietary operations data set Assets Vehicles, Powered and Unpowered Equipment, Sites 60T Data Location, Video, Diagnostics, Behavioral, Environmental proprietary data points Customer Volume & Diversity Industries, Geographies, and Customer Sizes Time S
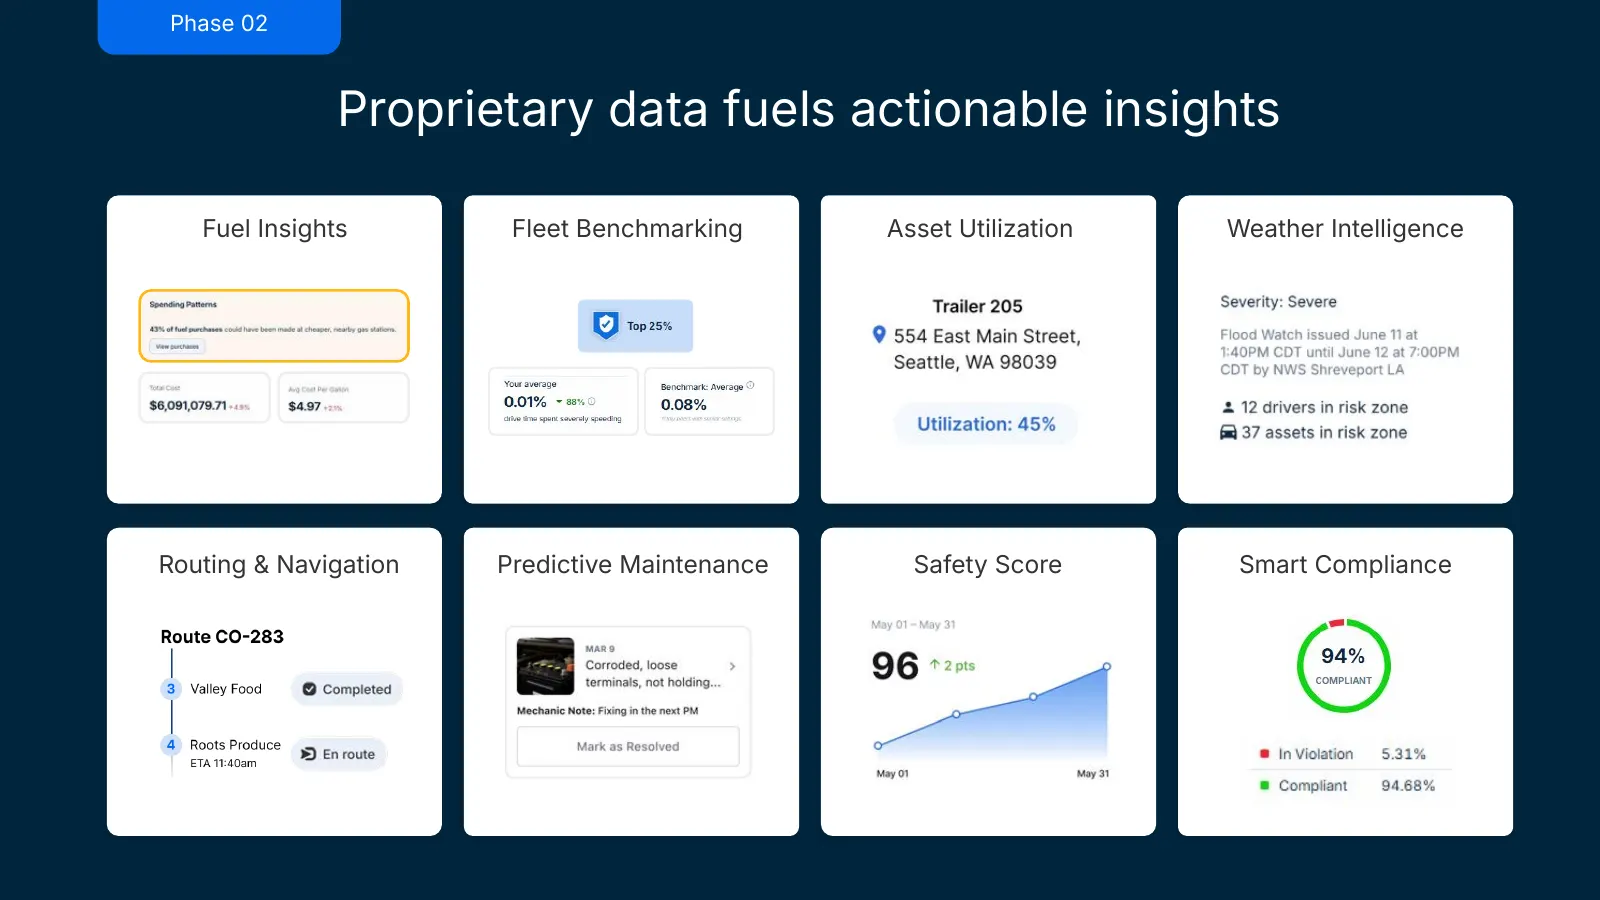
Slide 13: Proprietary data fuels actionable insights
Phase 02 Proprietary data fuels actionable insights Fuel Insights Fleet Benchmarking Asset Utilization Weather Intelligence Routing & Navigation Predictive Maintenance Safety Score Smart Compliance
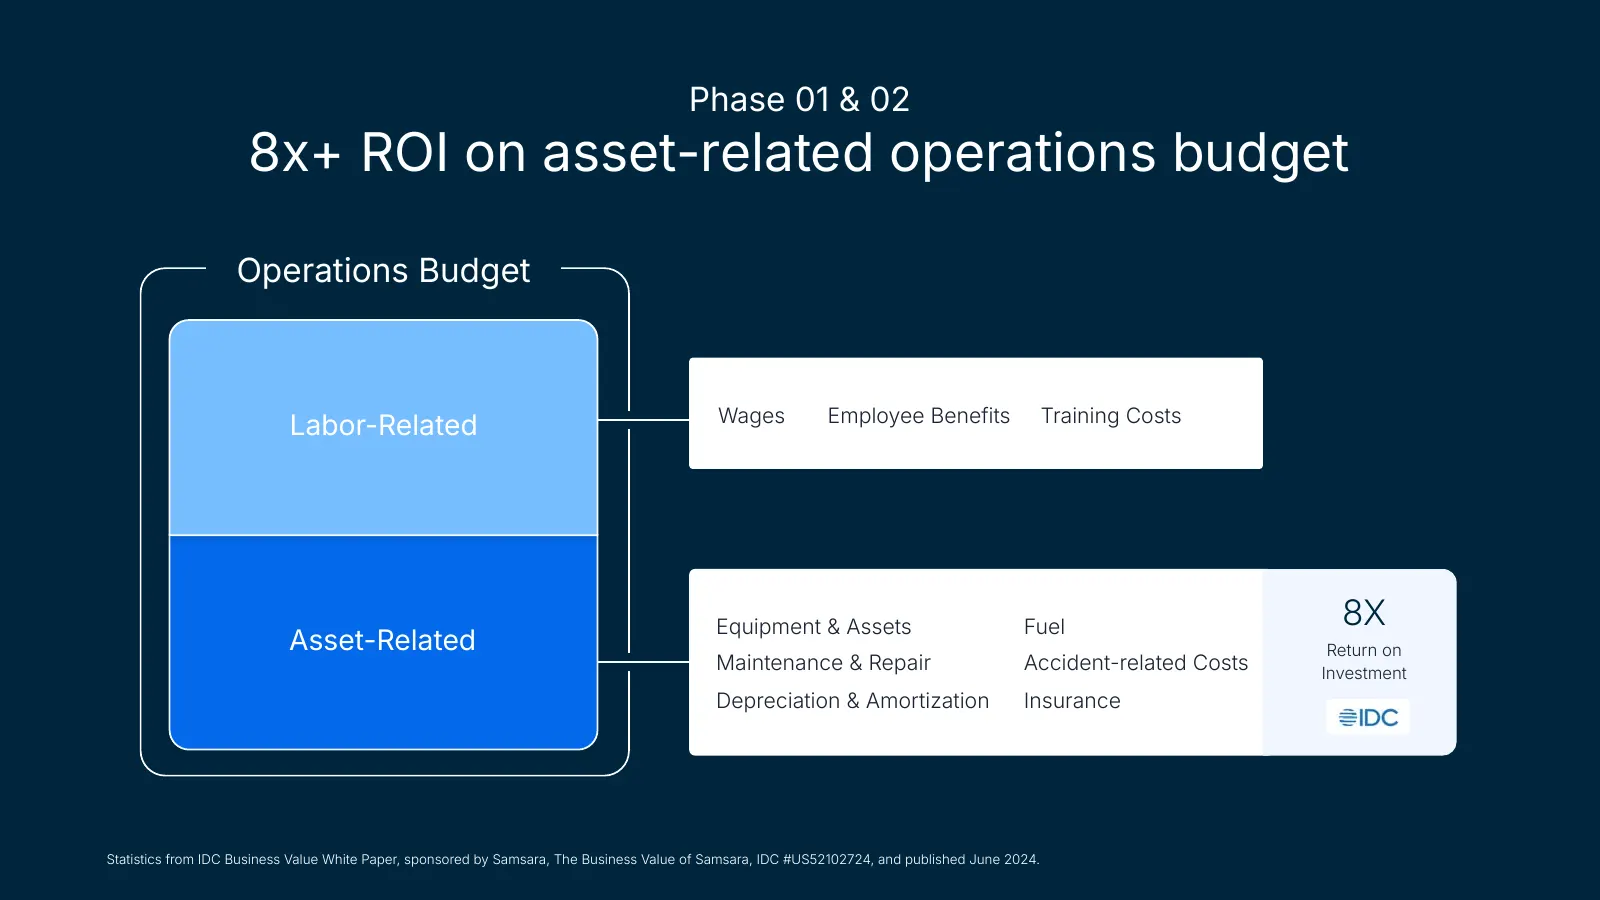
Slide 14: 8x+ ROI on asset-related operations budget
Phase 01 & 02 8x+ ROI on asset-related operations budget Operations Budget Wages Employee Benefits Training Costs Labor-Related Equipment & Assets Fuel 8X Asset-Related Return on Maintenance & Repair Accident-related Costs Investment Depreciation & Amortization Insurance Statistics from IDC Business
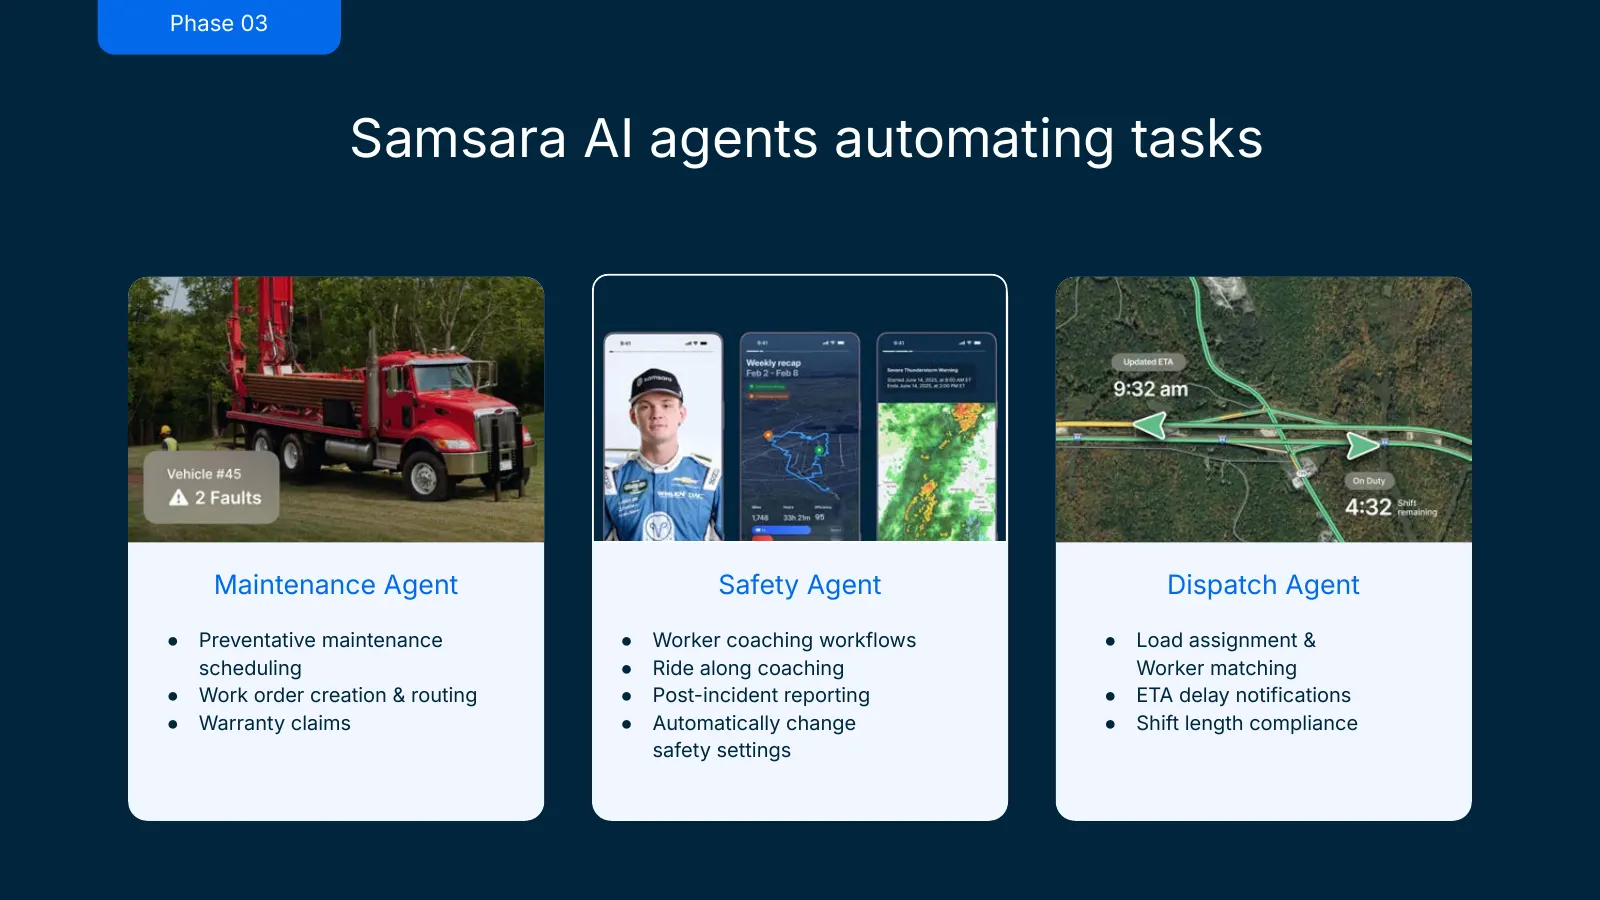
Slide 15: Samsara AI agents automating tasks
Phase 03 Samsara AI agents automating tasks Maintenance Agent Safety Agent Dispatch Agent ● Preventative maintenance ● Worker coaching workflows ● Load assignment & scheduling ● Ride along coaching Worker matching ● Work order creation & routing ● Post-incident reporting ● ETA delay notifications ●
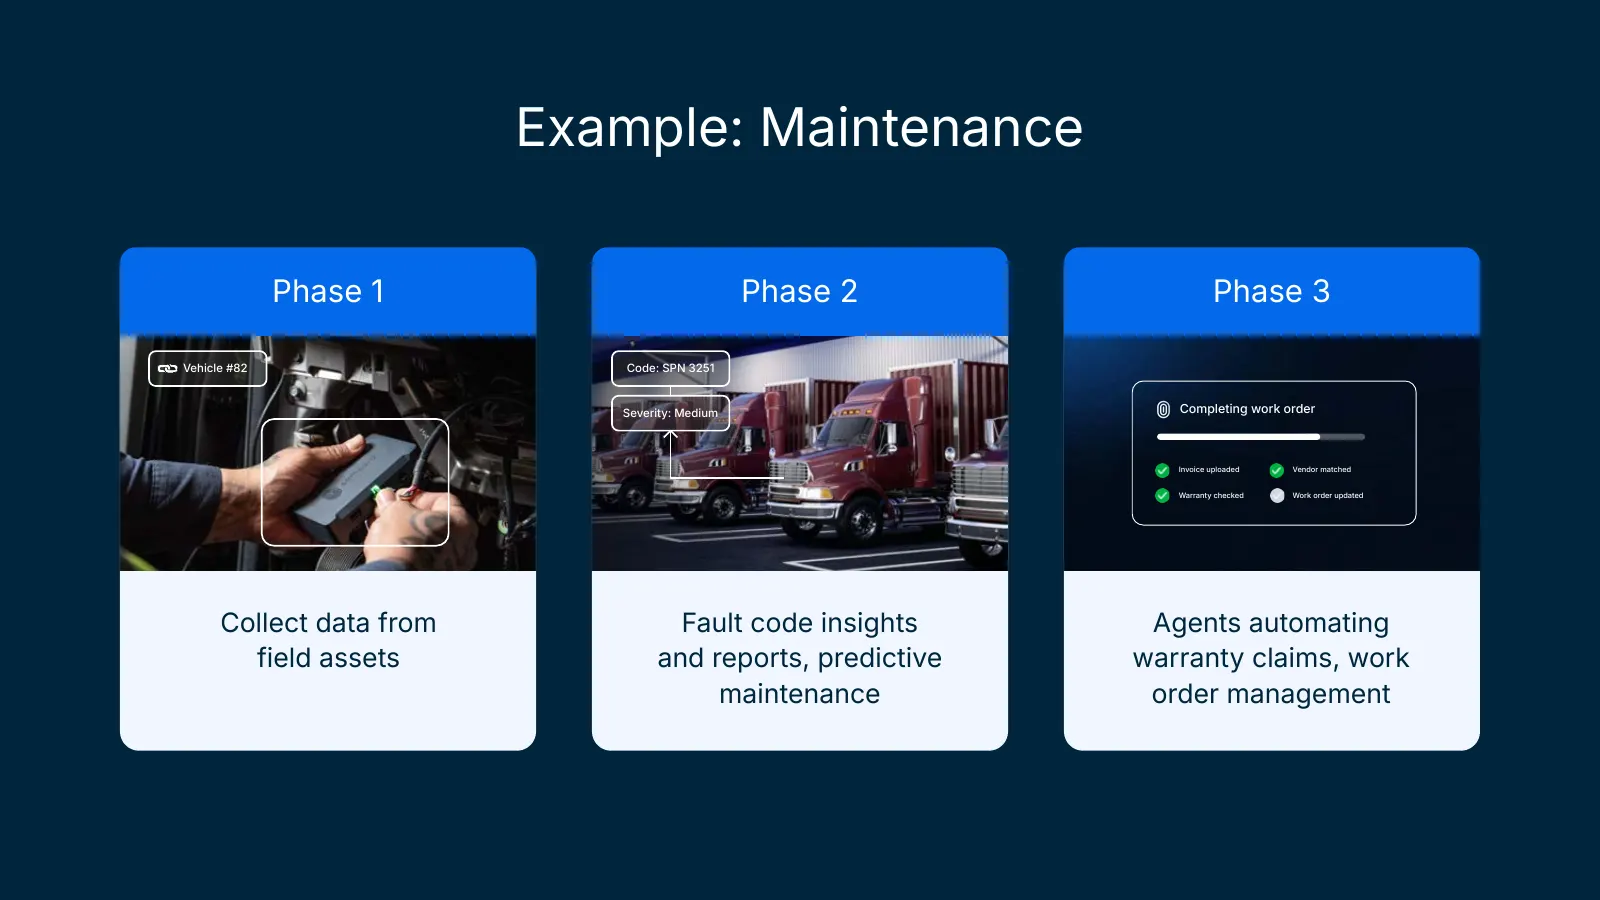
Slide 16: Example: Maintenance
Example: Maintenance Phase 1 Phase 2 Phase 3 Vehicle #82 Code: SPN 3251 Severity: Medium Completing work order Invoice uploaded Vendor matched Warranty checked Work order updated Collect data from Fault code insights Agents automating field assets and reports, predictive warranty claims, work mainte
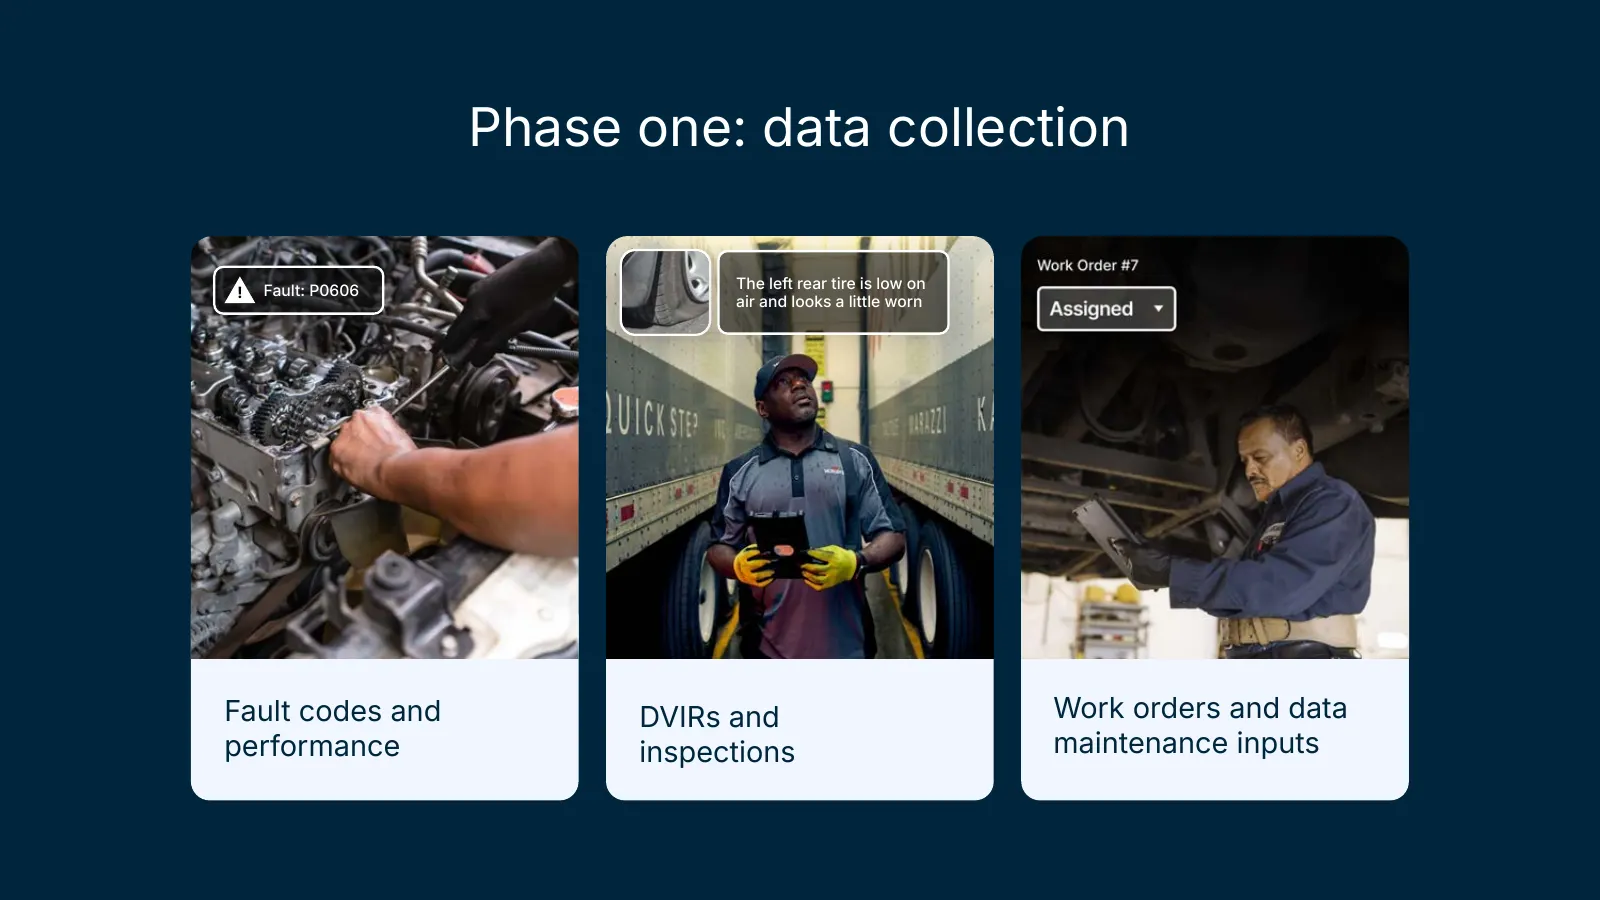
Slide 17: Phase one: data collection
Phase one: data collection Fault: P0606 The left rear tire is low on ! air and looks a little worn Fault codes and DVIRs and Work orders and data performance inspections maintenance inputs
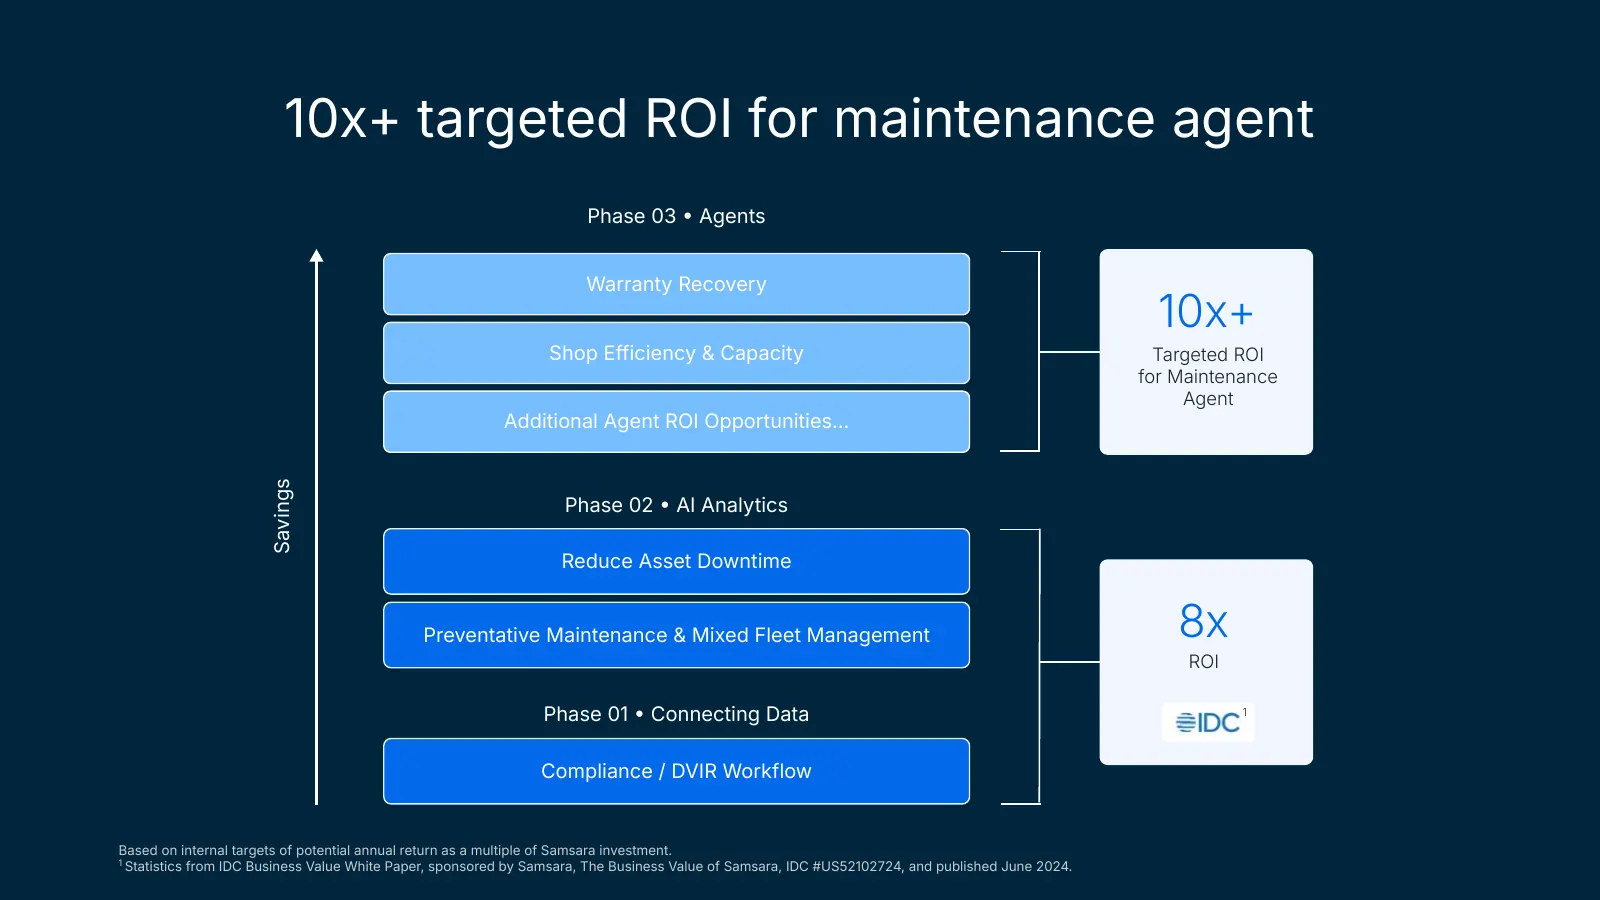
Slide 18: 10x+ targeted ROI for maintenance agent
10x+ targeted ROI for maintenance agent Phase 03 Agents Warranty Recovery 10x+ Shop Efficiency & Capacity Targeted ROI for Maintenance Agent Additional Agent ROI Opportunities… Savings Phase 02 AI Analytics Reduce Asset Downtime Preventative Maintenance & Mixed Fleet Management 8x ROI Phase 01
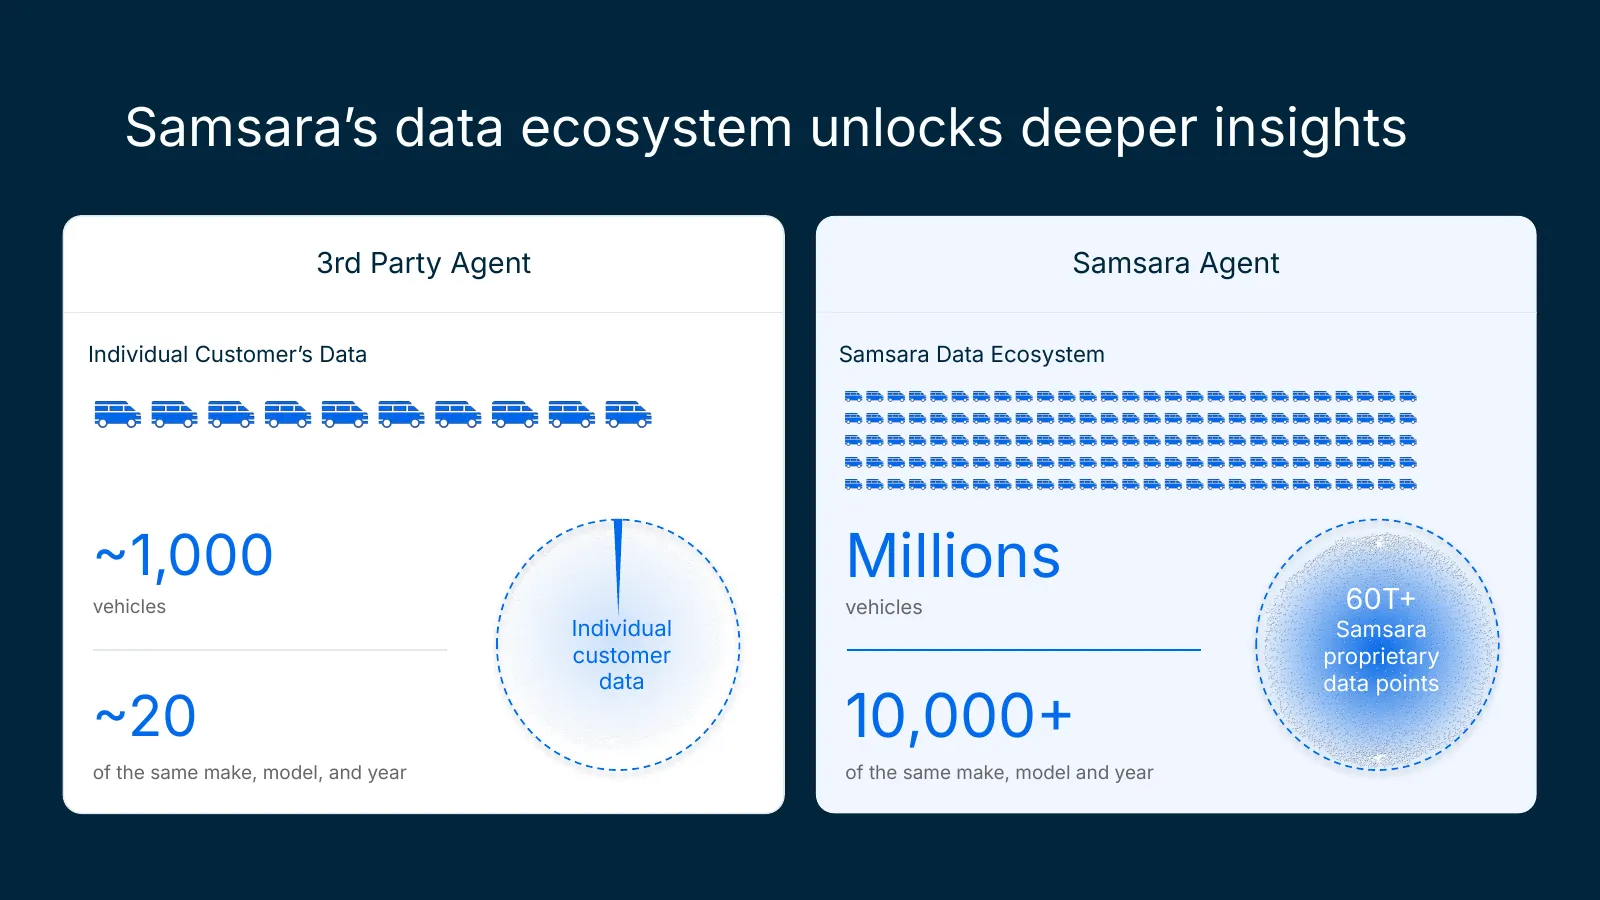
Slide 19: Samsara's data ecosystem unlocks deeper insights
Samsaraʼs data ecosystem unlocks deeper insights 3rd Party Agent Samsara Agent Individual Customerʼs Data Samsara Data Ecosystem 1,000 Millions vehicles vehicles 60T Individual Samsara customer proprietary data data points 20 10,000 of the same make, model, and year of the same make, model and y
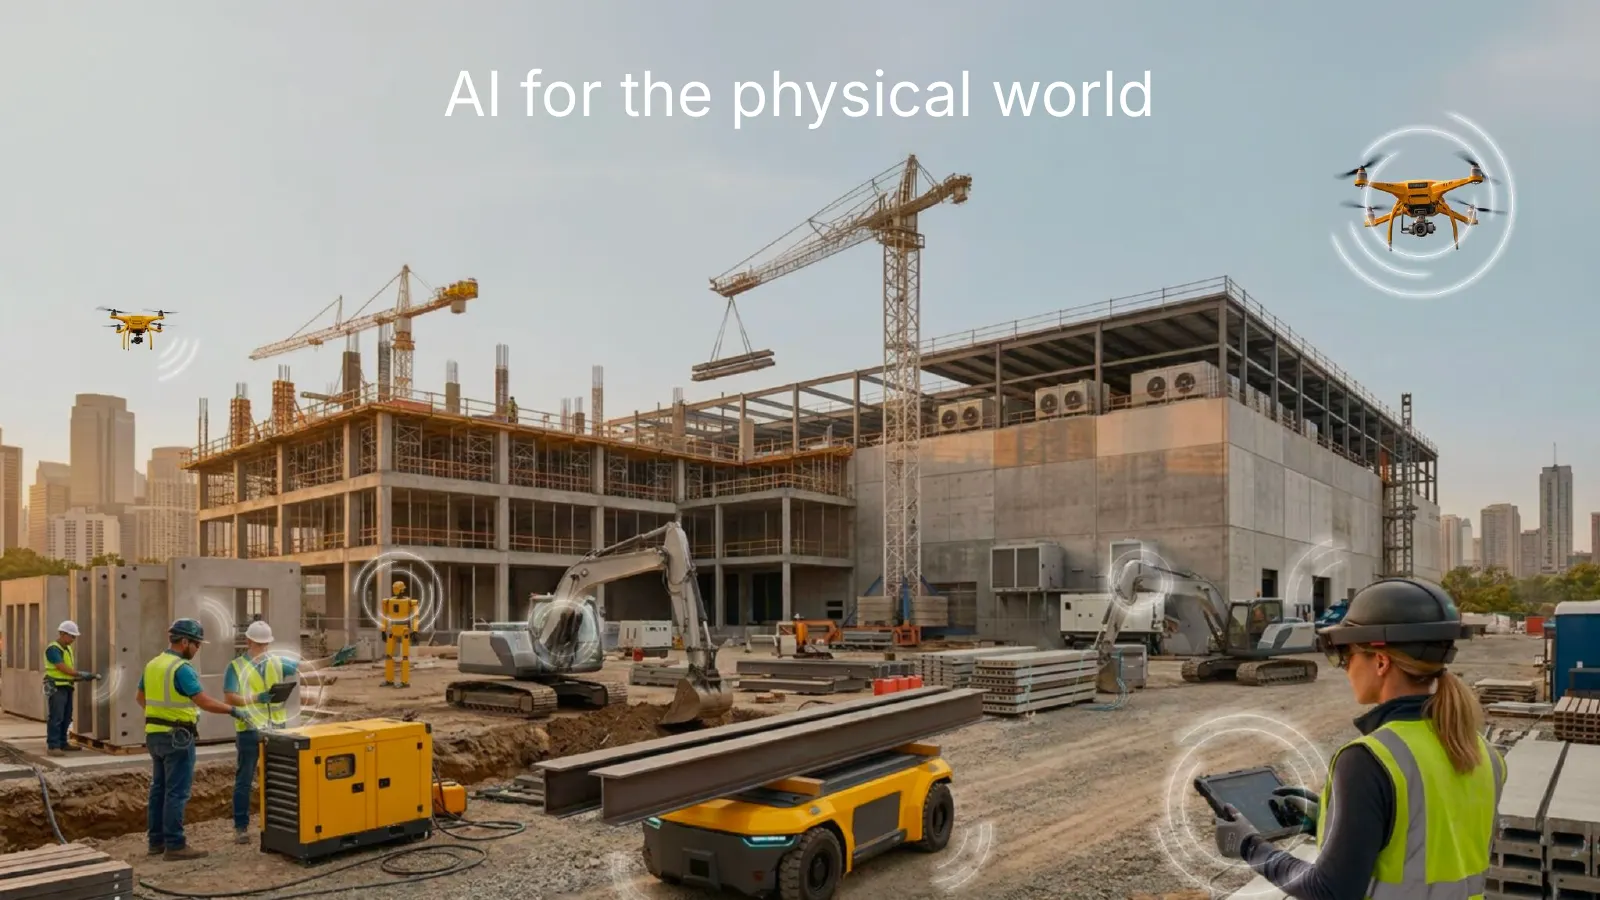
Slide 20: AI for the physical world
AI for the physical world

Slide 21: AI-Driven Product Velocity
AIDriven Product Velocity Johan Land Chief Product Officer
Slide 22: My background
My background Customer 2021 2025 Chief Product Officer 2019 2021 Chief Product Officer Vision 2019 & Prior Product Leader Growth
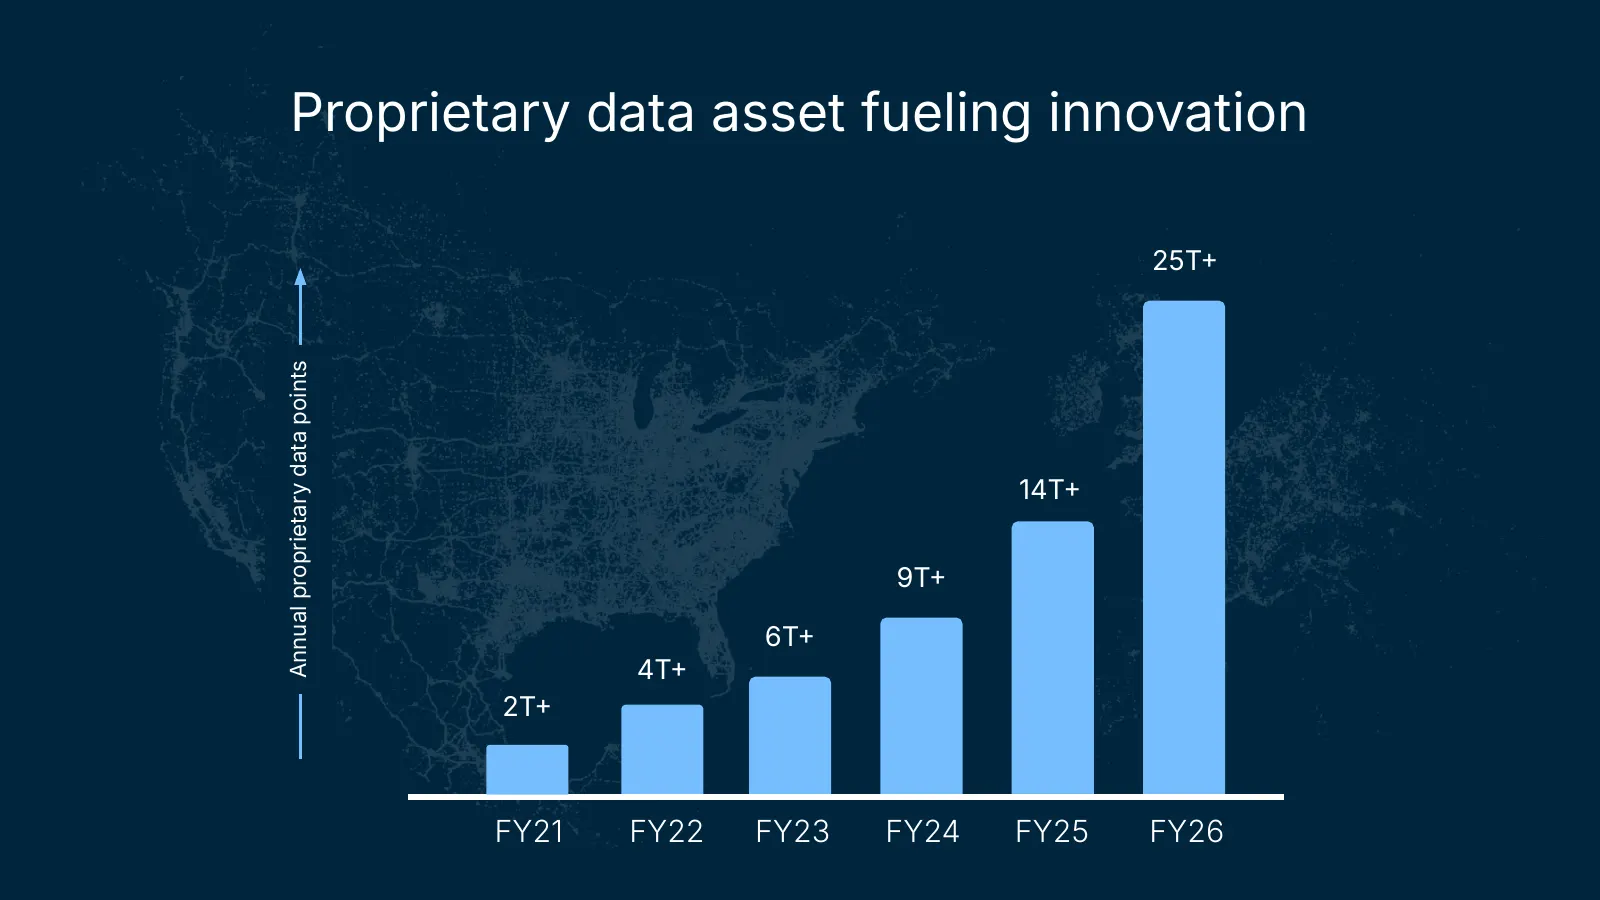
Slide 23: Proprietary data asset fueling innovation
Proprietary data asset fueling innovation 25T Annual proprietary data points 14T 9T 6T 4T 2T FY21 FY22 FY23 FY24 FY25 FY26 FY21 FY22 FY23 FY24 FY25 FY26
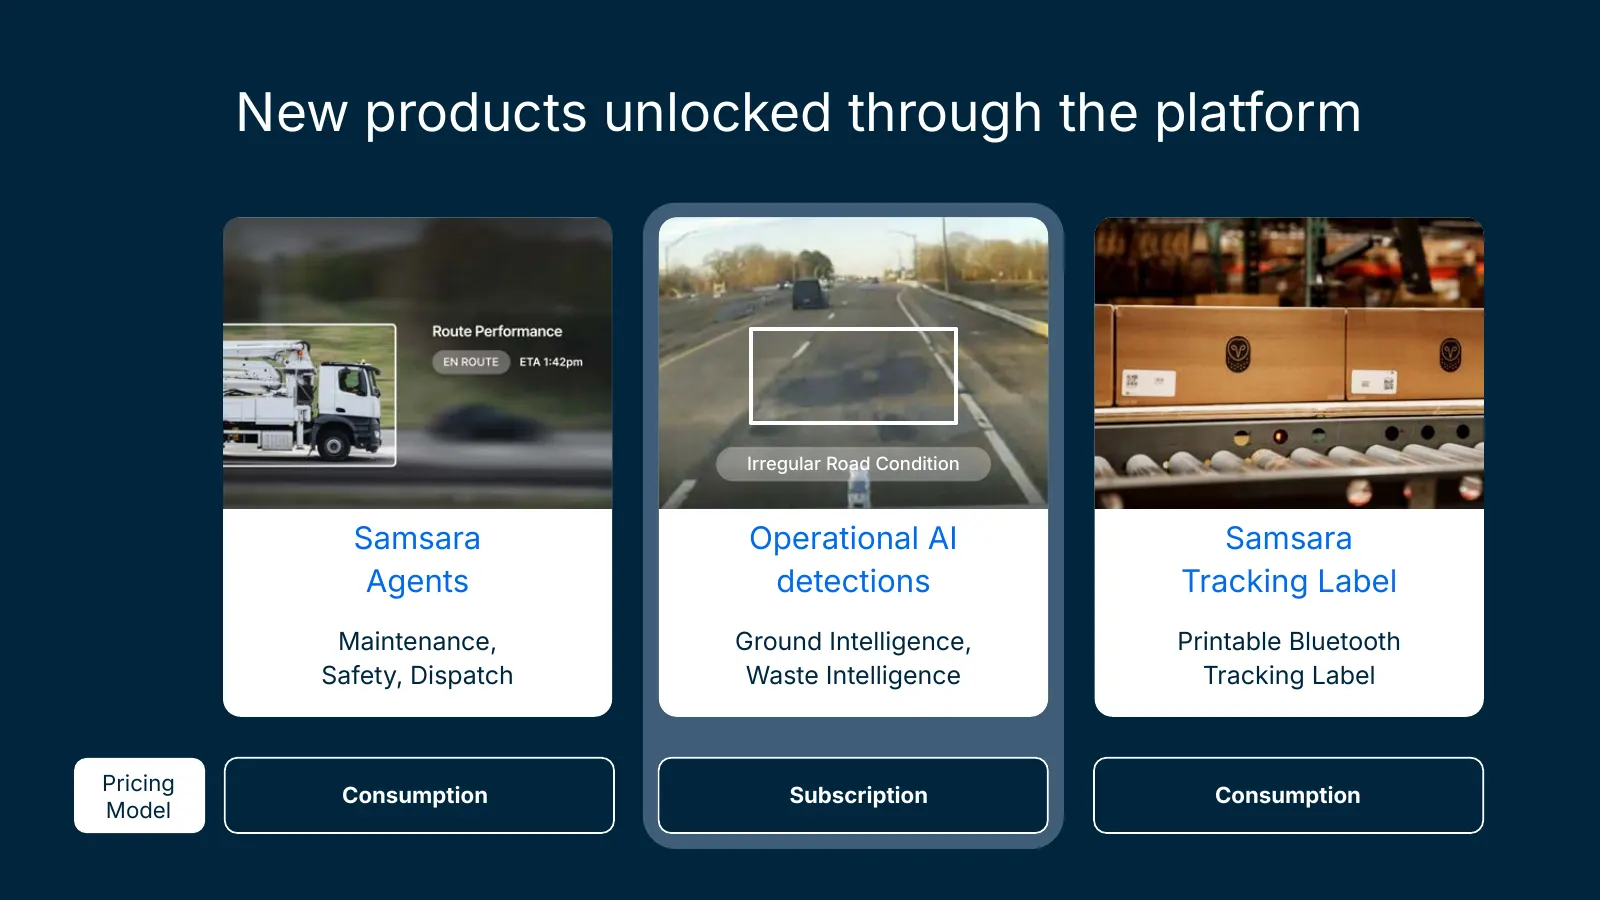
Slide 24: New products unlocked through the platform
New products unlocked through the platform Irregular Road Condition Samsara Operational AI Samsara Agents detections Tracking Label Maintenance, Ground Intelligence, Printable Bluetooth Safety, Dispatch Waste Intelligence Tracking Label Pricing Consumption Subscription Consumption Model
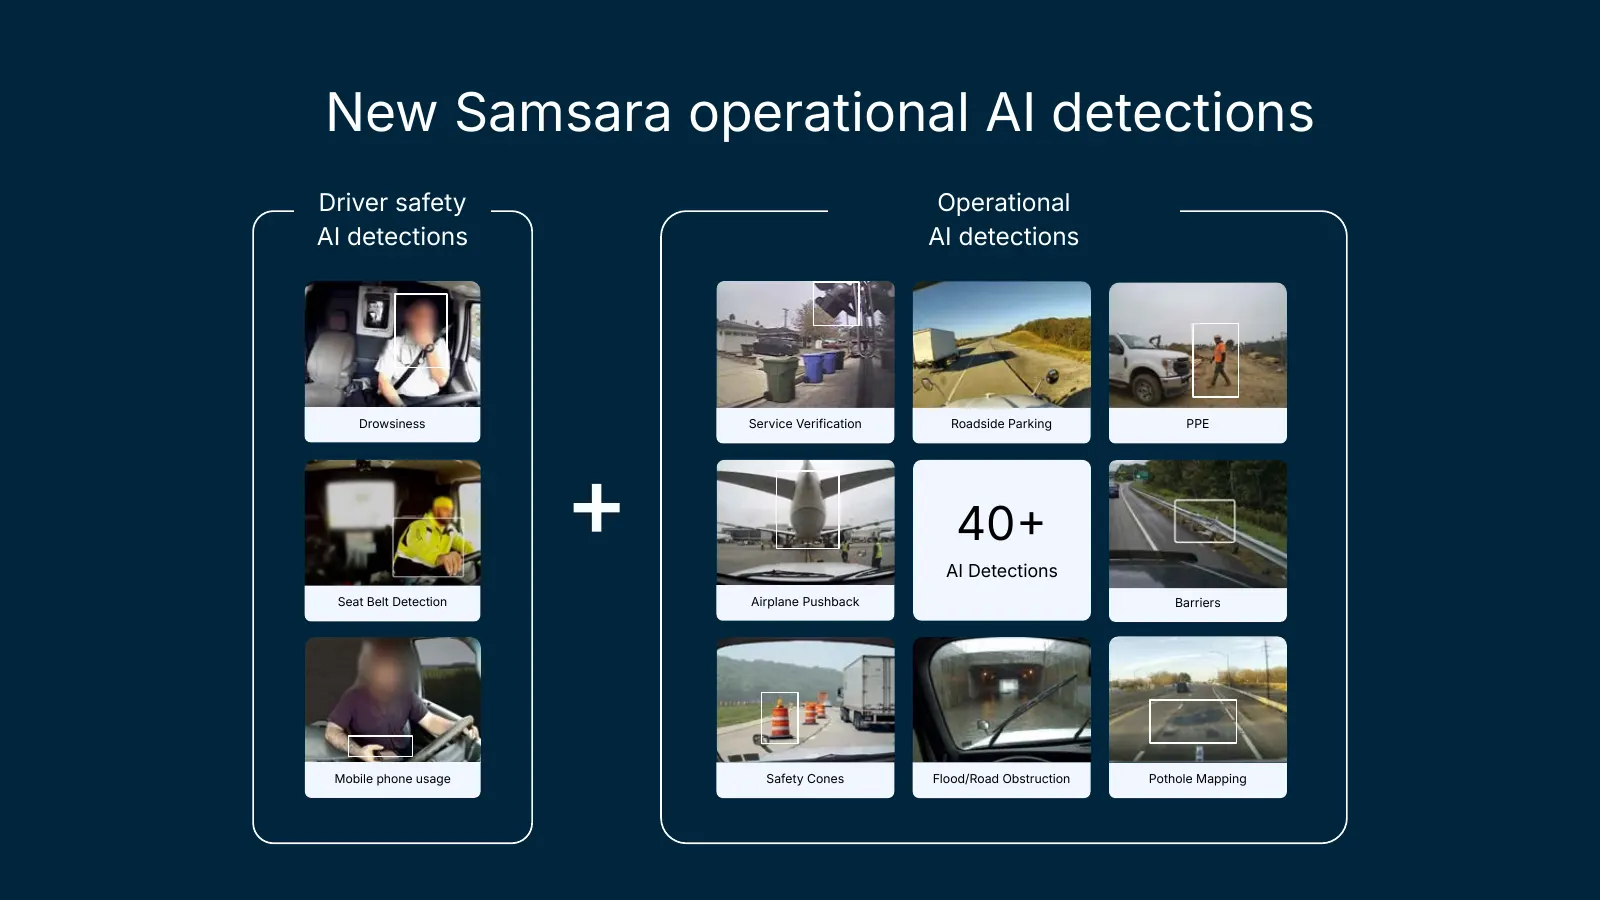
Slide 25: New Samsara operational AI detections
New Samsara operational AI detections Driver safety Operational AI detections AI detections Drowsiness Service Verification Roadside Parking PPE 40 AI Detections Seat Belt Detection Airplane Pushback Barriers Mobile phone usage Safety Cones Flood/Road Obstruction Pothole Mapping
Slide 26: Waste Intelligence
Product Demo Waste Intelligence
Slide 27: Ground Intelligence
Product Demo Ground Intelligence
Slide 28: Samsara Tracking Label
Samsara Tracking Label David Gal VP, Product & Engineering
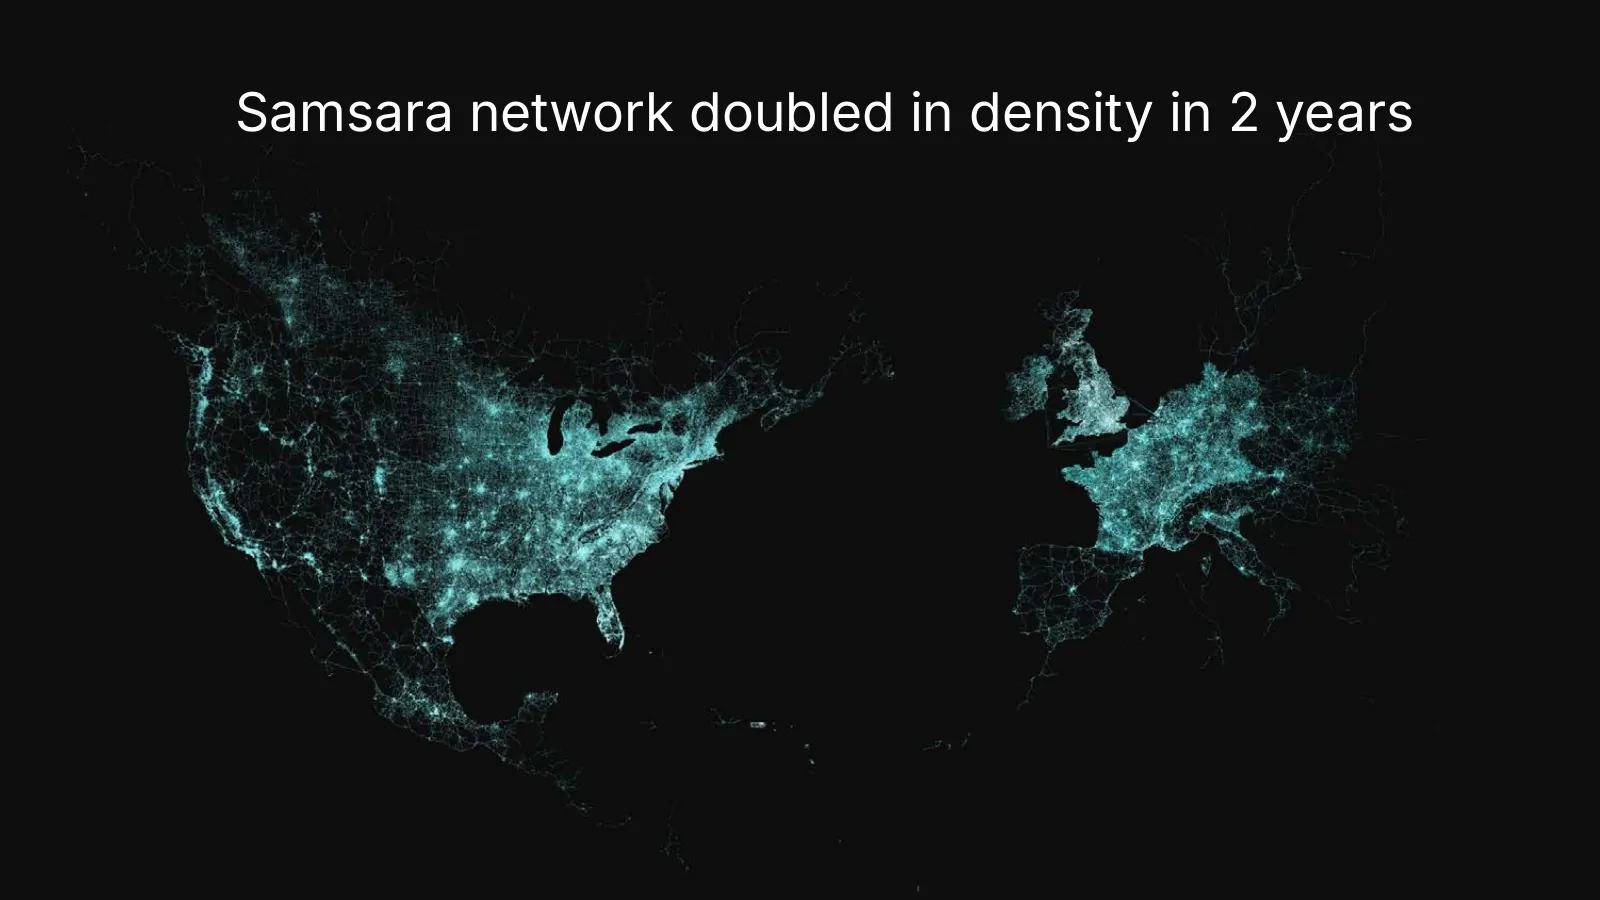
Slide 29: Samsara network doubled in density in 2 years
Samsara network doubled in density in 2 years
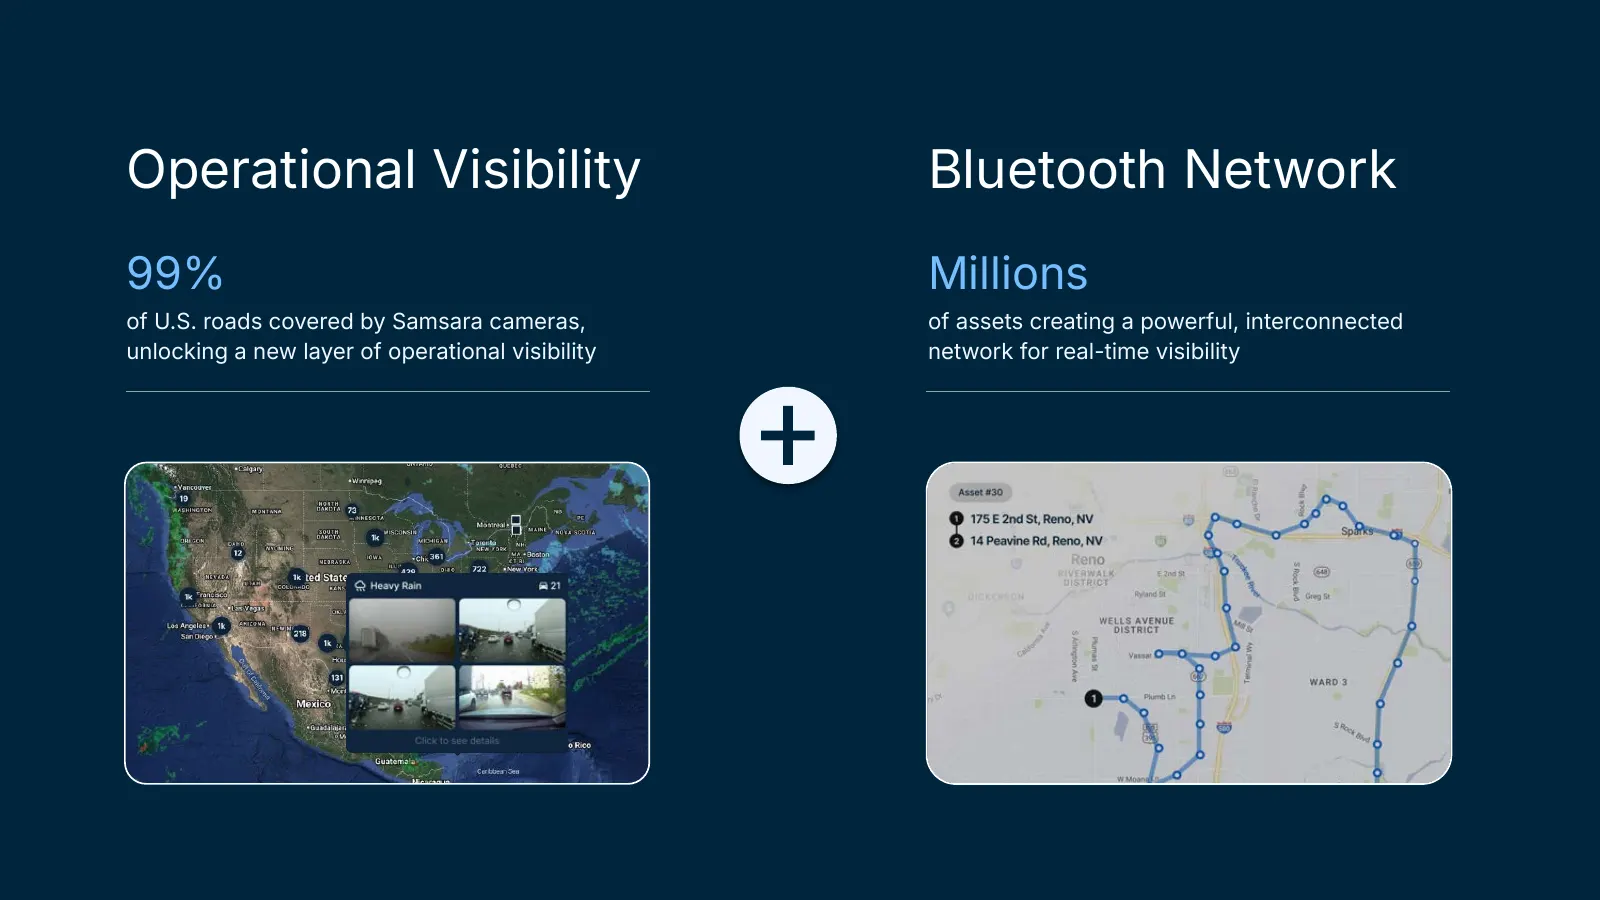
Slide 30: Operational Visibility Bluetooth Network
Operational Visibility Bluetooth Network 99% Millions of U.S. roads covered by Samsara cameras, of assets creating a powerful, interconnected unlocking a new layer of operational visibility network for real-time visibility
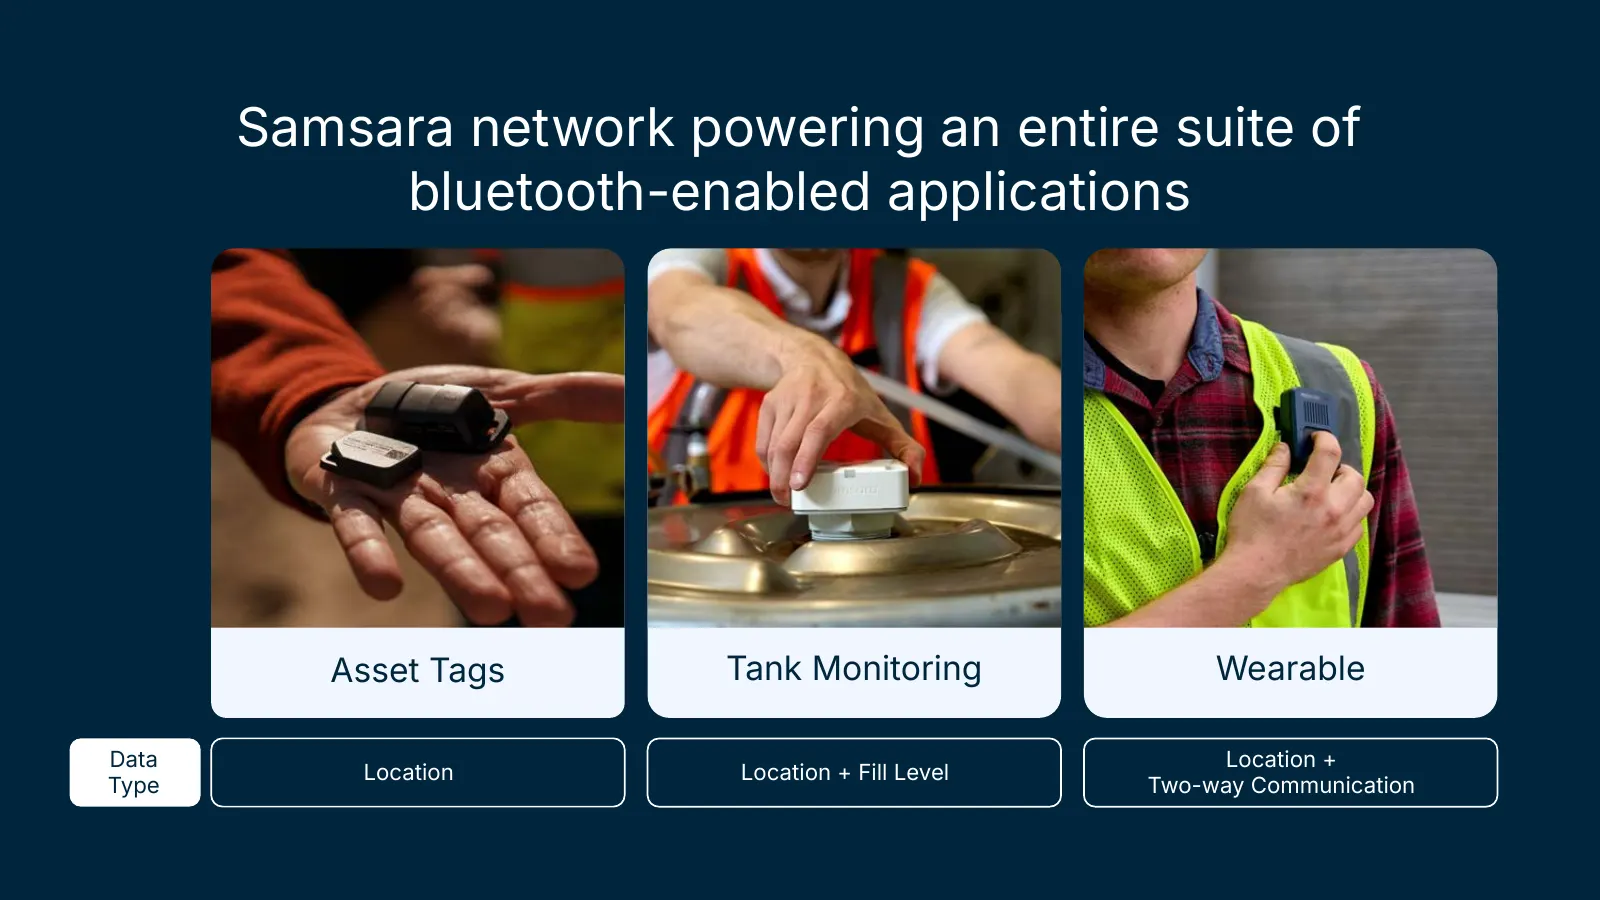
Slide 31: Samsara network powering an entire suite of bluetooth-enabled applications
Samsara network powering an entire suite of bluetooth-enabled applications Asset Tags Tank Monitoring Wearable Data Location + Location Location + Fill Level Type Two-way Communication
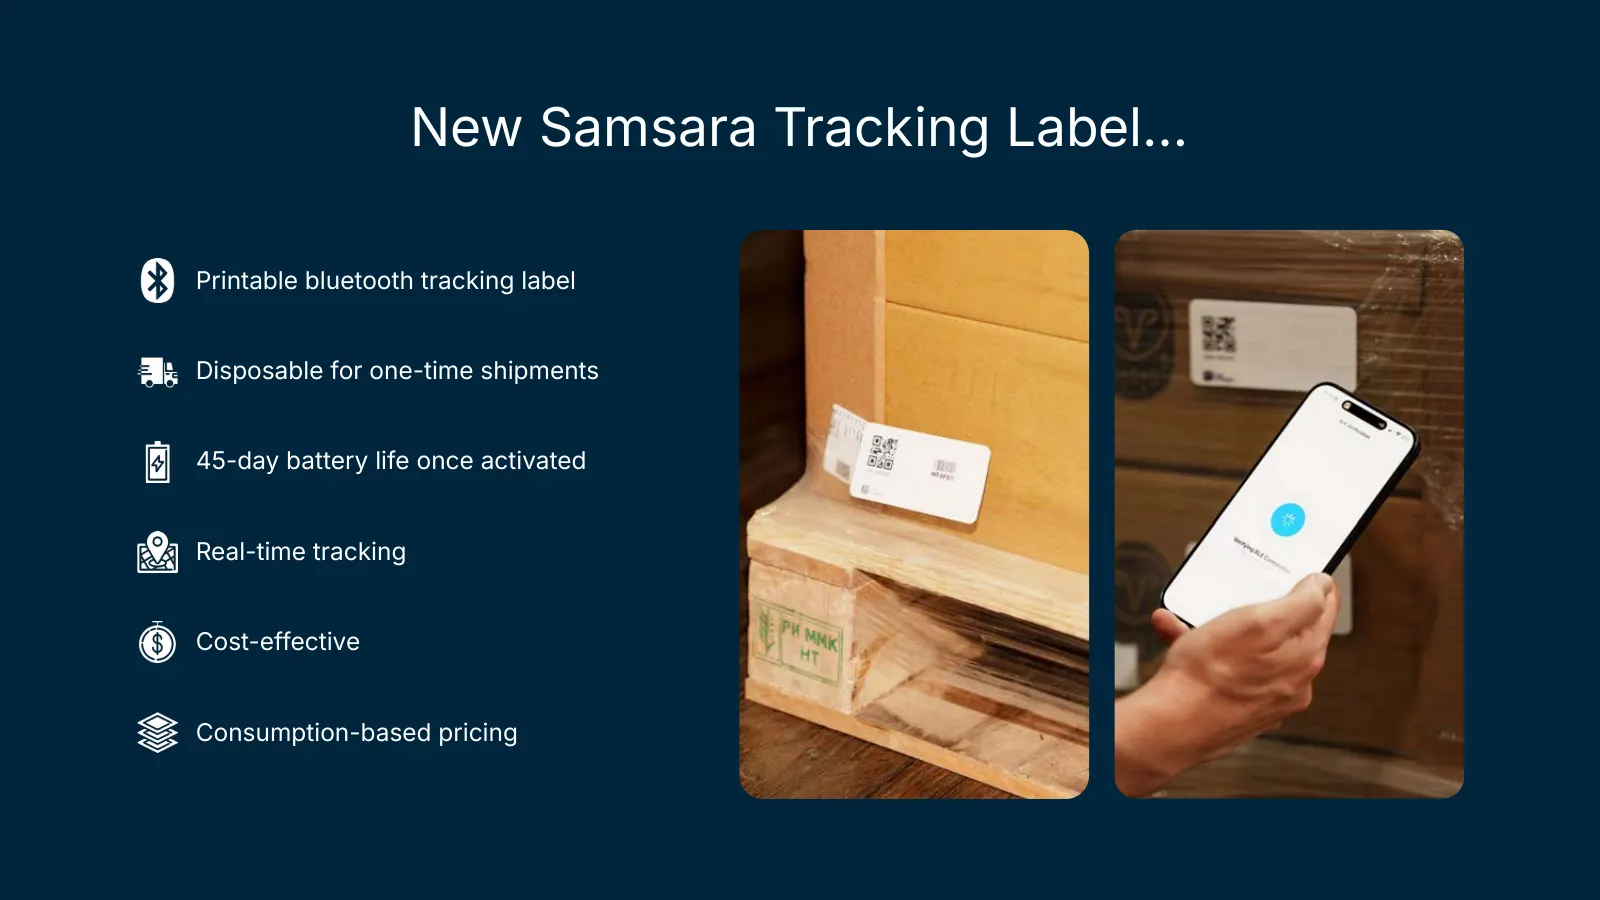
Slide 32: New Samsara Tracking Label
New Samsara Tracking Label… Printable bluetooth tracking label Disposable for one-time shipments 45-day battery life once activated Real-time tracking Cost-effective Consumption-based pricing
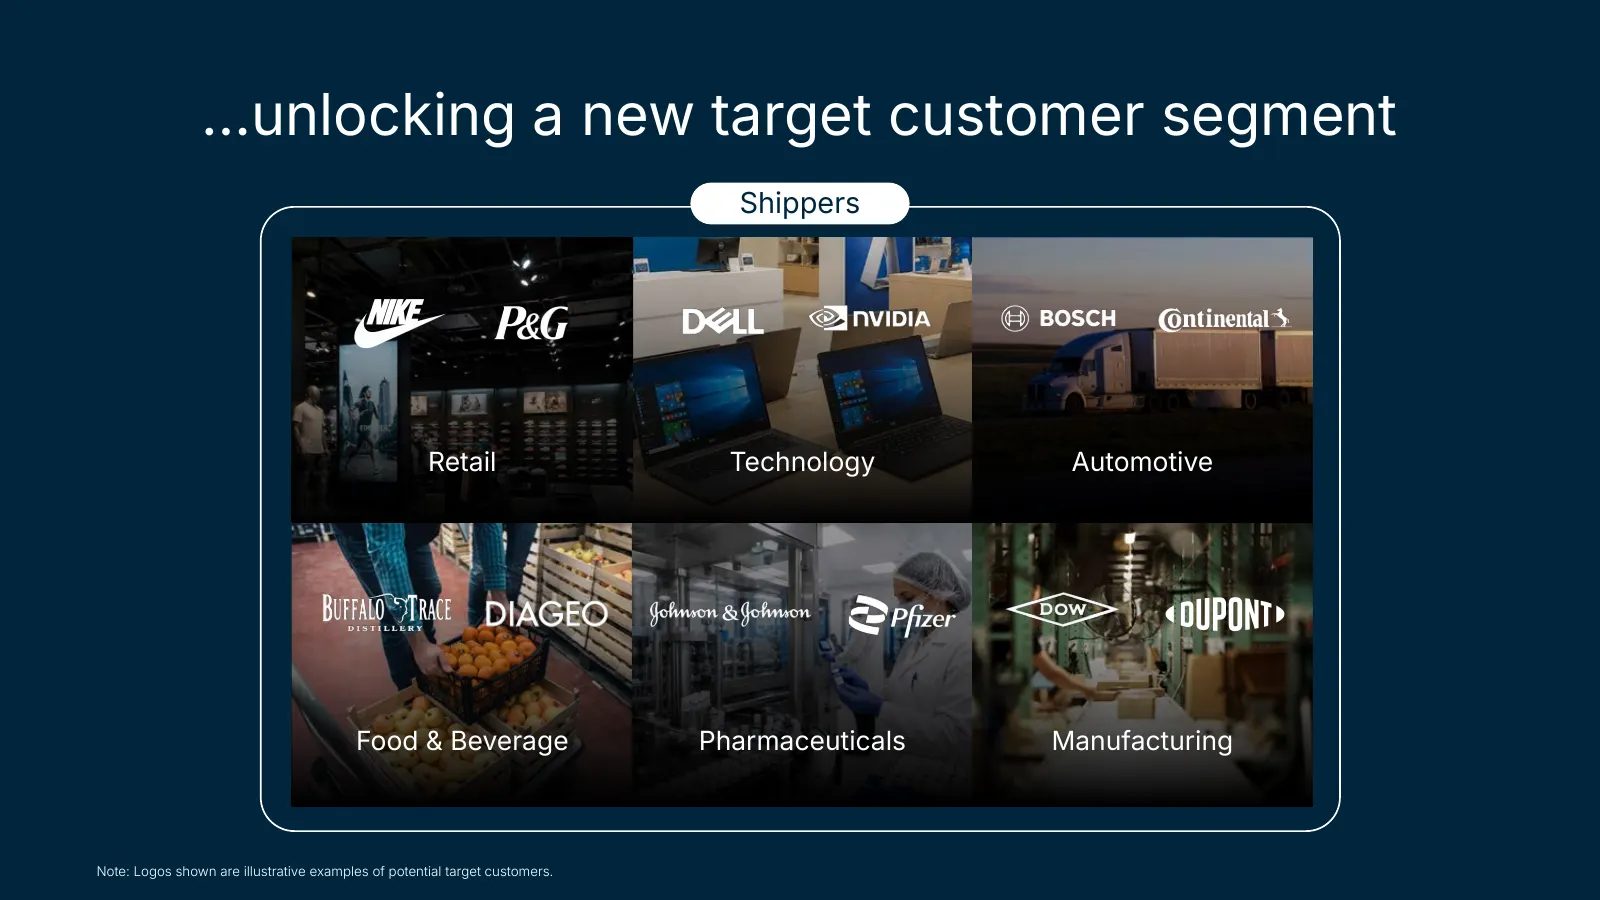
Slide 33: …unlocking a new target customer segment
…unlocking a new target customer segment Shippers Retail Technology Automotive Food & Beverage Pharmaceuticals Manufacturing Note: Logos shown are illustrative examples of potential target customers.
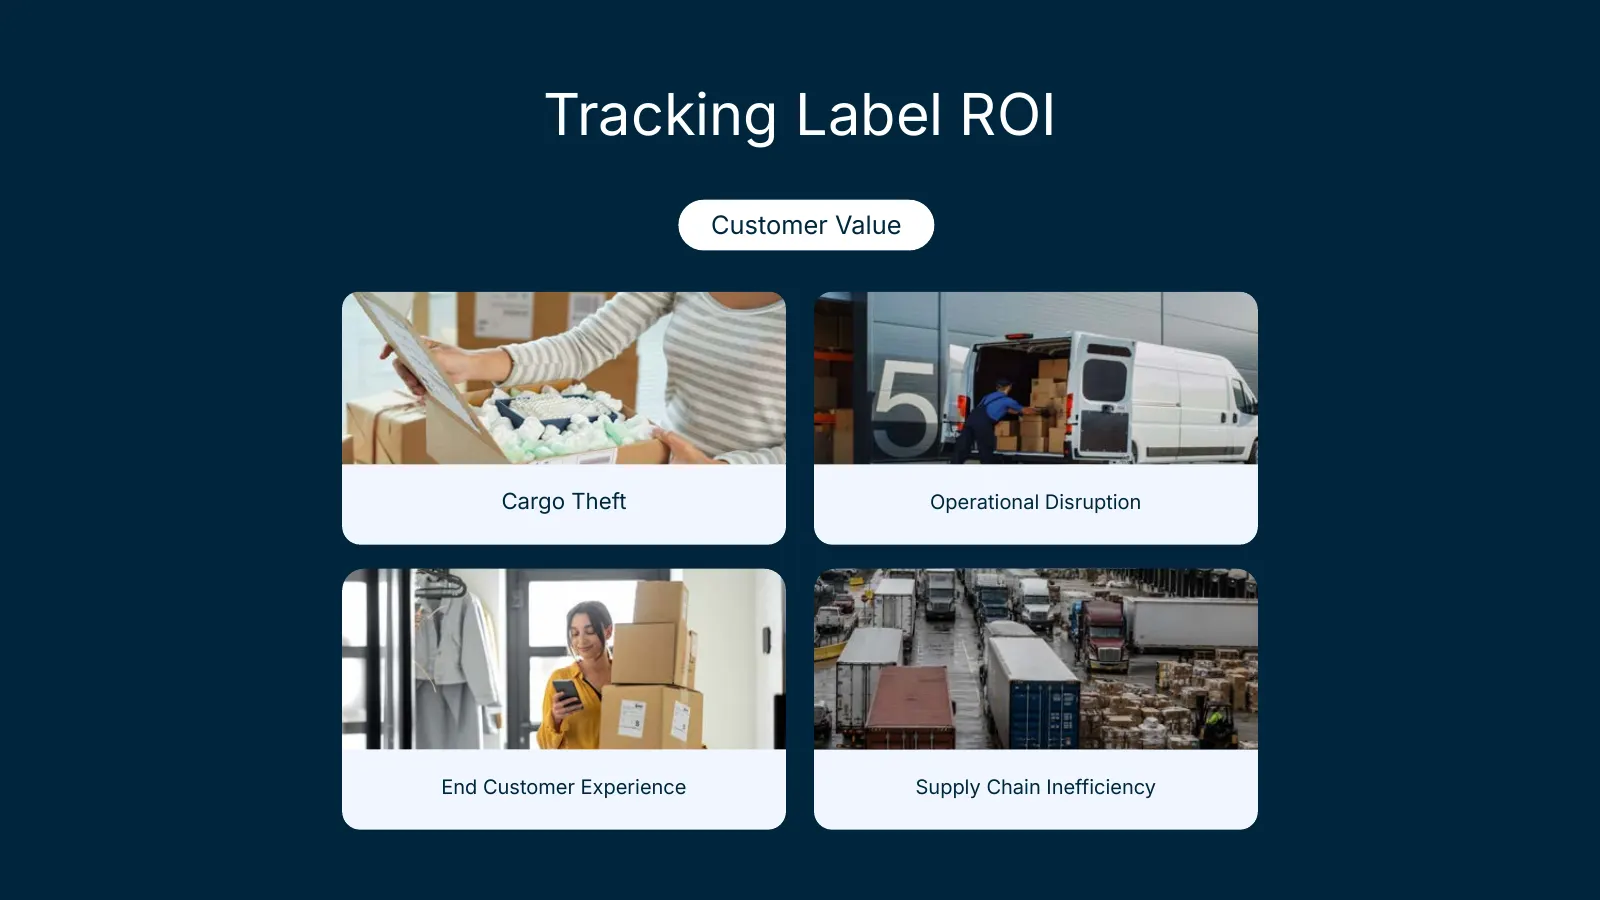
Slide 34: Tracking Label ROI
Tracking Label ROI Customer Value Cargo Theft Operational Disruption End Customer Experience Supply Chain Inefficiency
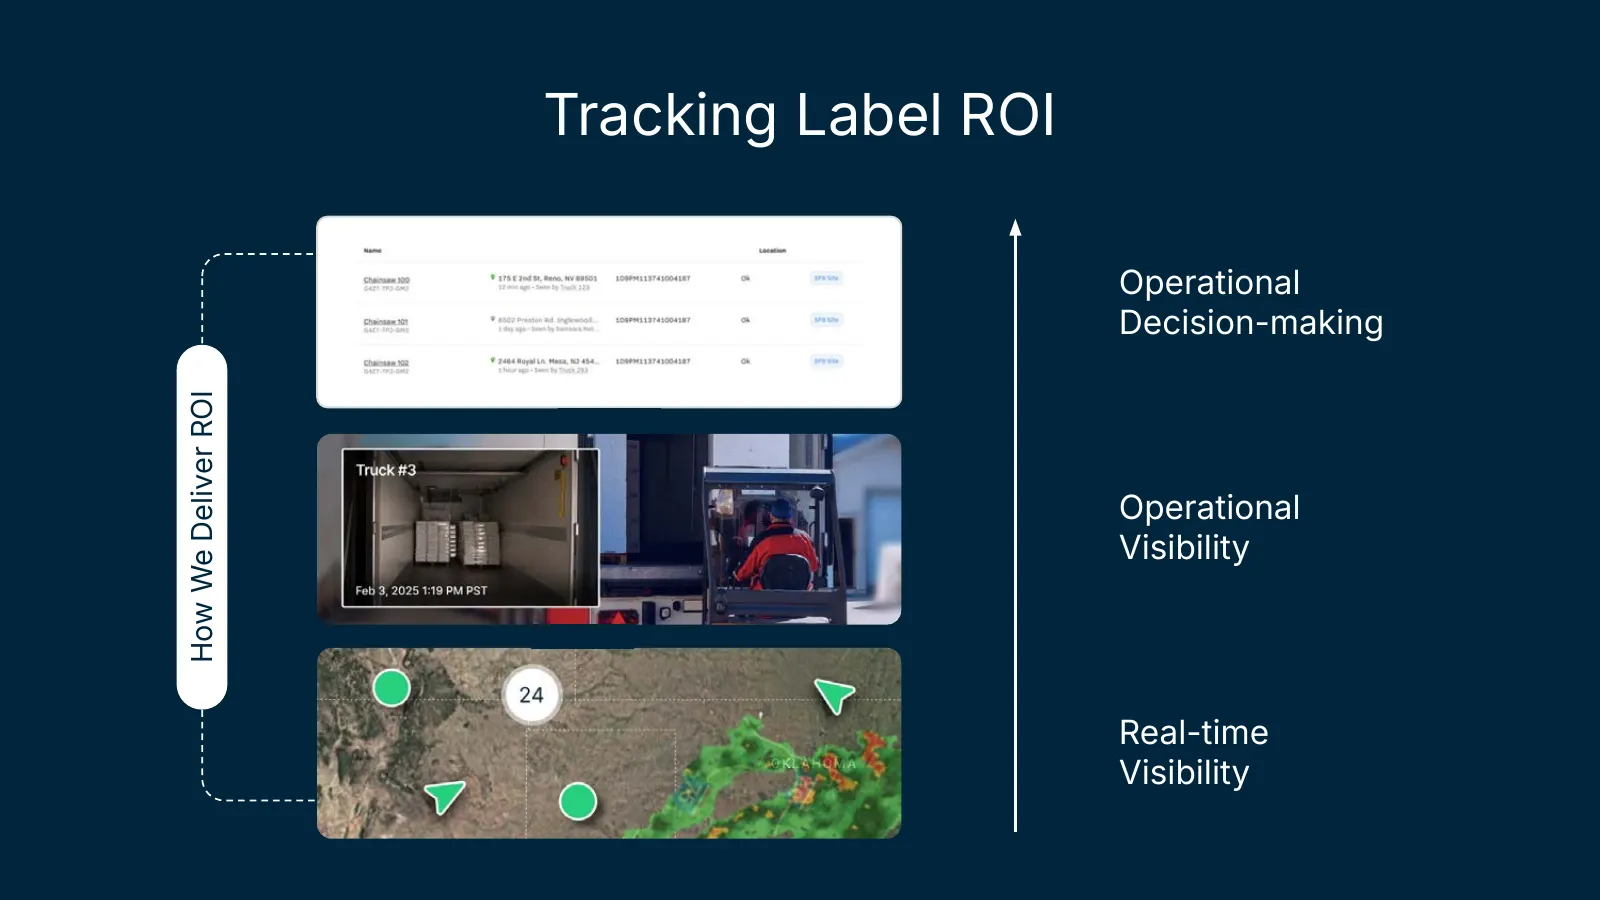
Slide 35: How We Deliver ROI
Tracking Label ROI Operational Decision-making How We Deliver ROI Operational Visibility Real-time Visibility
Slide 36: Tracking Label
Product Demo Tracking Label
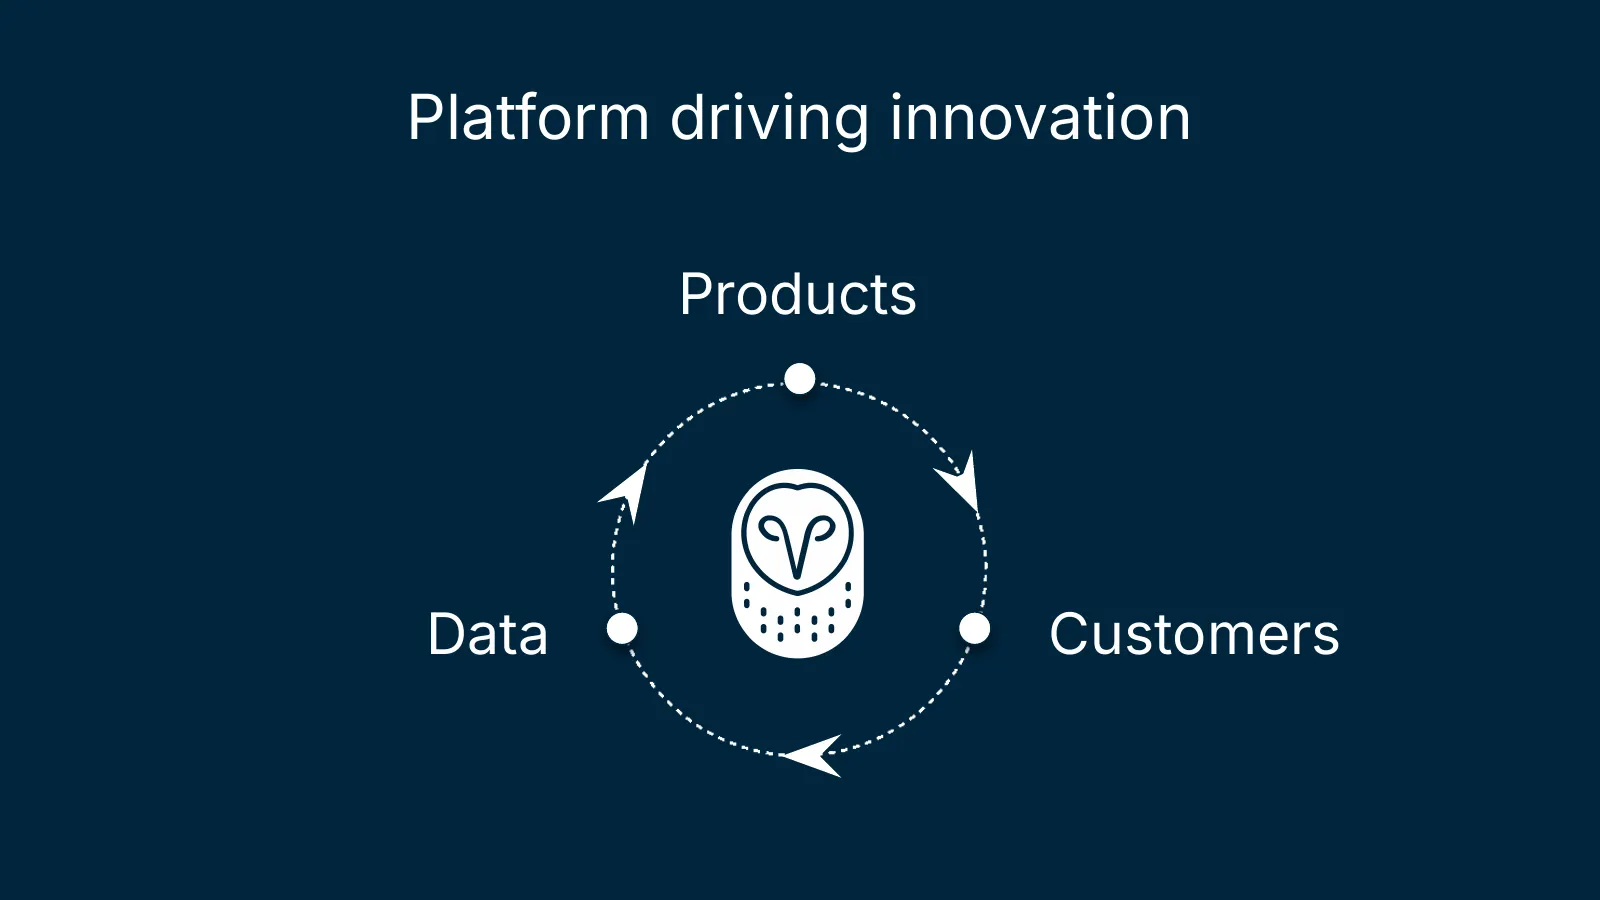
Slide 37: Platform driving innovation
Platform driving innovation Products Data Customers
Slide 38: Go-to-Market Momentum
Go-to-Market Momentum Amit Vyas Chief Revenue Officer
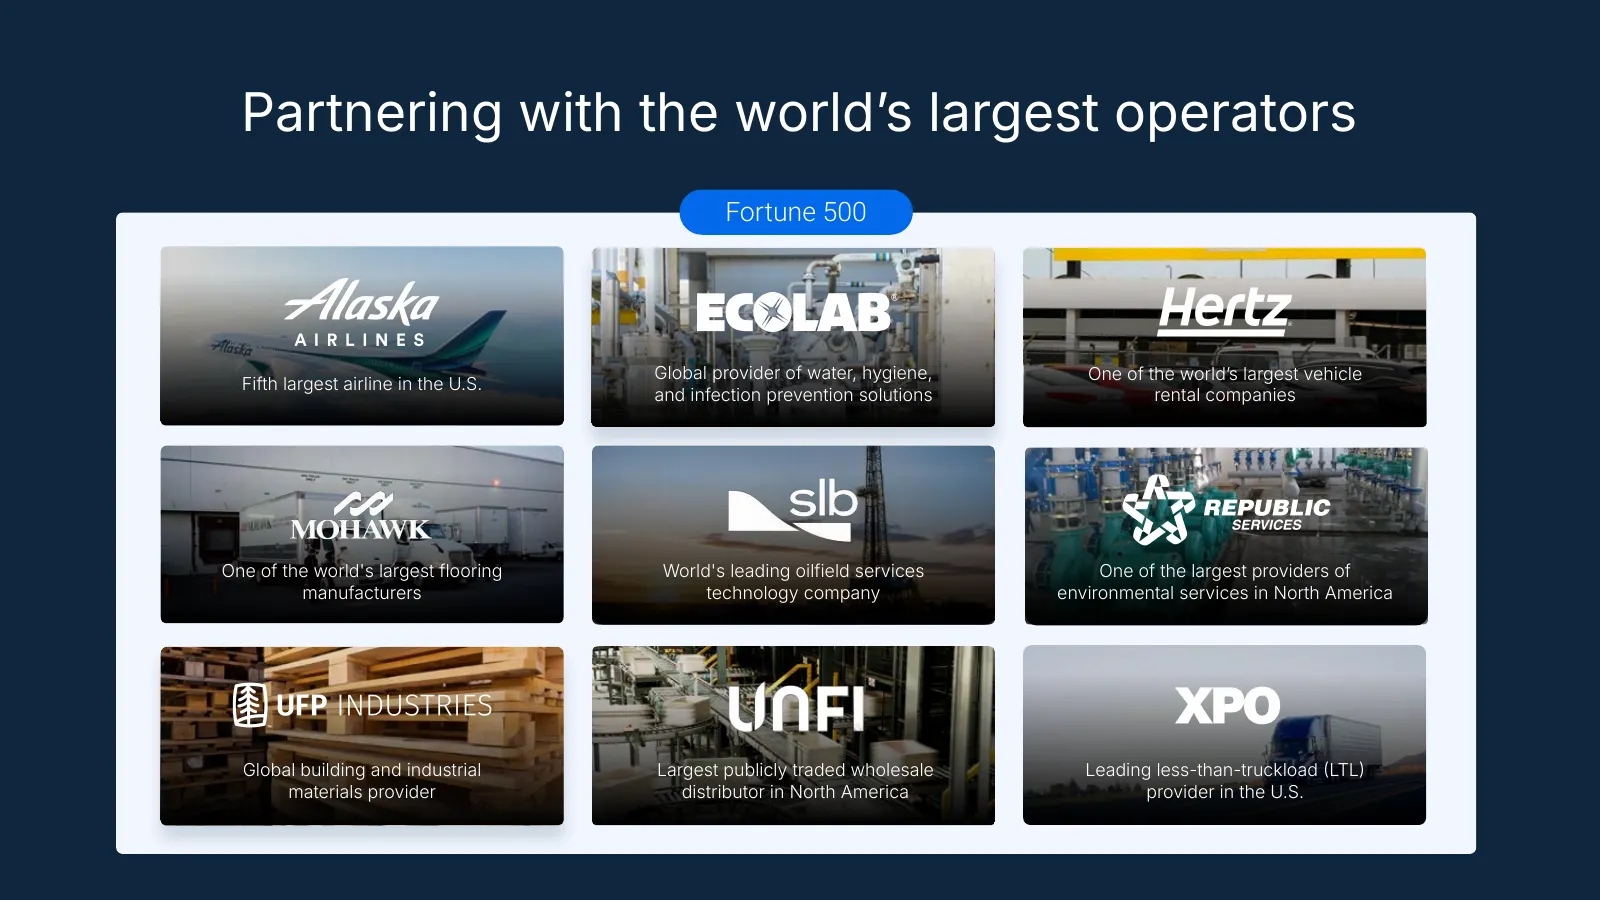
Slide 39: Partnering with the world's largest operators
Partnering with the worldʼs largest operators Fortune 500 Second largest US Global provider of water, hygiene, One of the worldʼs largest vehicle Fifth largest airline in the U.S. food distributor and infection prevention solutions rental companies One ofSecond largest the world's USflooring largest
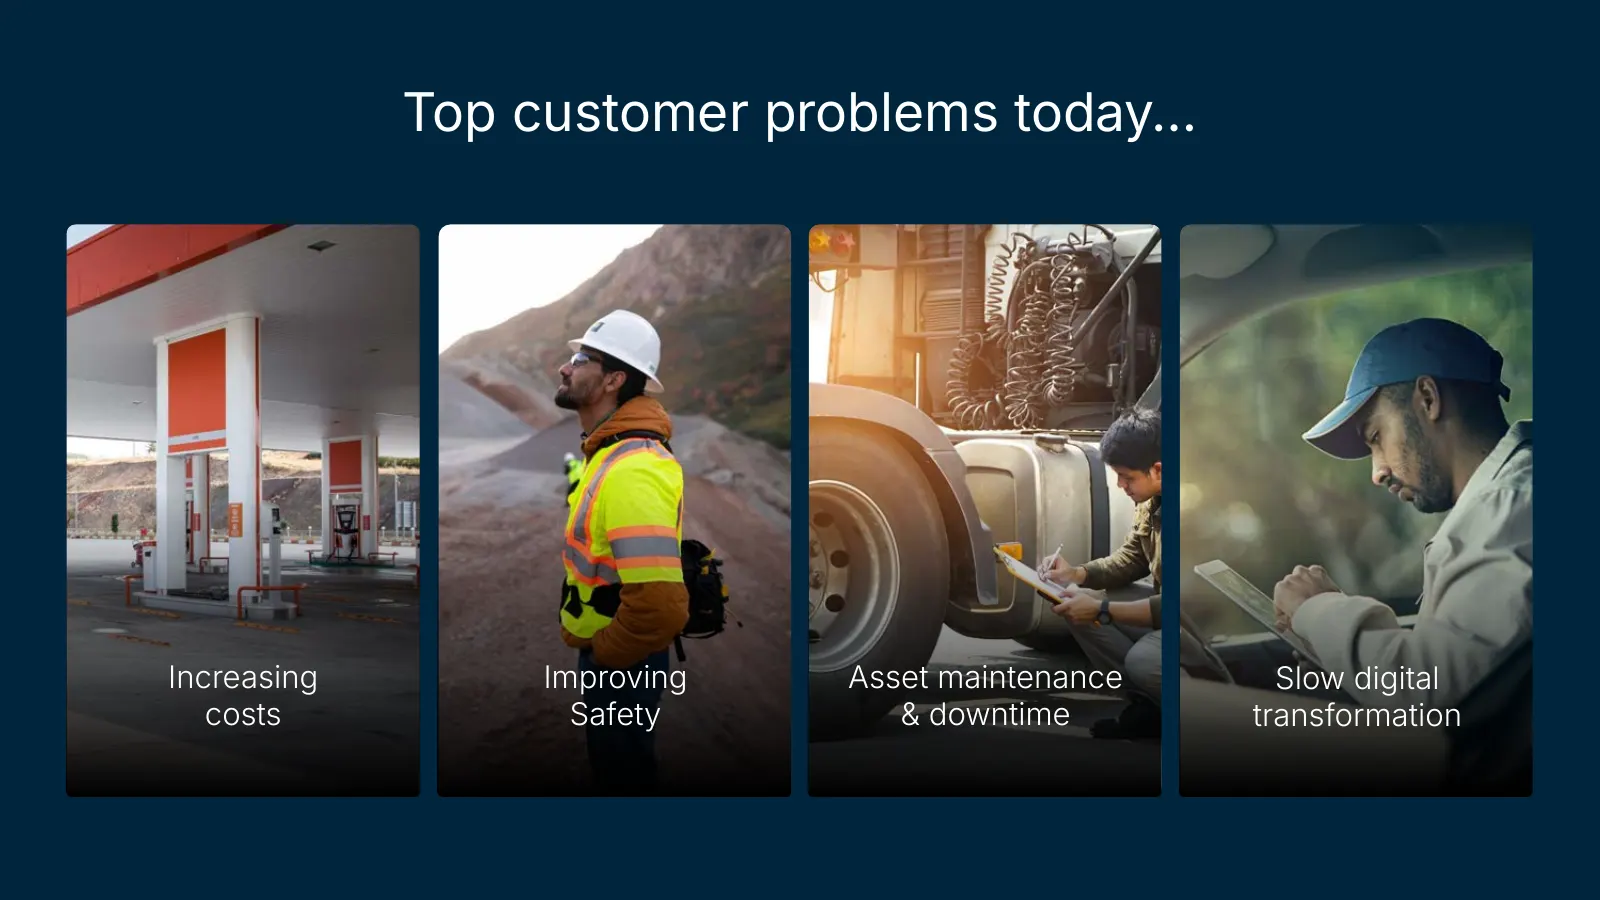
Slide 40: Top customer problems today…
Top customer problems today… Increasing Improving Asset maintenance Slow digital costs Safety & downtime transformation
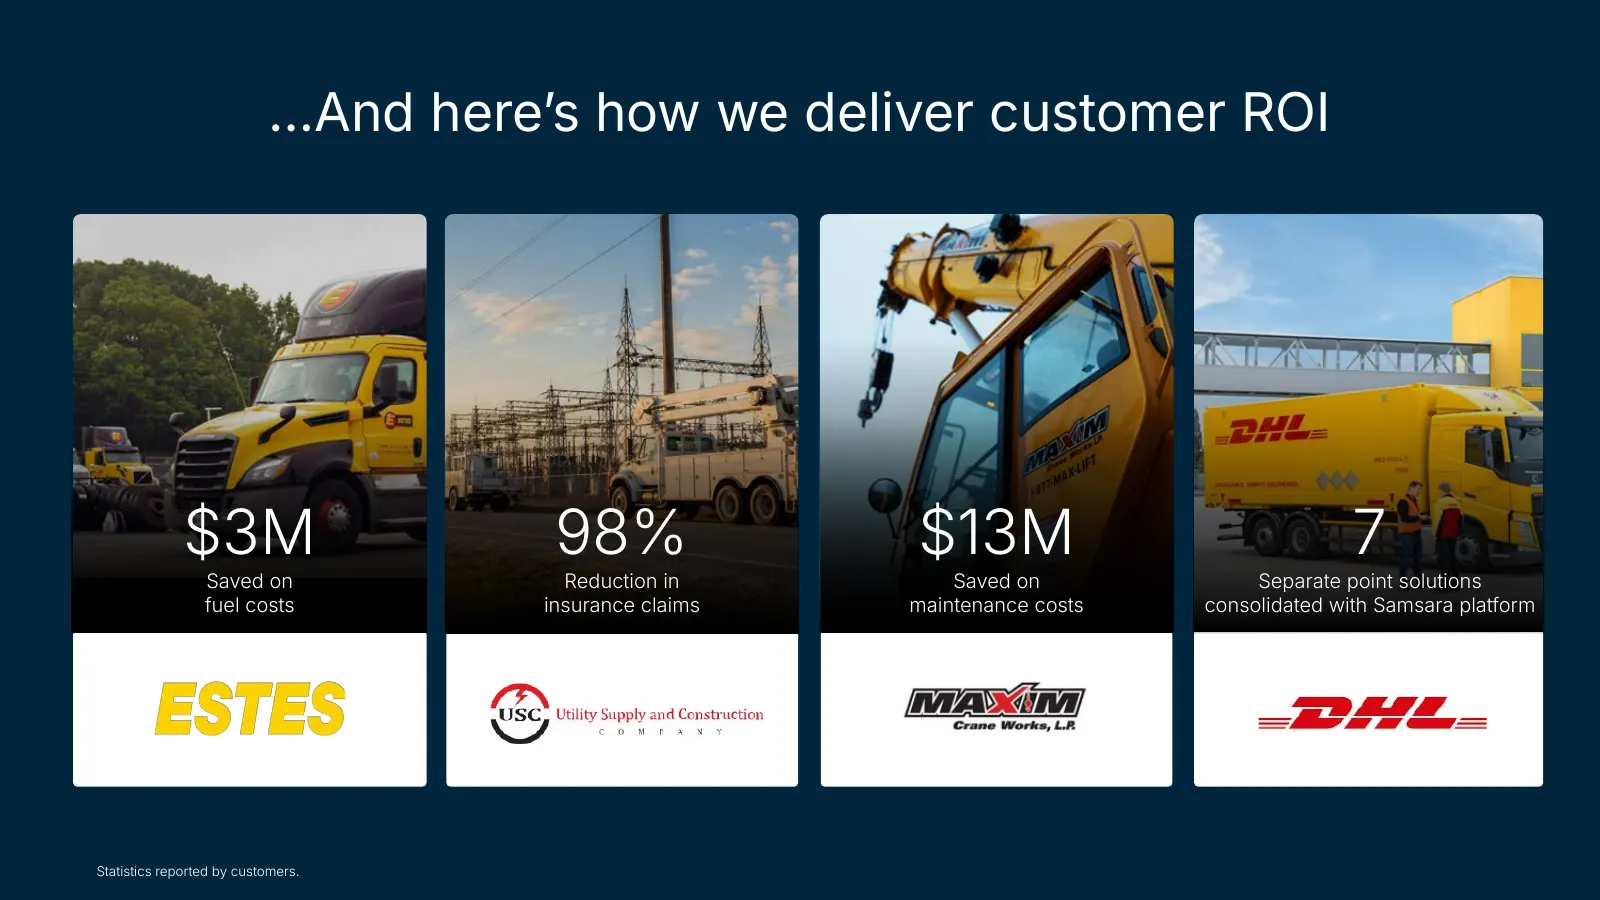
Slide 41: …And here's how we deliver customer ROI
…And hereʼs how we deliver customer ROI $3M 98% $13M 7 Saved on Reduction in Saved on Separate point solutions fuel costs insurance claims maintenance costs consolidated with Samsara platform Statistics reported by customers.
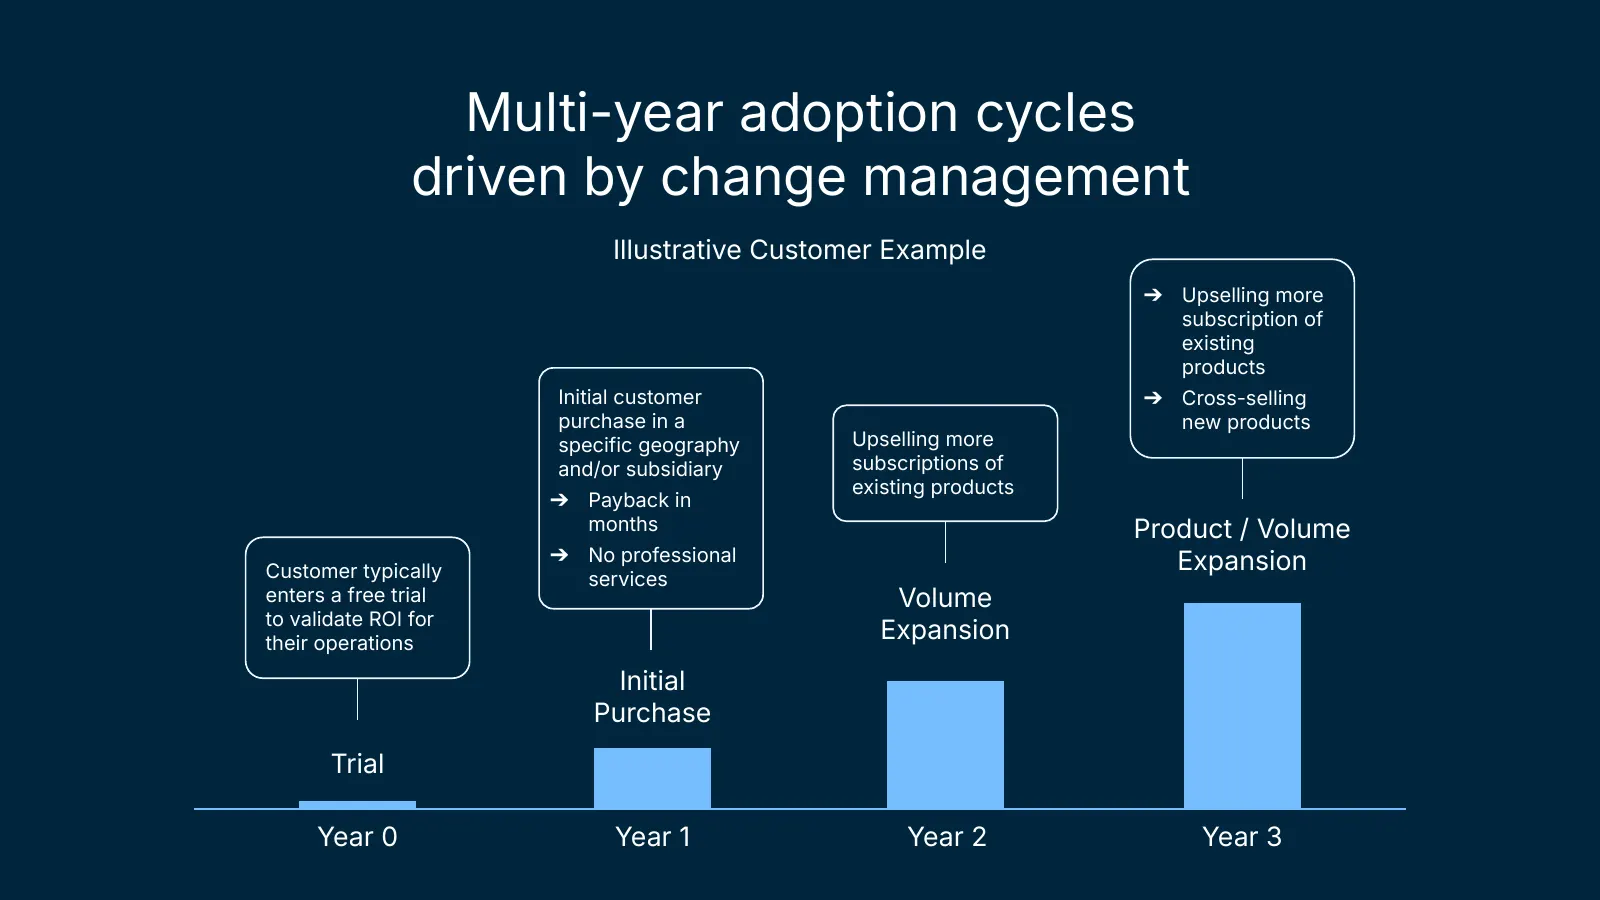
Slide 42: Multi-year adoption cycles driven by change management
Multi-year adoption cycles driven by change management Illustrative Customer Example ➔ Upselling more subscription of existing products Initial customer ➔ Cross-selling purchase in a new products specific geography Upselling more and/or subsidiary subscriptions of existing products ➔ Payback in mont
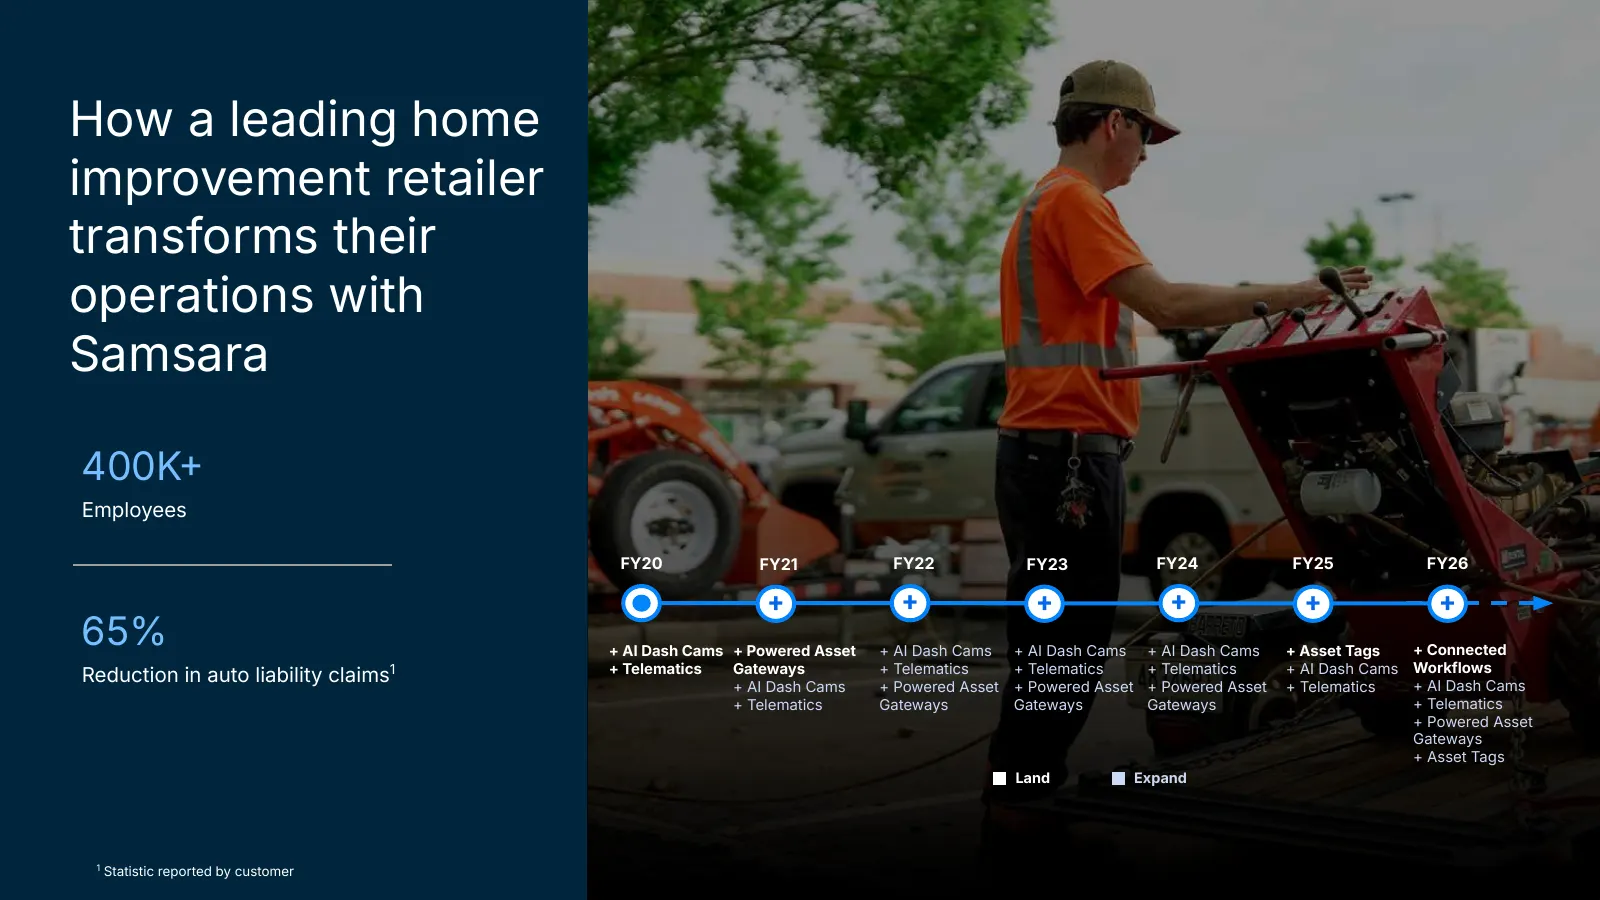
Slide 43: How a leading home improvement retailer transforms their operations with Samsara
How a leading home improvement retailer transforms their operations with Samsara 400K Employees FY20 FY21 FY22 FY23 FY24 FY25 FY26 + + + + + + 65% + AI Dash Cams + Powered Asset + AI Dash Cams + AI Dash Cams + AI Dash Cams + Asset Tags + Connected + Telematics Gateways + Telematics + Telematics + T
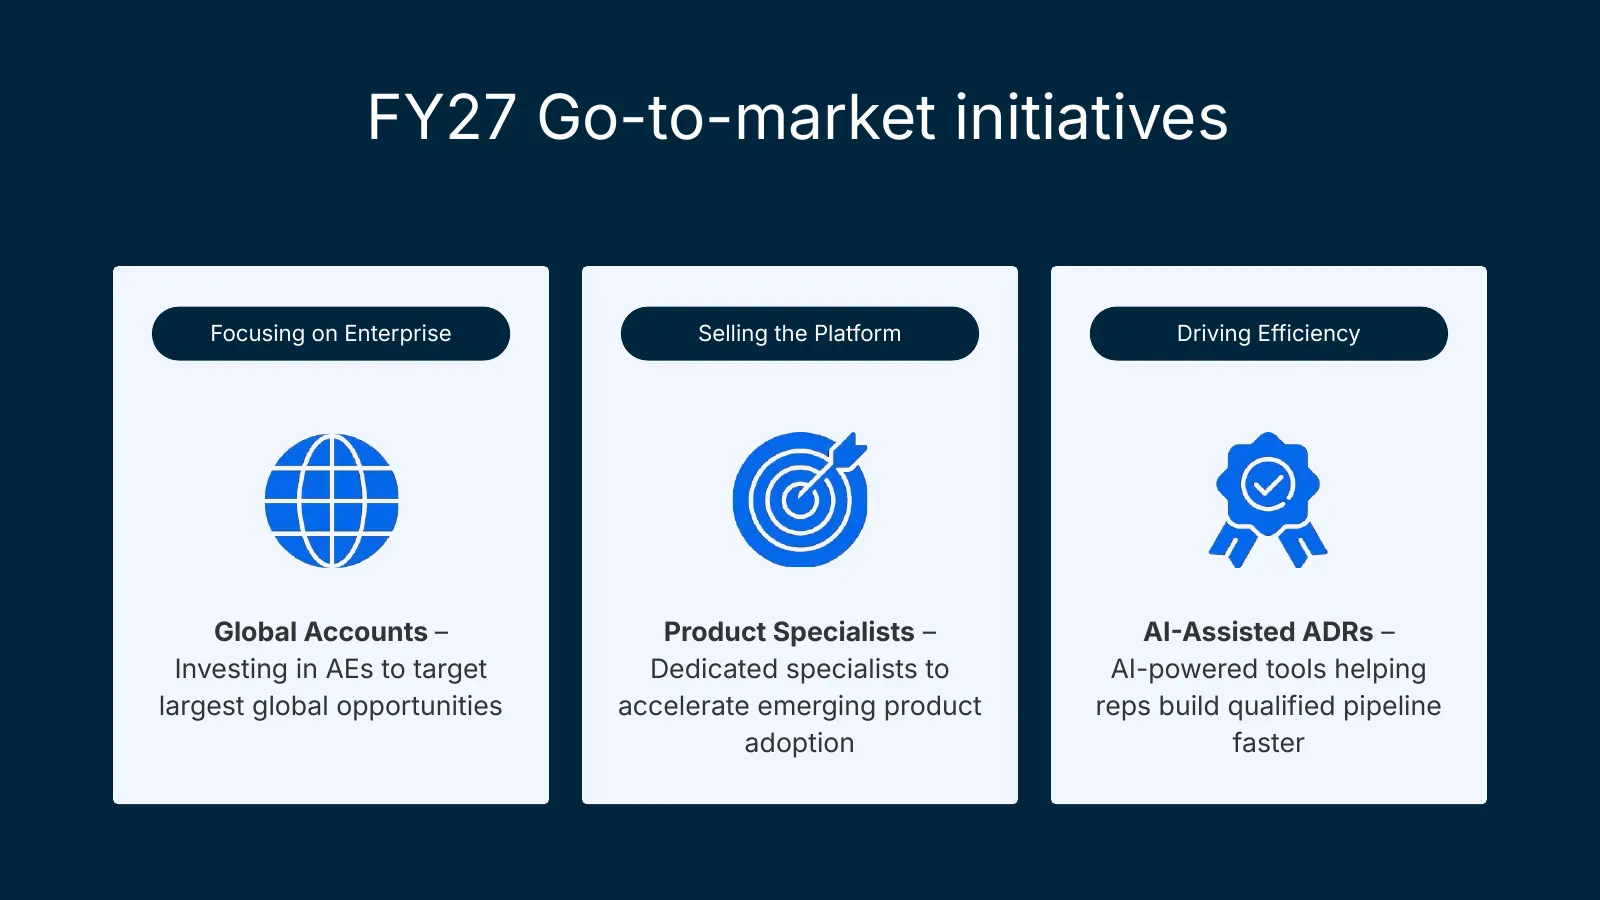
Slide 44: FY27 Go-to-market initiatives
FY27 Go-to-market initiatives Focusing on Enterprise Selling the Platform Driving Efficiency Global Accounts – Product Specialists – AIAssisted ADRs – Investing in AEs to target Dedicated specialists to AI-powered tools helping largest global opportunities accelerate emerging product reps build qua
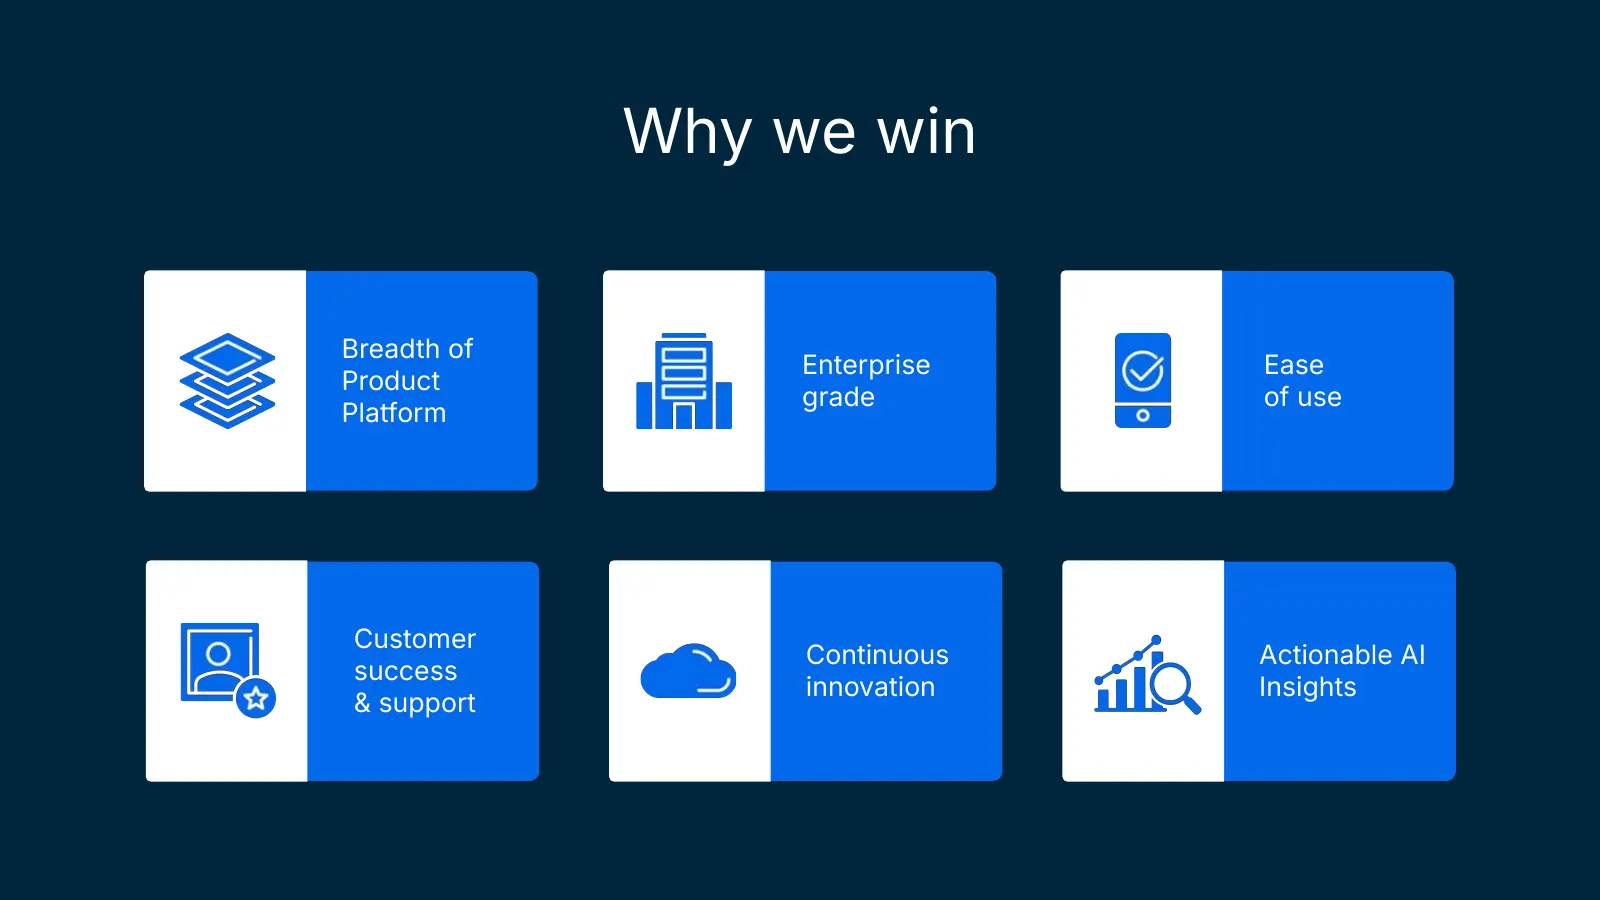
Slide 45: Why we win
Why we win Breadth of Enterprise Ease Product grade of use Platform Customer Continuous Actionable AI success innovation Insights & support
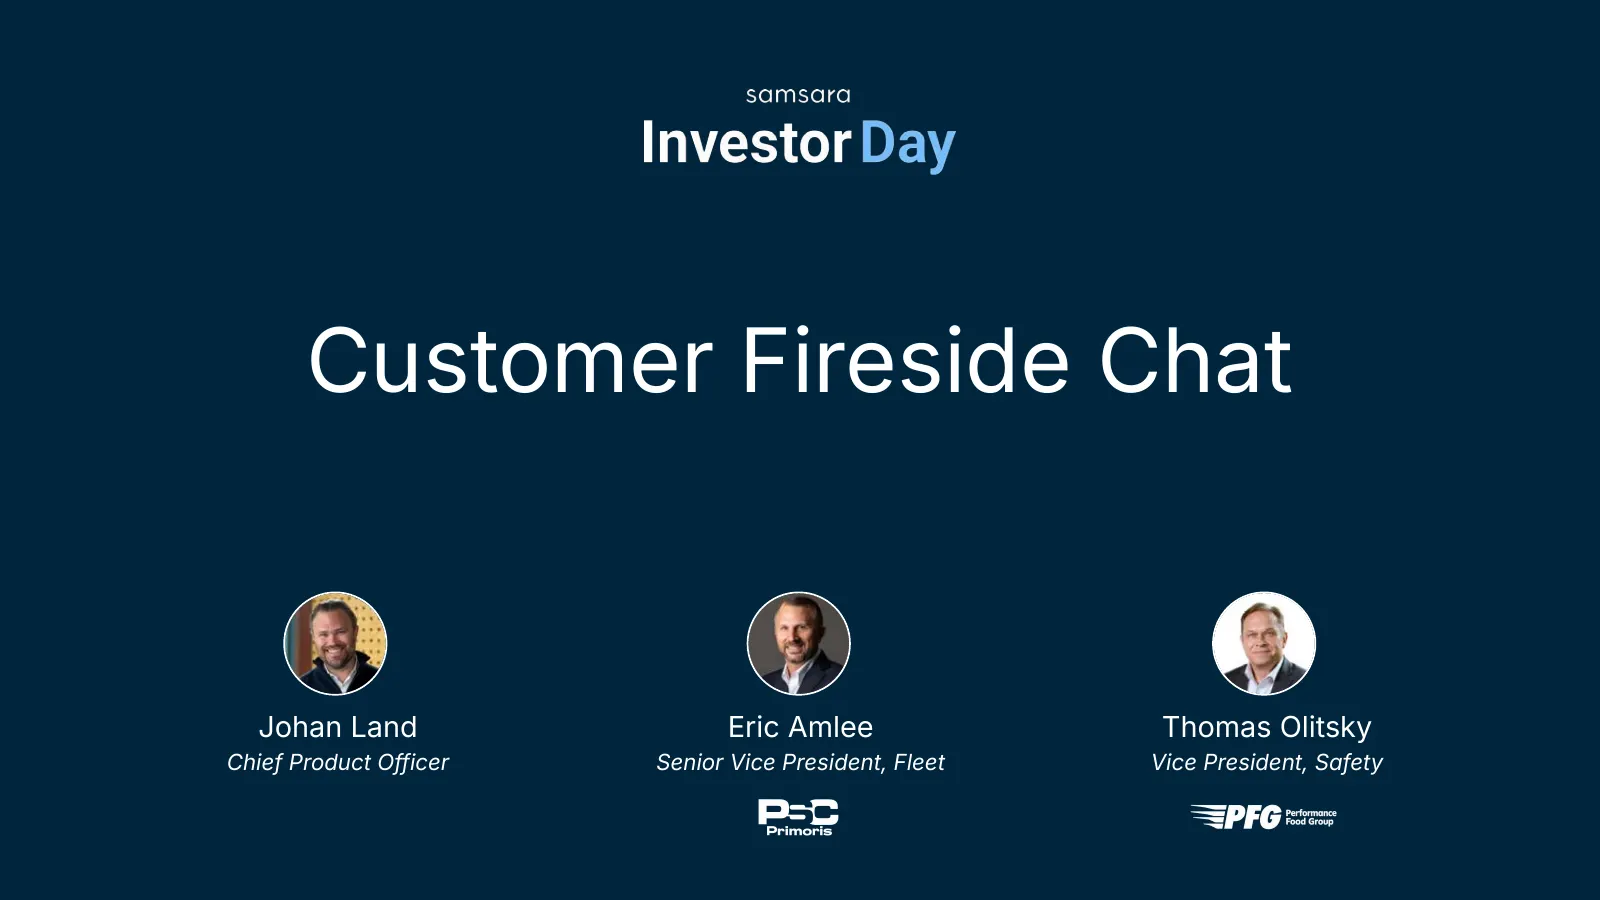
Slide 46: Customer Fireside Chat
Customer Fireside Chat Johan Land Eric Amlee Thomas Olitsky Chief Product Officer Senior Vice President, Fleet Vice President, Safety
Slide 47: Durable and Profitable Growth
Durable and Profitable Growth Dominic Phillips Chief Financial Officer
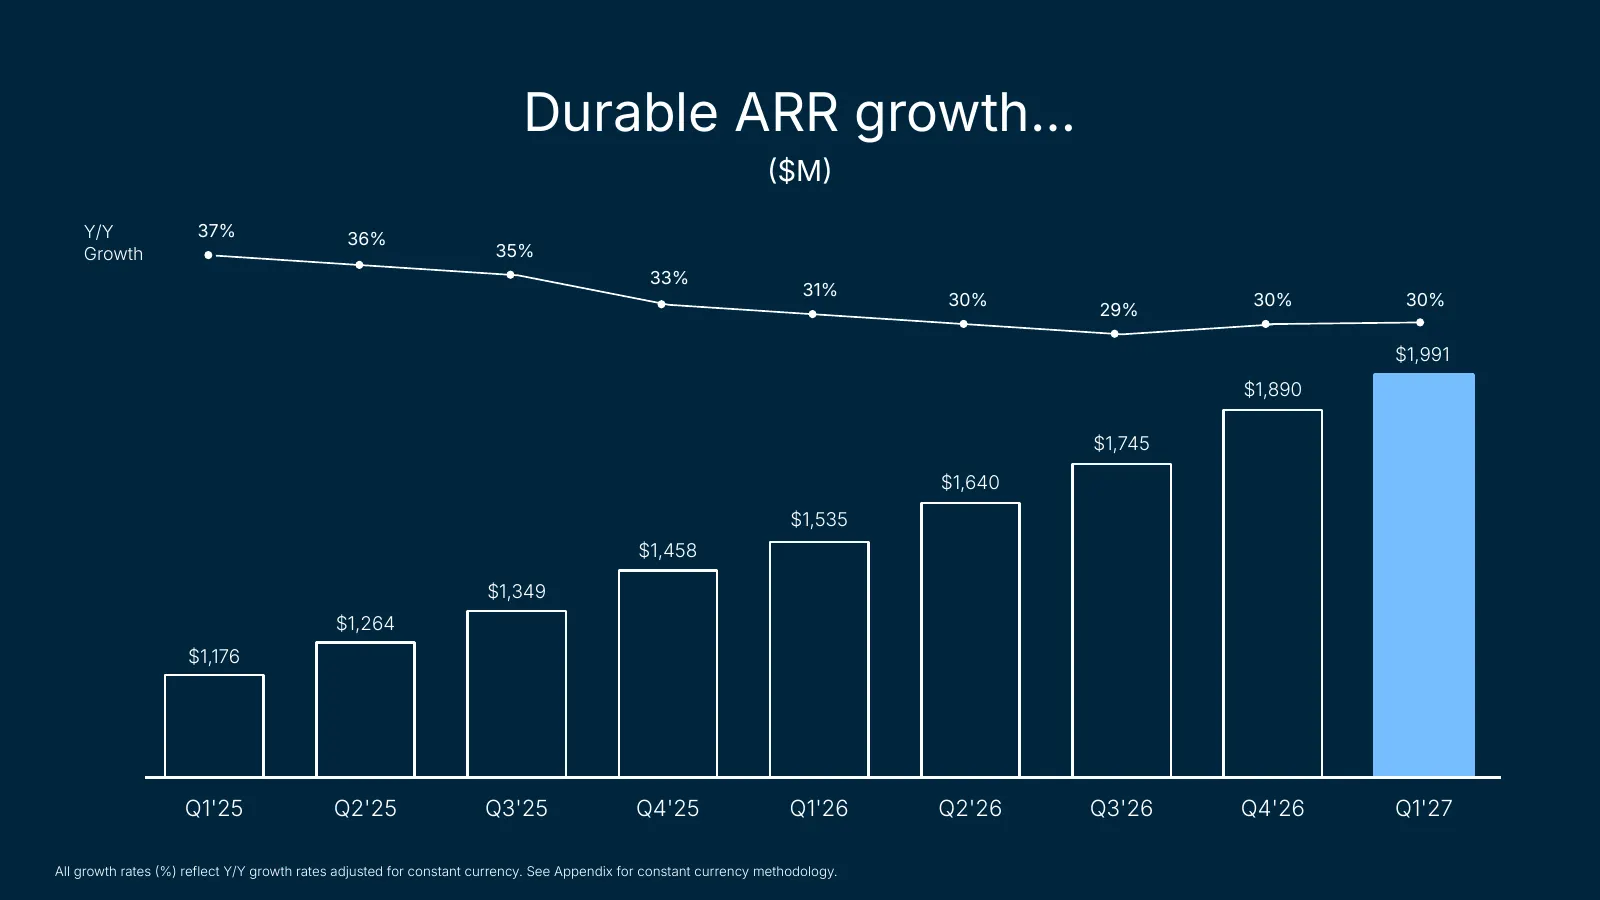
Slide 48: Durable ARR growth…
Durable ARR growth… $M Y/Y 37% 36% Growth 35% 33% 31% 30% 30% 30% 29% $1,991 $1,890 $1,745 $1,640 $1,535 $1,458 $1,349 $1,264 $1,176 Q1'25 Q2'25 Q3'25 Q4'25 Q1'26 Q2'26 Q3'26 Q4'26 Q1'27 All growth rates %) reflect Y/Y growth rates adjusted for constant currency. See Appendix for constant currenc
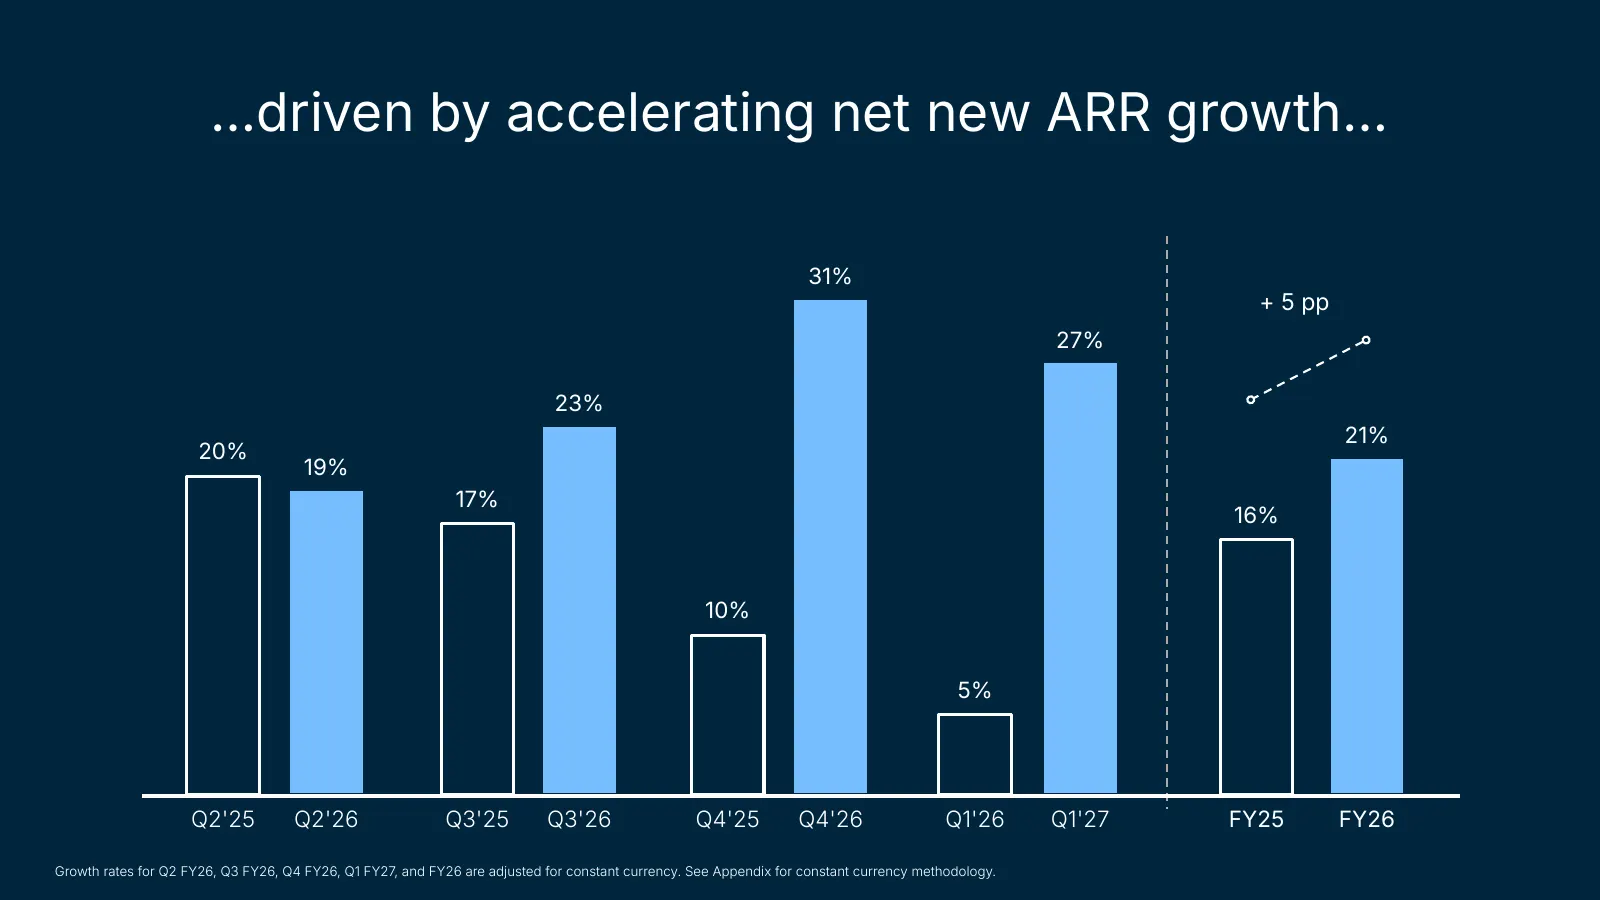
Slide 49: …driven by accelerating net new ARR growth…
…driven by accelerating net new ARR growth… 31% + 5 pp 27% 23% 21% 20% 19% 17% 16% 10% 5% Q2'25 Q2'26 Q3'25 Q3'26 Q4'25 Q4'26 Q1'26 Q1'27 FY25 FY26 Growth rates for Q2 FY26, Q3 FY26, Q4 FY26, Q1 FY27, and FY26 are adjusted for constant currency. See Appendix for constant currency methodology.
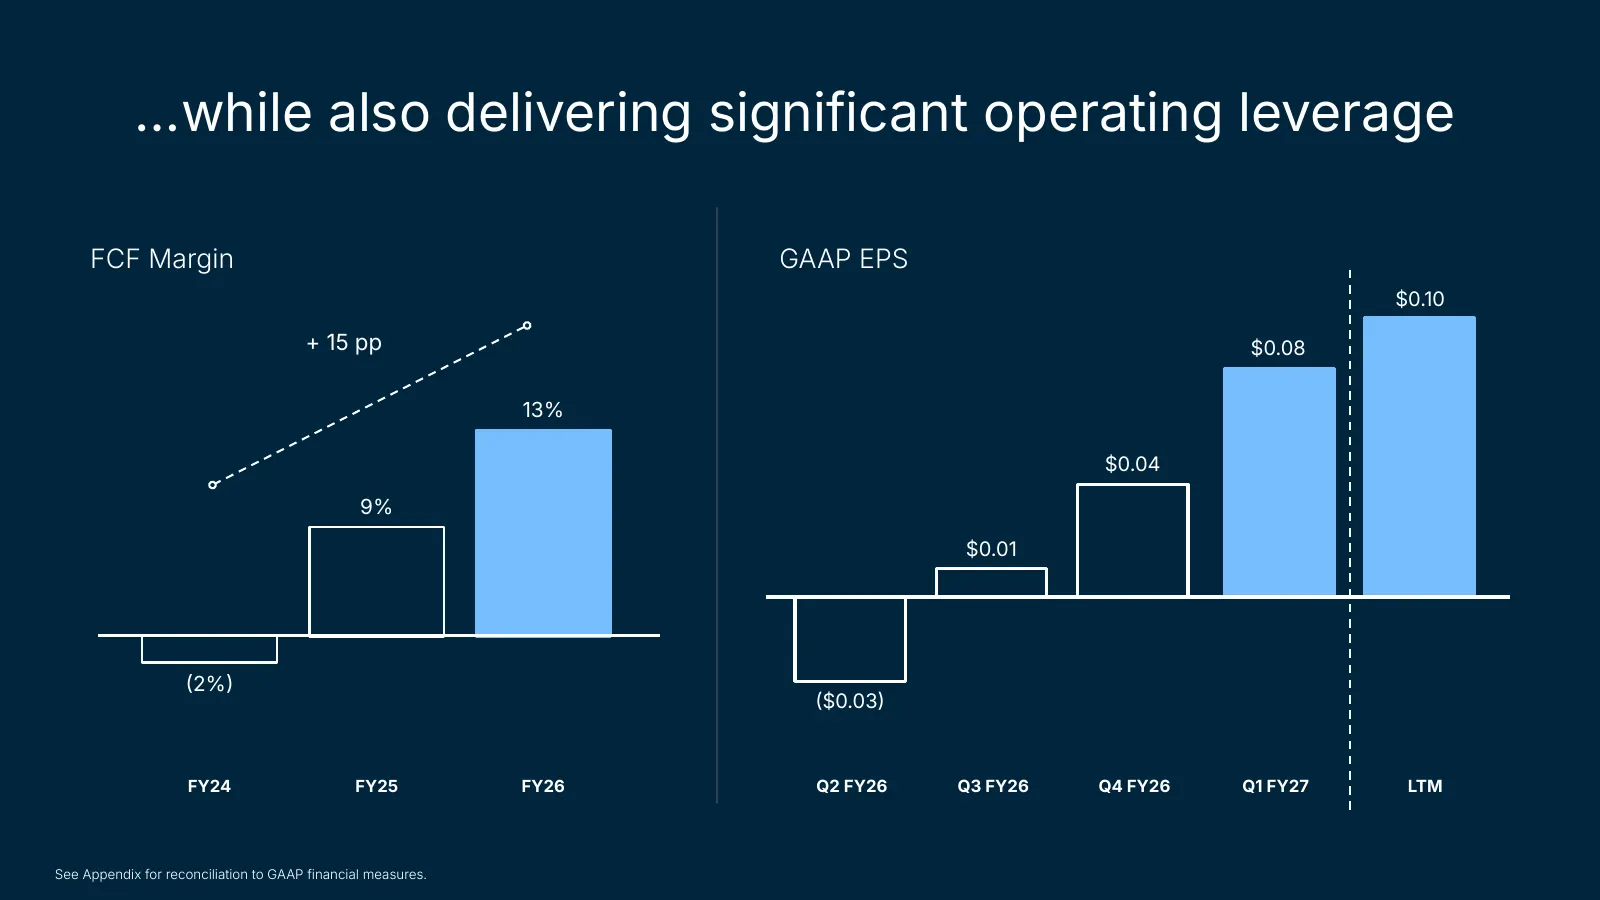
Slide 50: …while also delivering significant operating leverage
…while also delivering significant operating leverage FCF Margin GAAP EPS $0.10 + 15 pp $0.08 13% $0.04 9% $0.01 2% $0.03 FY24 FY25 FY26 Q2 FY26 Q3 FY26 Q4 FY26 Q1 FY27 LTM See Appendix for reconciliation to GAAP financial measures.
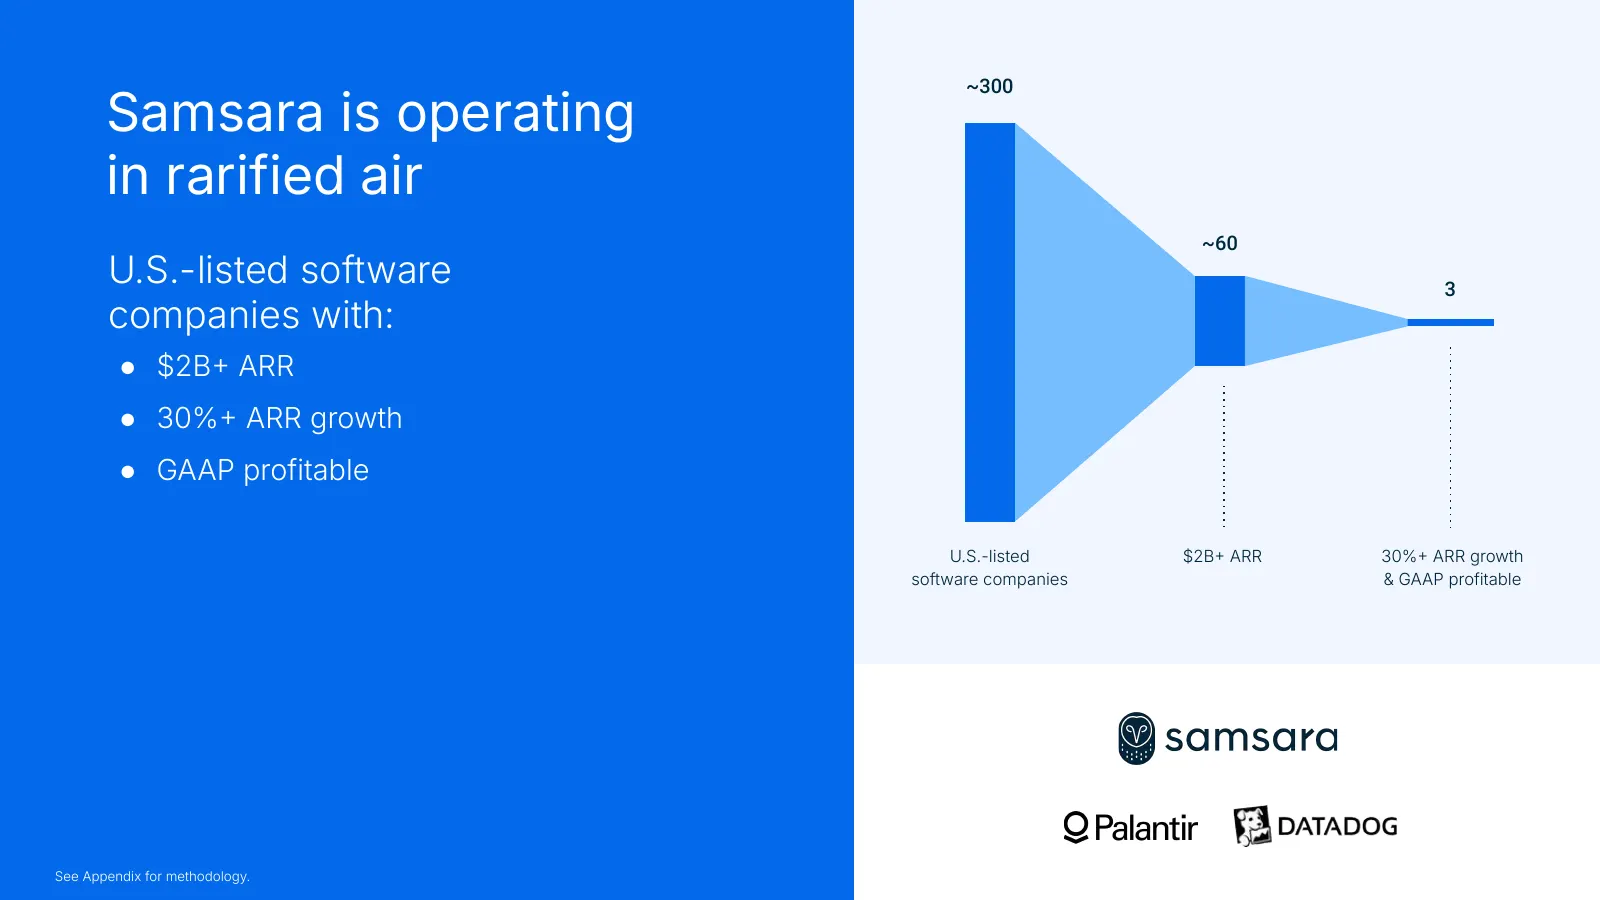
Slide 51: Samsara is operating in rarified air
~300 Samsara is operating in rarified air ~60 U.S.-listed software 3 companies with: ● $2B ARR ● 30% ARR growth ● GAAP profitable U.S.-listed $2B ARR 30% ARR growth software companies & GAAP profitable See Appendix for methodology.
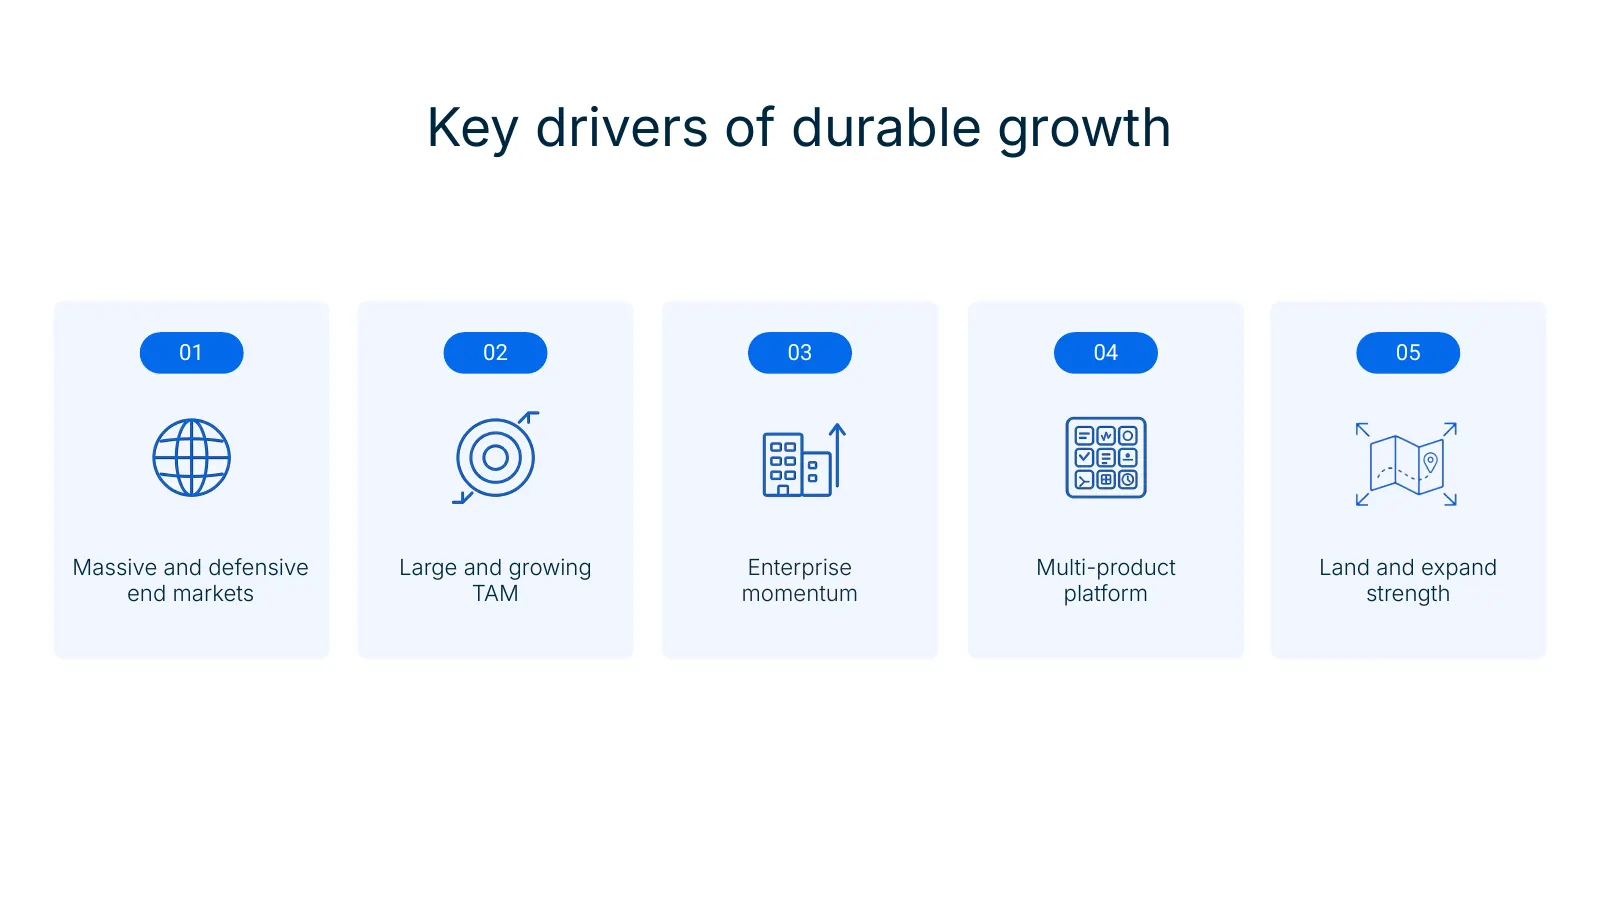
Slide 52: Key drivers of durable growth
Key drivers of durable growth 01 02 03 04 05 Massive and defensive Large and growing Enterprise Multi-product Land and expand end markets TAM momentum platform strength
Slide 53: Physical operations industries are massive…
01 Physical operations industries are massive… Global GDP Samsara ARR by 40%+ Industry Q1 FY27 >40% GDP Physical operations See Appendix for methodology. Percentages may not add up due to rounding.
Slide 54: …growing quickly…
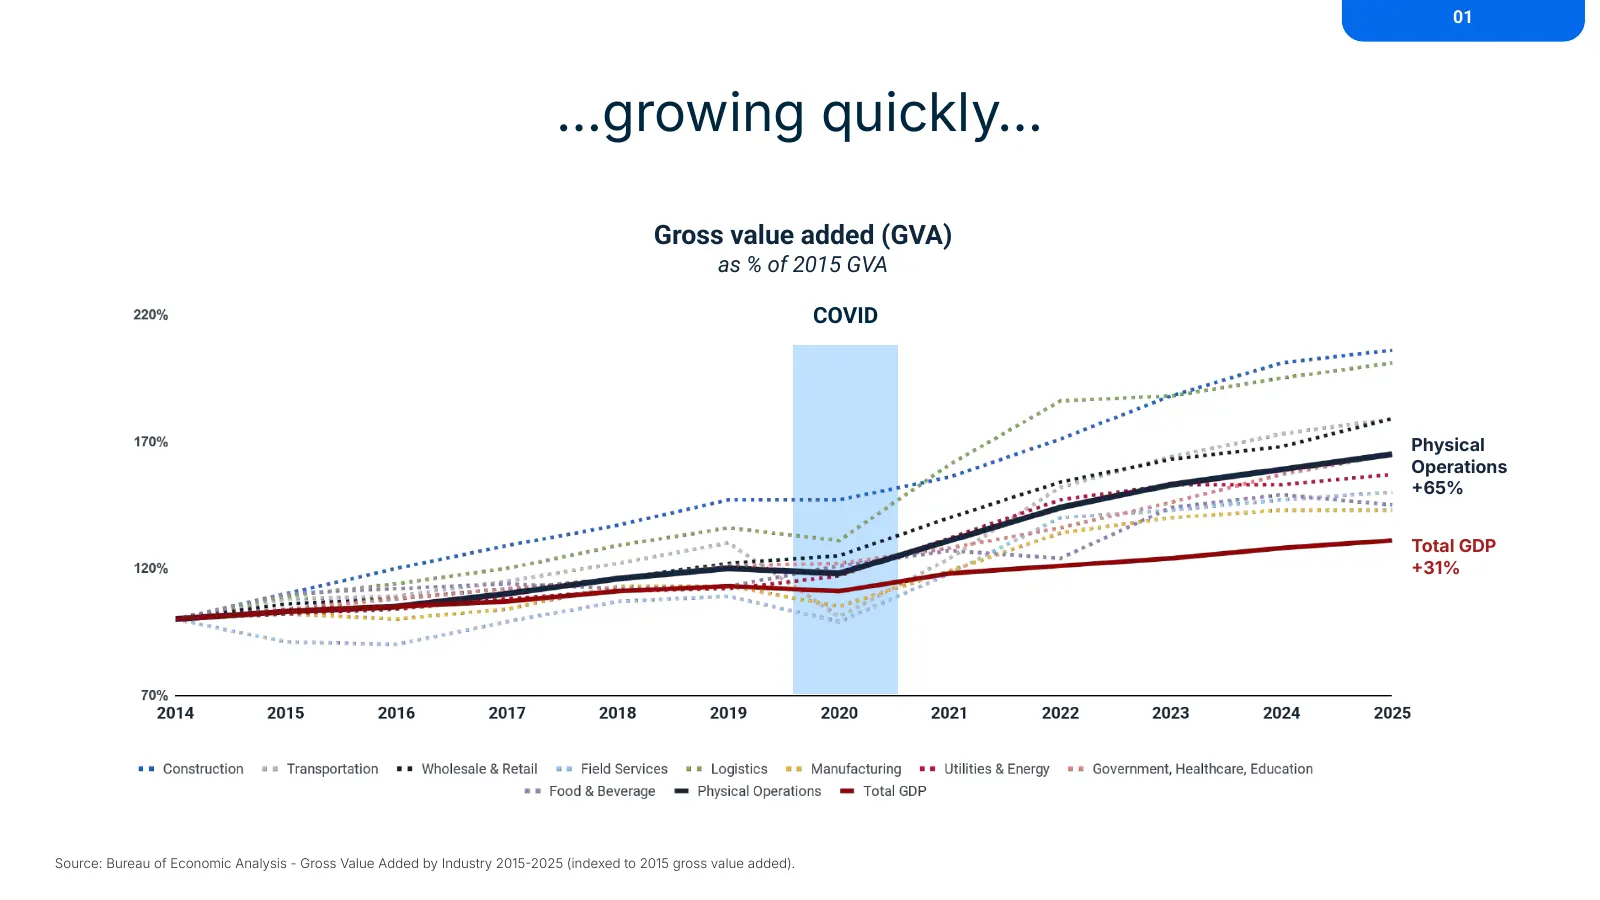
01 …growing quickly… Gross value added (GVA) as % of 2015 GVA COVID Physical Operations 65% Total GDP 31% Source: Bureau of Economic Analysis - Gross Value Added by Industry 20152025 (indexed to 2015 gross value added).
Slide 55: …with large, less discretionary Operations budgets…
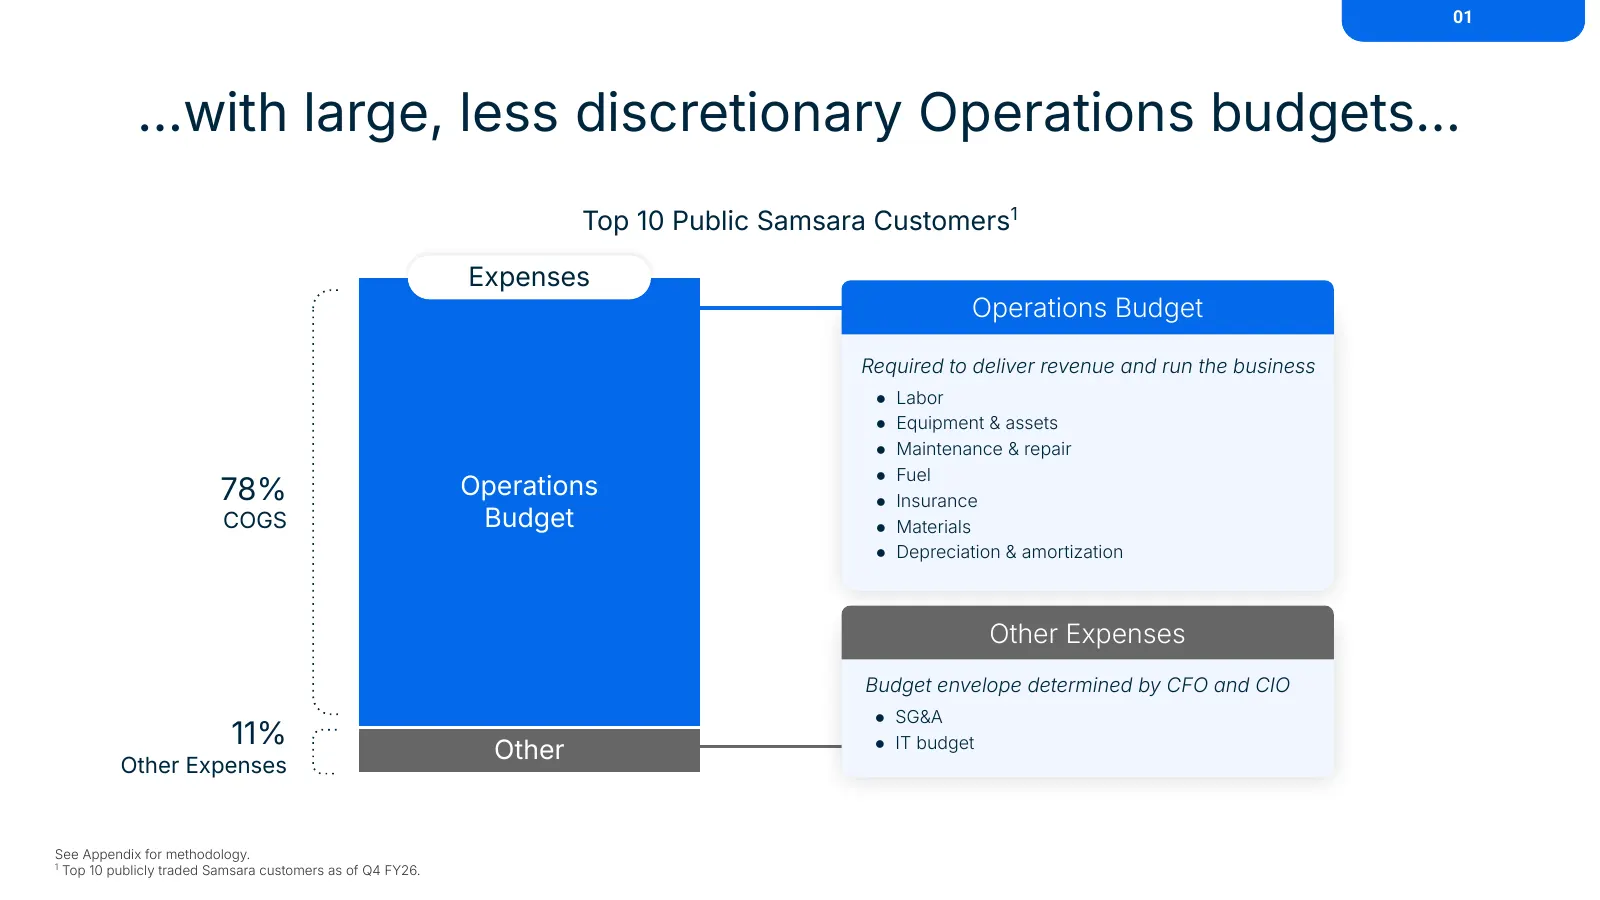
01 …with large, less discretionary Operations budgets… Top 10 Public Samsara Customers1 Expenses Operations Budget Required to deliver revenue and run the business ● Labor ● Equipment & assets ● Maintenance & repair ● Fuel 78% Operations ● Insurance COGS Budget ● Materials ● Depreciation & amortizat
Slide 56: …and are more AI resilient
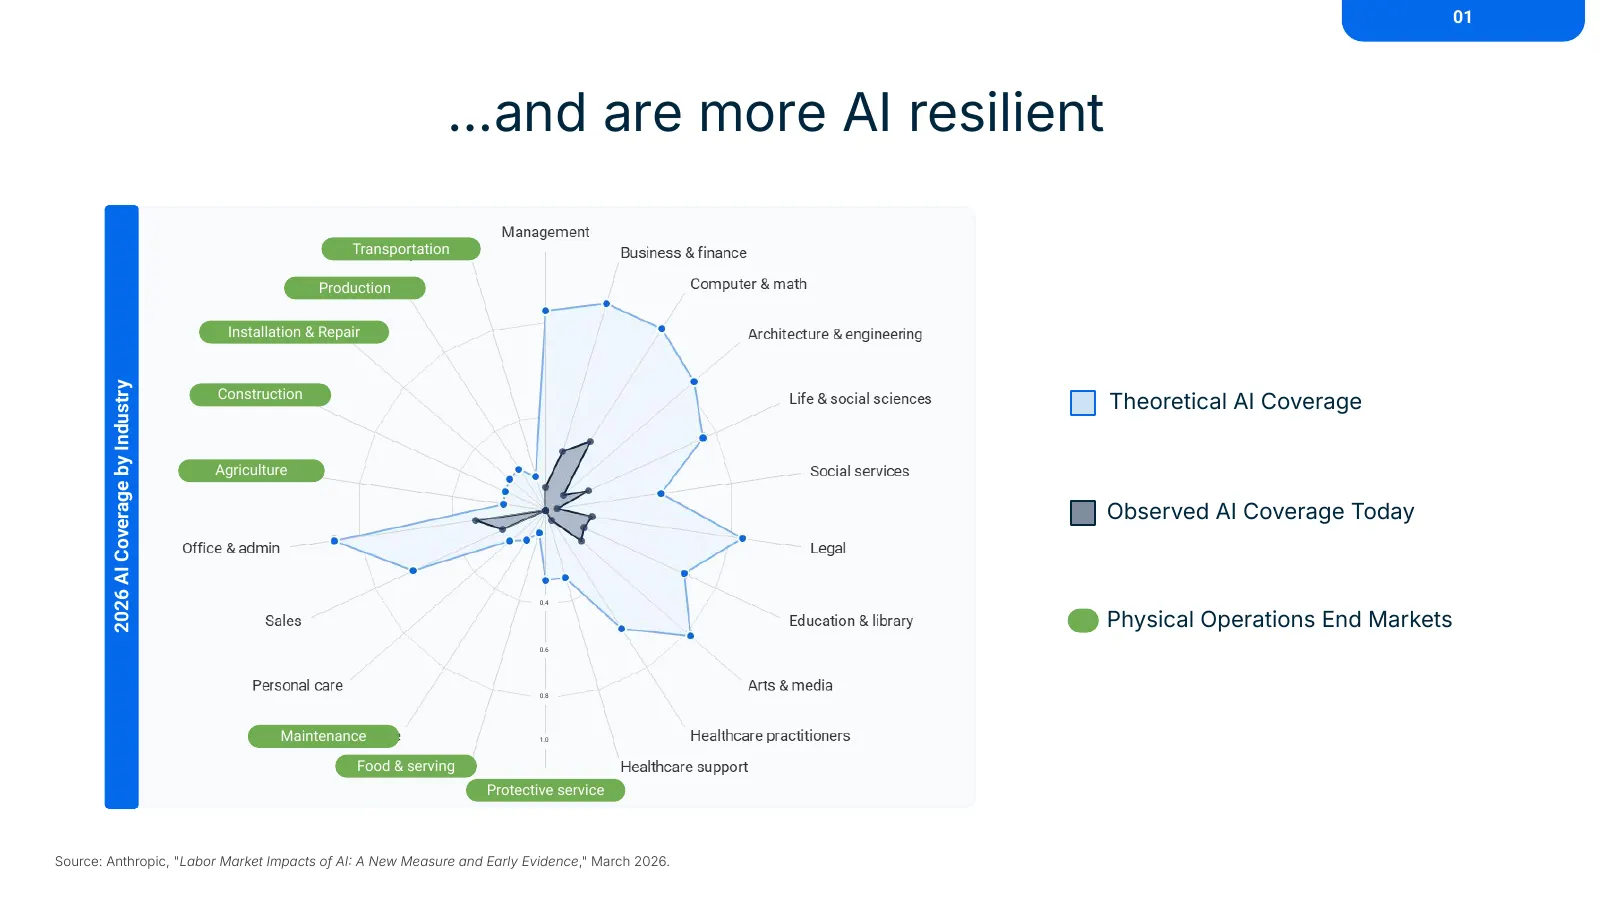
01 …and are more AI resilient Transportation Production Installation & Repair 2026 AI Coverage by Industry Construction Theoretical AI Coverage Agriculture Observed AI Coverage Today 0.4 Physical Operations End Markets 0.6 0.8 Maintenance 1.0 Food & serving Protective service Source: Anthropic, "Lab
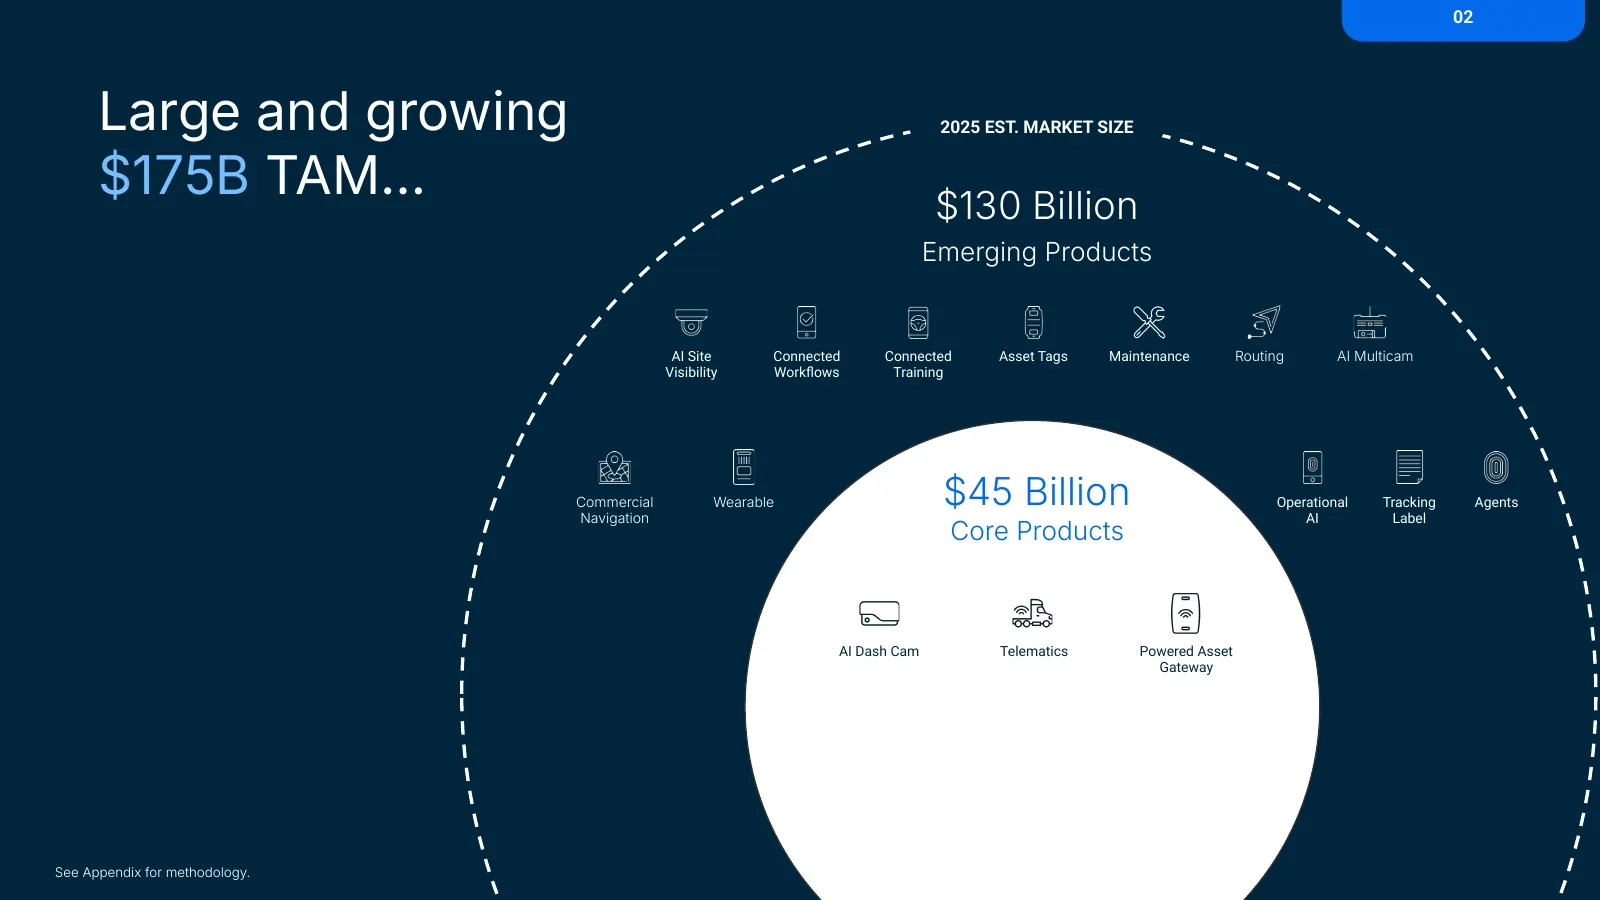
Slide 57: Large and growing $175B TAM…
02 Large and growing 2025 EST. MARKET SIZE $175B TAM… $130 Billion Emerging Products AI Site Connected Connected Asset Tags Maintenance Routing AI Multicam Visibility Workflows Training Commercial Navigation Wearable $45 Billion Operational AI Tracking Label Agents Core Products AI Dash Cam Telematic
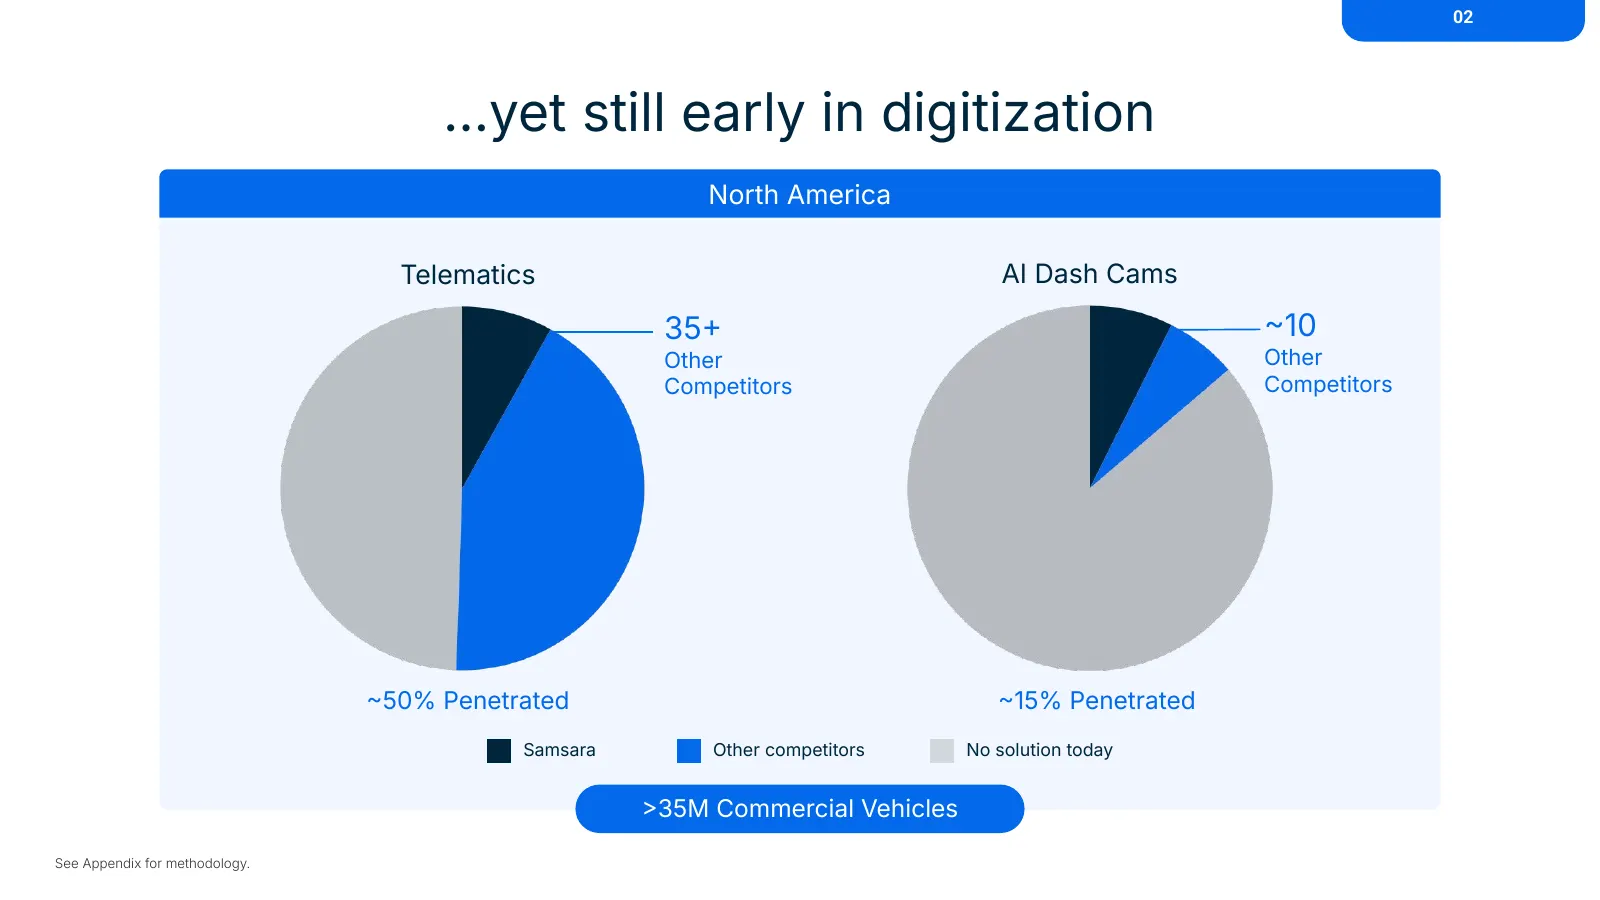
Slide 58: …yet still early in digitization
02 …yet still early in digitization North America Telematics AI Dash Cams 35 10 Other Other Competitors Competitors 50% Penetrated 15% Penetrated Samsara Other competitors No solution today 35M Commercial Vehicles See Appendix for methodology.
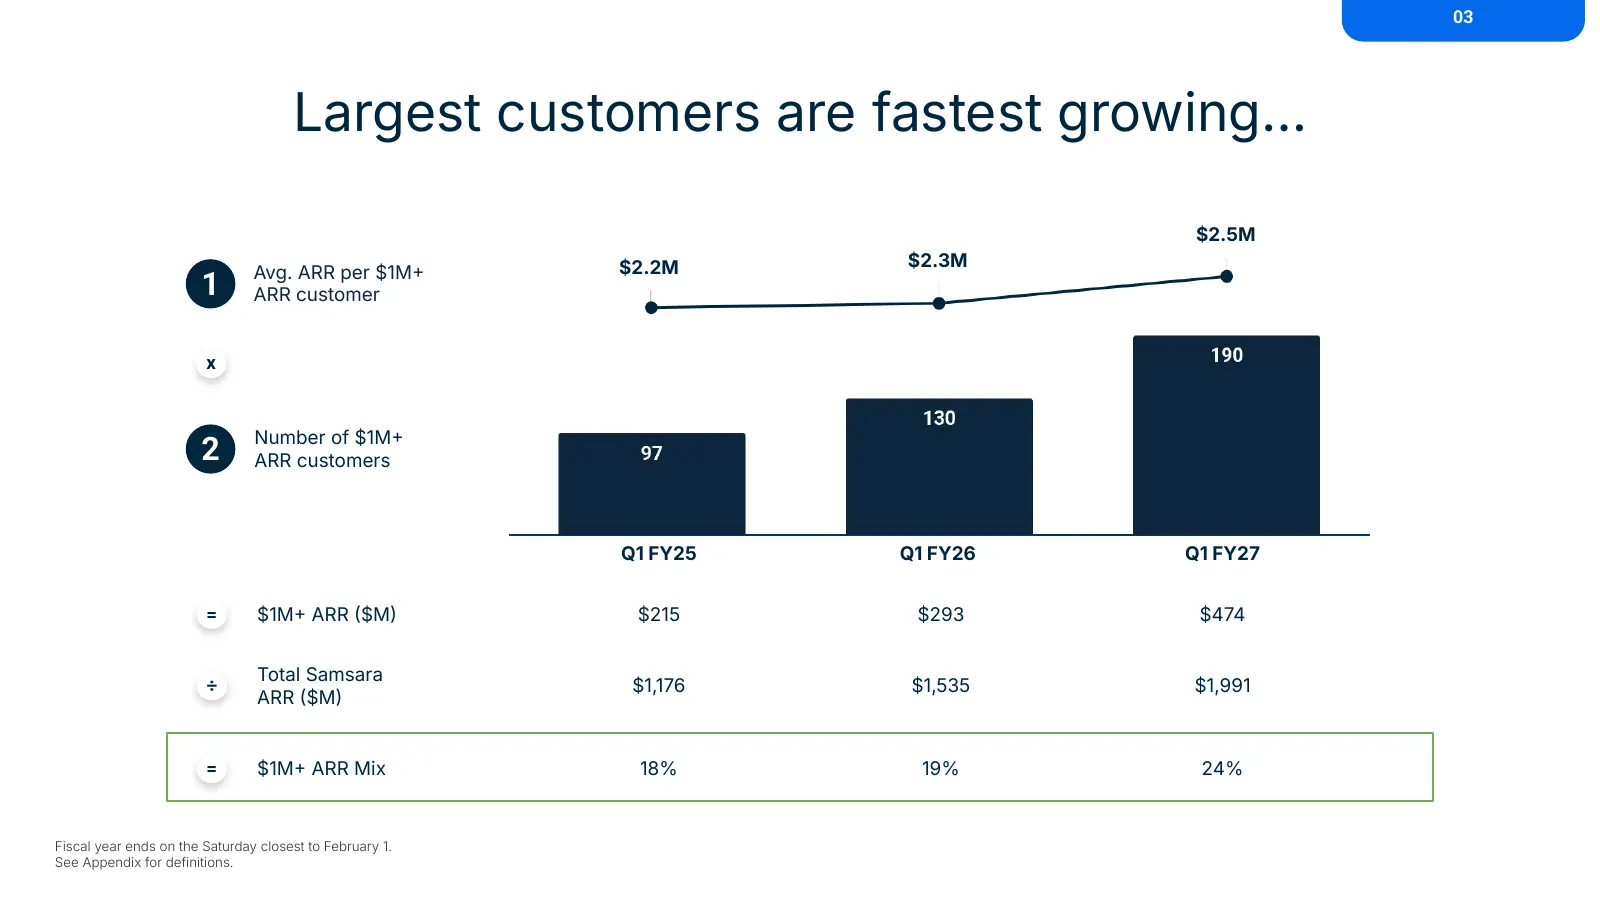
Slide 59: Largest customers are fastest growing…
03 Largest customers are fastest growing… $2.5M $2.2M $2.3M Avg. ARR per $1M 1 ARR customer x Number of $1M 2 ARR customers Q1 FY25 Q1 FY26 Q1 FY27 = $1M ARR $M $215 $293 $474 Total Samsara ÷ $1,176 $1,535 $1,991 ARR $M = $1M ARR Mix 18% 19% 24% Fiscal year ends on the Saturday closest to Fe
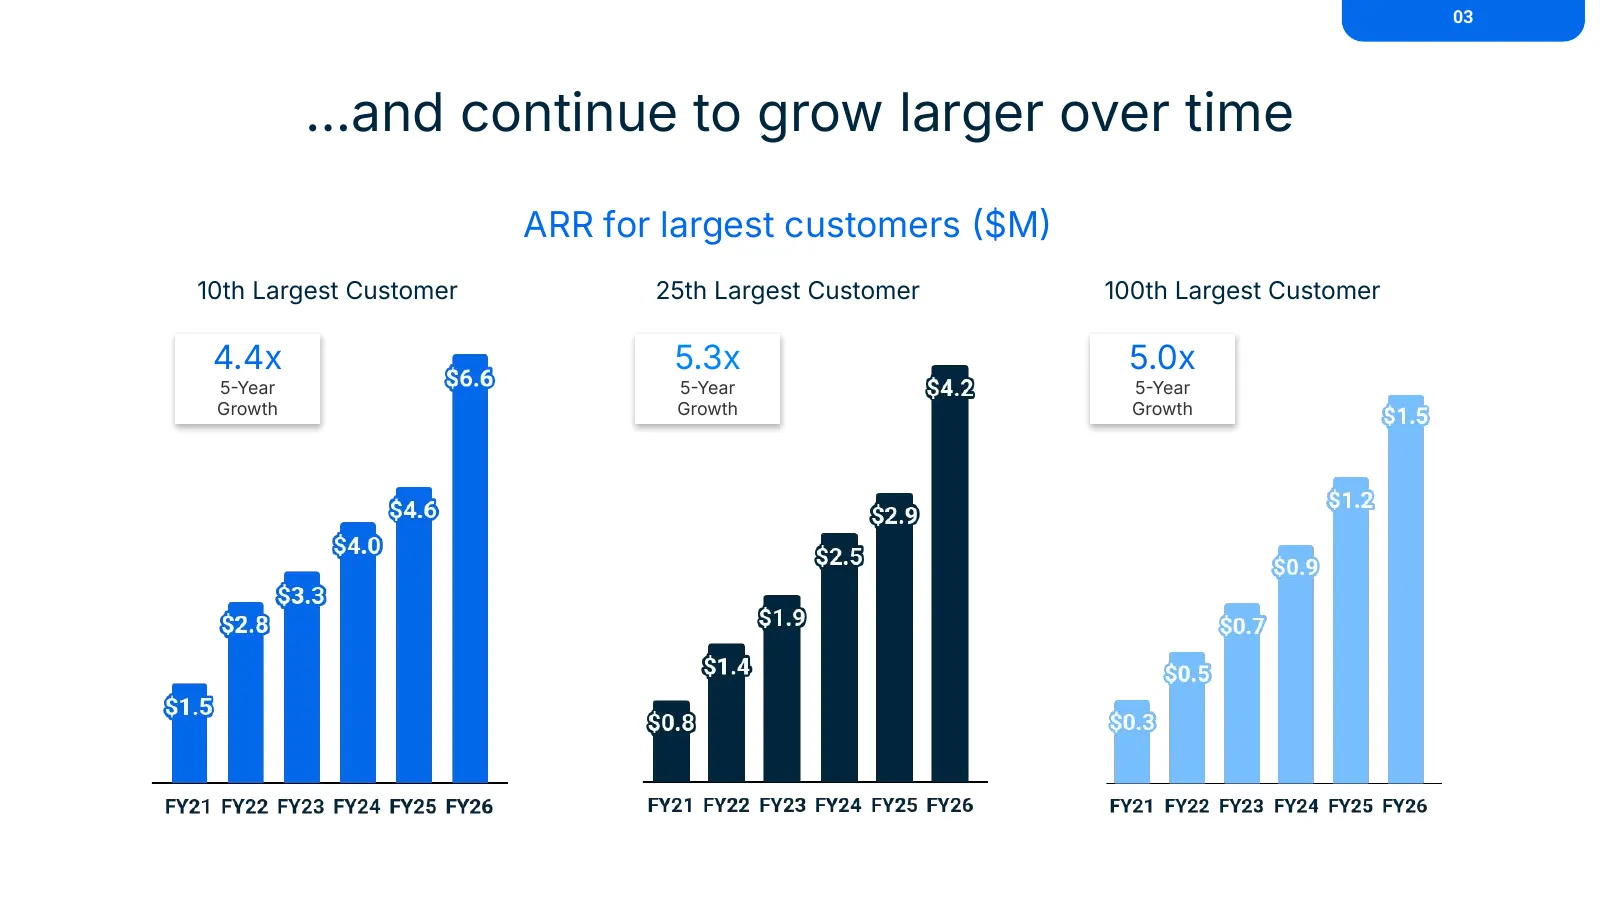
Slide 60: …and continue to grow larger over time
03 …and continue to grow larger over time ARR for largest customers $M 10th Largest Customer 25th Largest Customer 100th Largest Customer 4.4x 5.3x 5.0x 5Year 5Year 5Year Growth Growth Growth
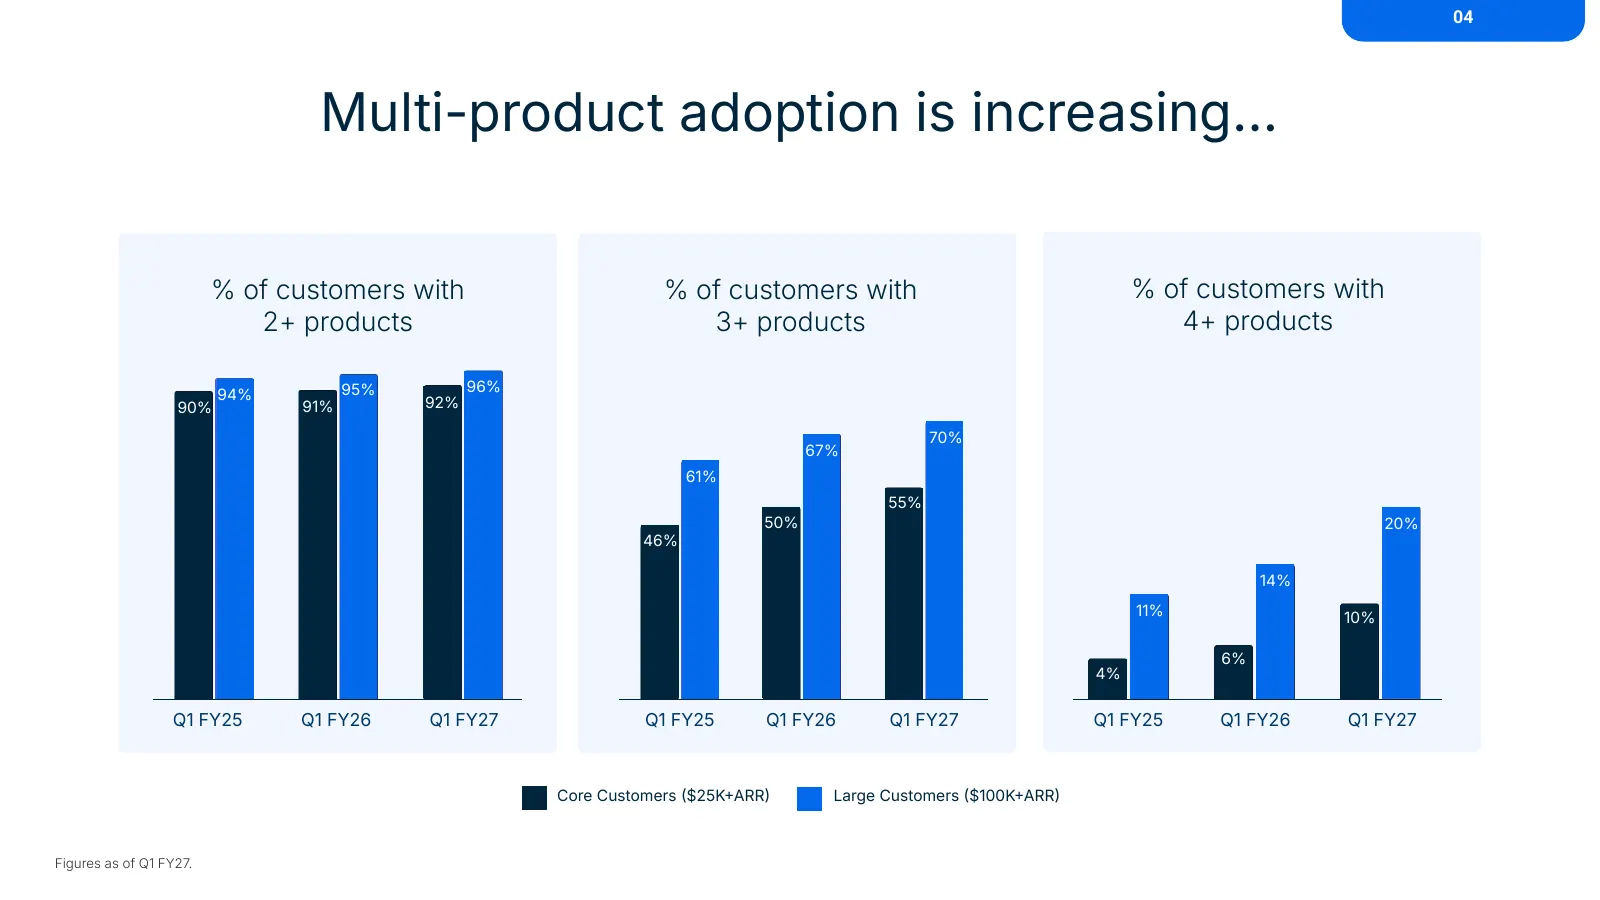
Slide 61: Multi-product adoption is increasing…
04 Multi-product adoption is increasing… % of customers with % of customers with % of customers with 2+ products 3+ products 4+ products 94% 95% 96% 90% 91% 92% 70% 67% 61% 55% 50% 20% 46% 14% 11% 10% 6% 4% Q1 FY25 Q1 FY26 Q1 FY27 Q1 FY25 Q1 FY26 Q1 FY27 Q1 FY25 Q1 FY26 Q1 FY27 Core Customers $25K
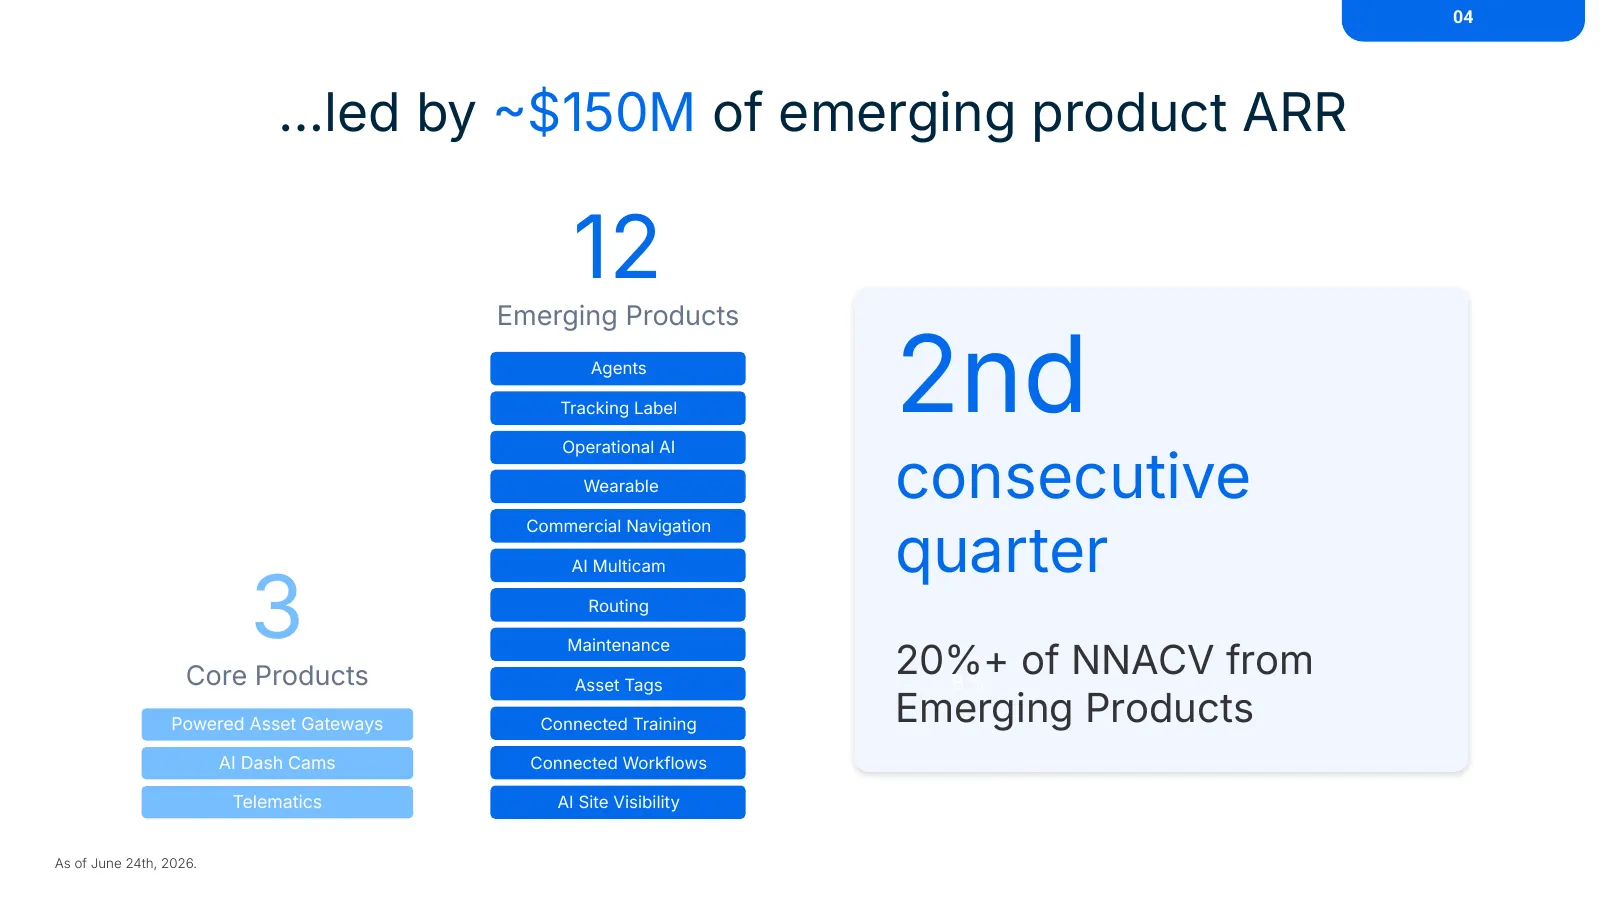
Slide 62: …led by $150M of emerging product ARR
04 …led by $150M of emerging product ARR 12 Emerging Products Agents Tracking Label Operational AI 2nd Wearable consecutive quarter Commercial Navigation 3 AI Multicam Routing Maintenance Core Products Asset Tags 20%+ 8% of NNACV from Powered Asset Gateways Connected Training Emerging Products AI D
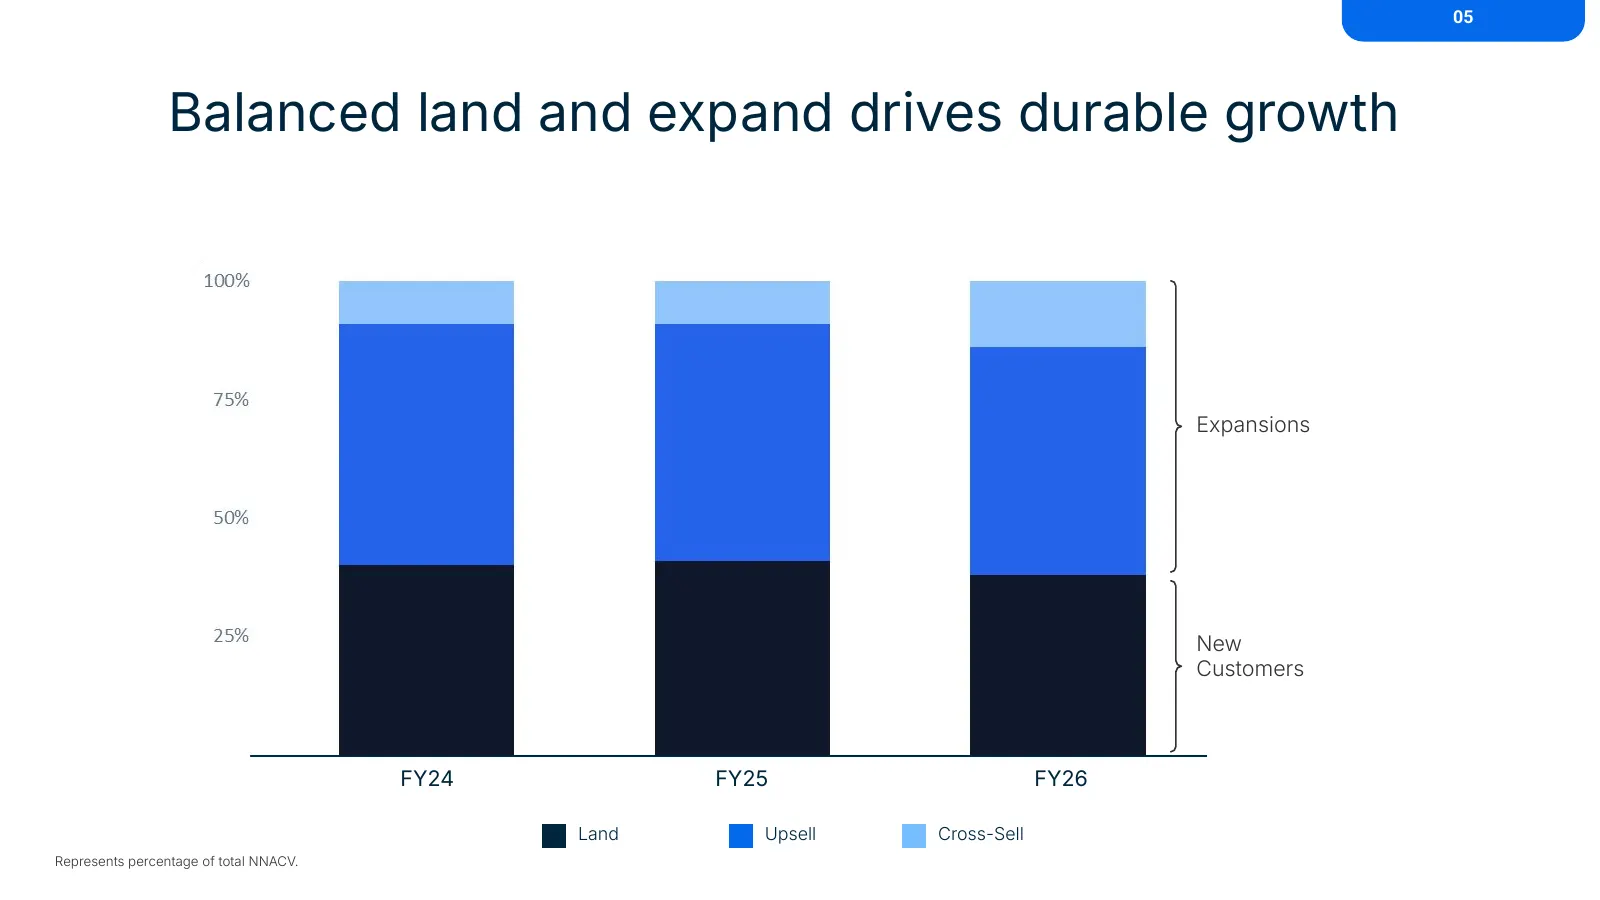
Slide 63: Balanced land and expand drives durable growth
05 Balanced land and expand drives durable growth Expansions New Customers FY24 FY25 FY26 Land Upsell Cross-Sell Represents percentage of total NNACV.
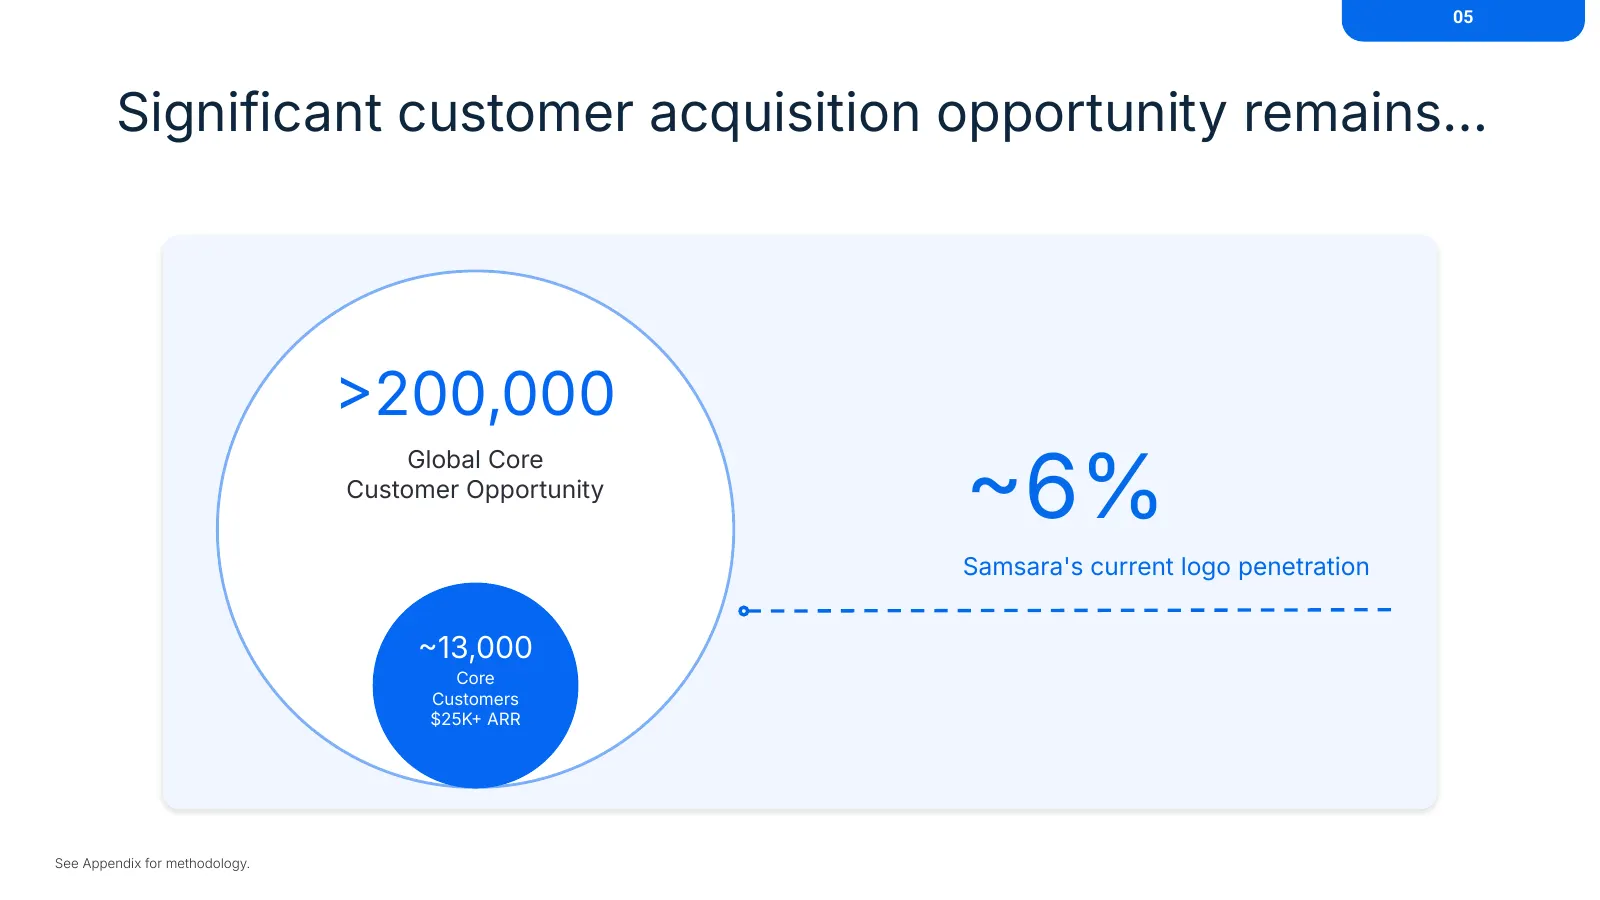
Slide 64: Significant customer acquisition opportunity remains…
05 Significant customer acquisition opportunity remains… 200,000 6% Global Core Customer Opportunity Samsara's current logo penetration 13,000 Core Customers $25K ARR See Appendix for methodology.
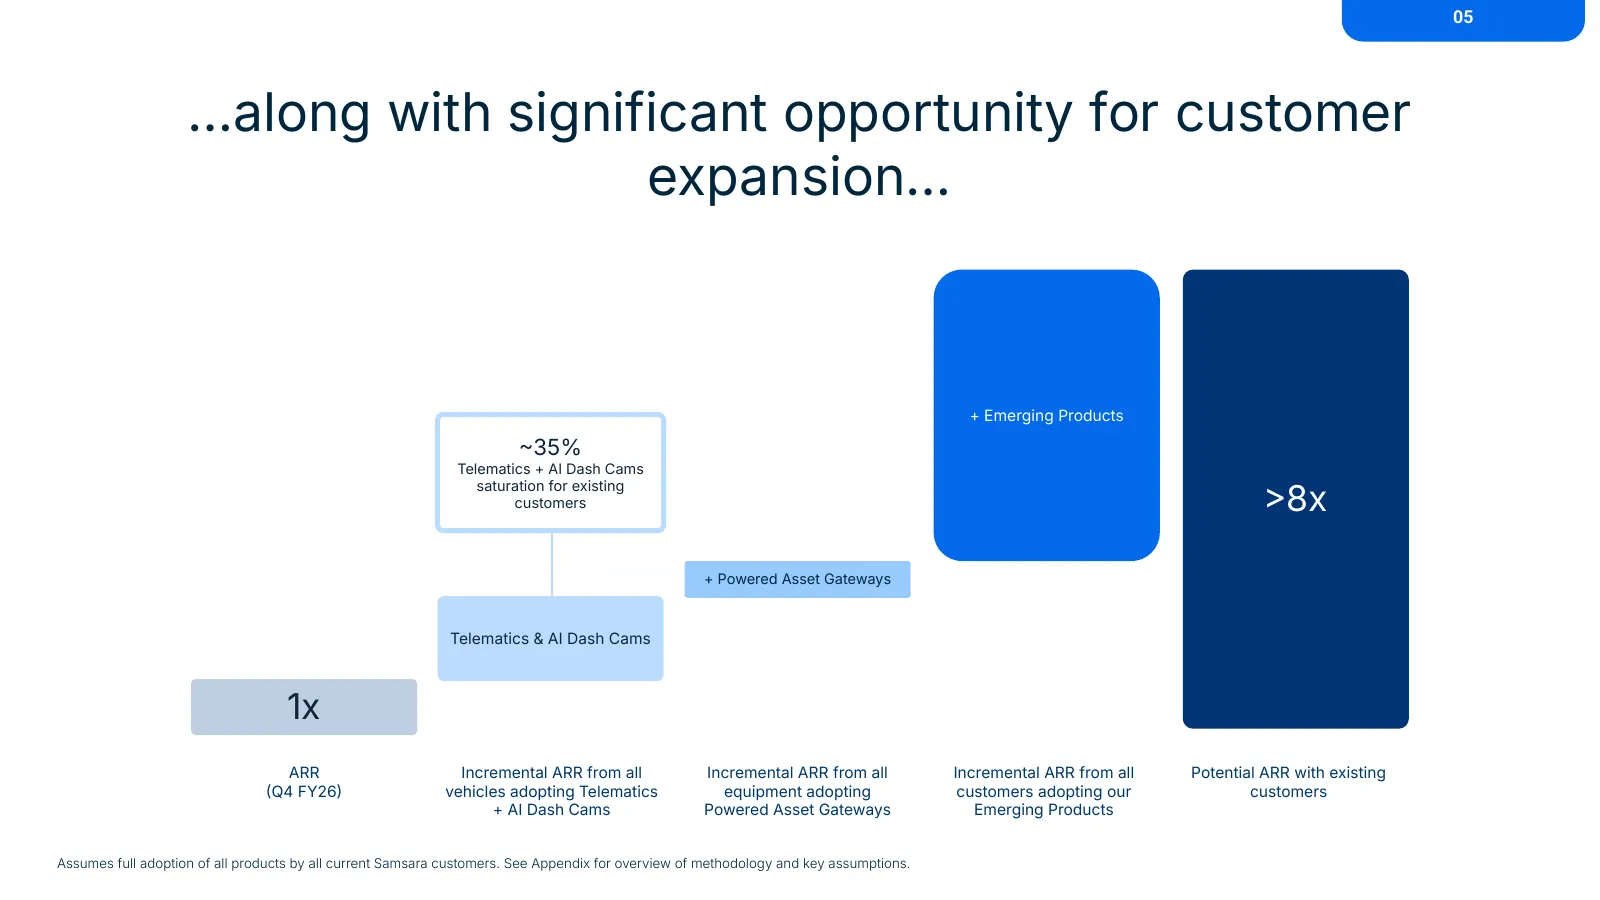
Slide 65: …along with significant opportunity for customer expansion…
05 …along with significant opportunity for customer expansion… + Emerging Products 35% Telematics + AI Dash Cams 8x saturation for existing customers + Powered Asset Gateways Telematics & AI Dash Cams 1x ARR Incremental ARR from all Incremental ARR from all Incremental ARR from all Potential ARR w
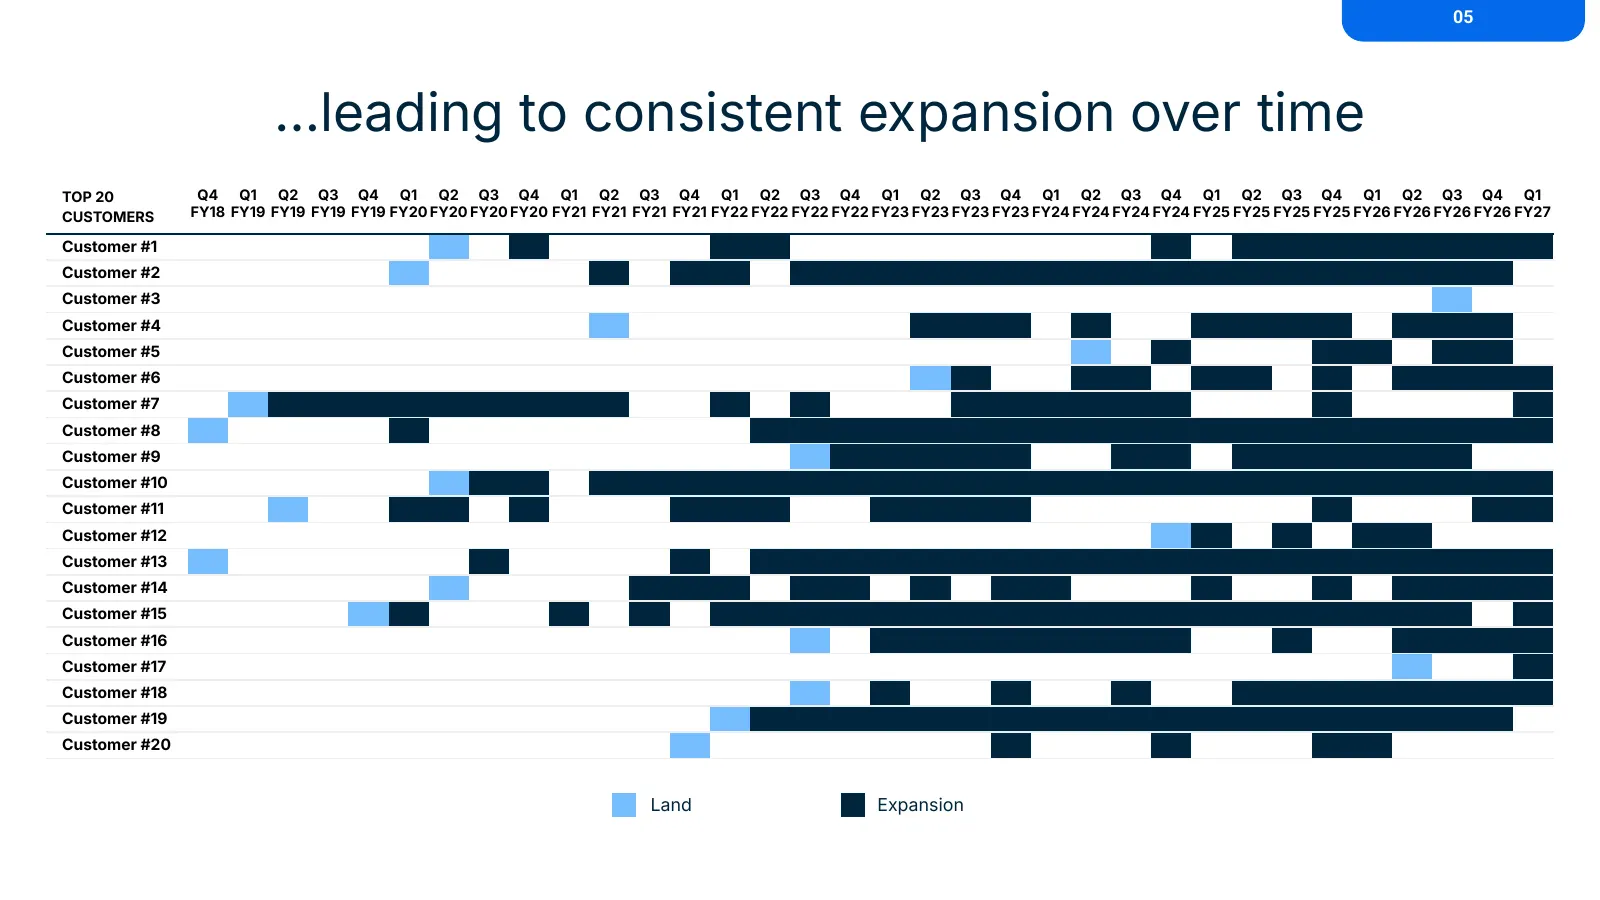
Slide 66: …leading to consistent expansion over time
05 …leading to consistent expansion over time TOP 20 Q4 Q1 Q2 Q3 Q4 Q1 Q2 Q3 Q4 Q1 Q2 Q3 Q4 Q1 Q2 Q3 Q4 Q1 Q2 Q3 Q4 Q1 Q2 Q3 Q4 Q1 Q2 Q3 Q4 Q1 Q2 Q3 Q4 Q1 CUSTOMERS FY18 FY19 FY19 FY19 FY19 FY20 FY20 FY20 FY20 FY21 FY21 FY21 FY21 FY22 FY22 FY22 FY22 FY23 FY23 FY23 FY23 FY24 FY24 FY24 FY24 FY25 FY25
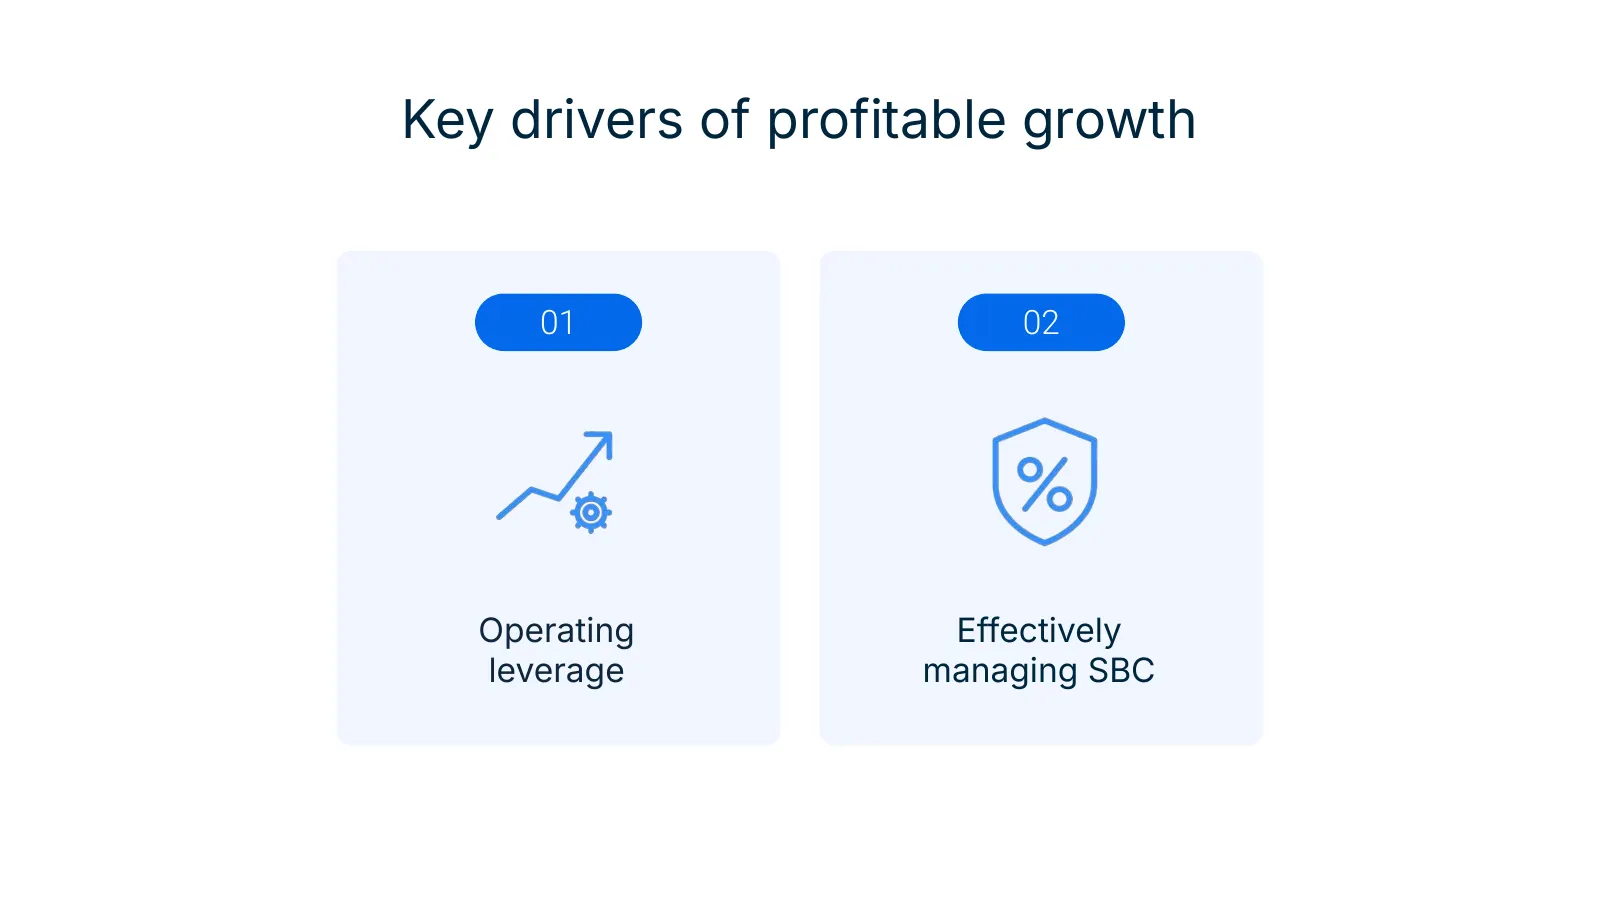
Slide 67: Key drivers of profitable growth
Key drivers of profitable growth 01 02 Operating Effectively leverage managing SBC
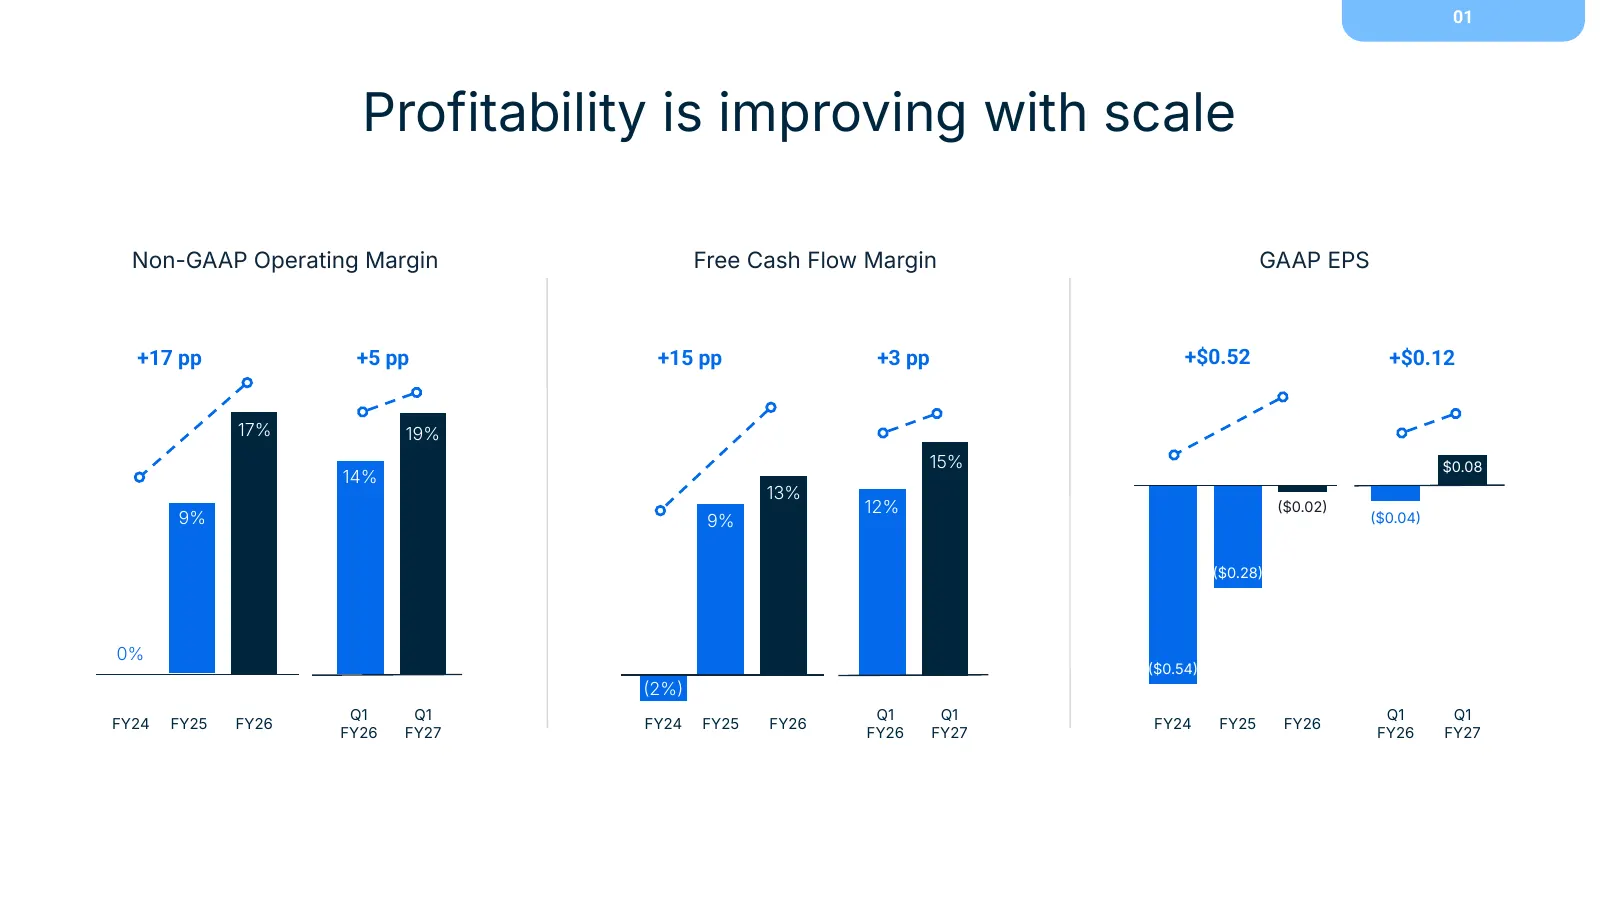
Slide 68: Profitability is improving with scale
01 Profitability is improving with scale Non-GAAP Operating Margin Free Cash Flow Margin GAAP EPS +17 pp +5 pp +15 pp +3 pp +$0.52 +$0.12 17% 19% 15% $0.08 14% 13% 12% $0.02 9% 9% $0.04 $0.28 0% $0.54 2% Q1 Q1 Q1 Q1 Q1 Q1 FY24 FY25 FY26 FY24 FY25 FY26 FY24 FY25 FY26 FY26 FY27 FY26 FY27 FY2
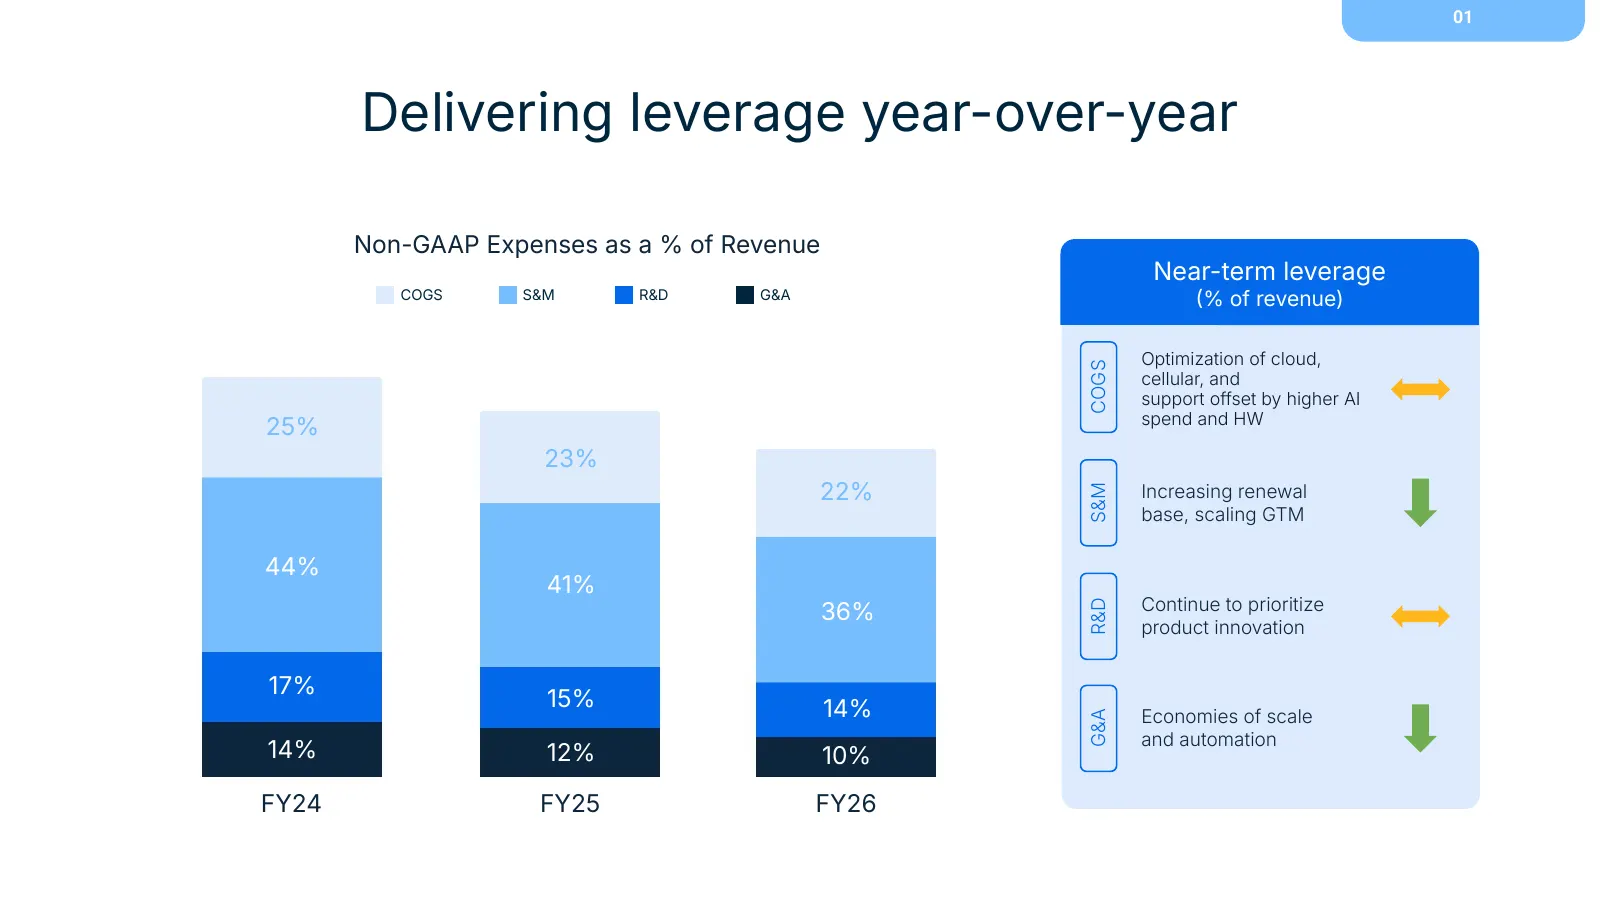
Slide 69: Delivering leverage year-over-year
01 Delivering leverage year-over-year Non-GAAP Expenses as a % of Revenue Near-term leverage COGS S&M R&D G&A % of revenue) Optimization of cloud, COGS cellular, and support offset by higher AI spend and HW 25% 23% 22% Increasing renewal S&M base, scaling GTM 44% 41% 36% Continue to prioritize R&D
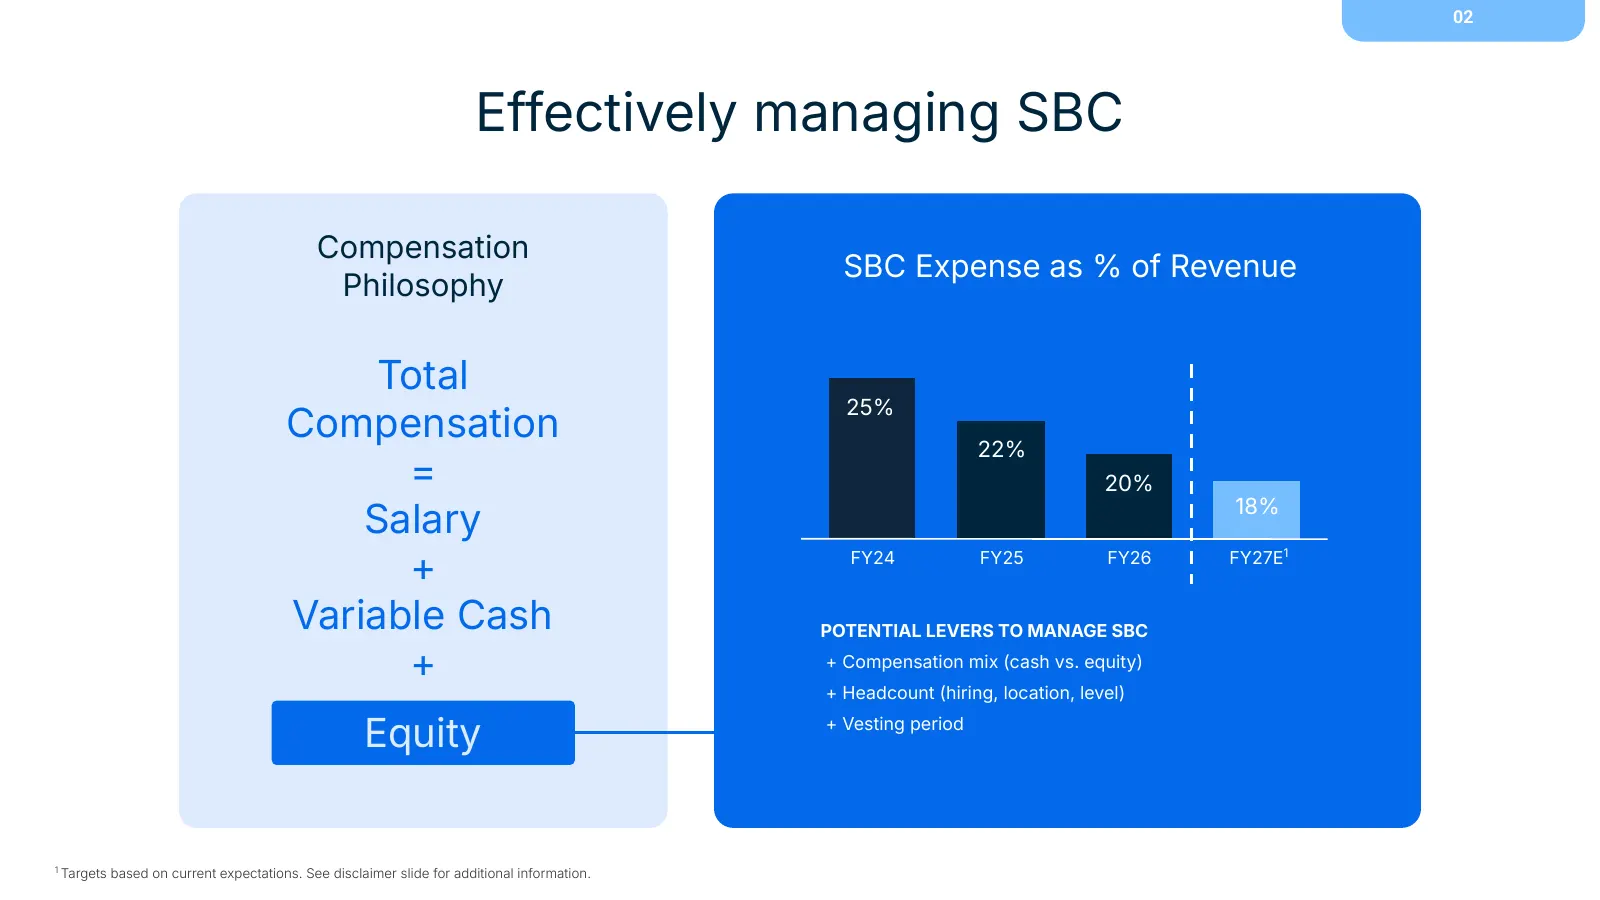
Slide 70: Effectively managing SBC
02 Effectively managing SBC Compensation SBC Expense as % of Revenue Philosophy Total 25% Compensation 22% = 20% 18% Salary + FY24 FY25 FY26 FY27E1 Variable Cash POTENTIAL LEVERS TO MANAGE SBC + + Compensation mix (cash vs. equity) + Headcount (hiring, location, level) Equity + Vesting period 1 Targ
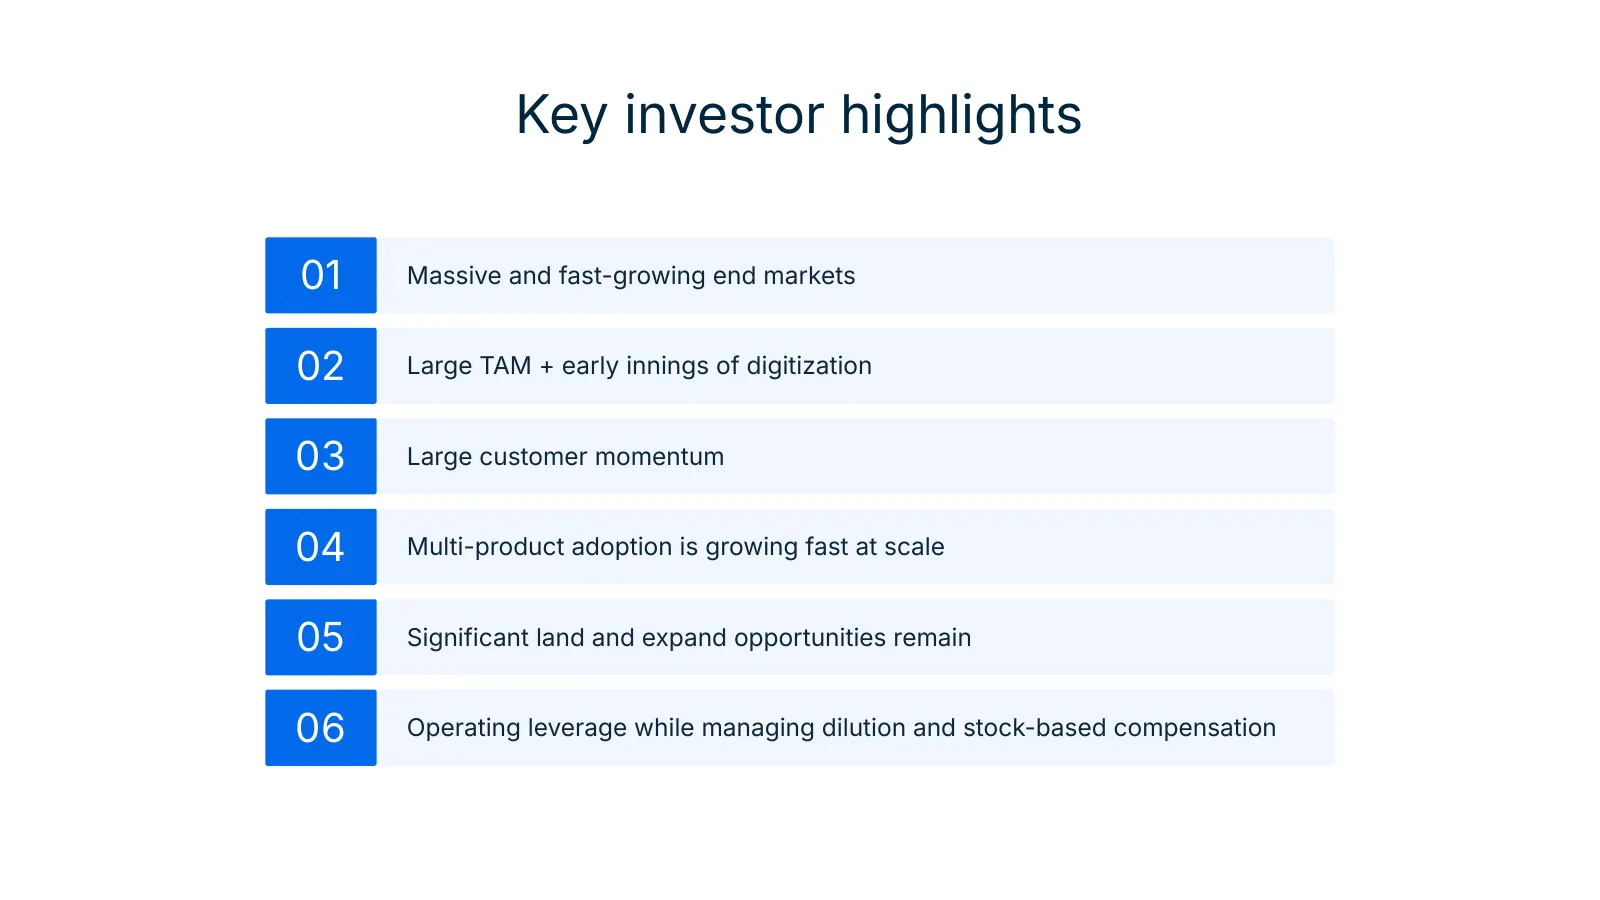
Slide 71: Key investor highlights
Key investor highlights 01 Massive and fast-growing end markets 02 Large TAM + early innings of digitization 03 Large customer momentum 04 Multi-product adoption is growing fast at scale 05 Significant land and expand opportunities remain 06 Operating leverage while managing dilution and stock-based
Slide 72: Appendix
Appendix
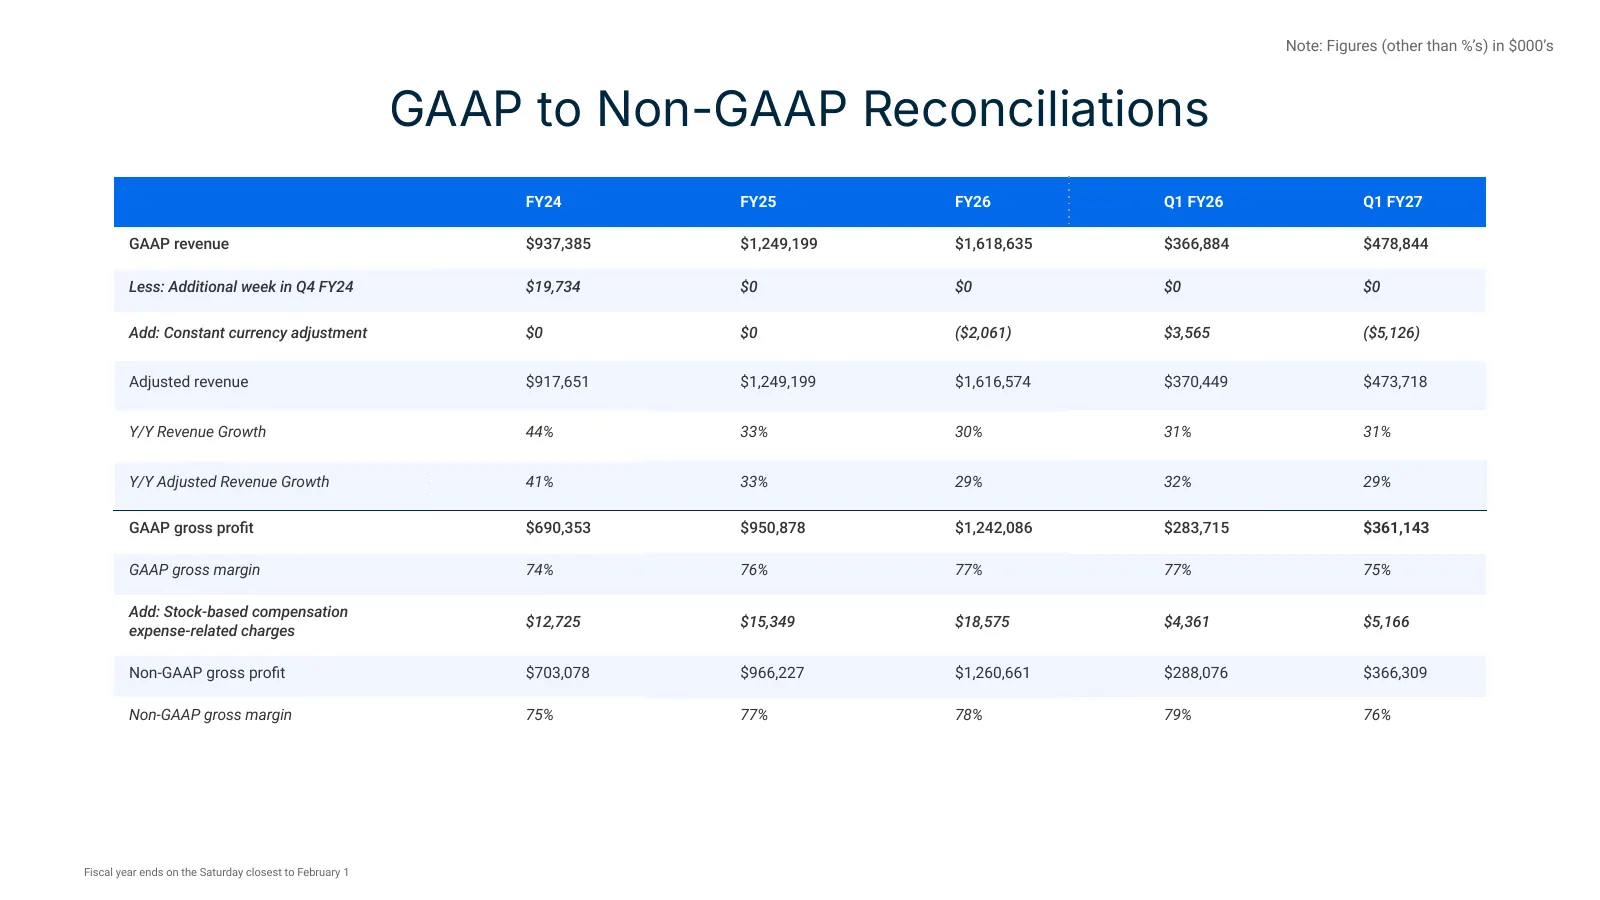
Slide 73: GAAP to Non-GAAP Reconciliations
Note: Figures (other than %’s) in $000’s GAAP to Non-GAAP Reconciliations FY24 FY25 FY26 Q1 FY26 Q1 FY27 GAAP revenue $937,385 $1,249,199 $1,618,635 $366,884 $478,844 Less: Additional week in Q4 FY24 $19,734 $0 $0 $0 $0 Add: Constant currency adjustment $0 $0 ($2,061) $3,565 ($5,126) Adjusted revenu
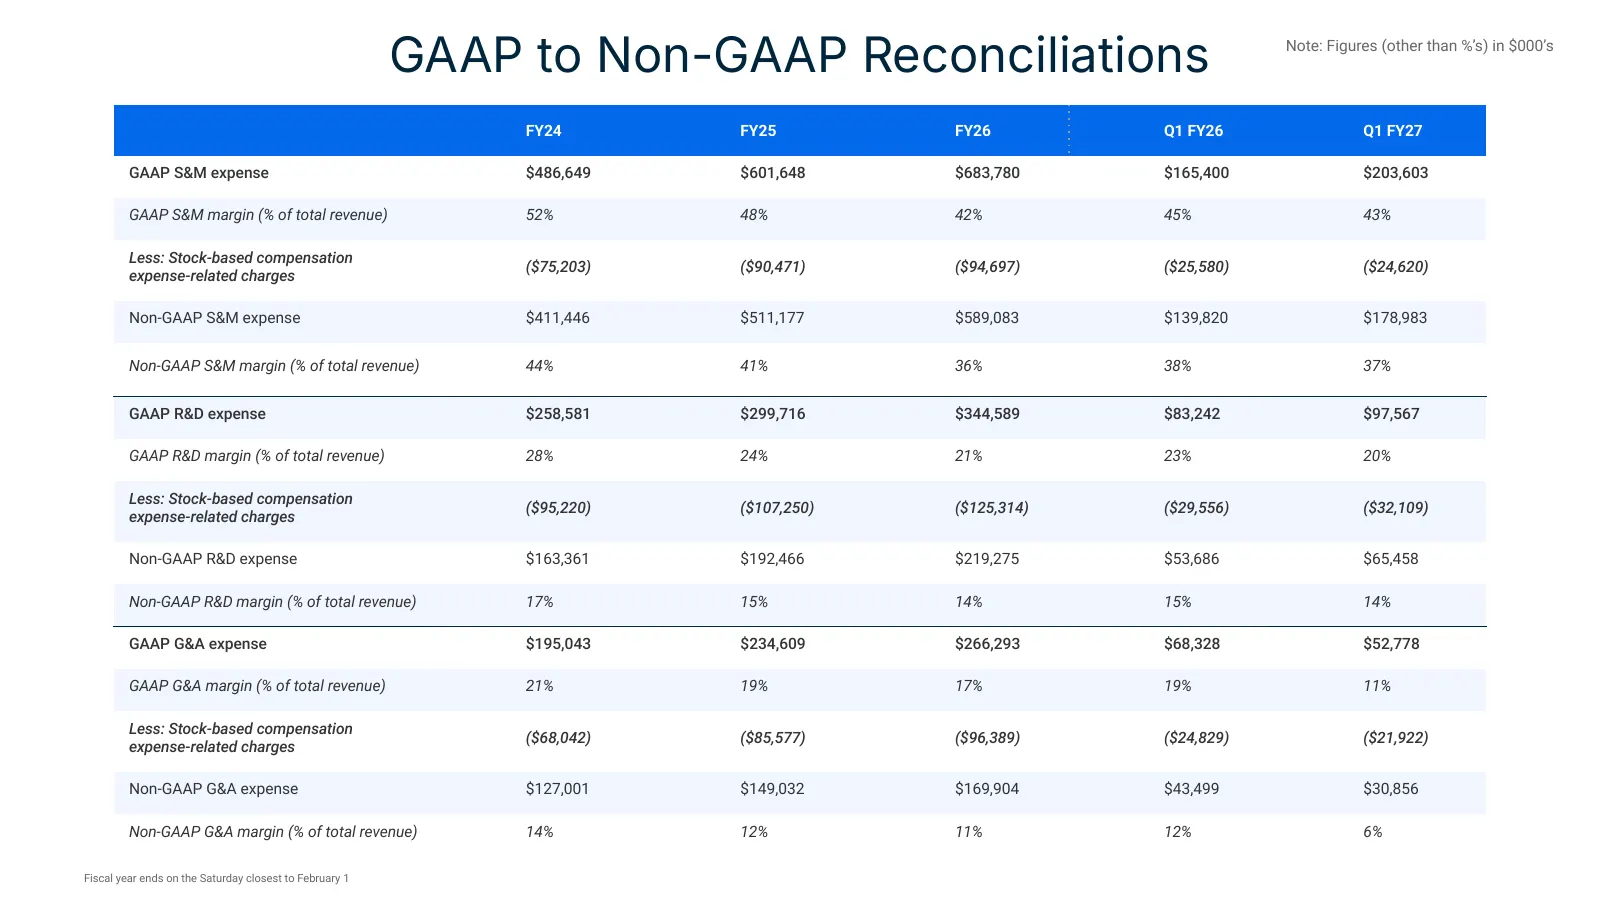
Slide 74: GAAP to Non-GAAP Reconciliations
GAAP to Non-GAAP Reconciliations Note: Figures (other than %’s) in $000’s FY24 FY25 FY26 Q1 FY26 Q1 FY27 GAAP S&M expense $486,649 $601,648 $683,780 $165,400 $203,603 GAAP S&M margin (% of total revenue) 52% 48% 42% 45% 43% Less: Stock-based compensation ($75,203) ($90,471) ($94,697) ($25,580) ($24,
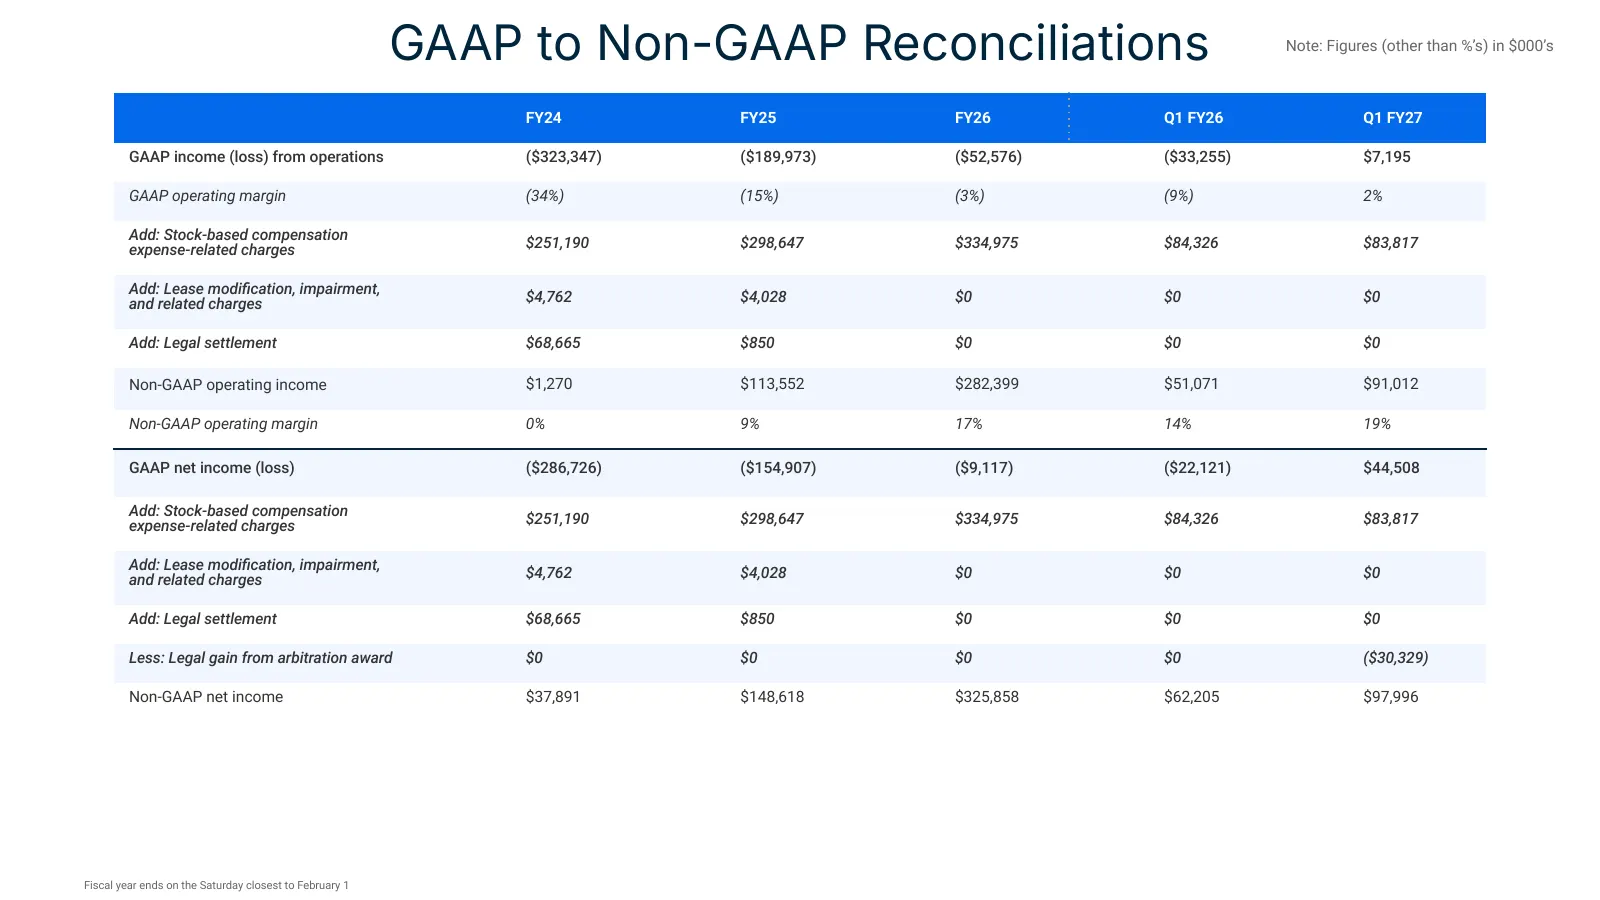
Slide 75: GAAP to Non-GAAP Reconciliations
GAAP to Non-GAAP Reconciliations Note: Figures (other than %’s) in $000’s FY24 FY25 FY26 Q1 FY26 Q1 FY27 GAAP income (loss) from operations ($323,347) ($189,973) ($52,576) ($33,255) $7,195 GAAP operating margin (34%) (15%) (3%) (9%) 2% Add: Stock-based compensation $251,190 $298,647 $334,975 $84,326
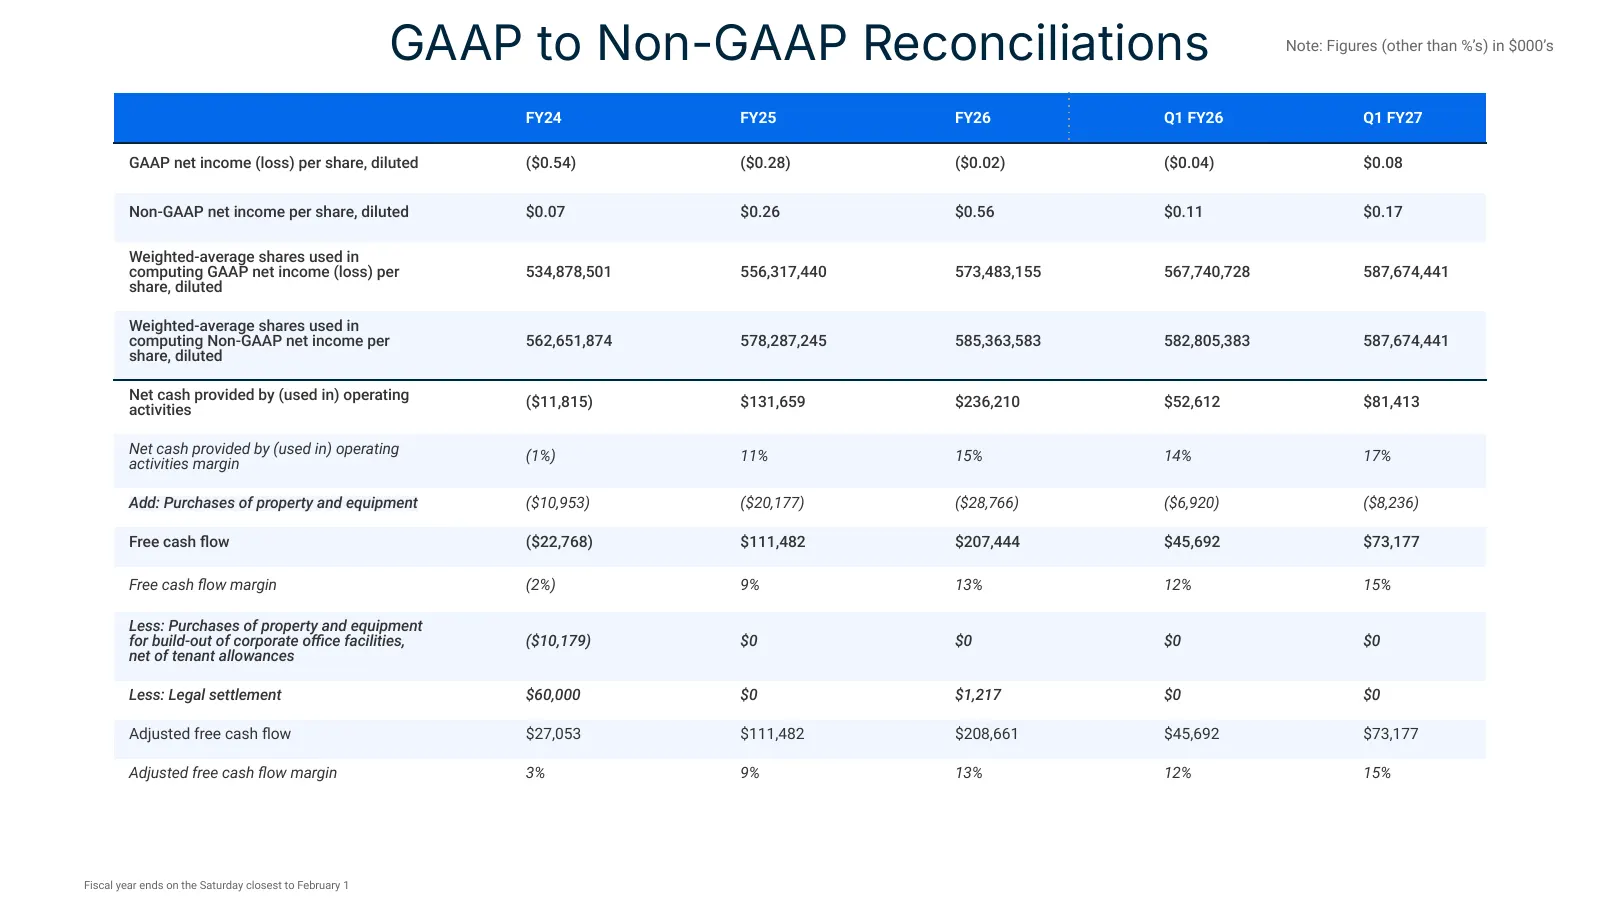
Slide 76: GAAP to Non-GAAP Reconciliations
GAAP to Non-GAAP Reconciliations Note: Figures (other than %’s) in $000’s FY24 FY25 FY26 Q1 FY26 Q1 FY27 GAAP net income (loss) per share, diluted ($0.54) ($0.28) ($0.02) ($0.04) $0.08 Non-GAAP net income per share, diluted $0.07 $0.26 $0.56 $0.11 $0.17 Weighted-average shares used in computing GAAP
Slide 77: Definitions / Methodology
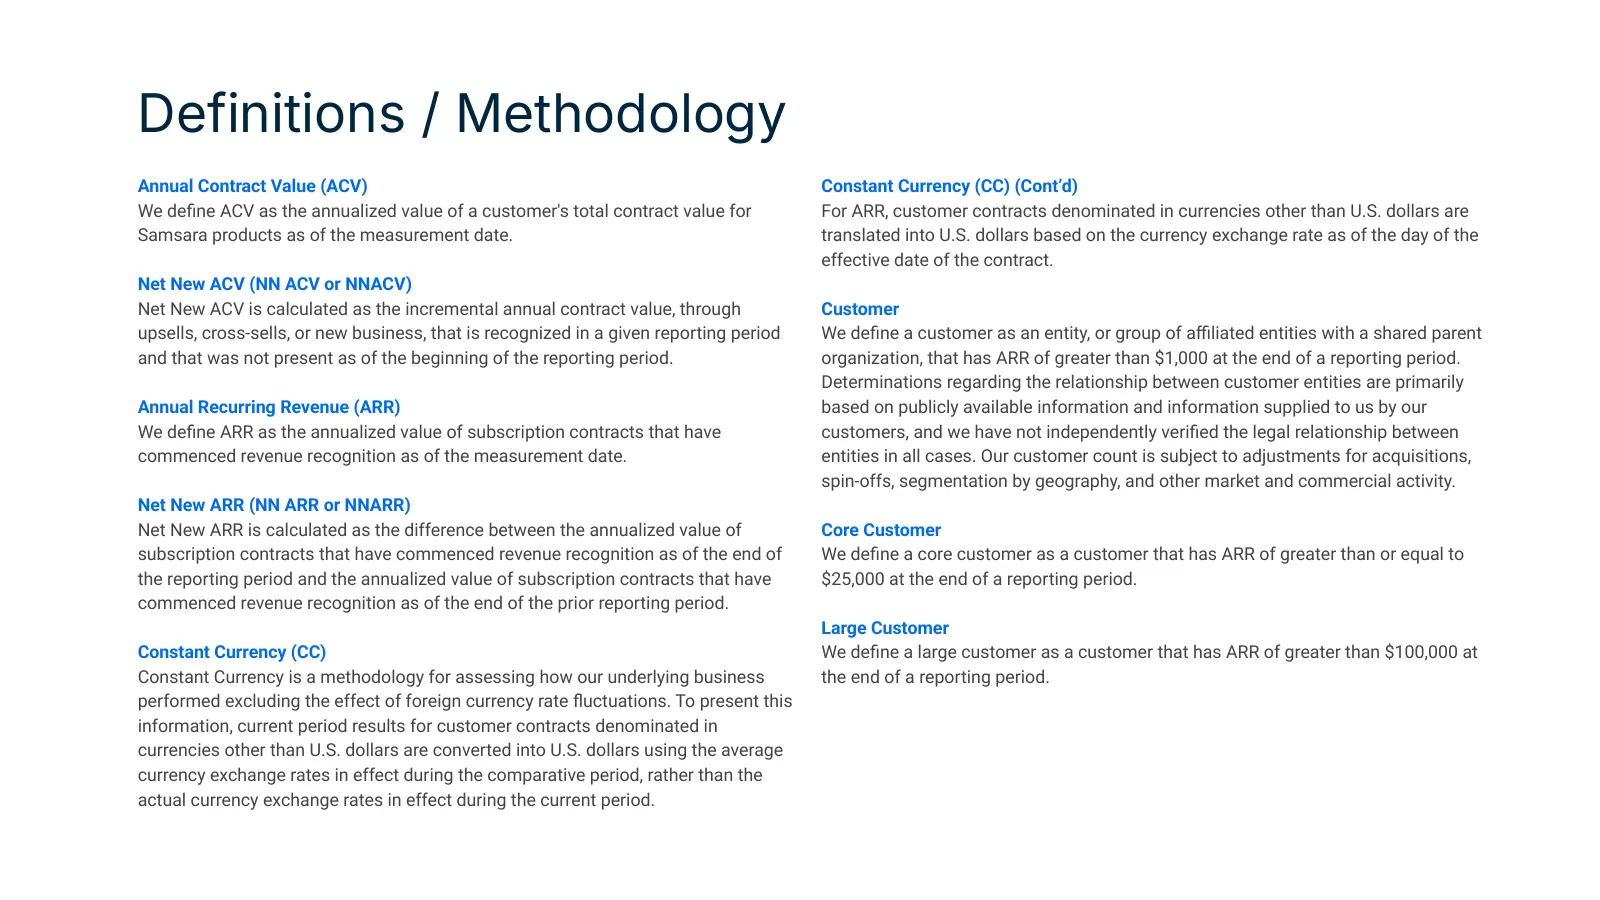
Definitions / Methodology Annual Contract Value (ACV) Constant Currency (CC) (Cont’d) We define ACV as the annualized value of a customer's total contract value for For ARR, customer contracts denominated in currencies other than U.S. dollars are Samsara products as of the measurement date. translate
Slide 78: Definitions / Methodology Cont'd
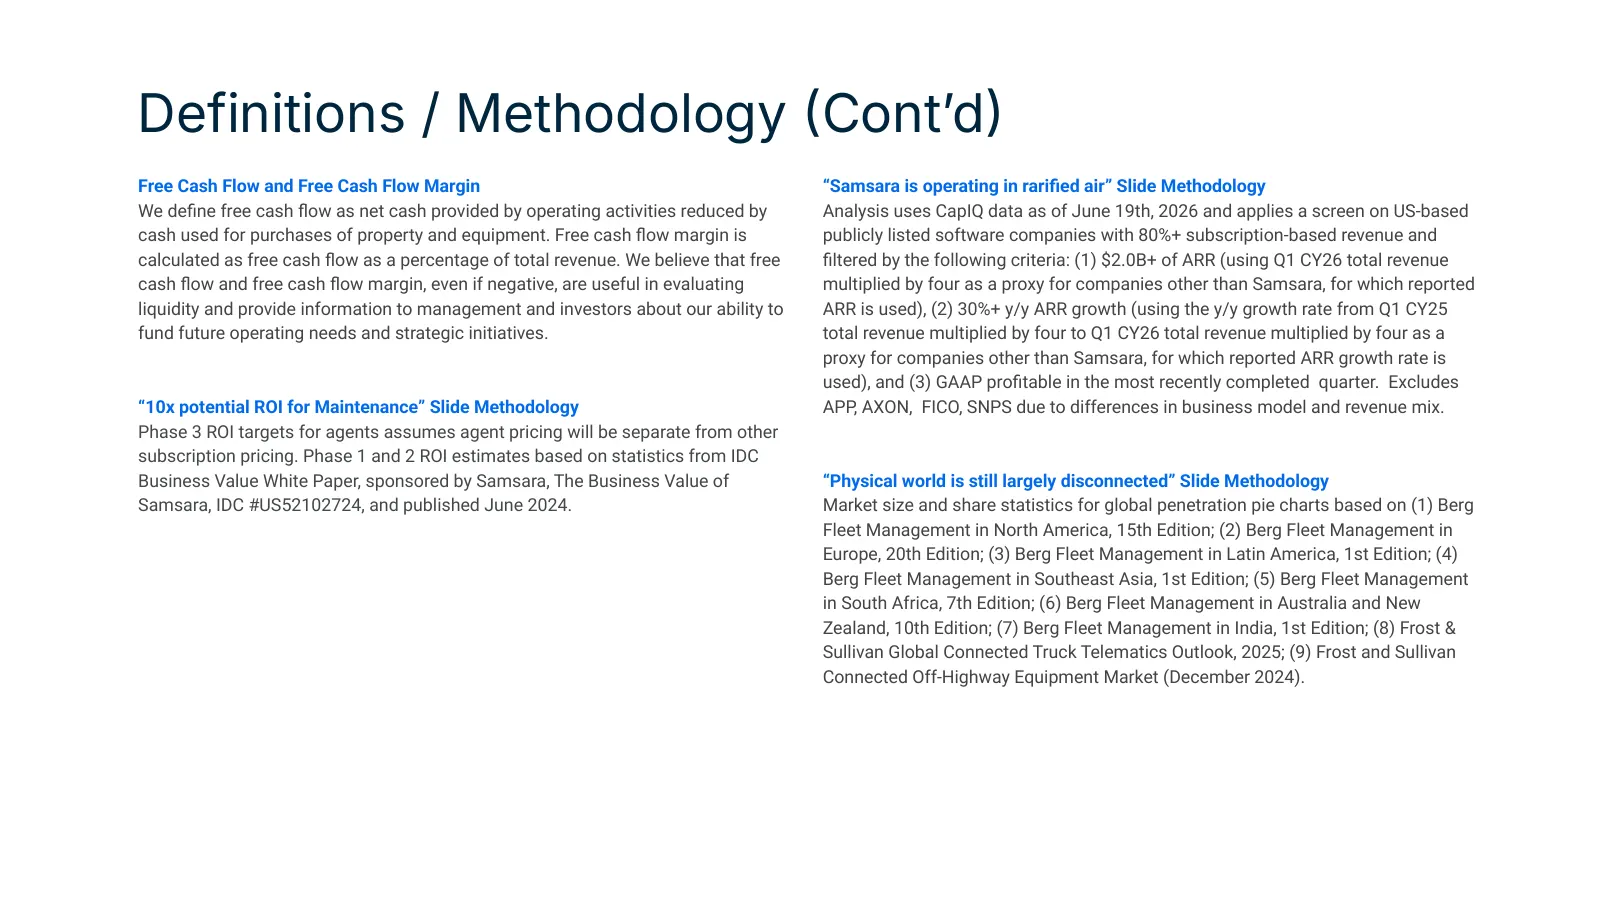
Definitions / Methodology Contʼd Free Cash Flow and Free Cash Flow Margin “Samsara is operating in rarified air” Slide Methodology We define free cash flow as net cash provided by operating activities reduced by Analysis uses CapIQ data as of June 19th, 2026 and applies a screen on US-based cash used
Slide 79: Definitions / Methodology Cont'd
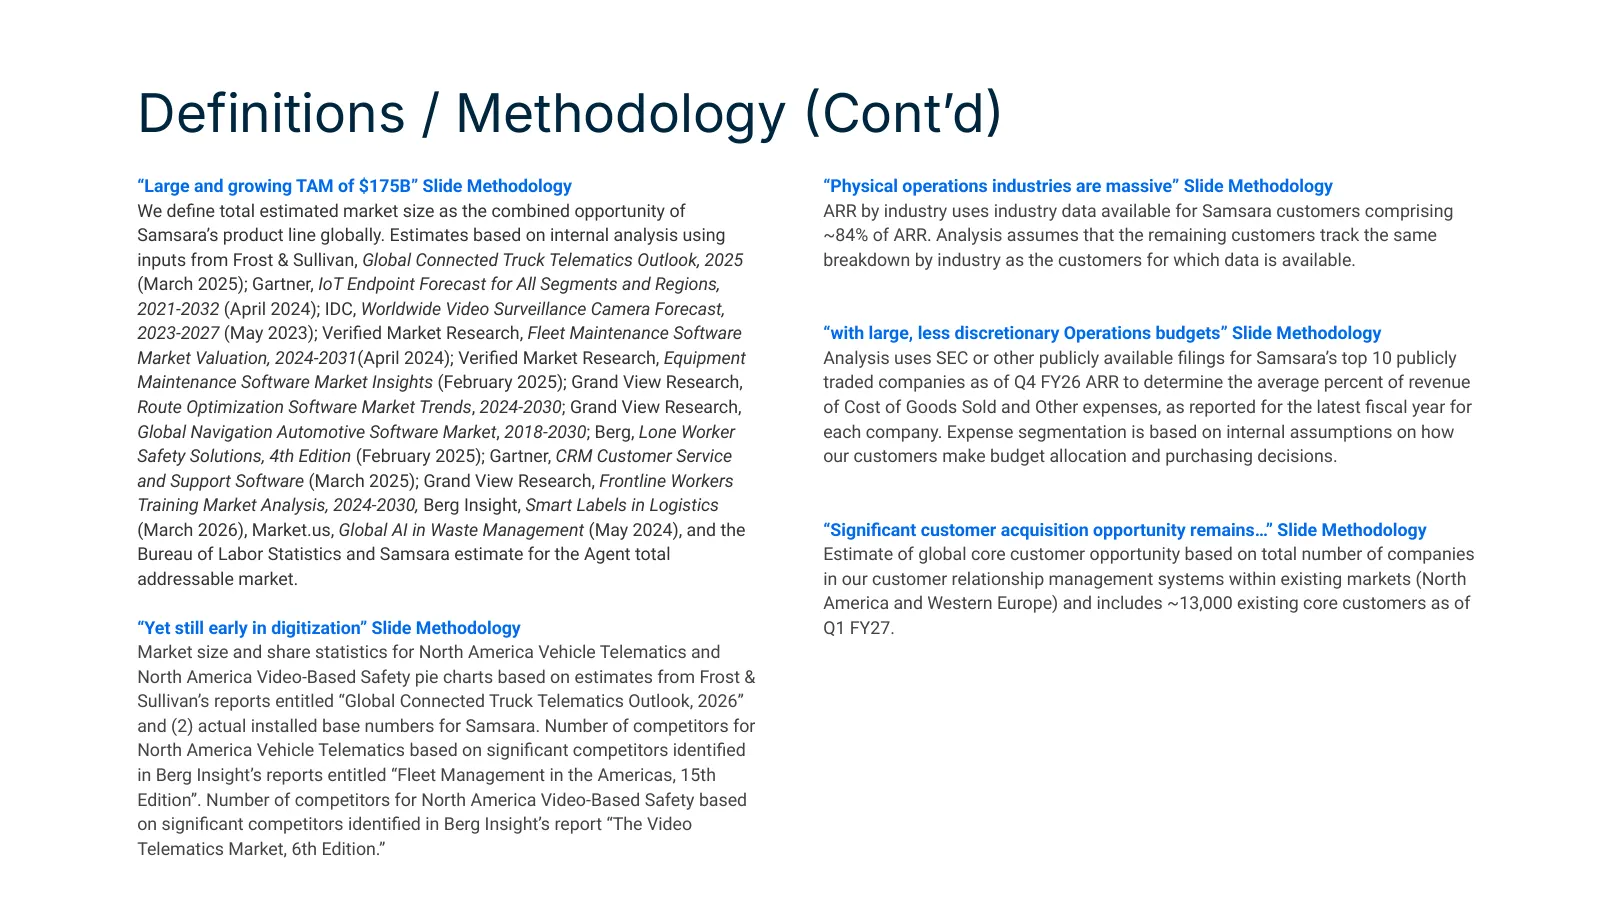
Definitions / Methodology Contʼd “Large and growing TAM of $175B” Slide Methodology “Physical operations industries are massive” Slide Methodology We define total estimated market size as the combined opportunity of ARR by industry uses industry data available for Samsara customers comprising Samsa
Slide 80: Definitions / Methodology Cont'd
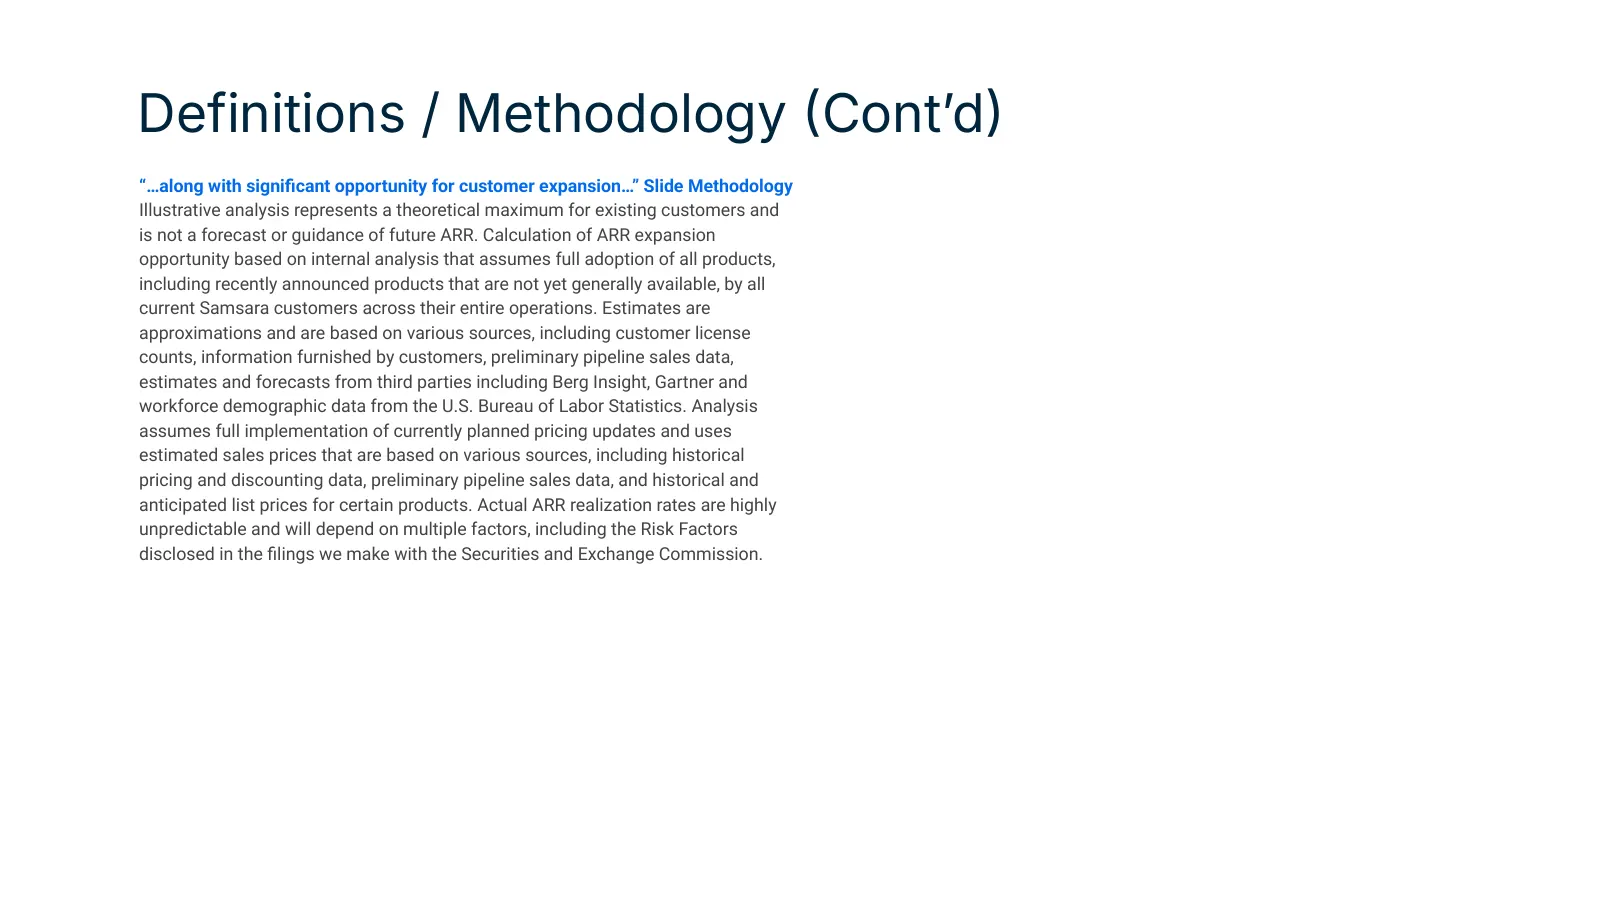
Definitions / Methodology Contʼd “…along with significant opportunity for customer expansion…” Slide Methodology Illustrative analysis represents a theoretical maximum for existing customers and is not a forecast or guidance of future ARR. Calculation of ARR expansion opportunity based on internal
Source: company website
More decks from Samsara Inc.
 Q2 2027 Earnings Presentation32 slides · Sep 3, 2026
 Q1 FY27 Earnings Presentation32 slides · Jun 4, 2026
 Q4 FY26 Earnings Presentation33 slides · Mar 5, 2026
 Q3 FY26 Earnings Presentation29 slides · Dec 4, 2025
 Q2 2026 Earnings Presentation27 slides · Sep 4, 2025
 Investor Day (June 2025)75 slides · Jun 24, 2025