Cirrus Logic, Inc. · NASDAQ:CRUS
Cirrus Logic — Investor Presentation (February 2021)
26 slides from Cirrus Logic's investor presentation, Feb 1, 2021

Slide 1: Investor Relations Update
Investor Relations Update As of February 1, 2021
Slide 2: Safe Harbor Statement
Safe Harbor Statement Except for historical information contained herein, the matters set forth in this presentation contain forward-looking statements, including industry market projections; our revenue growth opportunities; our ability to grow the percent revenue derived from high-performance mixe
Slide 3: Cirrus Logic at a Glance
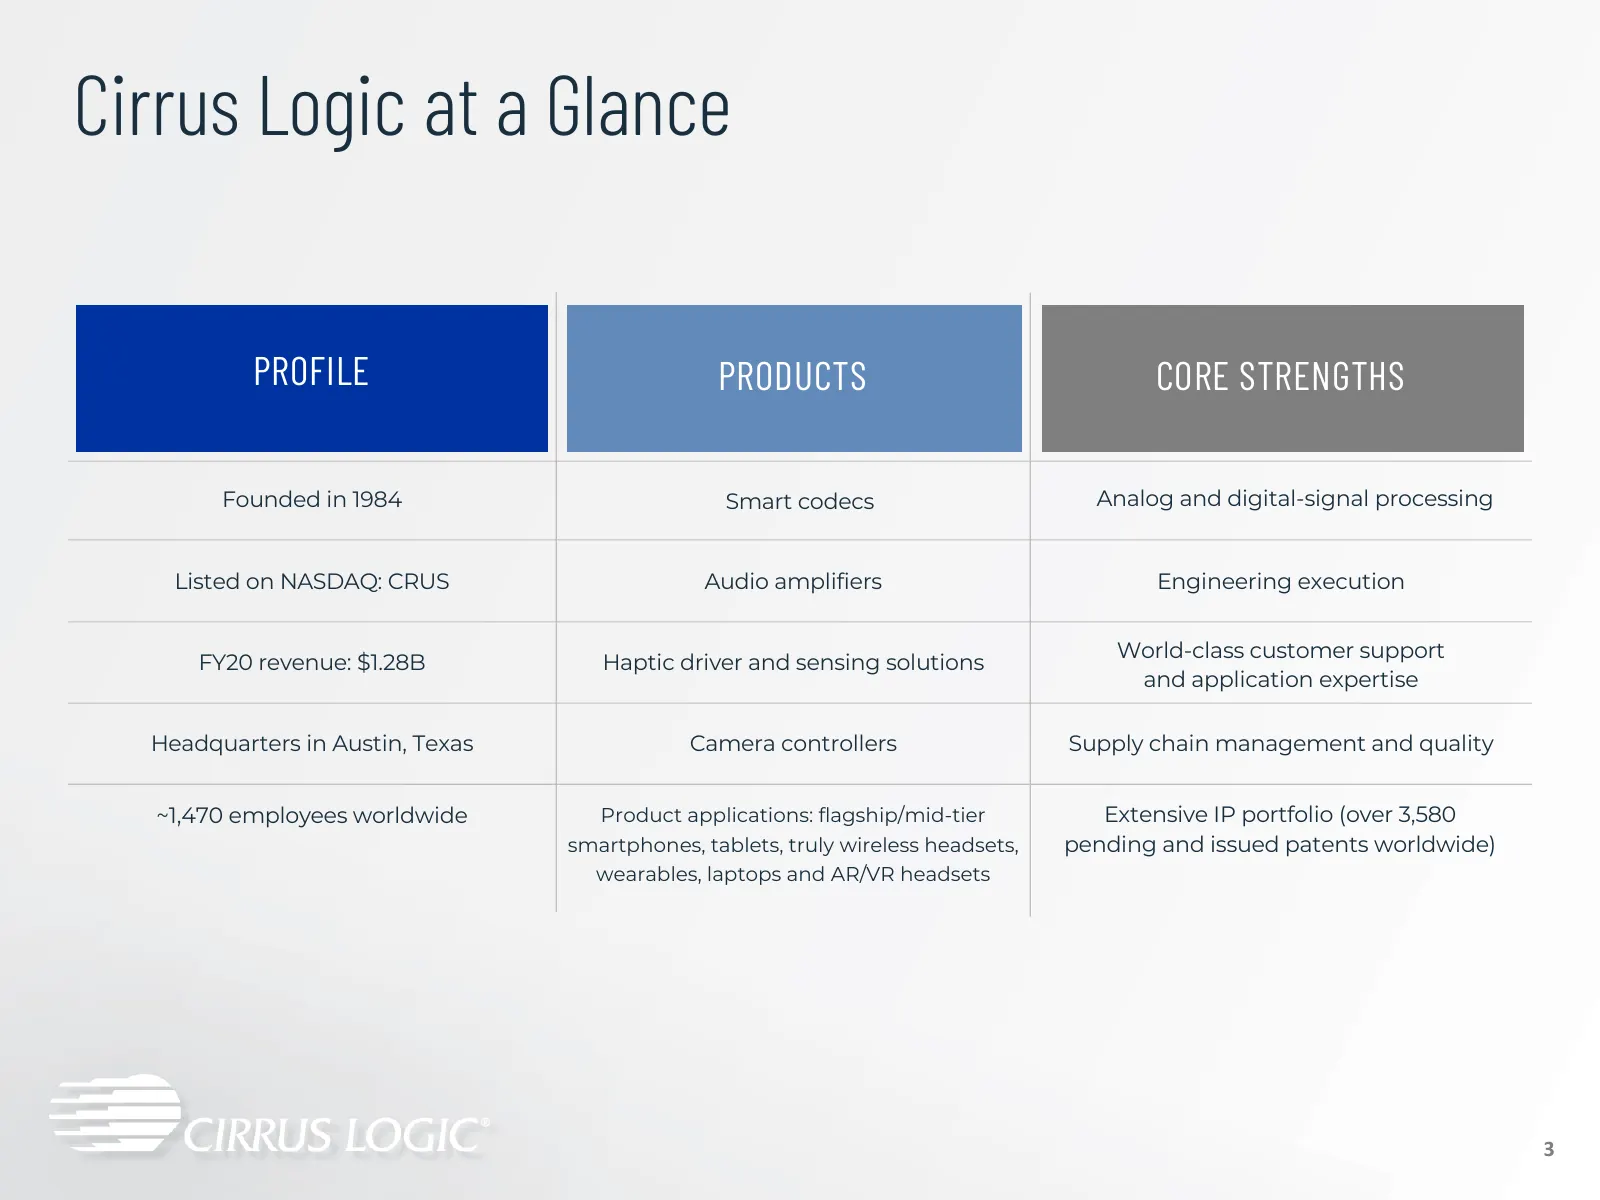
Cirrus Logic at a Glance PROFILE PRODUCTS CORE STRENGTHS Founded in 1984 Smart codecs Analog and digital-signal processing Listed on NASDAQ: CRUS Audio amplifiers Engineering execution World-class customer support FY20 revenue: $1.28B Haptic driver and sensing solutions and application expertise Hea
Slide 4: Proven Operating Model
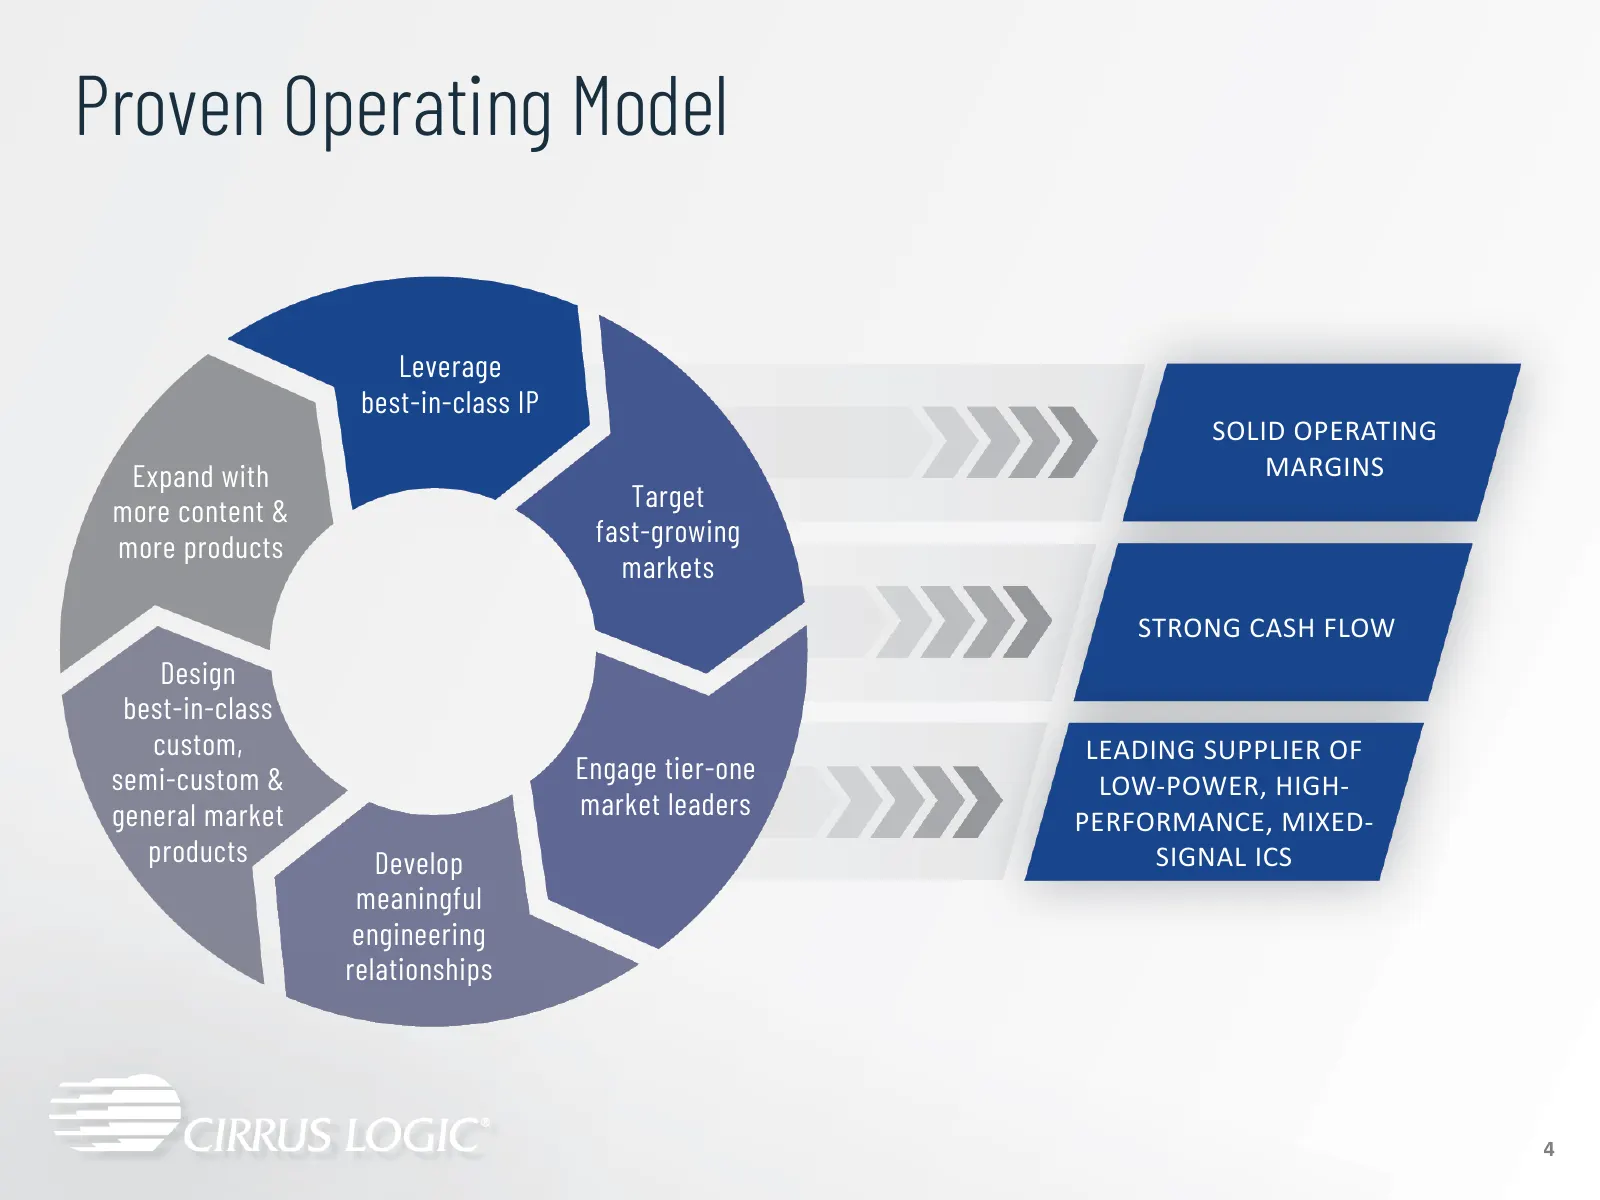
Proven Operating Model Leverage best-in-class IP SOLID OPERATING Expand with MARGINS more content & Target more products fast-growing markets STRONG CASH FLOW Design best-in-class custom, LEADING SUPPLIER OF semi-custom & Engage tier-one LOW-POWER, HIGH- general market market leaders PERFORMANCE, MI
Slide 5: Compelling Strategy for Growth & Diversification
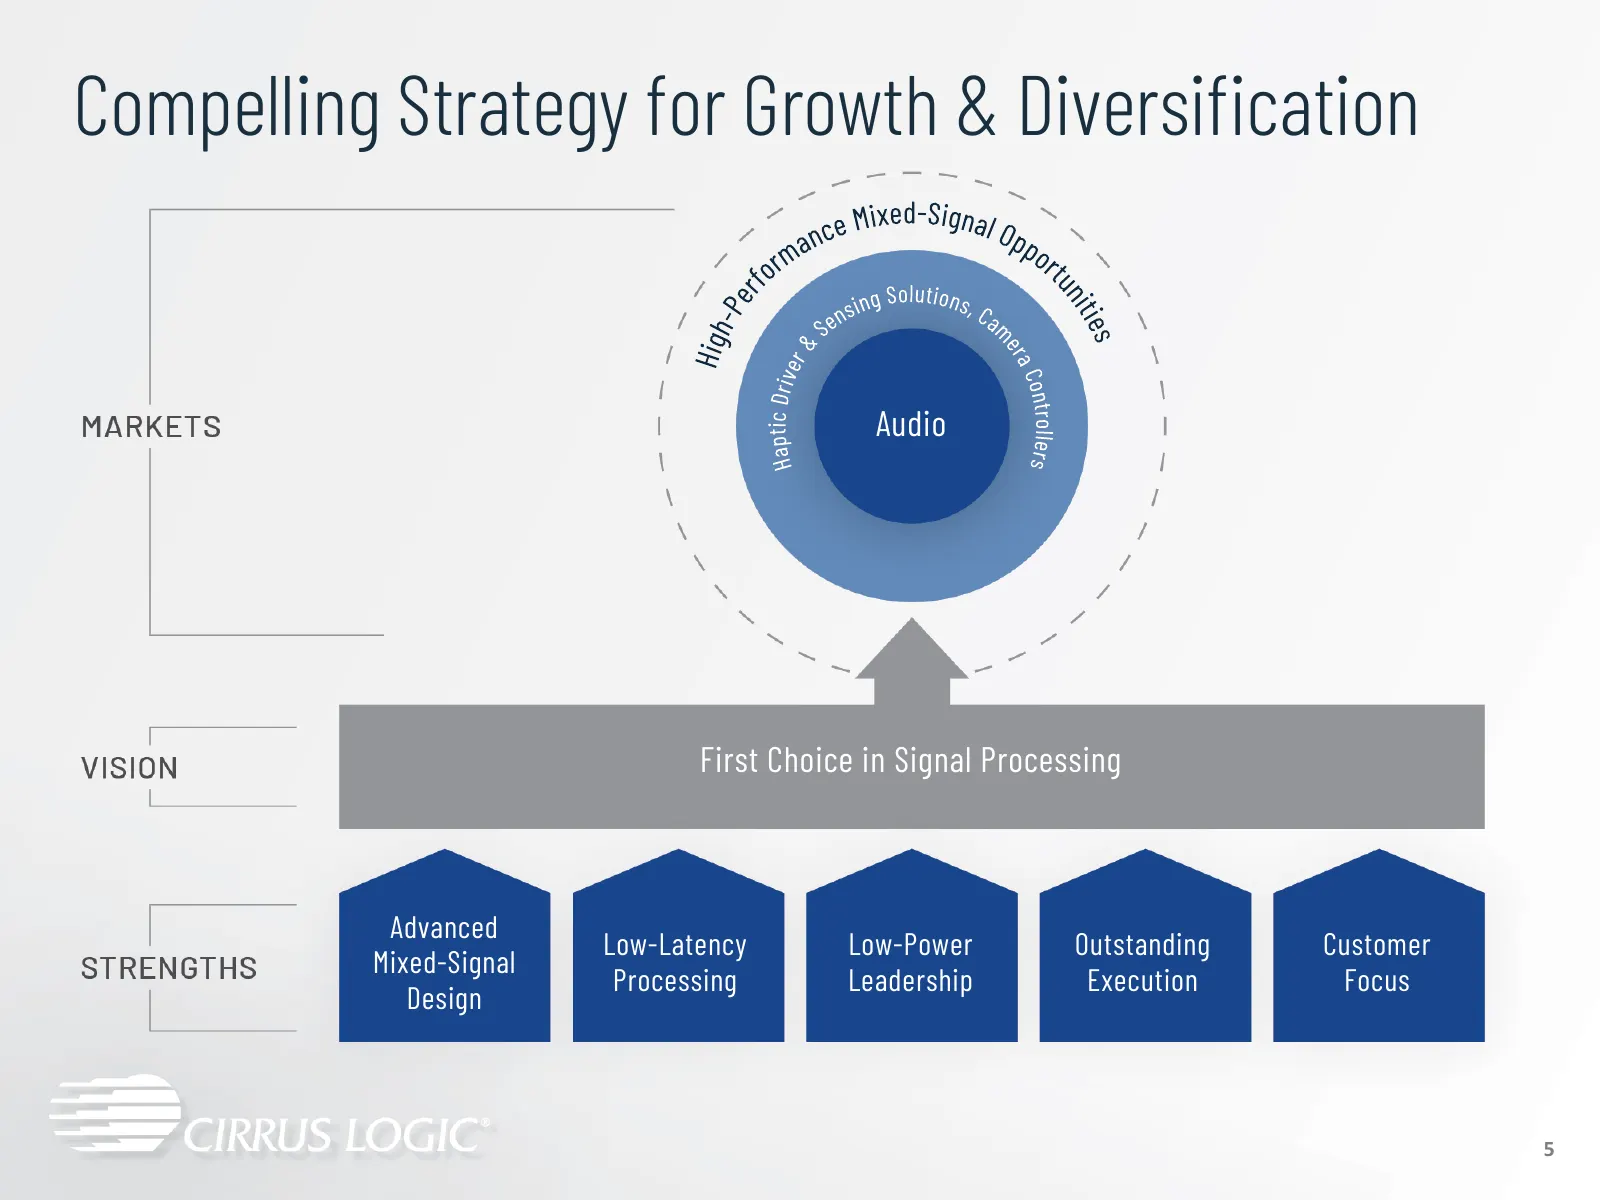
Compelling Strategy for Growth & Diversification Audio First Choice in Signal Processing Advanced Low-Latency Low-Power Outstanding Customer Mixed-Signal Processing Leadership Execution Focus Design 5

Slide 6: Unique Corporate Culture
Unique Corporate Culture Forbes | 2020 WORLD’S BEST EMPLOYERS POWERED BY STATISTA Best TOP Workplaces” WORK = PLACES Large Organisations 2021 Giean Place To UK Work, 2020

Slide 7: Technology & Market Overview
Technology & Market Overview 7
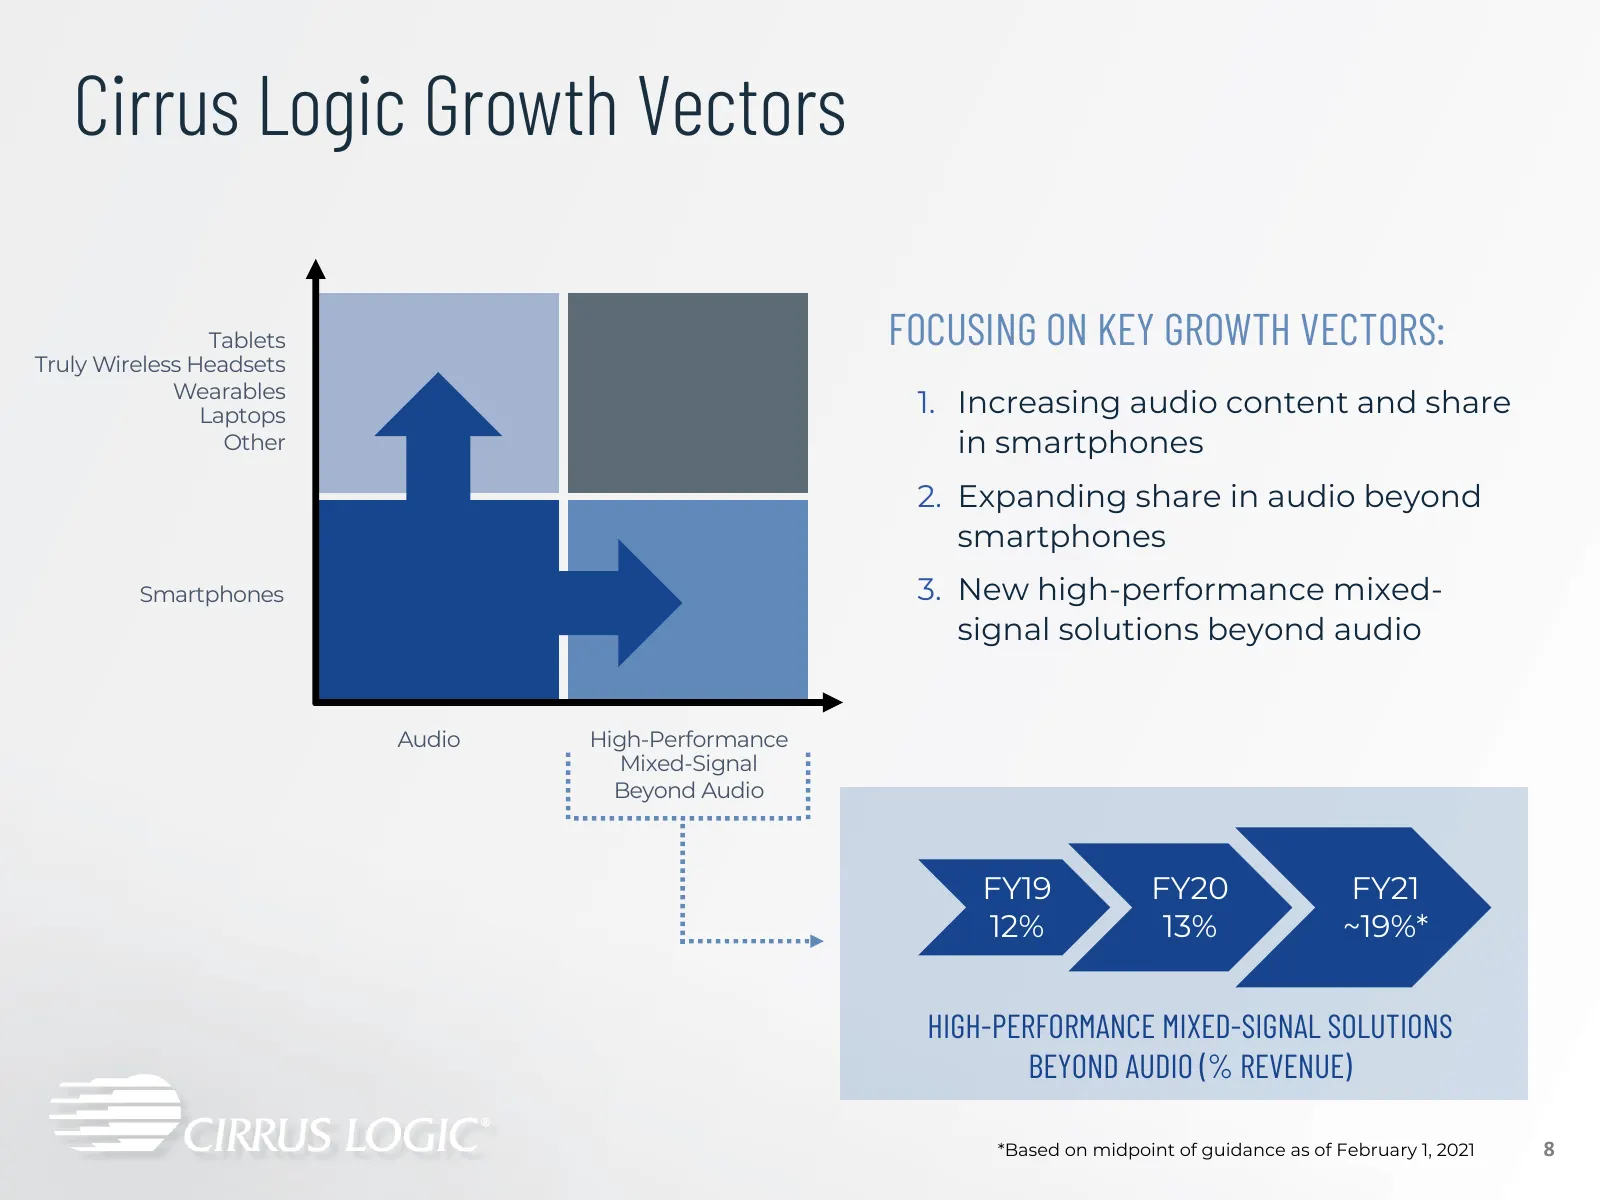
Slide 8: Cirrus Logic Growth Vectors
Cirrus Logic Growth Vectors Tablets FOCUSING ON KEY GROWTH VECTORS: Truly Wireless Headsets Wearables Laptops 1. Increasing audio content and share Other in smartphones 2. Expanding share in audio beyond smartphones Smartphones 3. New high-performance mixed- signal solutions beyond audio Audio High-
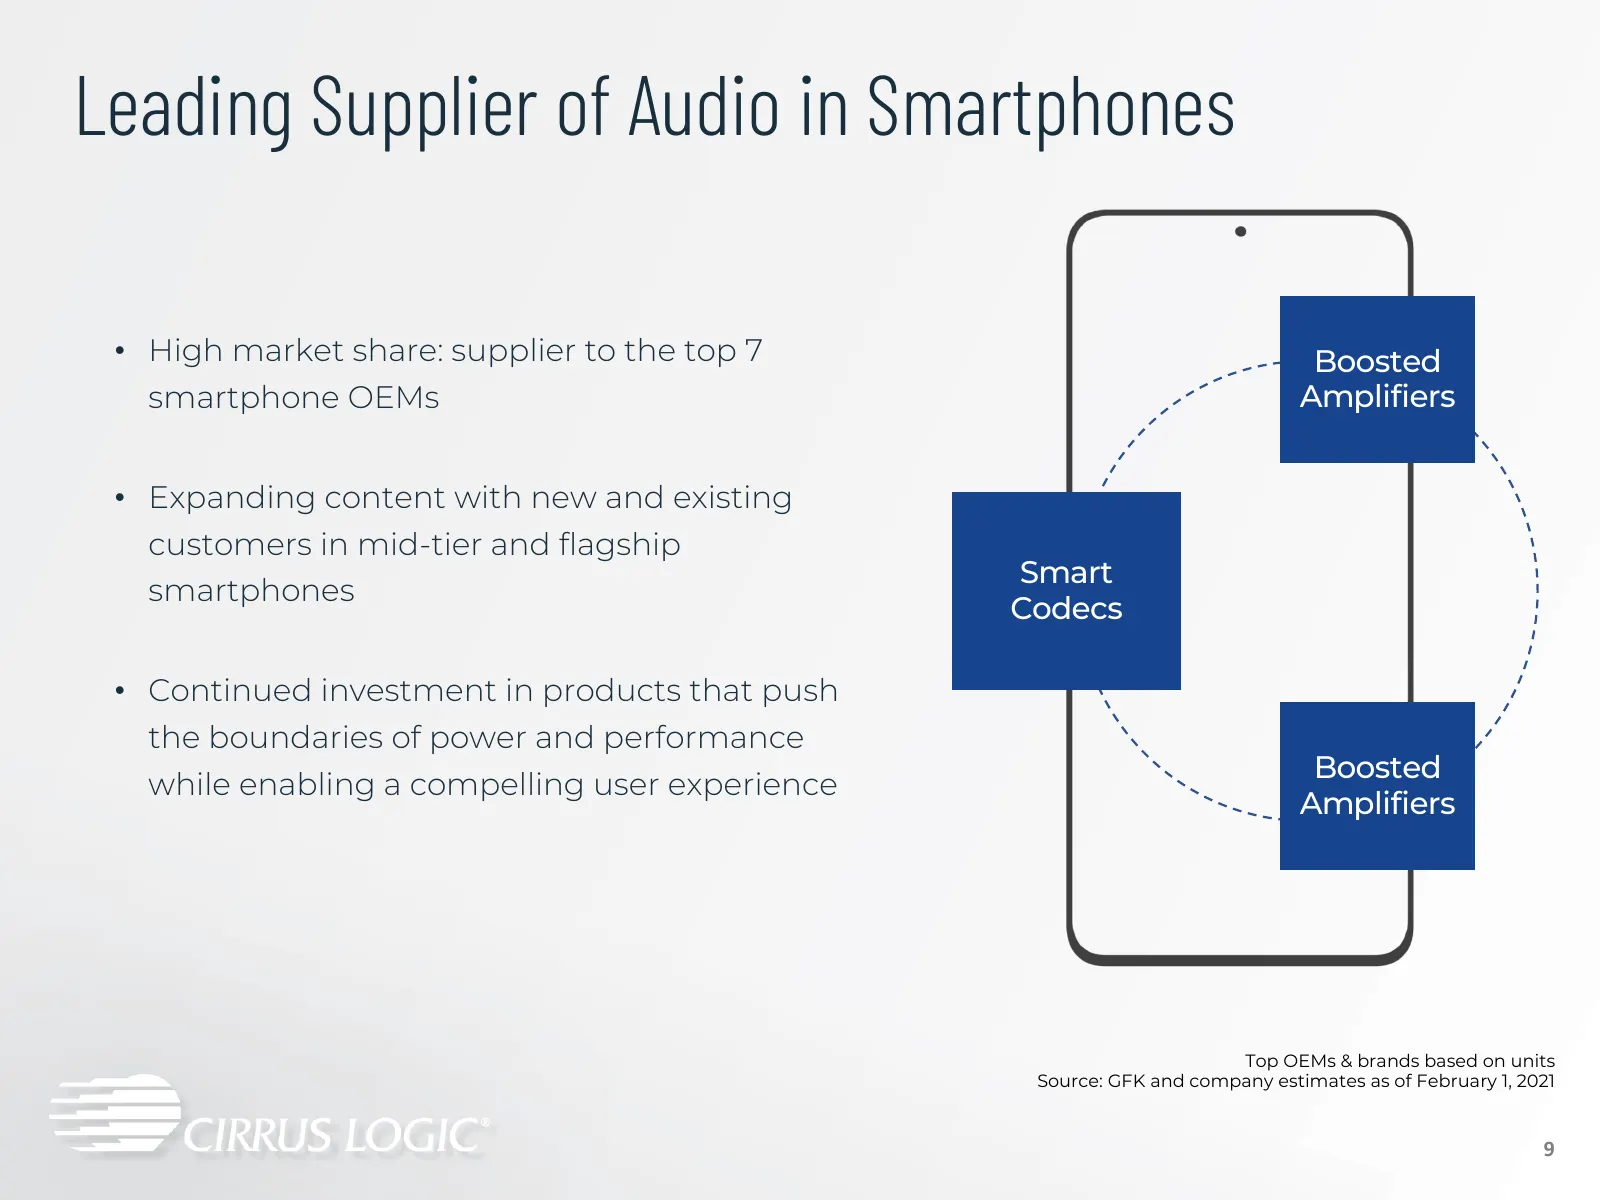
Slide 9: Leading Supplier of Audio in Smartphones
Leading Supplier of Audio in Smartphones • High market share: supplier to the top 7 Boosted smartphone OEMs Amplifiers • Expanding content with new and existing customers in mid-tier and flagship Smart smartphones Codecs • Continued investment in products that push the boundaries of power and perfor
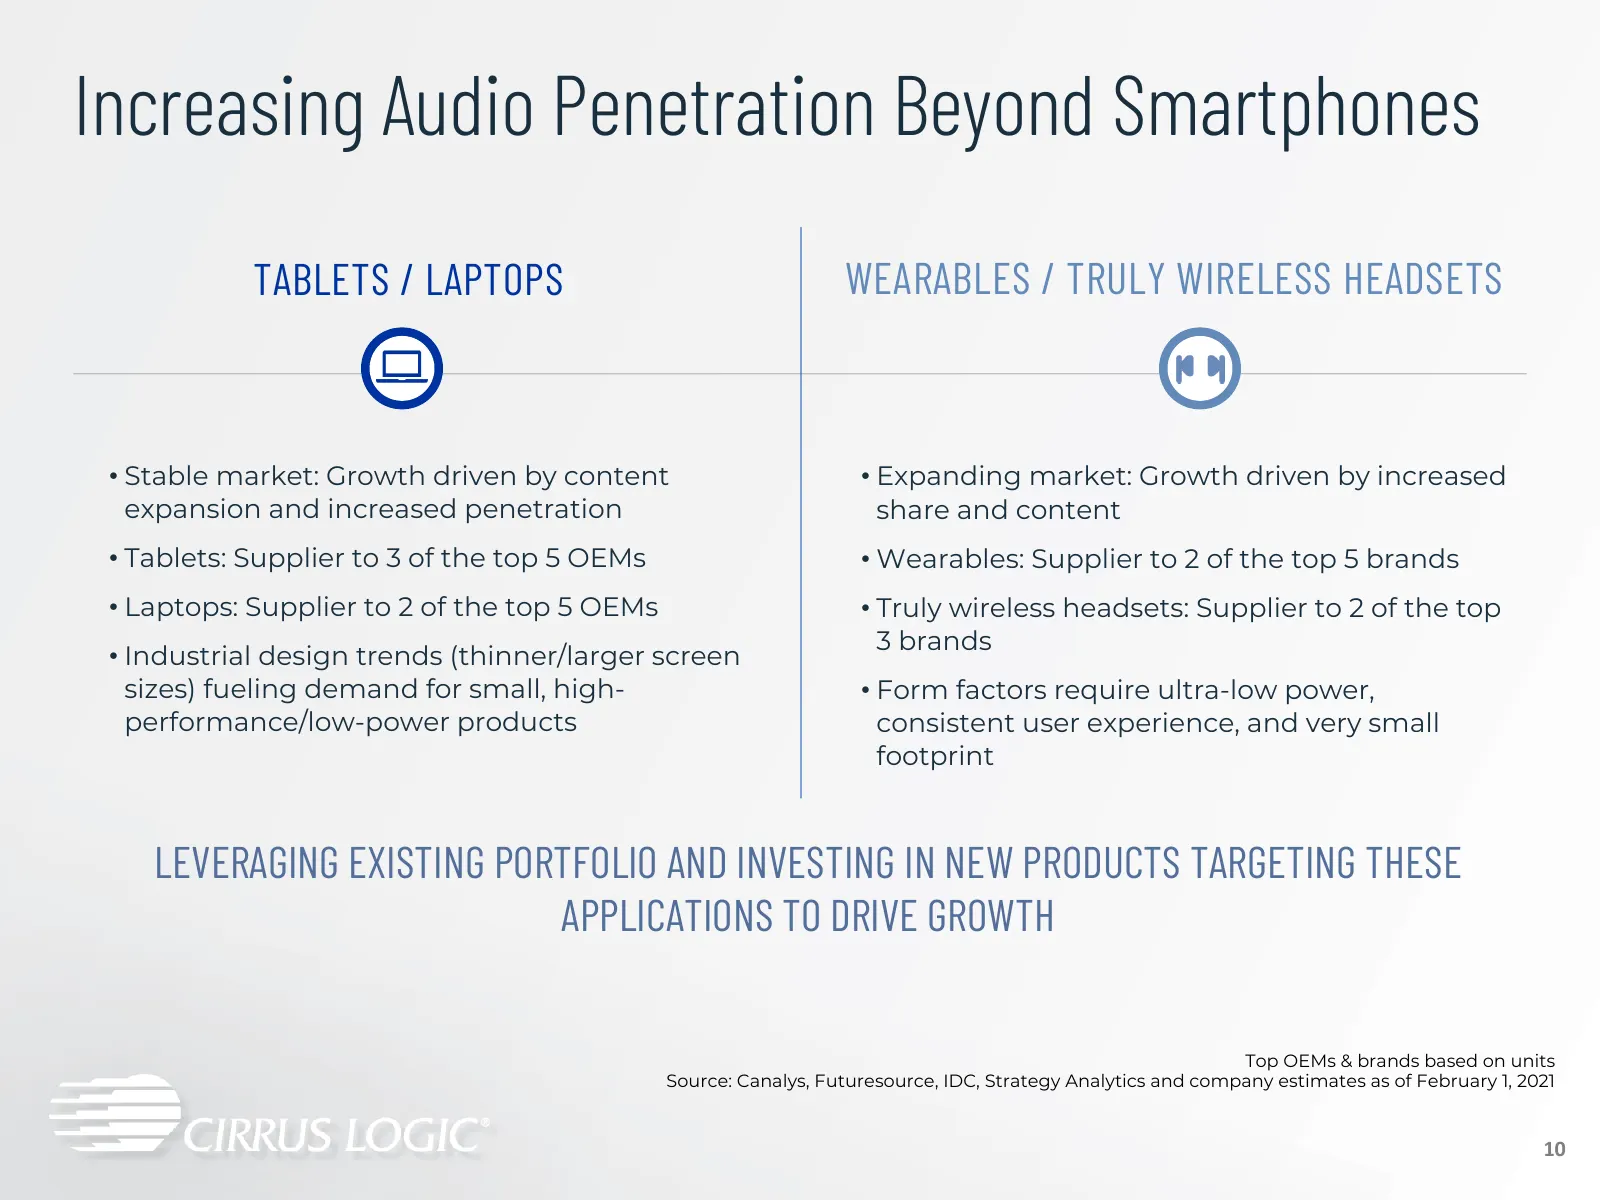
Slide 10: Increasing Audio Penetration Beyond Smartphones
Increasing Audio Penetration Beyond Smartphones TABLETS / LAPTOPS WEARABLES / TRULY WIRELESS HEADSETS • Stable market: Growth driven by content • Expanding market: Growth driven by increased expansion and increased penetration share and content • Tablets: Supplier to 3 of the top 5 OEMs • Wearables:
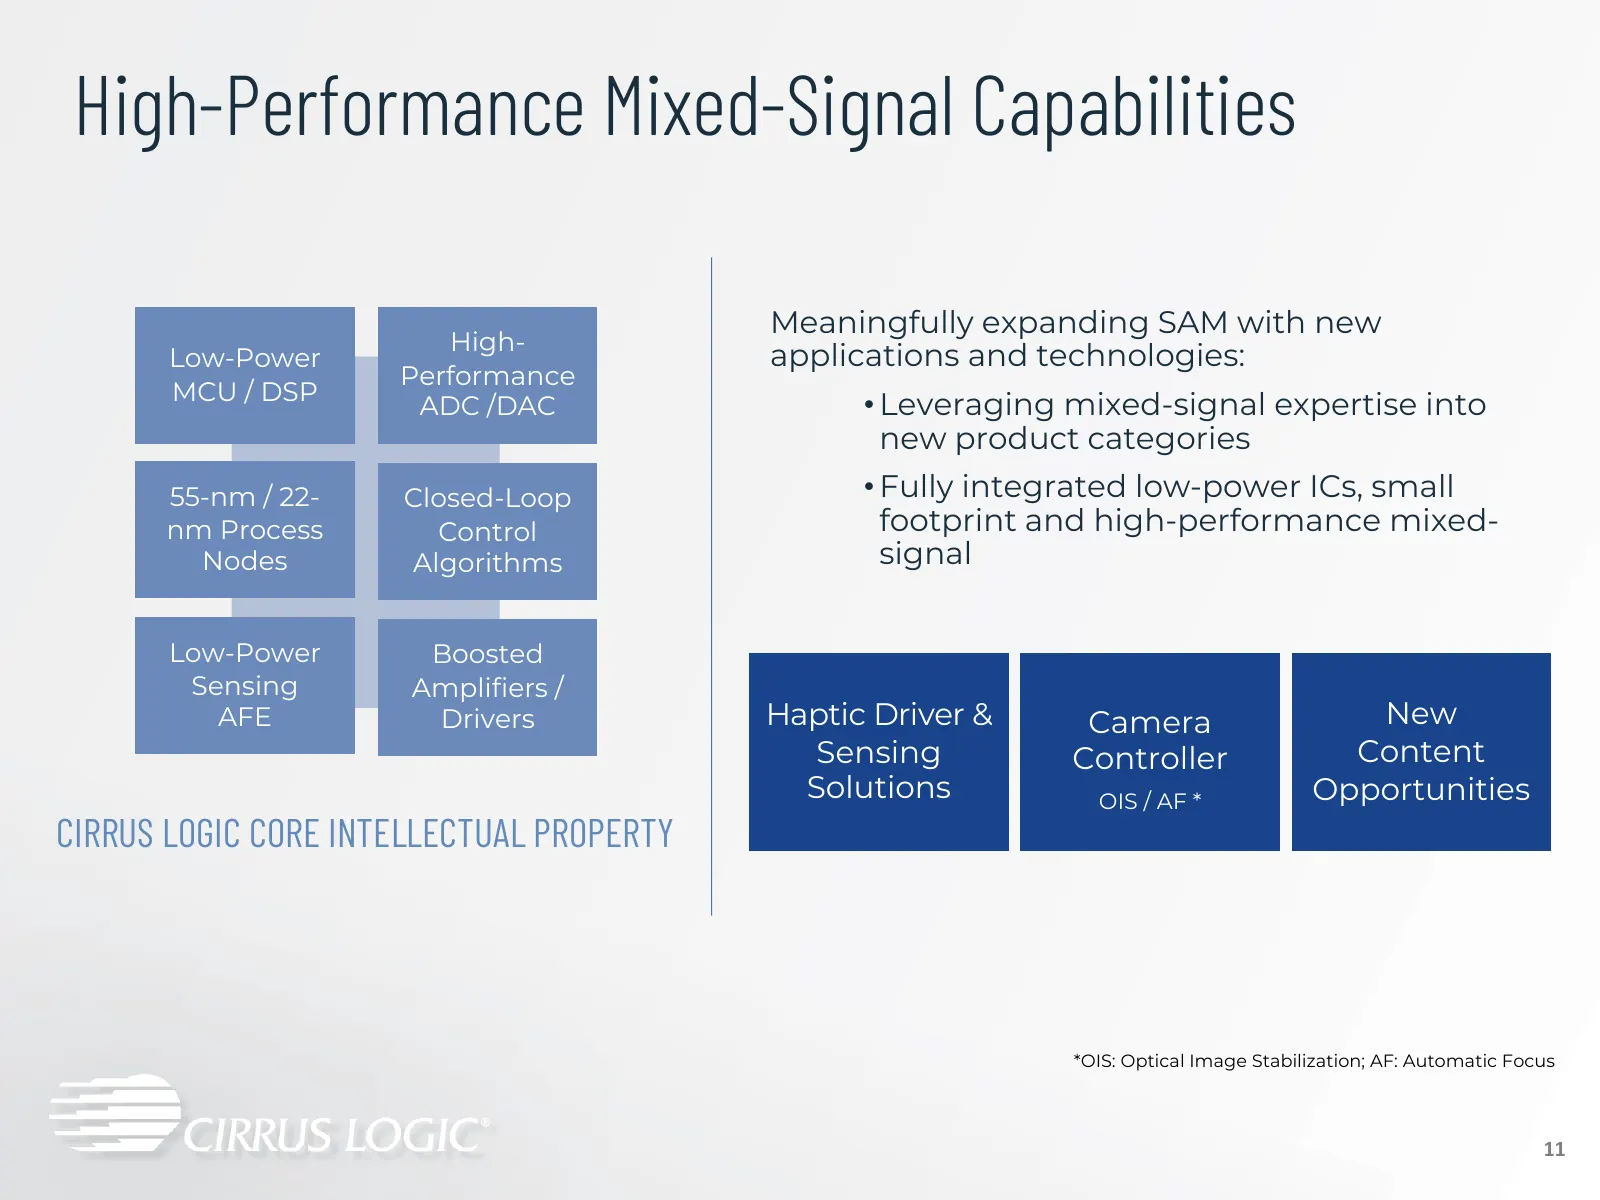
Slide 11: High-Performance Mixed-Signal Capabilities
High-Performance Mixed-Signal Capabilities Meaningfully expanding SAM with new High- Low-Power applications and technologies: Performance MCU / DSP ADC /DAC • Leveraging mixed-signal expertise into new product categories 55-nm / 22- Closed-Loop • Fully integrated low-power ICs, small nm Process Cont
Slide 12: Broadening Product Portfolio
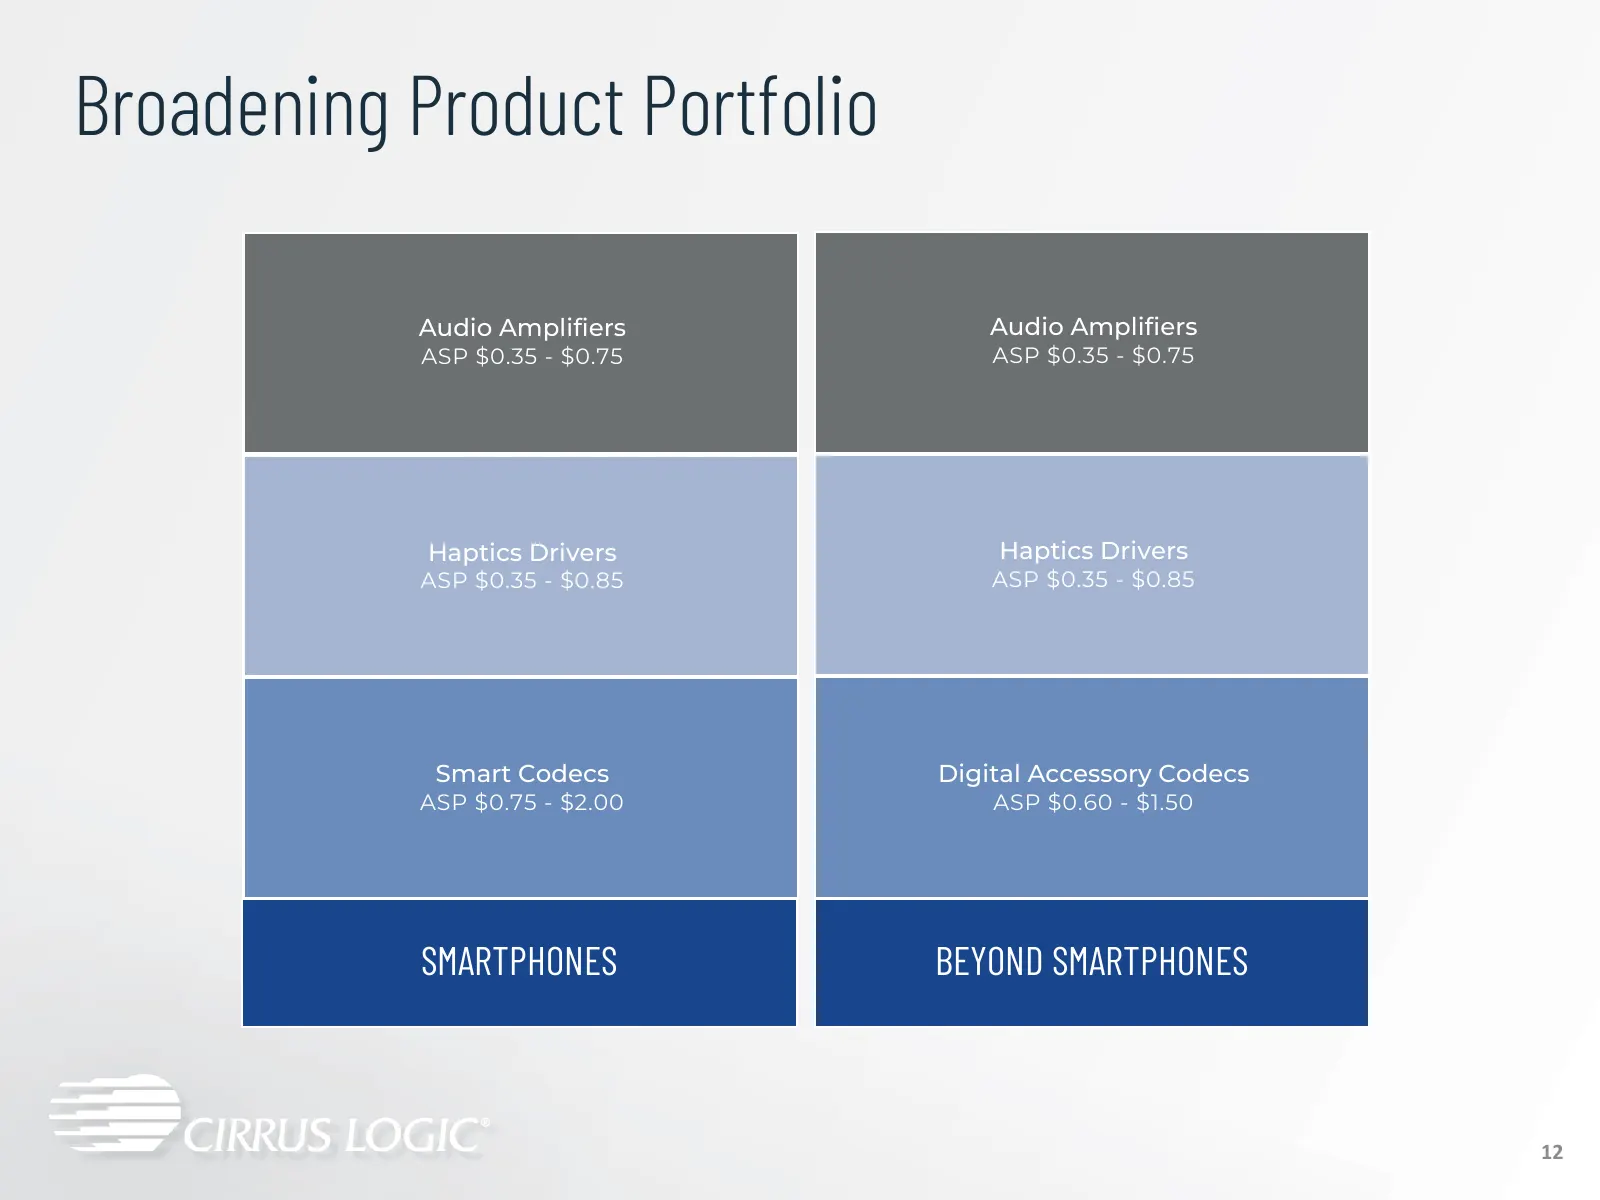
Broadening Product Portfolio Audio Amplifiers Audio Amplifiers ASP $0.35 - $0.75 ASP $0.35 - $0.75 Haptics Drivers Haptics Drivers ASP $0.35 - $0.85 ASP $0.35 - $0.85 Smart Codecs Digital Accessory Codecs ASP $0.75 - $2.00 ASP $0.60 - $1.50 SMARTPHONES BEYOND SMARTPHONES 12
Slide 13: Expanding SAM in a Vast Mixed-Signal Market
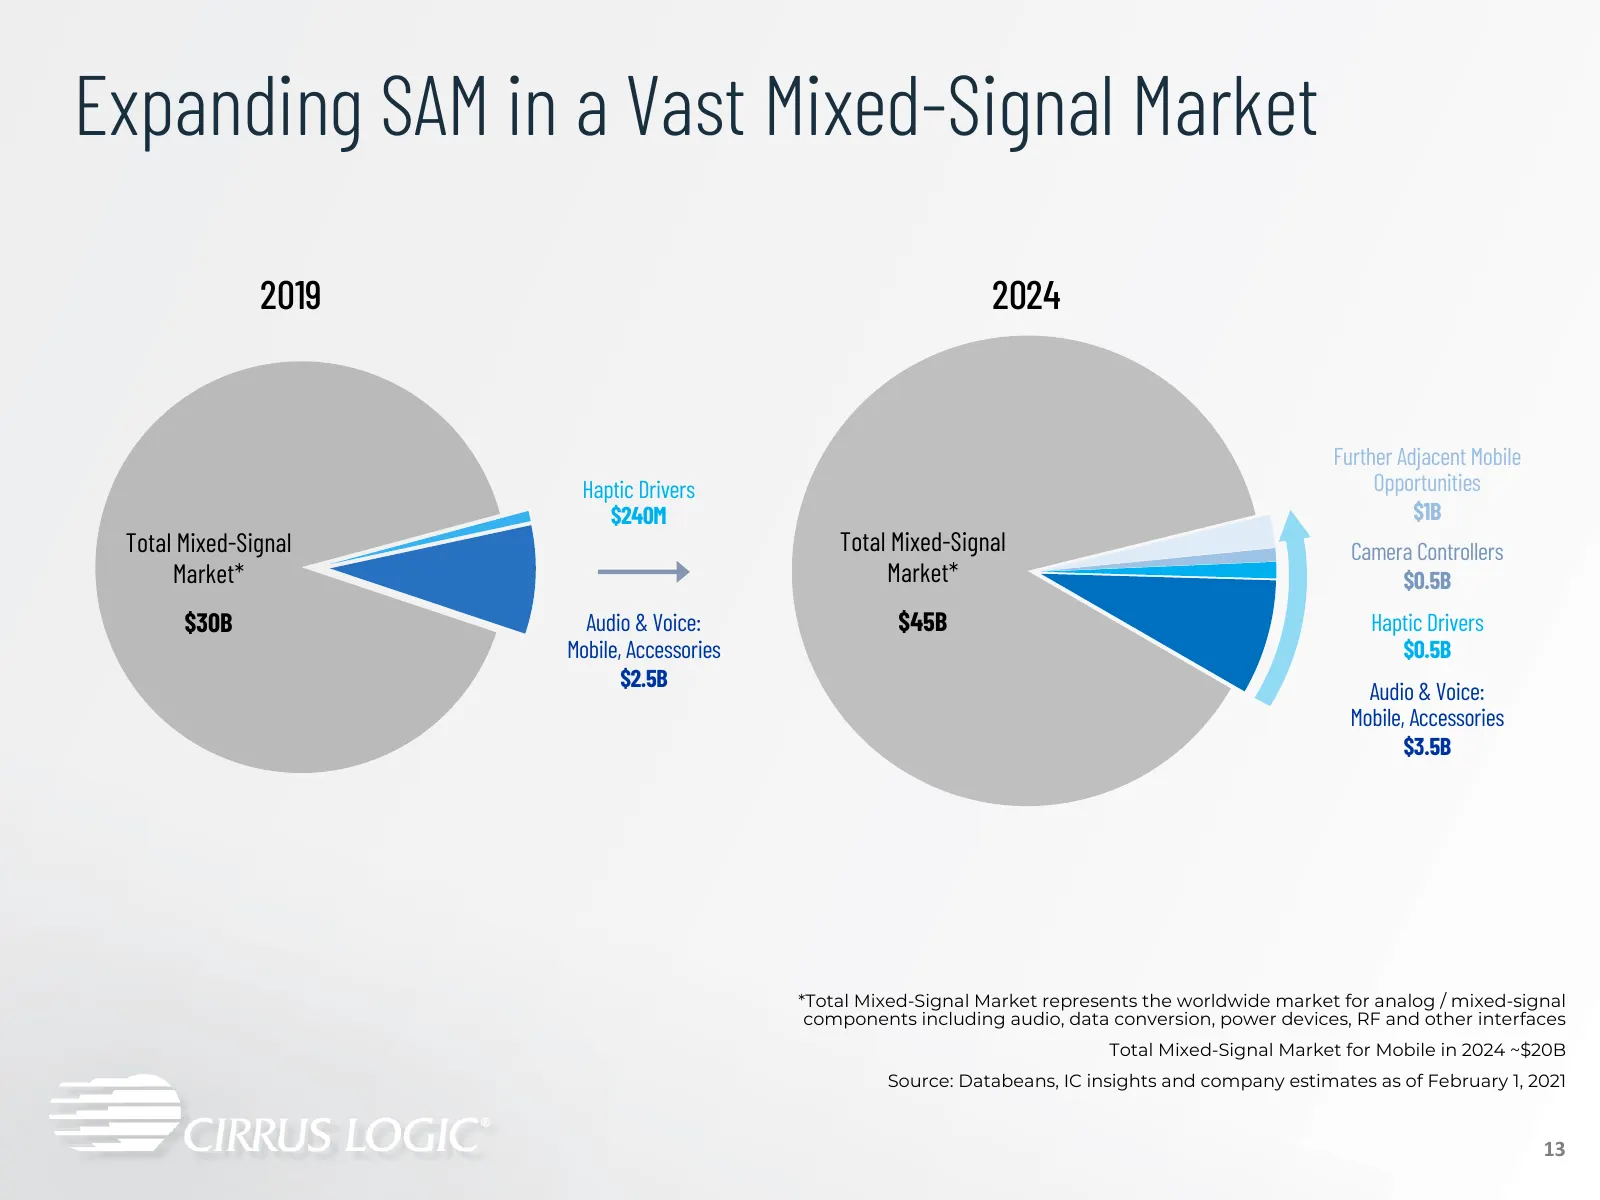
Expanding SAM in a Vast Mixed-Signal Market 2019 2024 Further Adjacent Mobile Haptic Drivers Opportunities $240M $1B Total Mixed-Signal Total TotalMixed-Signal Mixed Signal Camera Controllers Market* Market* Market* $0.5B $30B Audio & Voice: $45B $45B Haptic Drivers Mobile, Accessories $0.5B $2.5B A
Slide 14: Product Overview
Product Overview See Bebe gs
Slide 15: Audio Amplifiers
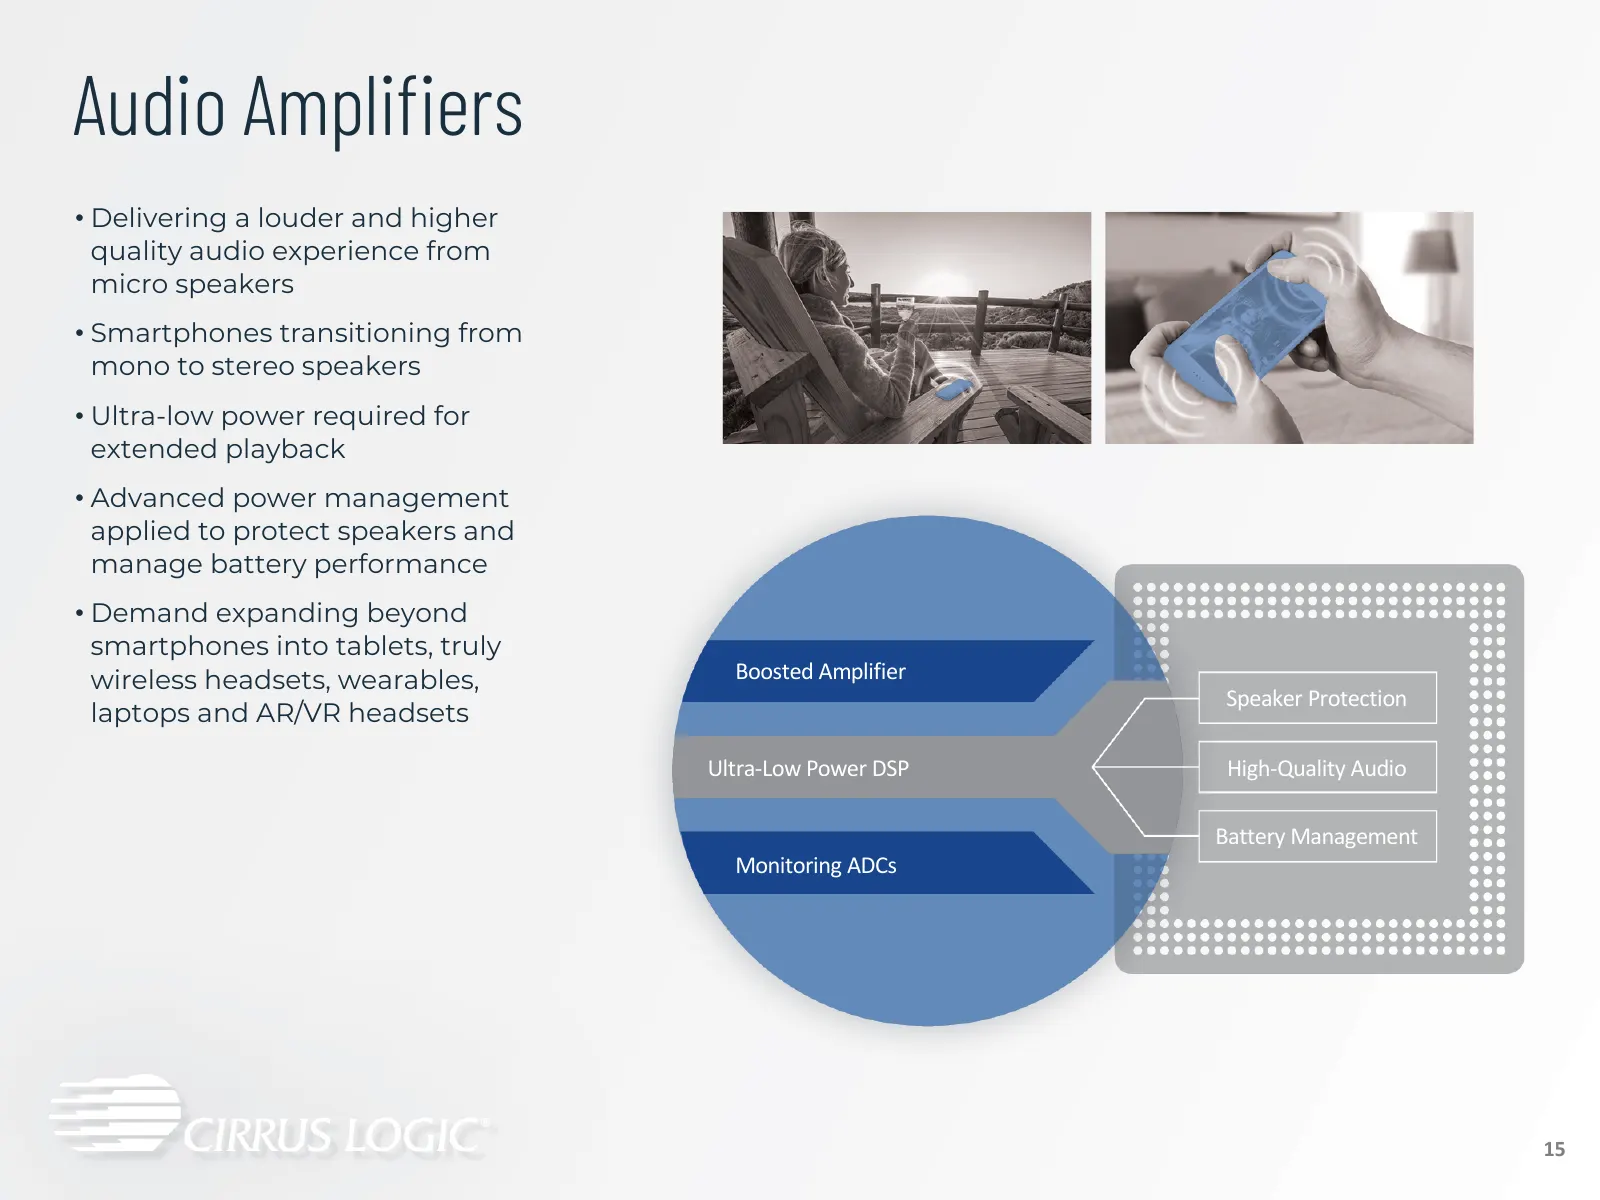
Audio Amplifiers • Delivering a louder and higher quality audio experience from micro speakers • Smartphones transitioning from mono to stereo speakers • Ultra-low power required for extended playback • Advanced power management applied to protect speakers and manage battery performance • Demand exp
Slide 16: Haptic Driver & Sensing Solutions
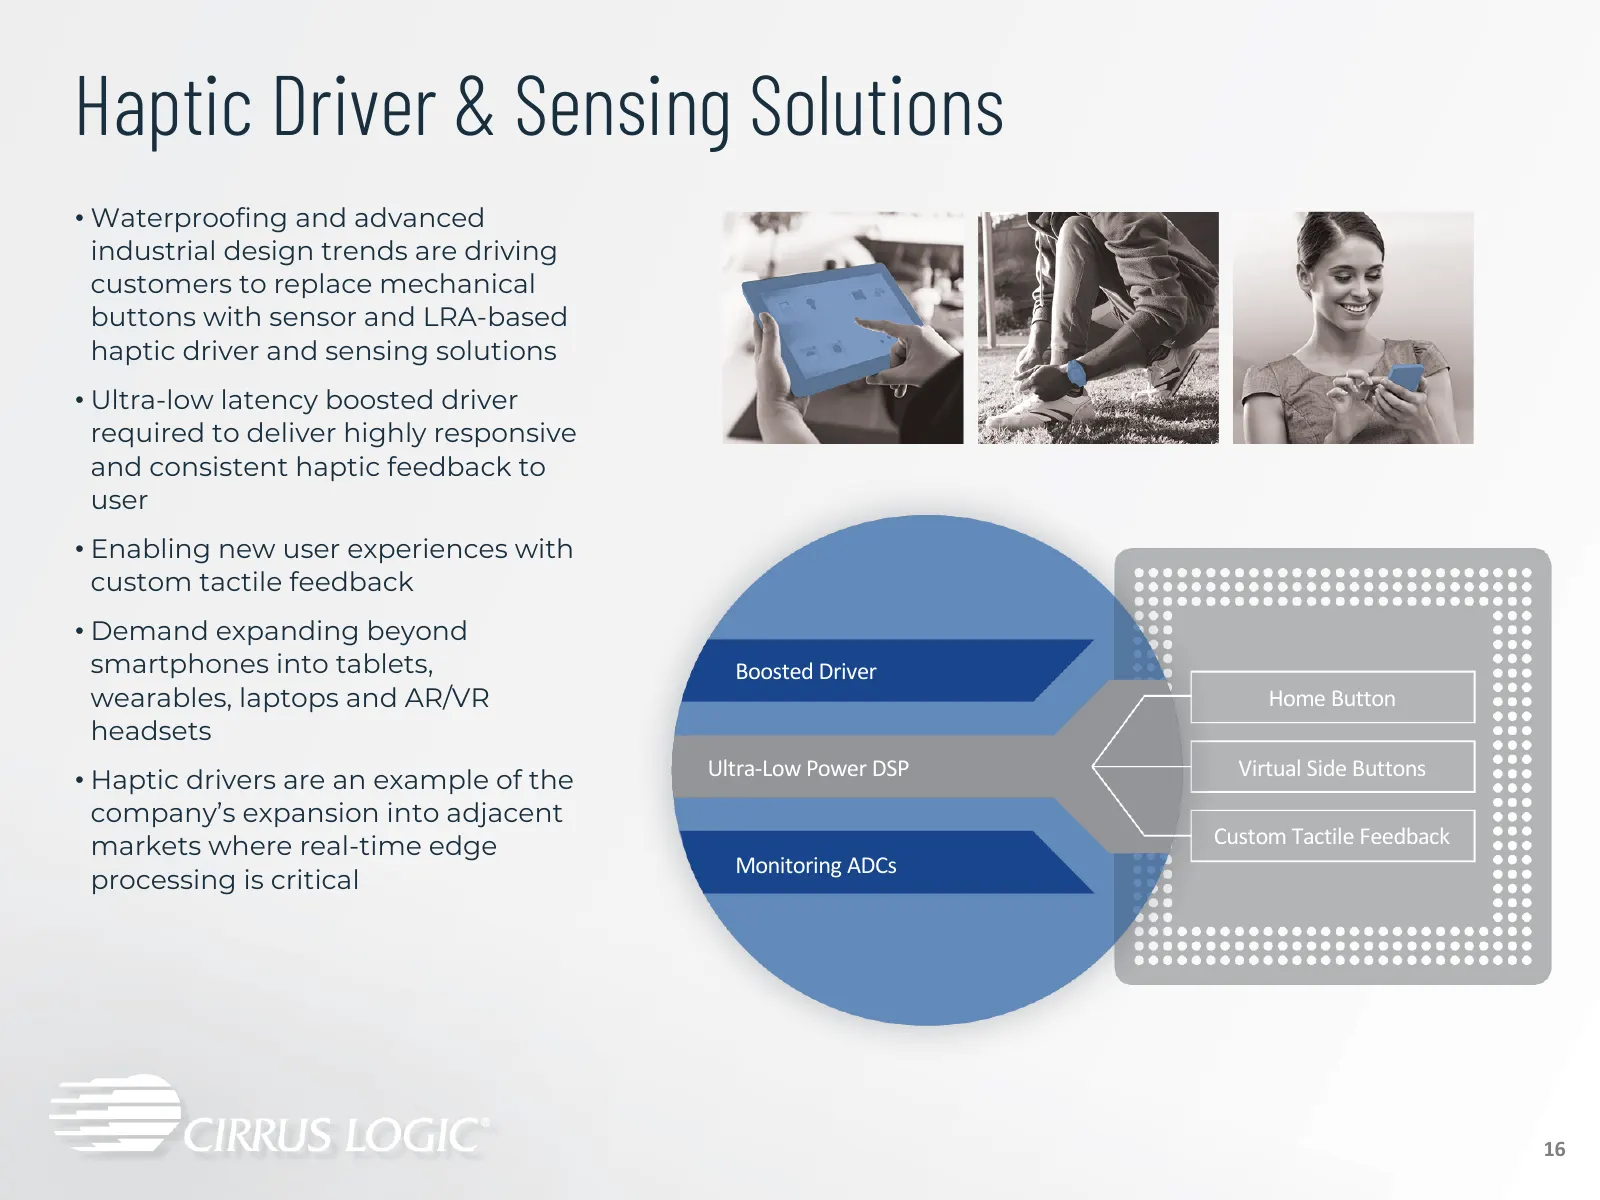
Haptic Driver & Sensing Solutions • Waterproofing and advanced industrial design trends are driving customers to replace mechanical buttons with sensor and LRA-based haptic driver and sensing solutions • Ultra-low latency boosted driver required to deliver highly responsive and consistent haptic fee
Slide 17: Smart Codecs
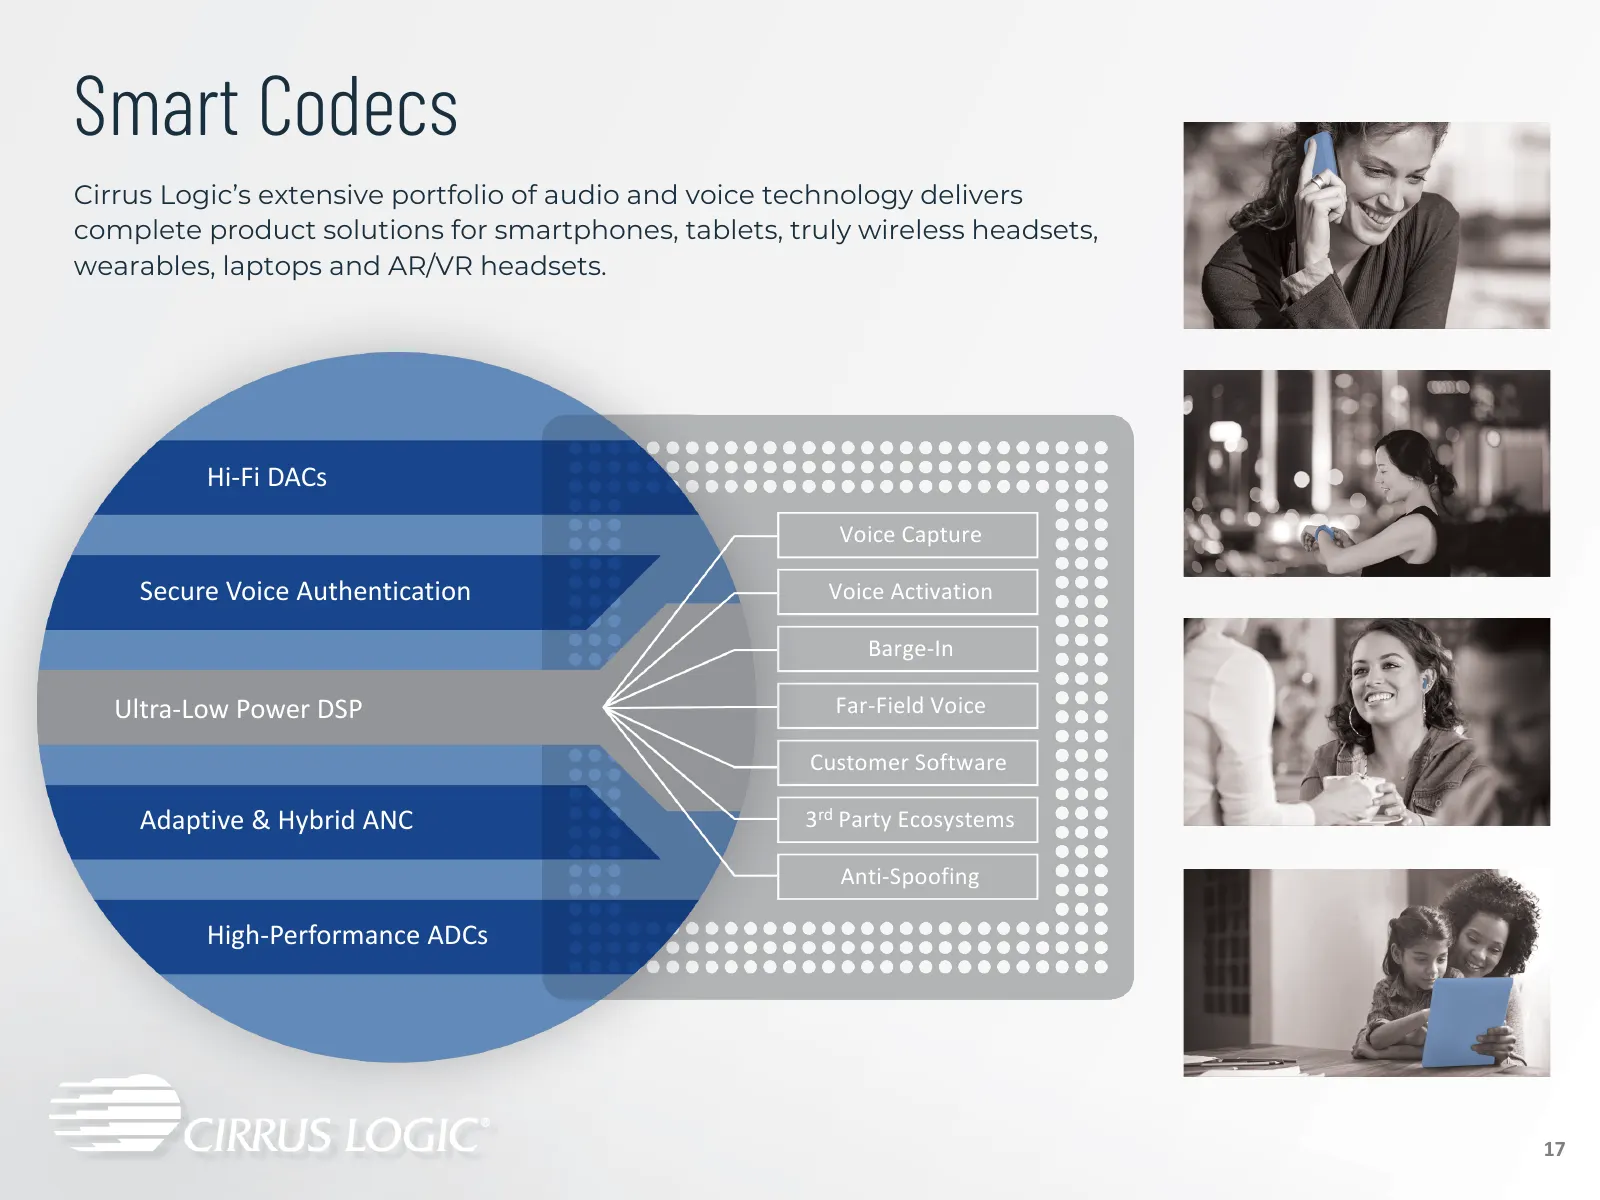
Smart Codecs Cirrus Logic’s extensive portfolio of audio and voice technology delivers complete product solutions for smartphones, tablets, truly wireless headsets, wearables, laptops and AR/VR headsets. Hi-Fi DACs Voice Capture Secure Voice Authentication Voice Activation Barge-In Ultra-Low Power D

Slide 18: Financials
Financials 18
Slide 19: Track Record of Long-Term Revenue Growth
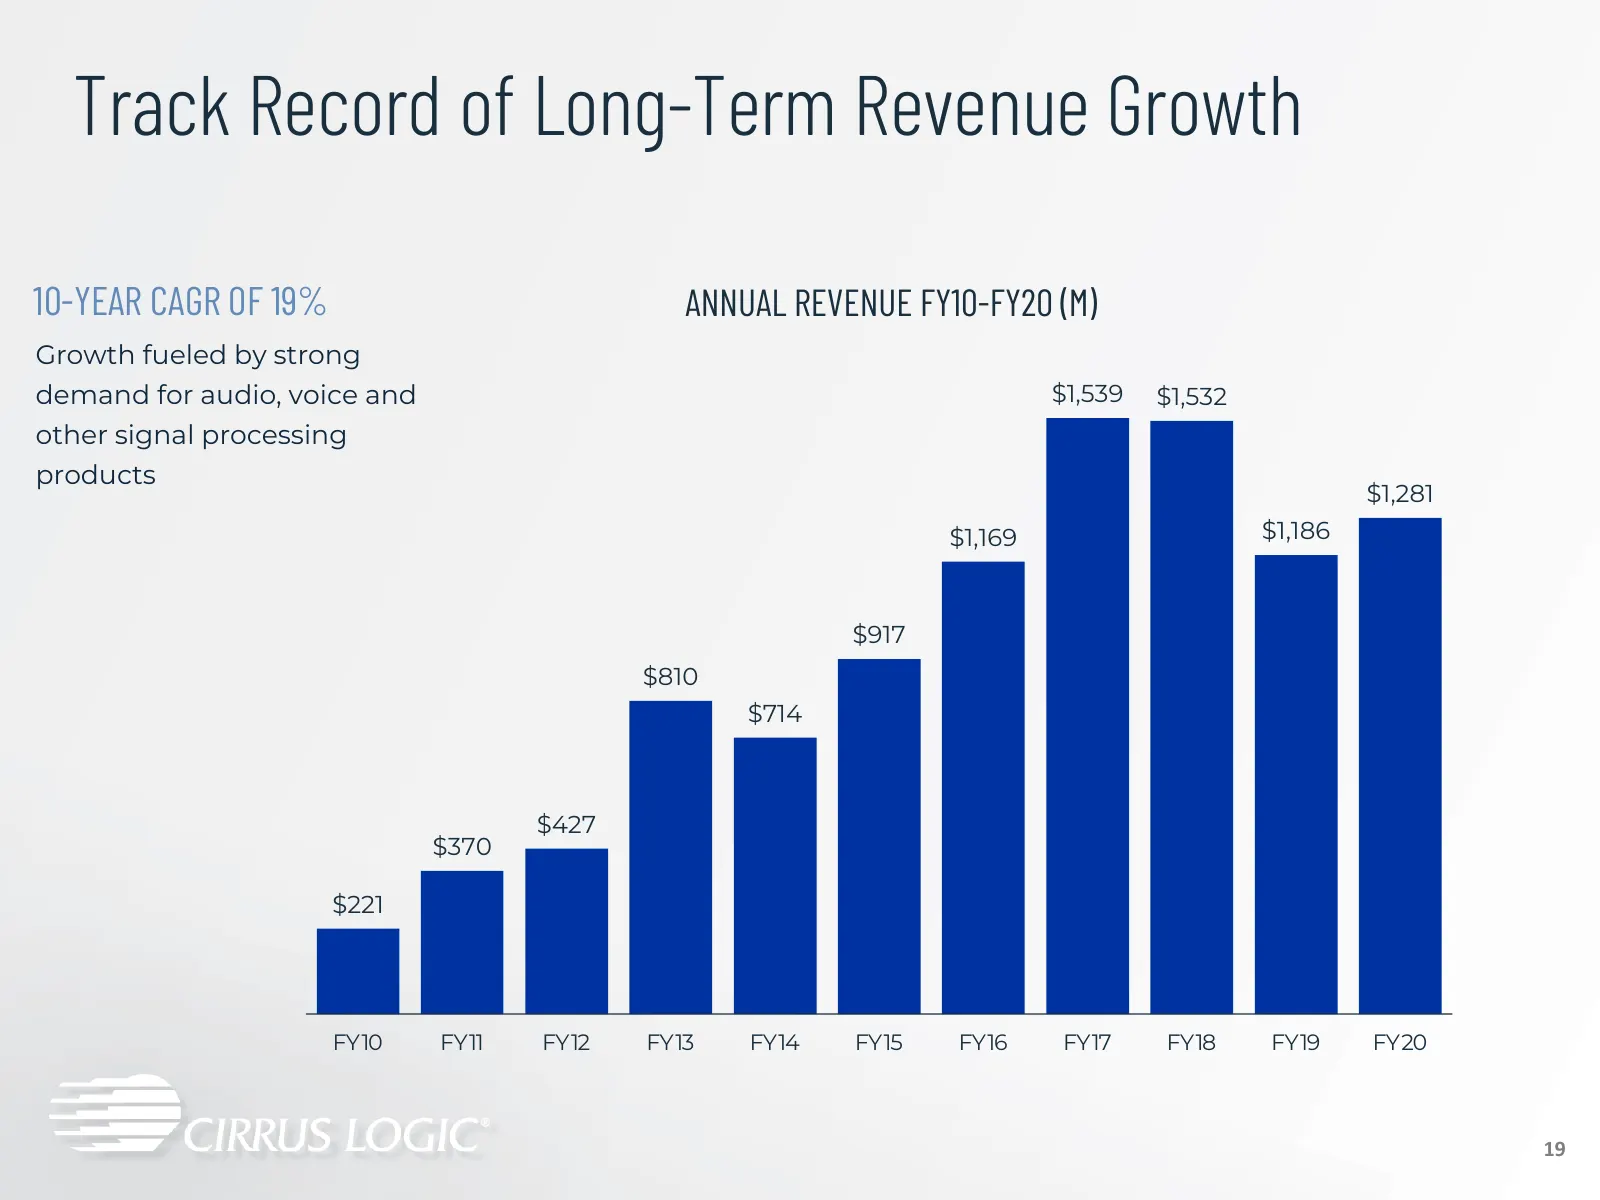
Track Record of Long-Term Revenue Growth 10-YEAR CAGR OF 19% ANNUAL REVENUE FY10-FY20 (M) Growth fueled by strong demand for audio, voice and $1,539 $1,532 other signal processing products $1,281 $1,169 $1,186 $917 $810 $714 $427 $370 $221 FY10 FY11 FY12 FY13 FY14 FY15 FY16 FY17 FY18 FY19 FY20 19
Slide 20: Financial Highlights
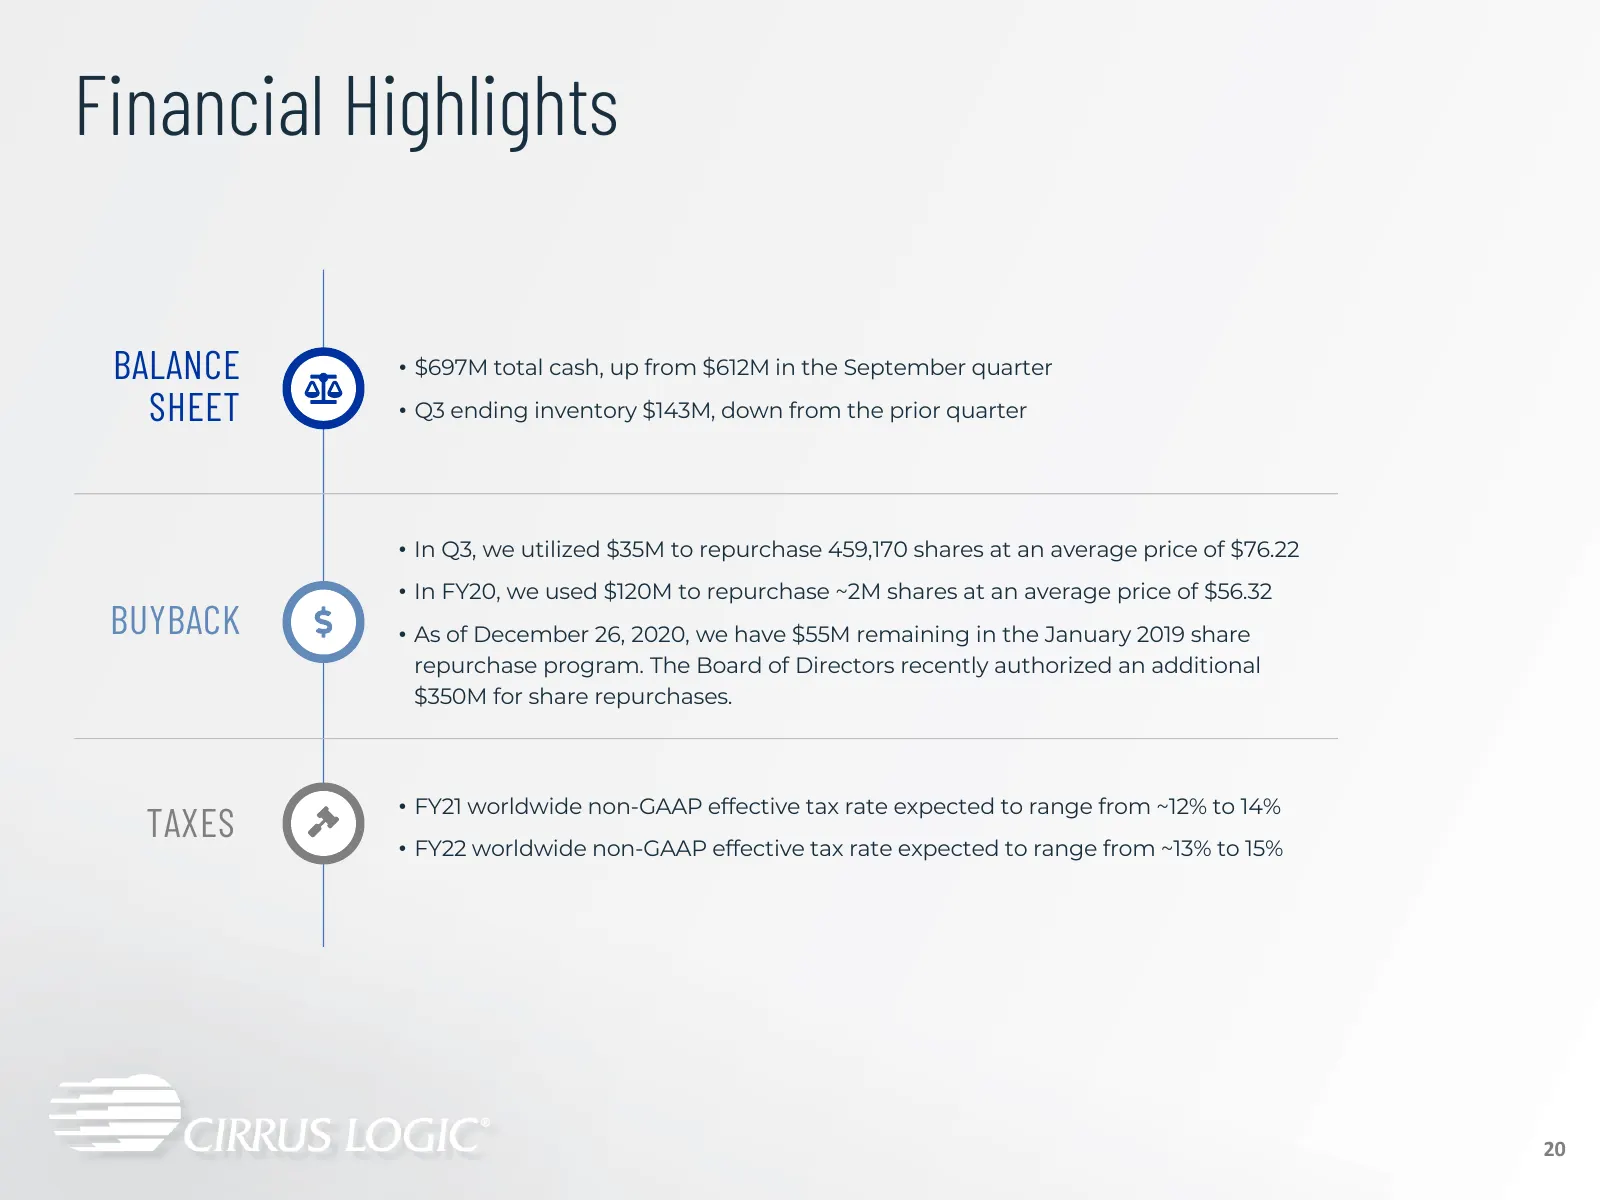
Financial Highlights BALANCE • $697M total cash, up from $612M in the September quarter SHEET • Q3 ending inventory $143M, down from the prior quarter • In Q3, we utilized $35M to repurchase 459,170 shares at an average price of $76.22 • In FY20, we used $120M to repurchase ~2M shares at an average
Slide 21: Strong Cash Generation
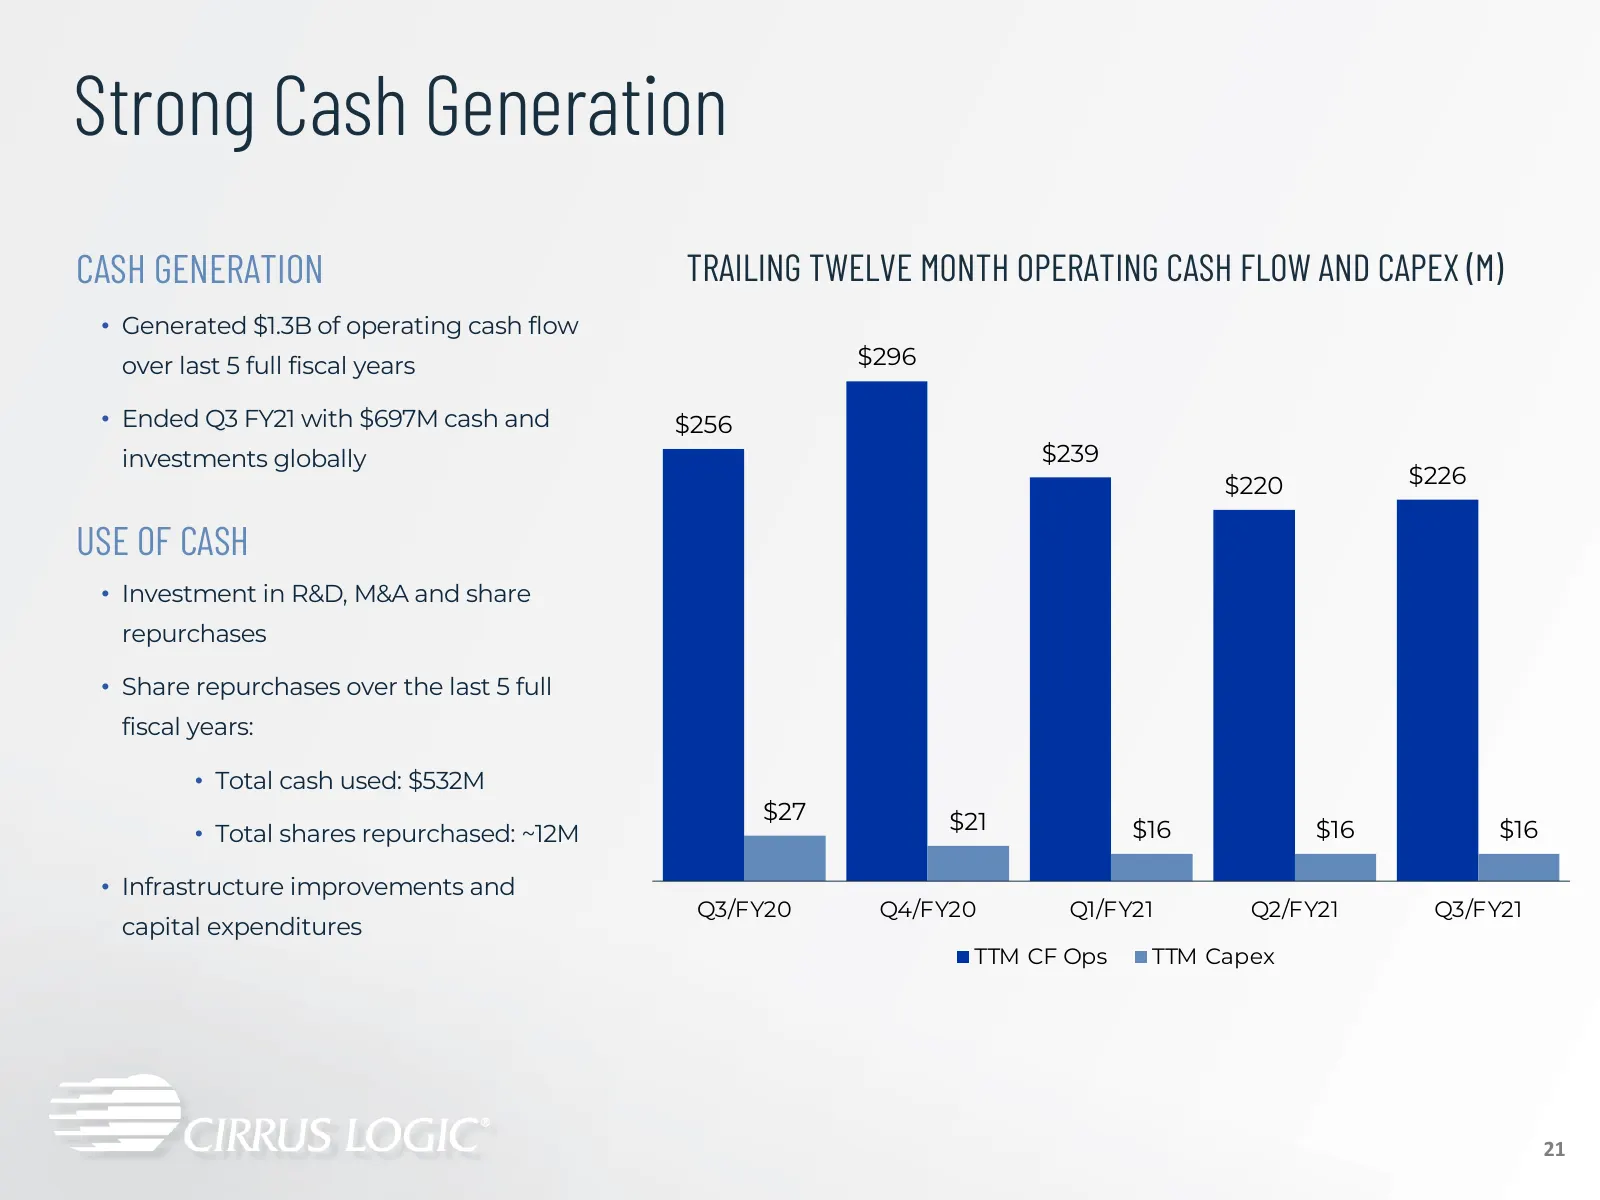
Strong Cash Generation CASH GENERATION TRAILING TWELVE MONTH OPERATING CASH FLOW AND CAPEX (M) • Generated $1.3B of operating cash flow over last 5 full fiscal years $296 • Ended Q3 FY21 with $697M cash and $256 investments globally $239 $220 $226 USE OF CASH • Investment in R&D, M&A and share repur
Slide 22: Operating Profit Profile
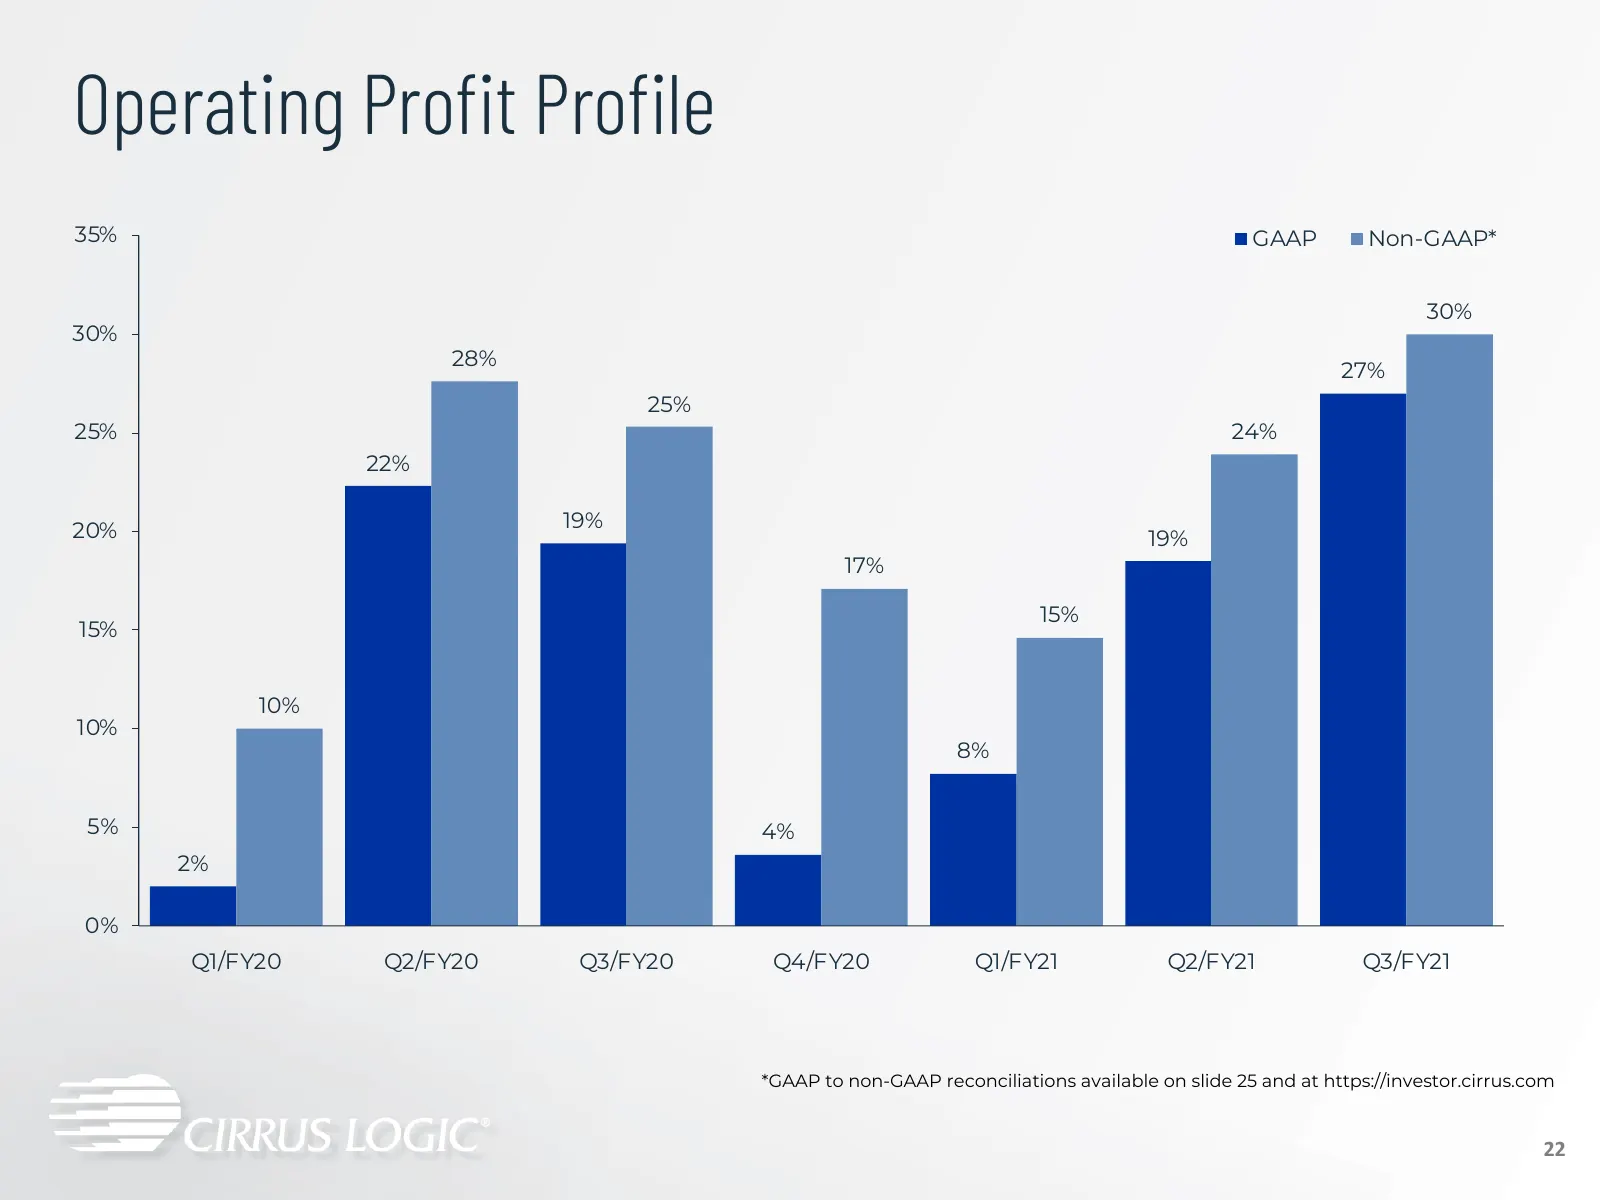
Operating Profit Profile 35% GAAP Non-GAAP* 30% 30% 28% 27% 25% 25% 24% 22% 20% 19% 19% 17% 15% 15% 10% 10% 8% 5% 4% 2% 0% Q1/FY20 Q2/FY20 Q3/FY20 Q4/FY20 Q1/FY21 Q2/FY21 Q3/FY21 *GAAP to non-GAAP reconciliations available on slide 25 and at https://investor.cirrus.com 22
Slide 23: Financial Results and Outlook
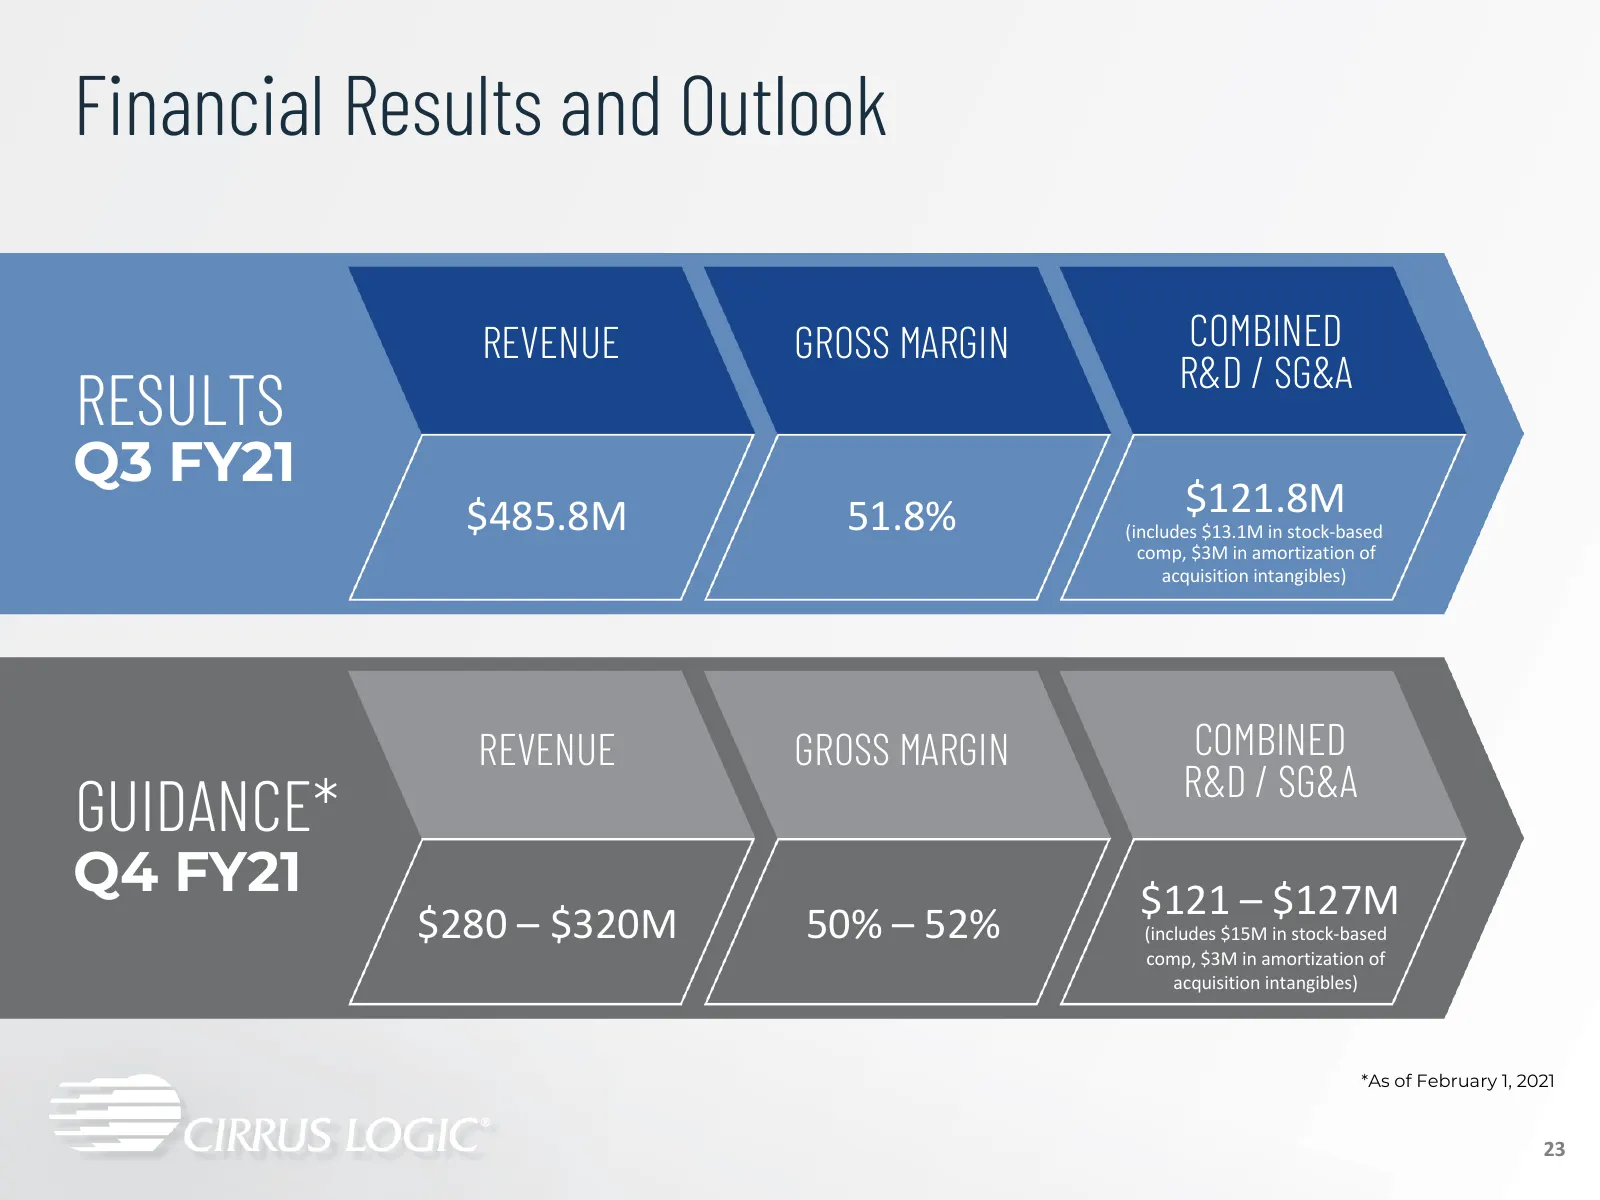
Financial Results and Outlook REVENUE GROSS MARGIN COMBINED R&D / SG&A RESULTS Q3 FY21 $485.8M 51.8% $121.8M (includes $13.1M in stock-based comp, $3M in amortization of acquisition intangibles) REVENUE GROSS MARGIN COMBINED R&D / SG&A GUIDANCE* Q4 FY21 $121 – $127M $280 – $320M 50% – 52% (includes
Slide 24: Quarterly Revenue and EPS
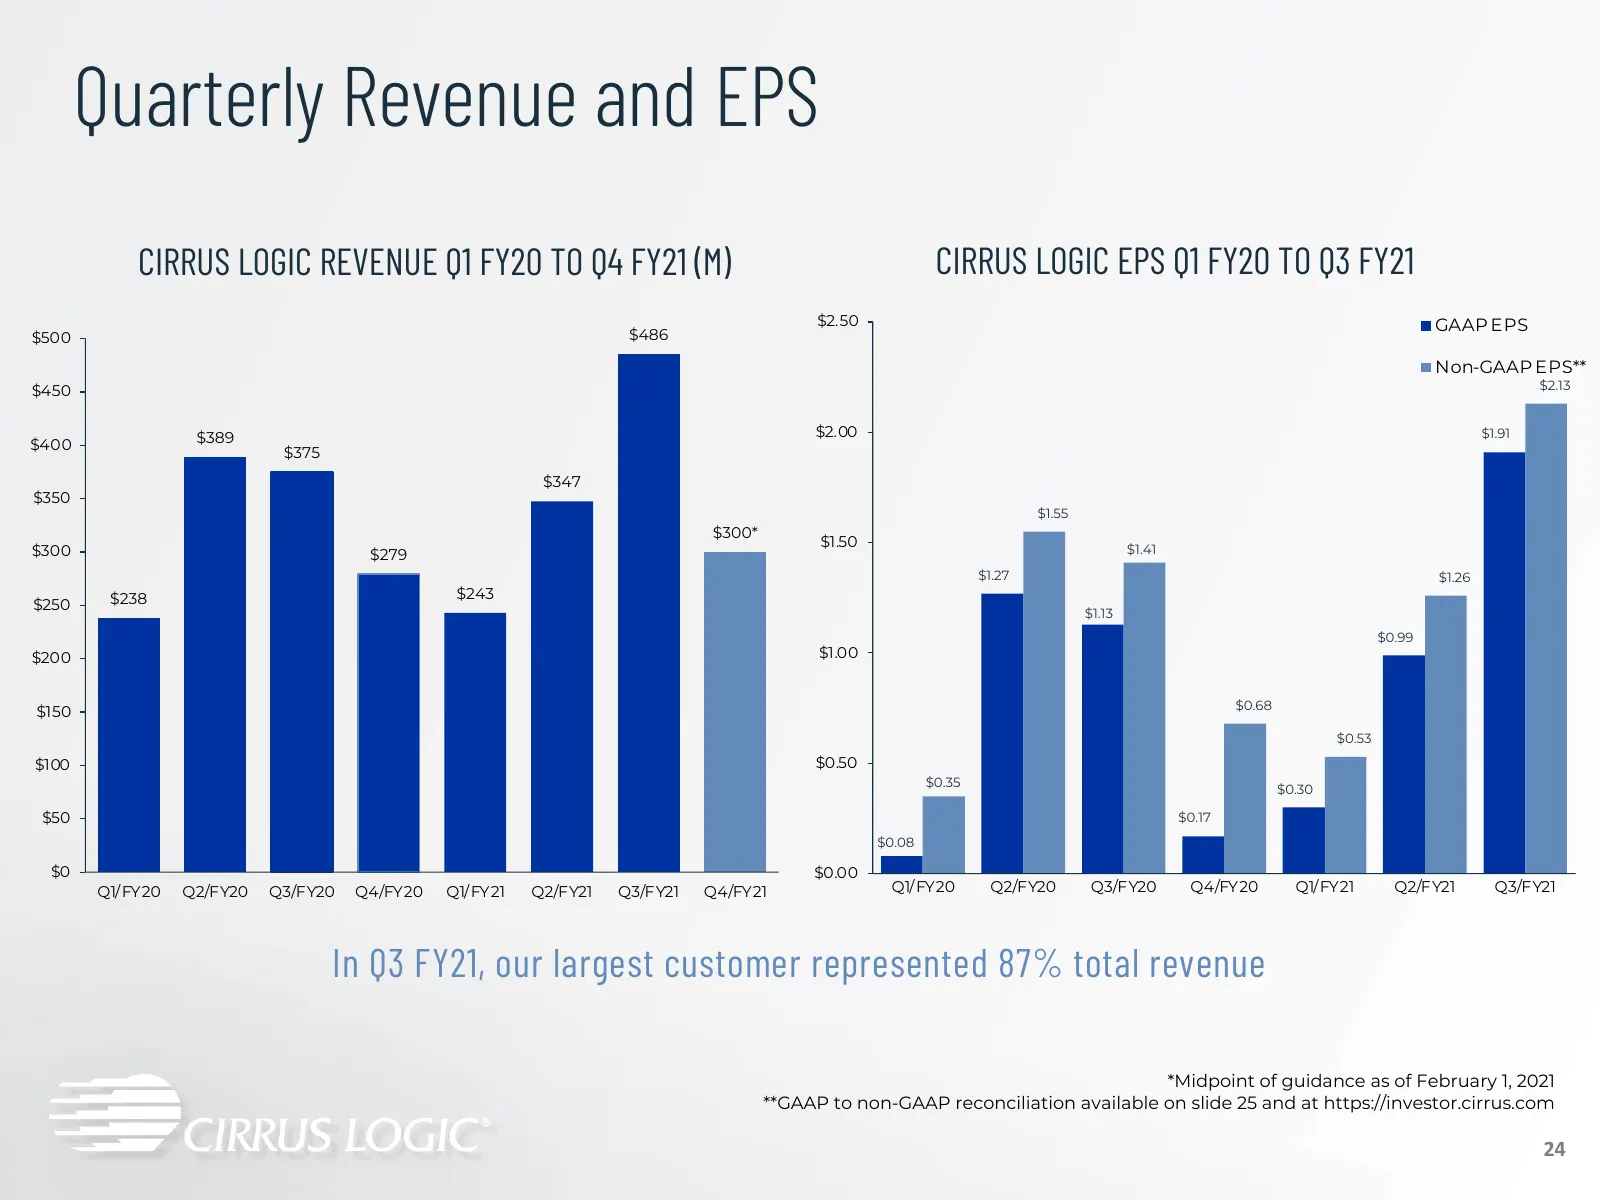
Quarterly Revenue and EPS CIRRUS LOGIC REVENUE Q1 FY20 TO Q4 FY21 (M) CIRRUS LOGIC EPS Q1 FY20 TO Q3 FY21 $2.50 GAAP EPS $500 $486 Non-GAAP EPS** $450 $2.13 $389 $2.00 $1.91 $400 $375 $347 $350 $1.55 $300* $1.50 $1.41 $300 $279 $1.27 $1.26 $238 $243 $250 $1.13 $0.99 $200 $1.00 $0.68 $150 $0.53 $100
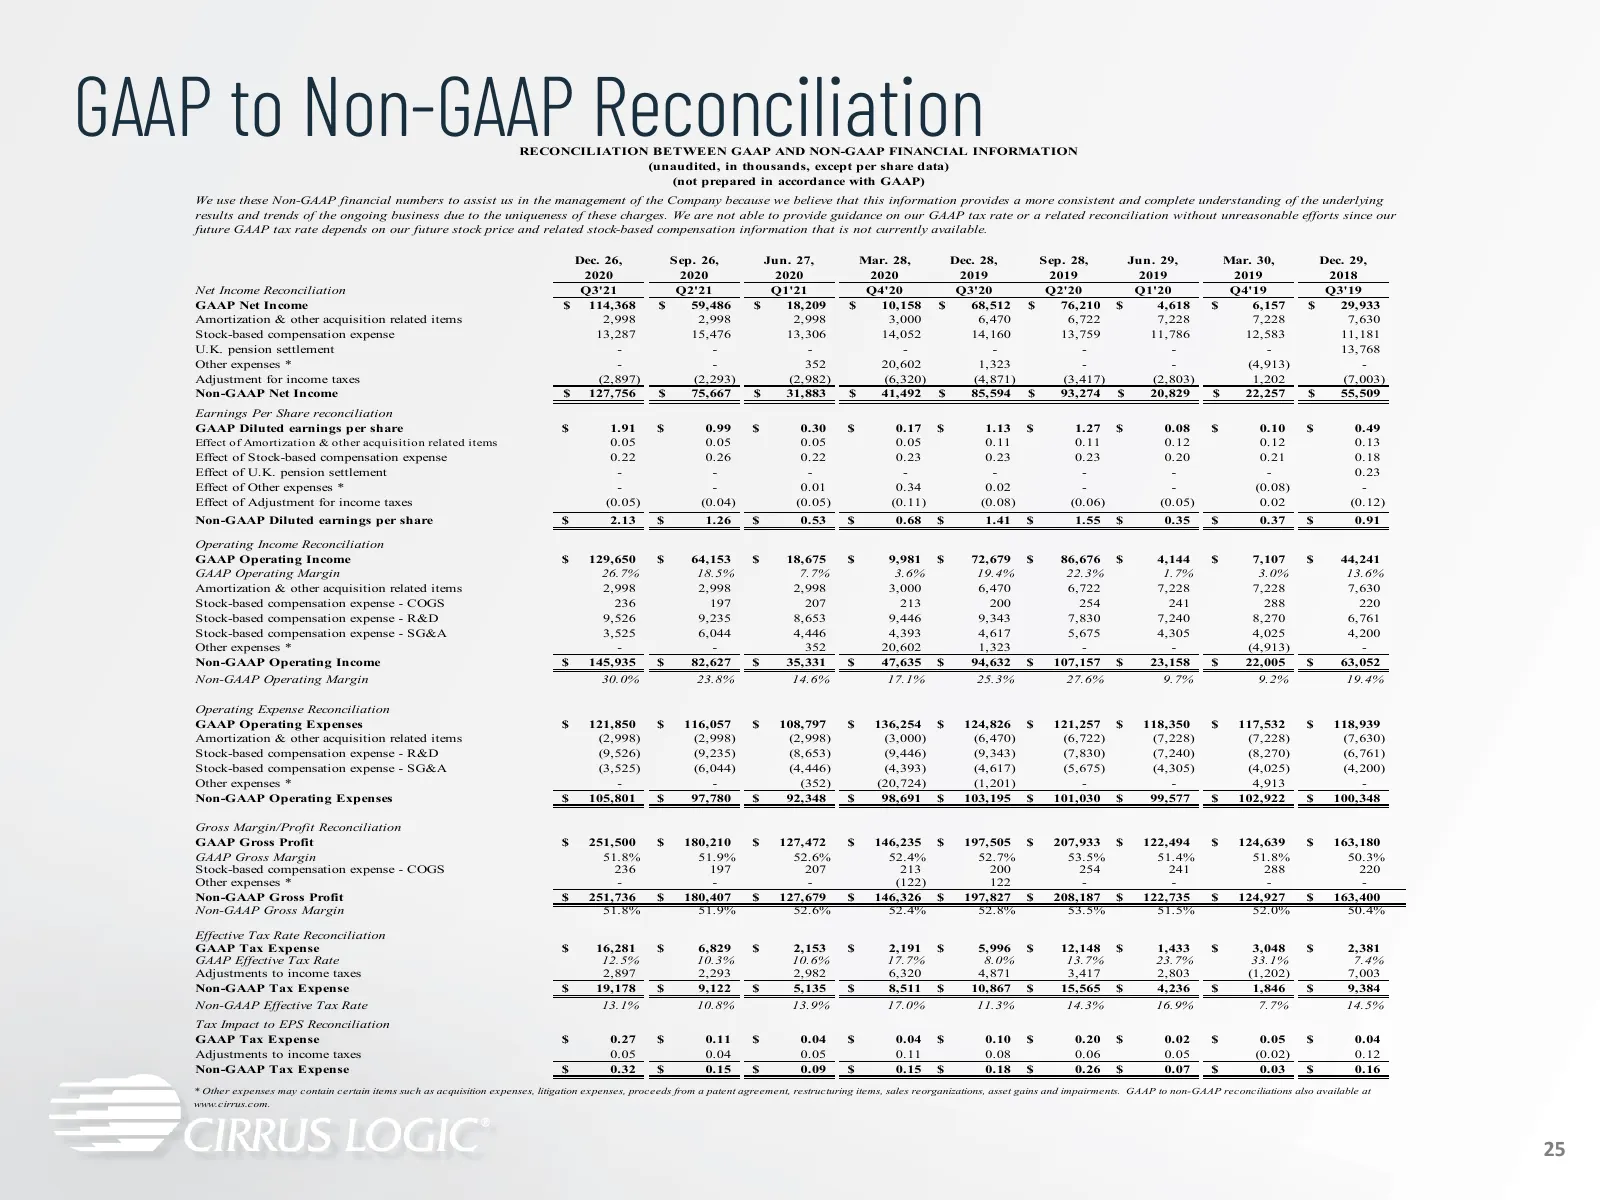
Slide 25: GAAP to Non-GAAP Reconciliation
GAAP to Non-GAAP Reconciliation RECONCILIATION BETWEEN GAAP AND NON-GAAP FINANCIAL INFORMATION (unaudited, in thousands, except per share data) (not prepared in accordance with GAAP) We use these Non-GAAP financial numbers to assist us in the management of the Company because we believe that this in

Slide 26: Cirrus Logic
GUS LOGI Gs
Source: Internet Archive copy of s21.q4cdn.com
More decks from Cirrus Logic, Inc.
 Q1 2026 Earnings Presentation26 slides · Aug 5, 2026
 Q3 2026 Earnings Presentation25 slides · Feb 3, 2026
 Q1 FY2026 Earnings Presentation25 slides · Aug 5, 2025
 Q4 2025 Earnings Presentation27 slides · May 6, 2025
 Q2 FY25 Earnings Presentation26 slides · Nov 4, 2024
 Q1 FY25 Earnings Presentation26 slides · Aug 6, 2024