Atlas Pipeline Partners L.P — Debt Investor Presentation (June 2007)
49 slides from Atlas Pipeline Partners L.P's debt investor presentation, Jun 27, 2007
Slide 1: Atlas Pipeline Partners, L.P. Public Lender Presentation
Exhibit 99.1 X X X X x Atlas Pipeline Partners, L.P. Public Lender Presentation June 27, 2007
Slide 2: Safe Harbor
Safe Harbor THE WORDS“BELIEVES,ANTICIPATES,EXPECTS”AND SIMILAR EXPRESSIONSARE INTENDEDTO IDENTIFY FORWARD LOOKING STATEMENTS. SUCH STATEMENTS ARE SUBJECT TO CERTAIN RISKS AND UNCERTAINTIES, WHICH COULD CAUSE ACTUAL RESULTS TO DIFFER MATERIALLY FROM THOSE PROJECTED IN THE FORWARD LOOKING STATEMENTS.
Slide 3: Introduction
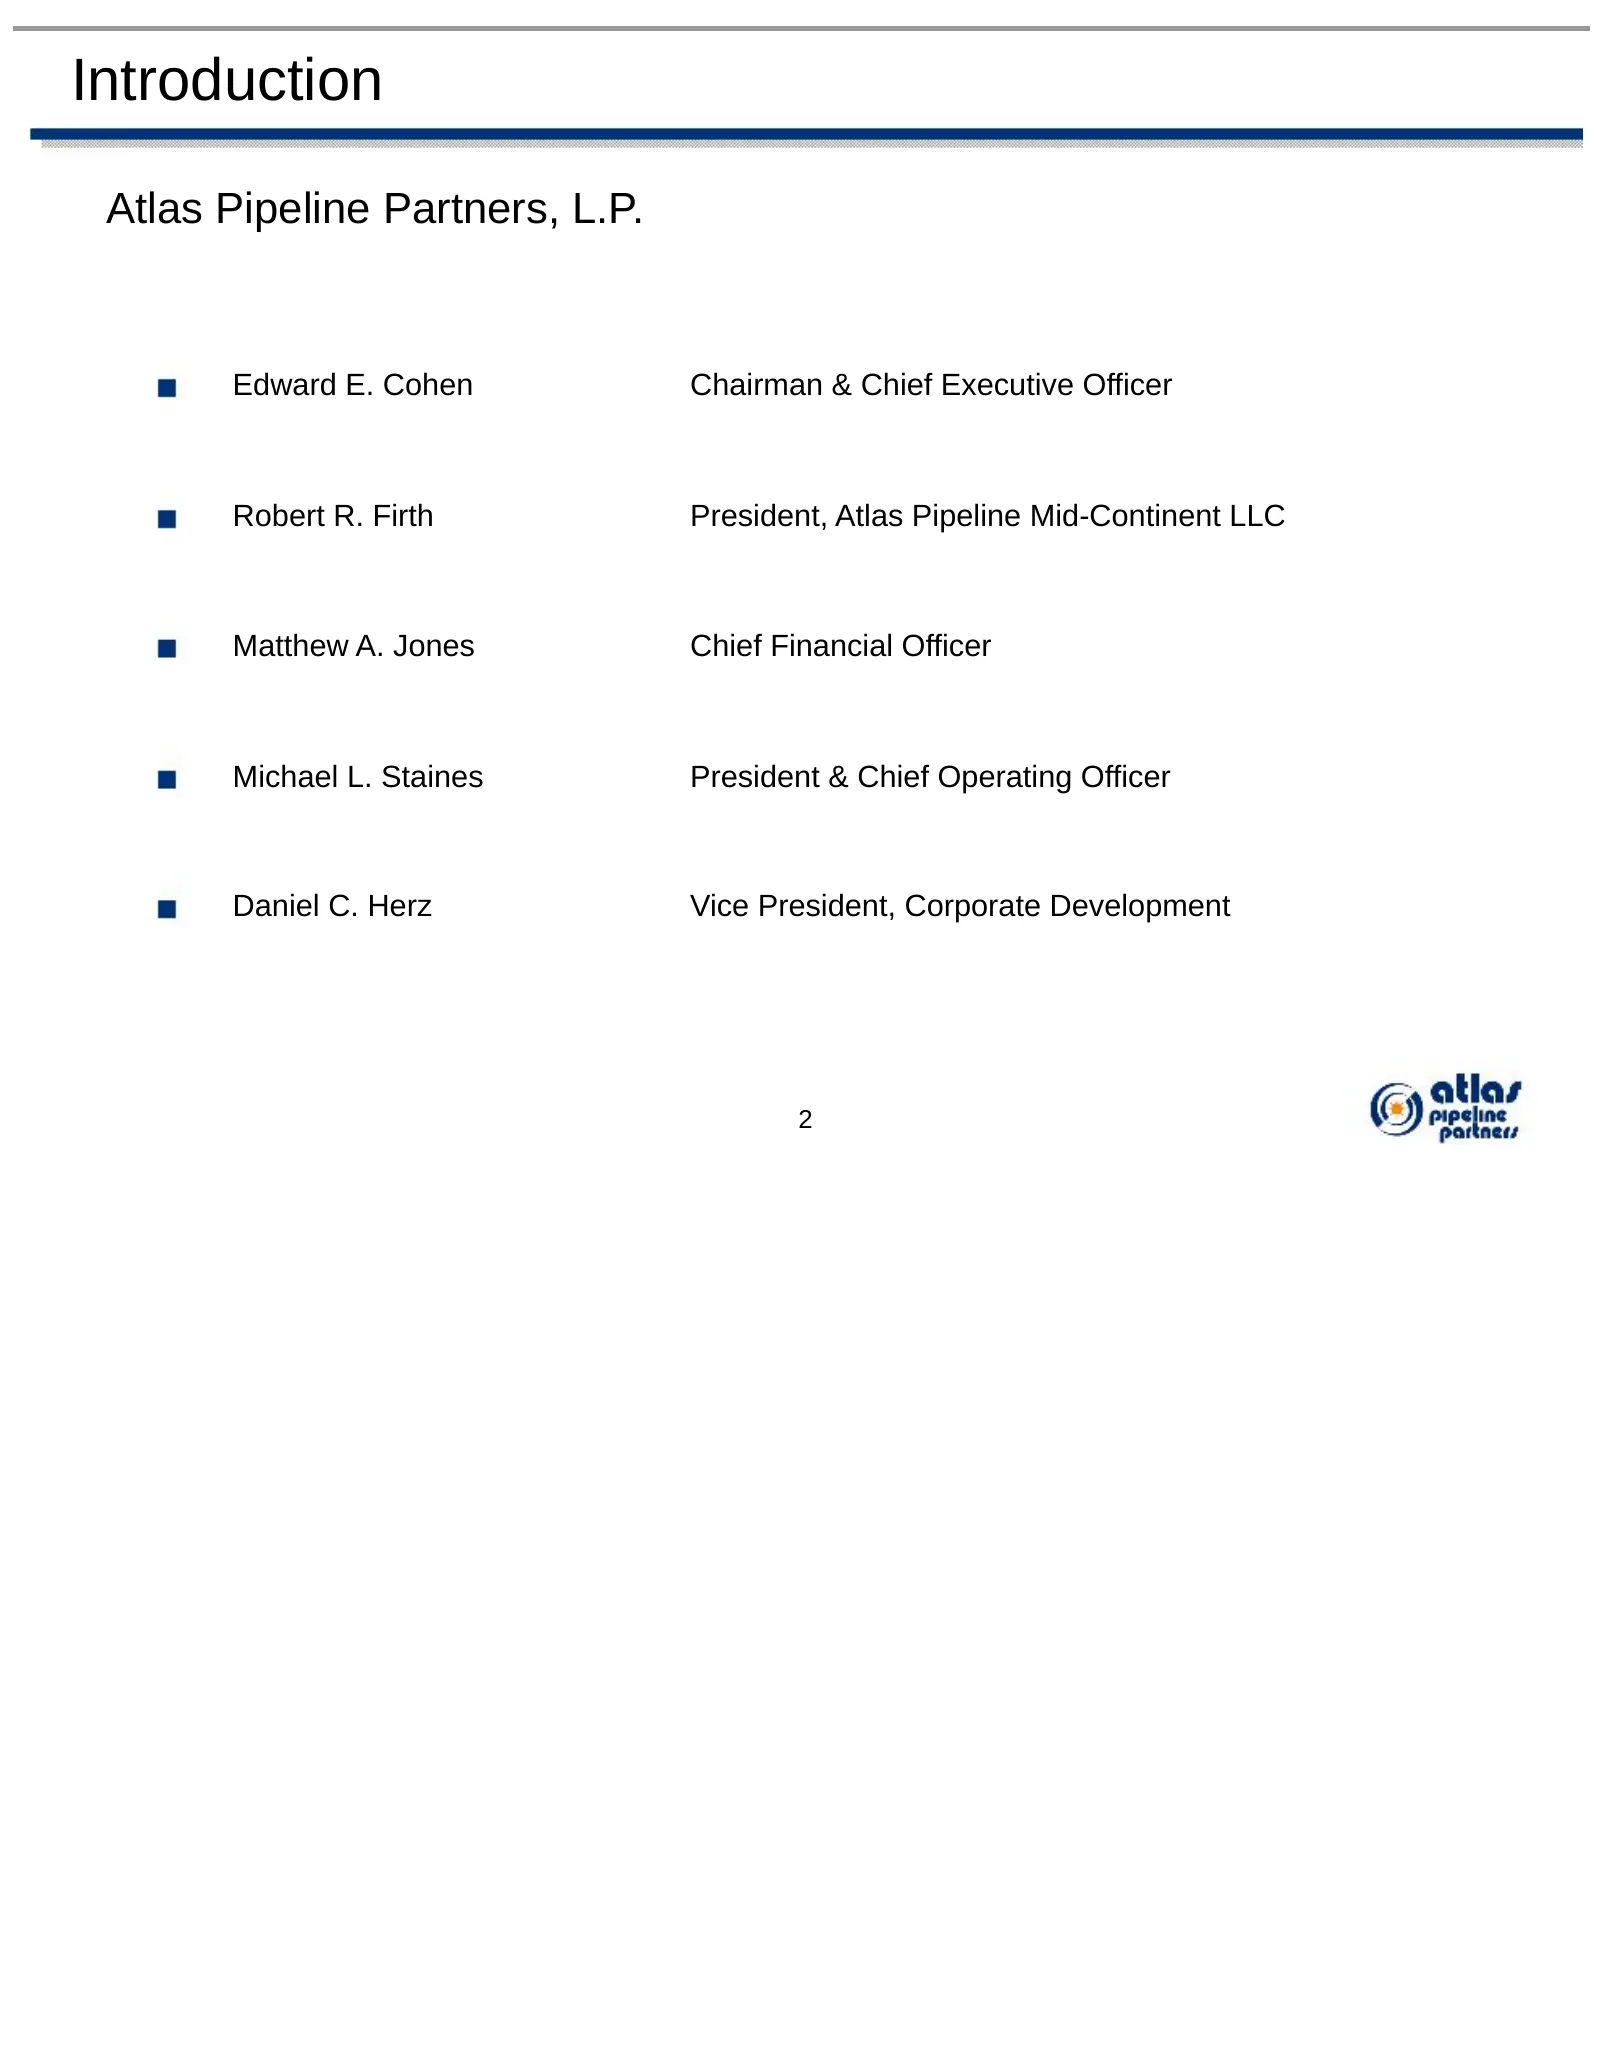
Introduction Atlas Pipeline Partners, L.P. Edward E. Cohen Chairman & Chief Executive Officer Robert R. Firth President, Atlas Pipeline Mid-Continent LLC Matthew A. Jones Chief Financial Officer Michael L. Staines President & Chief Operating Officer Daniel C. Herz Vice President, Corporate Developme
Slide 4: Transaction Overview
* * * * * * * * * * * * * * * * * * * * * * * * Transaction Overview
Slide 5: Transaction Overview
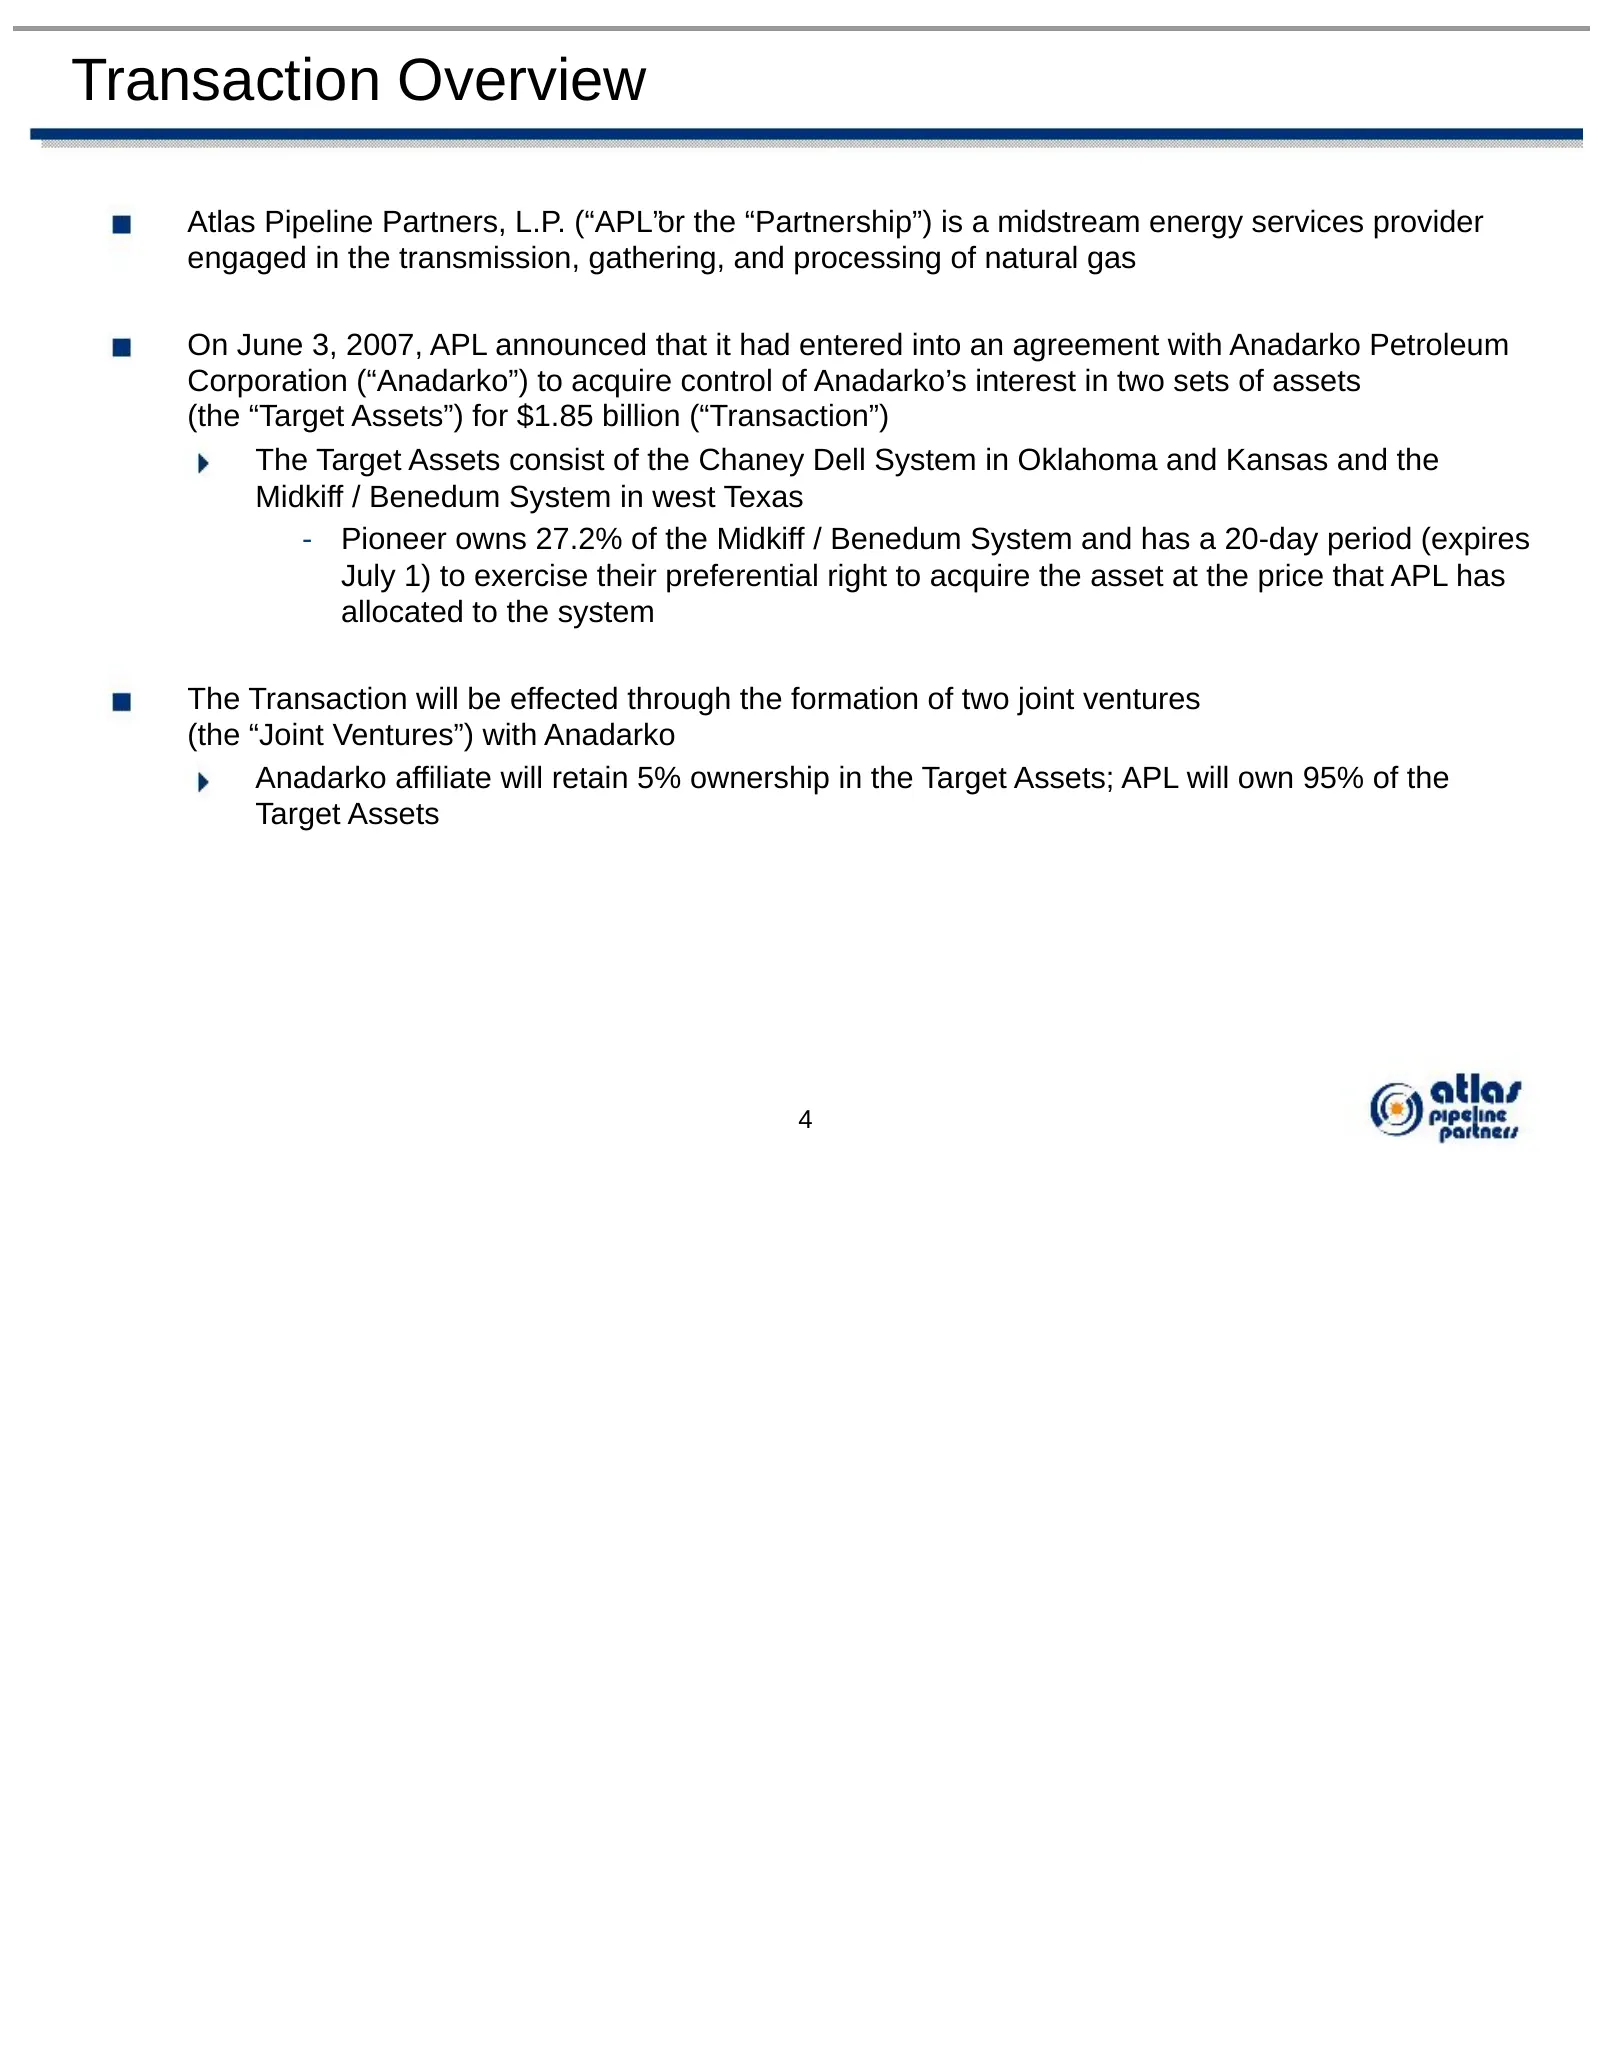
Transaction Overview Atlas Pipeline Partners, L.P. (“APL”or the “Partnership”) is a midstream energy services provider engaged in the transmission, gathering, and processing of natural gas On June 3, 2007, APL announced that it had entered into an agreement with Anadarko Petroleum Corporation (“Anad
Slide 6: Transaction Overview
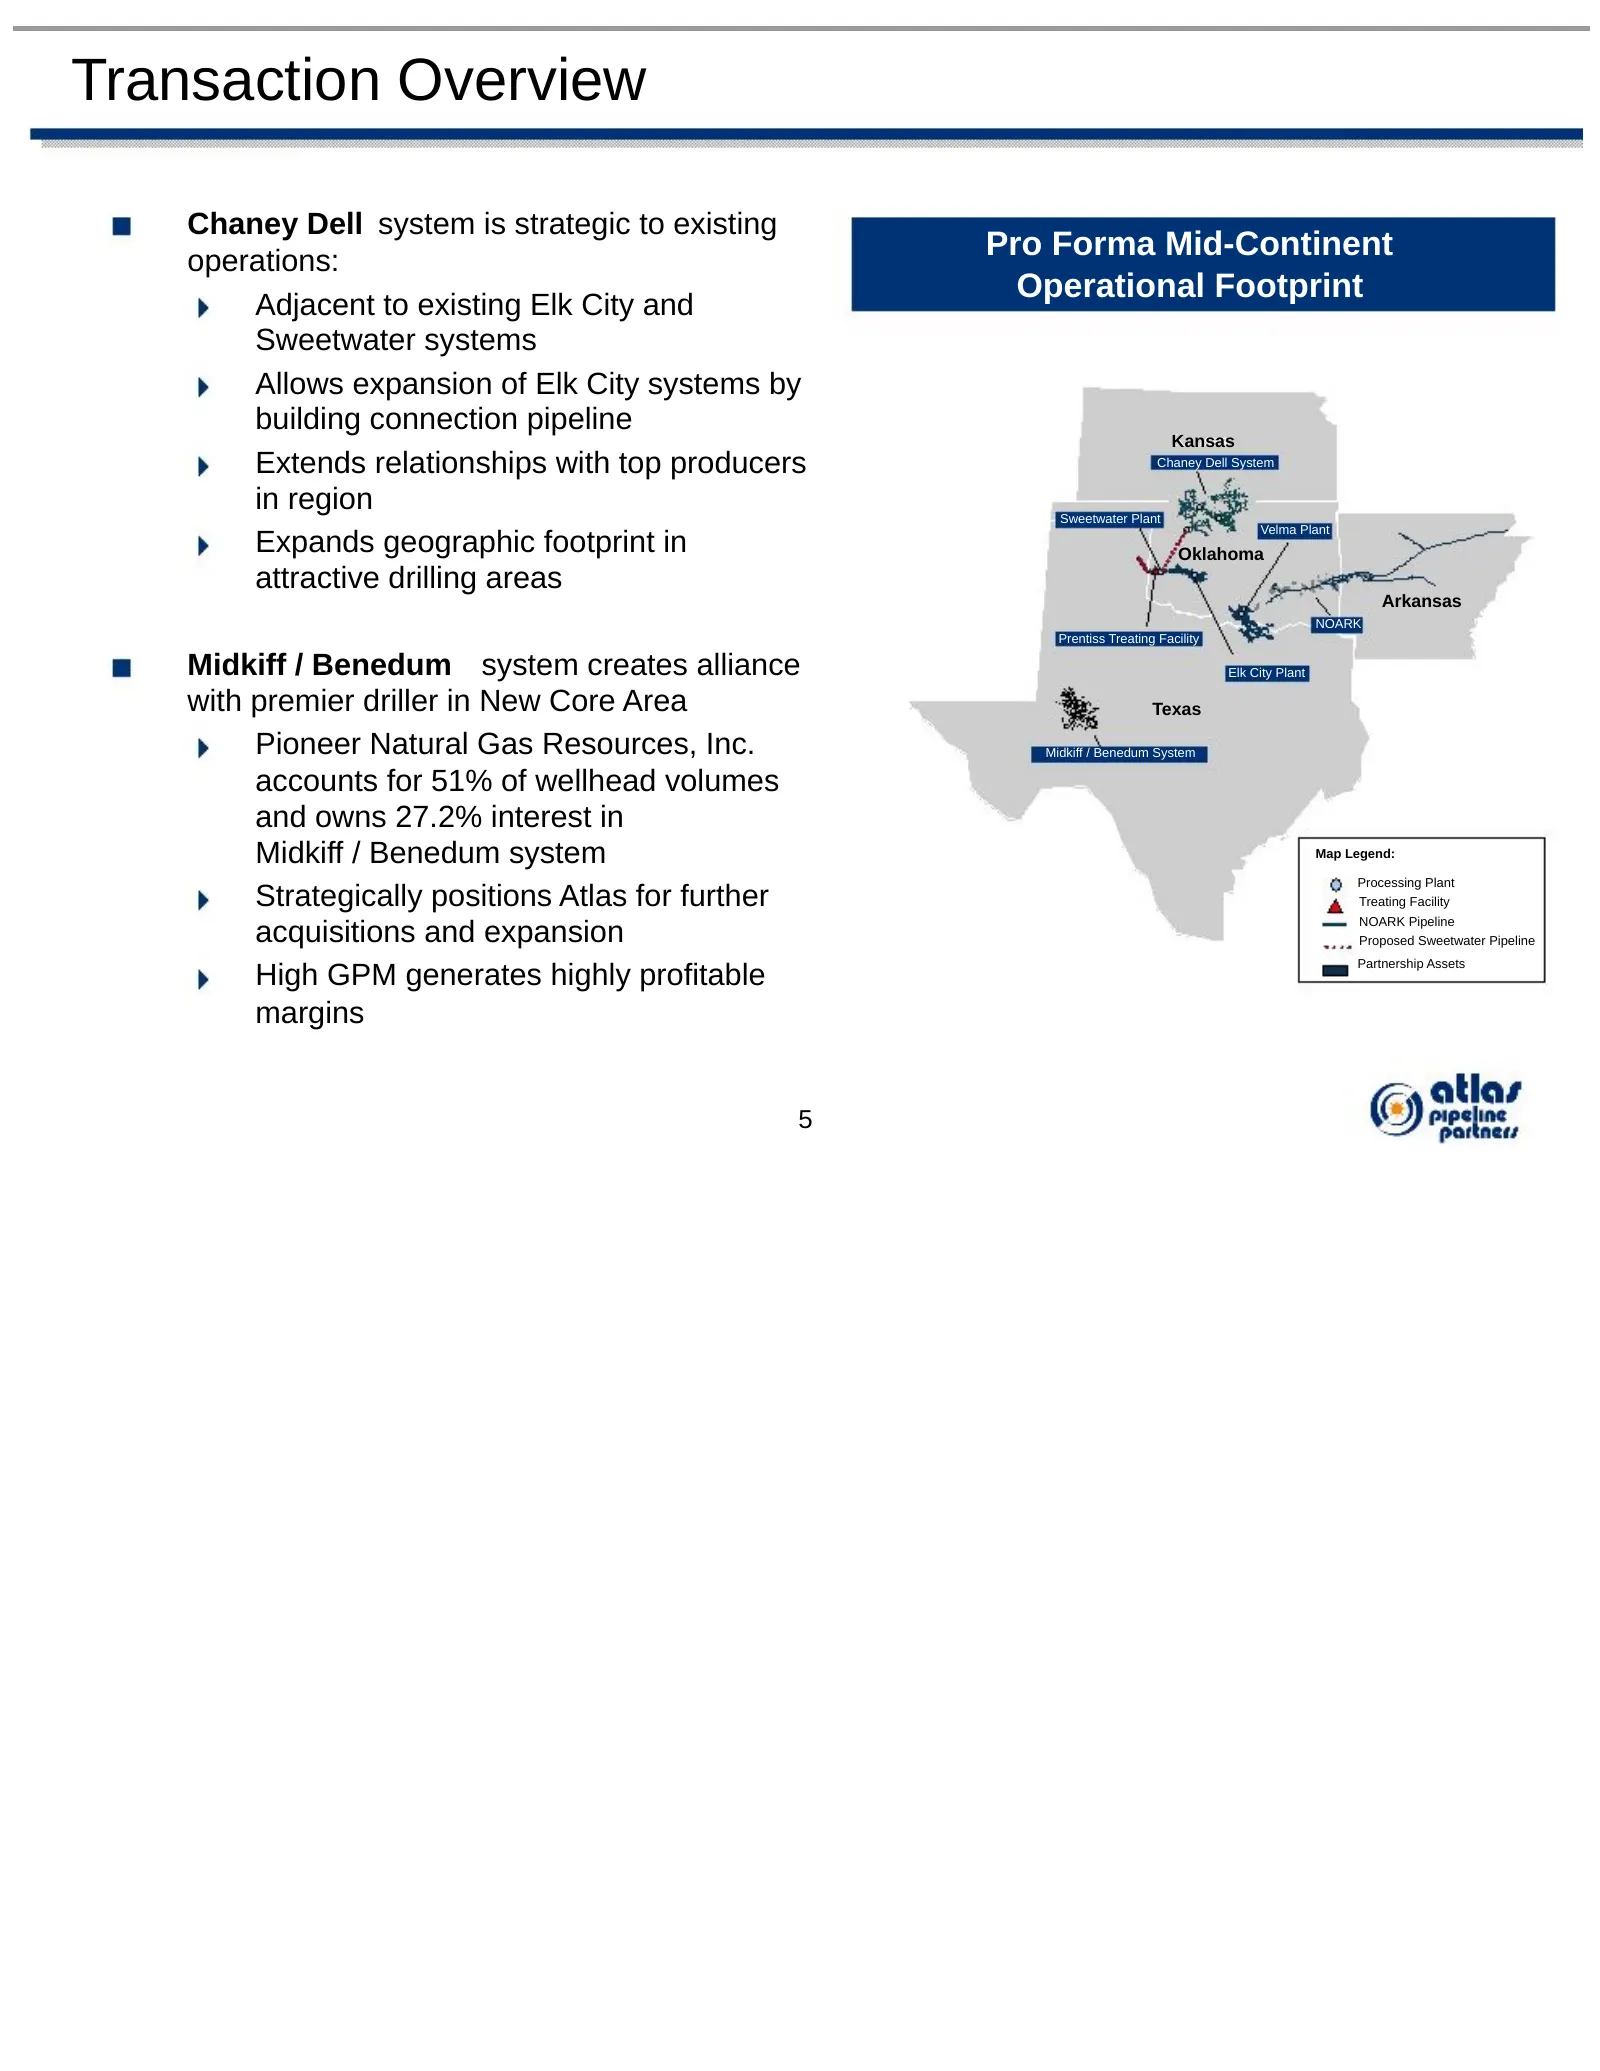
Transaction Overview Chaney Dell system is strategic to existing operations: Pro Forma Mid-Continent Operational Footprint Adjacent to existing Elk City and Sweetwater systems Allows expansion of Elk City systems by building connection pipeline Kansas Kansas Extends relationships with top producers
Slide 7: Strategic Acquisition Highlights
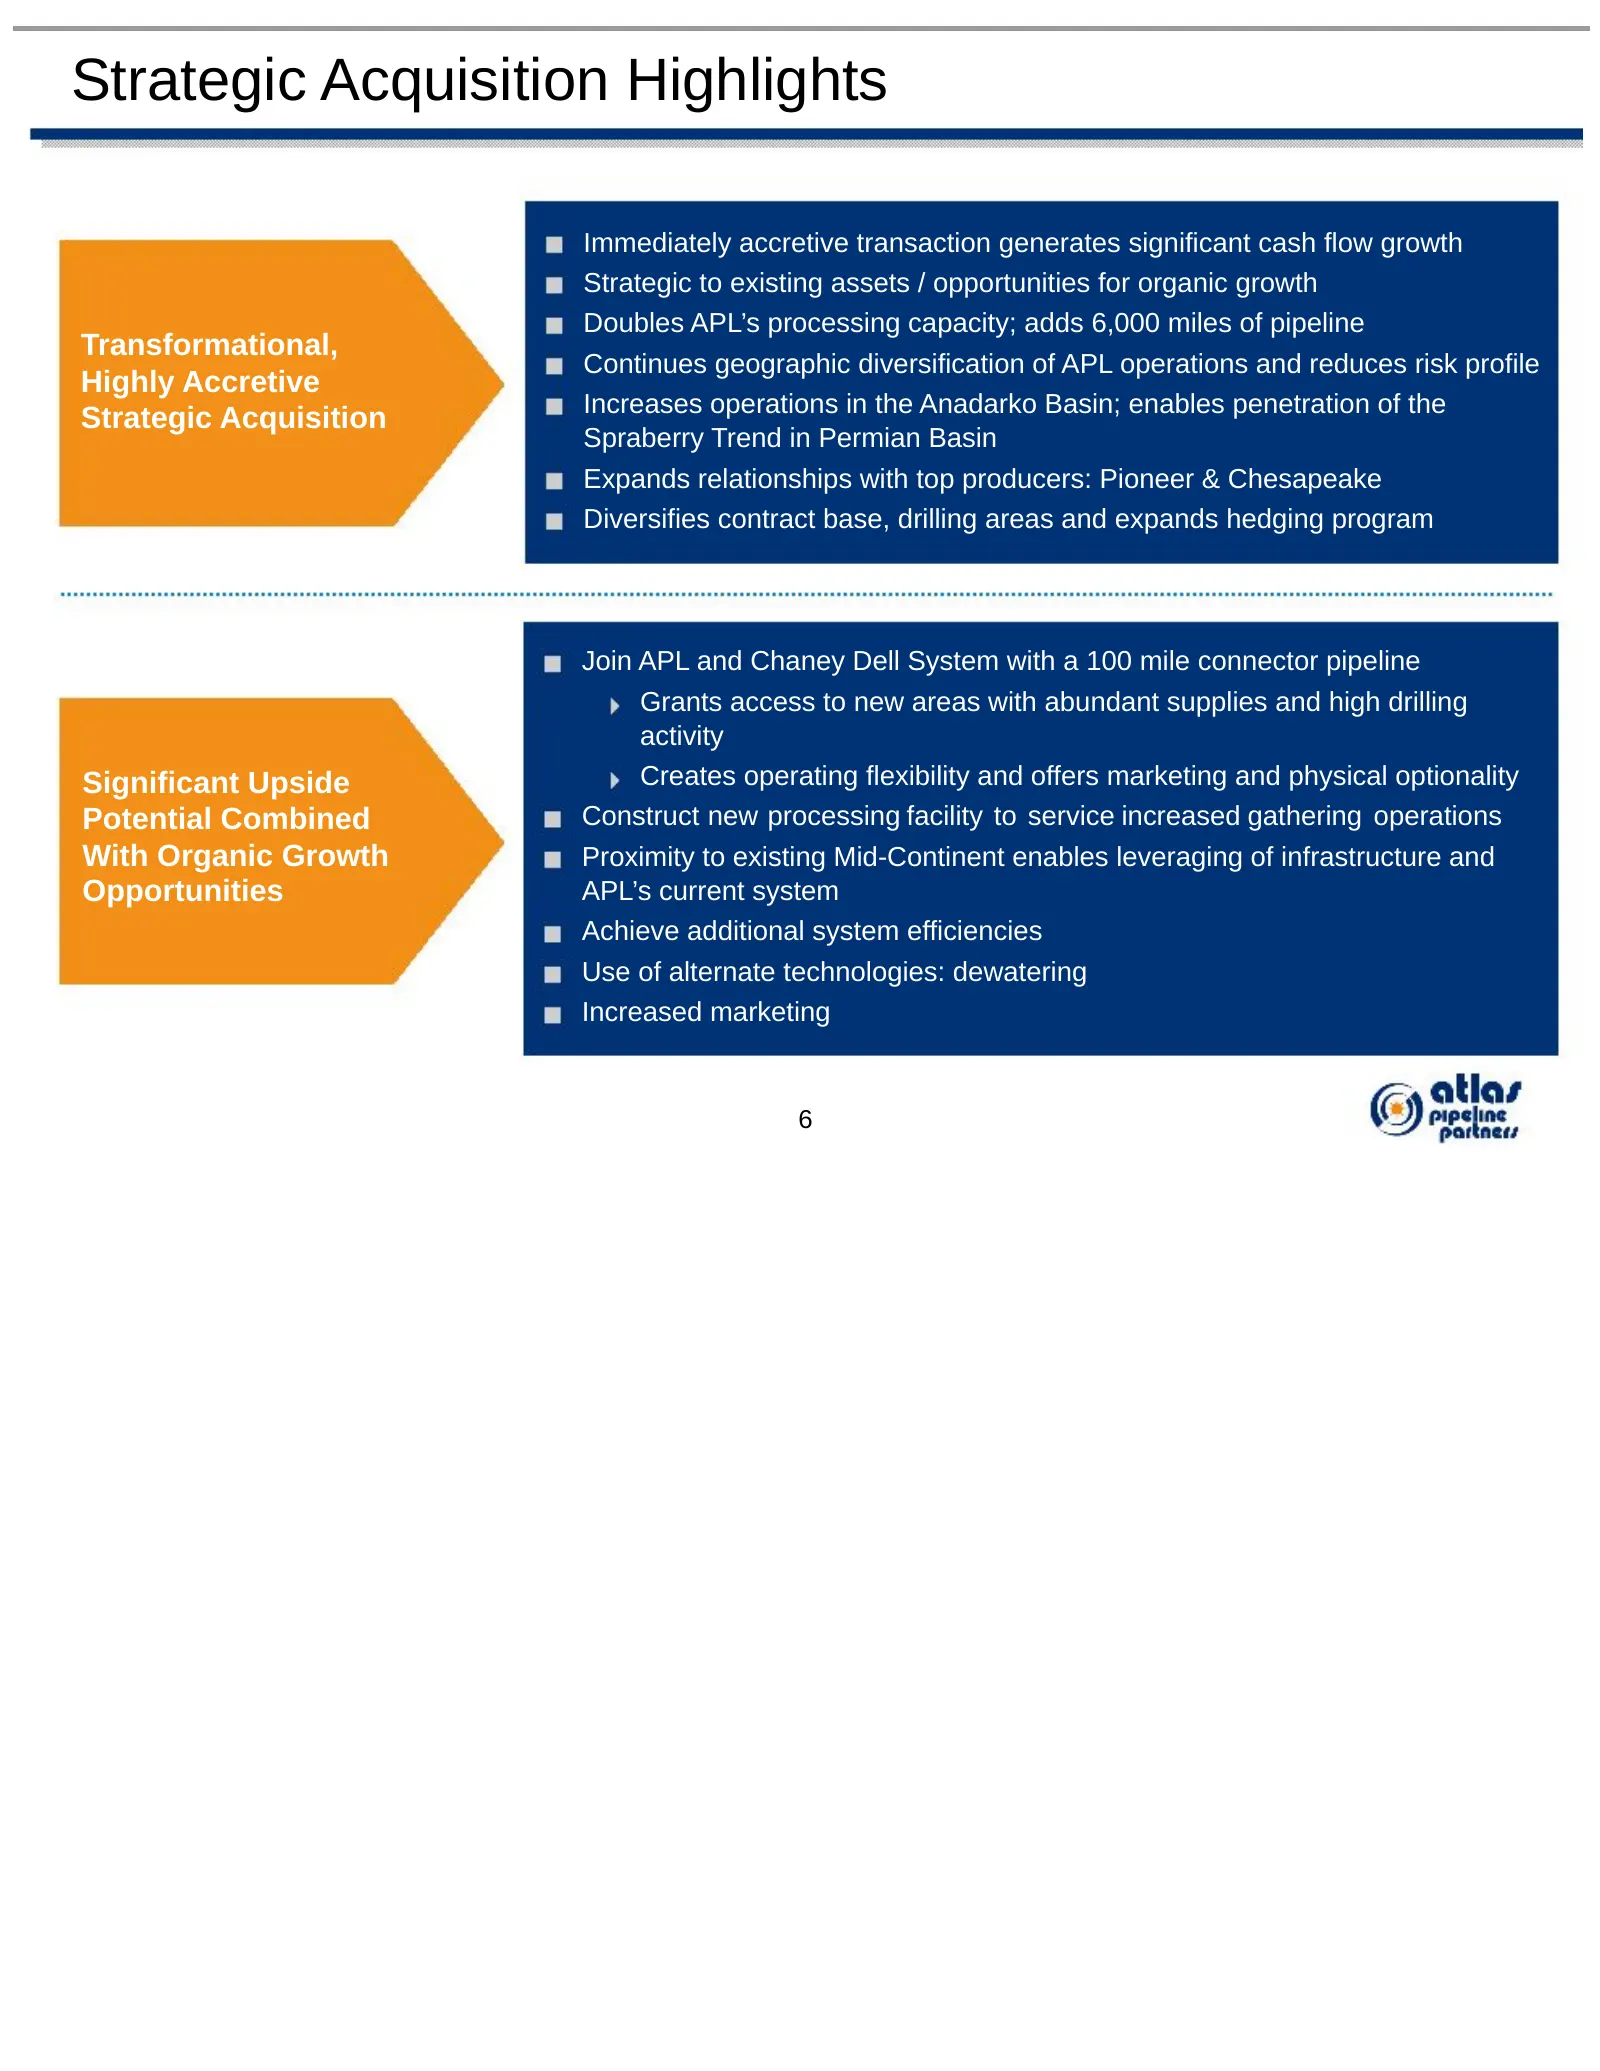
Strategic Acquisition Highlights Immediately accretive transaction generates significant cash flow growth Strategic to existing assets / opportunities for organic growth Doubles APL’s processing capacity; adds 6,000 miles of pipeline Transformational, Continues geographic diversification of APL oper
Slide 8: Overview of Standalone Atlas Pipeline Partners, L.P.
* * * * * * * * * * * * * * * * * * * * * * * * Overview of Standalone Atlas Pipeline Partners, L.P.
Slide 9: Standalone Geographic Footprint
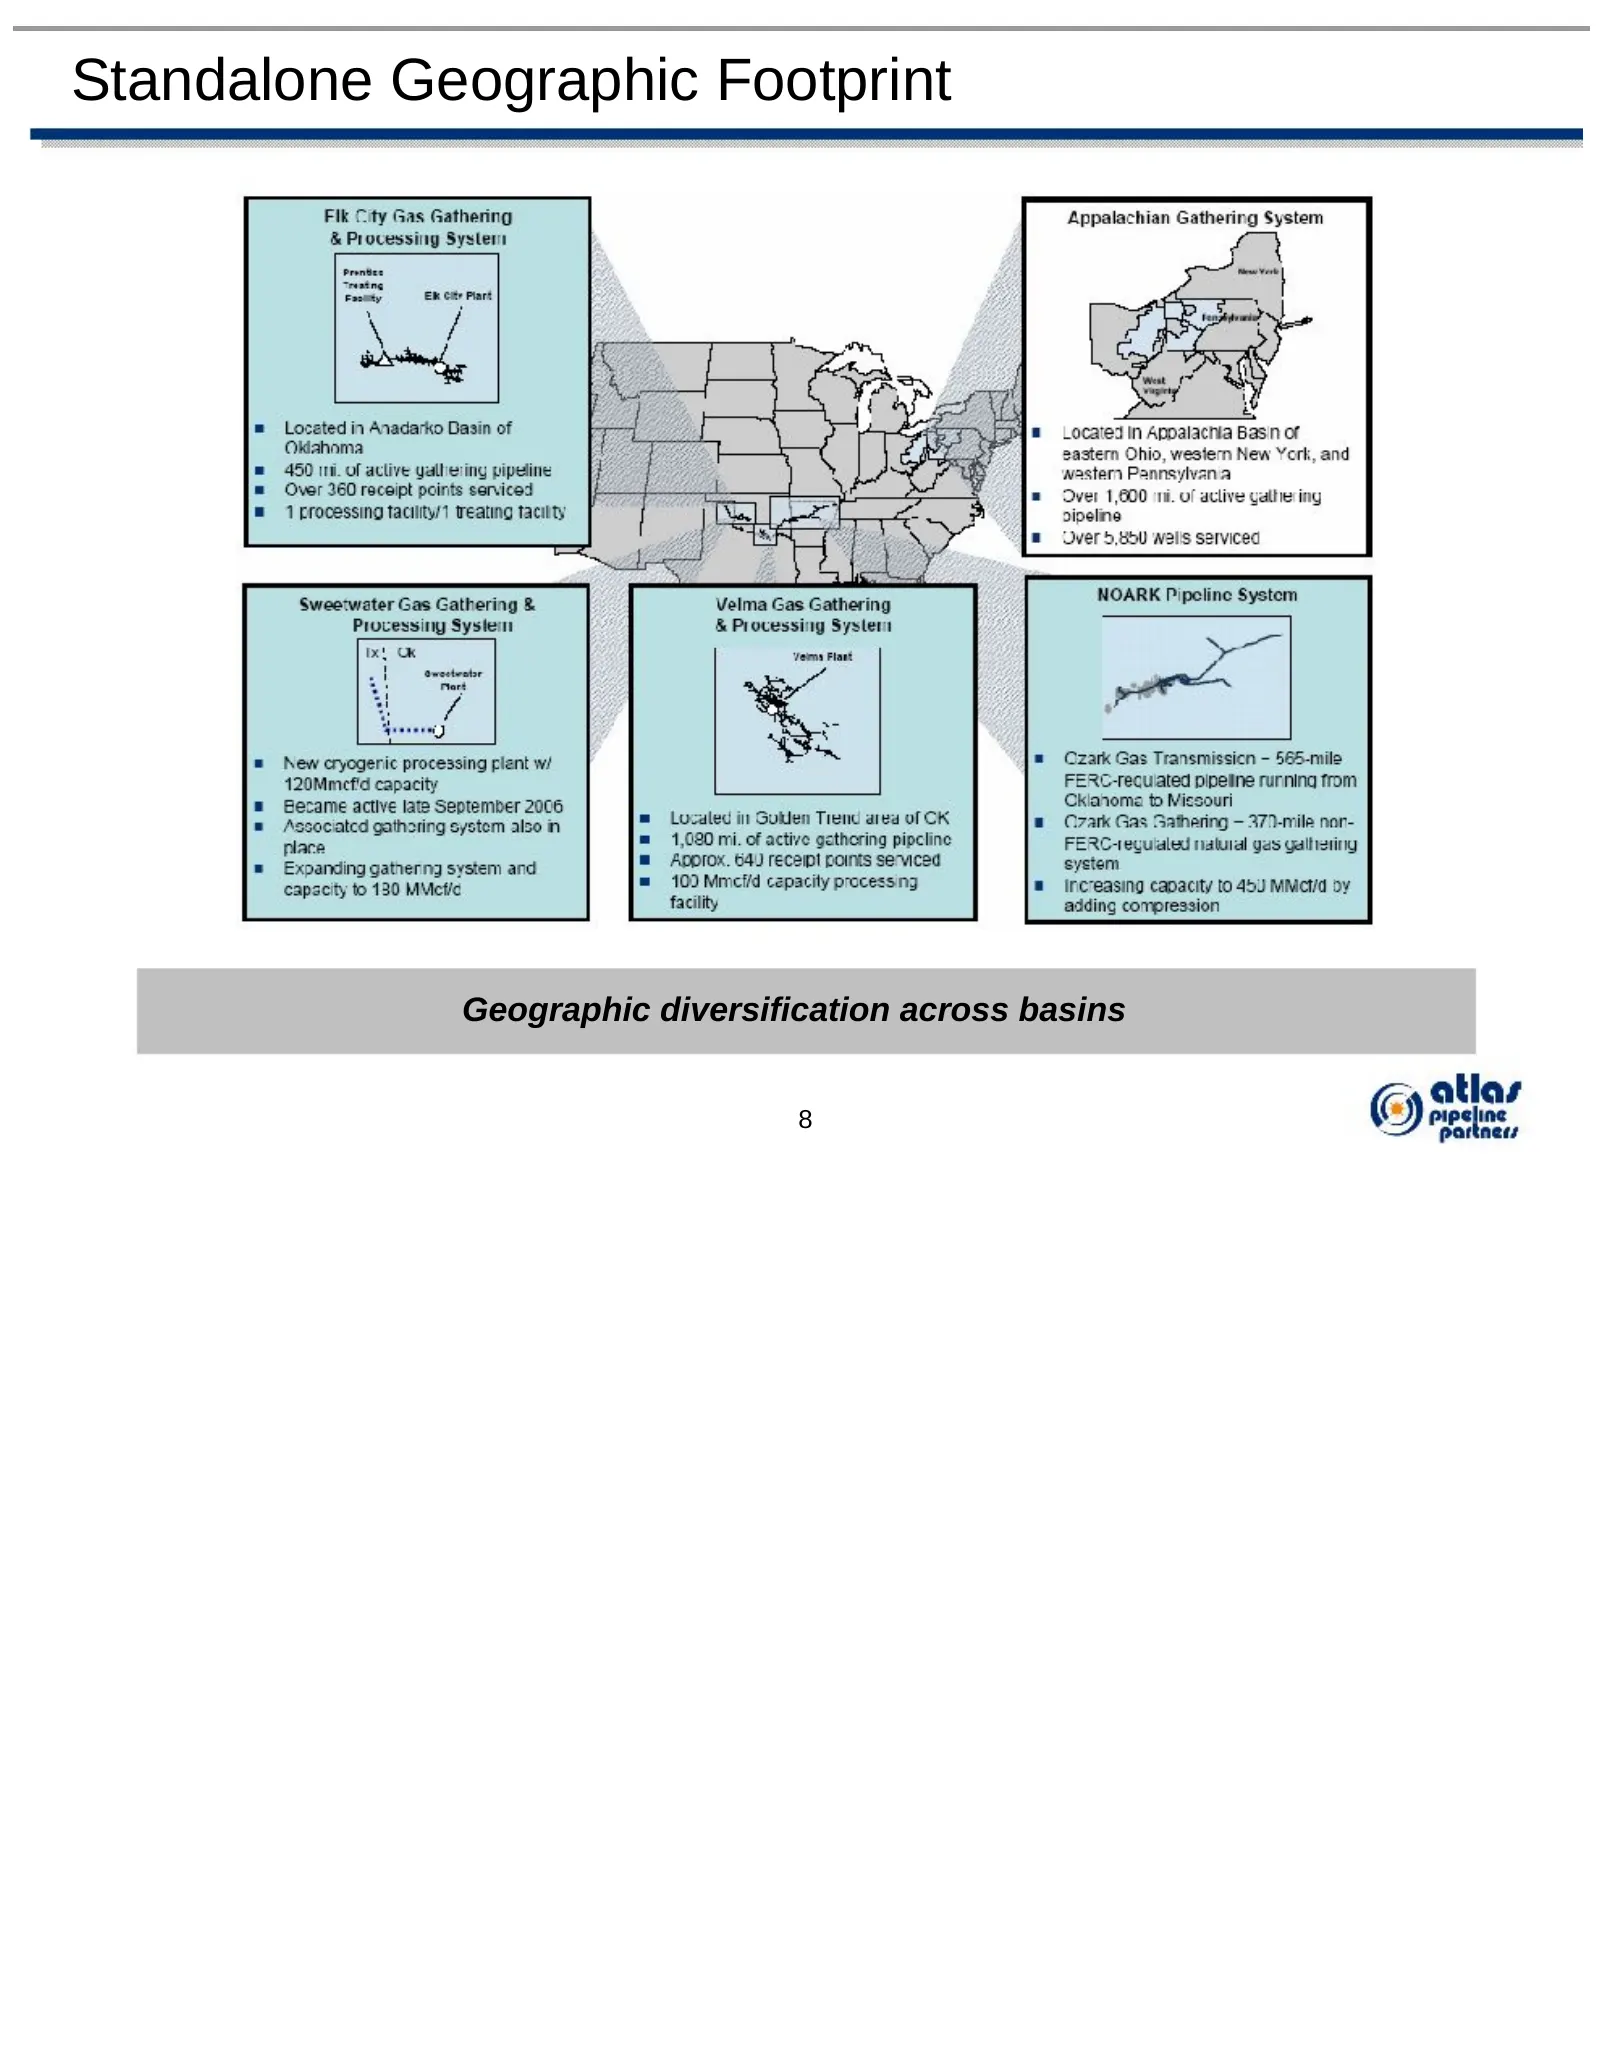
Standalone Geographic Footprint Geographic diversification across basins 8
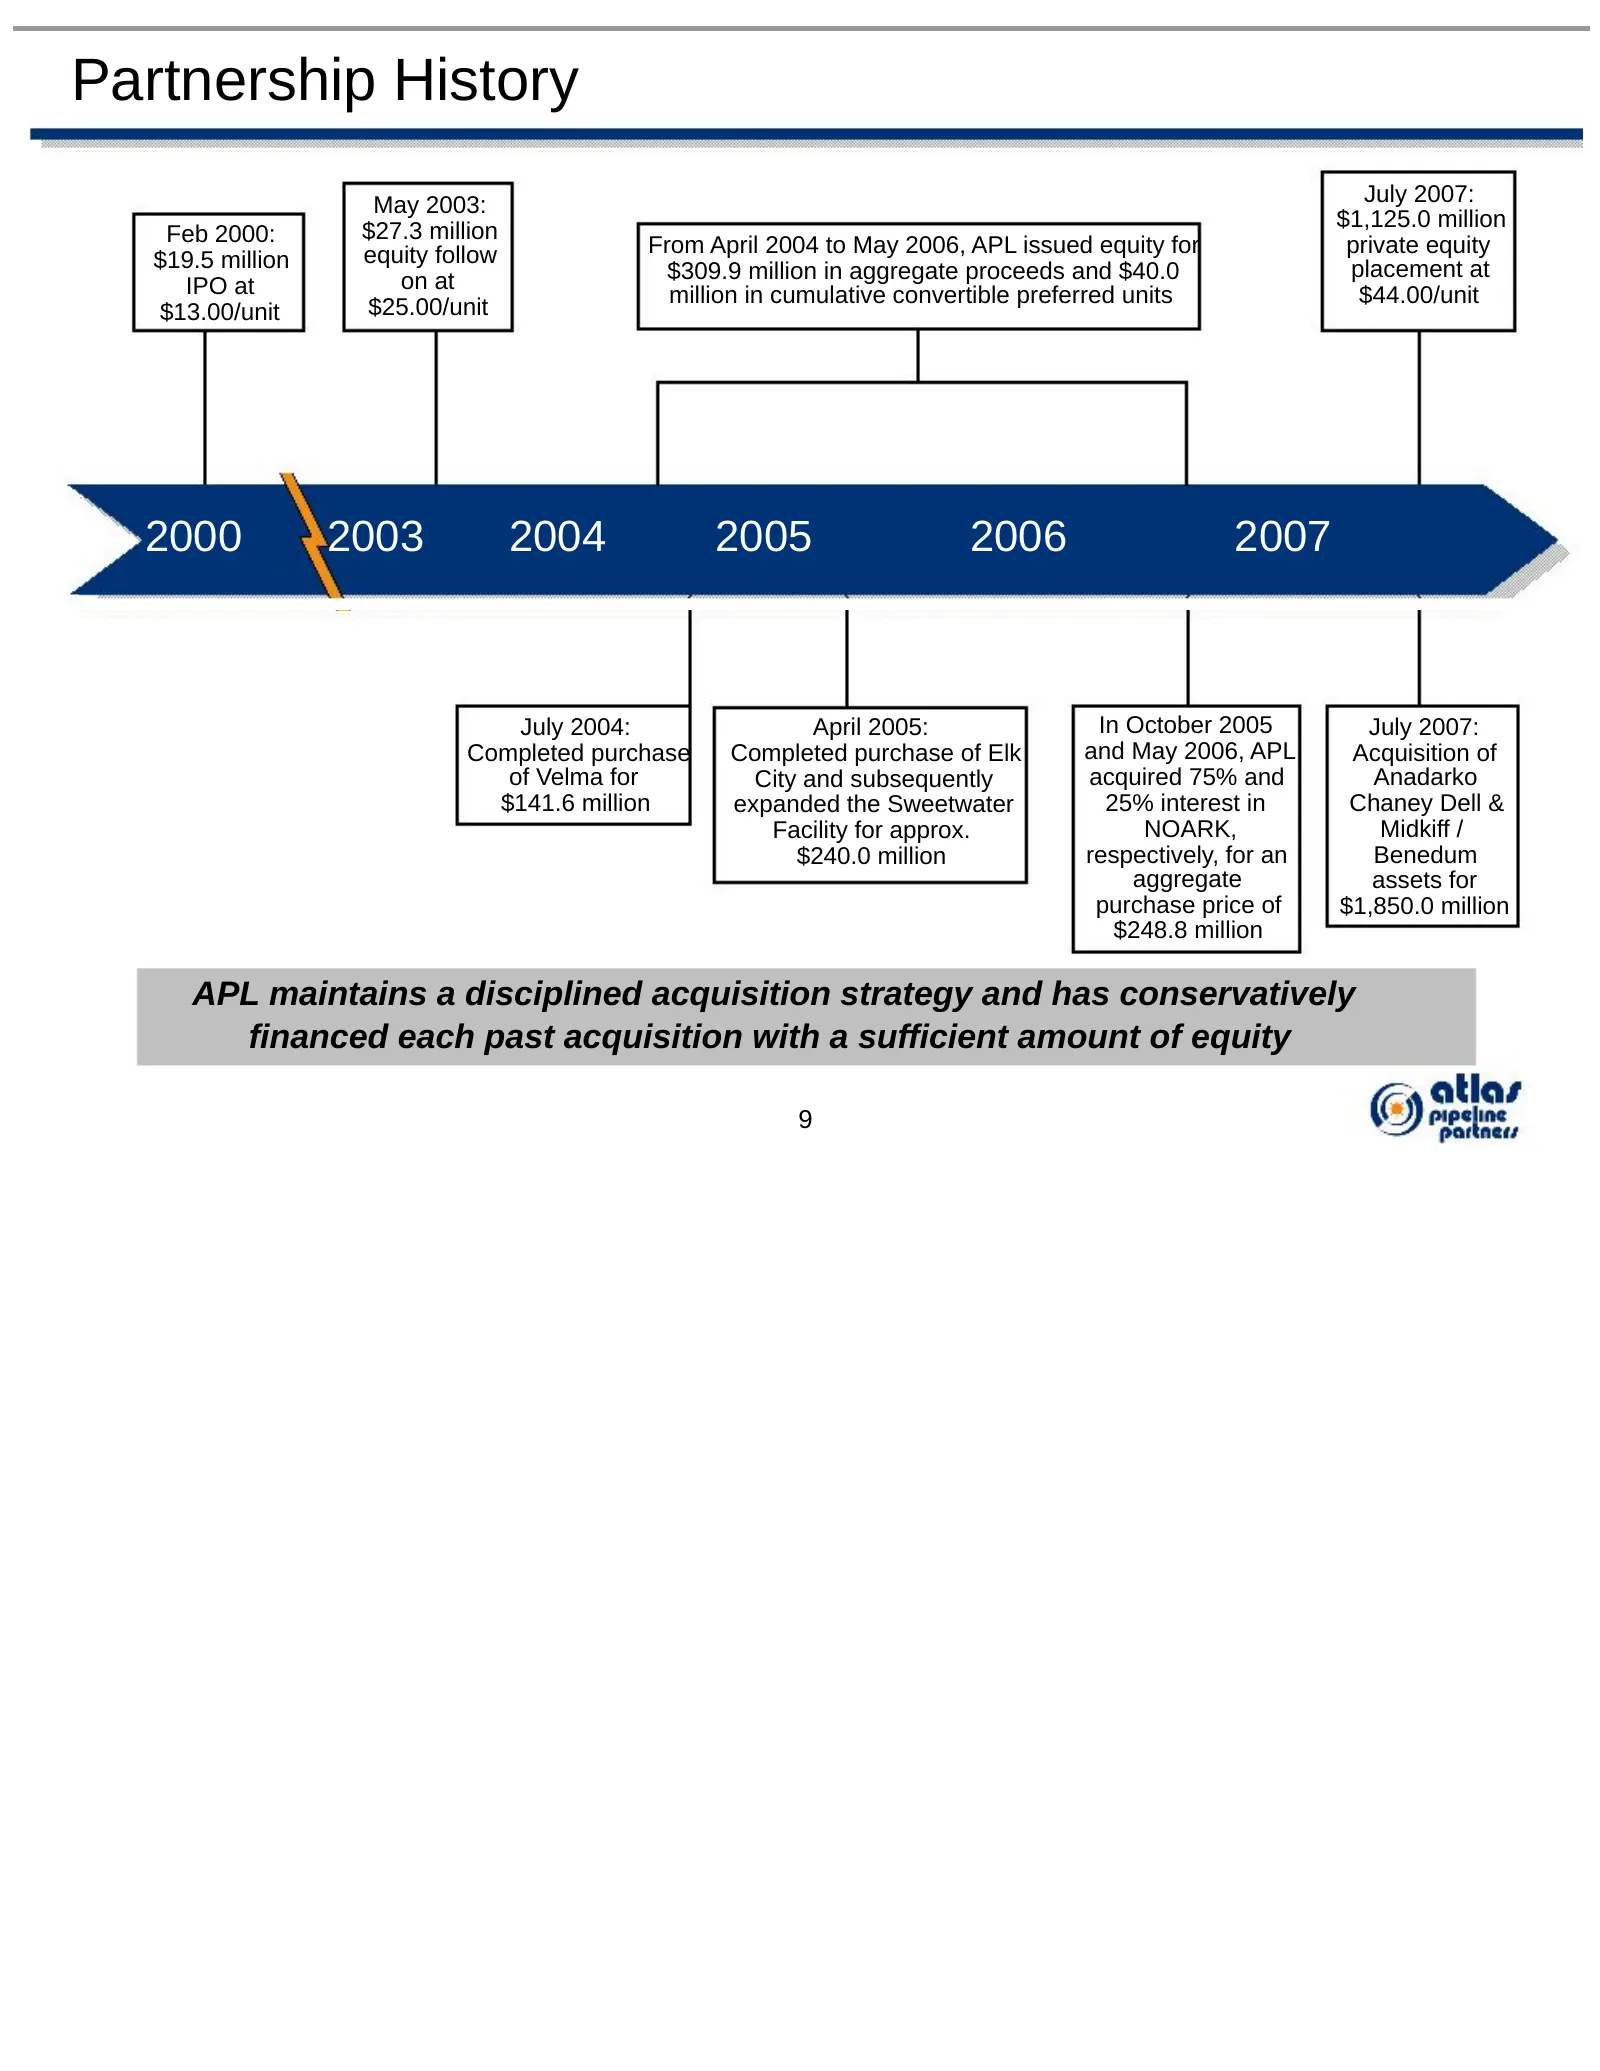
Slide 10: Partnership History
Partnership History May 2003: July 2007: $27.3 million $1,125.0 million Feb 2000: From April 2004 to May 2006, APL issued equity for private equity $19.5 million equity follow on at $309.9 million in aggregate proceeds and $40.0 placement at IPO at million in cumulative convertible preferred units $
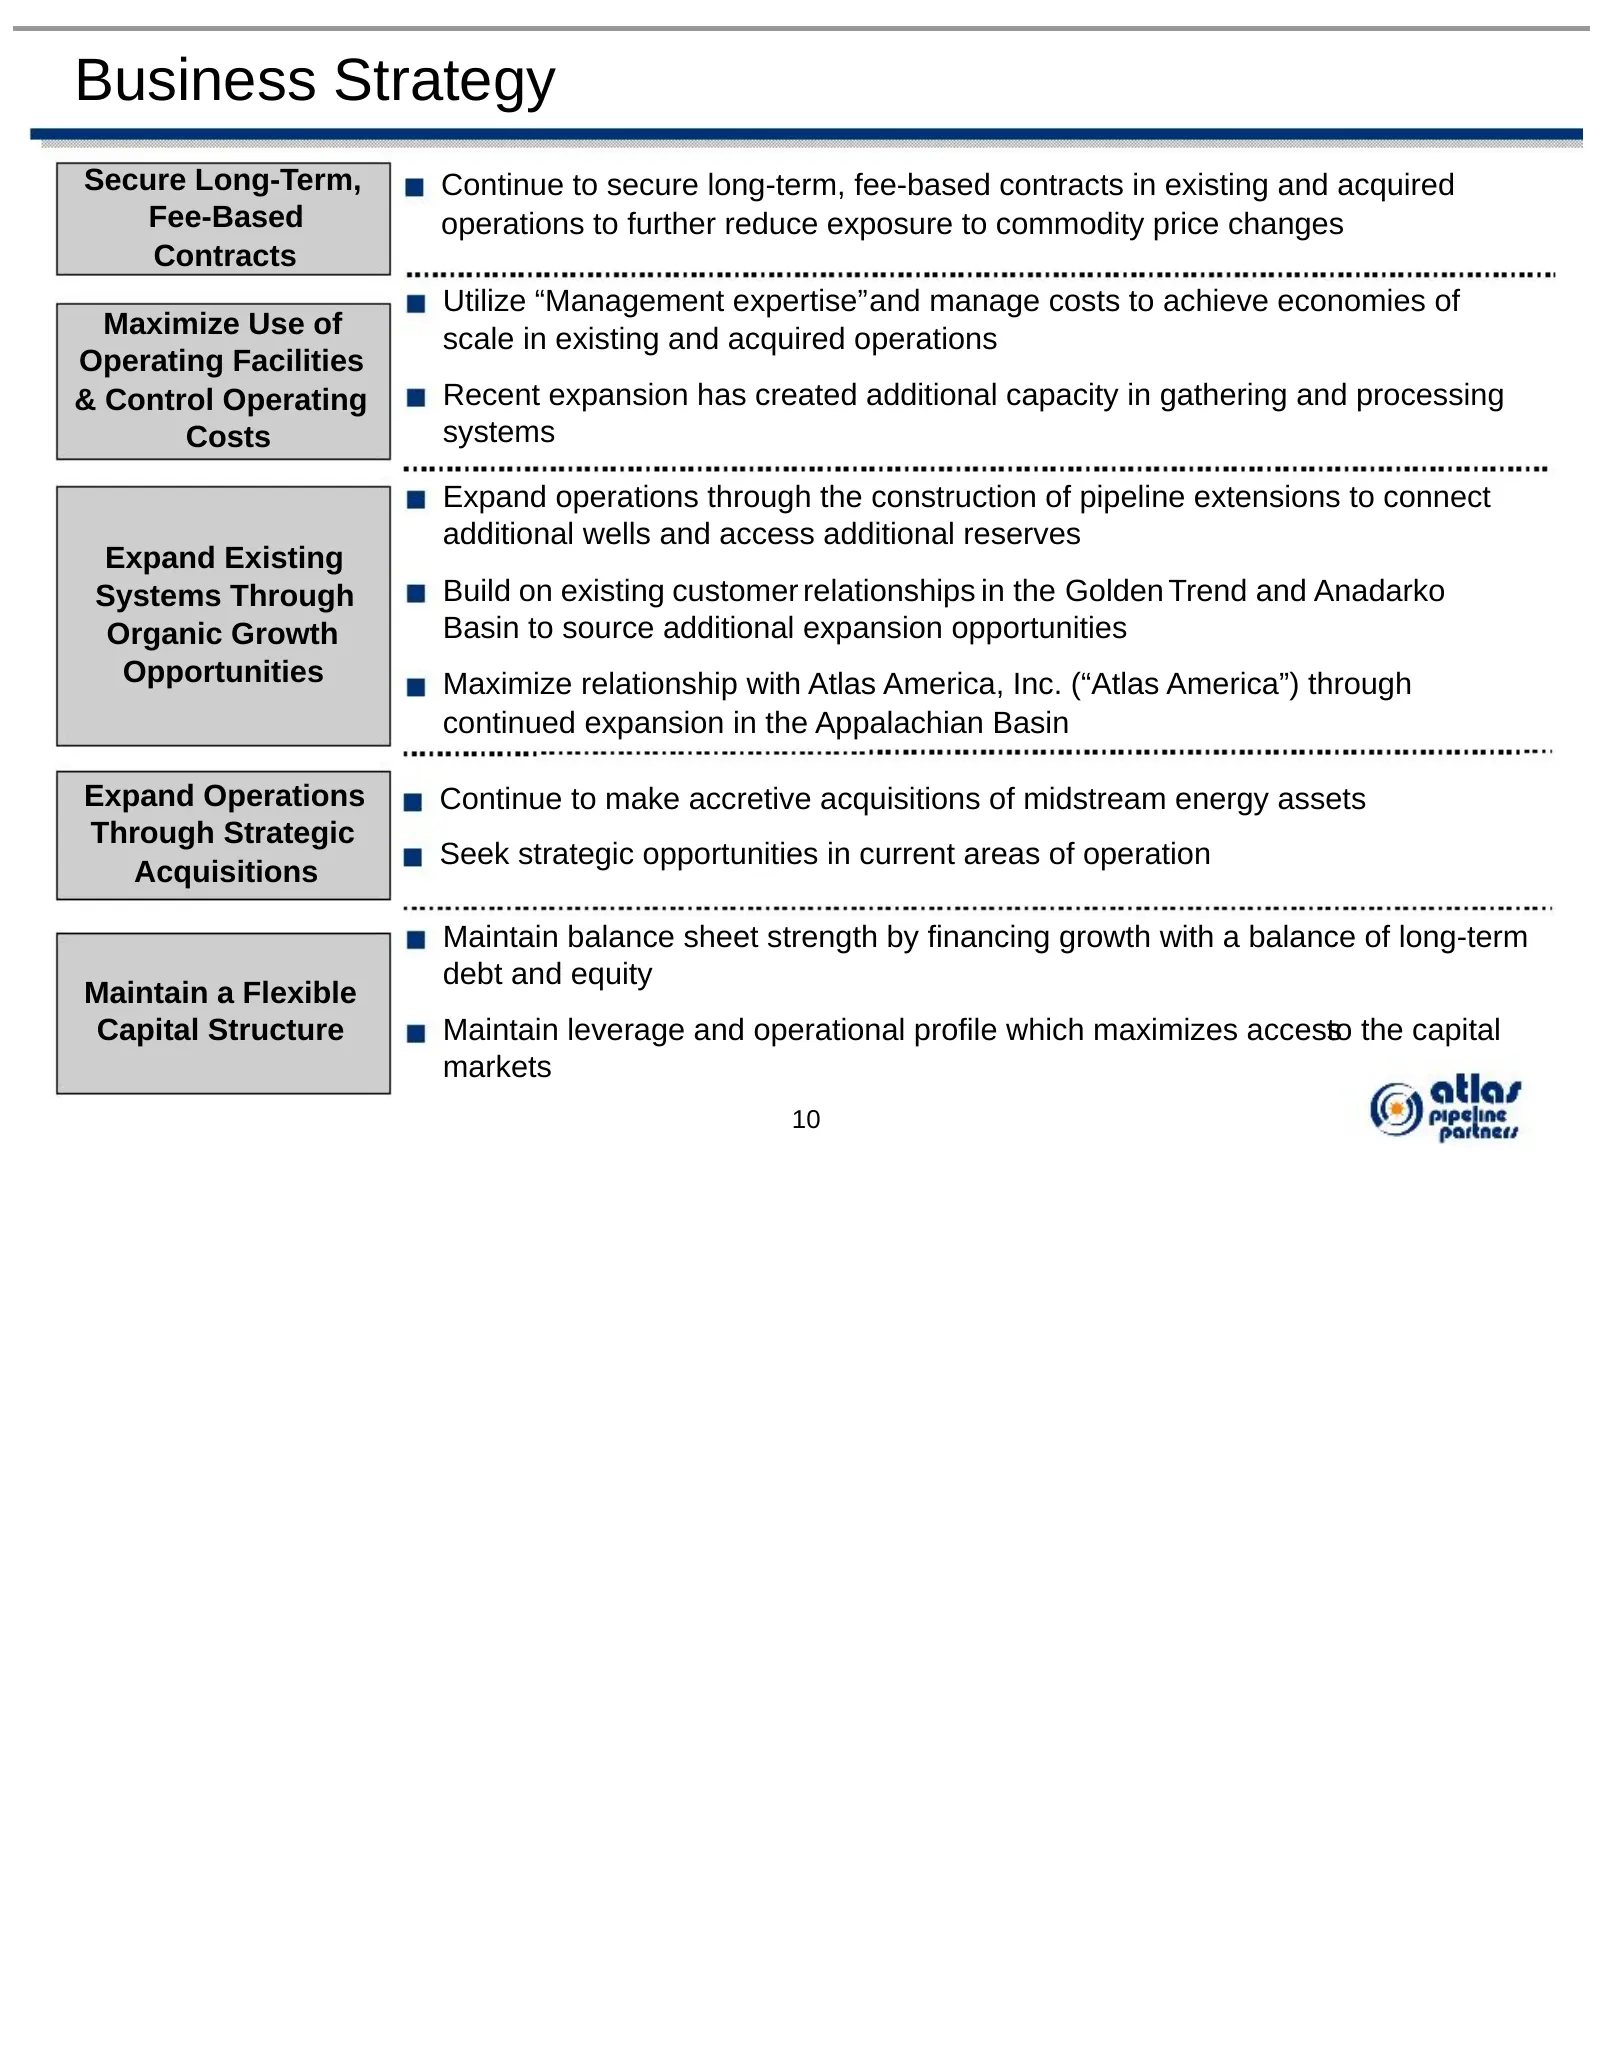
Slide 11: Business Strategy
Business Strategy Secure Long-Term, Continue to secure long-term, fee-based contracts in existing and acquired Fee-Based operations to further reduce exposure to commodity price changes Contracts Utilize “Management expertise”and manage costs to achieve economies of Maximize Use of scale in existing
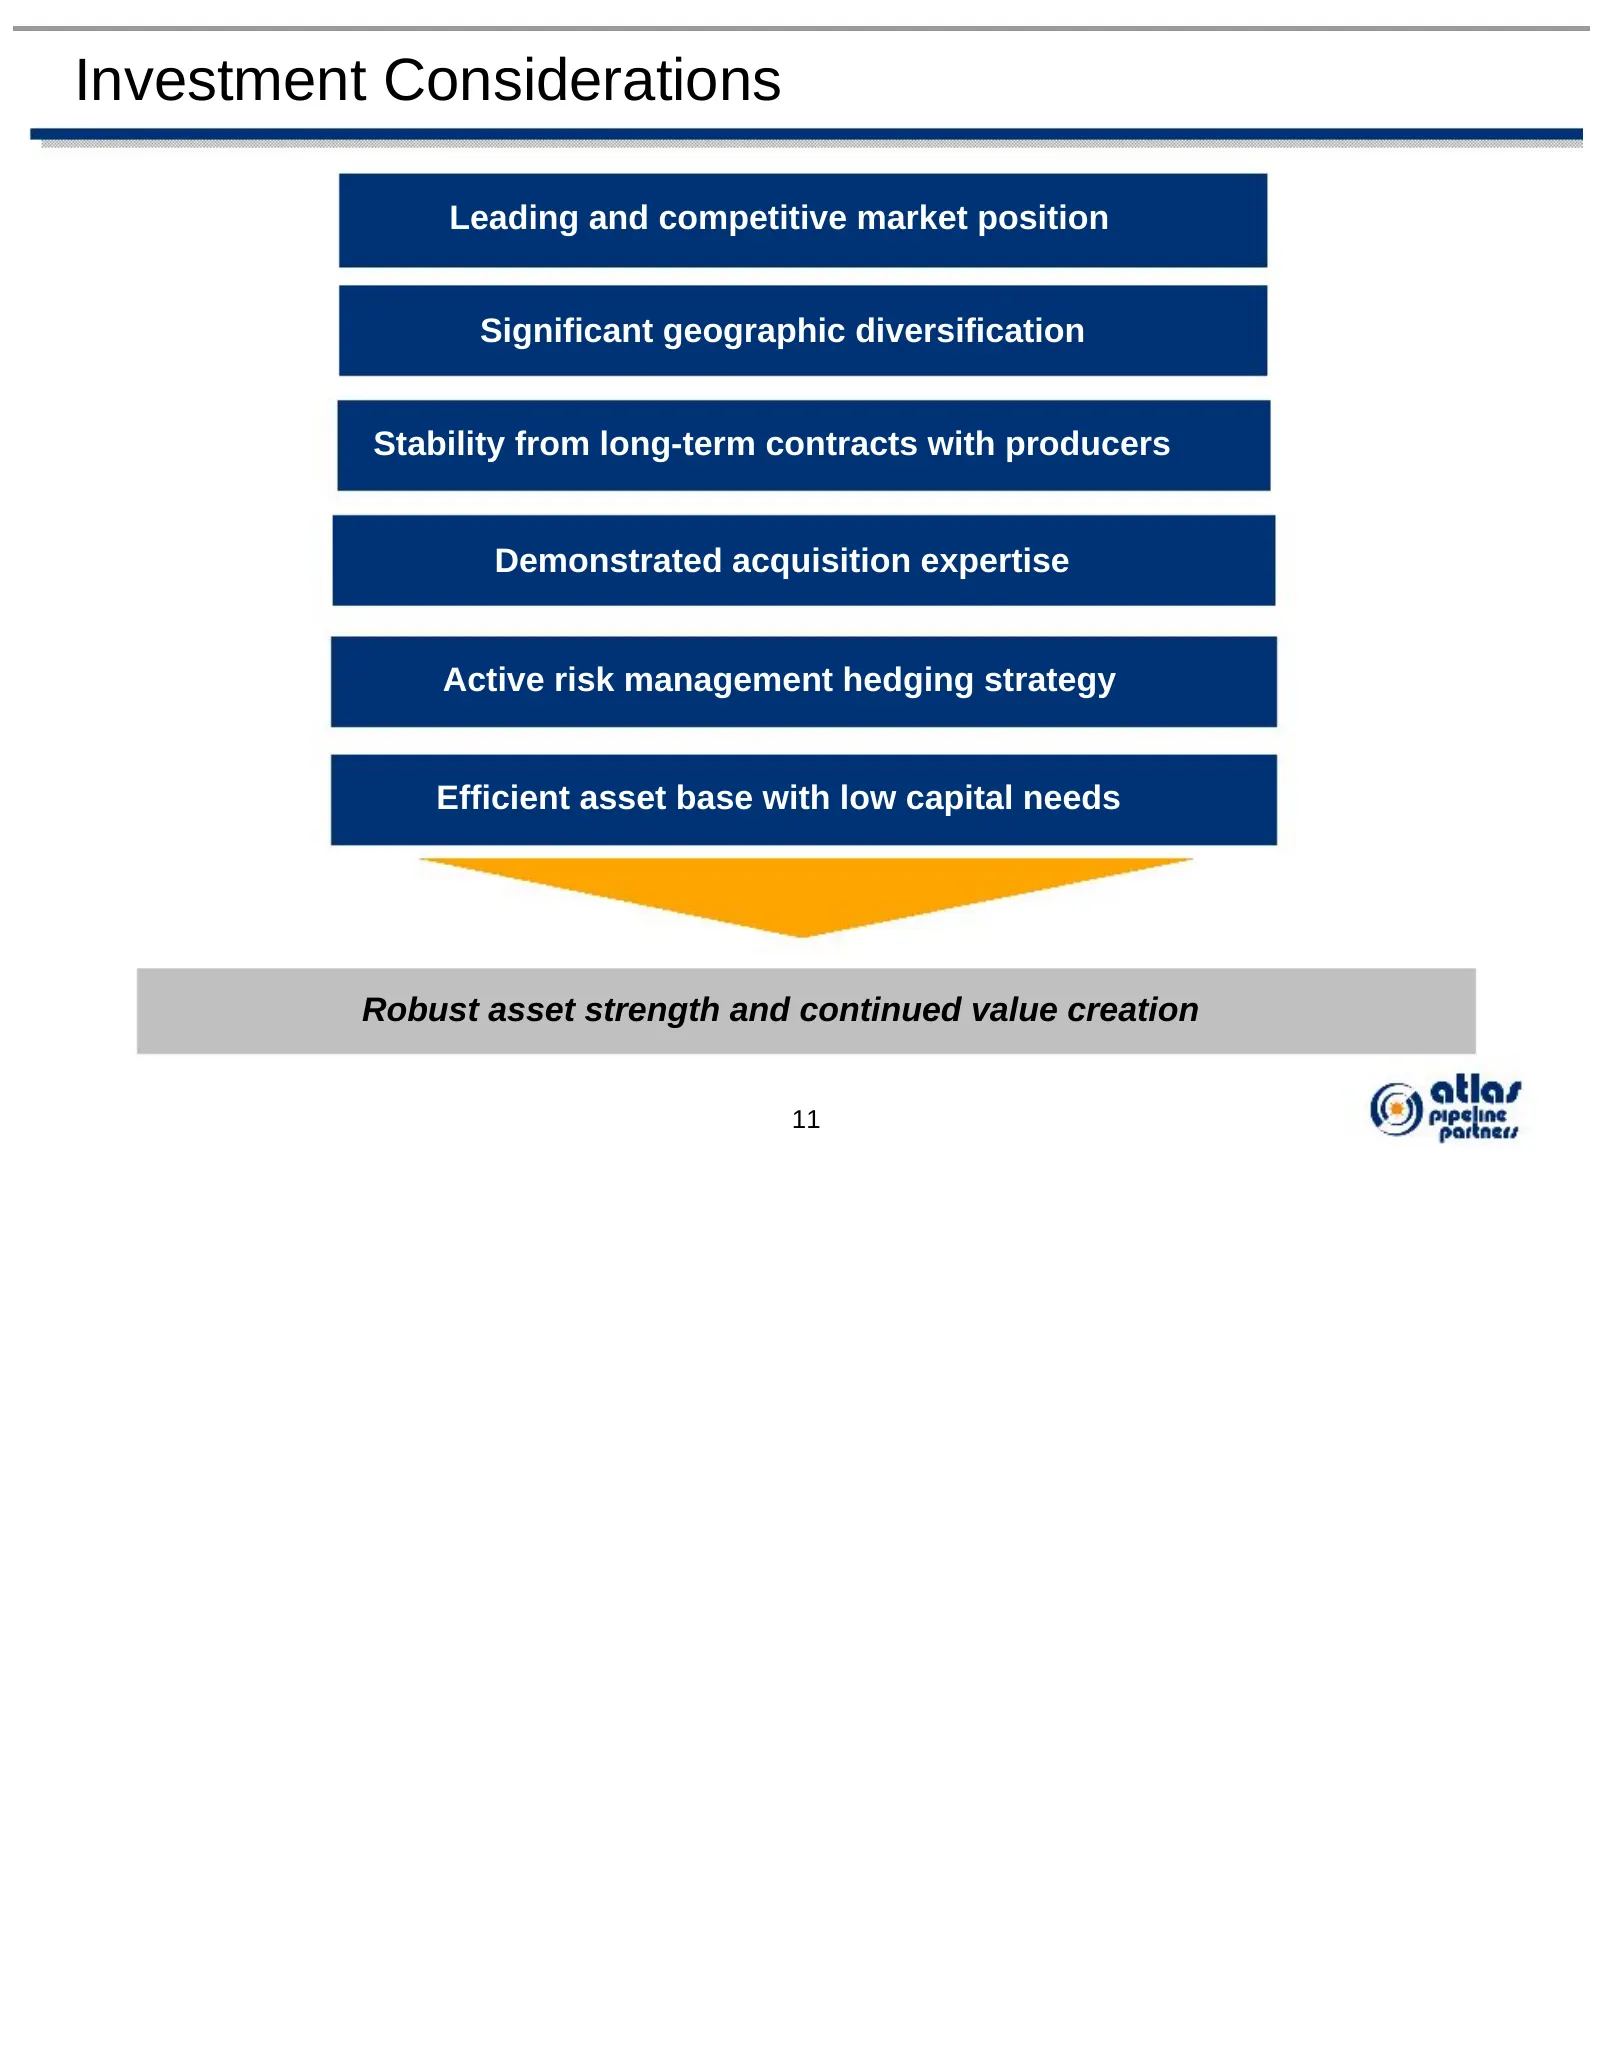
Slide 12: Investment Considerations
Investment Considerations Leading and competitive market position Significant geographic diversification Stability from long-term contracts with producers Demonstrated acquisition expertise Active risk management hedging strategy Efficient asset base with low capital needs Robust asset strength and
Slide 13: Appalachian Standalone Operations Overview
* * * * * * * * * * * * * * * * * * * * * * * * Appalachian Standalone Operations Overview
Slide 14: Appalachian Highlights
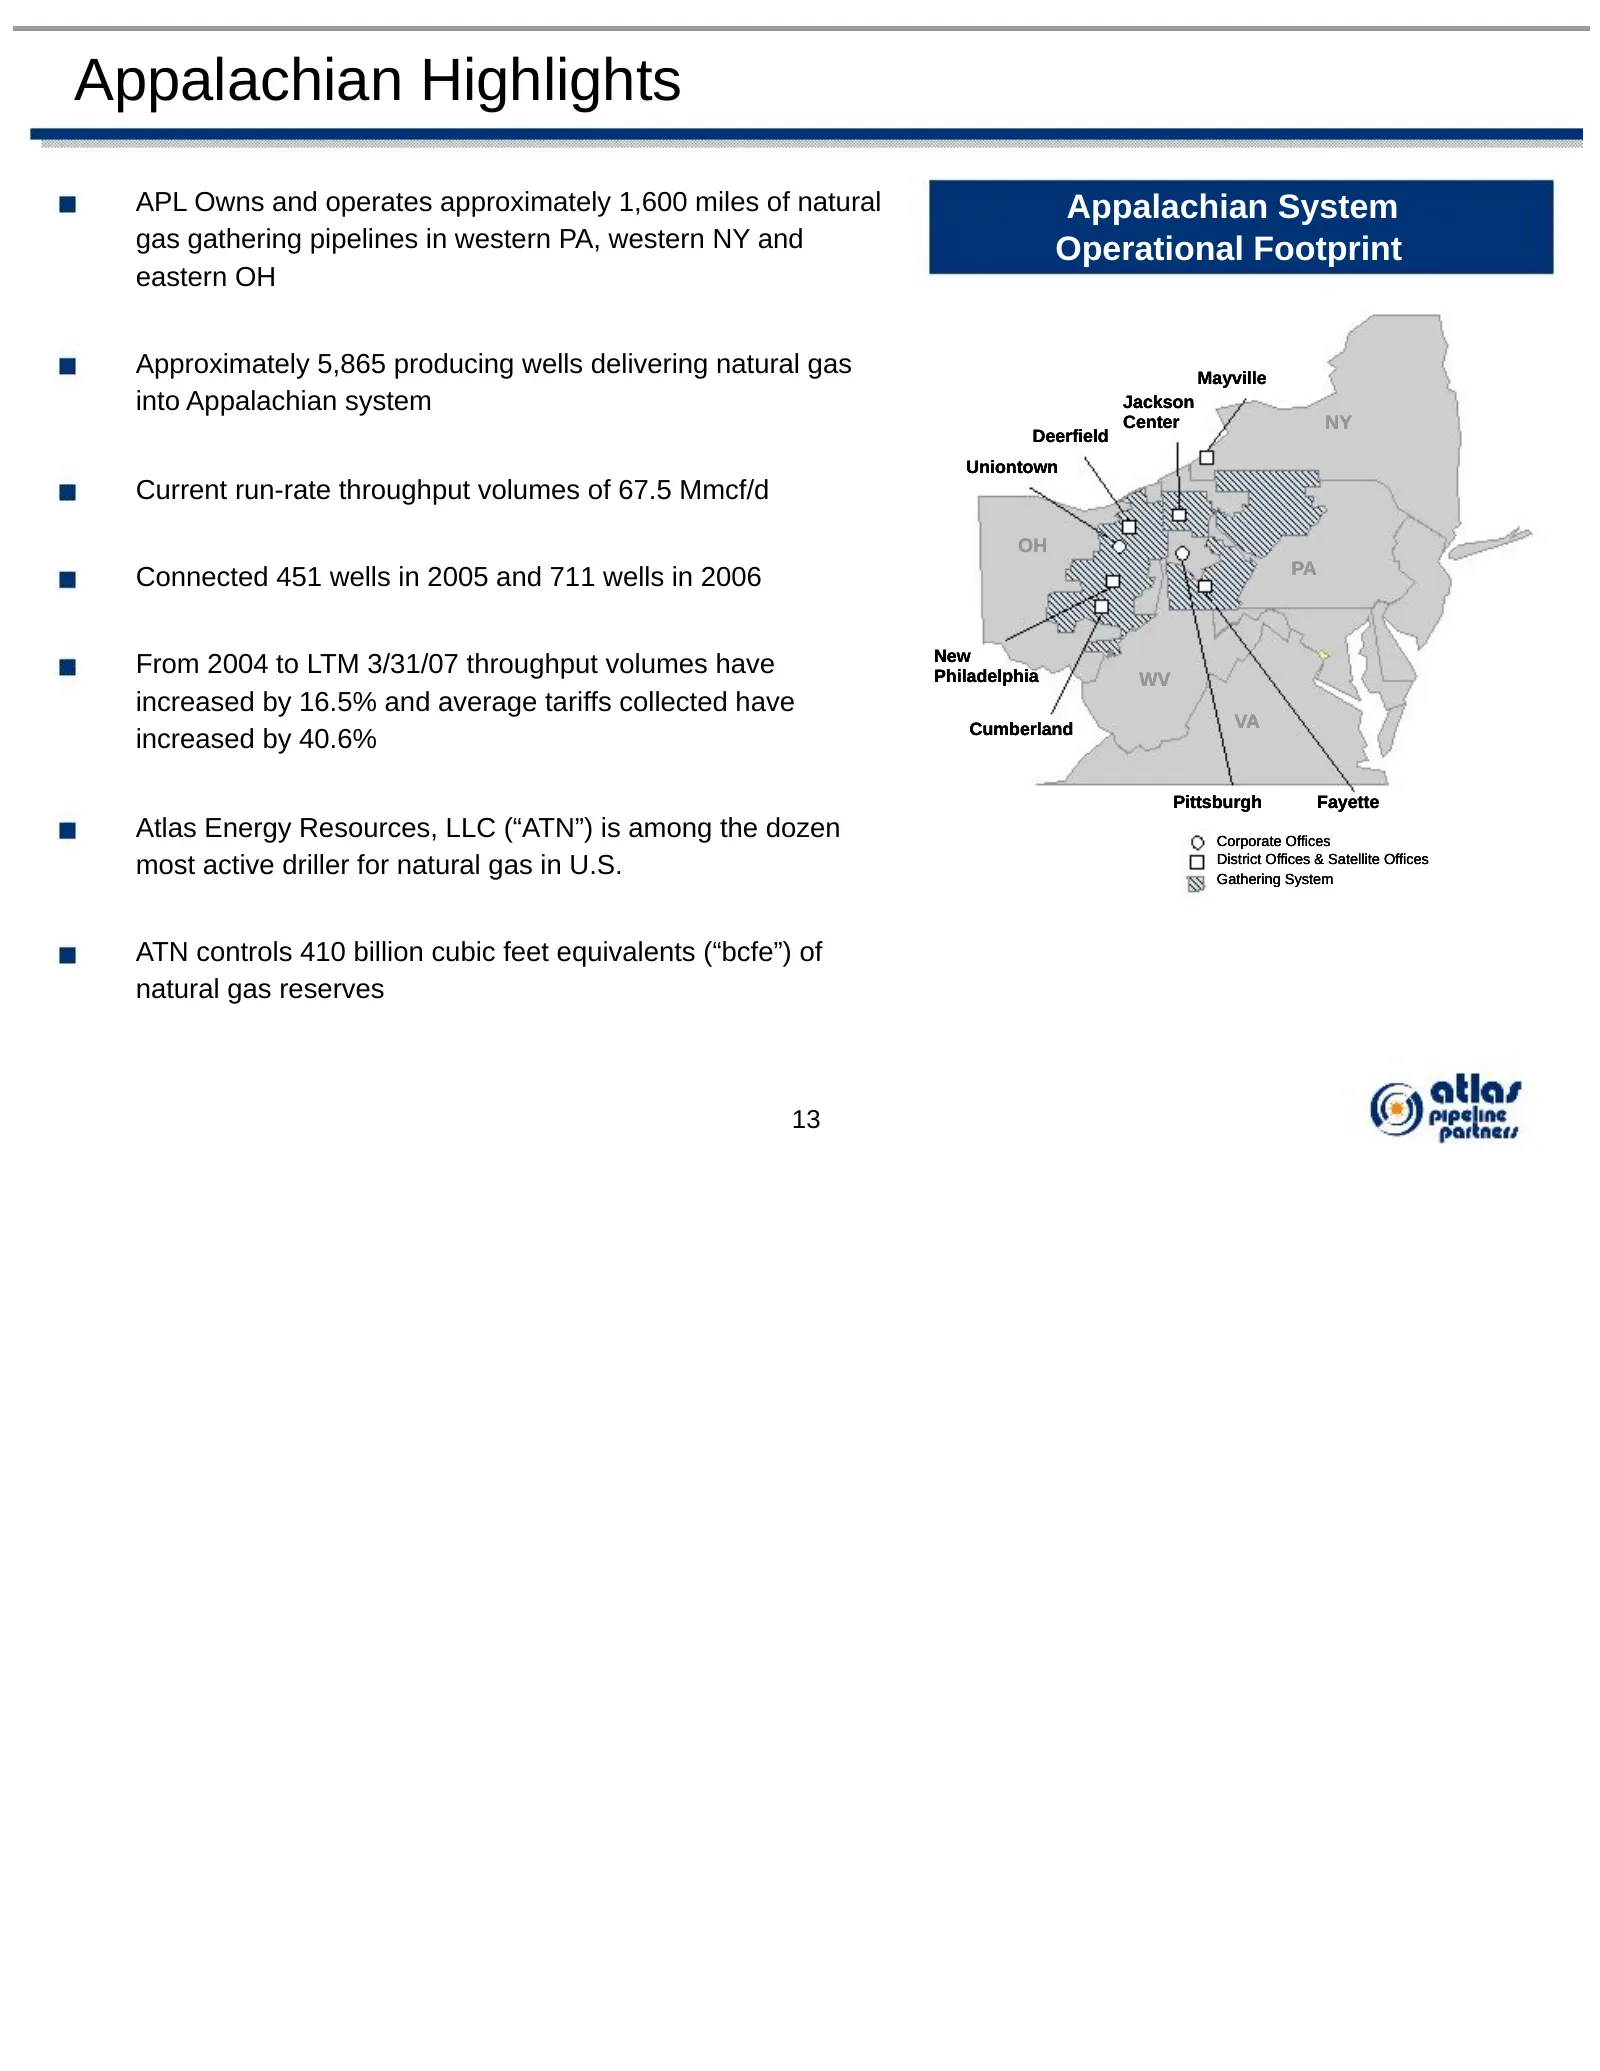
Appalachian Highlights APL Owns and operates approximately 1,600 miles of natural Appalachian System gas gathering pipelines in western PA, western NY and Operational Footprint eastern OH Approximately 5,865 producing wells delivering natural gas Mayville into Appalachian system Jackson Center NY De
Slide 15: Relationship With Atlas Energy
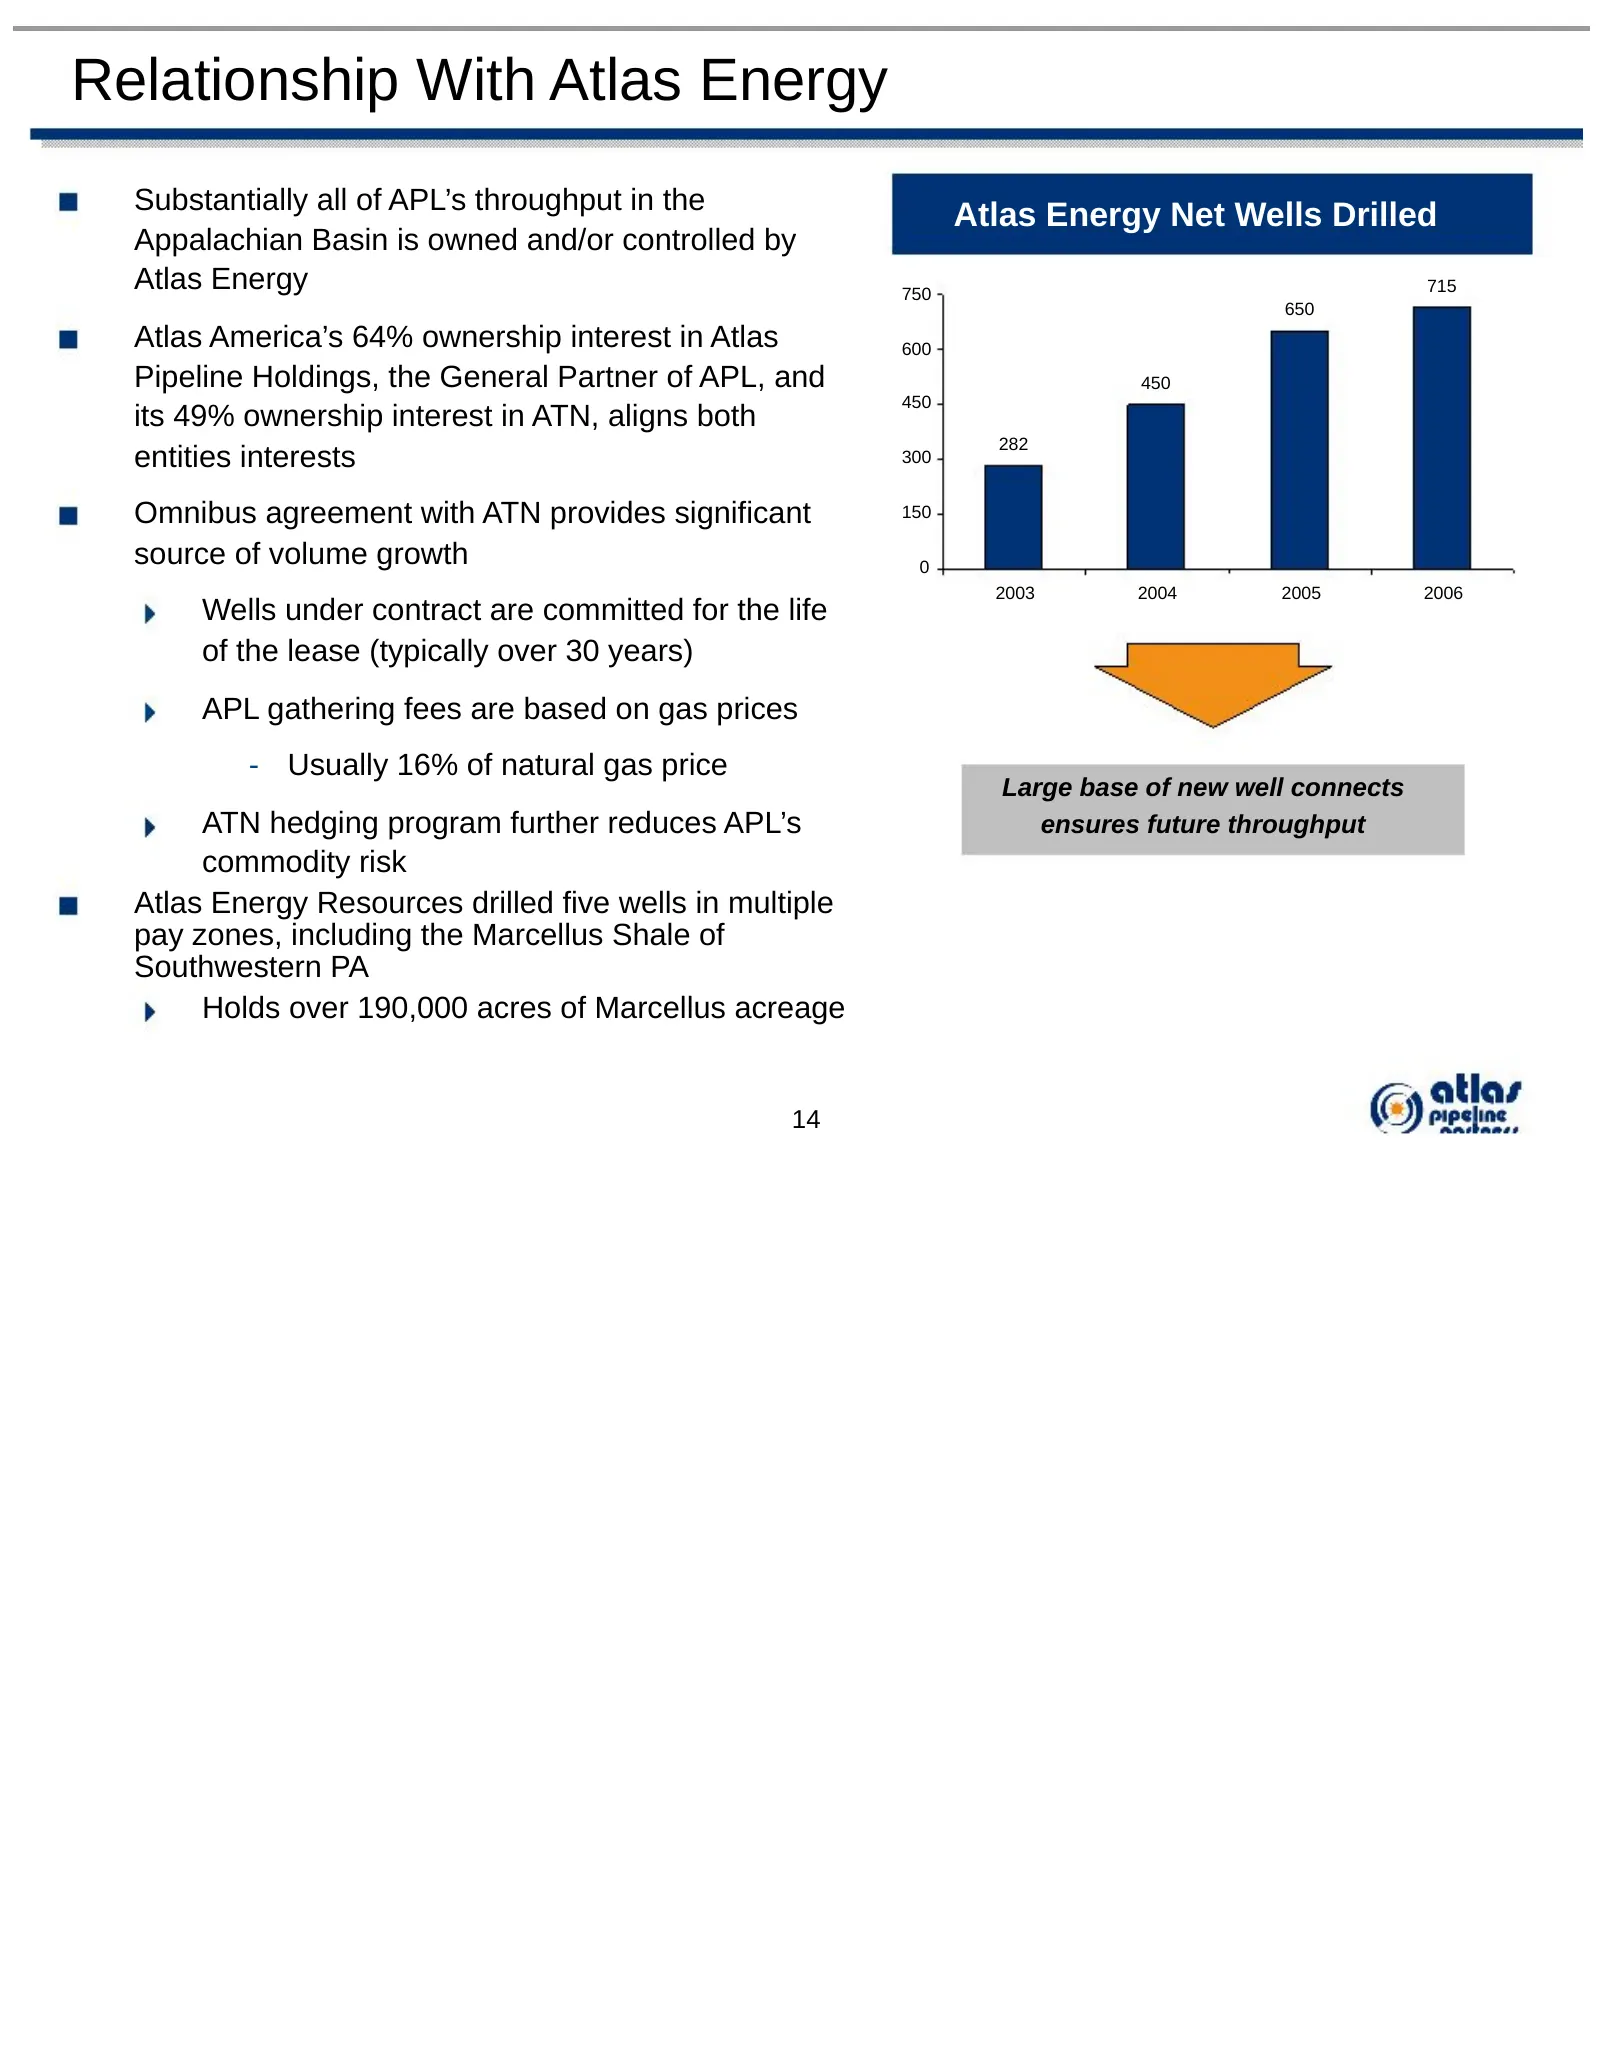
Relationship With Atlas Energy Substantially all of APL’s throughput in the Atlas Energy Net Wells Drilled Appalachian Basin is owned and/or controlled by Atlas Energy 750 715 650 Atlas America’s 64% ownership interest in Atlas 600 Pipeline Holdings, the General Partner of APL, and 450 450 its 49% o
Slide 16: Mid-Continent Standalone Operations Overview
* * * * * * * * * * * * * * * * * * * * * * * * Mid-Continent Standalone Operations Overview
Slide 17: Mid-Continent Standalone Business Overview
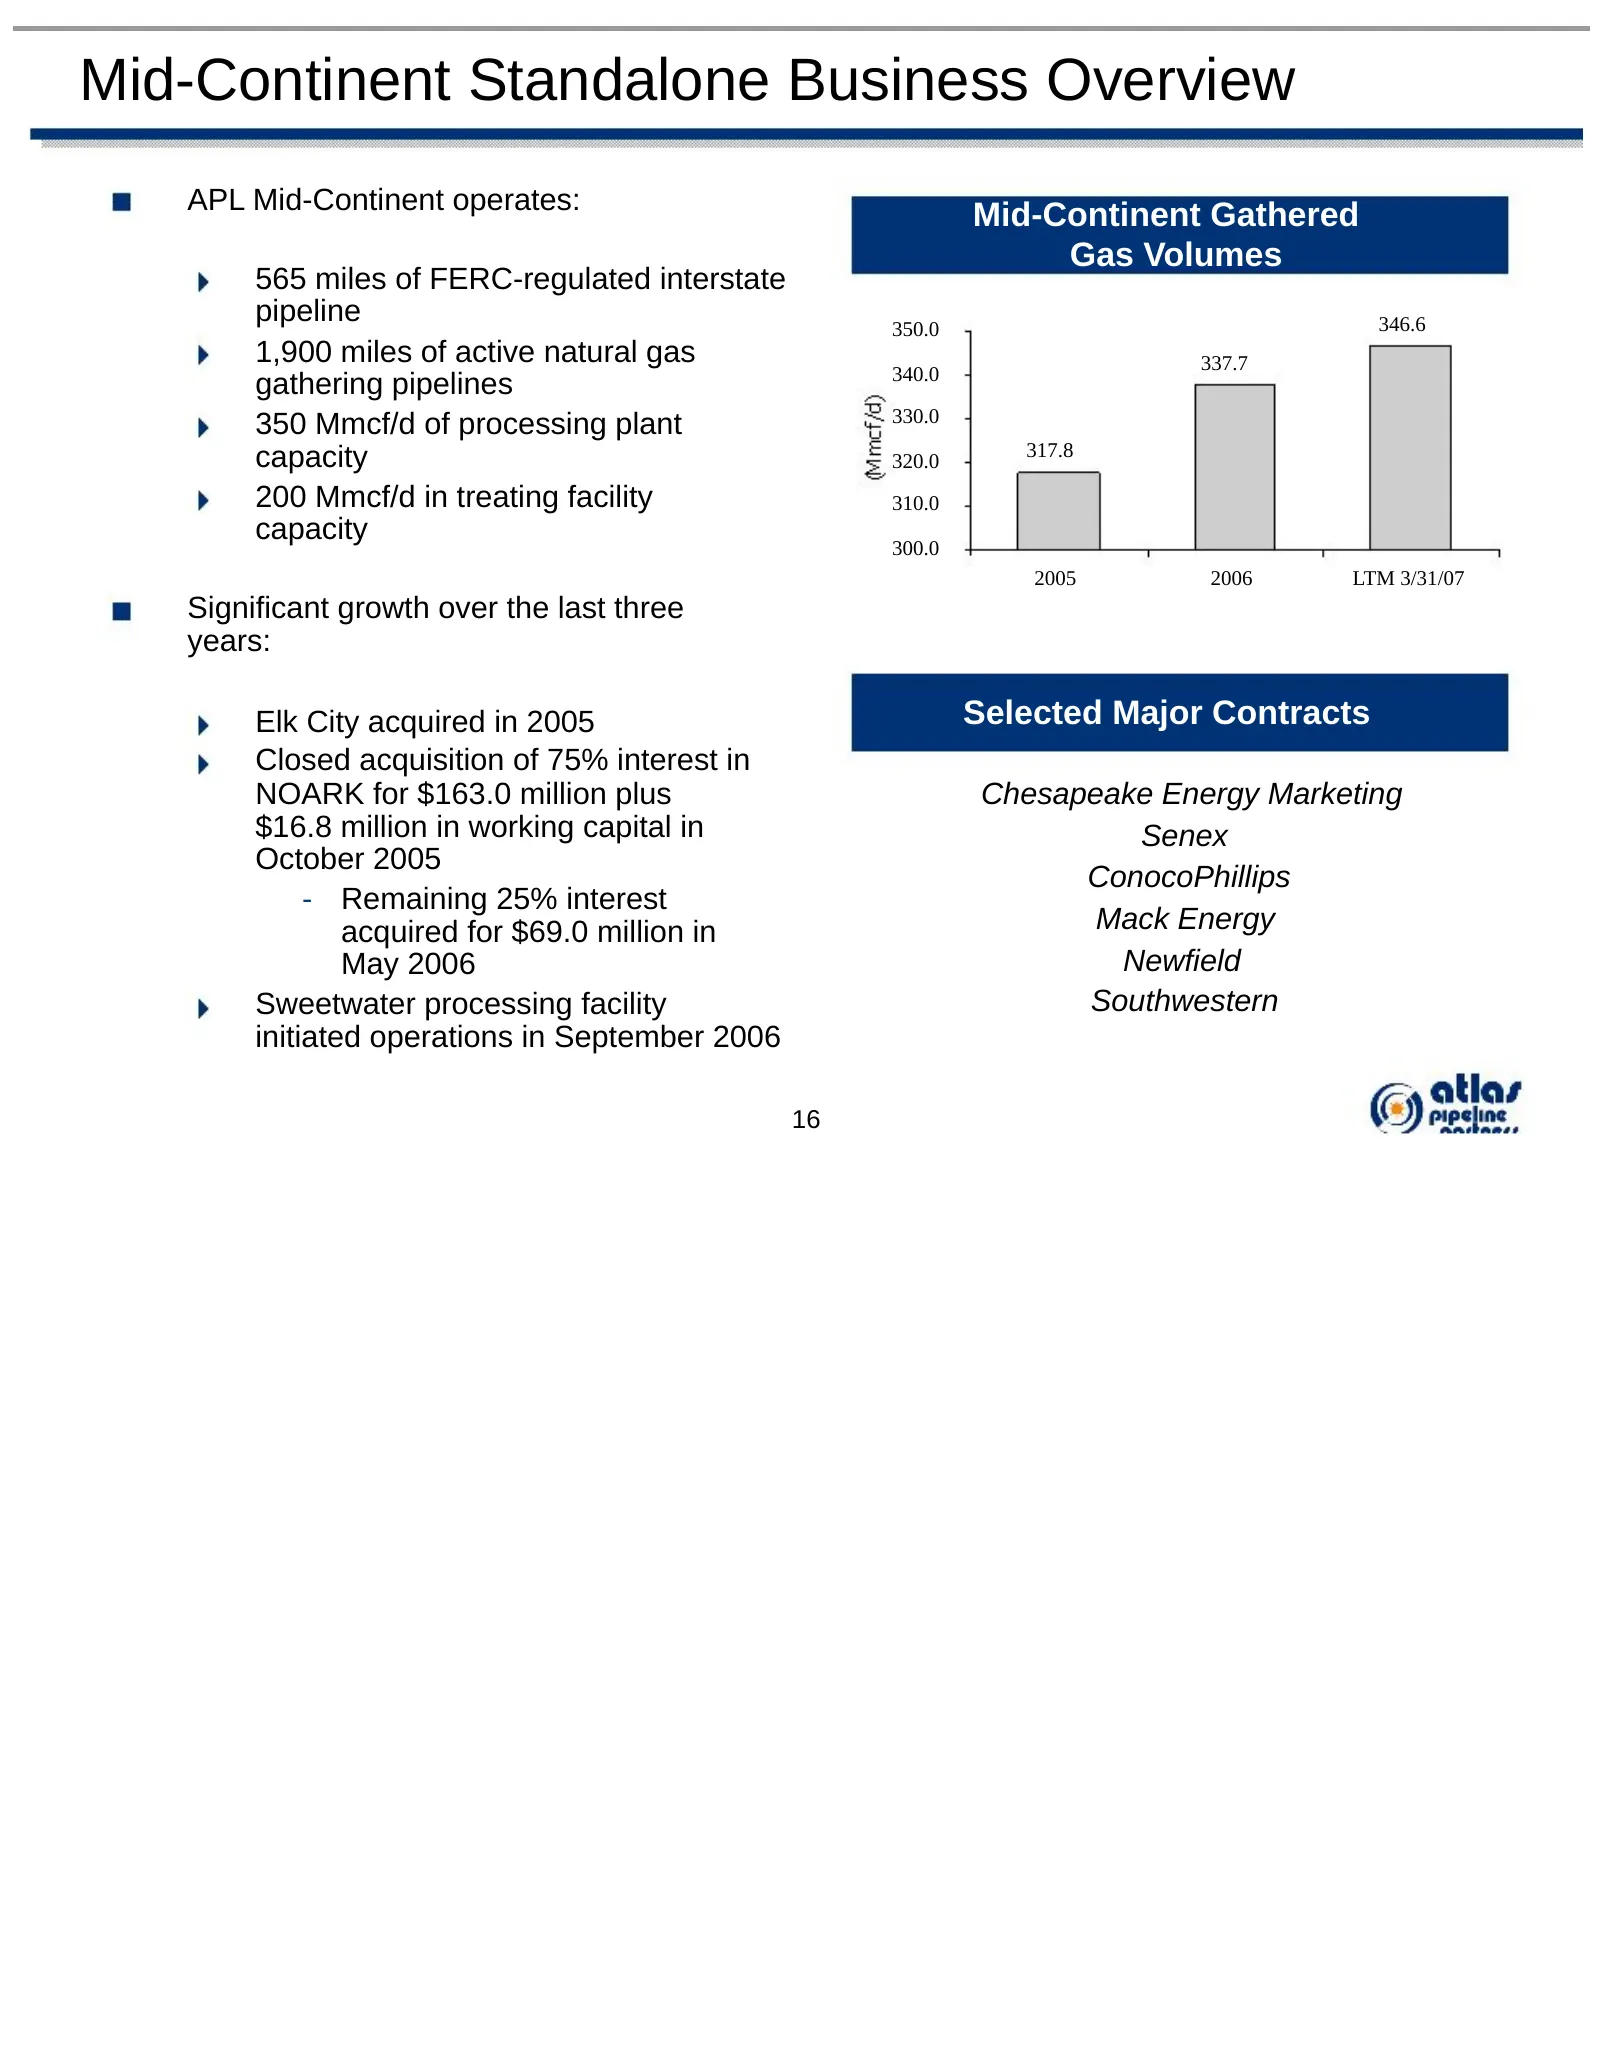
Mid-Continent Standalone Business Overview APL Mid-Continent operates: Mid-Continent Gathered Gas Volumes 565 miles of FERC-regulated interstate pipeline 350.0 346.6 1,900 miles of active natural gas 337.7 340.0 gathering pipelines 330.0 350 Mmcf/d of processing plant capacity 317.8 320.0 200 Mmcf/d
Slide 18: Existing Mid-Continent Footprint
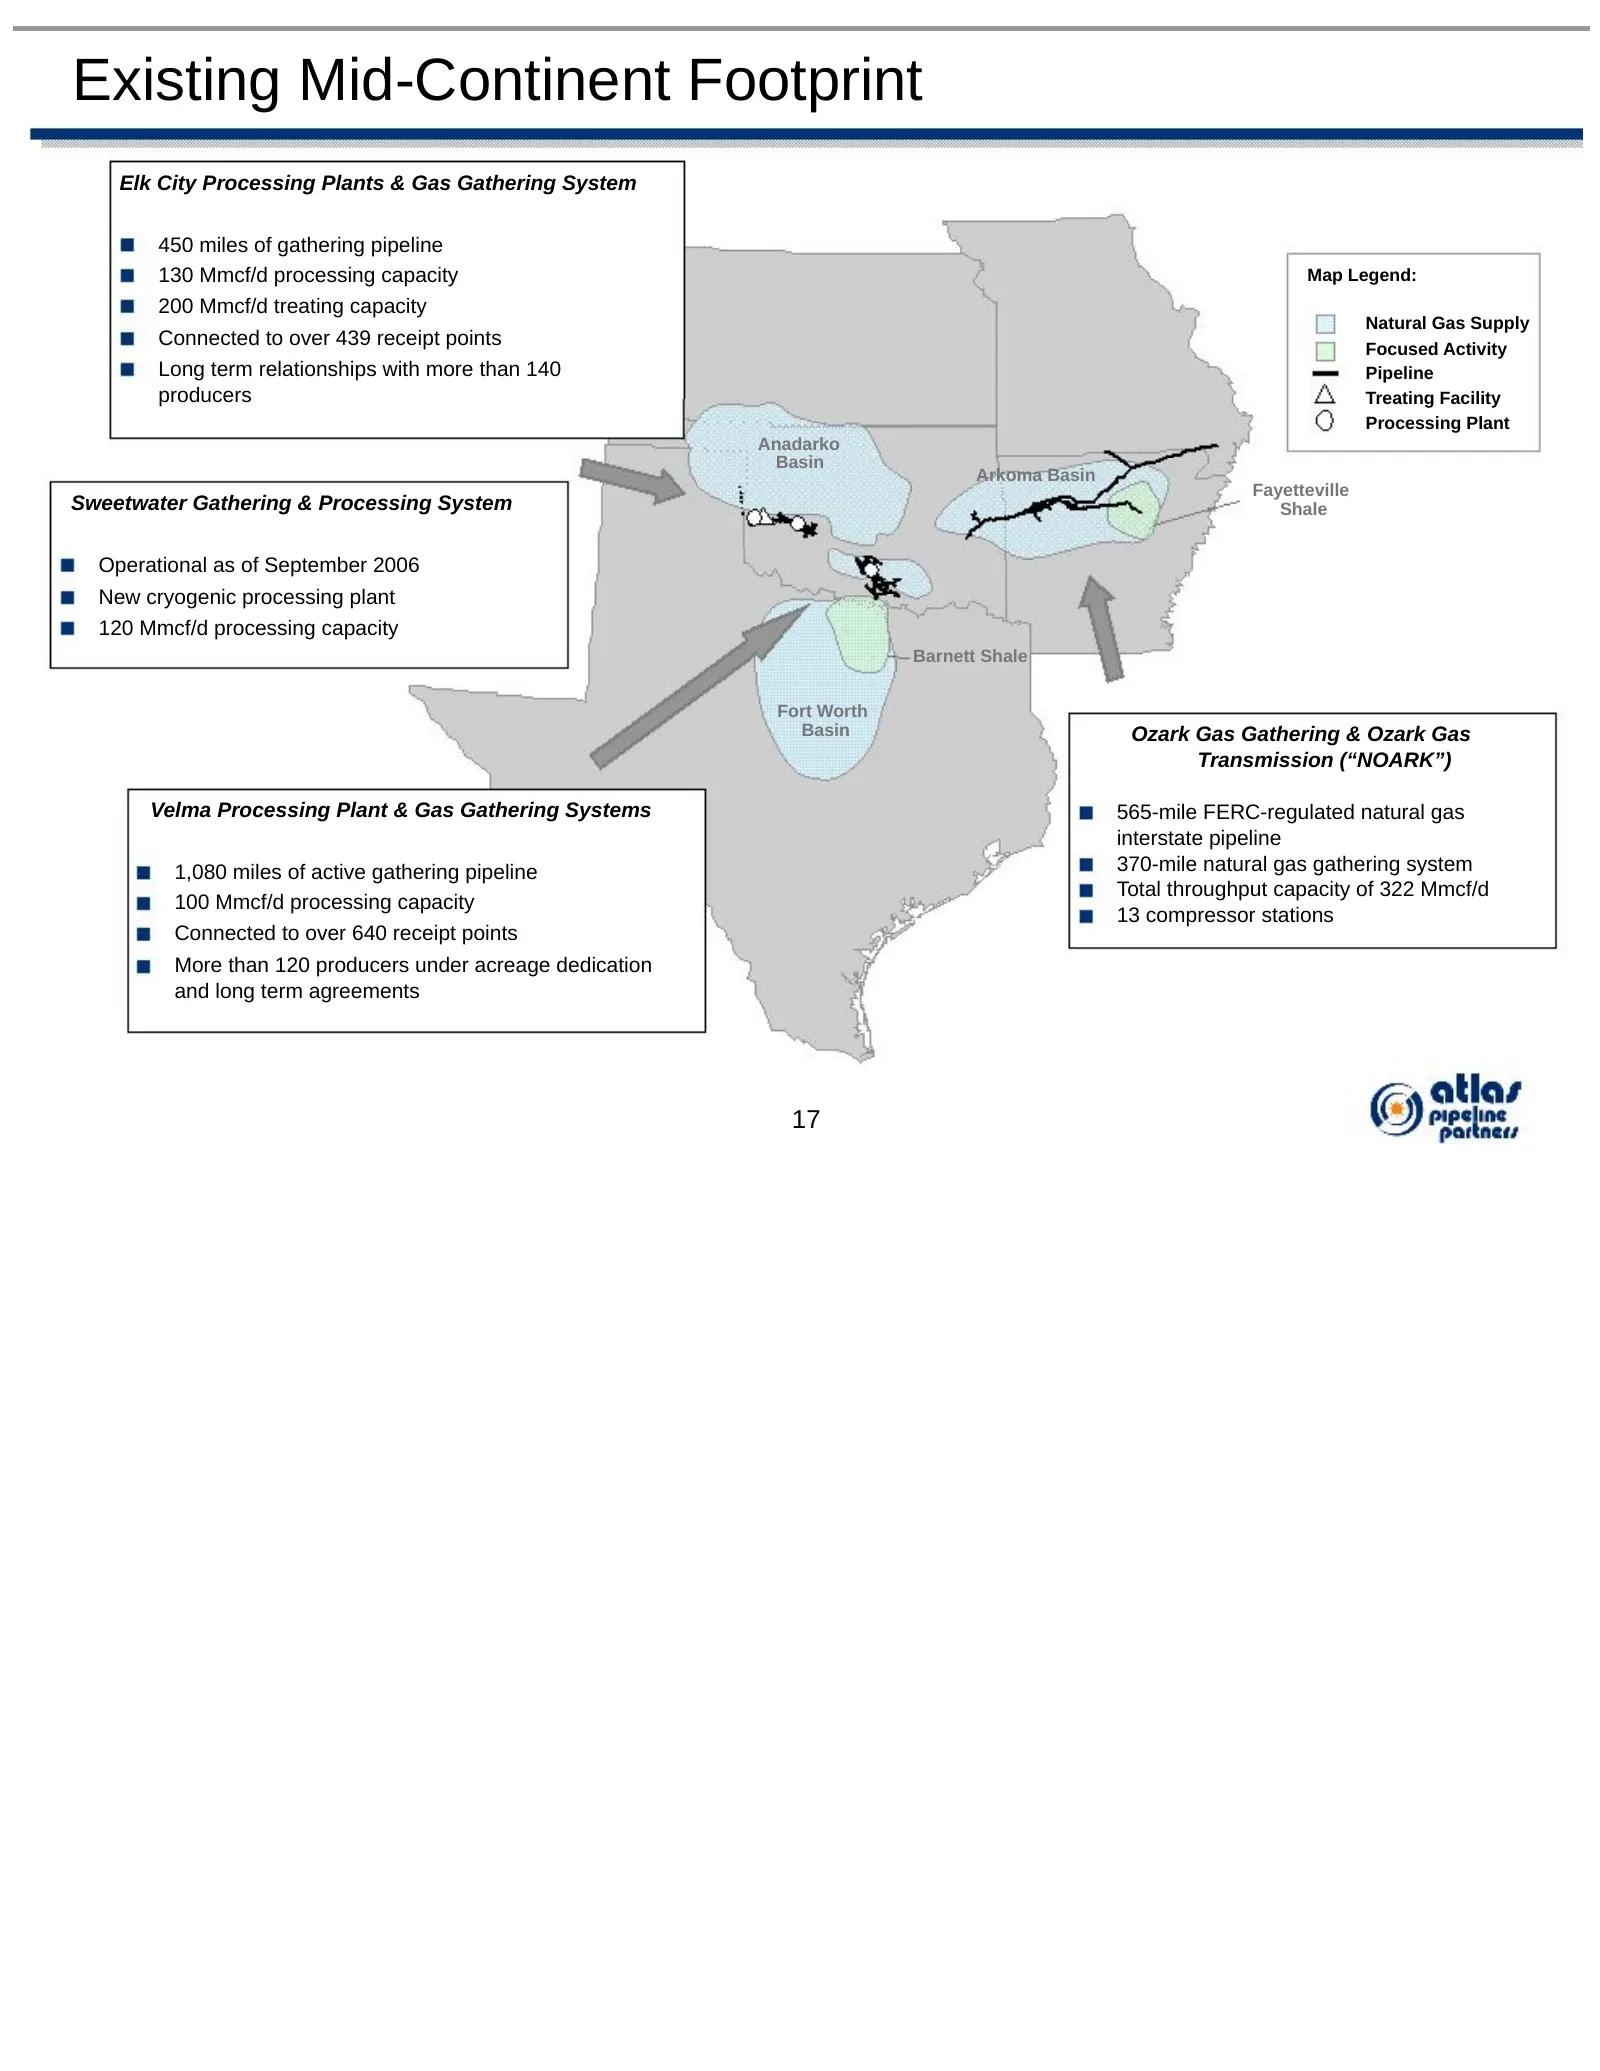
Existing Mid-Continent Footprint Elk City Processing Plants & Gas Gathering System 450 miles of gathering pipeline 130 Mmcf/d processing capacity Map Legend: 200 Mmcf/d treating capacity Natural Gas Supply Connected to over 439 receipt points Focused Activity Long term relationships with more than 1
Slide 19: NOARK Gas Transmission and Gathering System
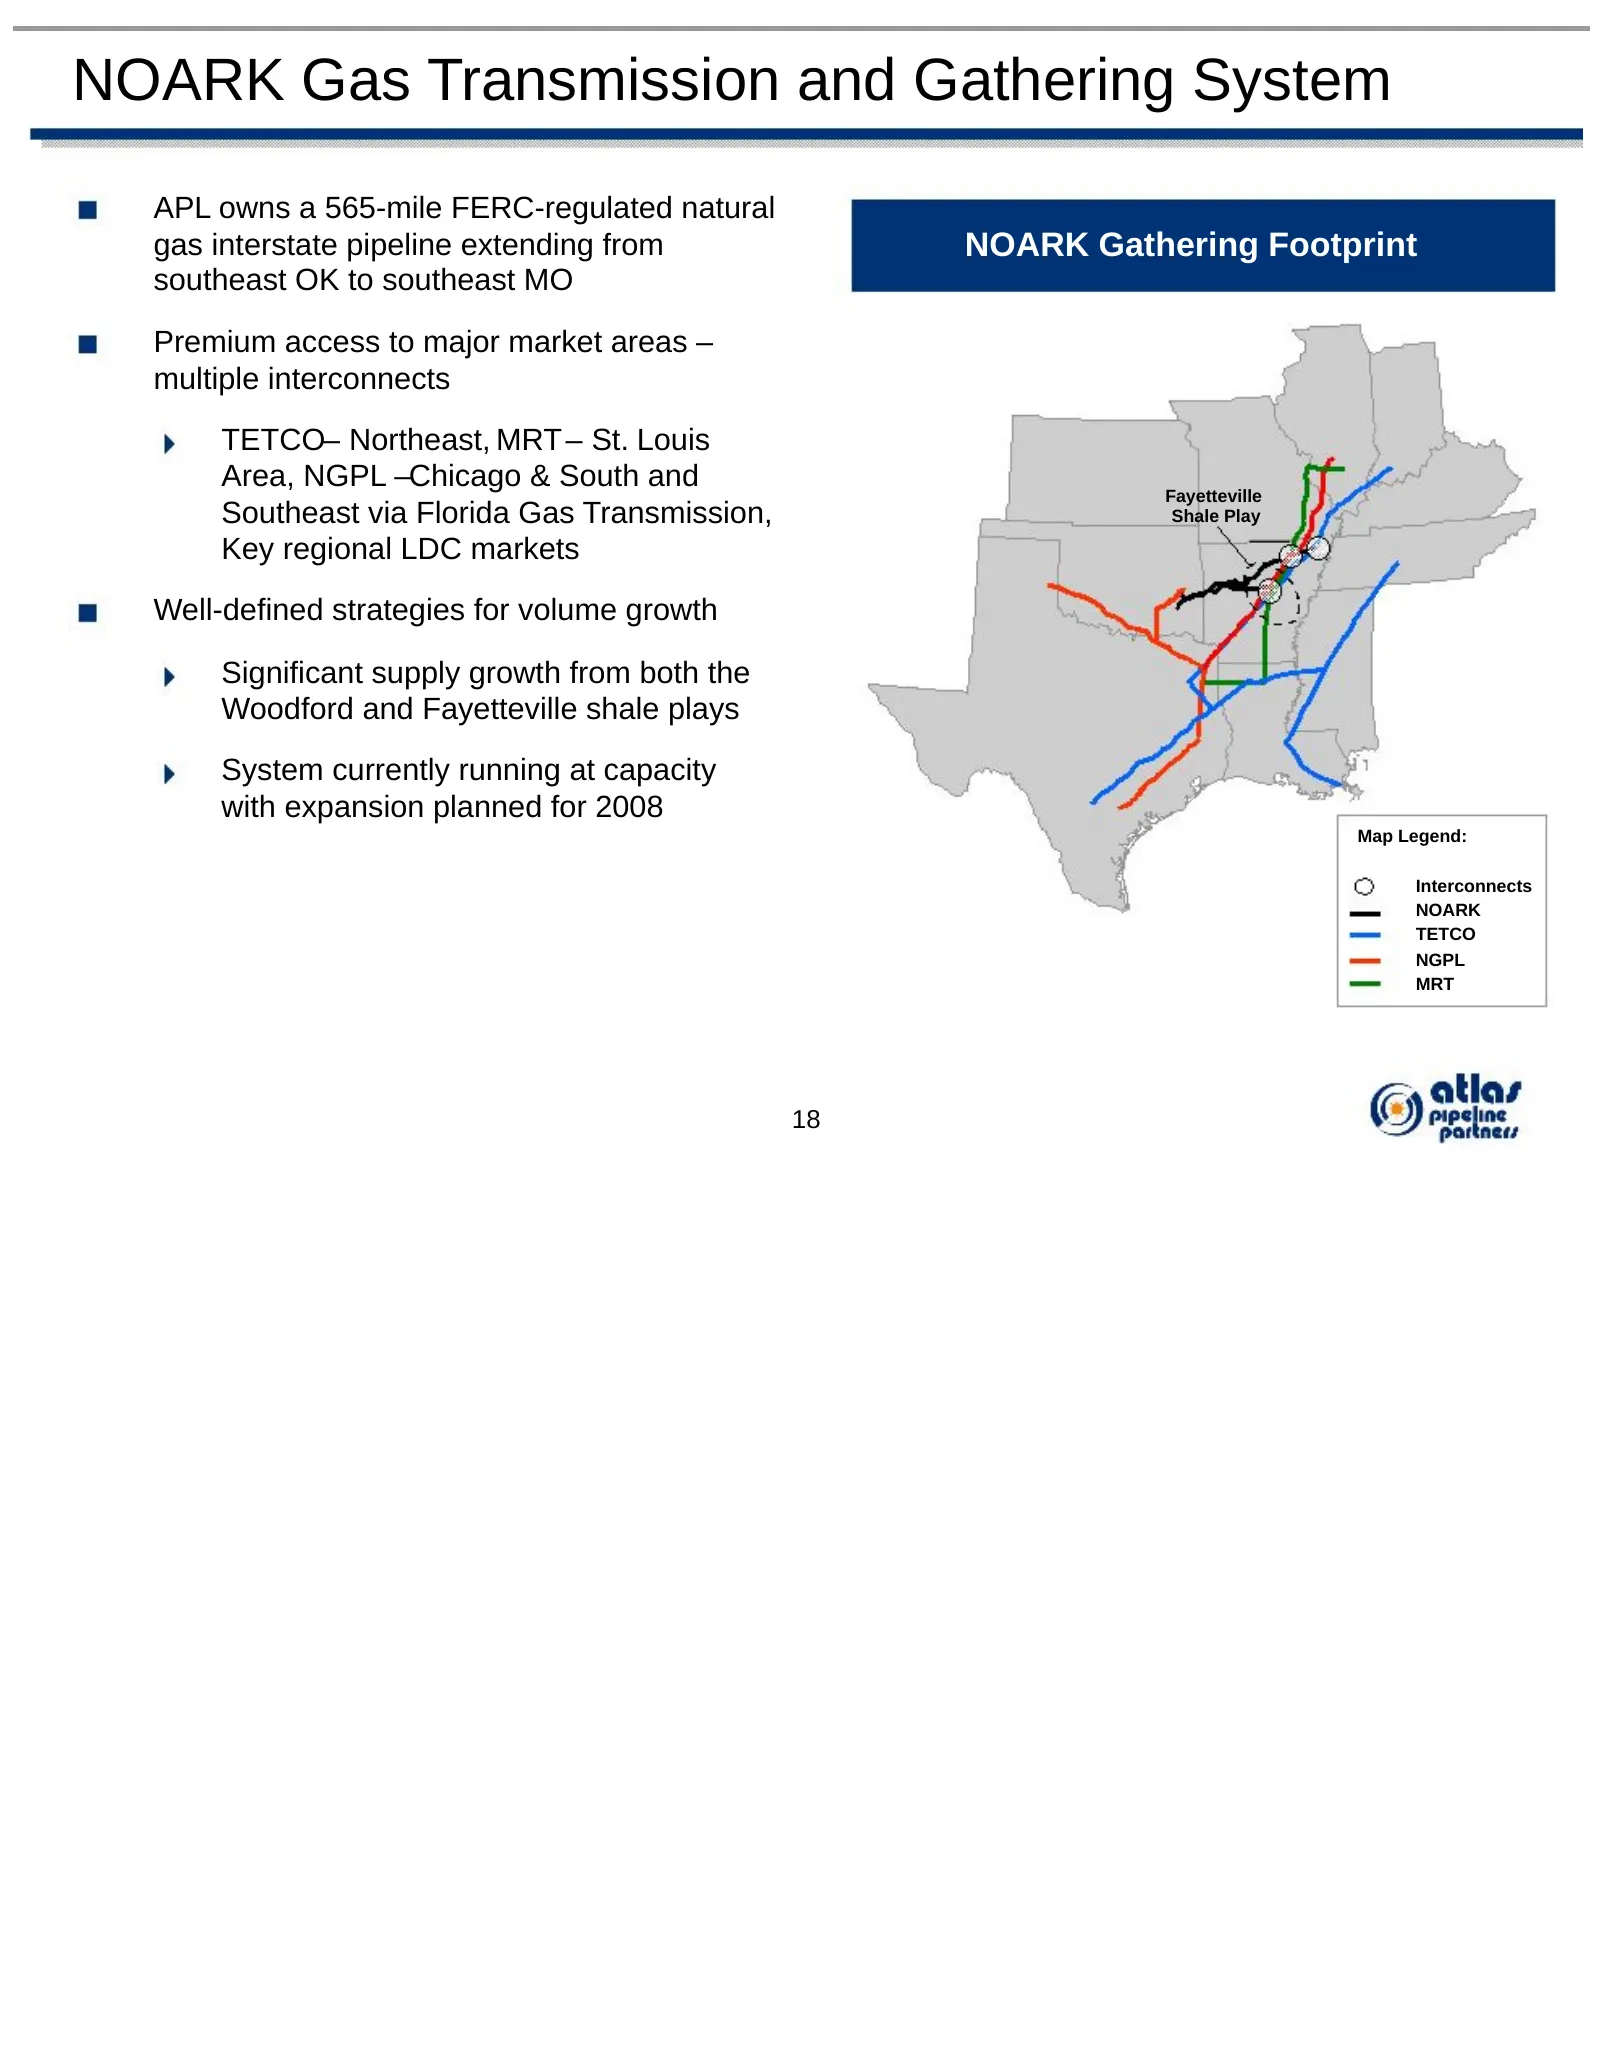
NOARK Gas Transmission and Gathering System APL owns a 565-mile FERC-regulated natural gas interstate pipeline extending from NOARK Gathering Footprint southeast OK to southeast MO Premium access to major market areas – multiple interconnects TETCO– Northeast, MRT – St. Louis Area, NGPL –Chicago & S
Slide 20: Elk City and Sweetwater System Overview
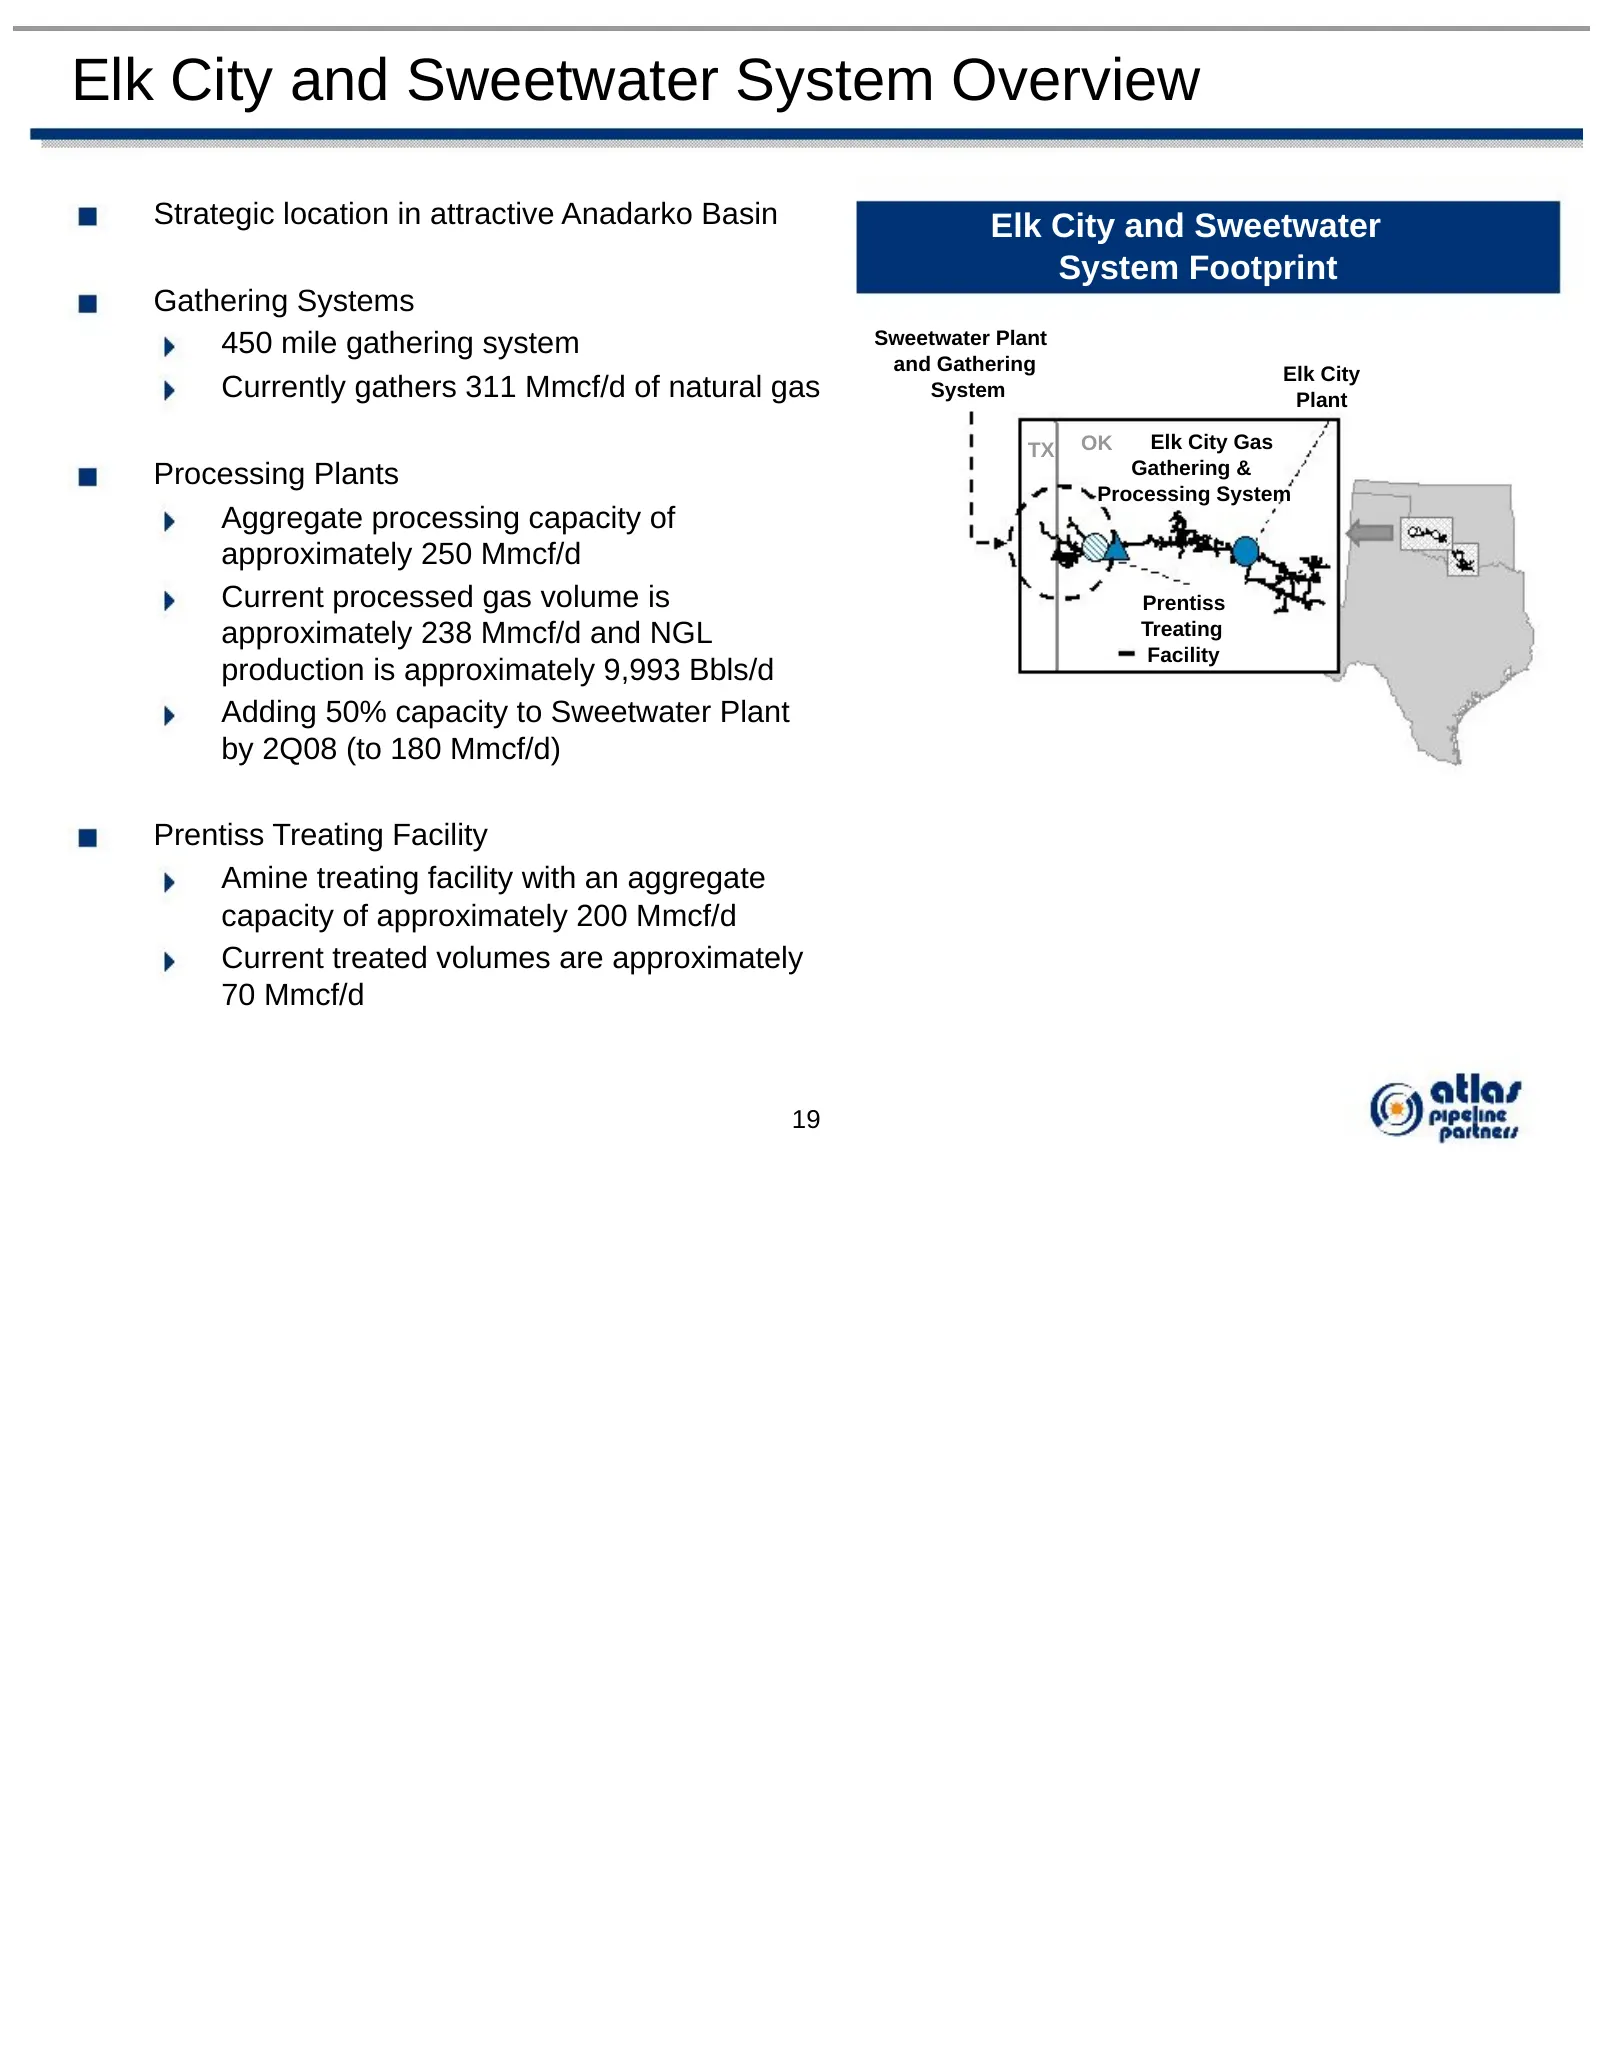
Elk City and Sweetwater System Overview Strategic location in attractive Anadarko Basin Elk City and Sweetwater System Footprint Gathering Systems 450 mile gathering system Sweetwater Plant and Gathering Elk City Currently gathers 311 Mmcf/d of natural gas System Plant TX OK Elk City Gas Processing
Slide 21: Velma Gas Gathering and Processing System Overview
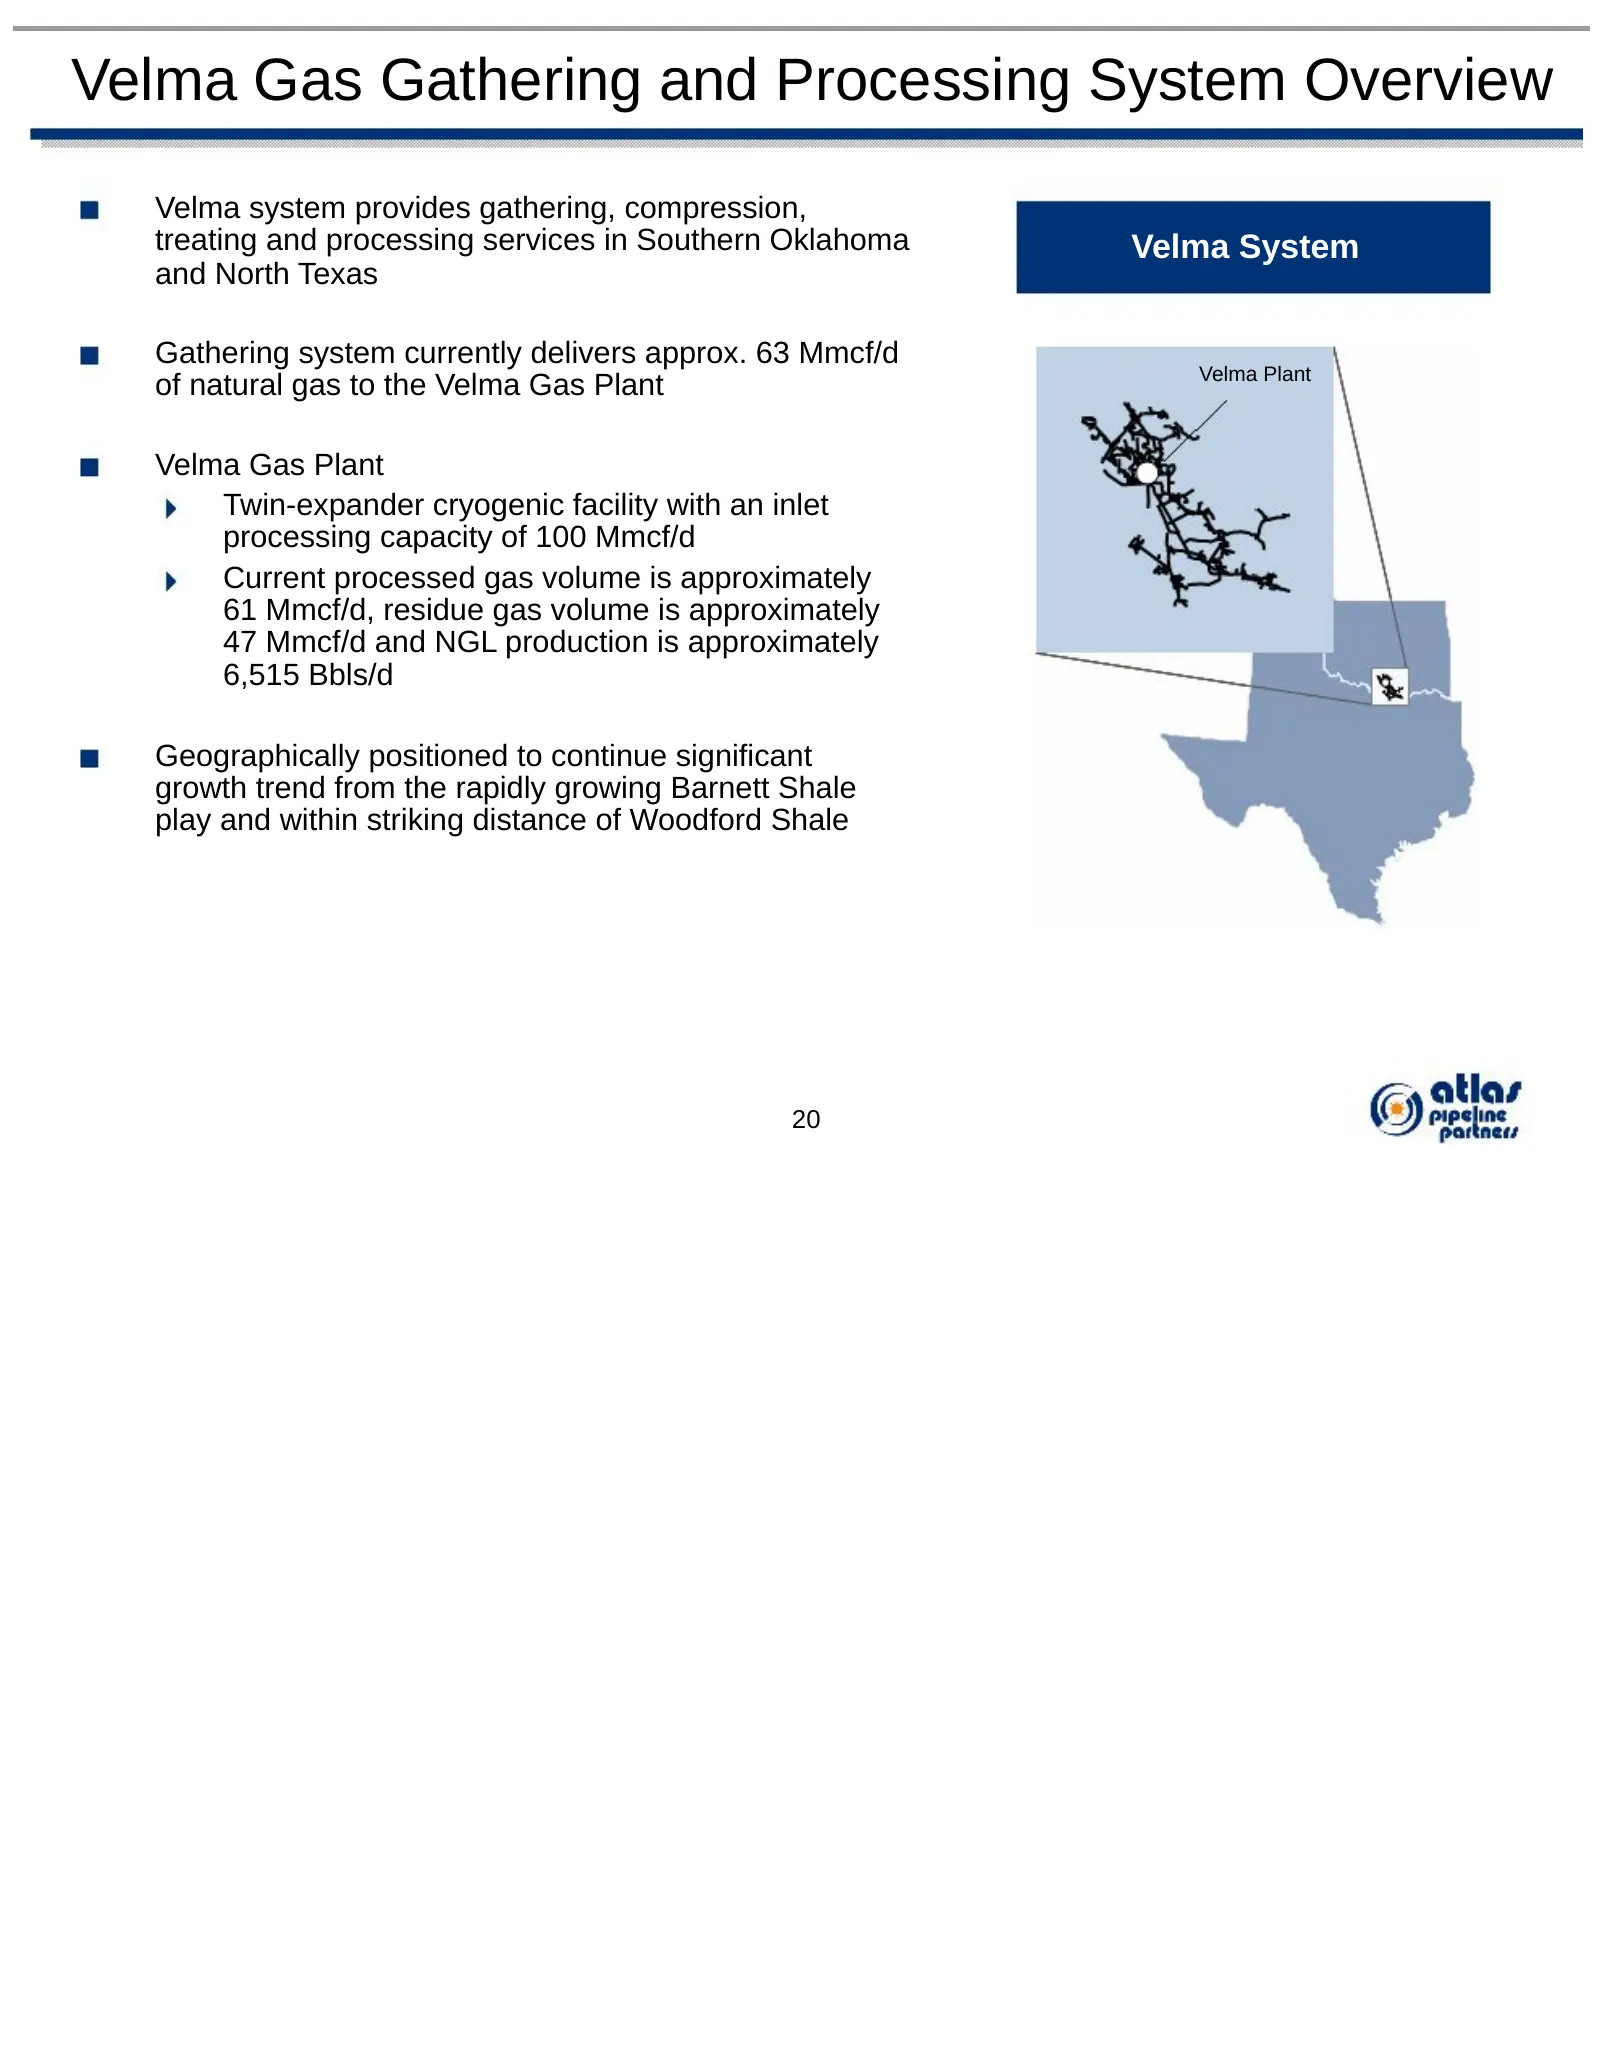
Velma Gas Gathering and Processing System Overview Velma system provides gathering, compression, treating and processing services in Southern Oklahoma Velma System and North Texas Gathering system currently delivers approx. 63 Mmcf/d Velma Plant of natural gas to the Velma Gas Plant Velma Gas Plant
Slide 22: Standalone Organic Growth Initiatives
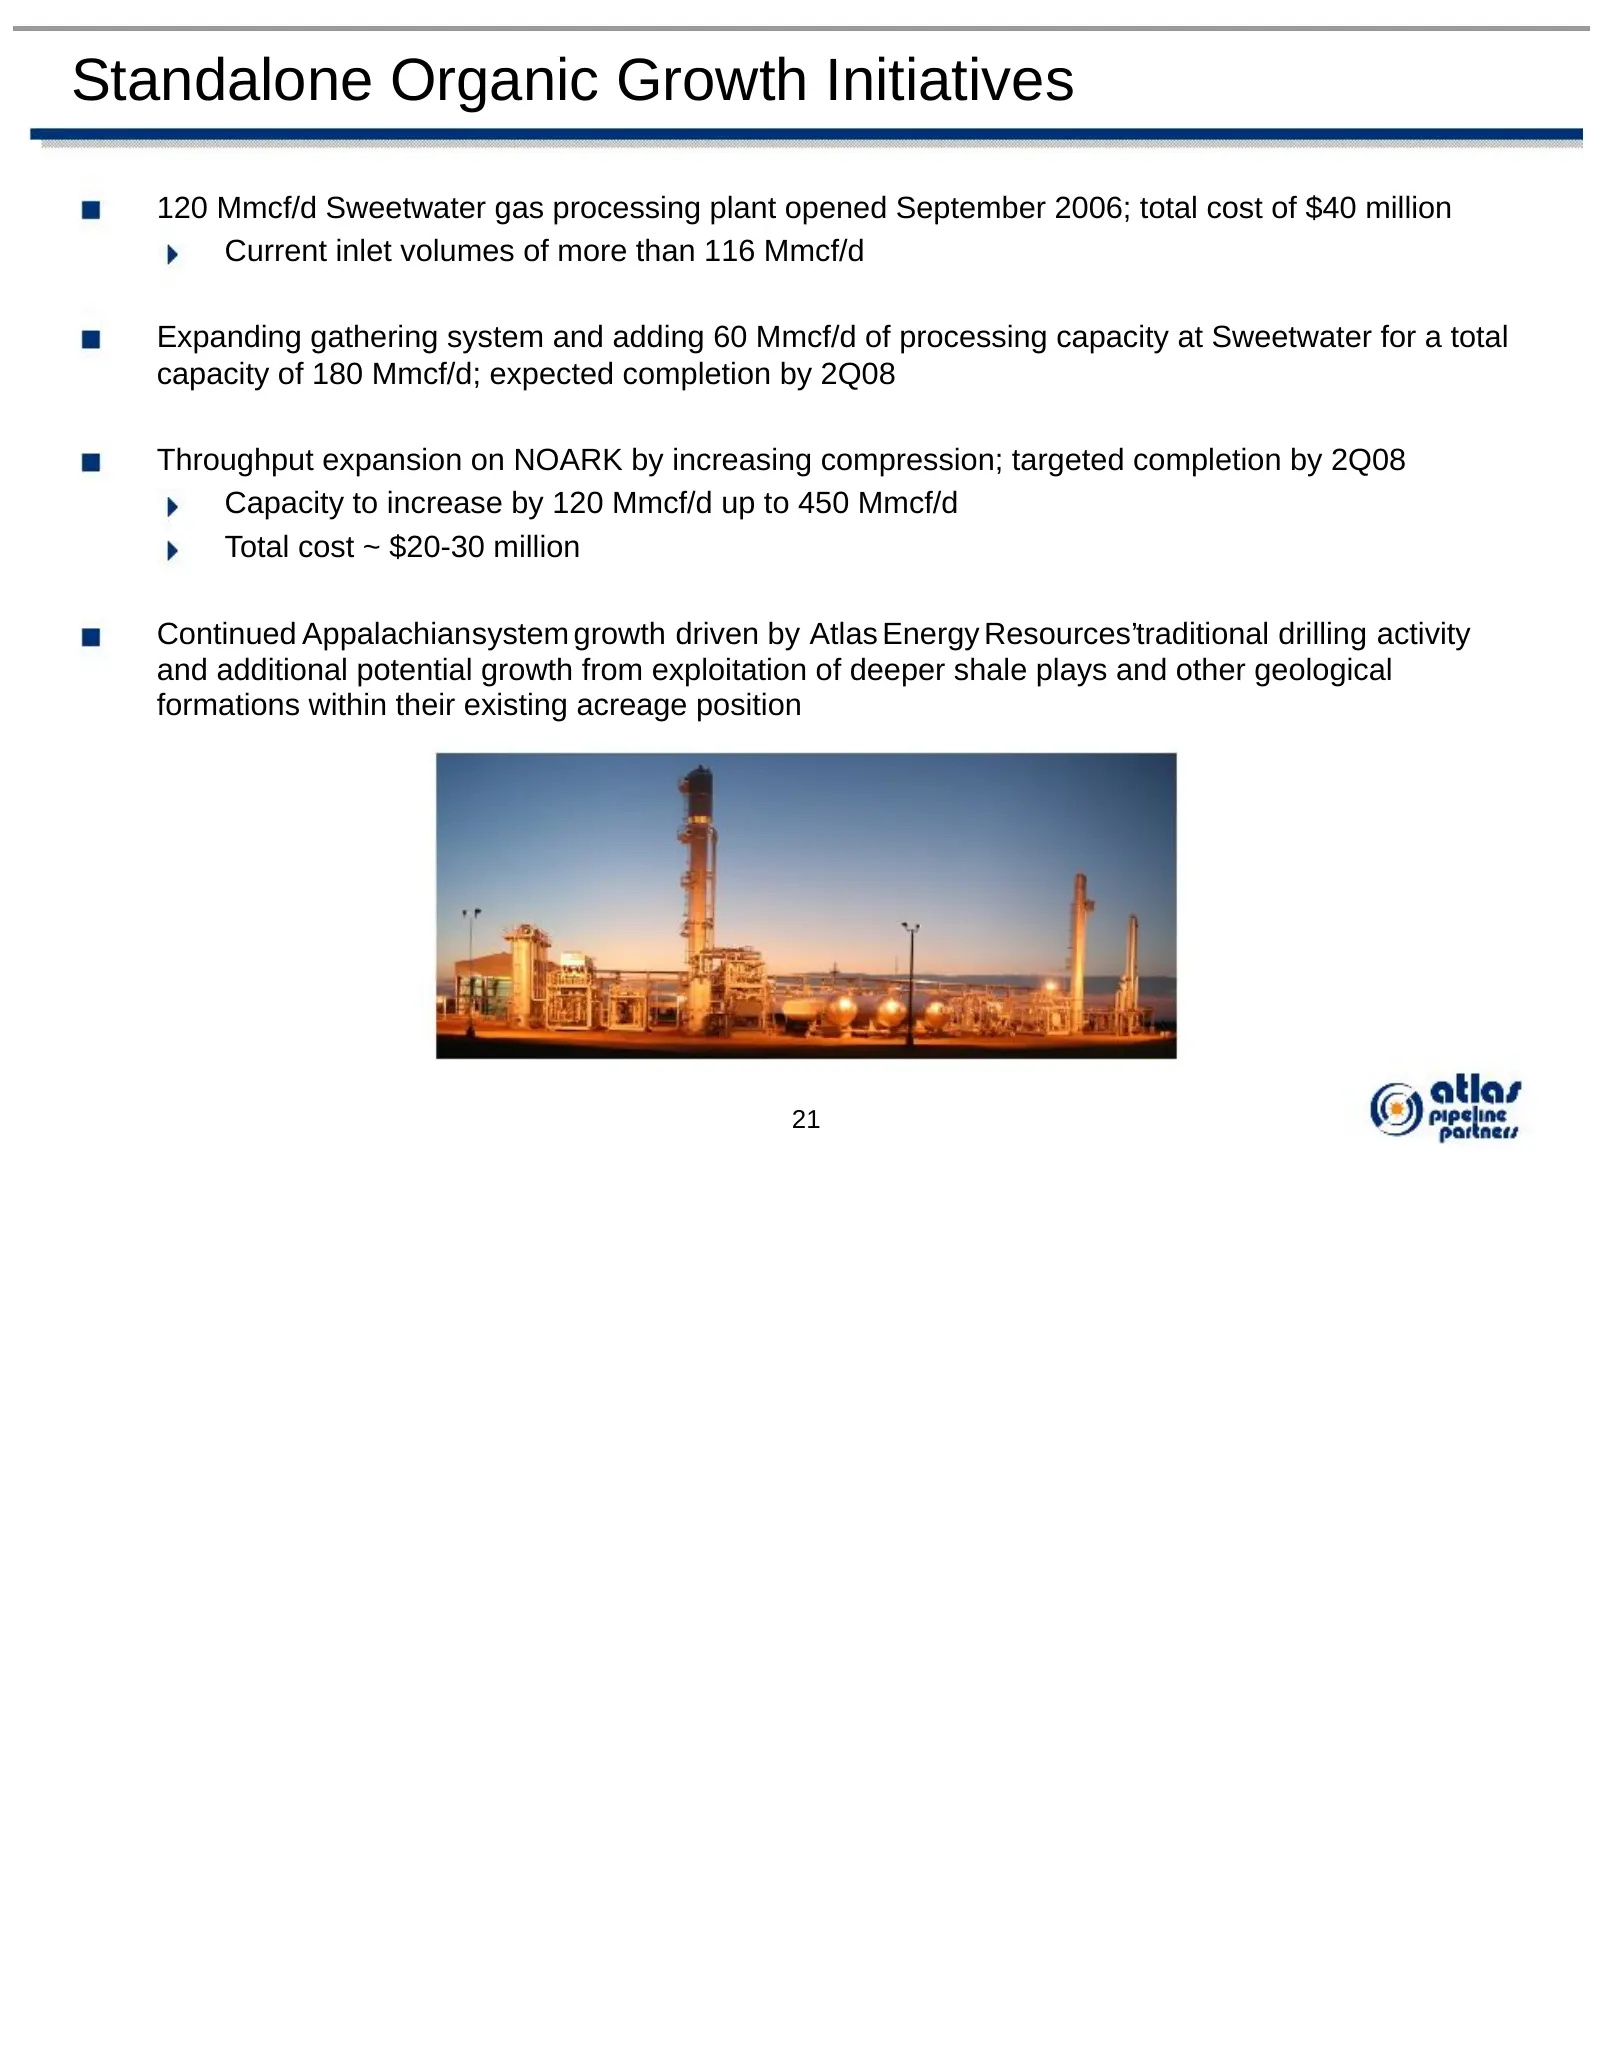
Standalone Organic Growth Initiatives 120 Mmcf/d Sweetwater gas processing plant opened September 2006; total cost of $40 million Current inlet volumes of more than 116 Mmcf/d Expanding gathering system and adding 60 Mmcf/d of processing capacity at Sweetwater for a total capacity of 180 Mmcf/d; exp
Slide 23: Target Assets Overview
* * * * * * * * * * * * * * * * * * * * * * * * Target Assets Overview
Slide 24: Target Assets Overview
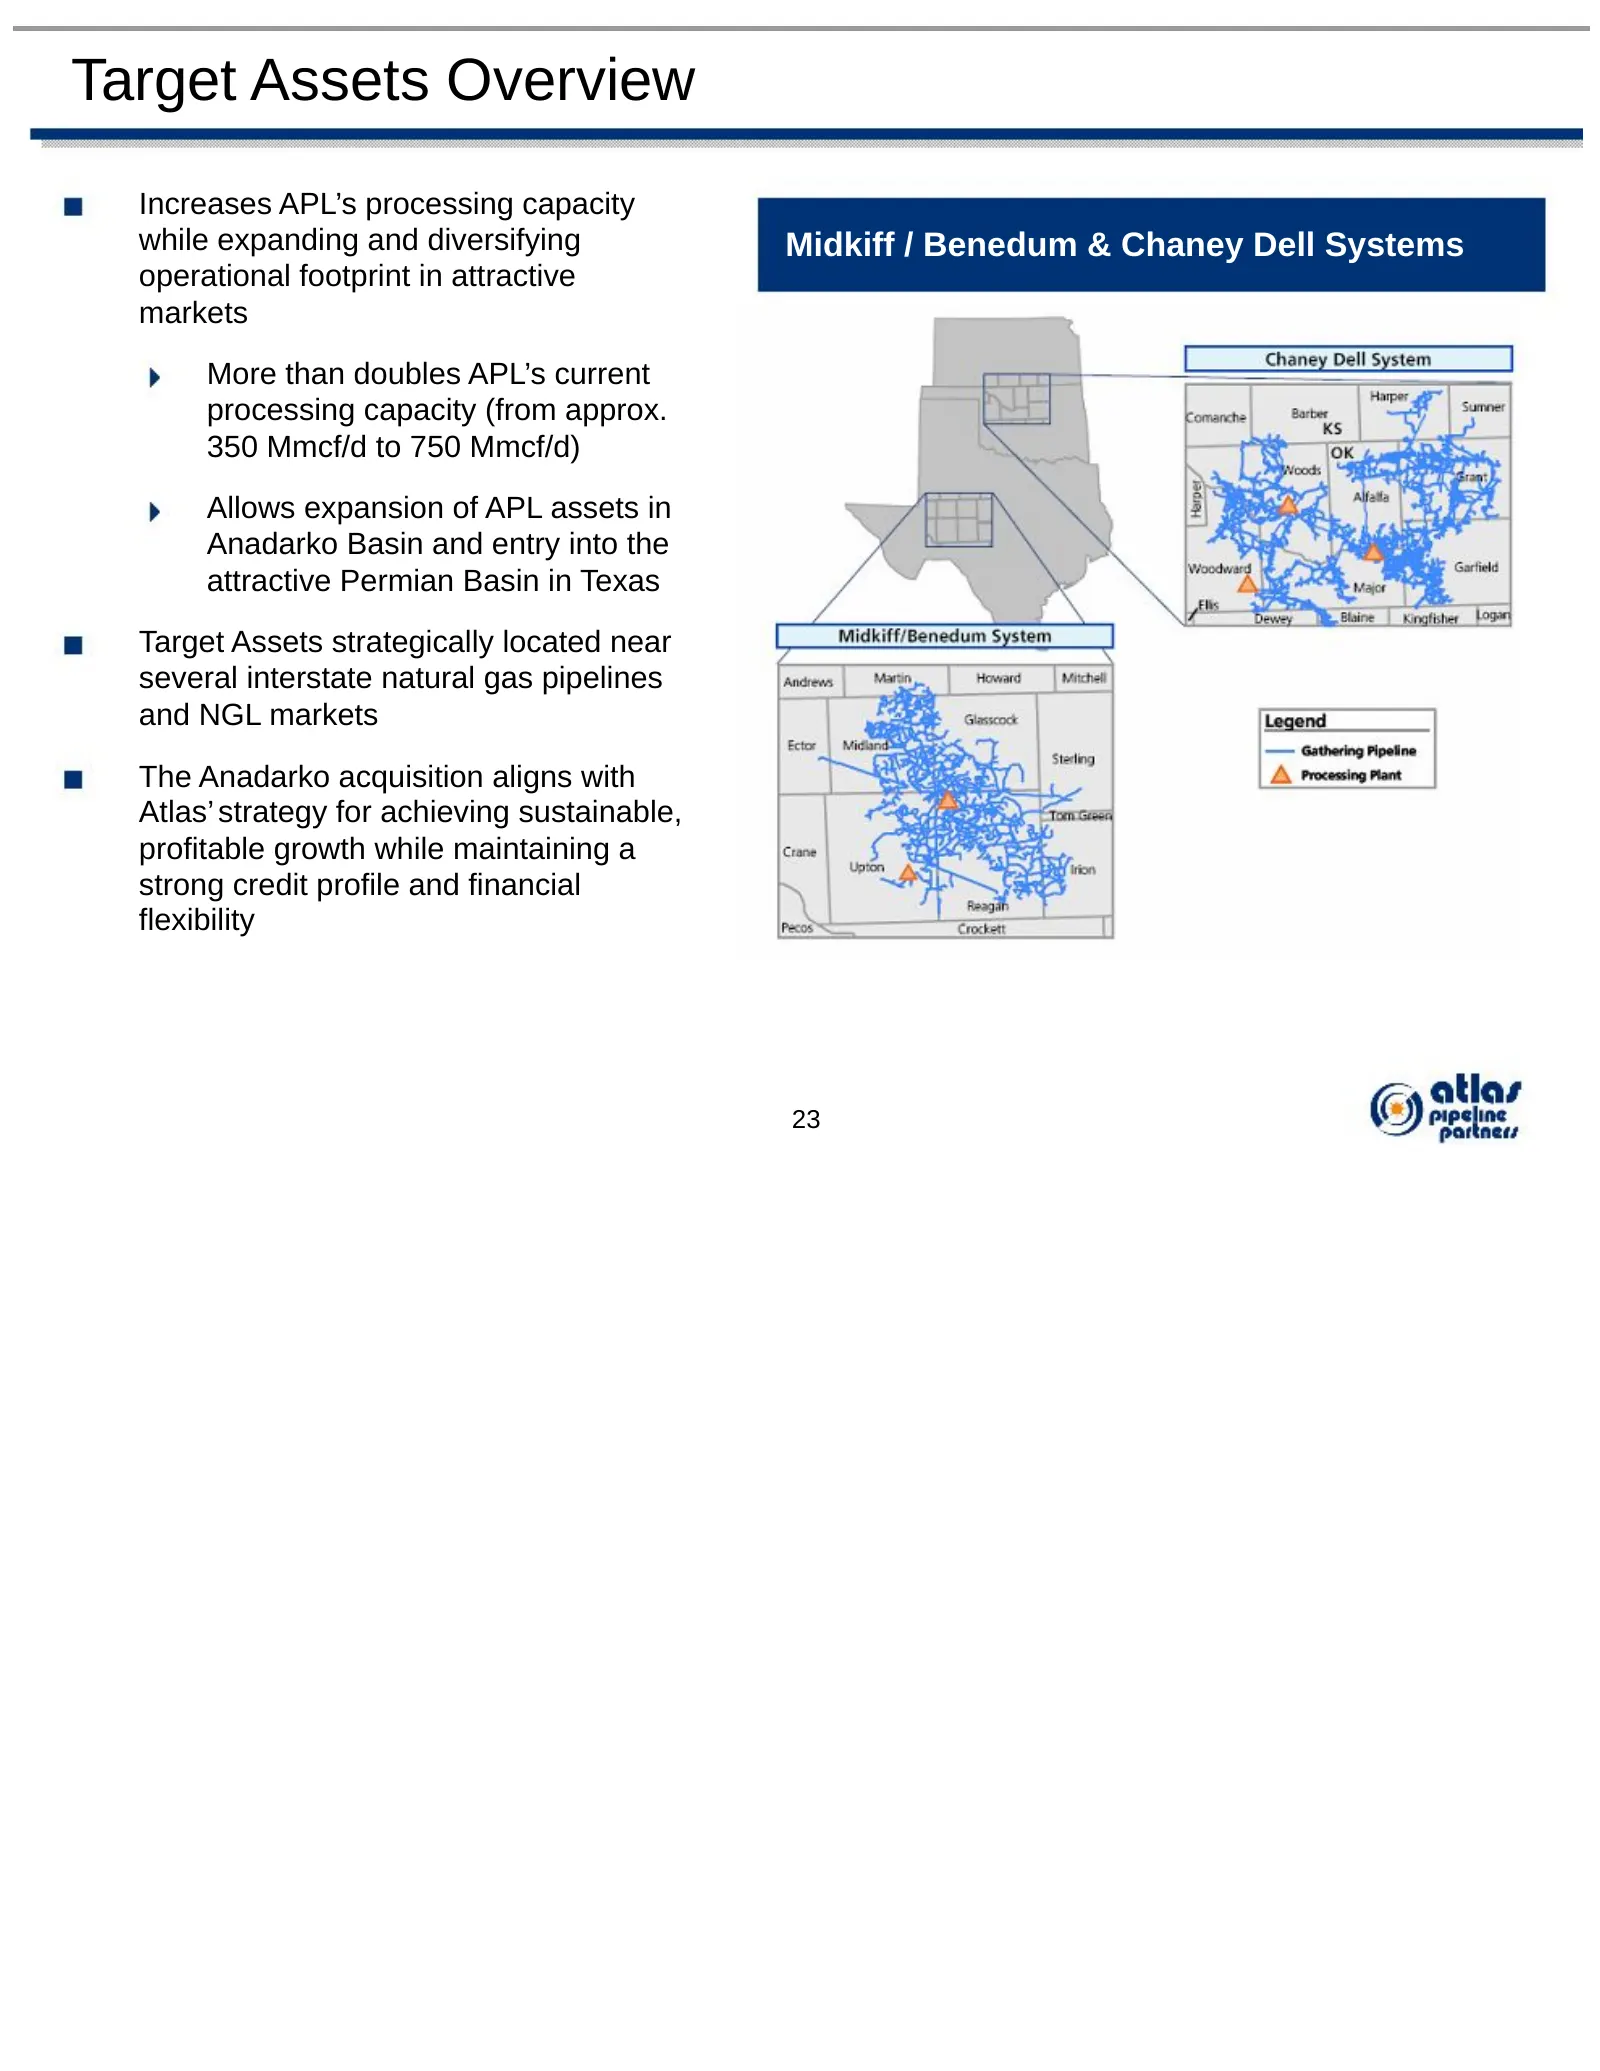
Target Assets Overview Increases APL’s processing capacity while expanding and diversifying Midkiff / Benedum & Chaney Dell Systems operational footprint in attractive markets More than doubles APL’s current processing capacity (from approx. 350 Mmcf/d to 750 Mmcf/d) Allows expansion of APL assets i
Slide 25: Chaney Dell & Midkiff / Benedum Production & Growth
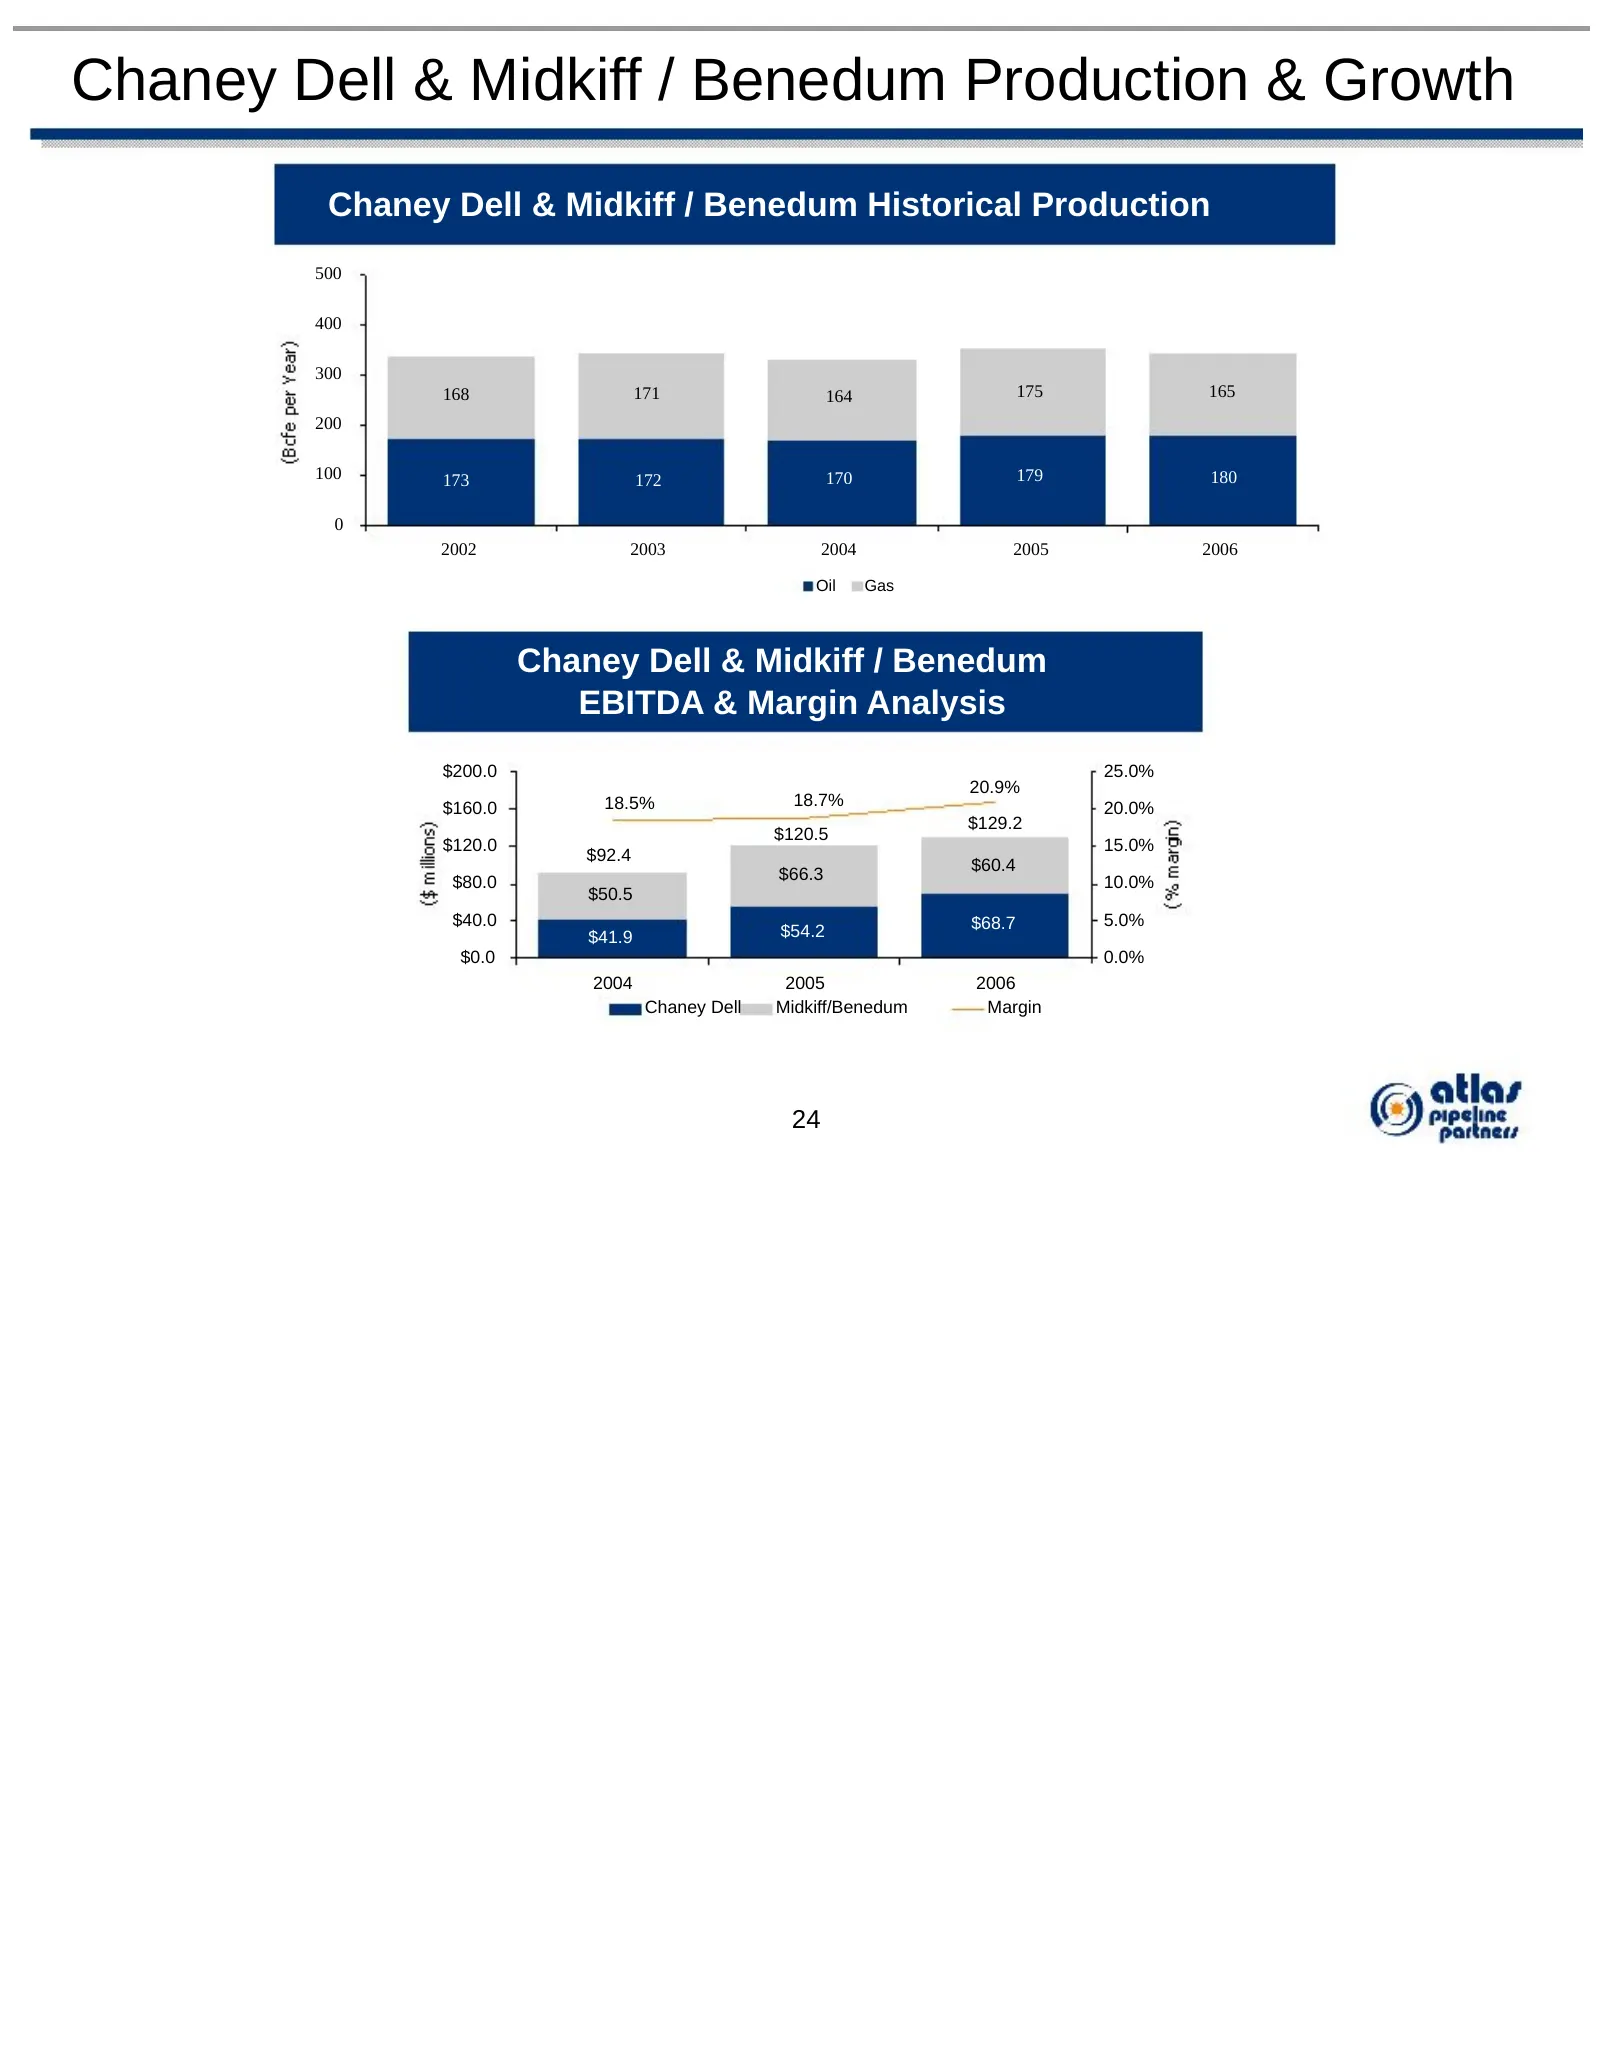
Chaney Dell & Midkiff / Benedum Production & Growth Chaney Dell & Midkiff / Benedum Historical Production 500 400 300 168 171 164 175 165 200 100 173 172 170 179 180 0 2002 2003 2004 2005 2006 Oil Gas Chaney Dell & Midkiff / Benedum EBITDA & Margin Analysis $200.0 25.0% 20.9% $160.0 18.5% 18.7% 20.0
Slide 26: Combined Growth Opportunities
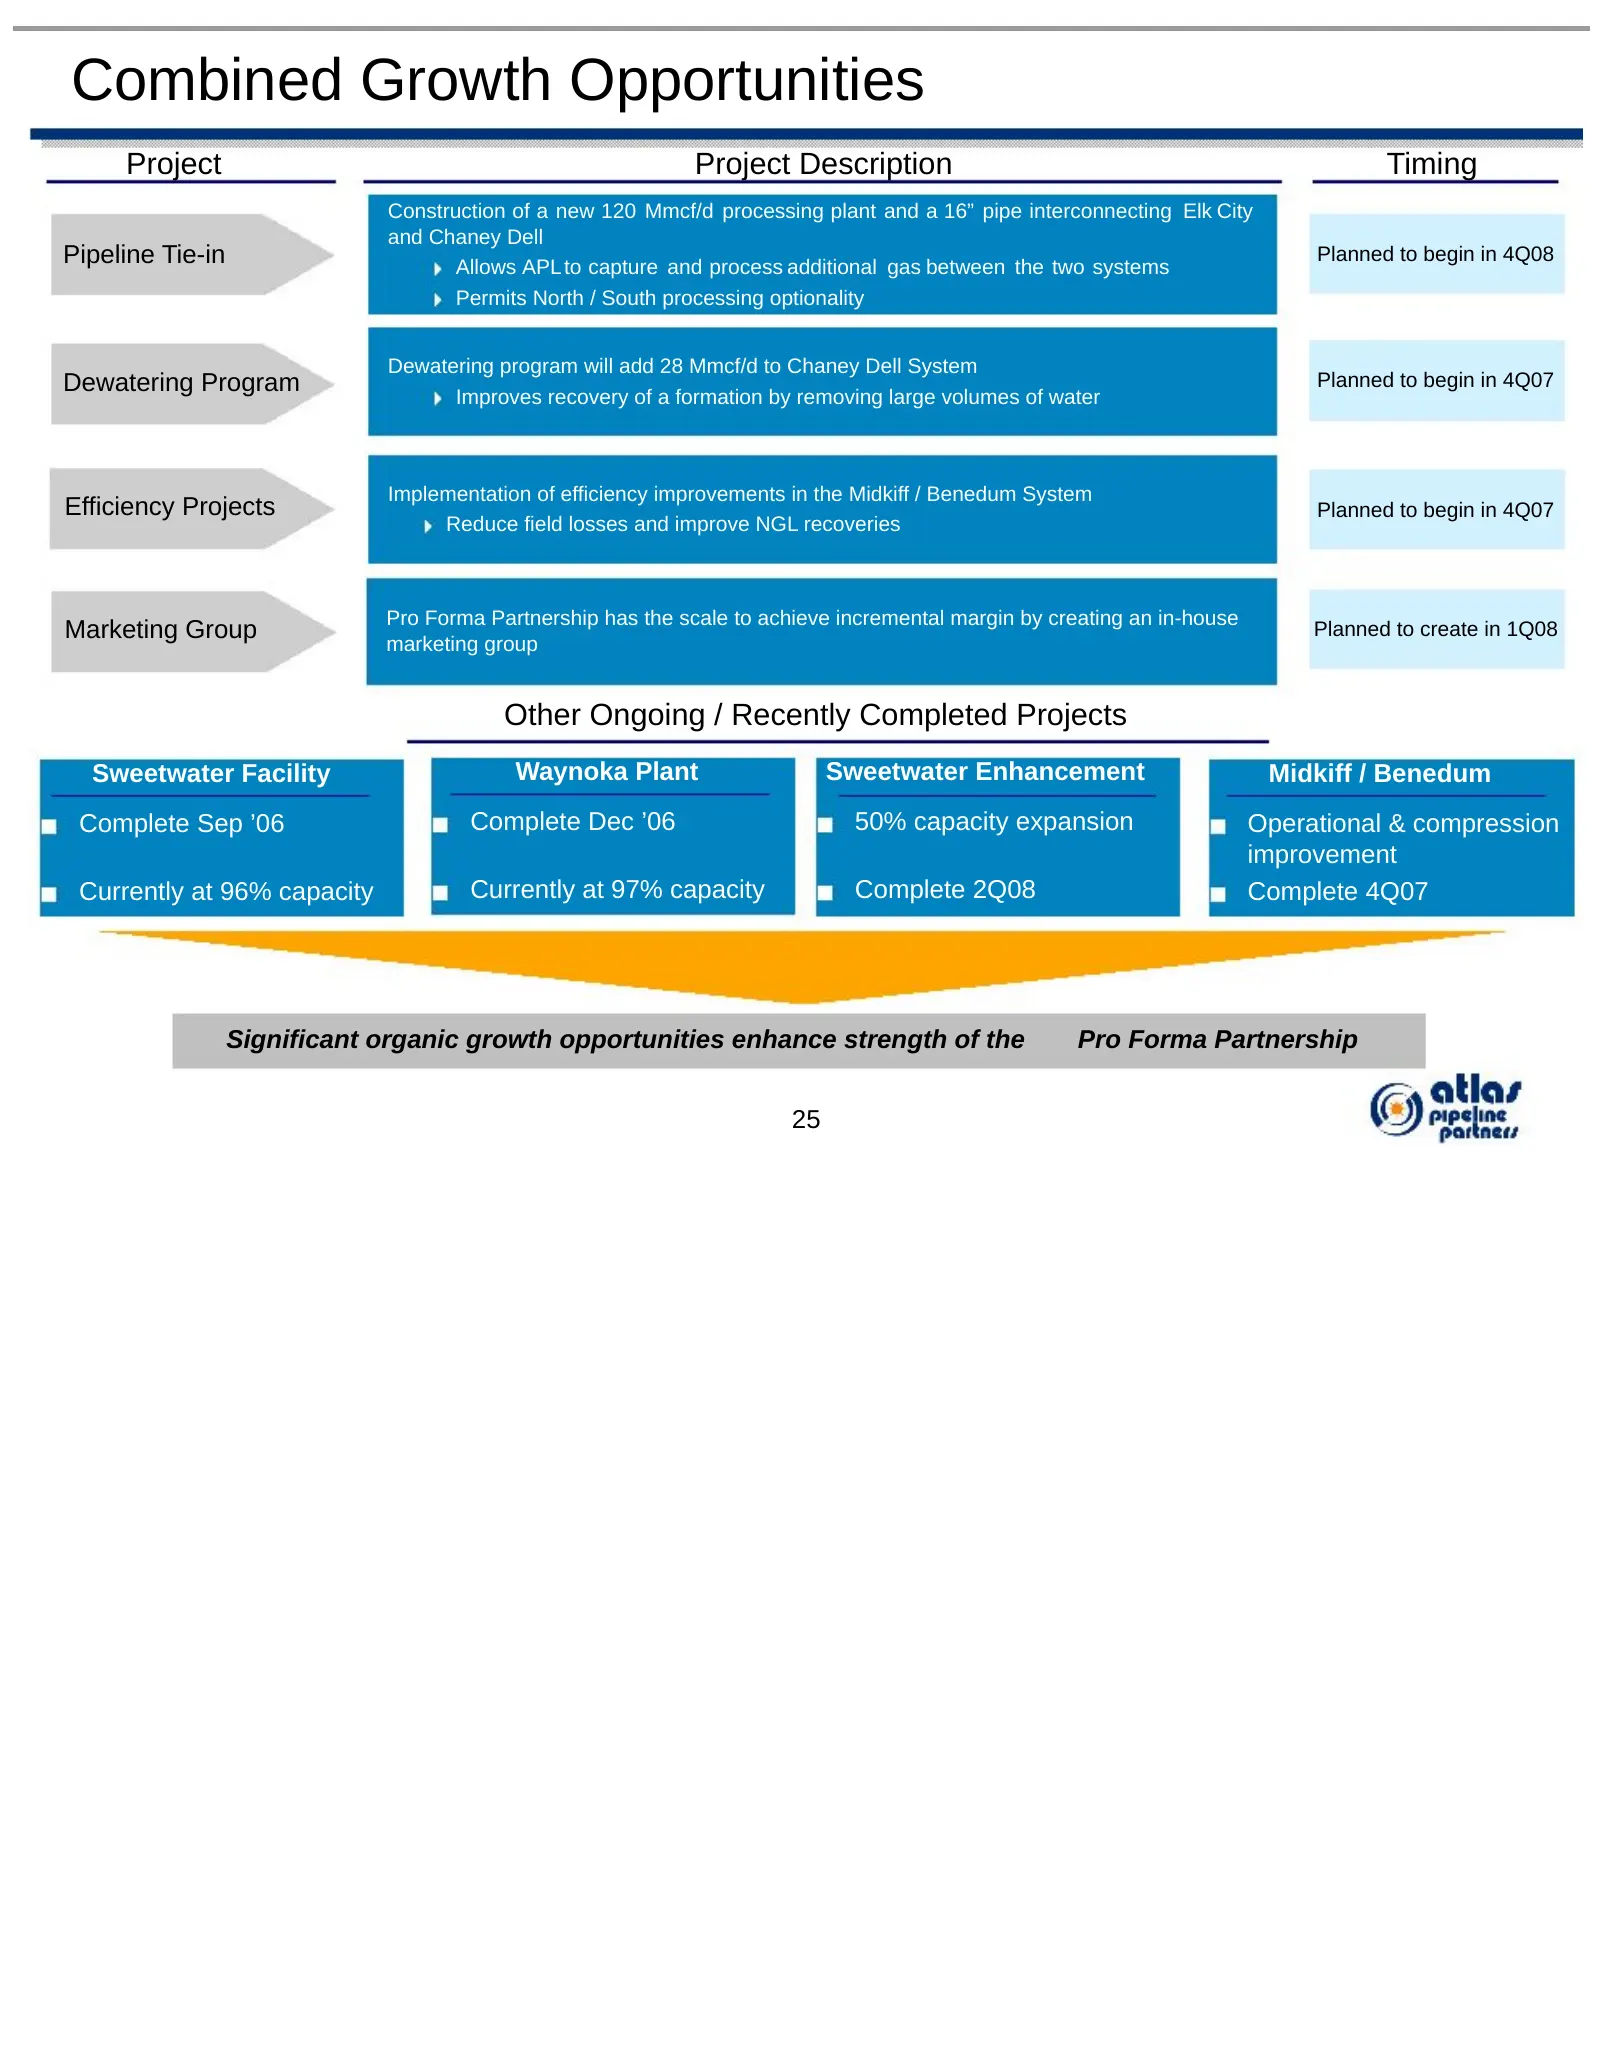
Combined Growth Opportunities Project Project Description Timing Construction of a new 120 Mmcf/d processing plant and a 16” pipe interconnecting Elk City and Chaney Dell Pipeline Tie-in Allows APL to capture and process additional gas between the two systems Planned to begin in 4Q08 Permits North /
Slide 27: Chaney Dell System
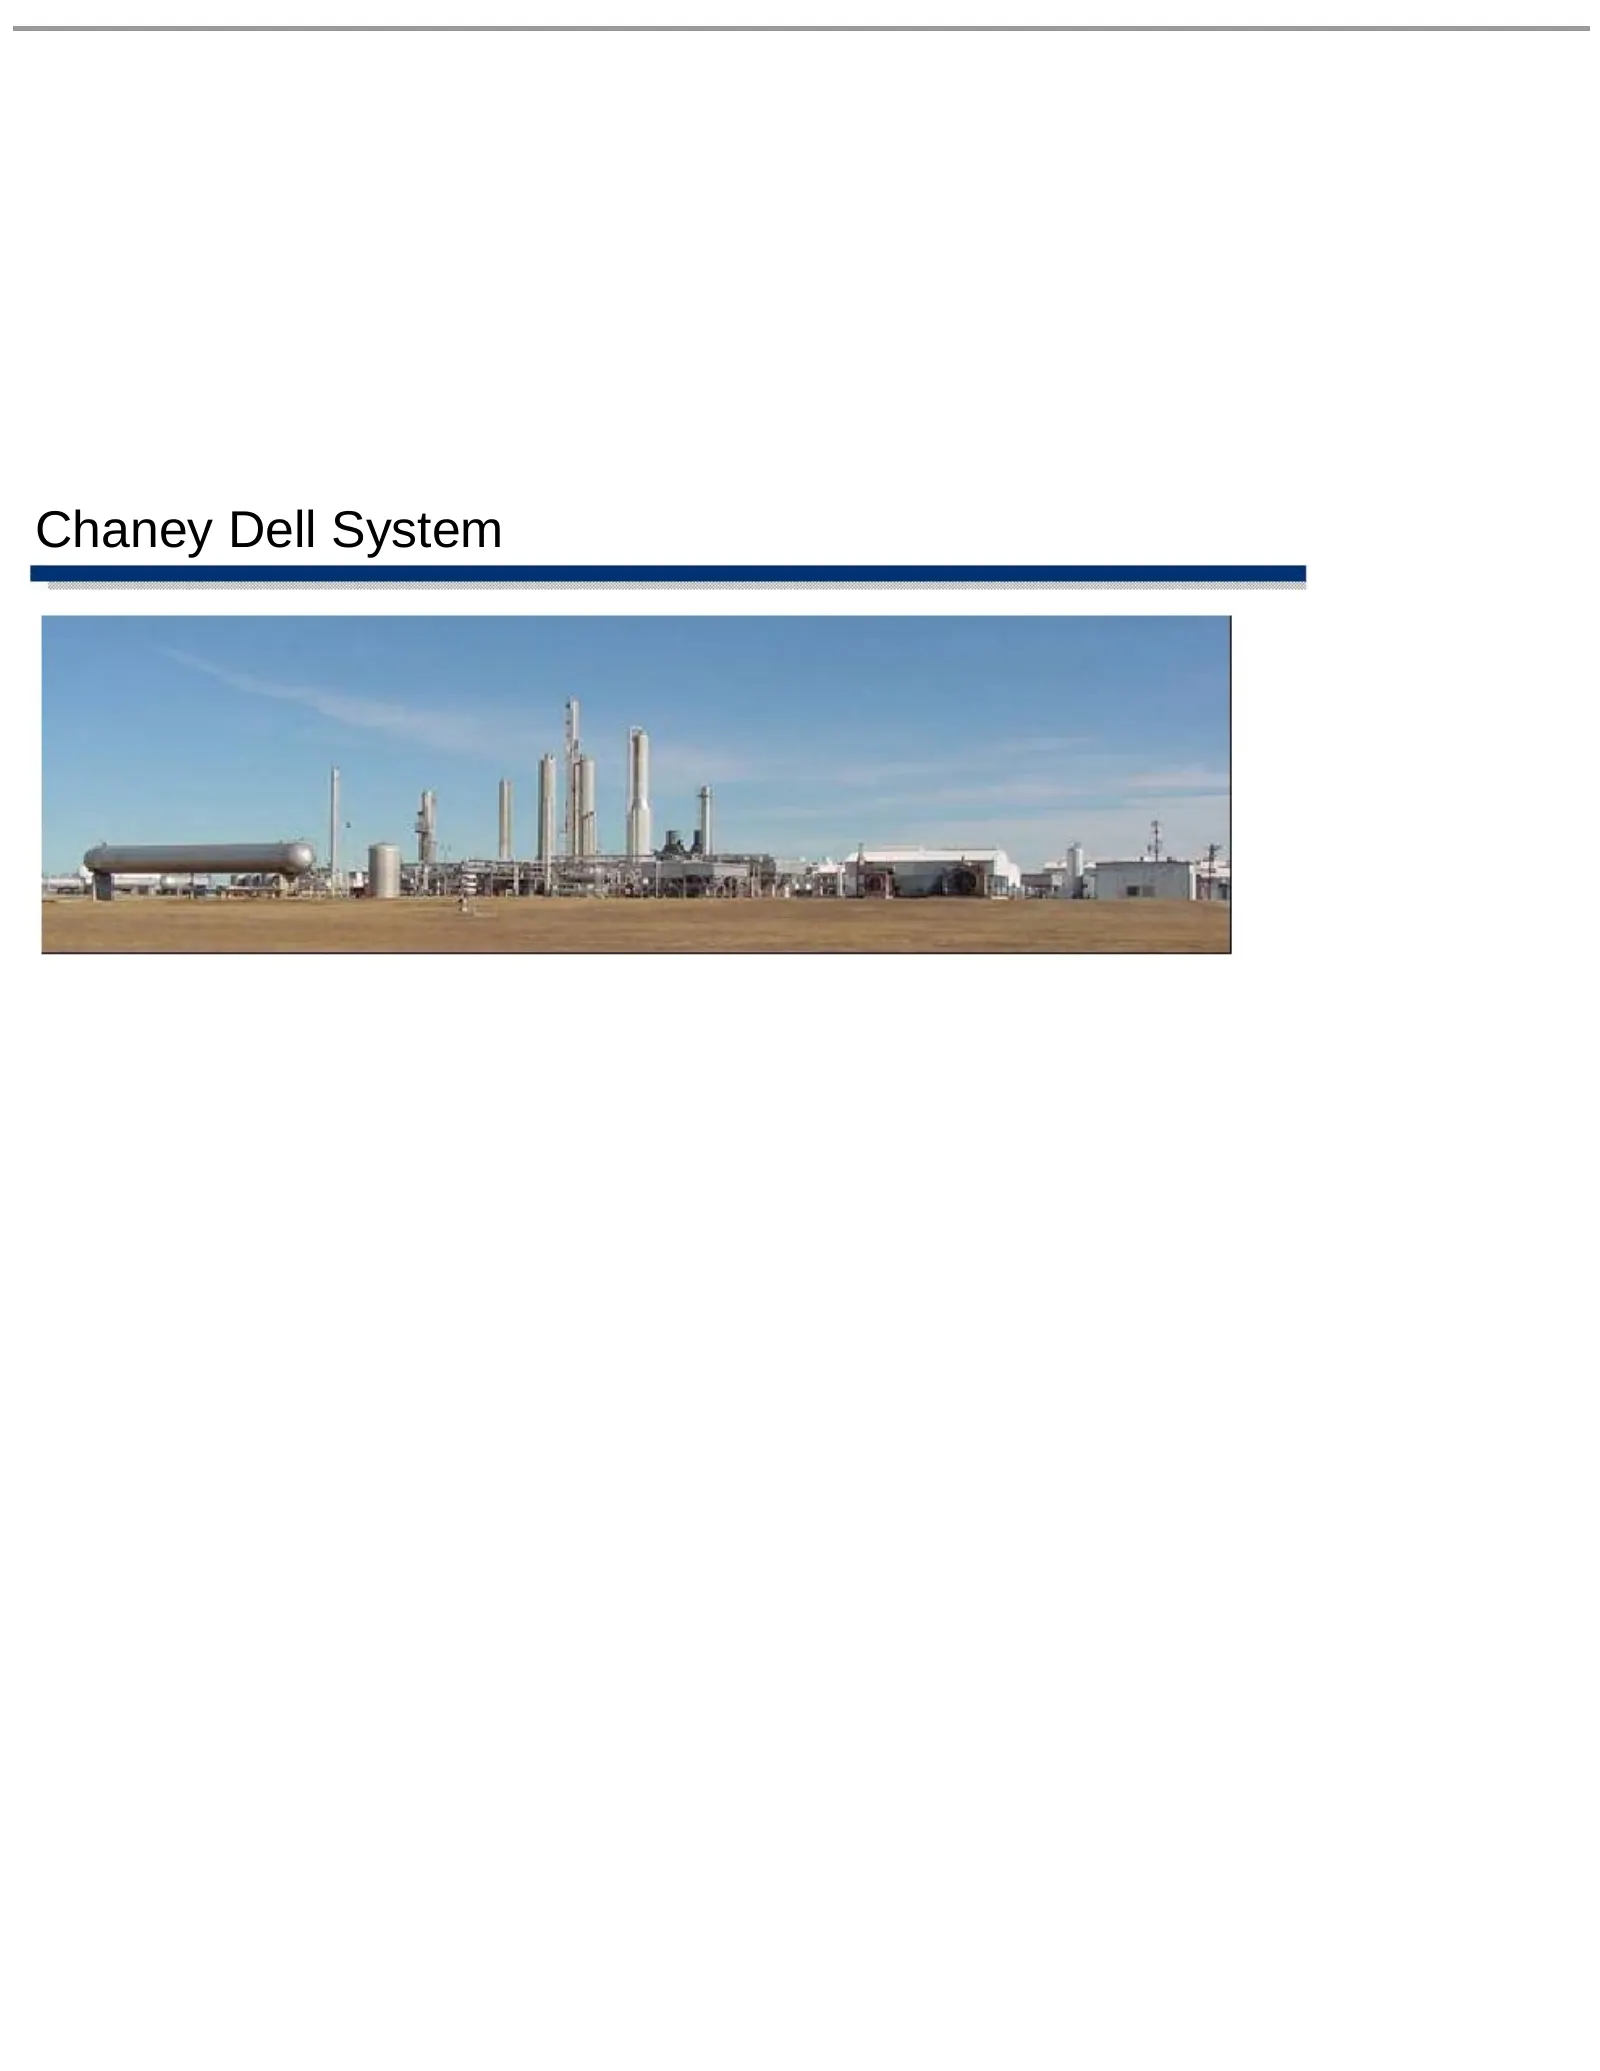
* * * * * * * * * * * * * * * * * * * * * * * * Chaney Dell System
Slide 28: Chaney Dell System Summary
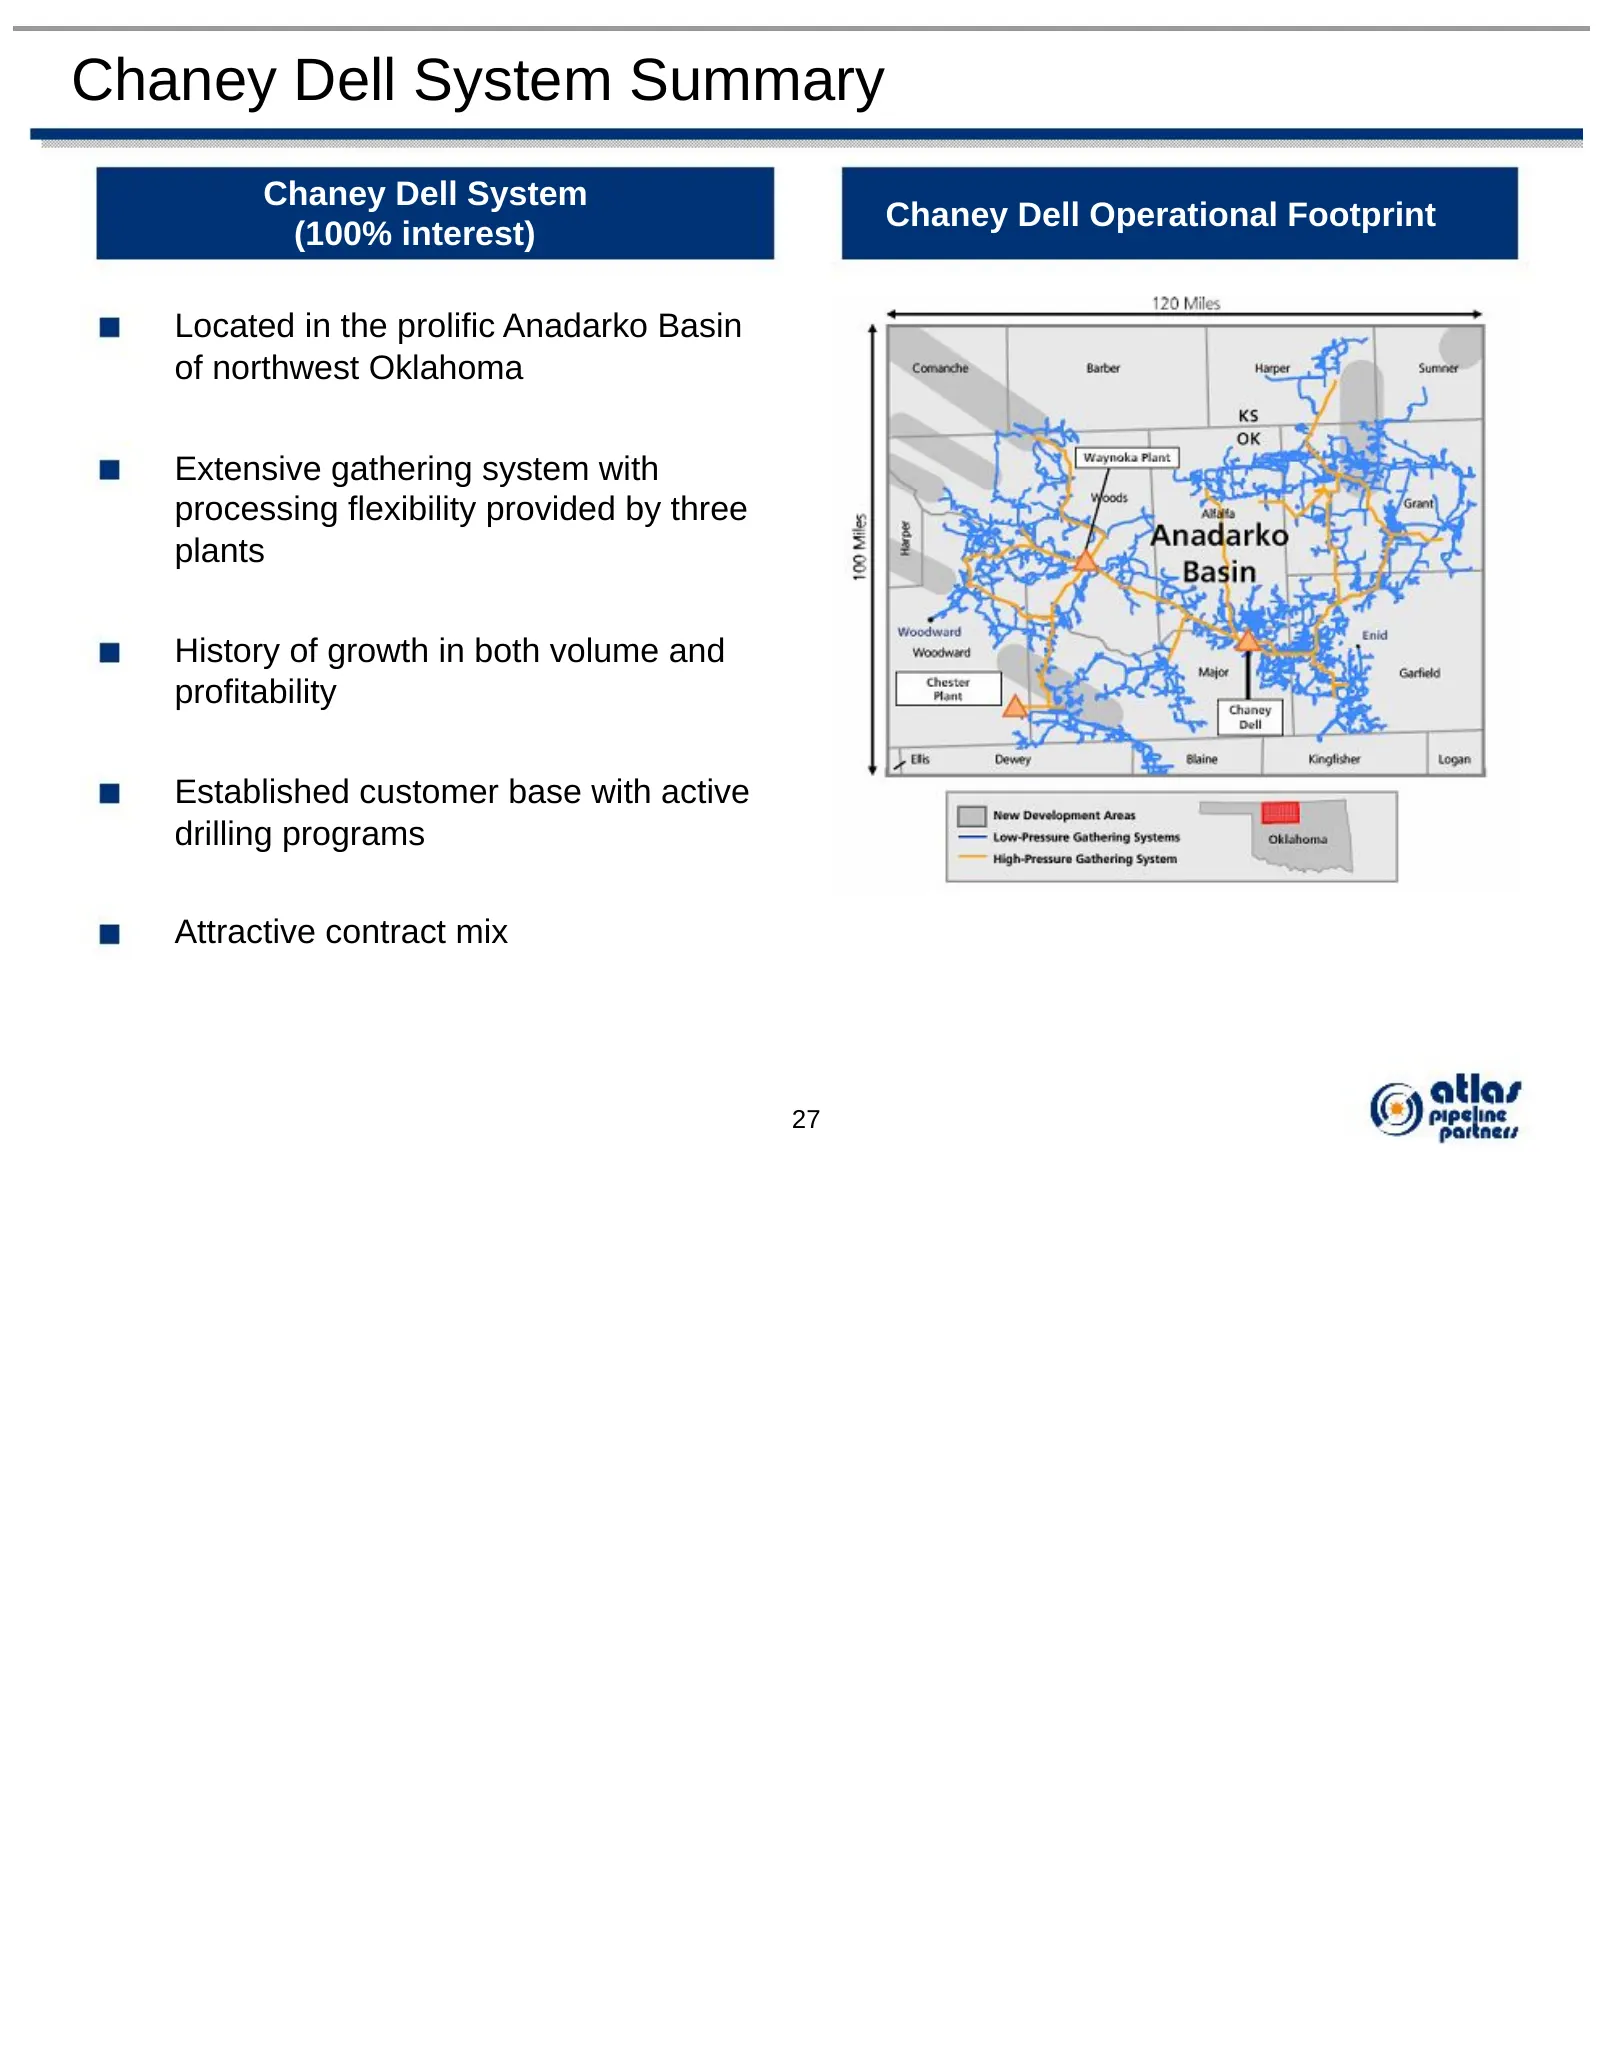
Chaney Dell System Summary Chaney Dell System Chaney Dell Operational Footprint (100% interest) Located in the prolific Anadarko Basin of northwest Oklahoma Extensive gathering system with processing flexibility provided by three plants History of growth in both volume and profitability Established
Slide 29: Chaney Dell System Key Characteristics
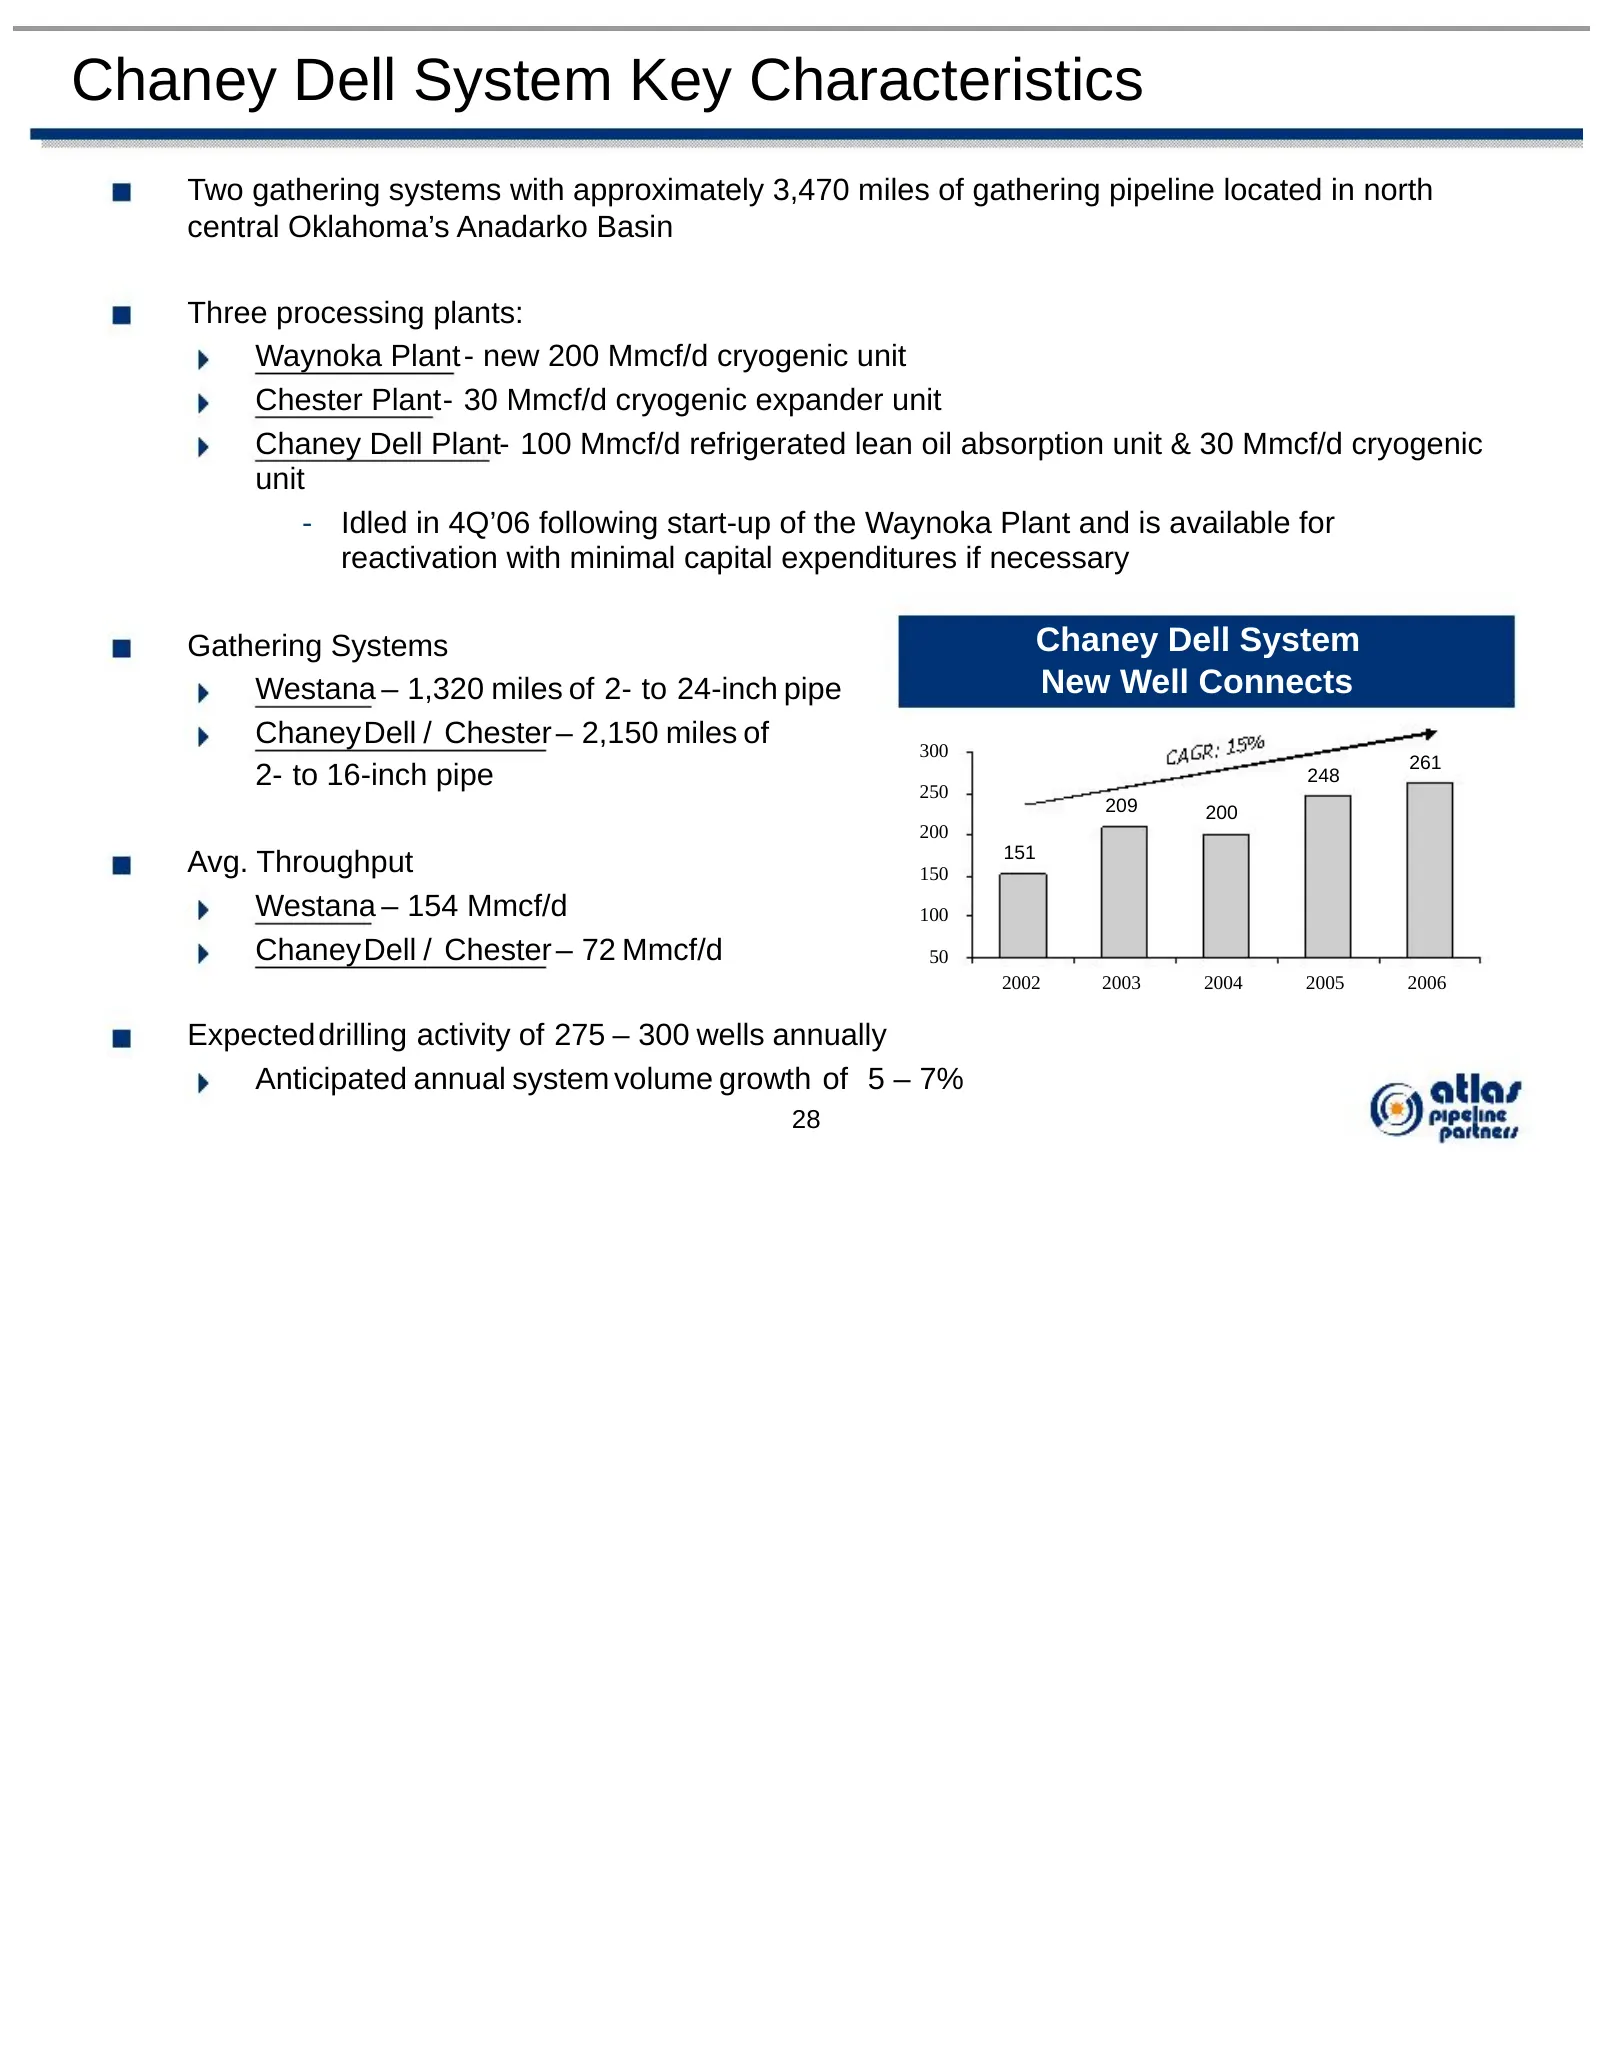
Chaney Dell System Key Characteristics Two gathering systems with approximately 3,470 miles of gathering pipeline located in north central Oklahoma’s Anadarko Basin Three processing plants: Waynoka Plant - new 200 Mmcf/d cryogenic unit Chester Plant- 30 Mmcf/d cryogenic expander unit Chaney Dell Pla
Slide 30: Chaney Dell Customer Base
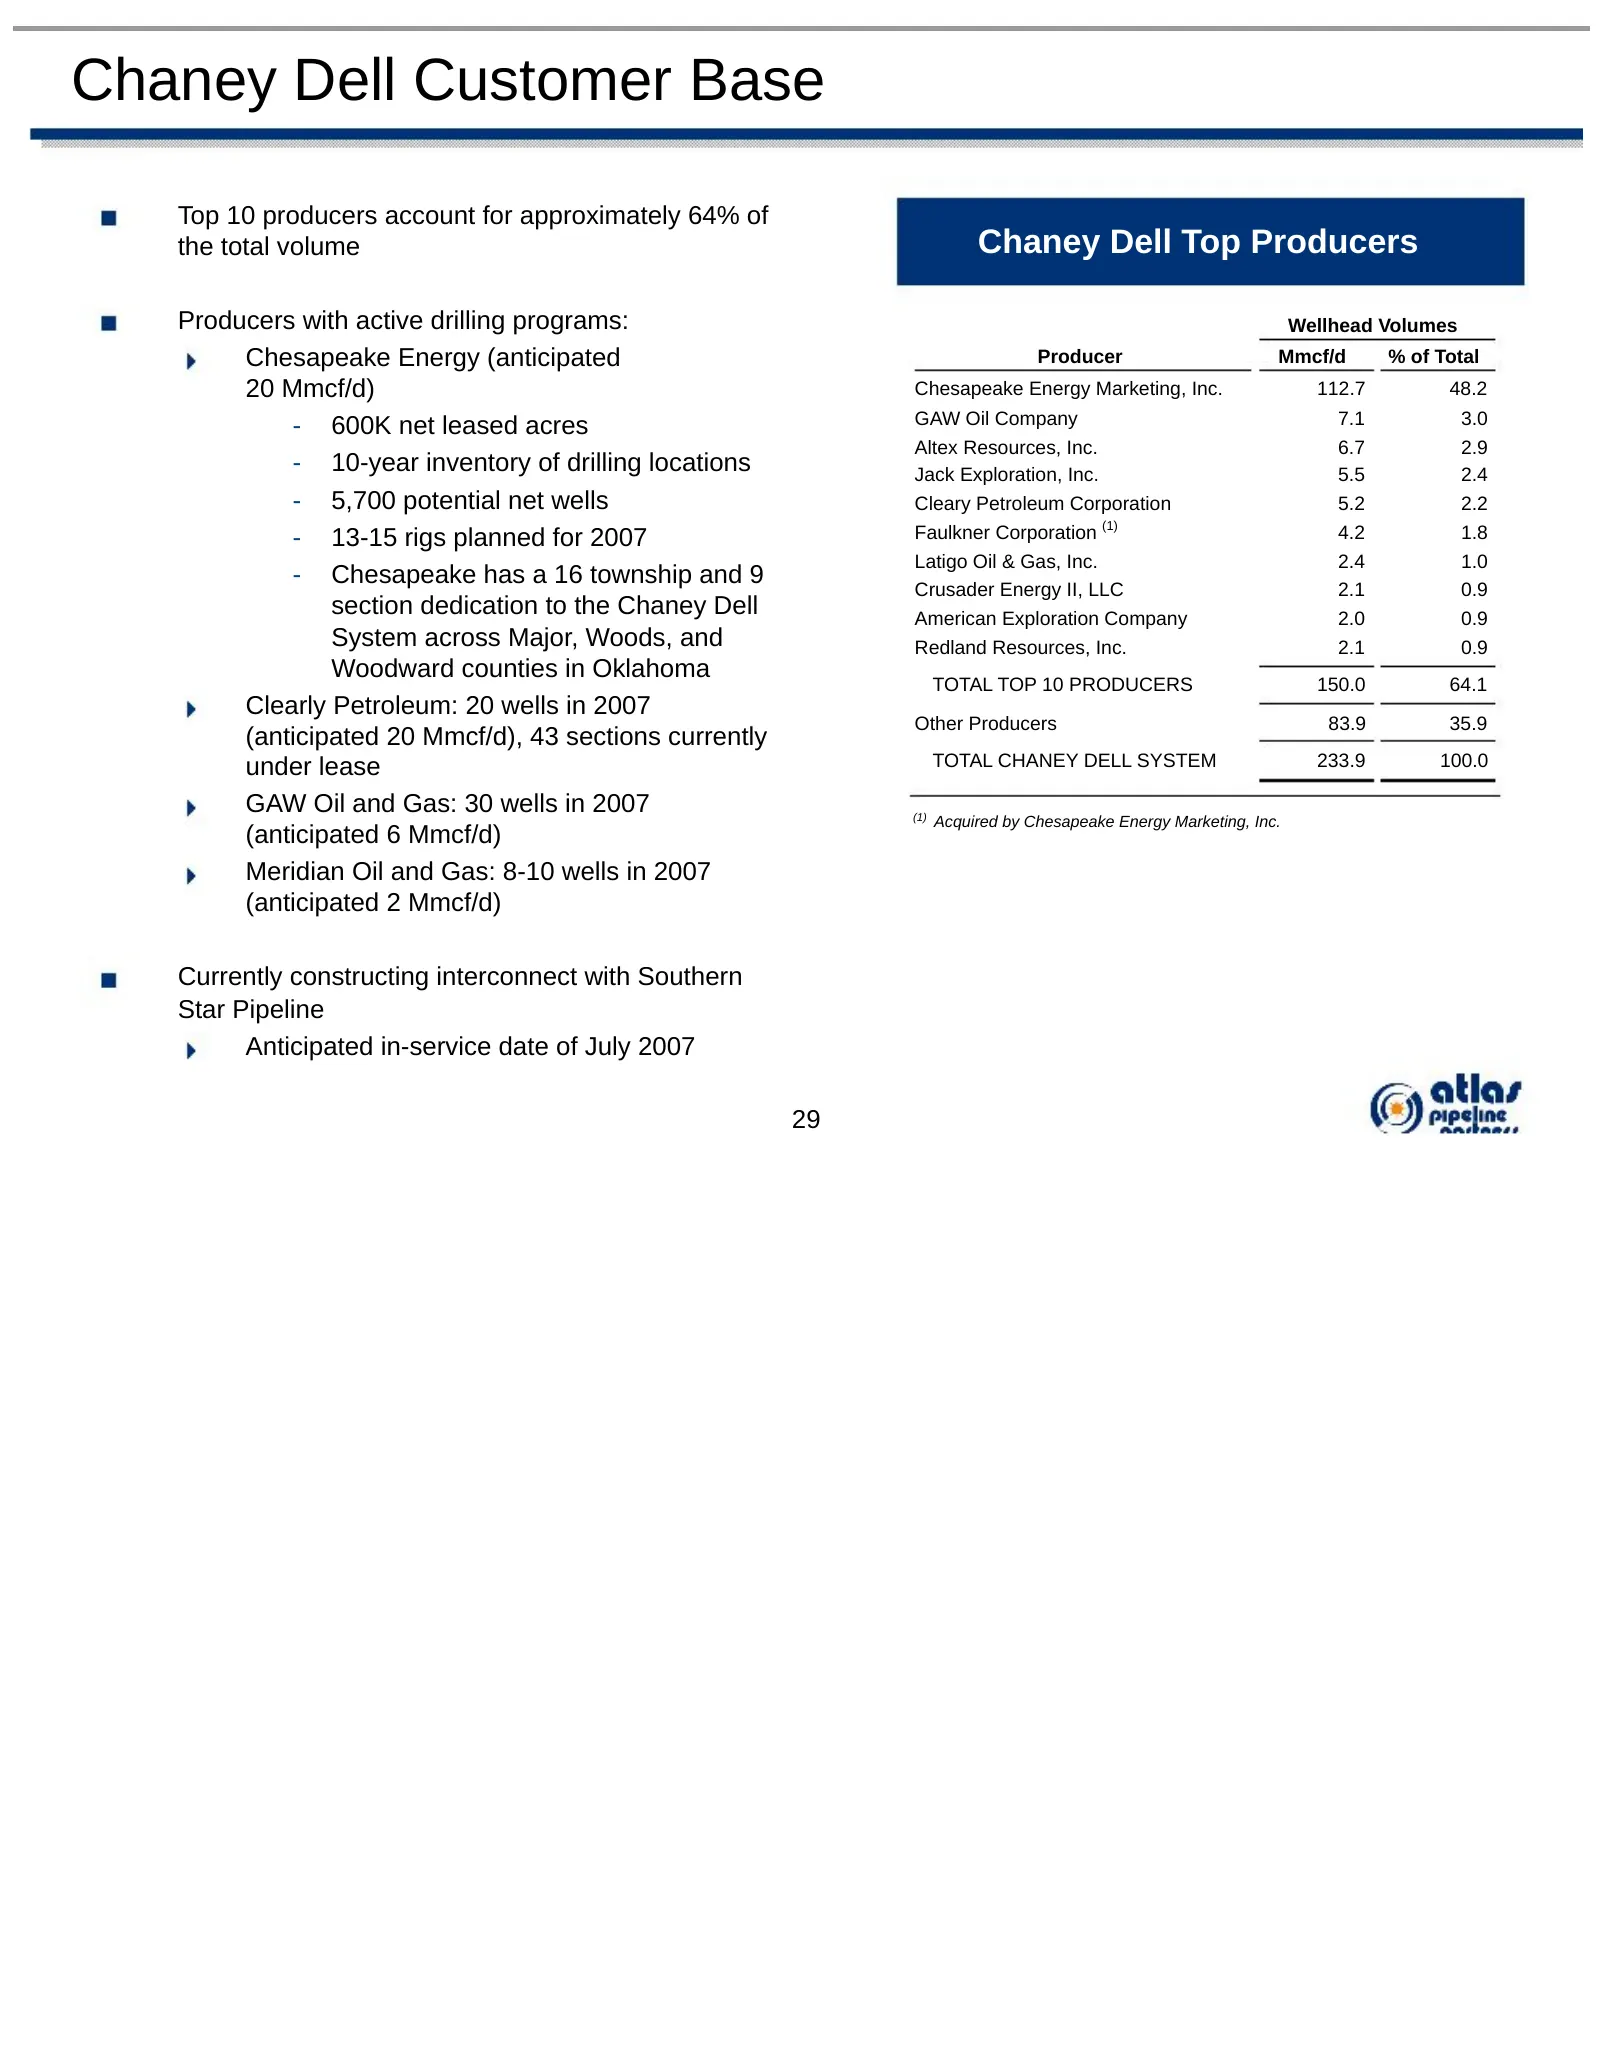
Chaney Dell Customer Base Top 10 producers account for approximately 64% of the total volume Chaney Dell Top Producers Producers with active drilling programs: Wellhead Volumes Chesapeake Energy (anticipated Producer Mmcf/d % of Total 20 Mmcf/d) Chesapeake Energy Marketing, Inc. 112.7 48.2 GAW Oil C
Slide 31: Chaney Dell Contract Overview
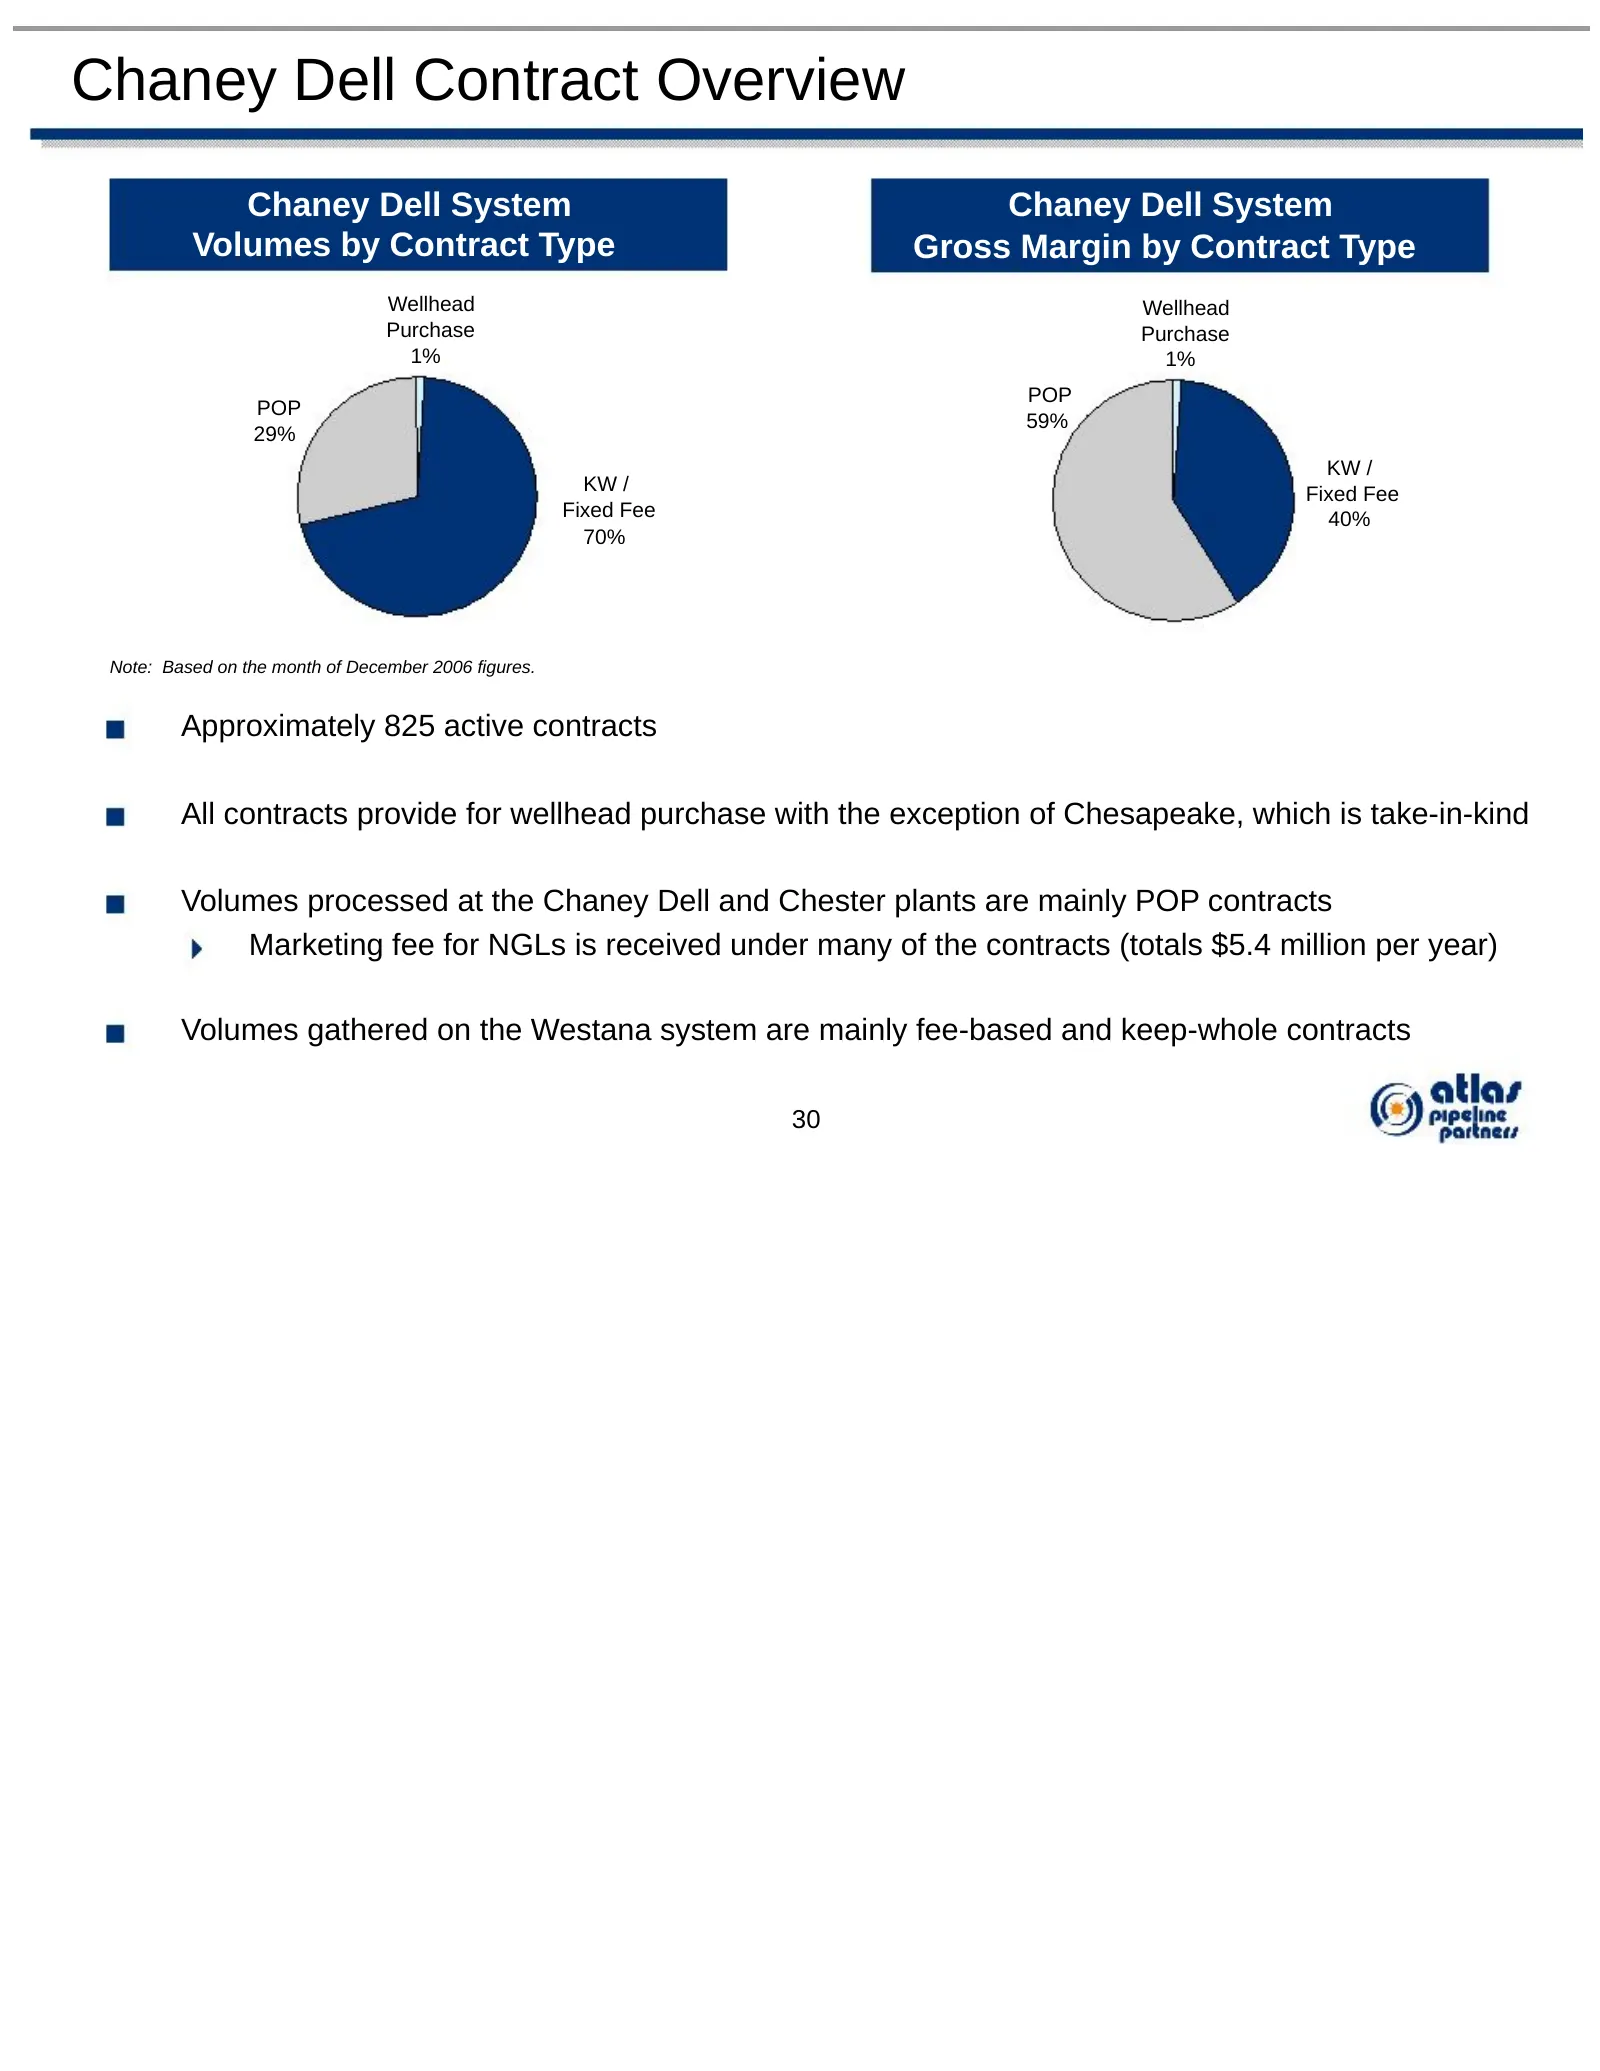
Chaney Dell Contract Overview Chaney Dell System Chaney Dell System Volumes by Contract Type Gross Margin by Contract Type Wellhead Wellhead Purchase Purchase 1% 1% POP POP 59% 29% KW / KW / Fixed Fee Fixed Fee 40% 70% Note: Based on the month of December 2006 figures. Approximately 825 active contr
Slide 32: Midkiff / Benedum System
* * * * * * * * * * * * * * * * * * * * * * * * Midkiff / Benedum System
Slide 33: Midkiff / Benedum System Overview
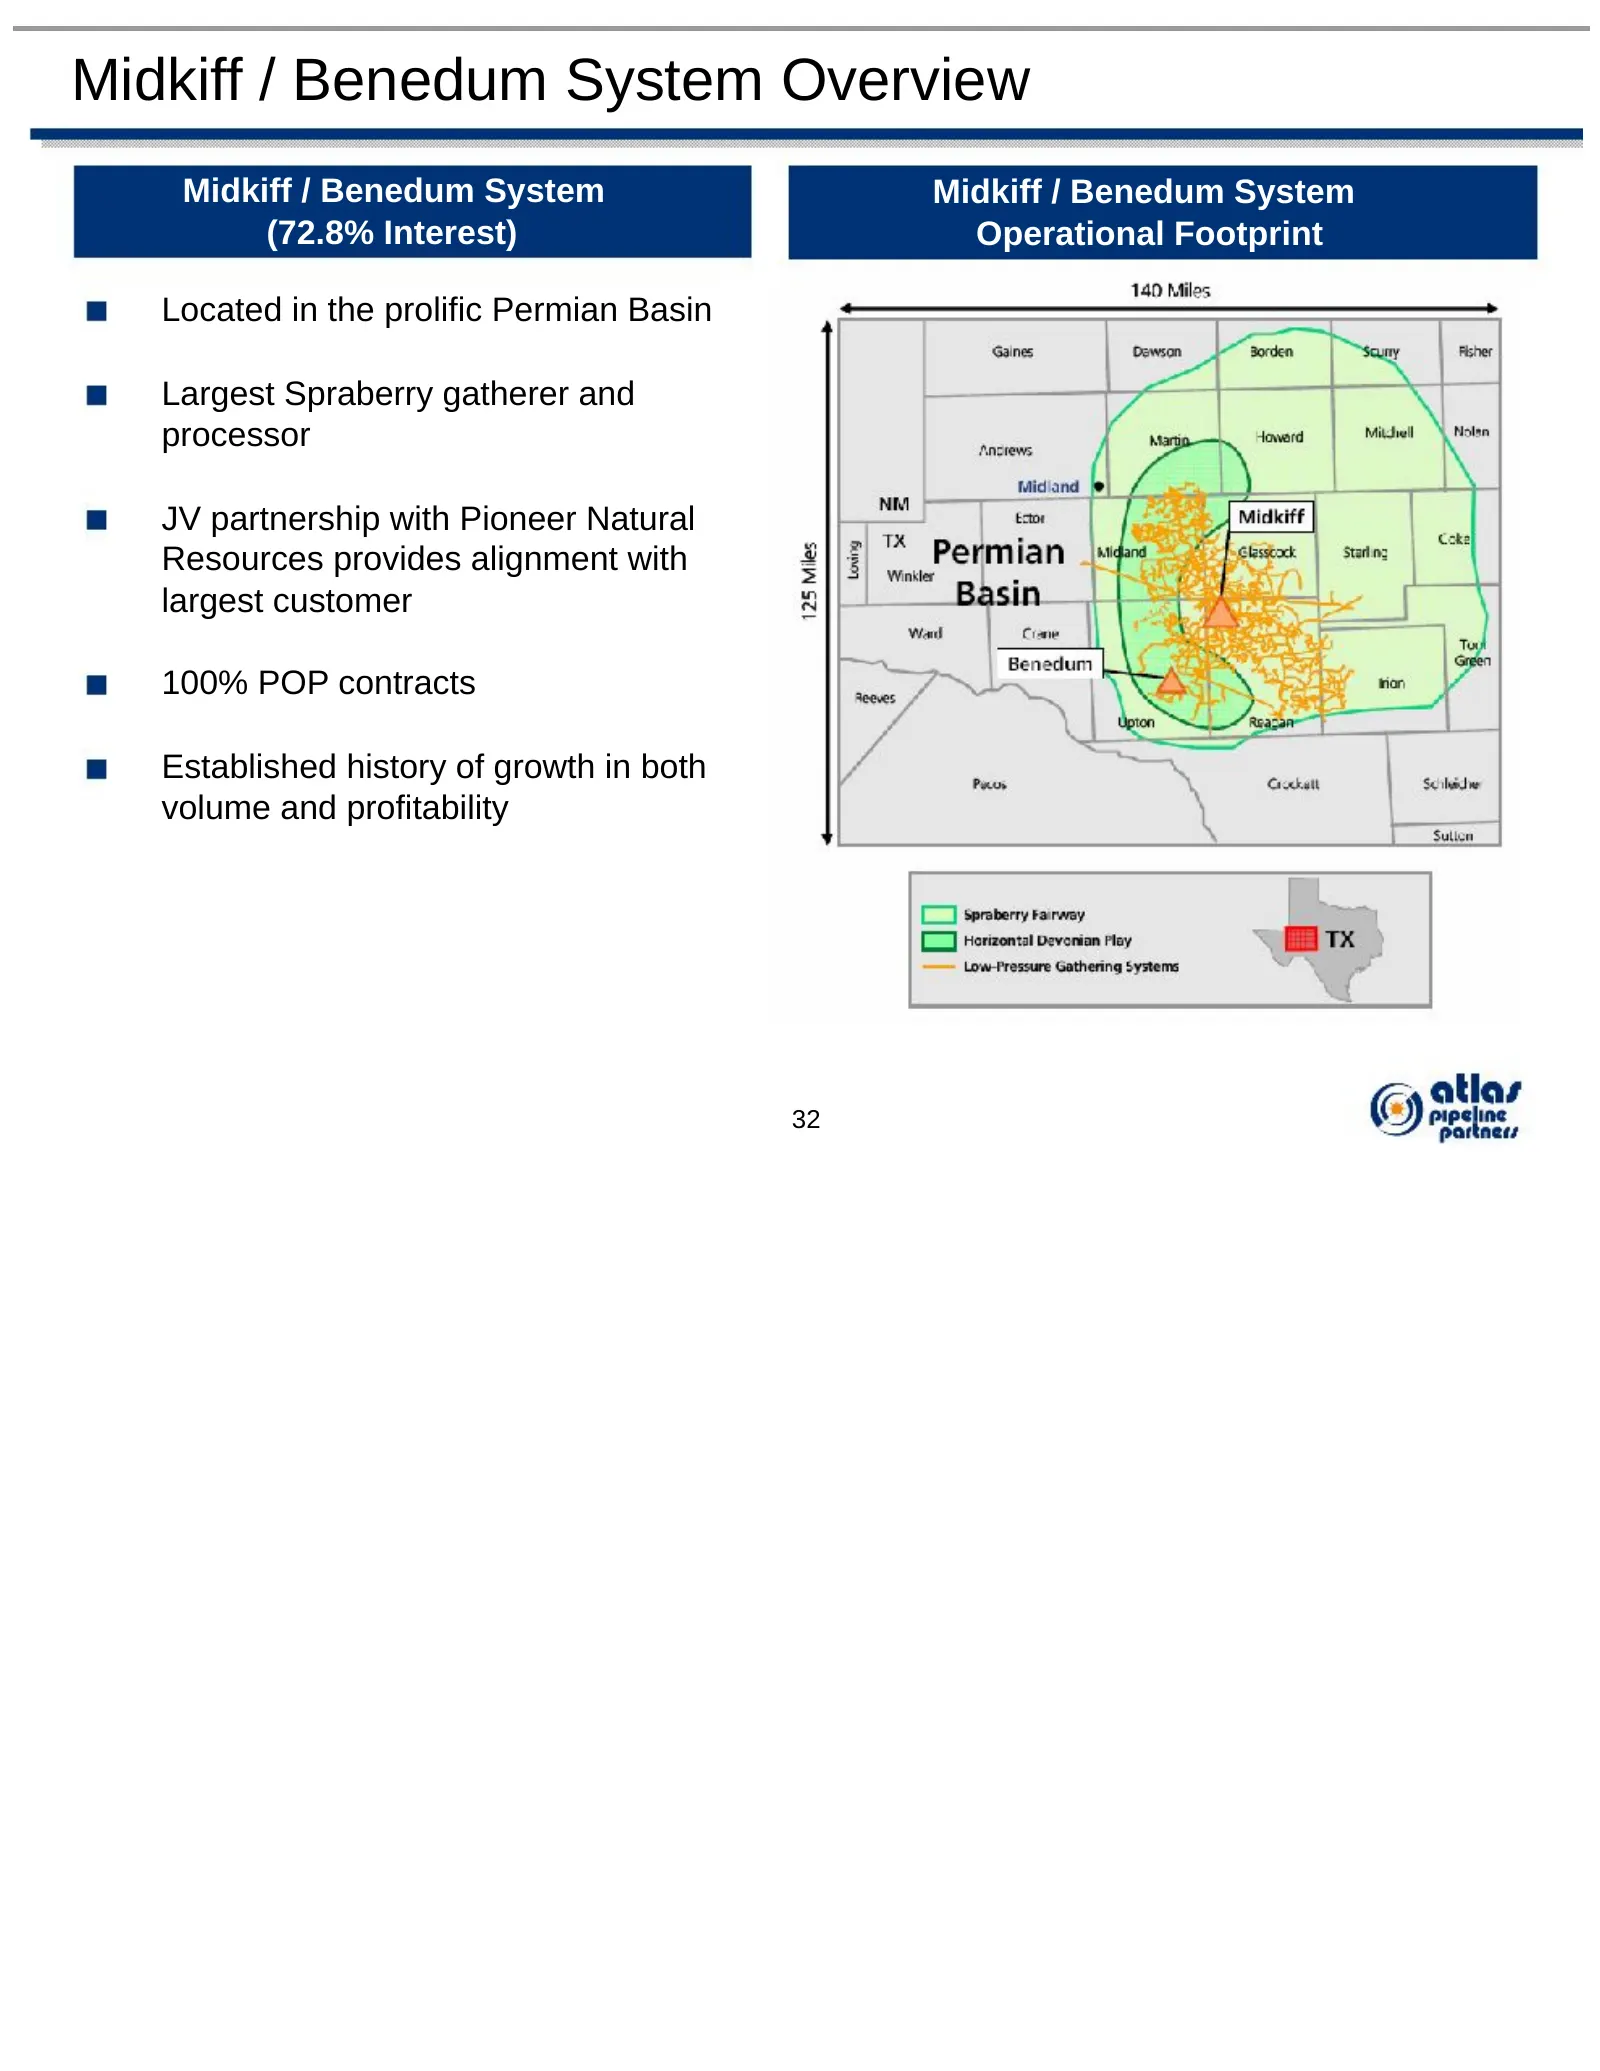
Midkiff / Benedum System Overview Midkiff / Benedum System Midkiff / Benedum System (72.8% Interest) Operational Footprint Located in the prolific Permian Basin Largest Spraberry gatherer and processor JV partnership with Pioneer Natural Resources provides alignment with largest customer 100% POP co
Slide 34: Midkiff / Benedum Key Characteristics
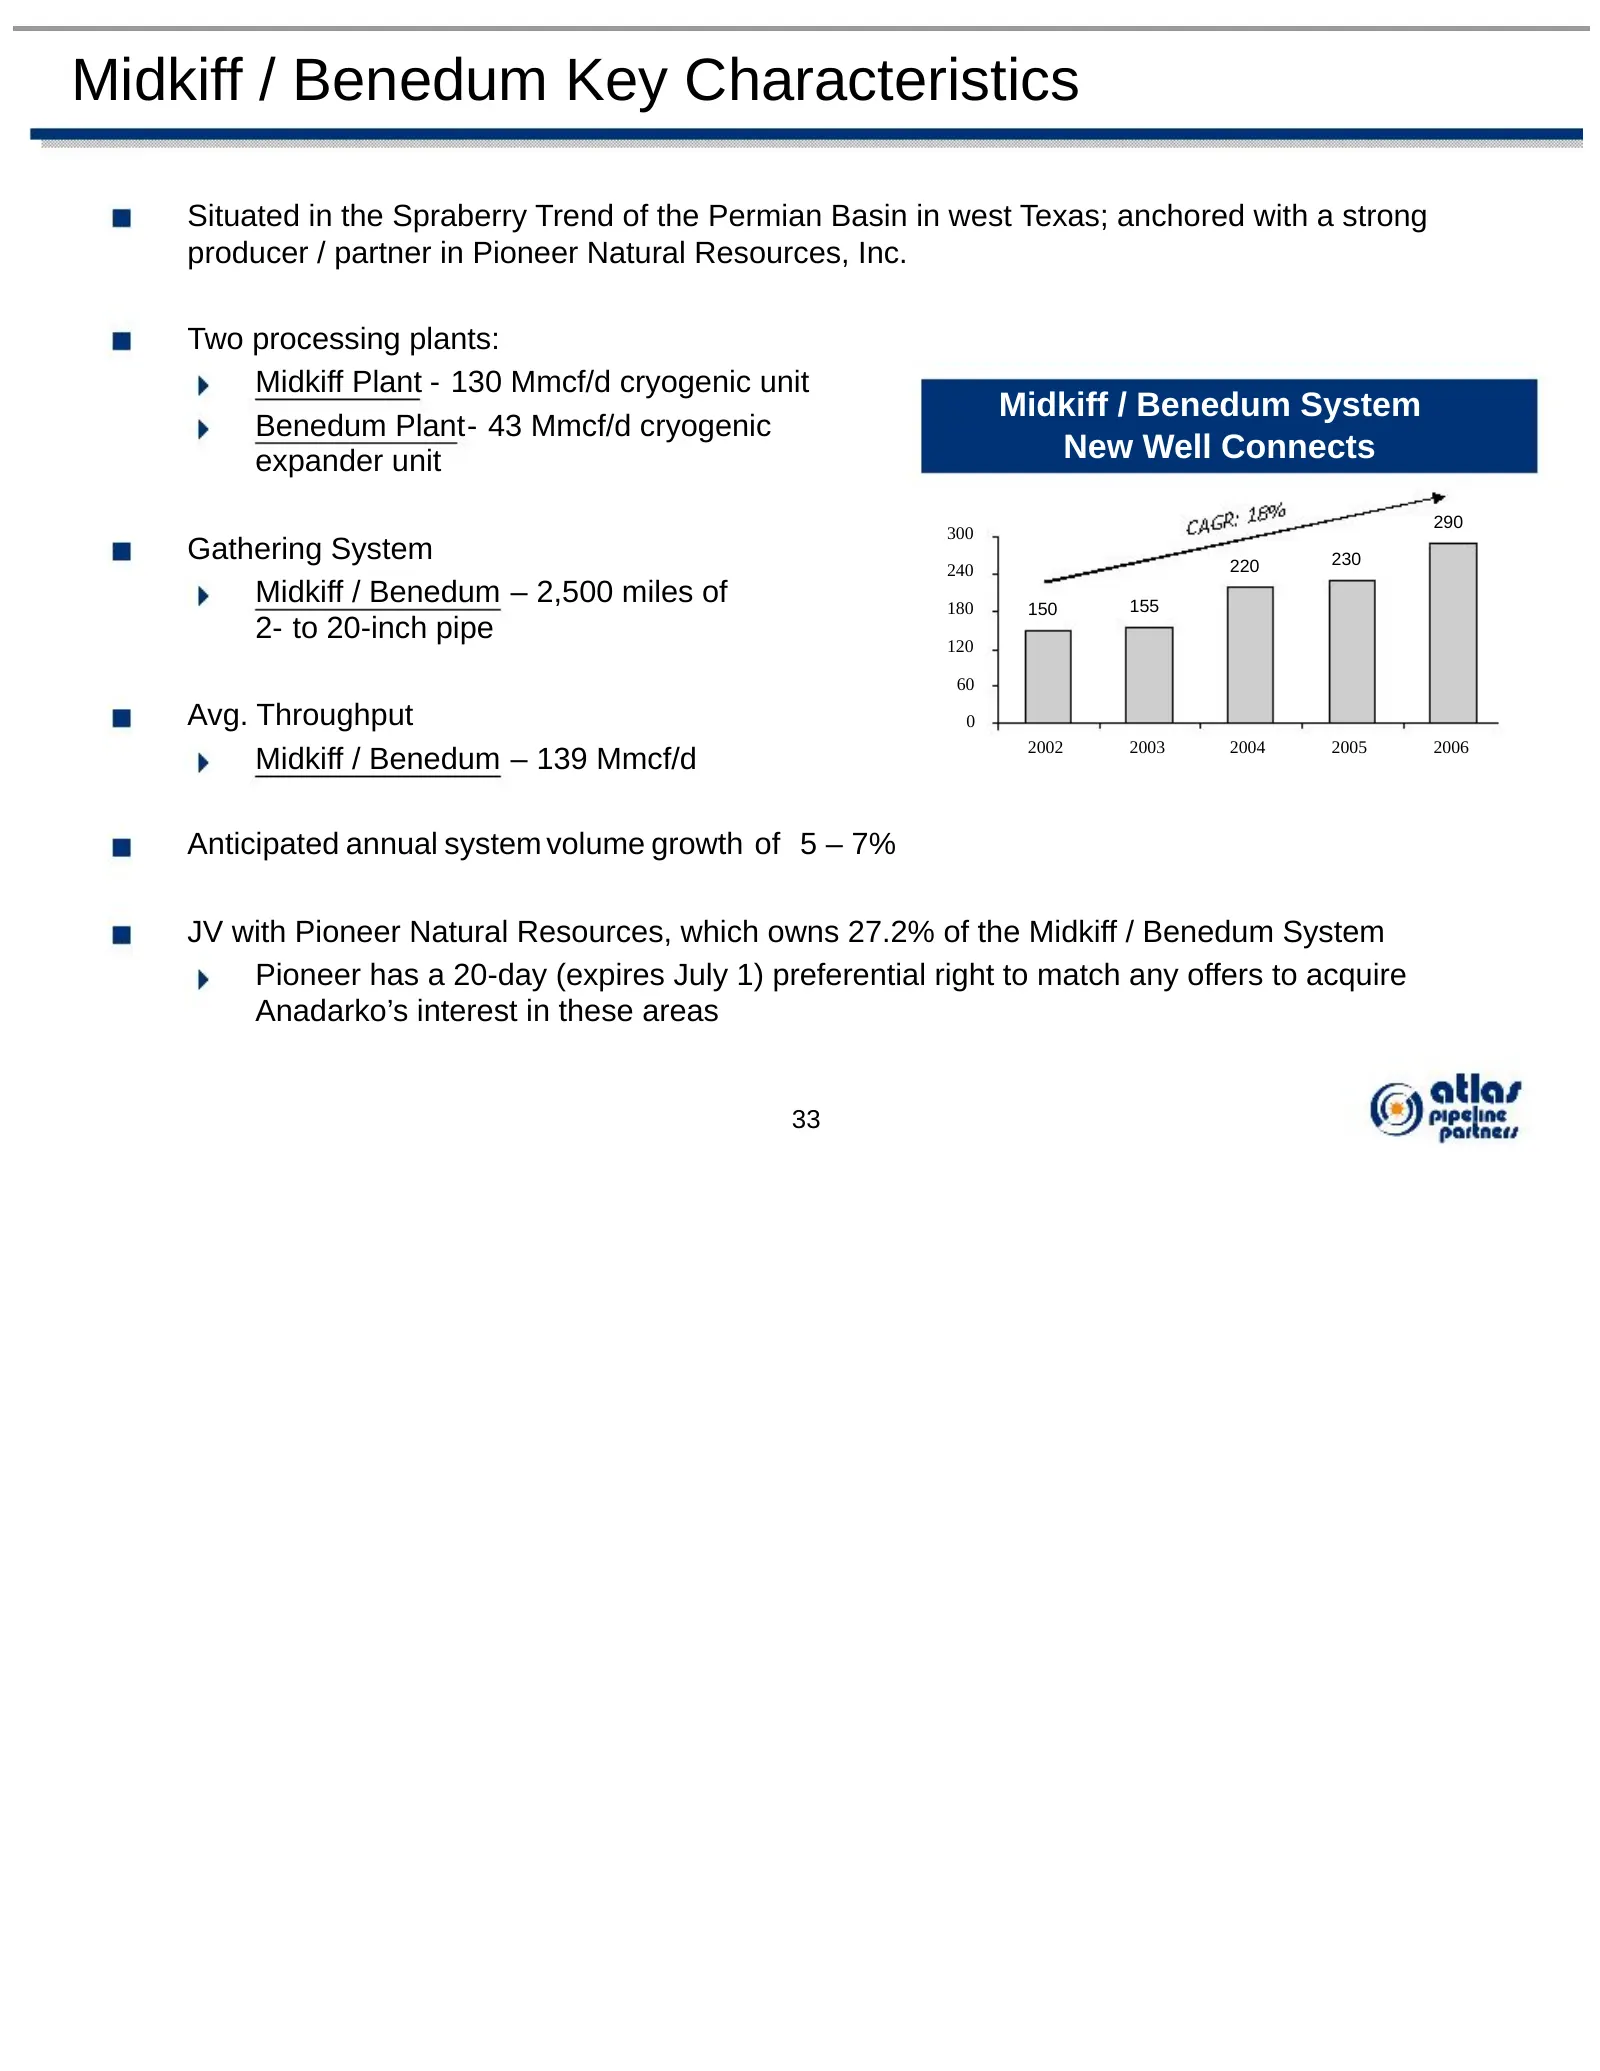
Midkiff / Benedum Key Characteristics Situated in the Spraberry Trend of the Permian Basin in west Texas; anchored with a strong producer / partner in Pioneer Natural Resources, Inc. Two processing plants: Midkiff Plant - 130 Mmcf/d cryogenic unit Midkiff / Benedum System Benedum Plant- 43 Mmcf/d cr
Slide 35: Midkiff / Benedum Customer Base
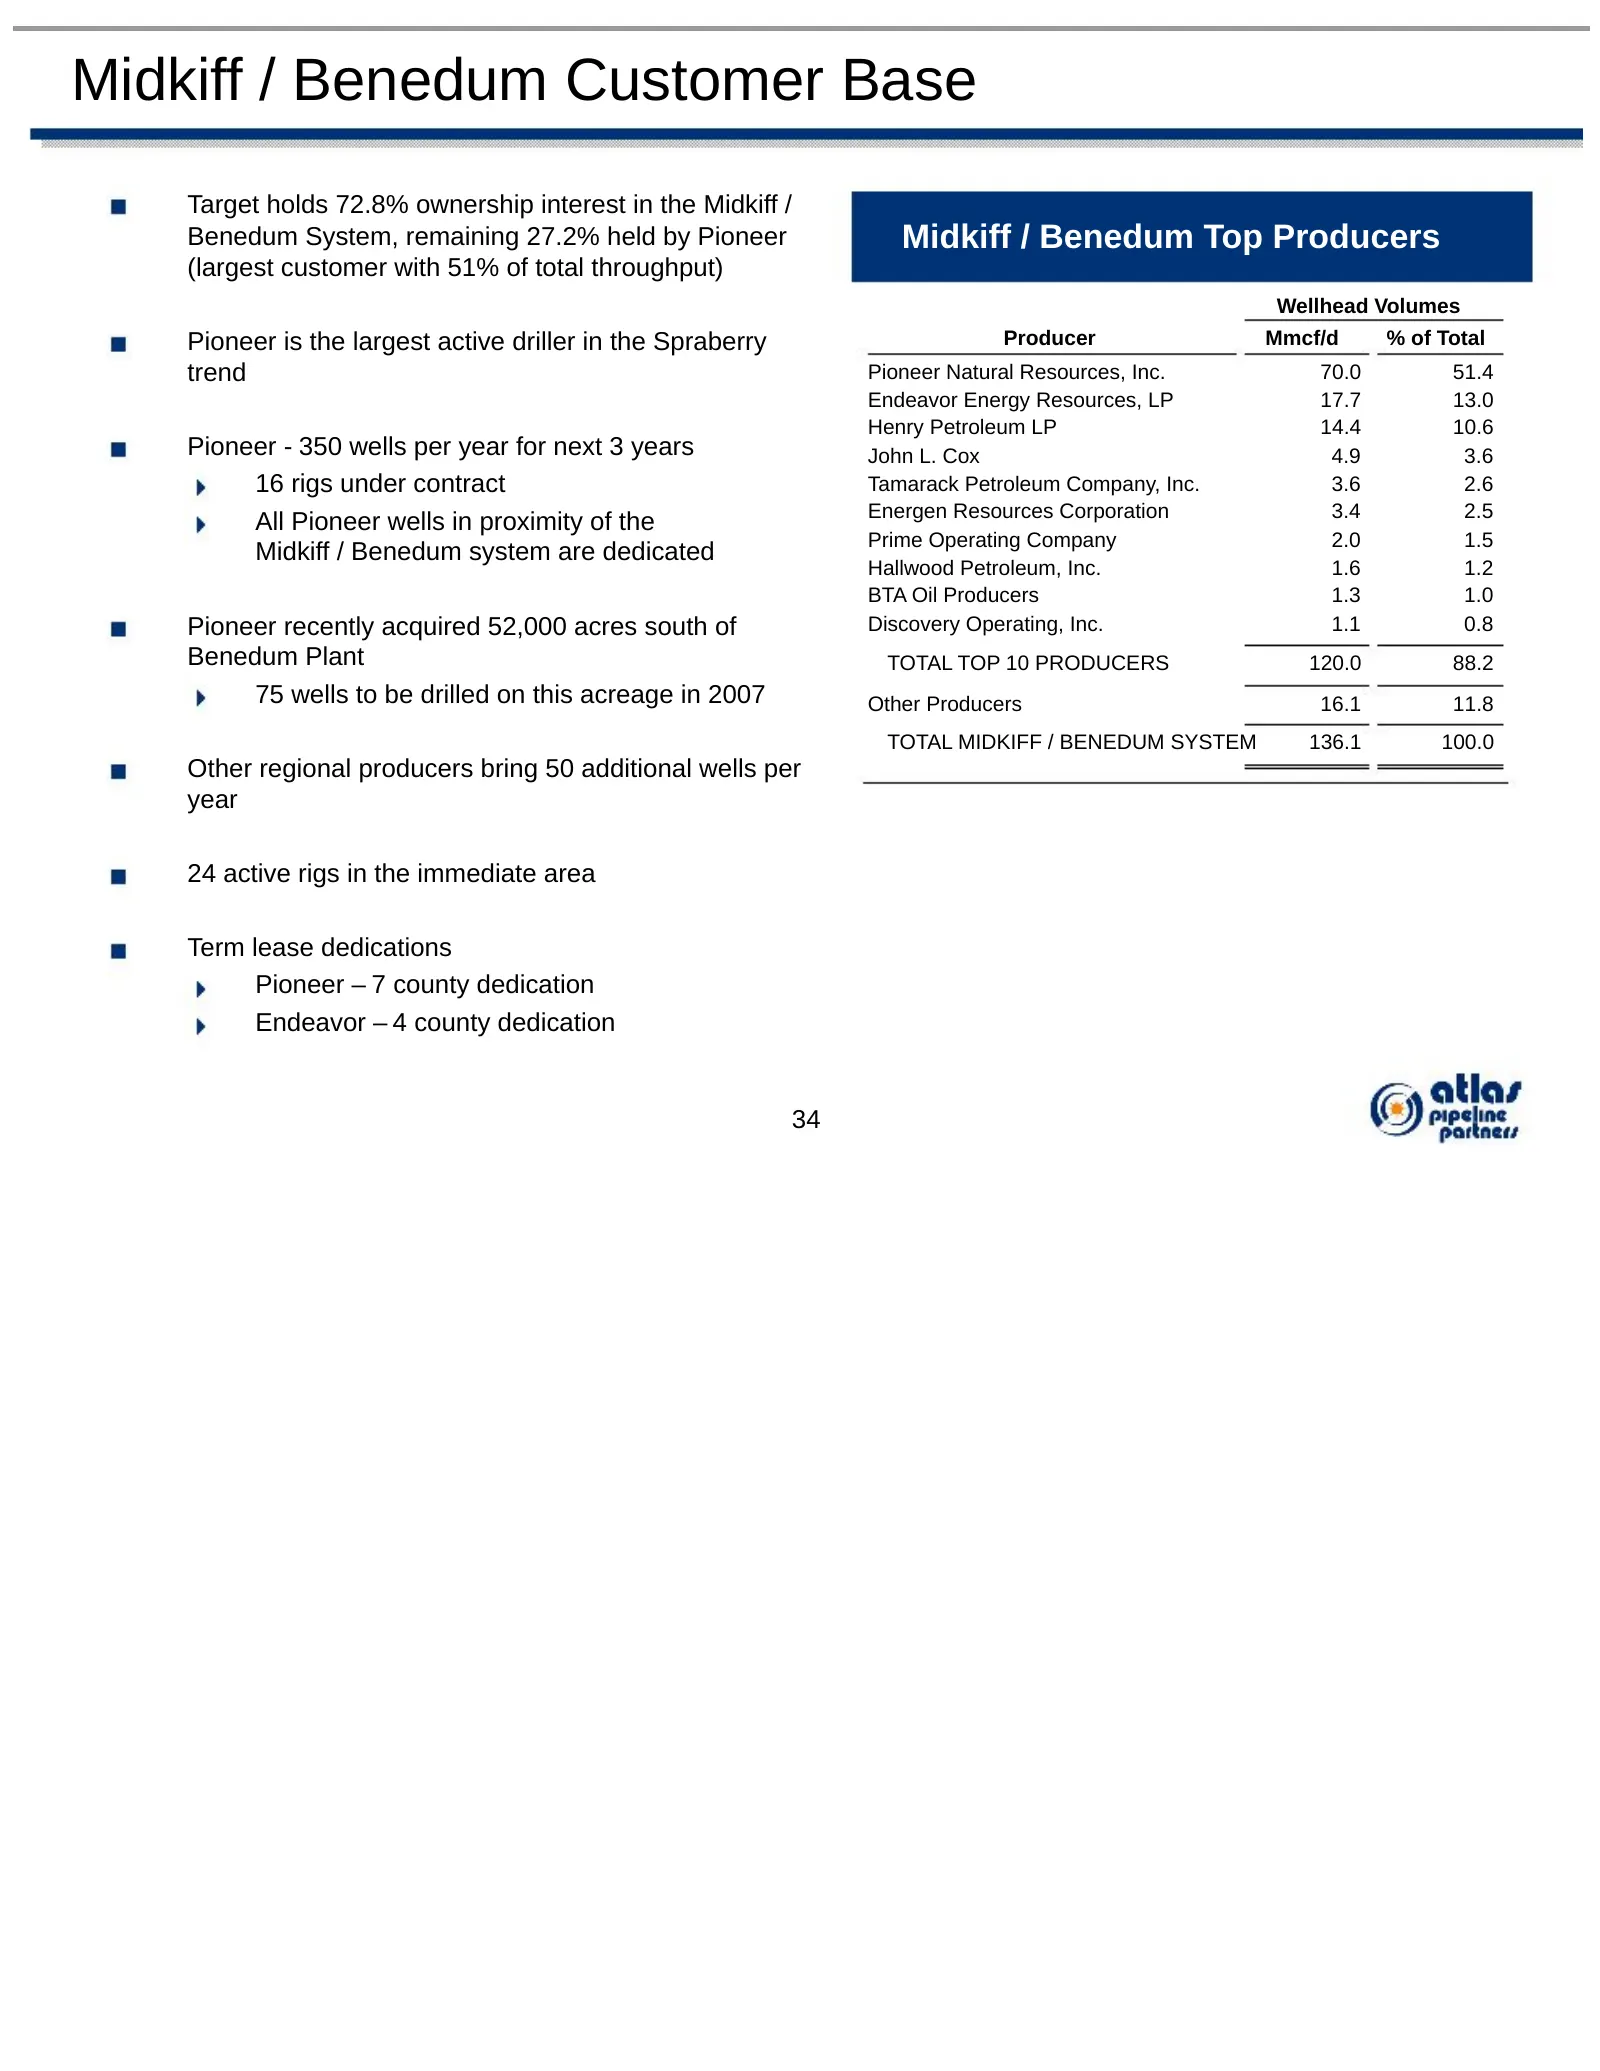
Midkiff / Benedum Customer Base Target holds 72.8% ownership interest in the Midkiff / Benedum System, remaining 27.2% held by Pioneer Midkiff / Benedum Top Producers (largest customer with 51% of total throughput) Wellhead Volumes Pioneer is the largest active driller in the Spraberry Producer Mmcf
Slide 36: Midkiff / Benedum – Contract Overview
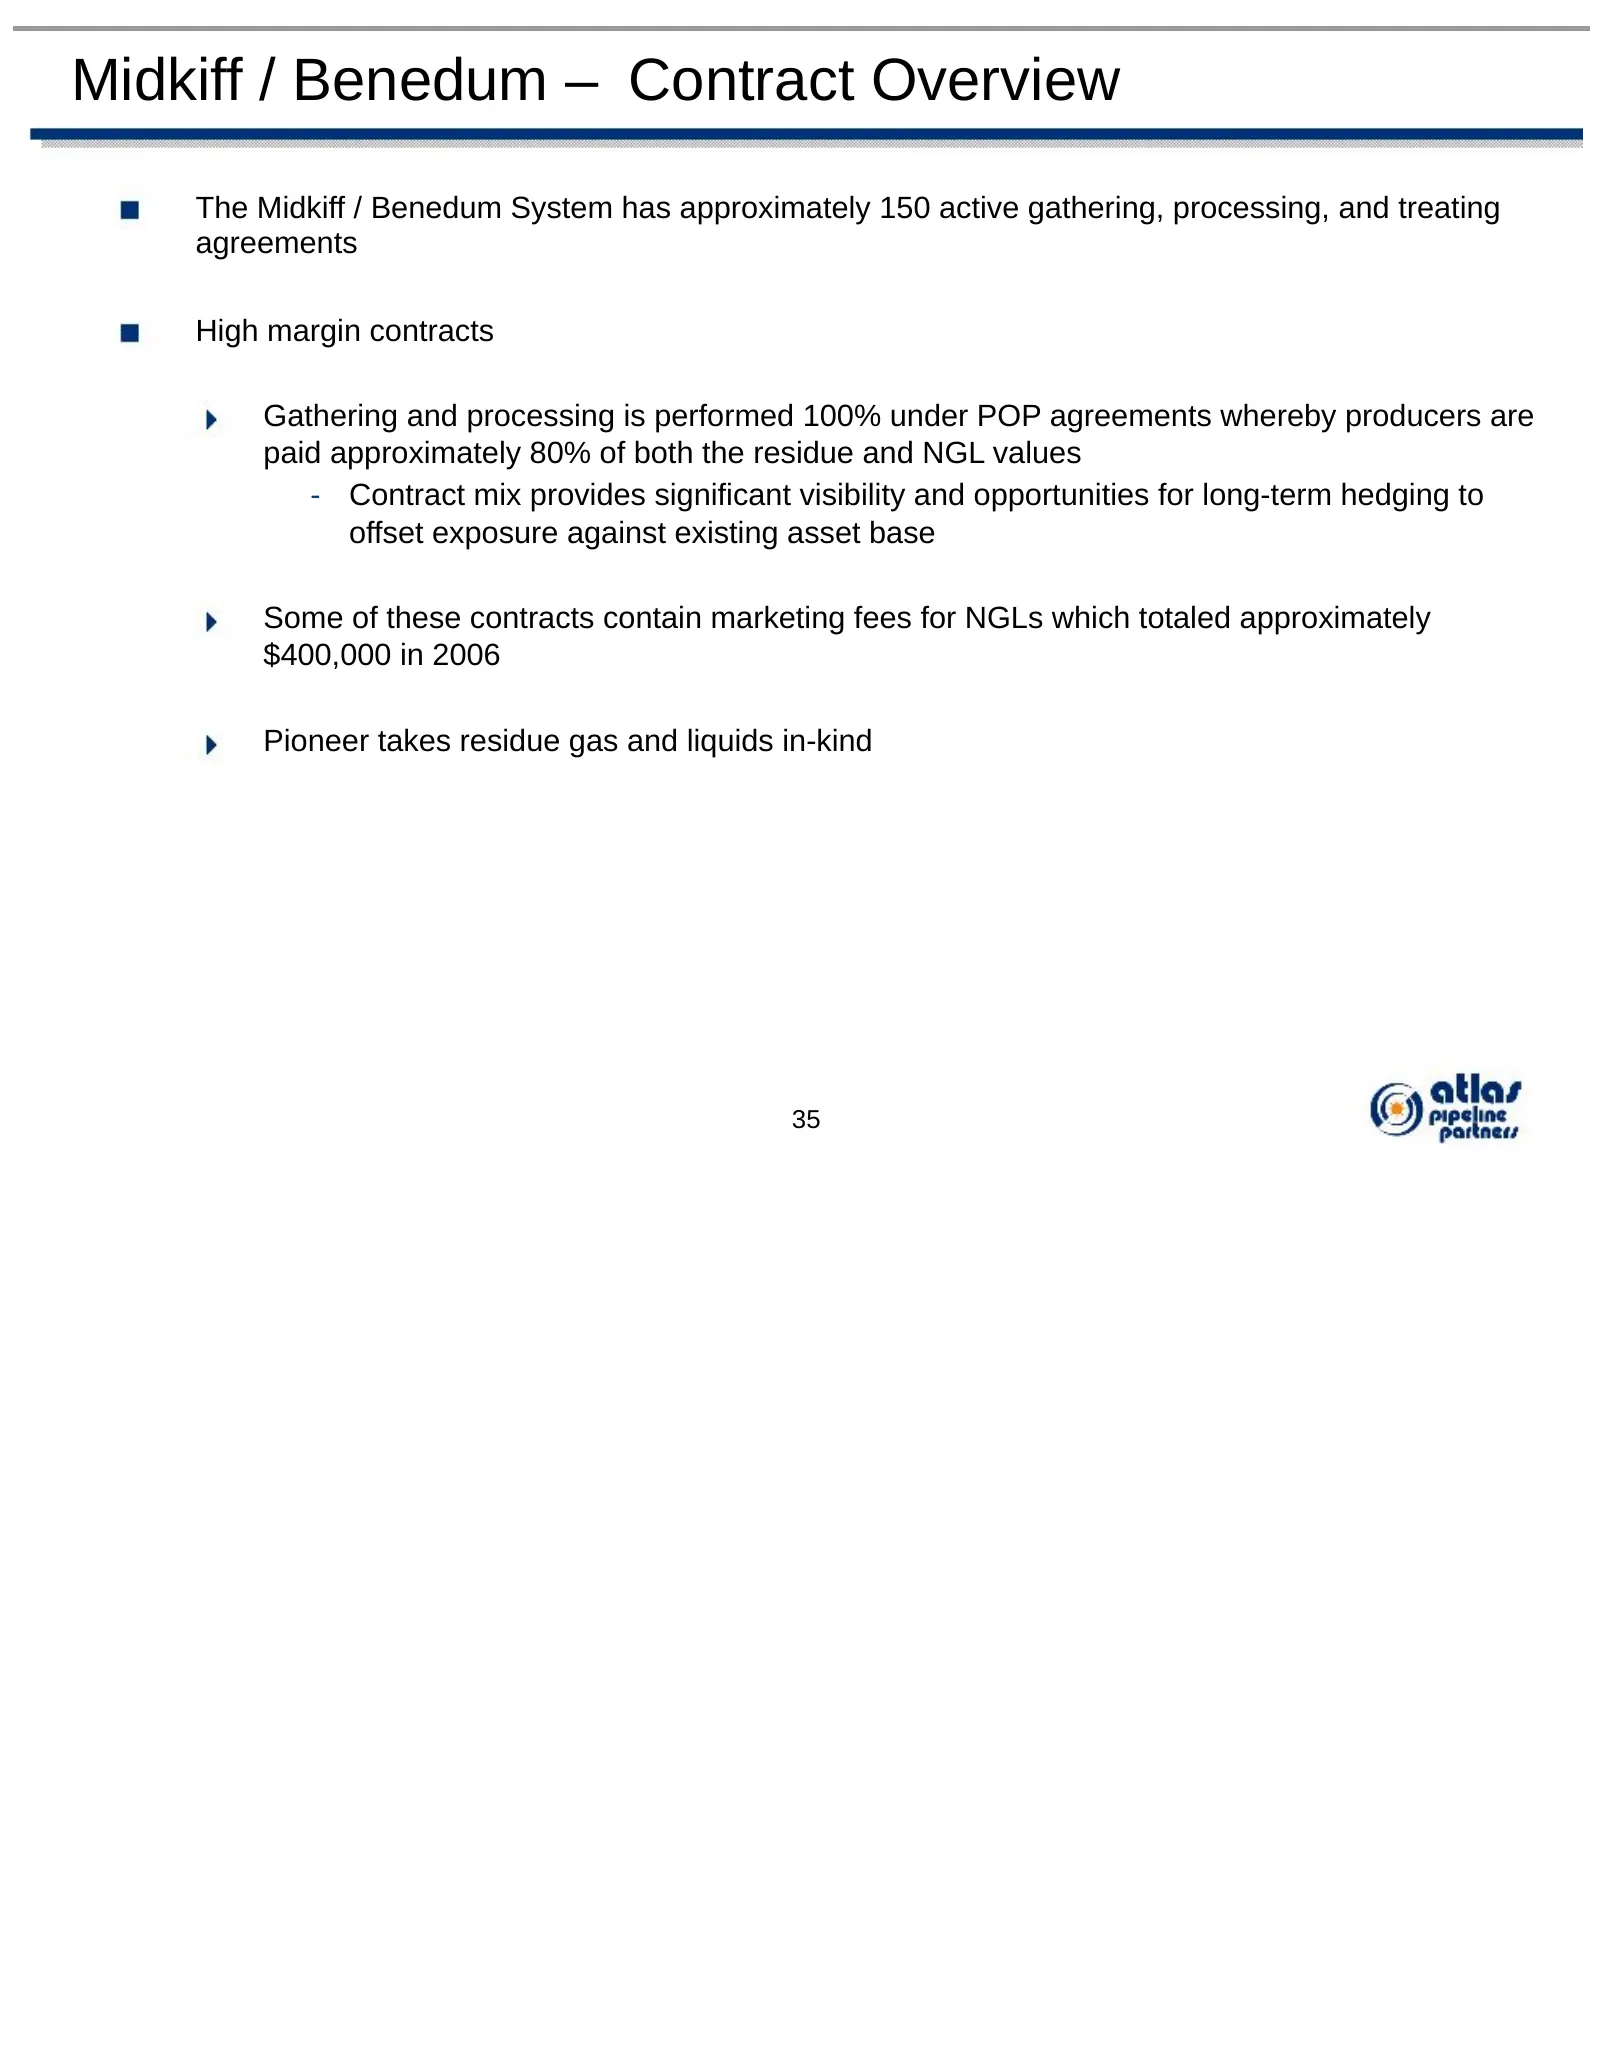
Midkiff / Benedum – Contract Overview The Midkiff / Benedum System has approximately 150 active gathering, processing, and treating agreements High margin contracts Gathering and processing is performed 100% under POP agreements whereby producers are paid approximately 80% of both the residue and NG
Slide 37: Midkiff / Benedum – Growth
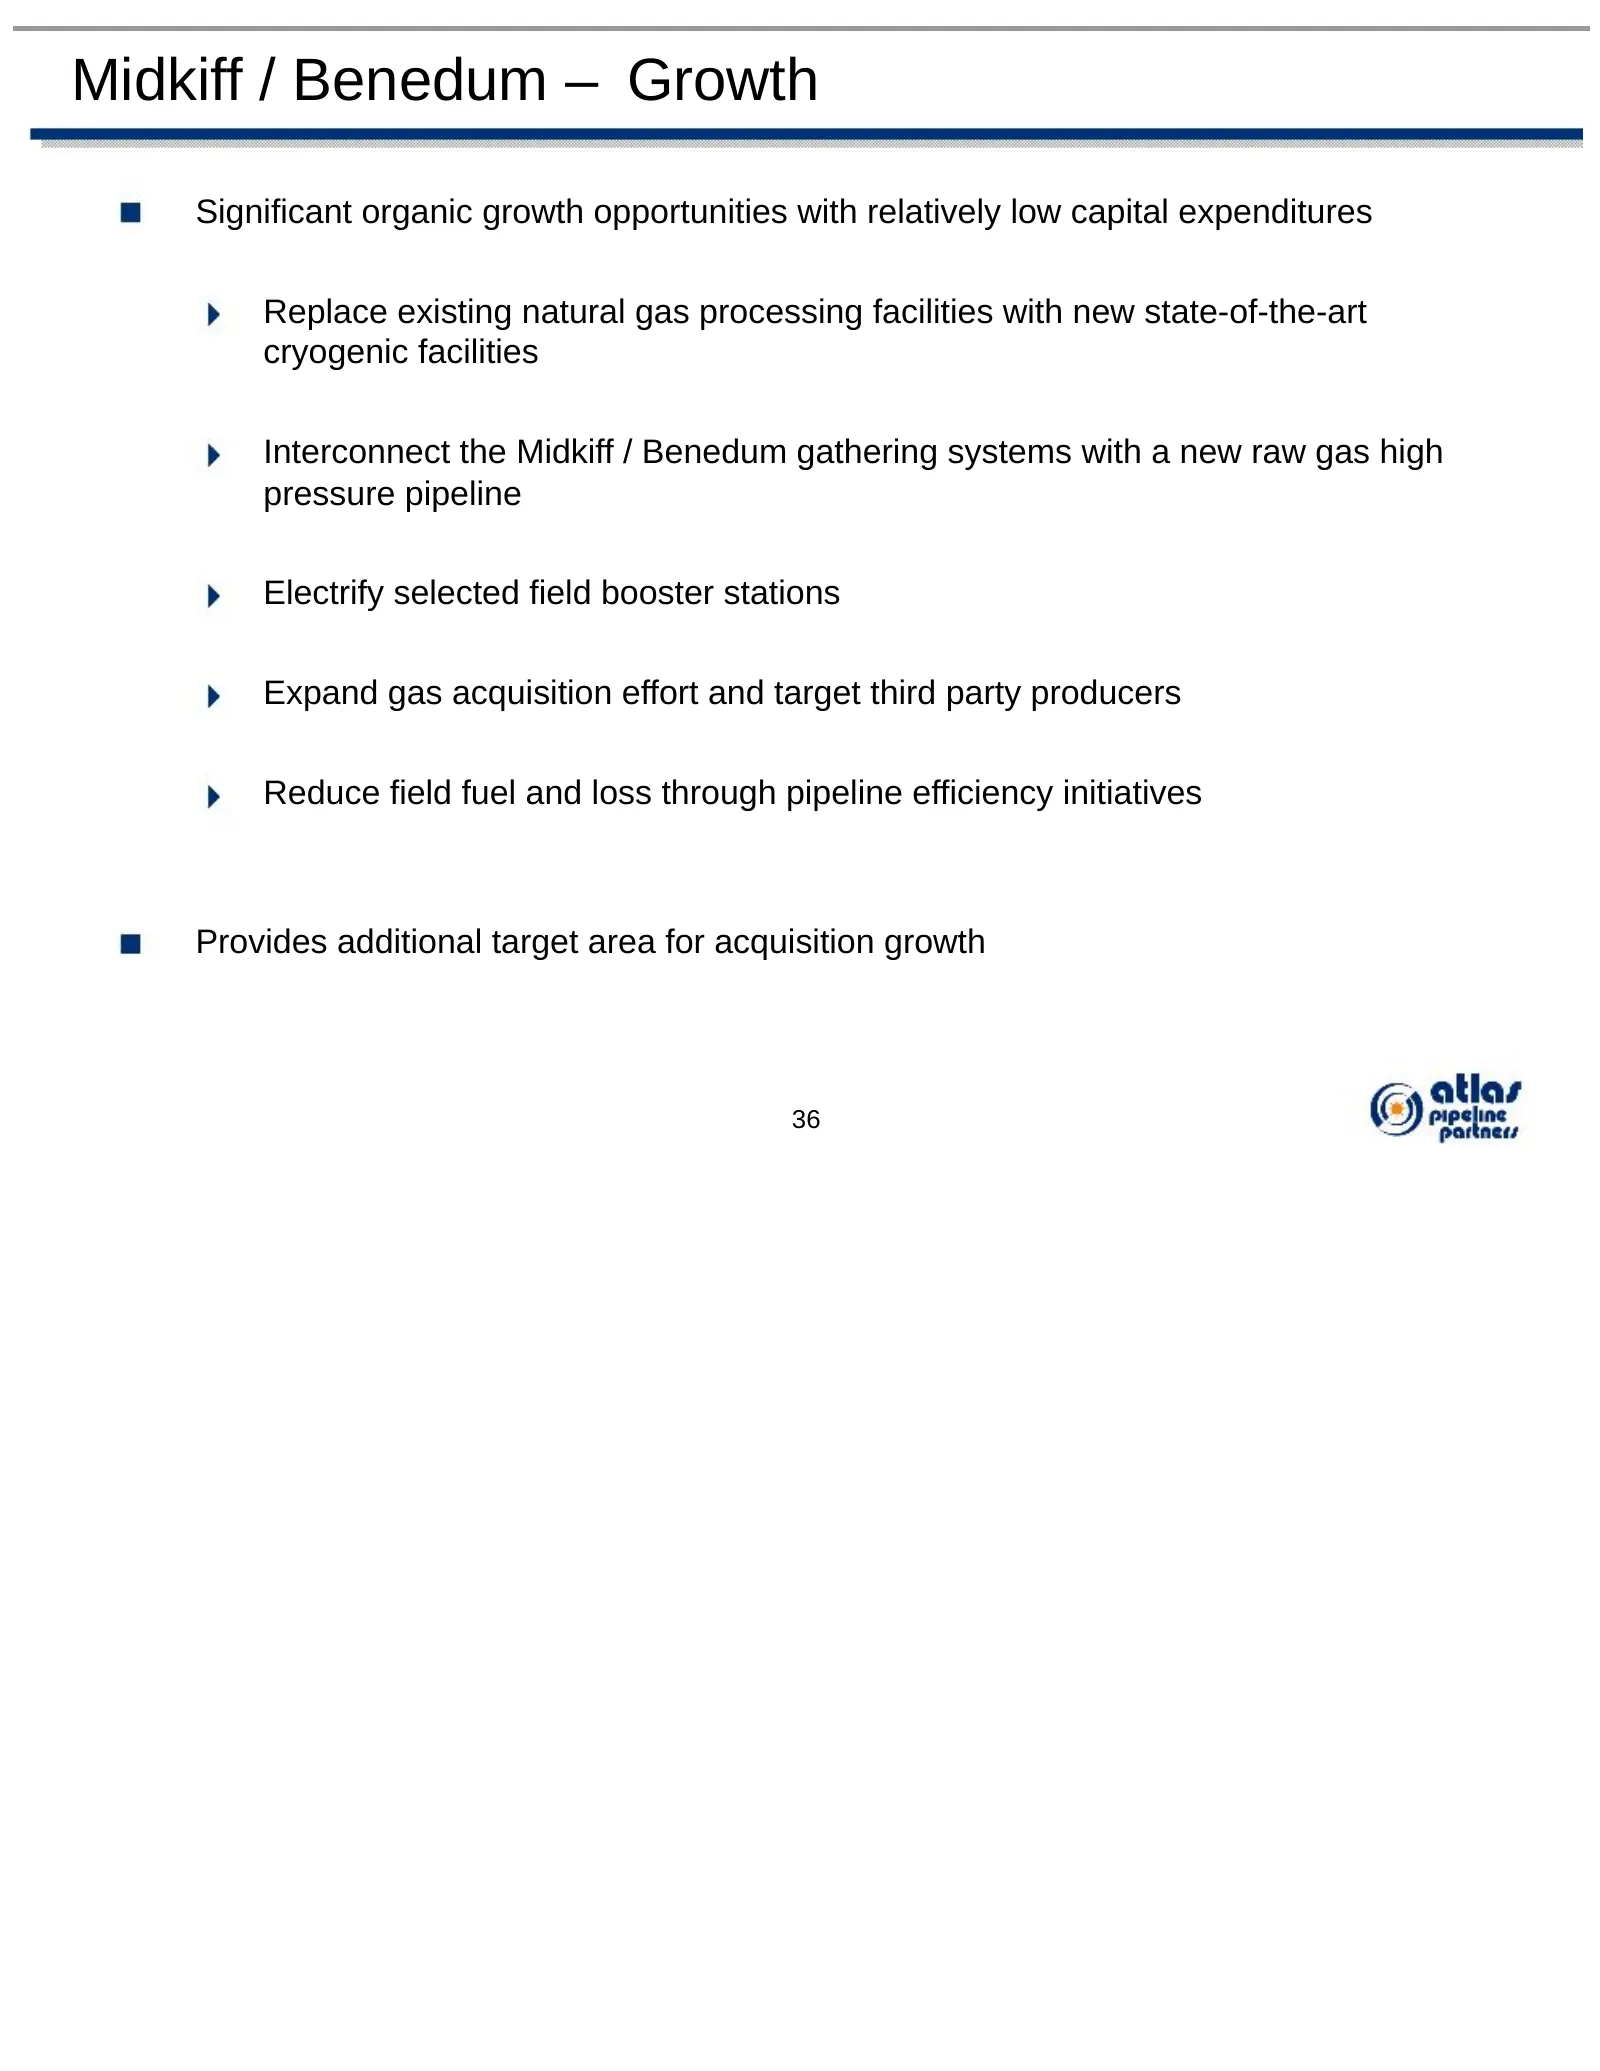
Midkiff / Benedum – Growth Significant organic growth opportunities with relatively low capital expenditures Replace existing natural gas processing facilities with new state-of-the-art cryogenic facilities Interconnect the Midkiff / Benedum gathering systems with a new raw gas high pressure pipelin
Slide 38: Historical Financial Information
* * * * * * * * * * * * * * * * * * * * * * * * Historical Financial Information
Slide 39: Key Financial Targets
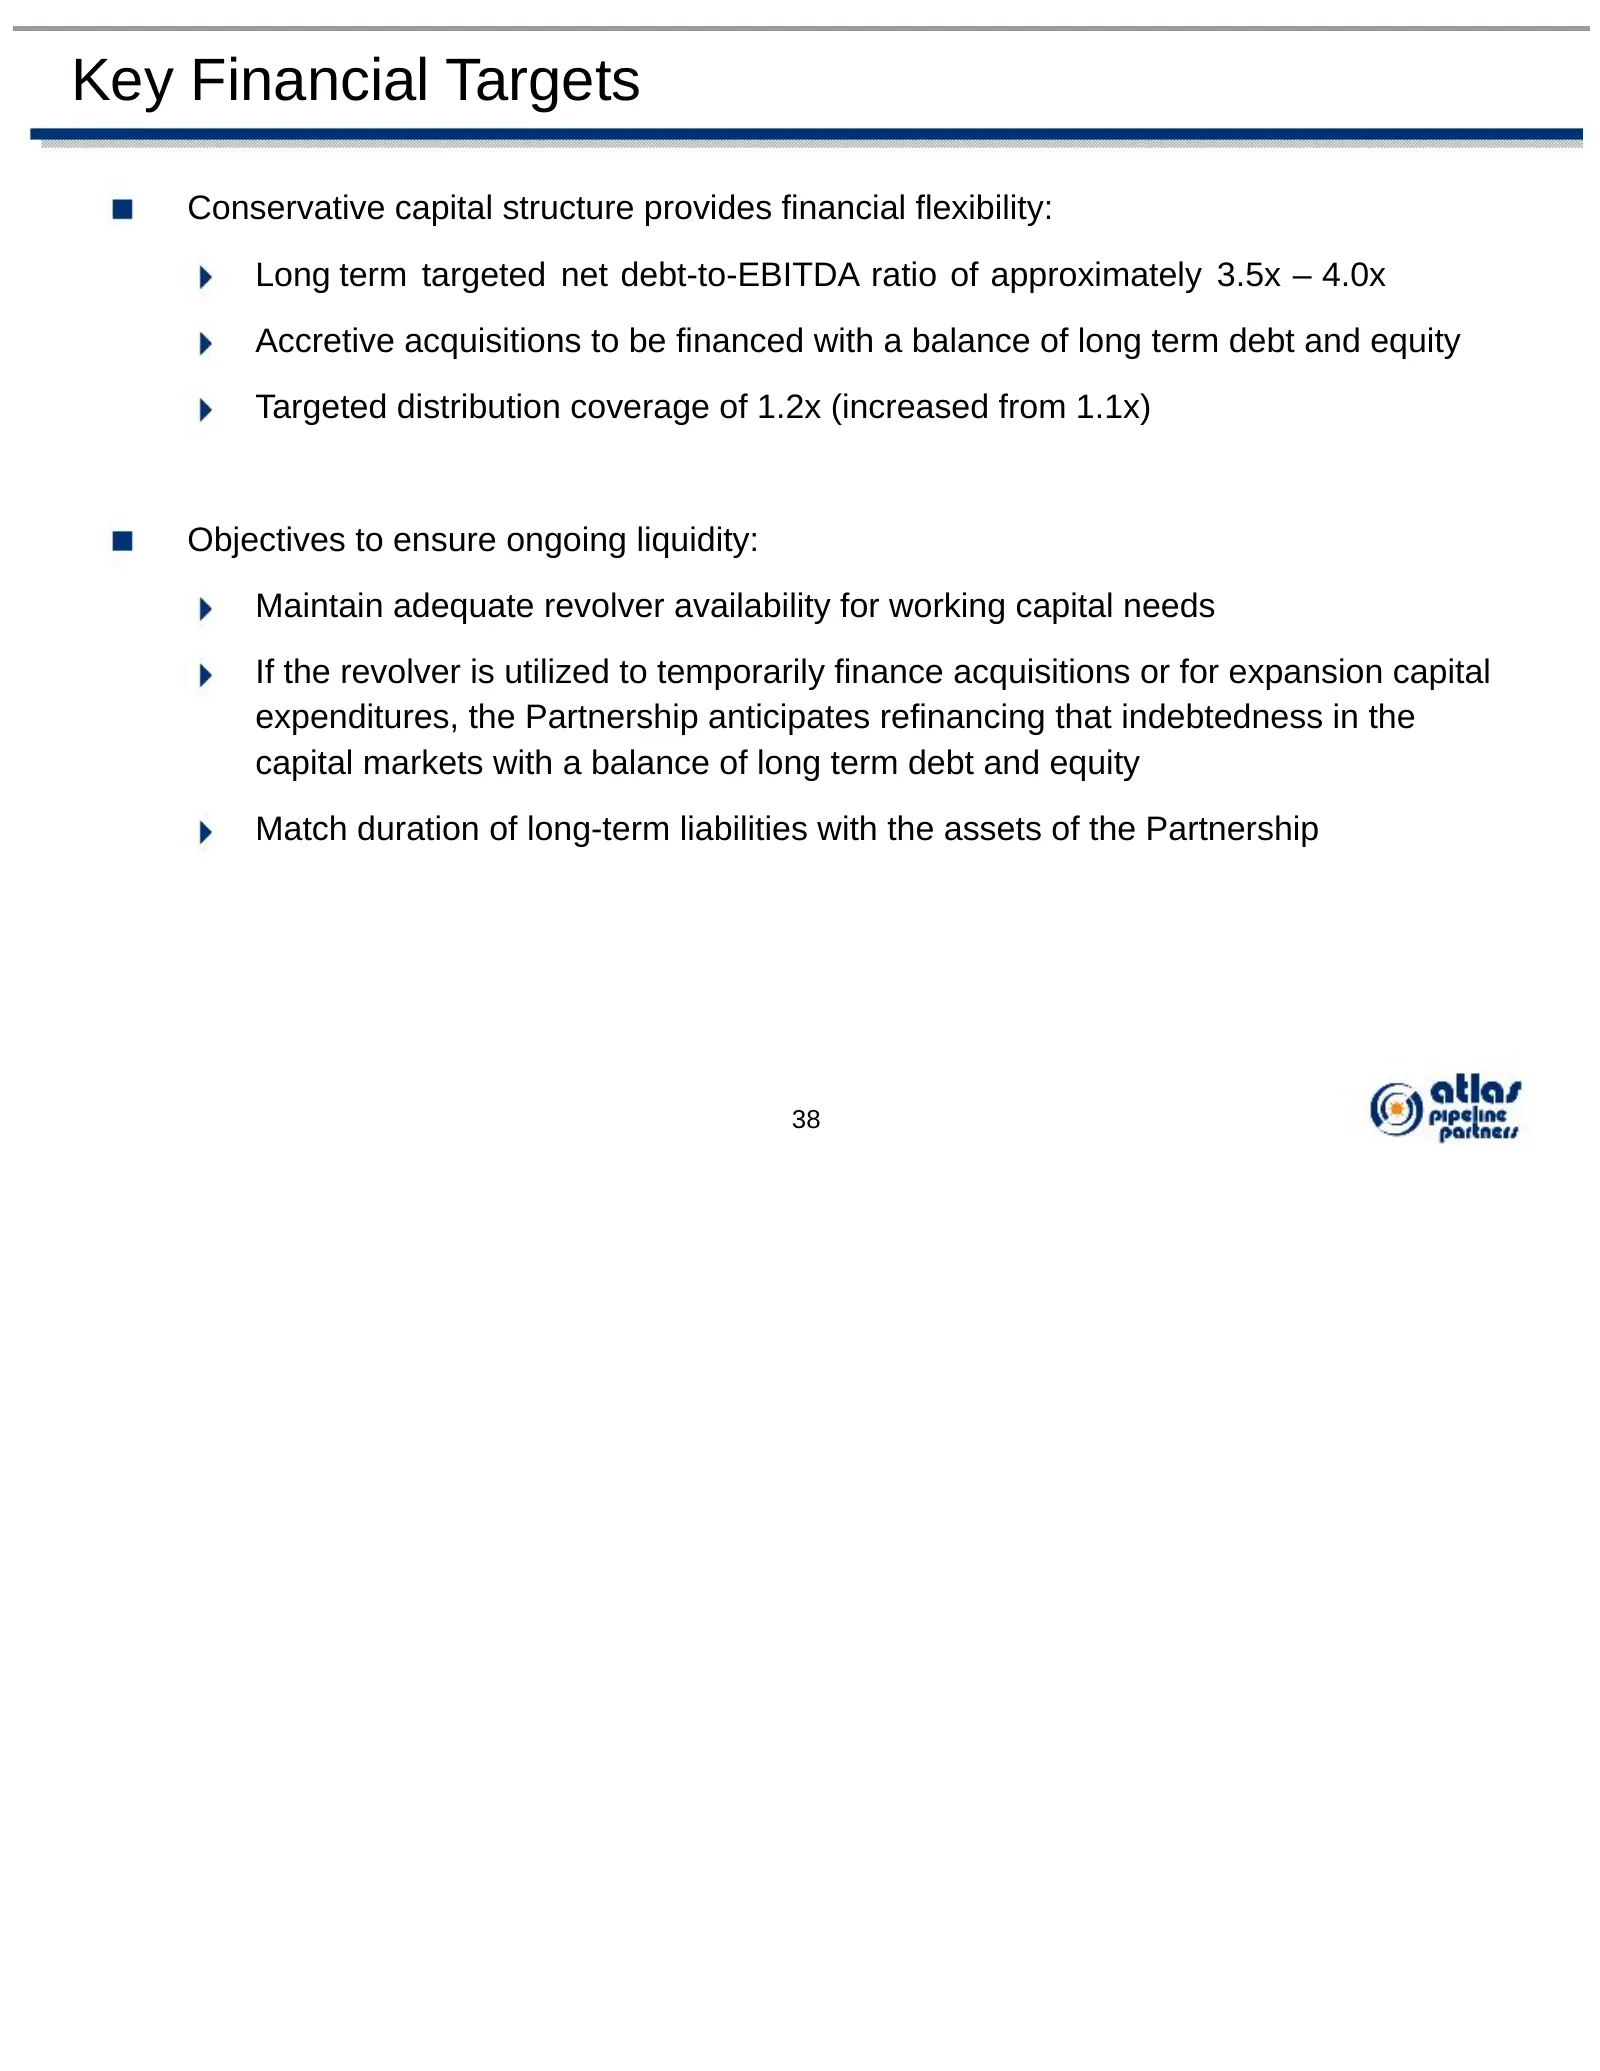
Key Financial Targets Conservative capital structure provides financial flexibility: Long term targeted net debt-to-EBITDA ratio of approximately 3.5x – 4.0x Accretive acquisitions to be financed with a balance of long term debt and equity Targeted distribution coverage of 1.2x (increased from 1.1x)
Slide 40: Sources & Uses / Pro Forma Capitalization
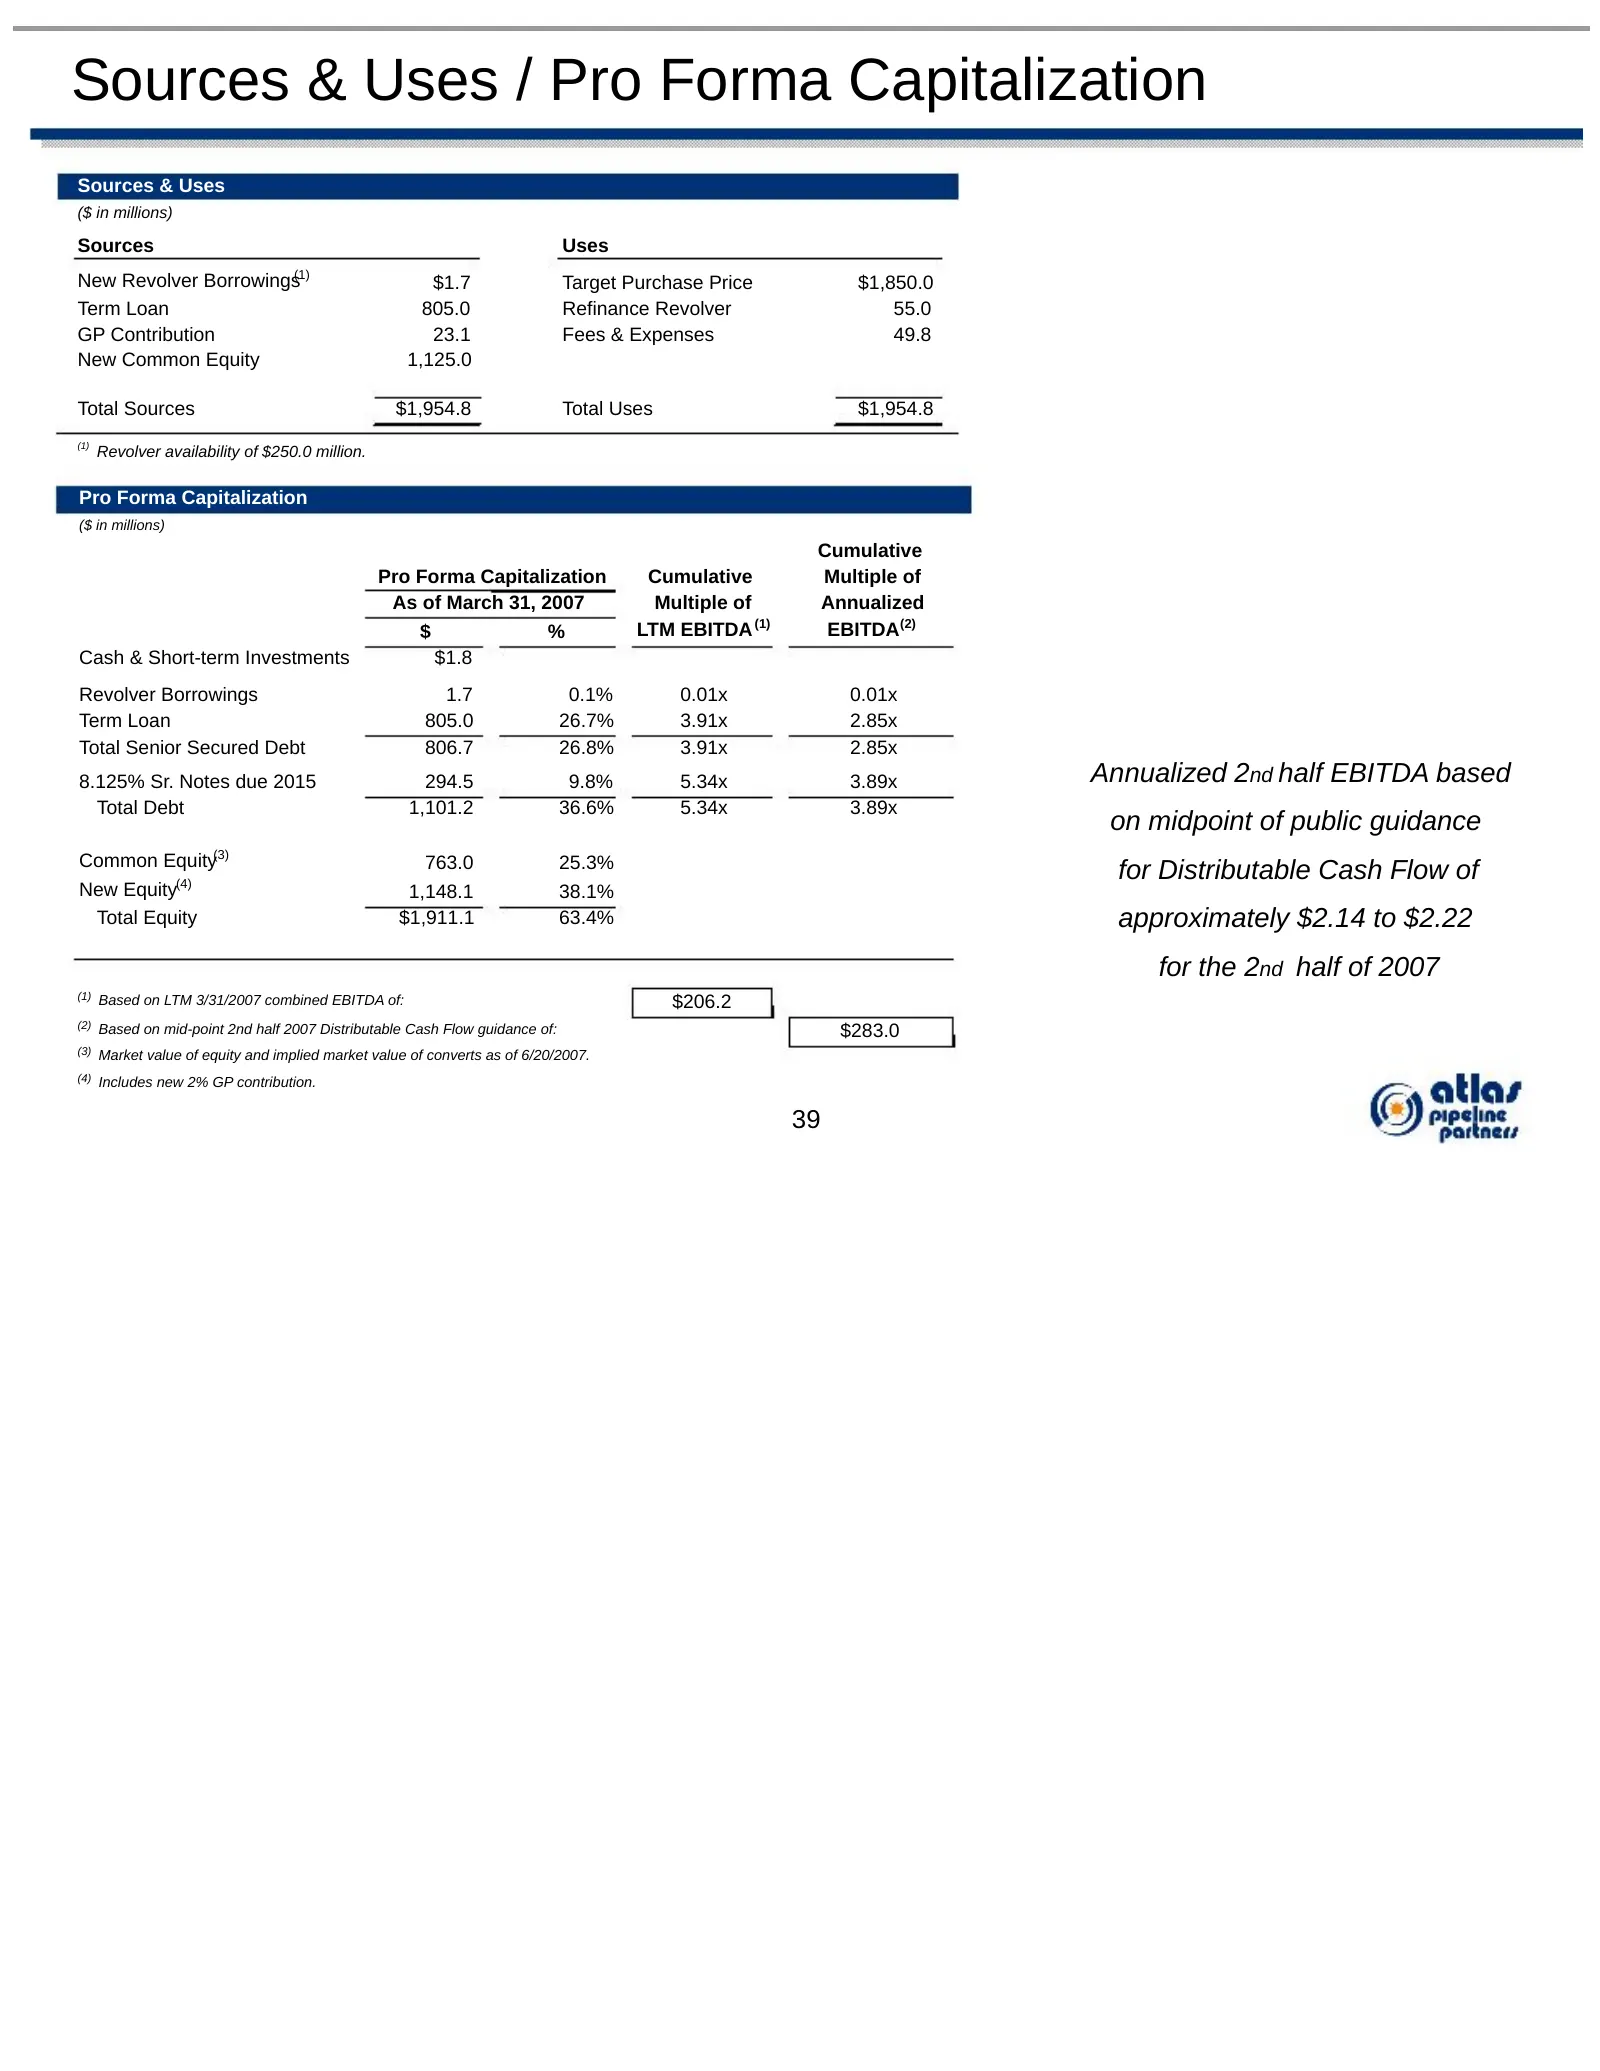
Sources & Uses / Pro Forma Capitalization Sources & Uses ($ in millions) Sources Uses New Revolver Borrowings(1) $1.7 Target Purchase Price $1,850.0 Term Loan 805.0 Refinance Revolver 55.0 GP Contribution 23.1 Fees & Expenses 49.8 New Common Equity 1,125.0 Total Sources $1,954.8 Total Uses $1,954.8
Slide 41: EBITDA Improvements
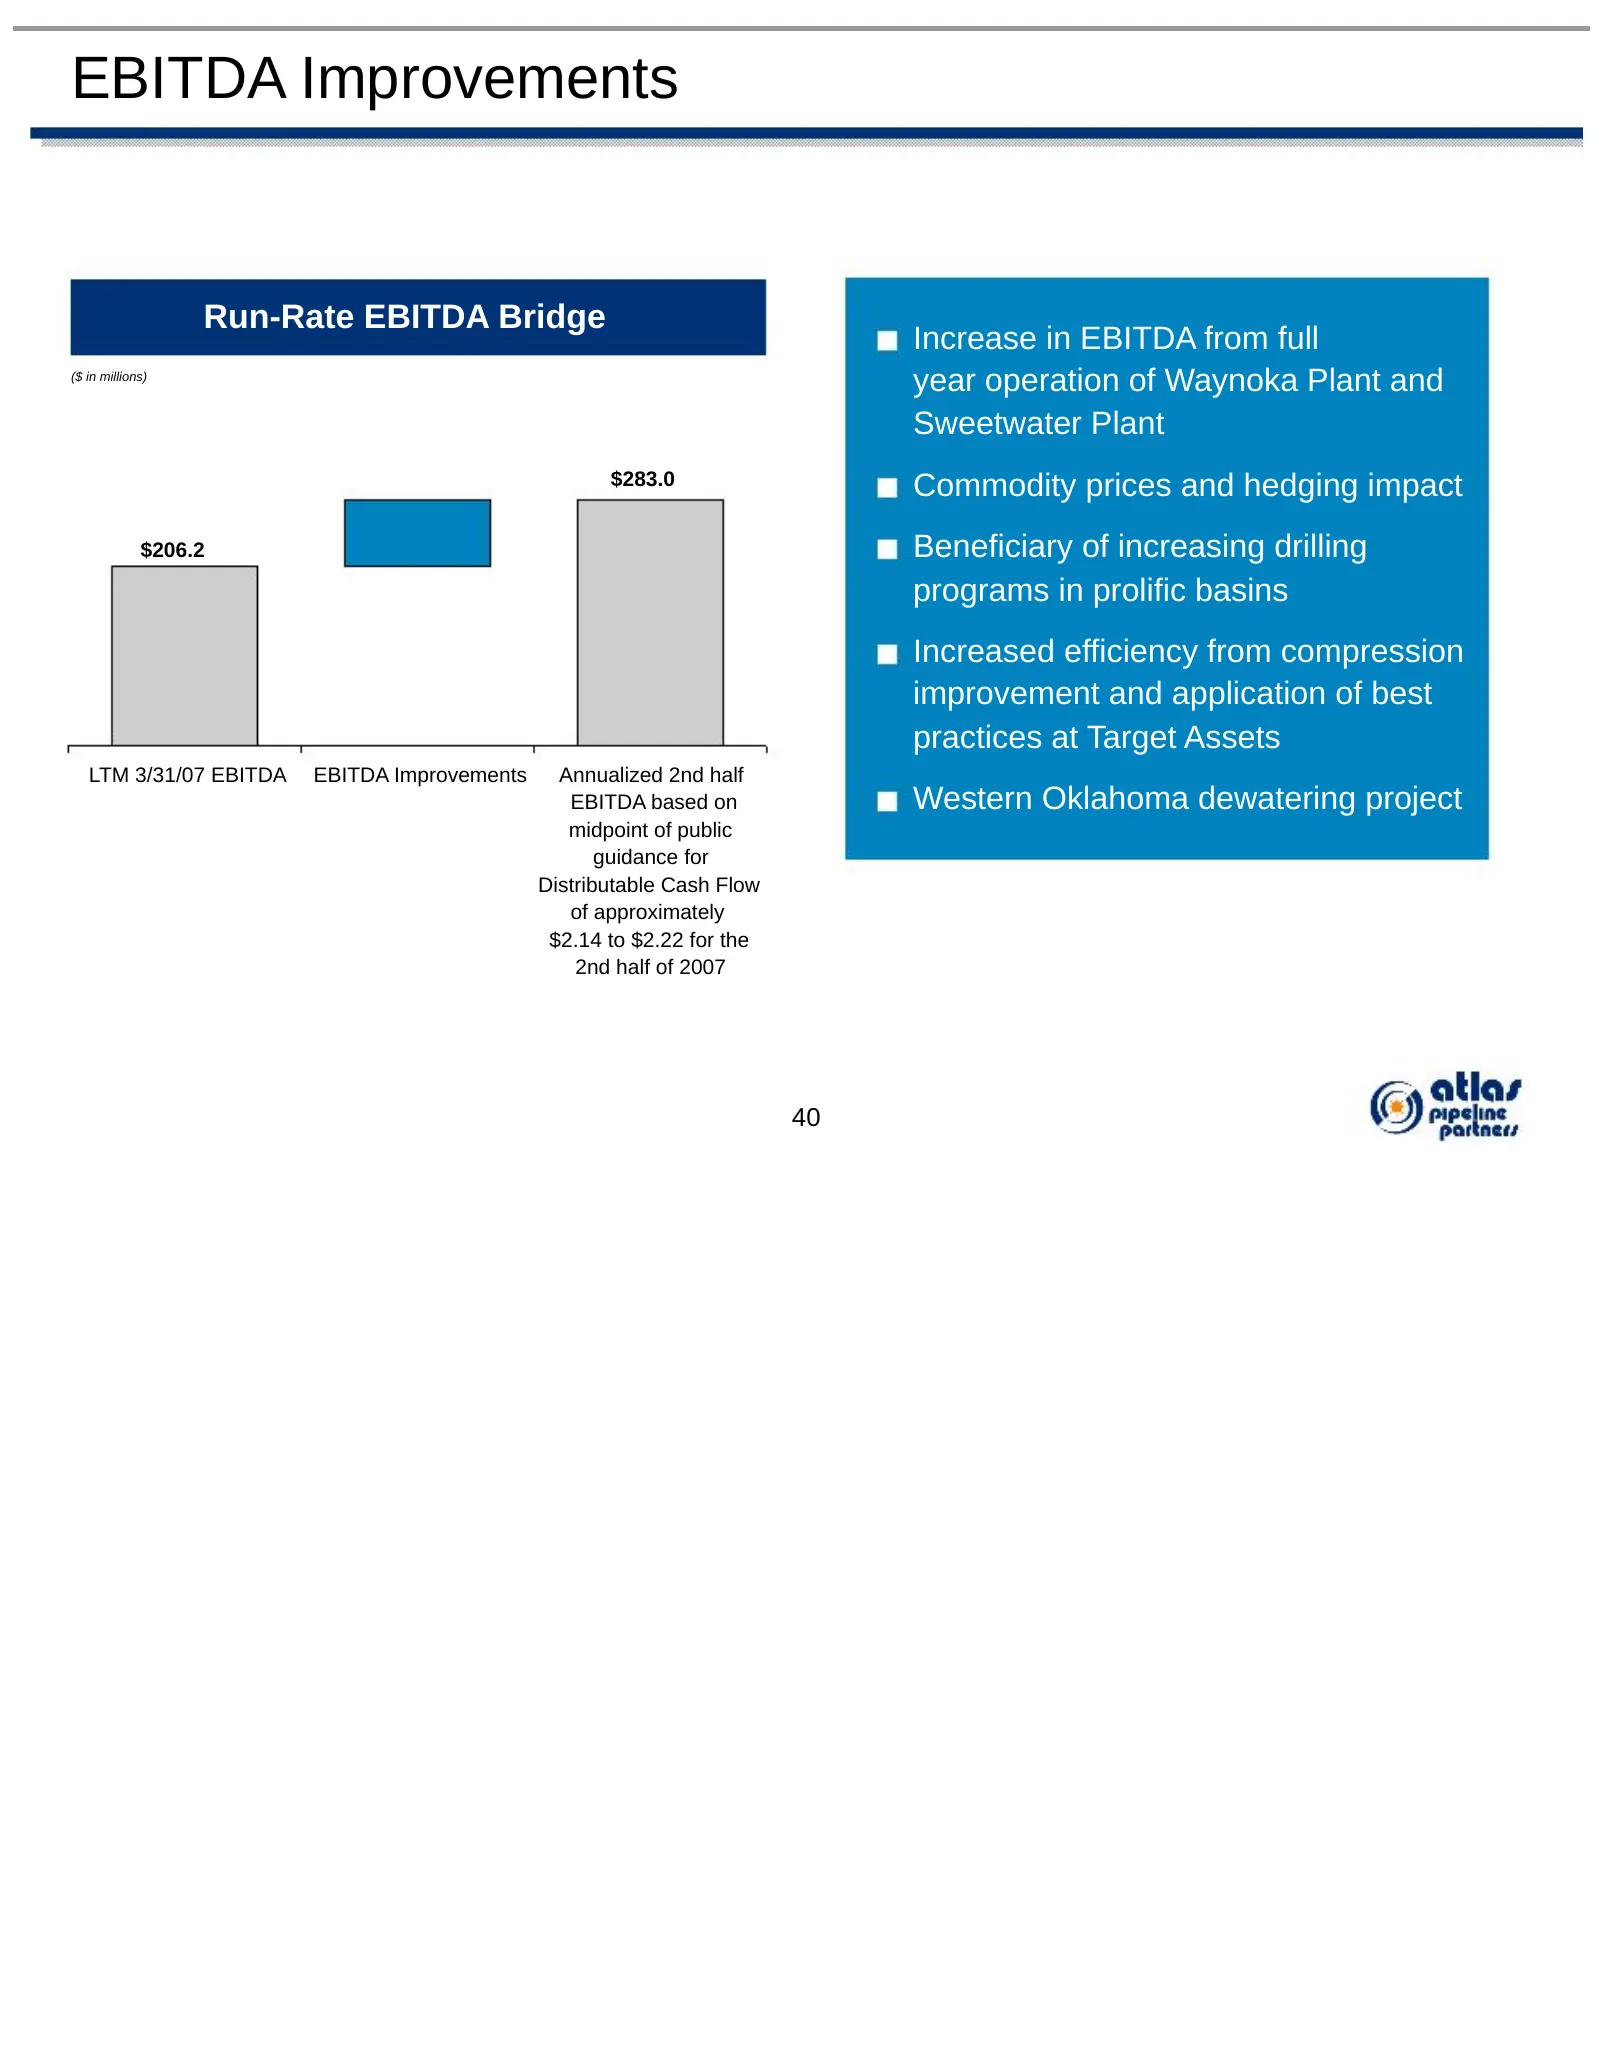
EBITDA Improvements Run-Rate EBITDA Bridge Increase in EBITDA from full ($ in millions) year operation of Waynoka Plant and Sweetwater Plant $283.0 Commodity prices and hedging impact $206.2 Beneficiary of increasing drilling programs in prolific basins Increased efficiency from compression improvem
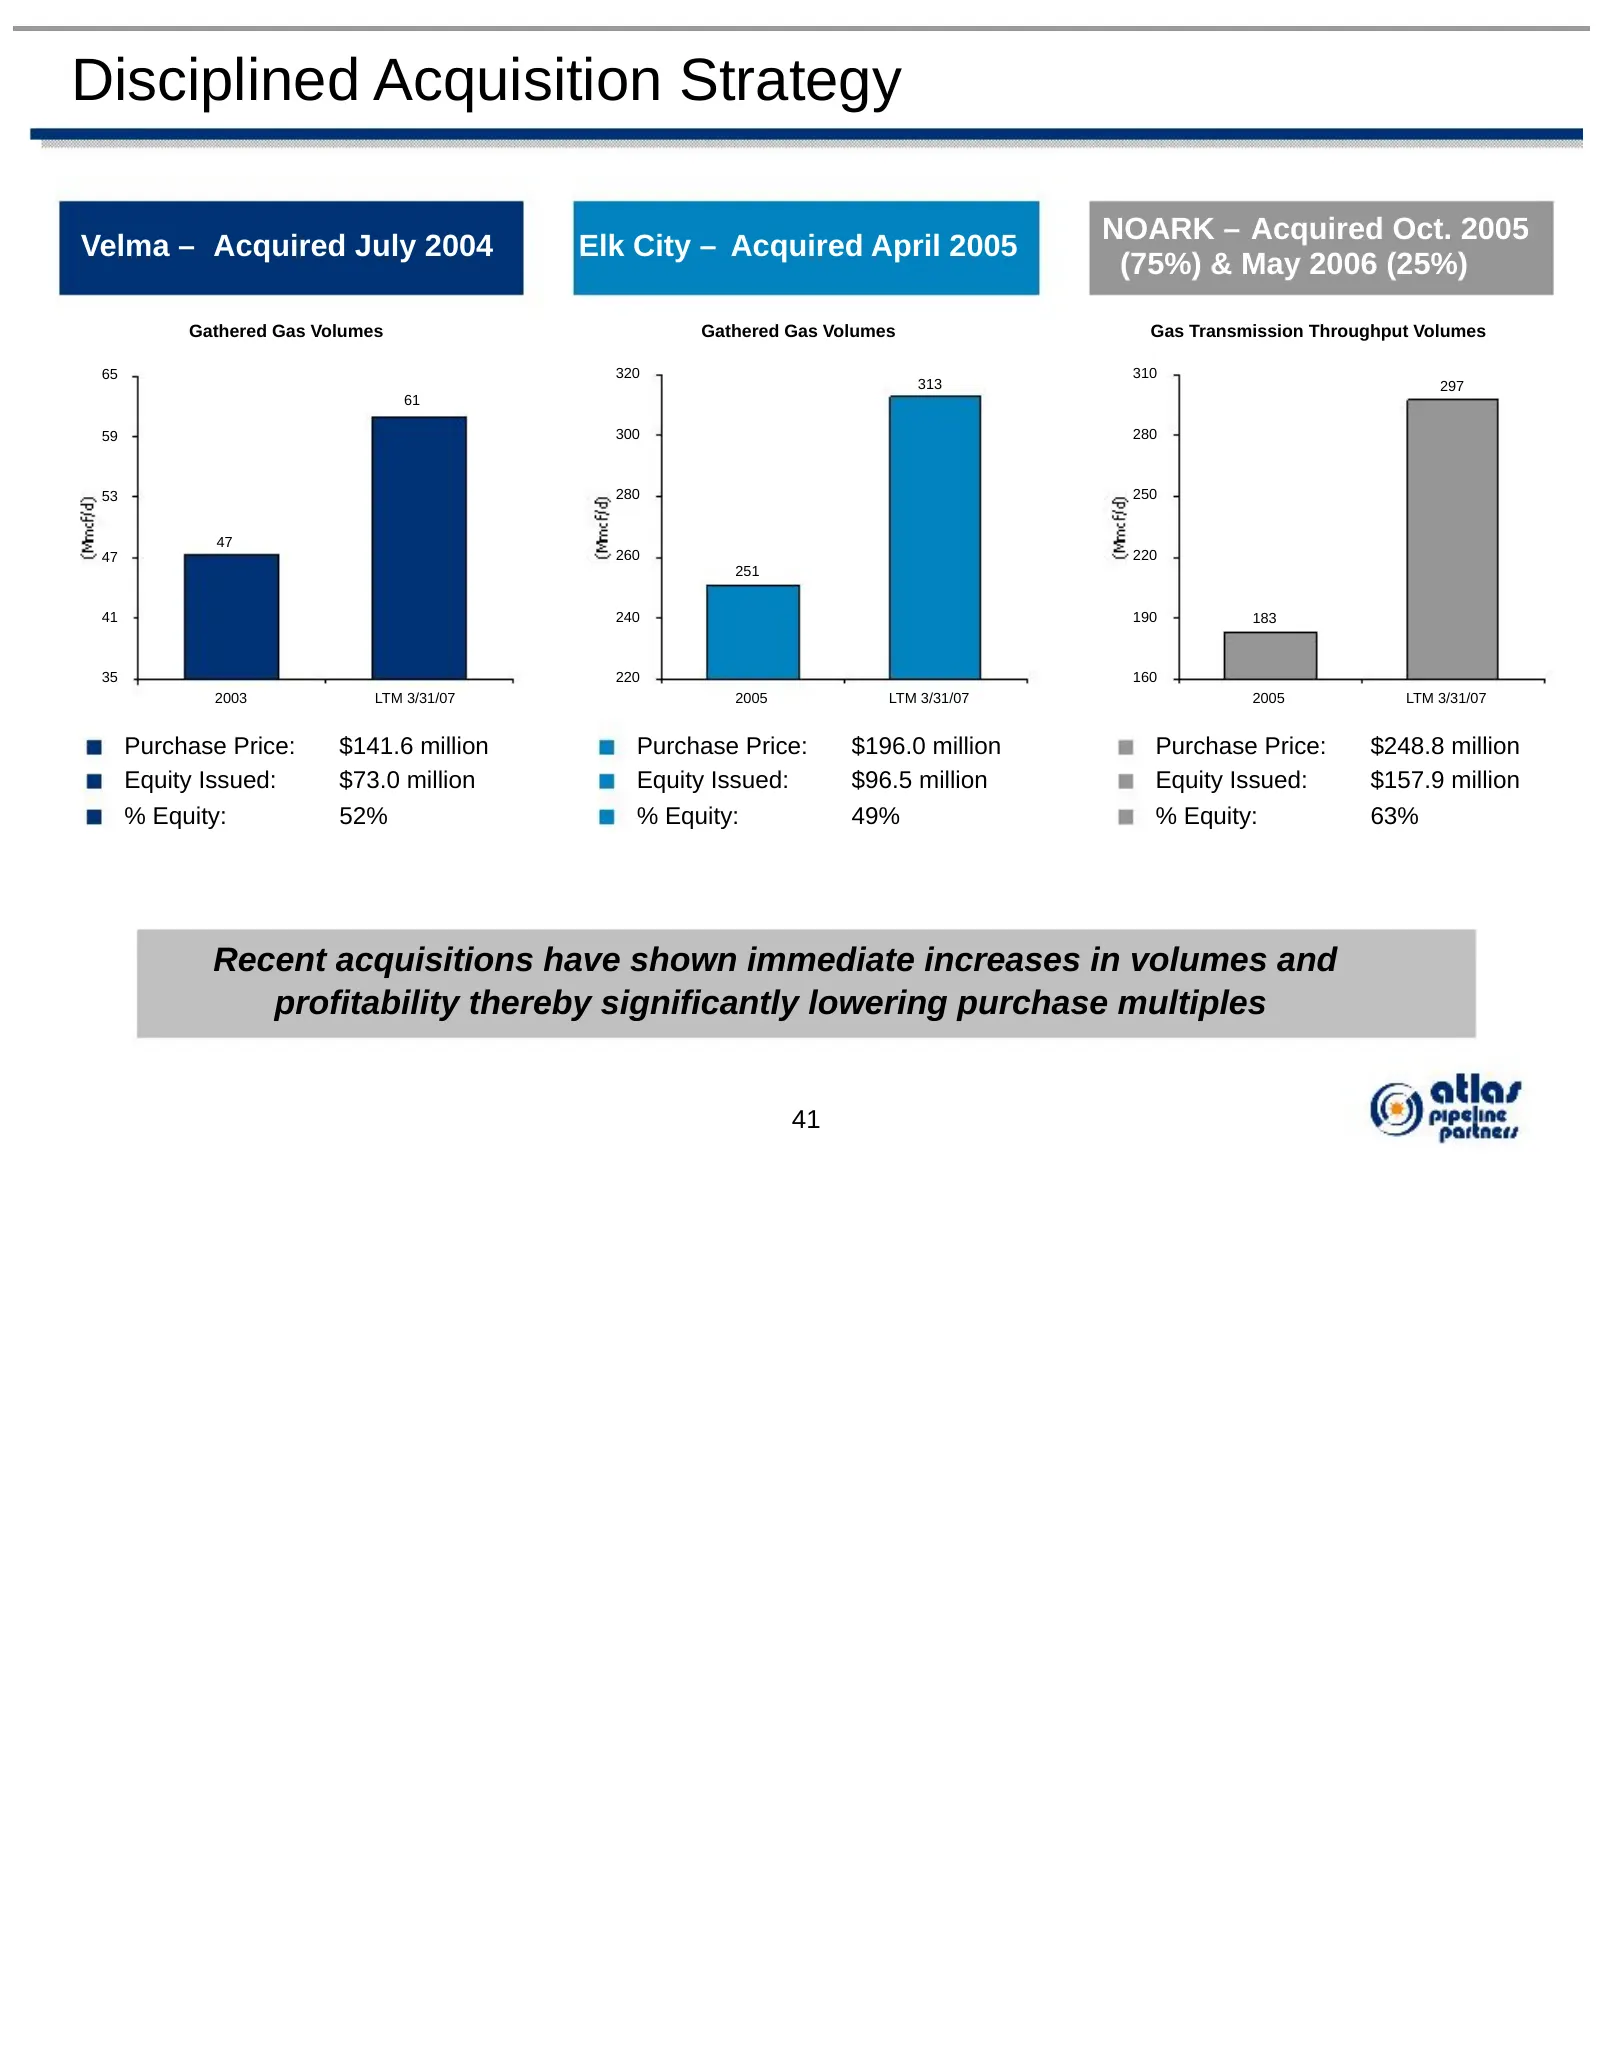
Slide 42: Disciplined Acquisition Strategy
Disciplined Acquisition Strategy NOARK – Acquired Oct. 2005 Velma – Acquired July 2004 Elk City – Acquired April 2005 (75%) & May 2006 (25%) Gathered Gas Volumes Gathered Gas Volumes Gas Transmission Throughput Volumes 65 320 310 313 297 61 59 300 280 53 280 250 47 47 260 220 251 41 240 190 183 35 2
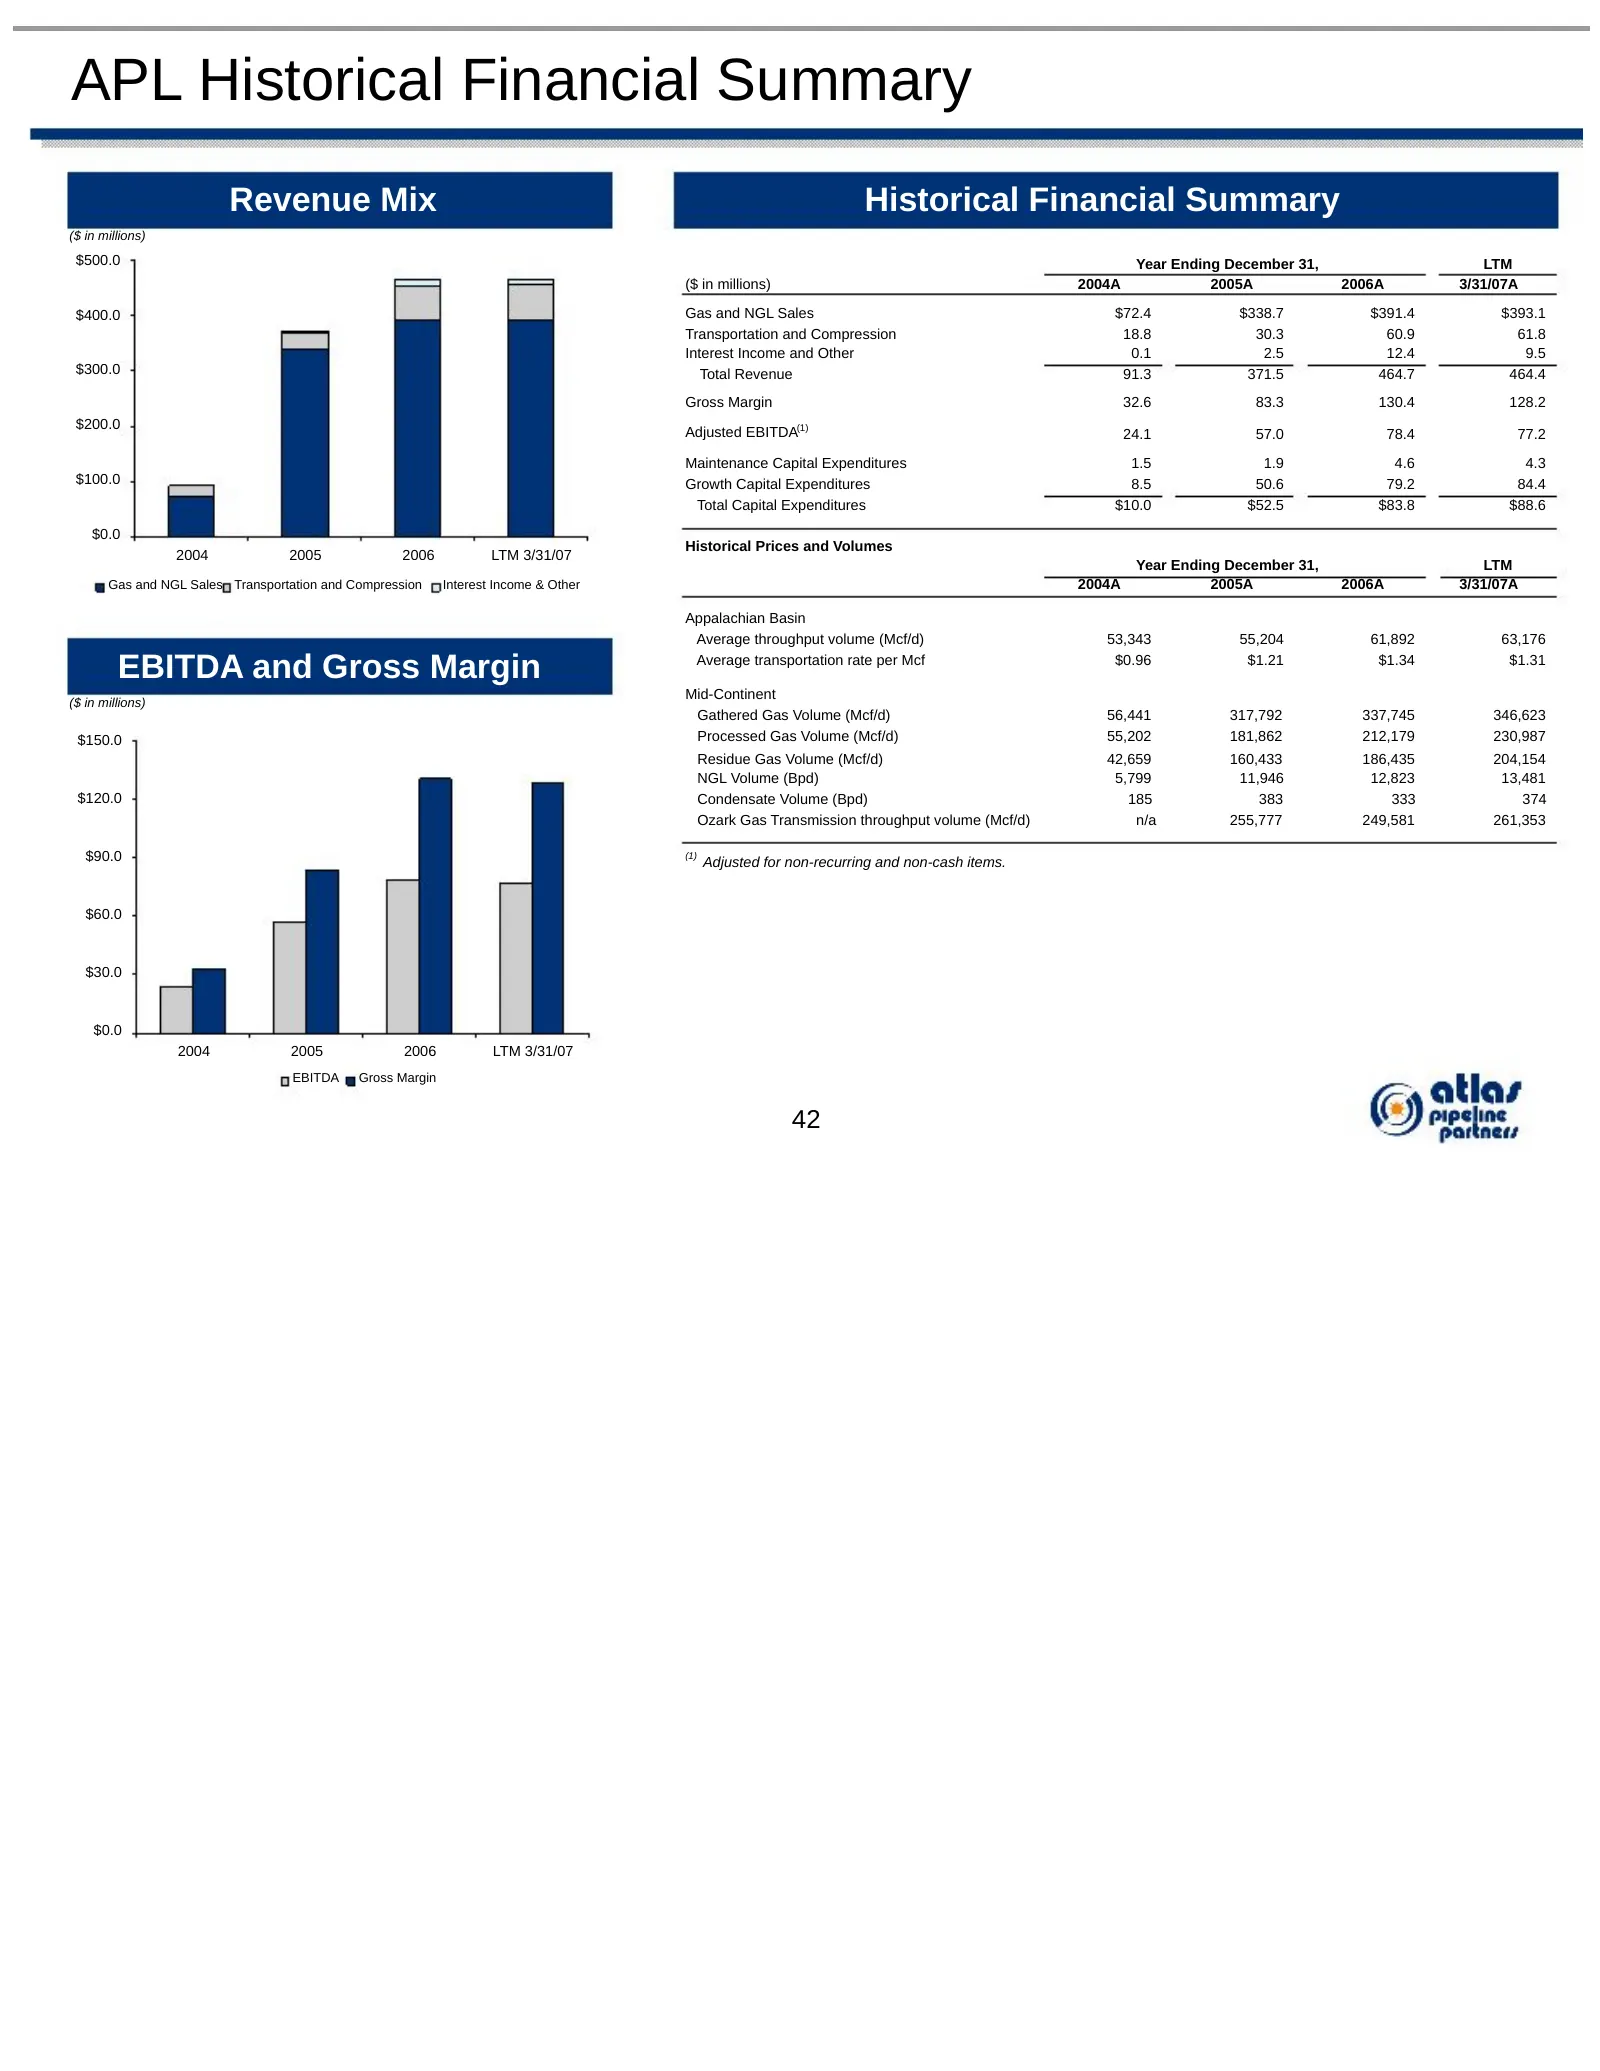
Slide 43: APL Historical Financial Summary
APL Historical Financial Summary Revenue Mix Historical Financial Summary ($ in millions) $500.0 Year Ending December 31, LTM ($ in millions) 2004A 2005A 2006A 3/31/07A $400.0 Gas and NGL Sales $72.4 $338.7 $391.4 $393.1 Transportation and Compression 18.8 30.3 60.9 61.8 Interest Income and Other 0.
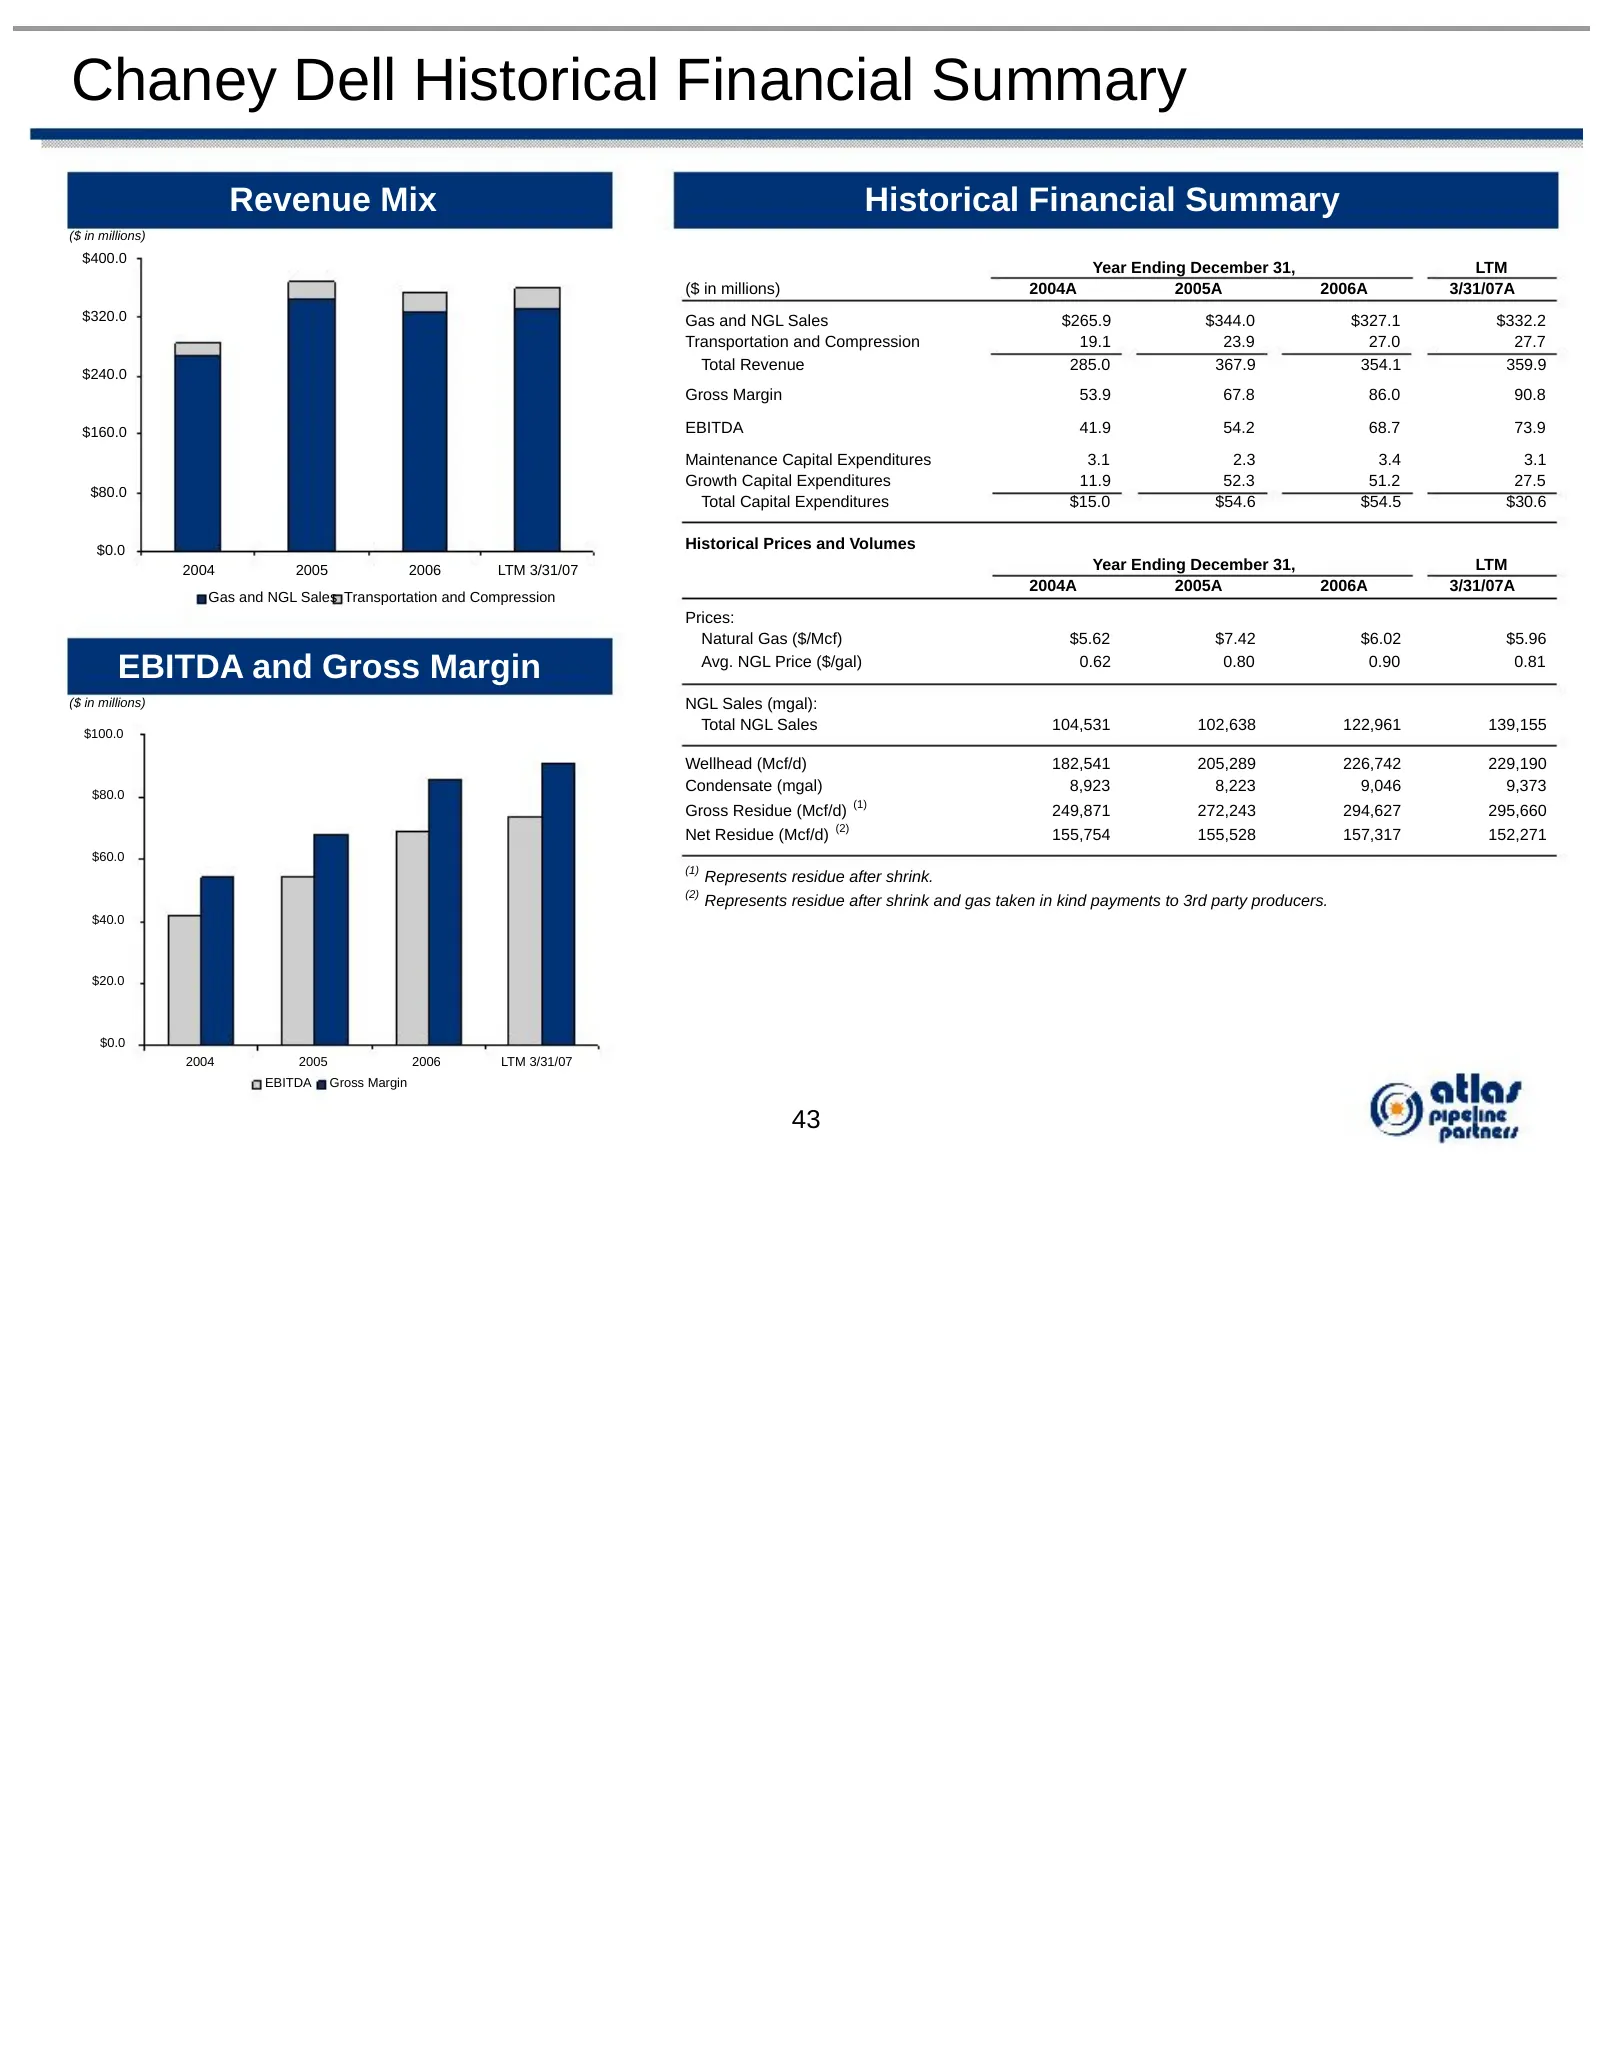
Slide 44: Chaney Dell Historical Financial Summary
Chaney Dell Historical Financial Summary Revenue Mix Historical Financial Summary ($ in millions) $400.0 Year Ending December 31, LTM ($ in millions) 2004A 2005A 2006A 3/31/07A $320.0 Gas and NGL Sales $265.9 $344.0 $327.1 $332.2 Transportation and Compression 19.1 23.9 27.0 27.7 Total Revenue 285.0
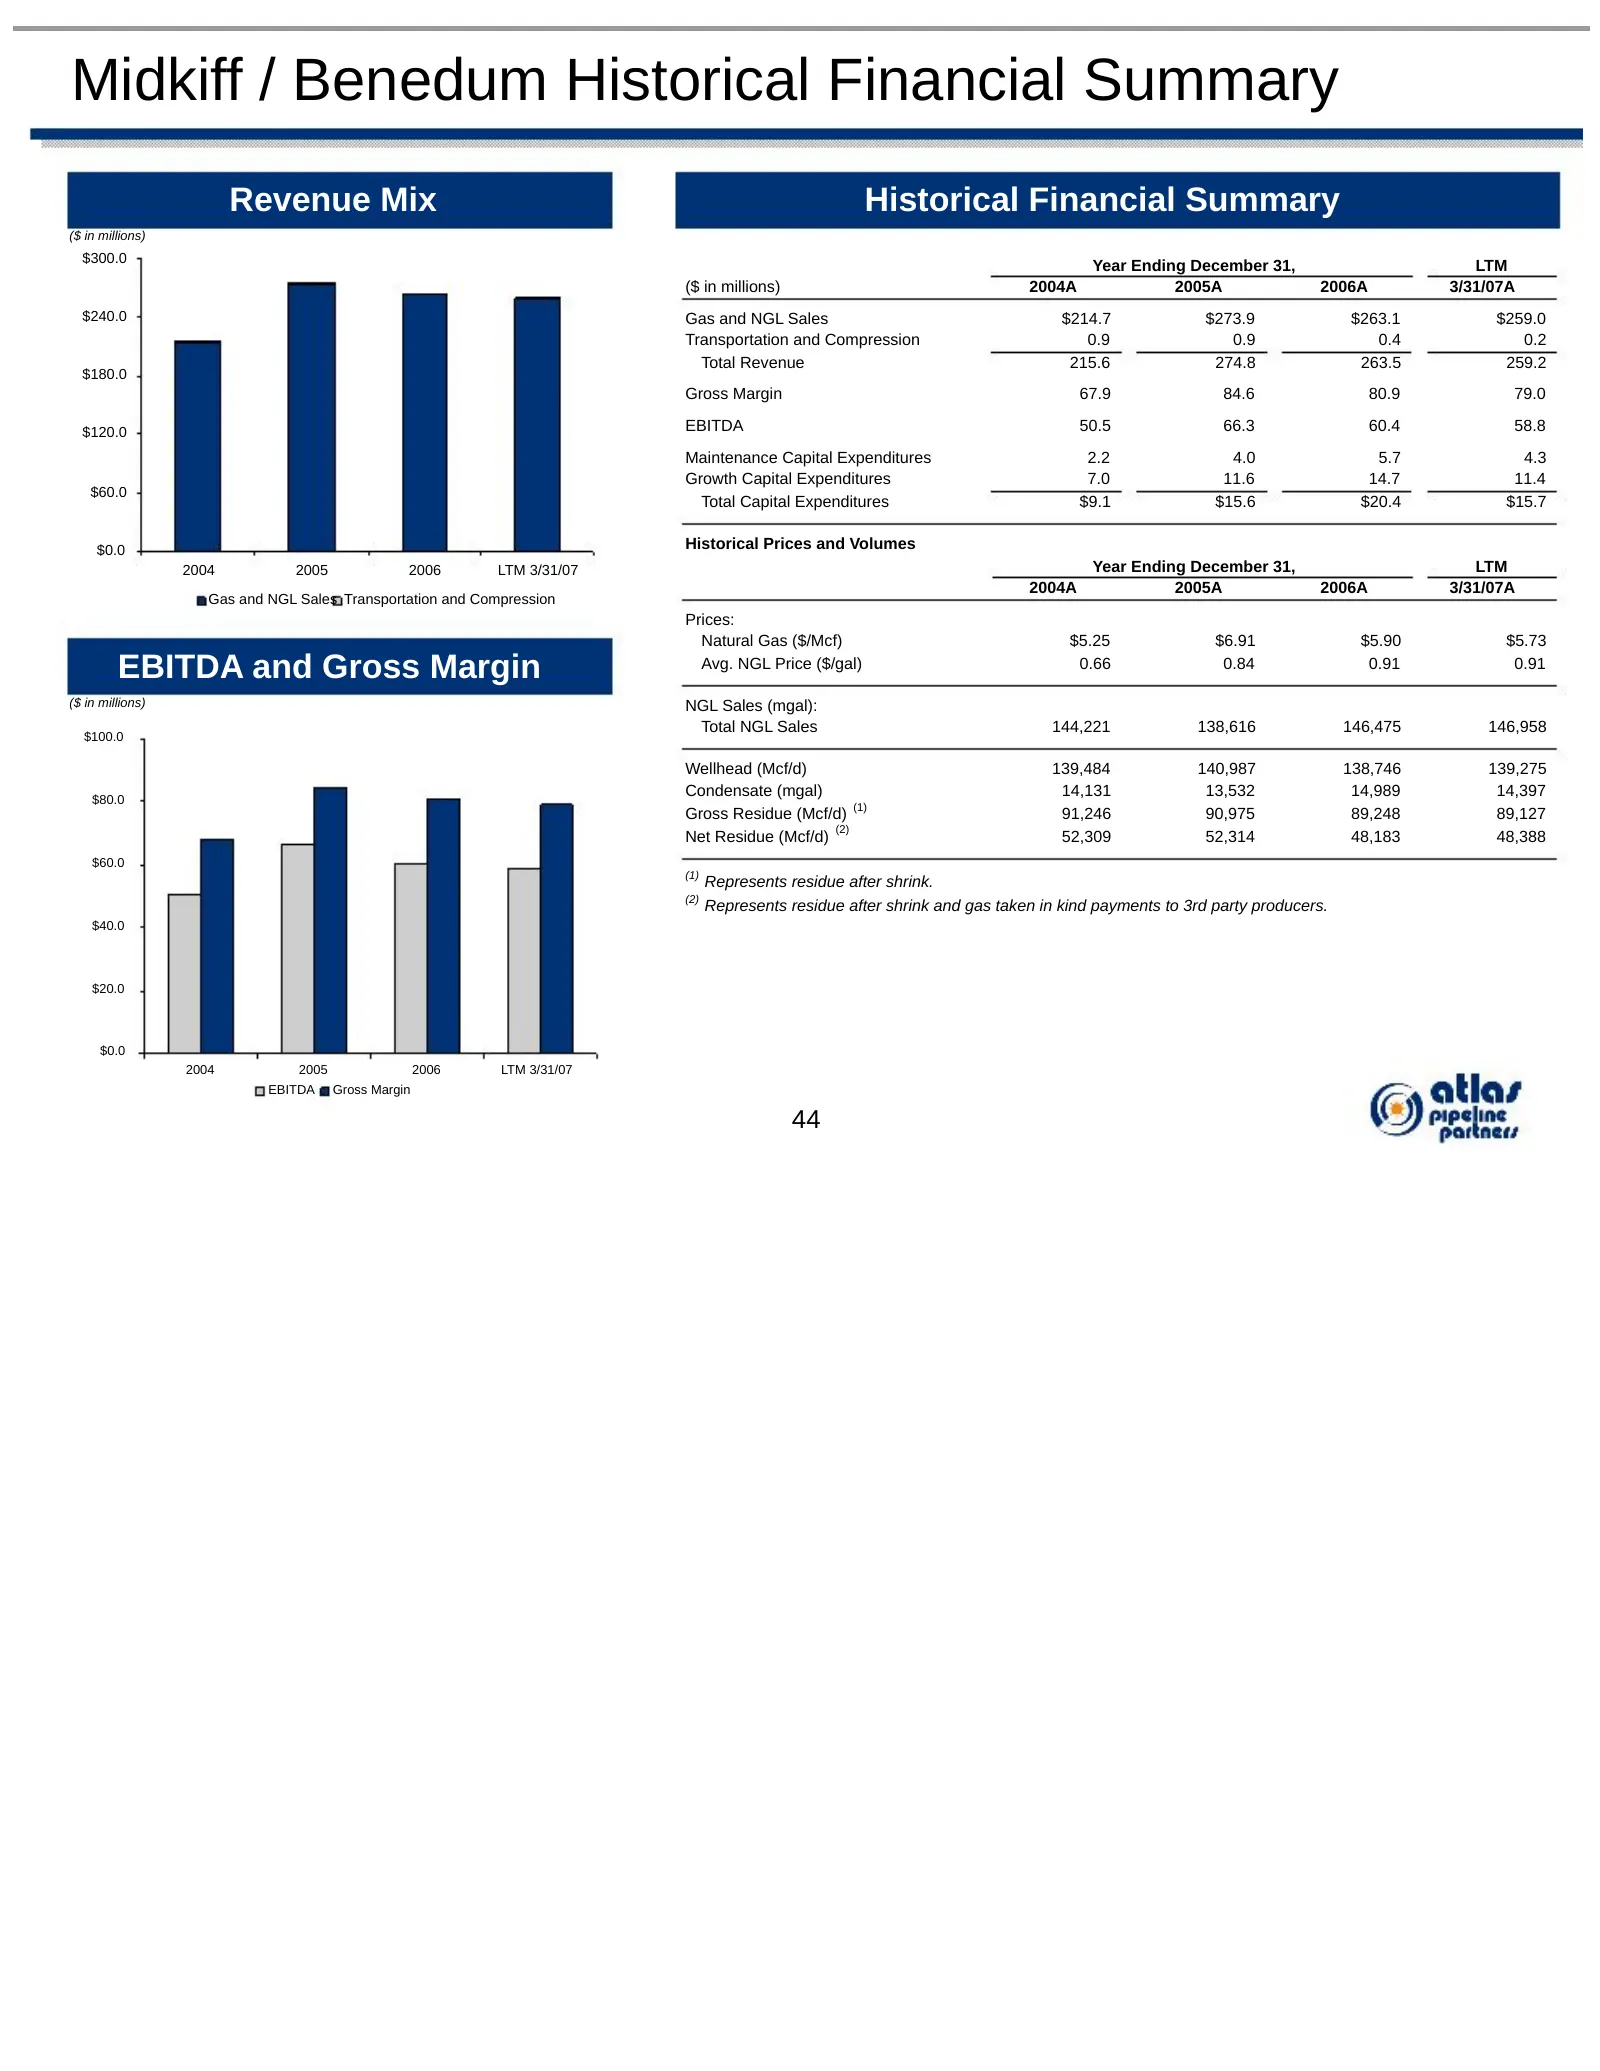
Slide 45: Midkiff / Benedum Historical Financial Summary
Midkiff / Benedum Historical Financial Summary Revenue Mix Historical Financial Summary ($ in millions) $300.0 Year Ending December 31, LTM ($ in millions) 2004A 2005A 2006A 3/31/07A $240.0 Gas and NGL Sales $214.7 $273.9 $263.1 $259.0 Transportation and Compression 0.9 0.9 0.4 0.2 Total Revenue 215
Slide 46: Pro Forma EBITDA and Gross Margin Contribution
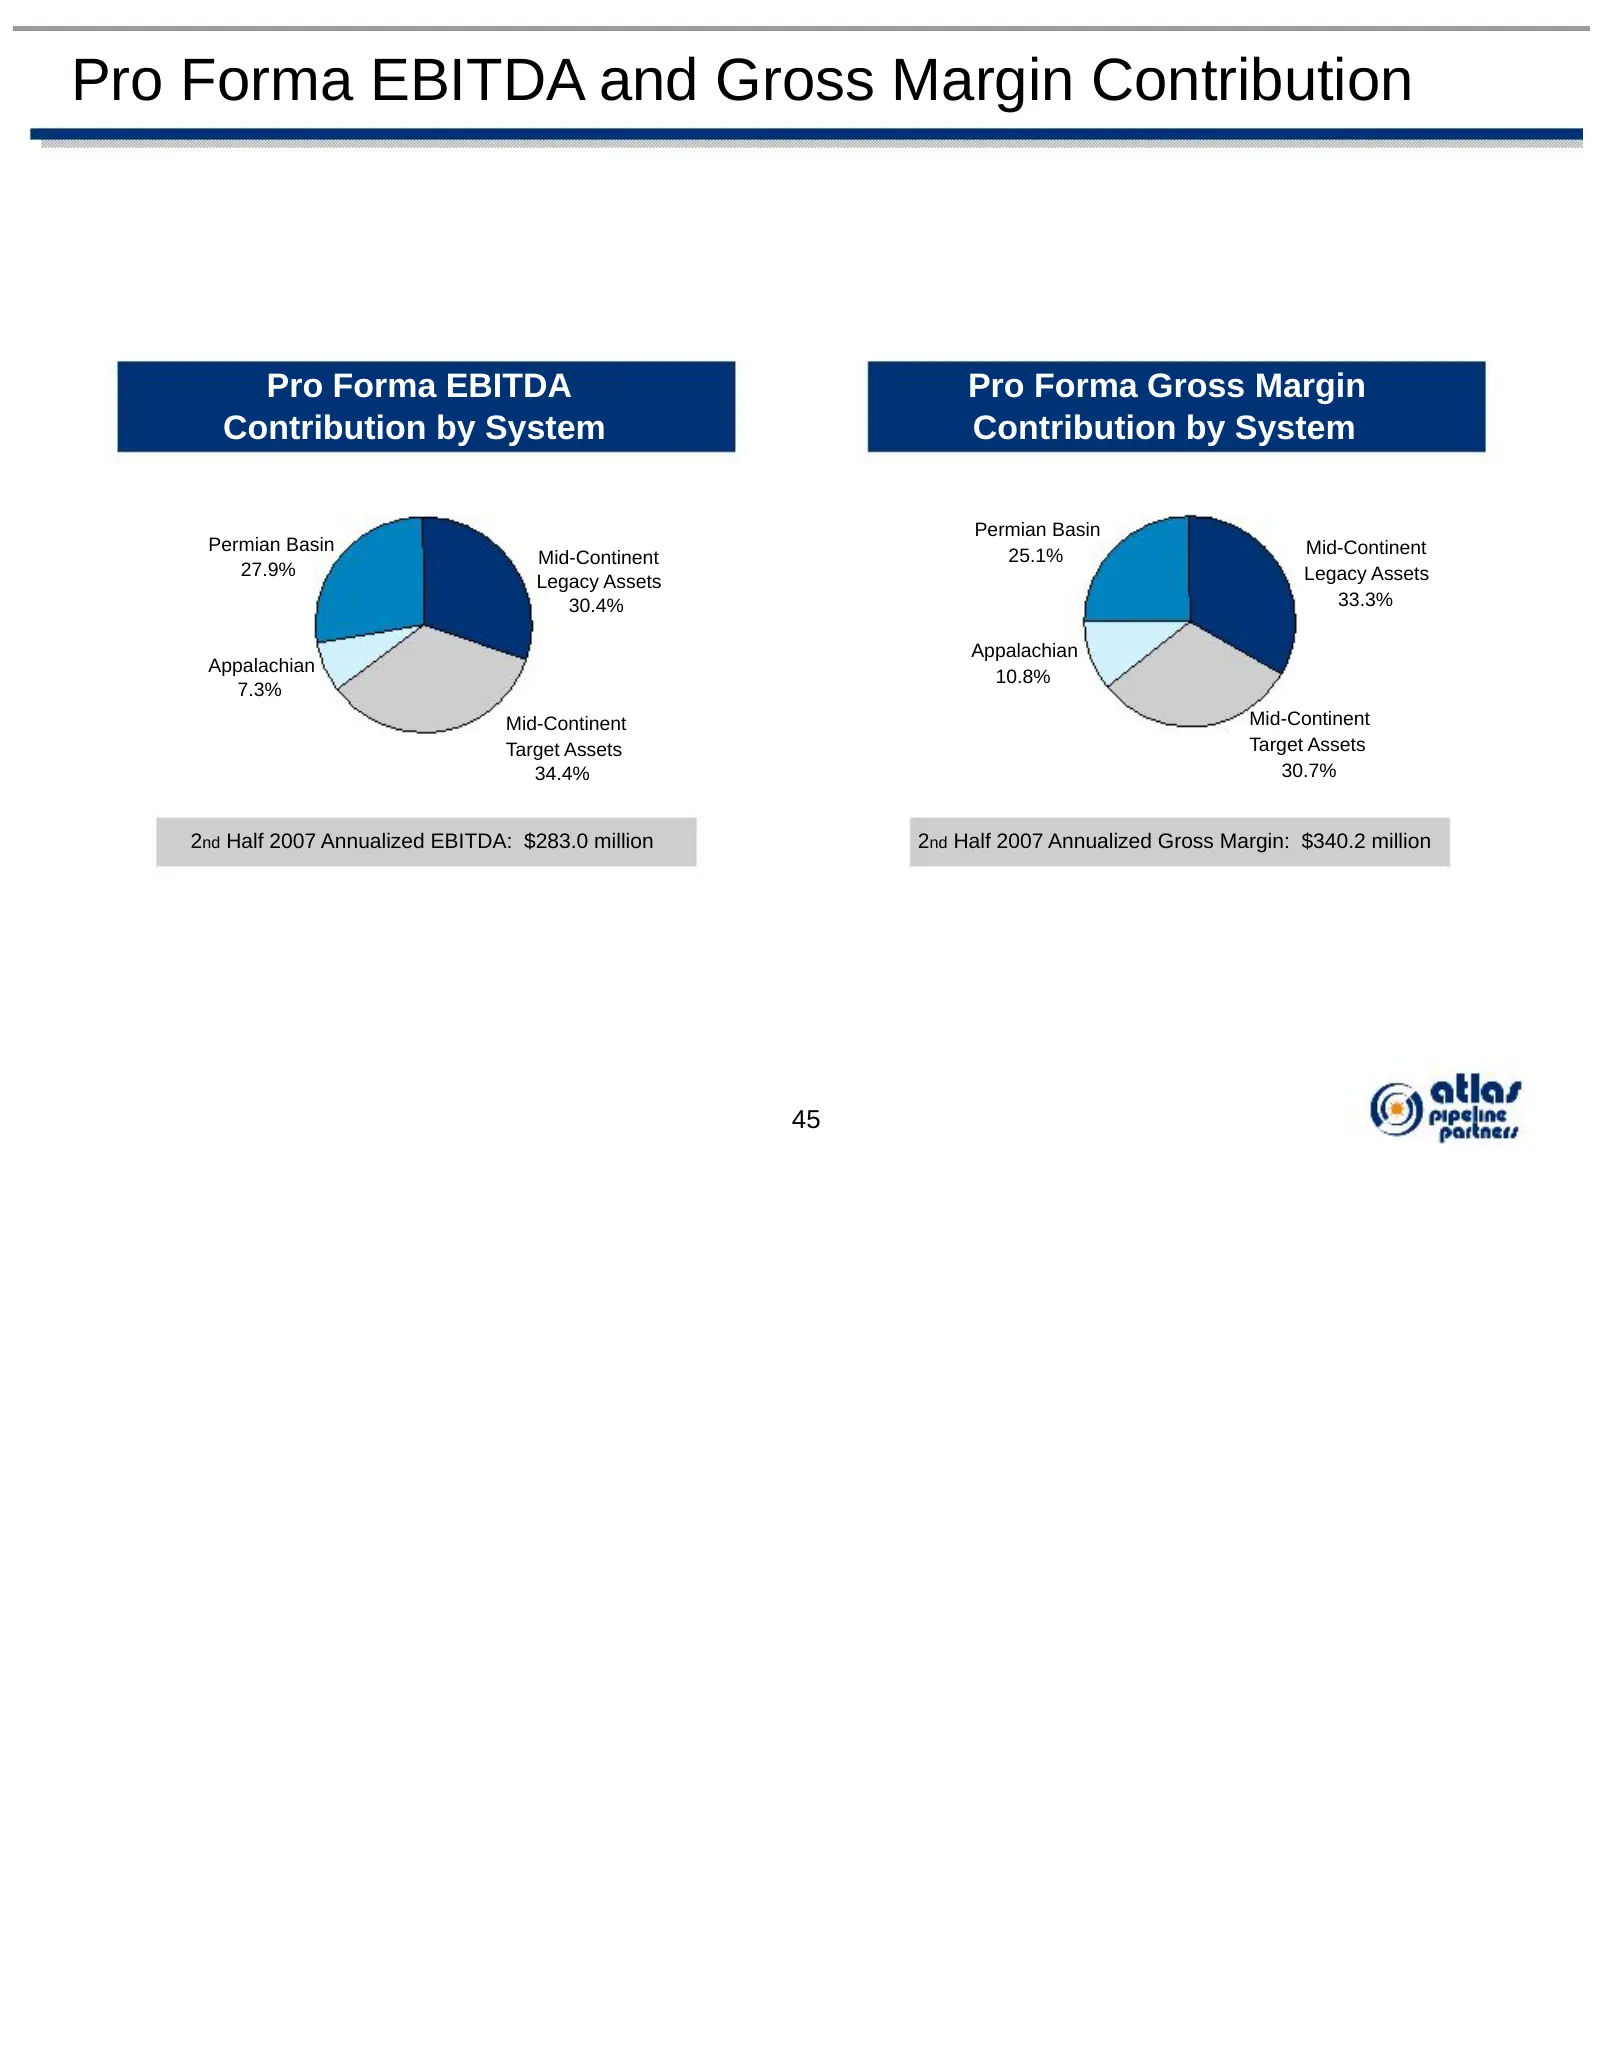
Pro Forma EBITDA and Gross Margin Contribution Pro Forma EBITDA Pro Forma Gross Margin Contribution by System Contribution by System Permian Basin Permian Basin Mid-Continent Mid-Continent 25.1% 27.9% Legacy Assets Legacy Assets 30.4% 33.3% Appalachian Appalachian 10.8% 7.3% Mid-Continent Mid-Contin
Slide 47: Pro Forma Contract Mix
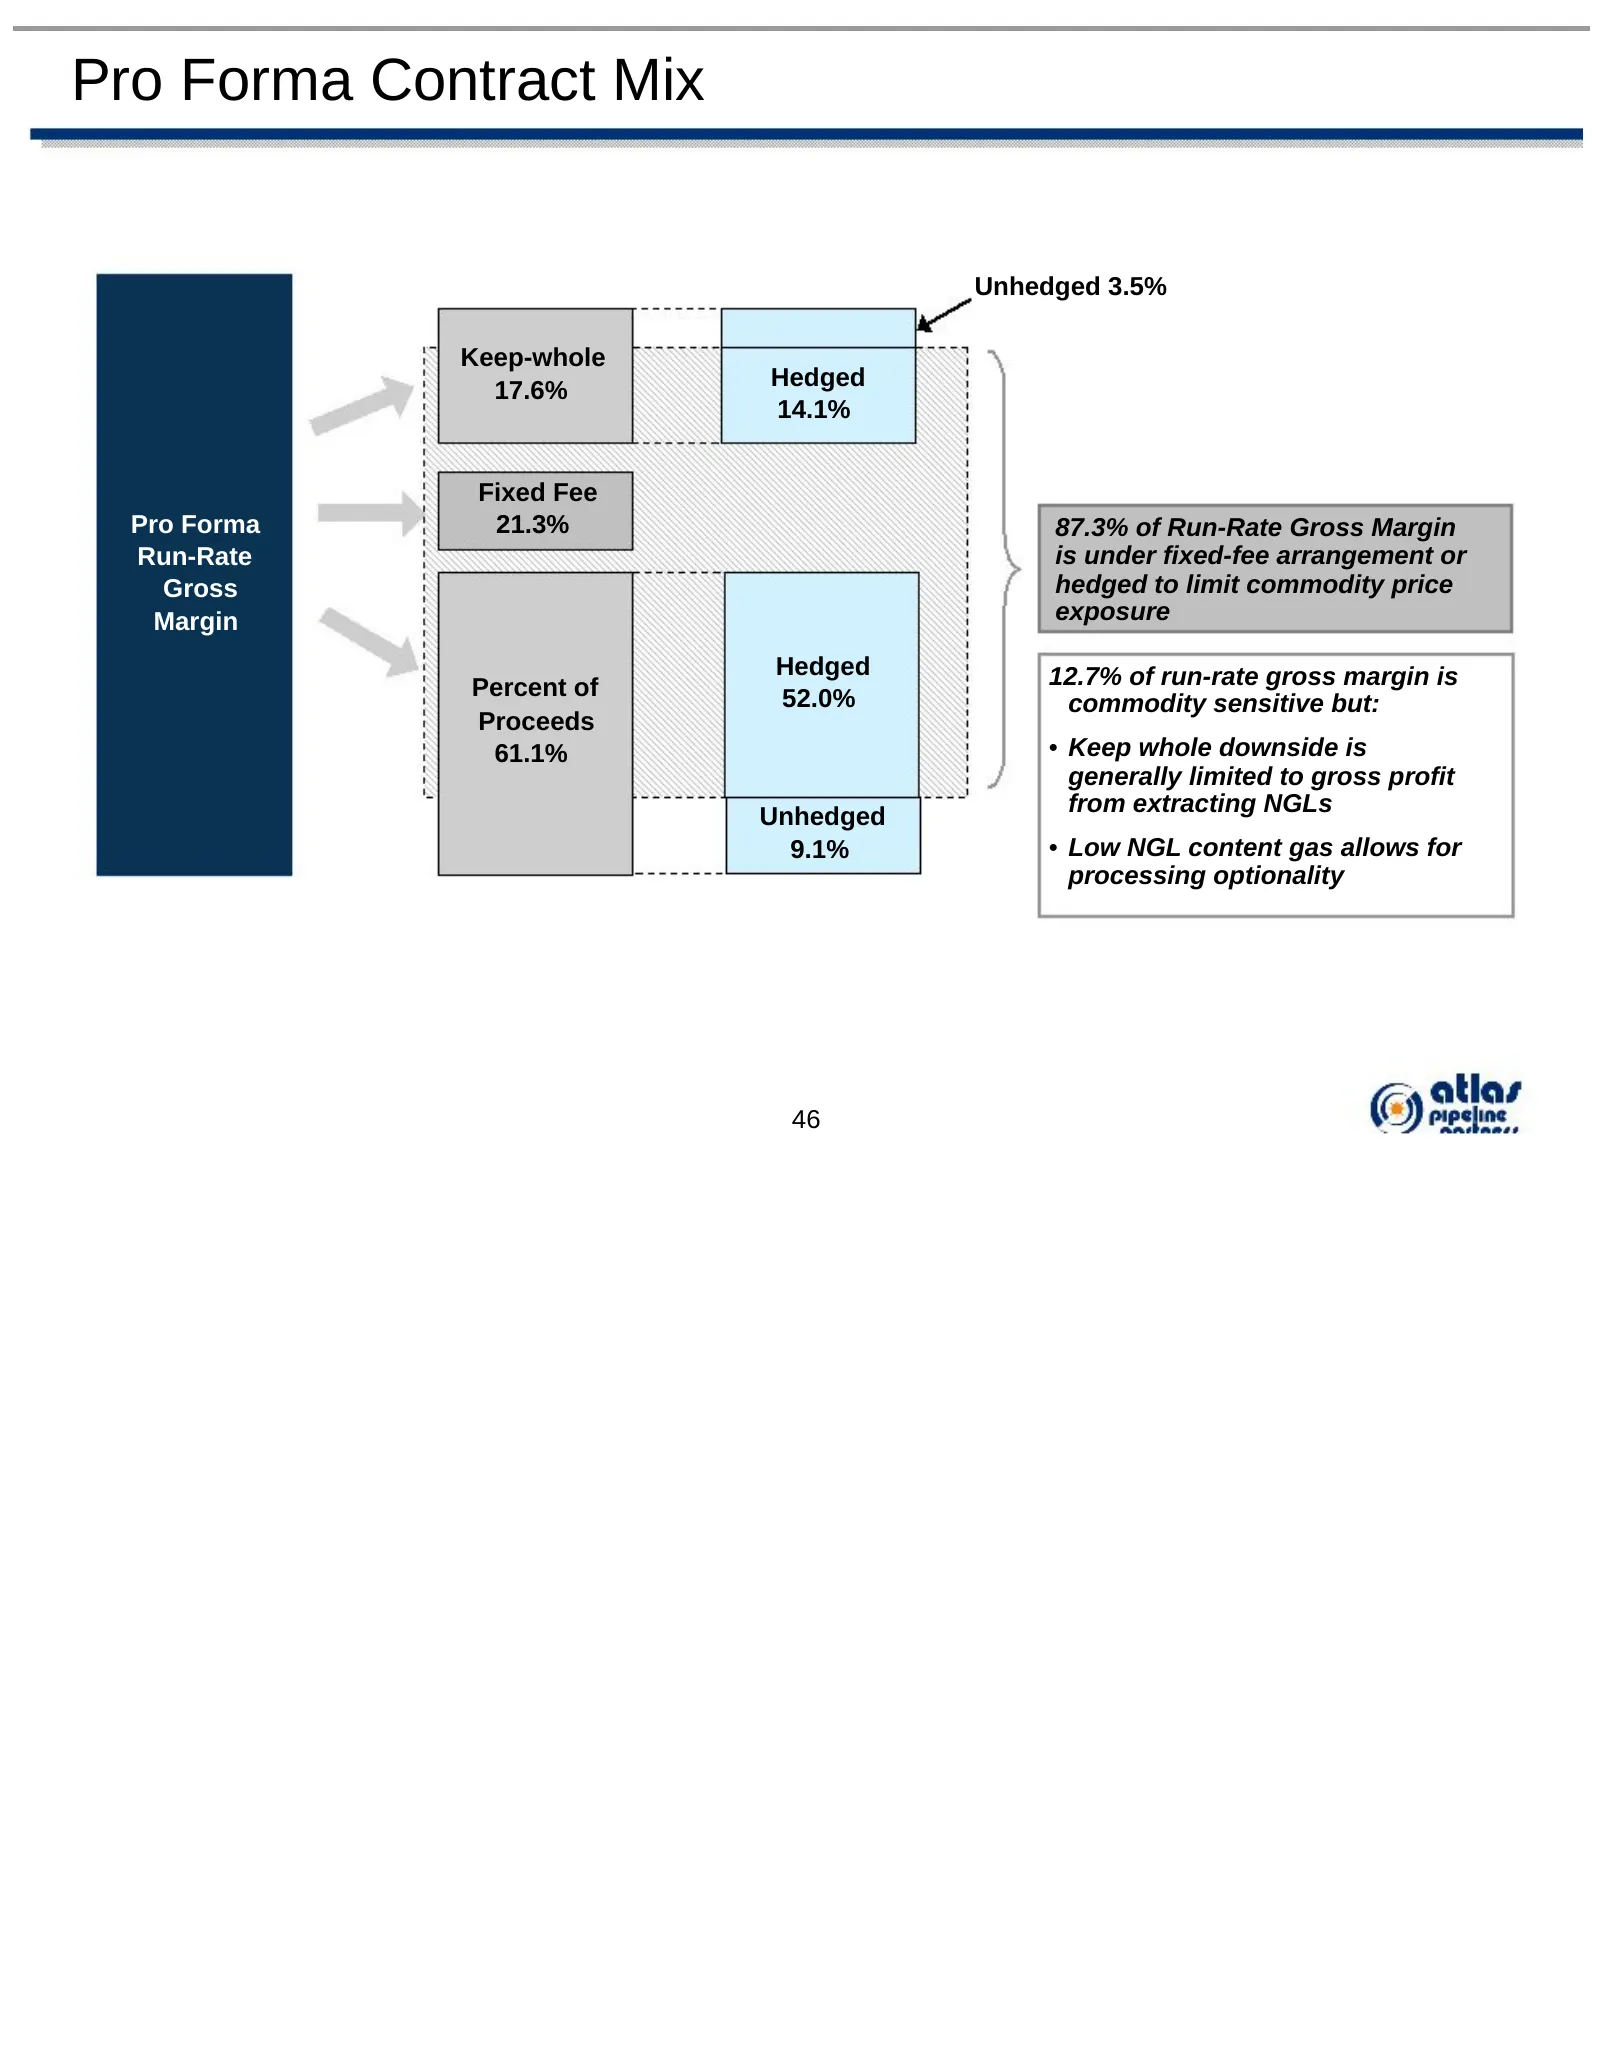
Pro Forma Contract Mix Unhedged 3.5% Keep-whole 17.6% Hedged 14.1% Fixed Fee Pro Forma 21.3% 87.3% of Run-Rate Gross Margin Run-Rate is under fixed-fee arrangement or Gross hedged to limit commodity price Margin exposure Hedged 12.7% of run-rate gross margin is Percent of 52.0% commodity sensitive b
Slide 48: Pro Forma Maintenance Capital Expenditures
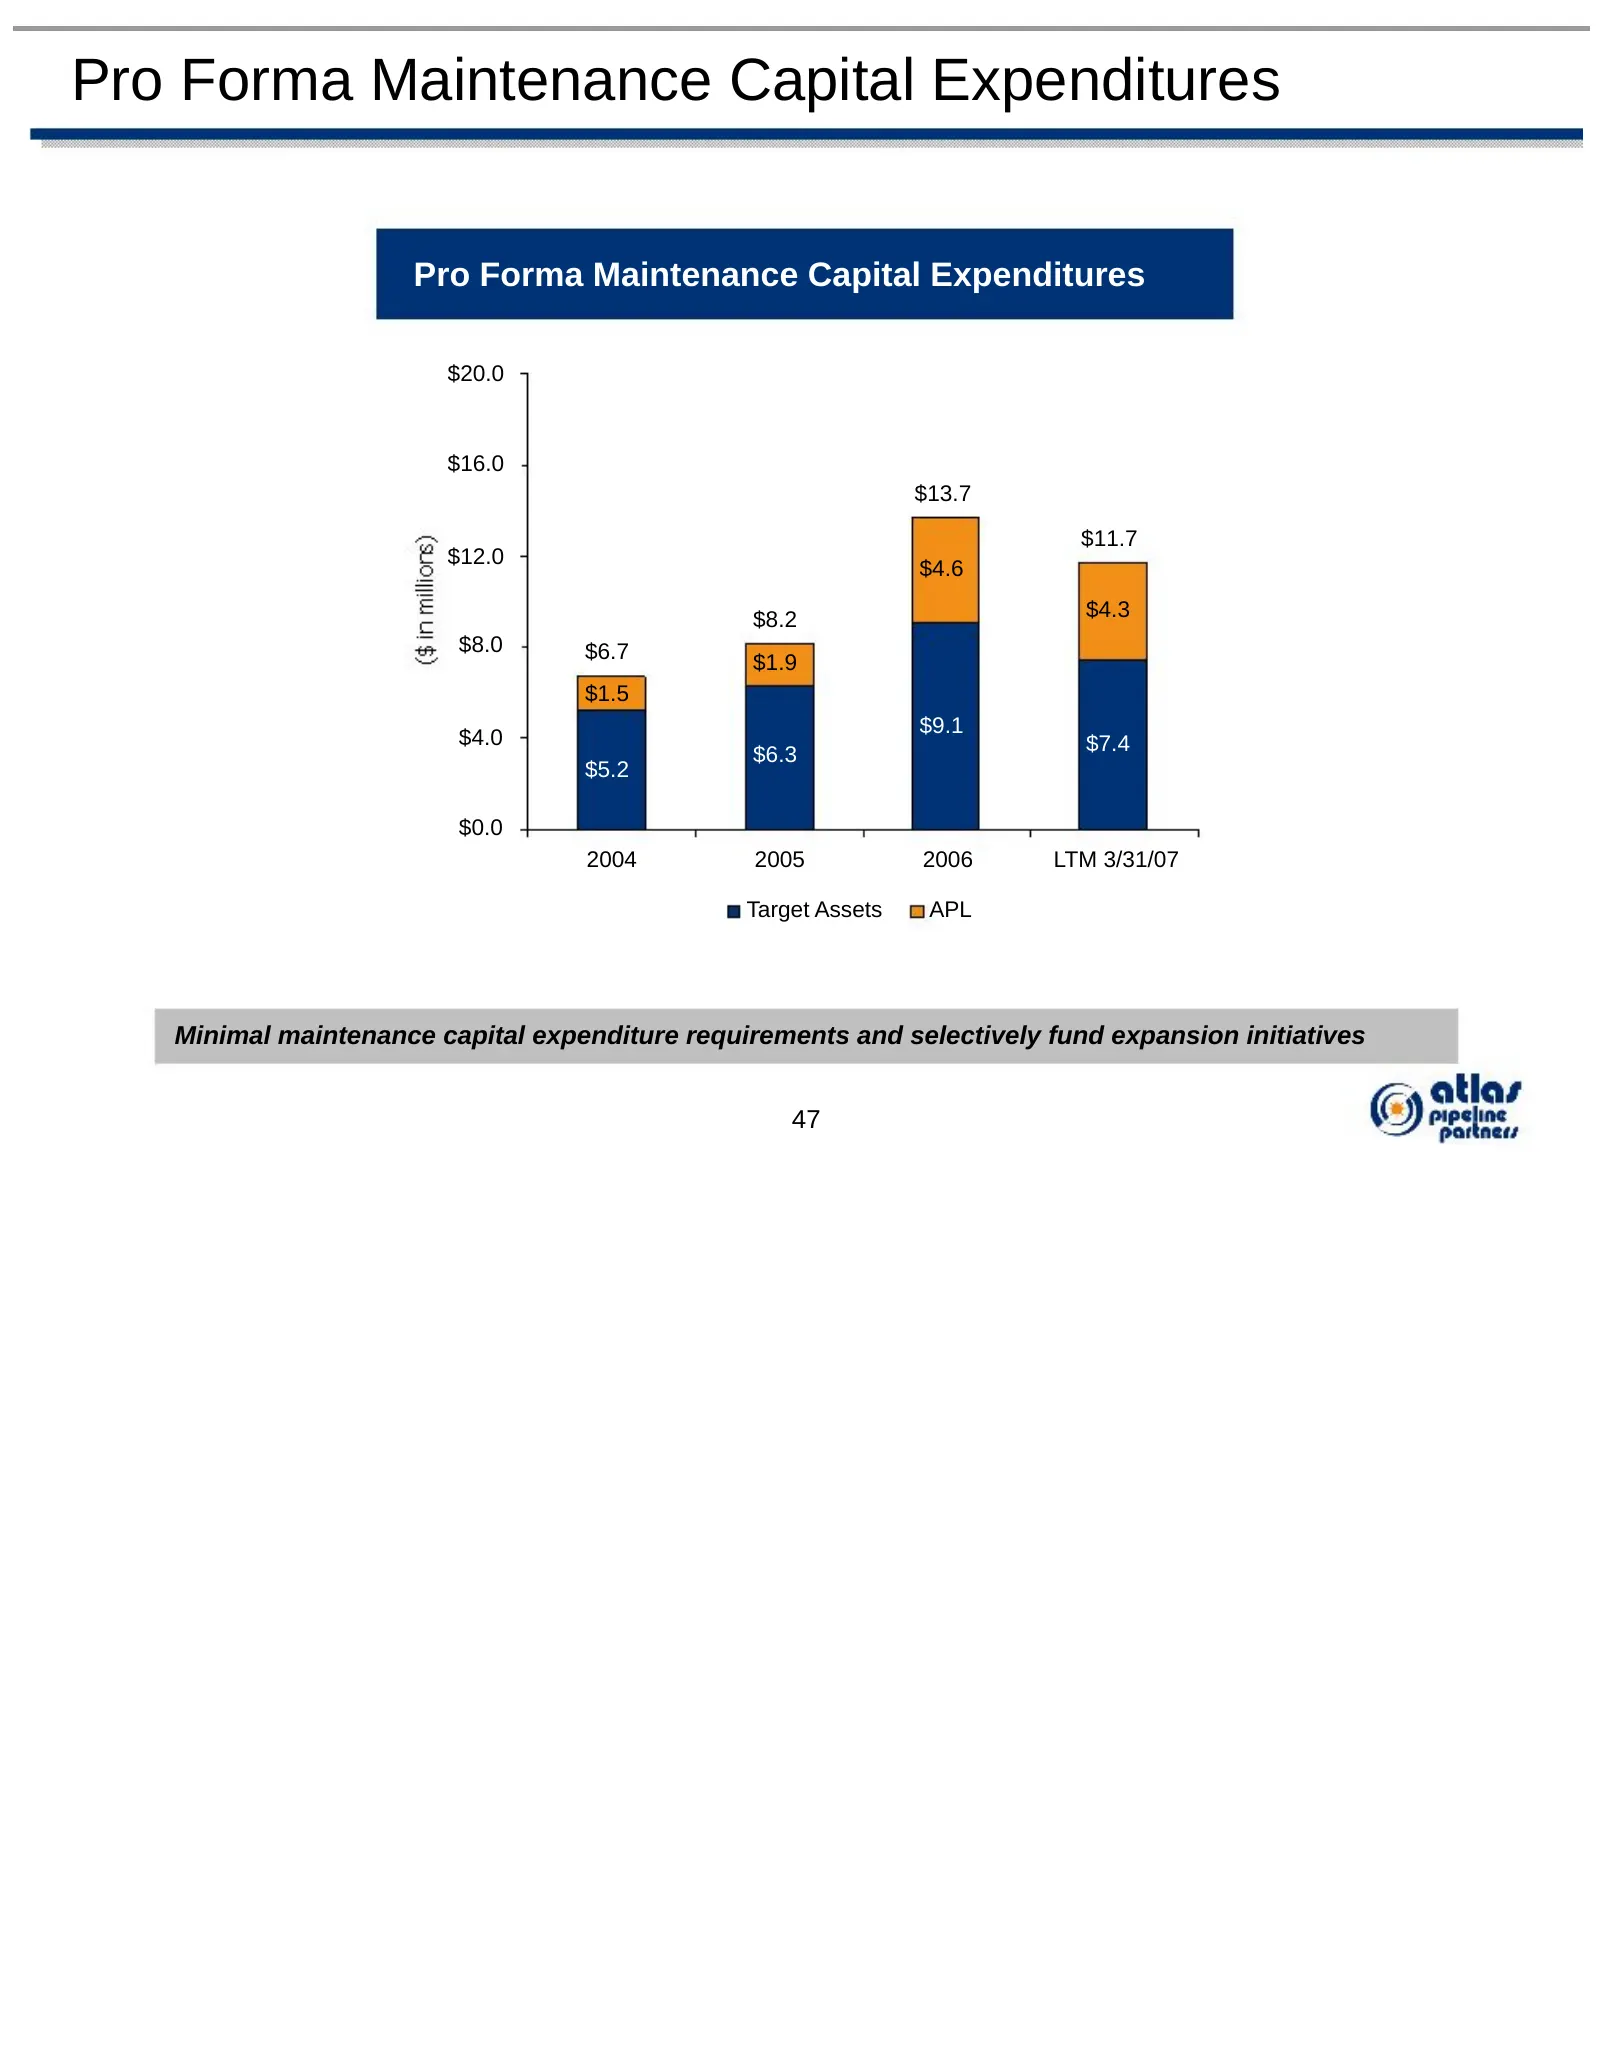
Pro Forma Maintenance Capital Expenditures Pro Forma Maintenance Capital Expenditures $20.0 $16.0 $13.7 $11.7 $12.0 $4.6 $8.2 $4.3 $8.0 $6.7 $1.9 $1.5 $9.1 $4.0 $7.4 $6.3 $5.2 $0.0 2004 2005 2006 LTM 3/31/07 Target Assets APL Pro Forma Minimal maintenance capital expenditure requirements and selecti
Slide 49: Joint Venture Formation and Consideration
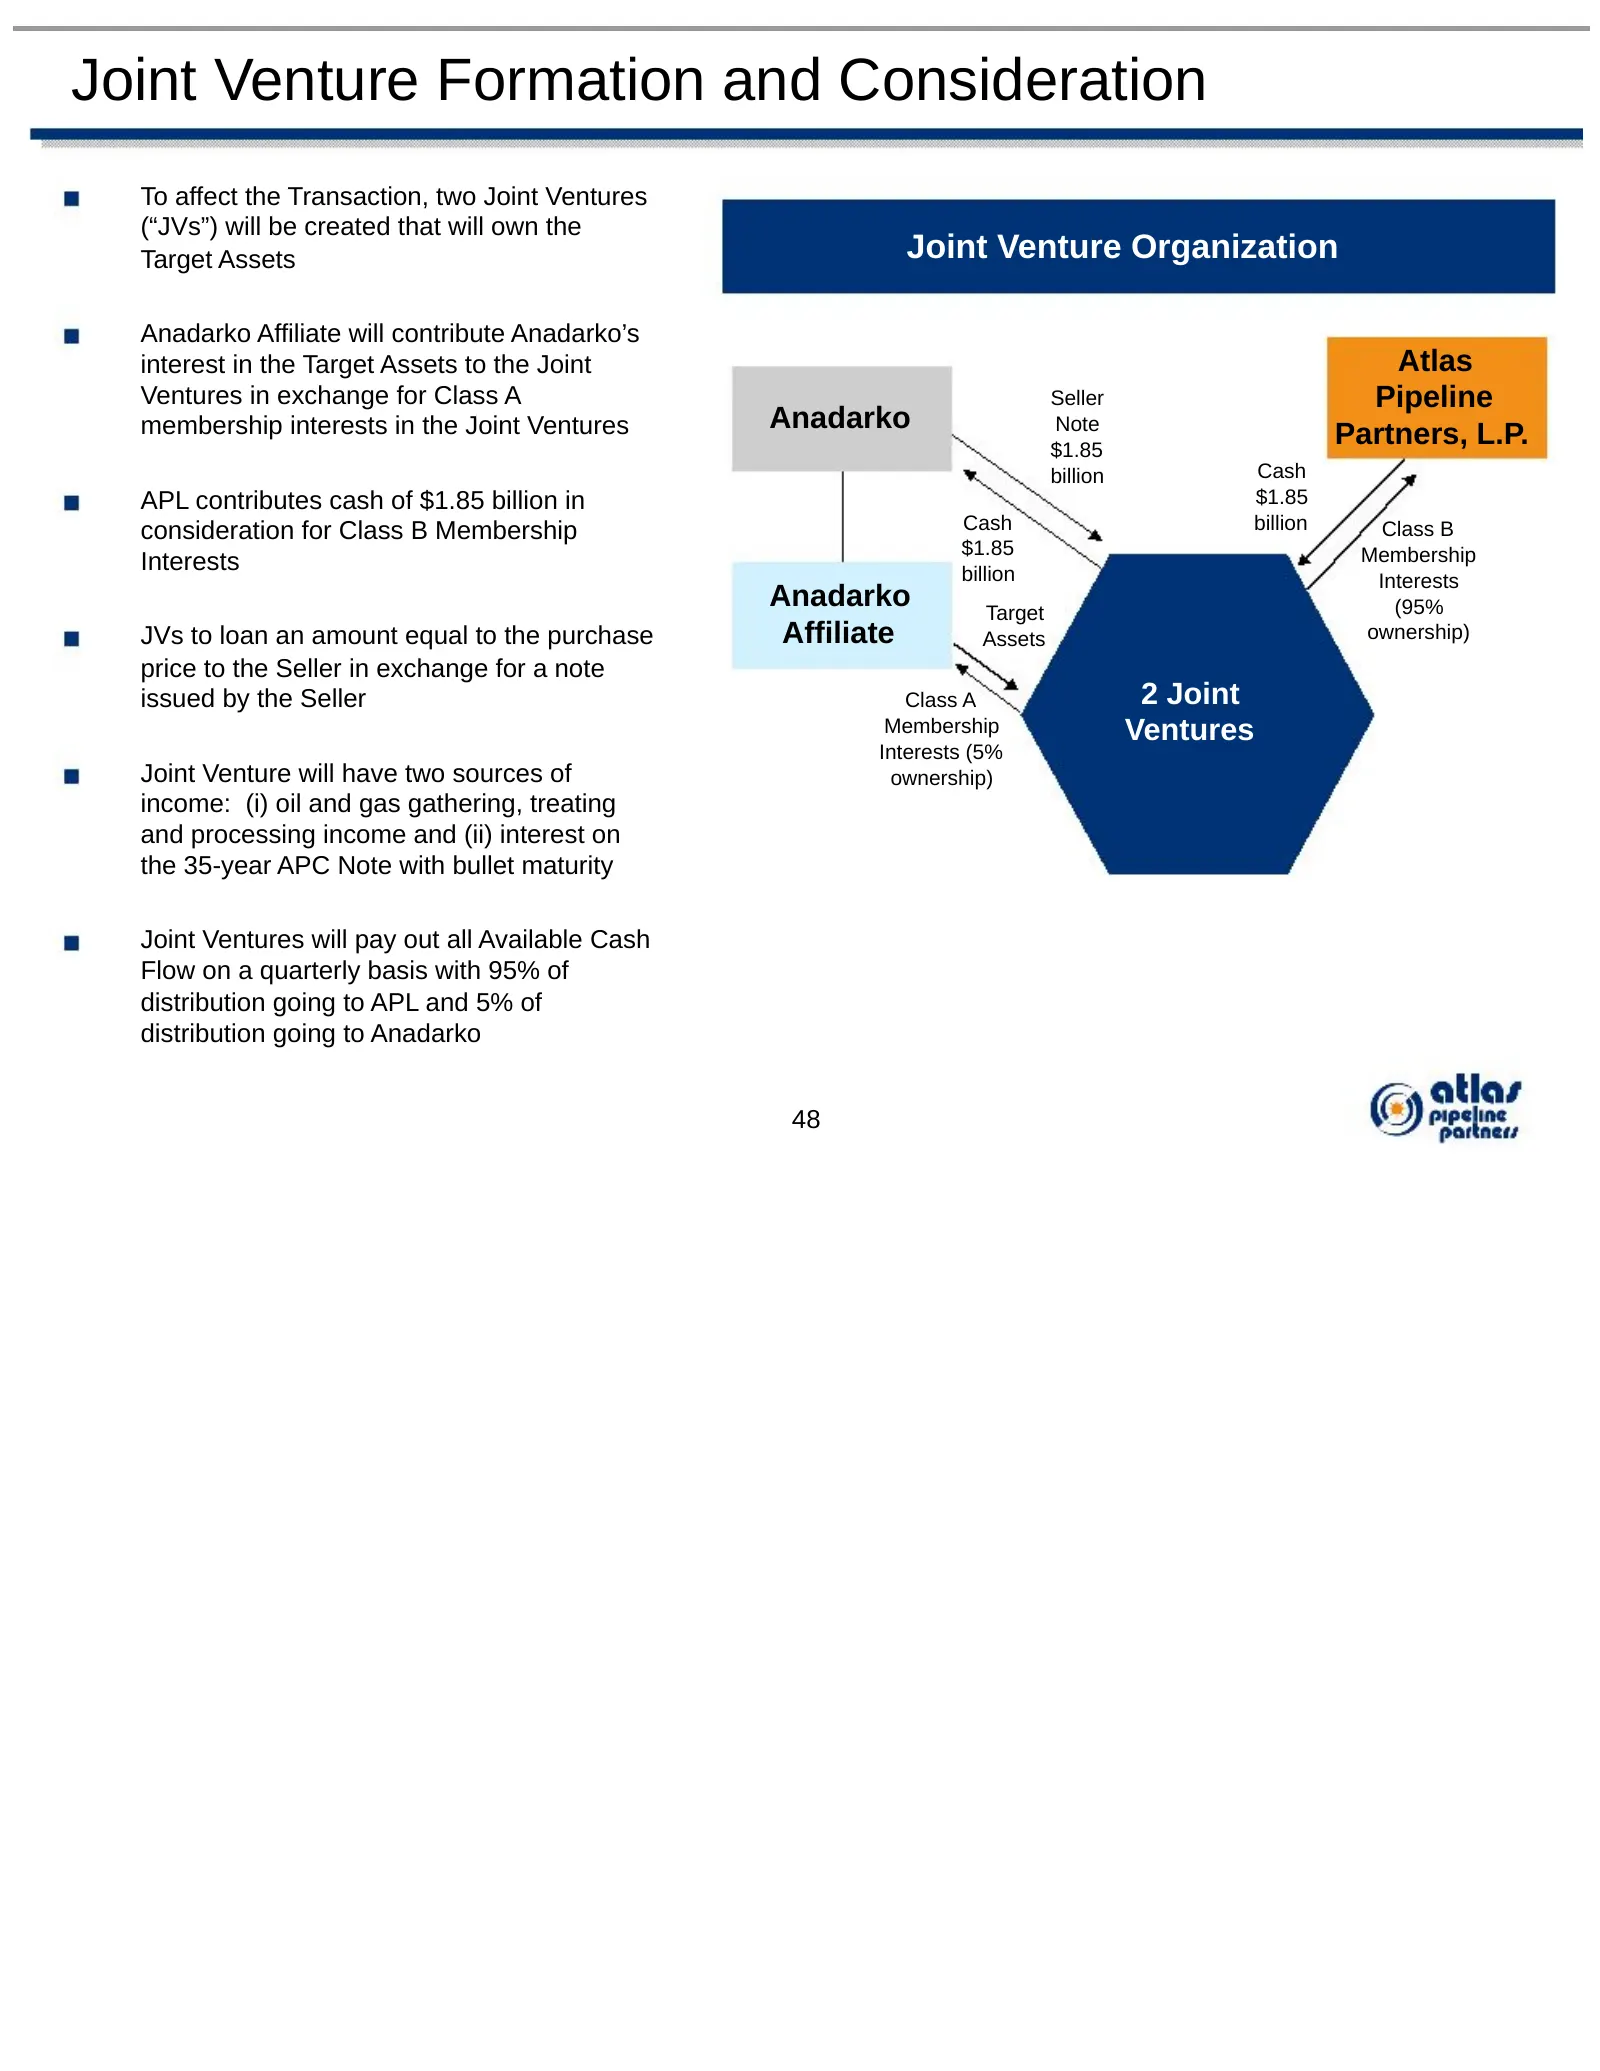
Joint Venture Formation and Consideration To affect the Transaction, two Joint Ventures (“JVs”) will be created that will own the Target Assets Joint Venture Organization Anadarko Affiliate will contribute Anadarko’s interest in the Target Assets to the Joint Atlas Ventures in exchange for Class A S
Source: SEC EDGAR · 8-K filed Jun 27, 2007