Saudi Telecom Co. · TADAWUL:7010
Saudi Telecom — Q1 2020 Earnings Presentation
17 slides from Saudi Telecom's earnings presentation, 2020
Slide 1: Financial Results Presentation Q1 2020
Financial Results Presentation Investor Relations Q1, 2020
Slide 2: Disclaimer
Disclaimer Financial Results Q1,2020 | stc group Saudi Telecom Company (stc) has prepared this presentation to the best of its abilities, however, no warranty or representation, express or implied is made as to the adequacy, correctness, completeness or accuracy of any numbers, statements, opinions,
Slide 3: Agenda
Financial Results Q1,2020 | stc group Agenda I. Strategy Overview II. KSA Telecom Market Overview III. Financial Highlights
Slide 4: I. Strategy Overview
I. Strategy Overview = sen ati . Sic
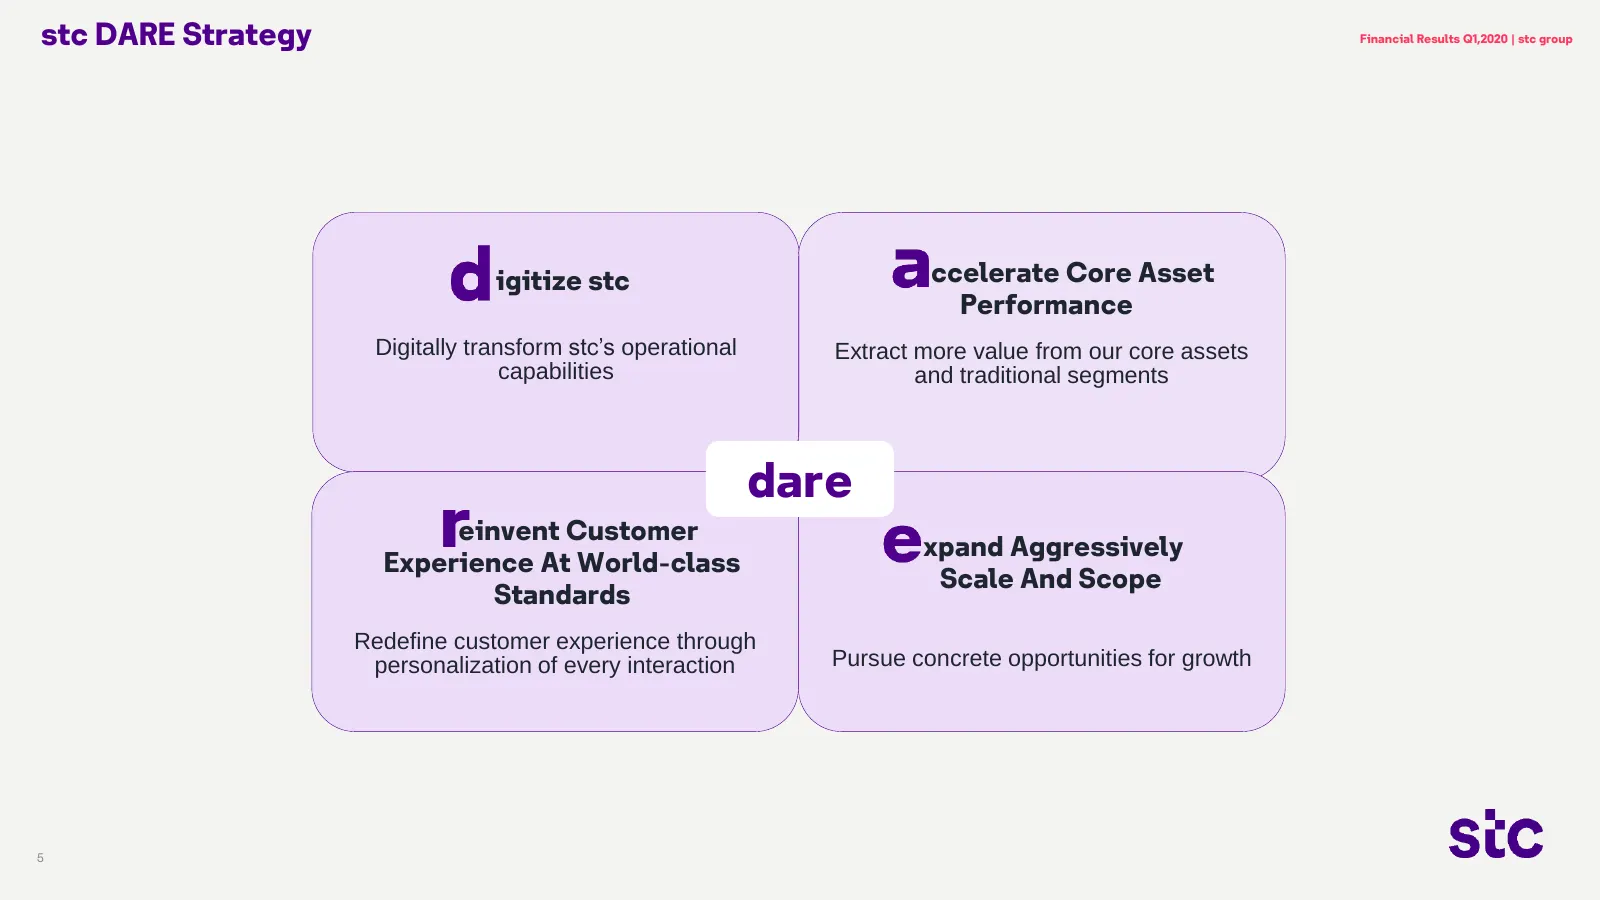
Slide 5: stc DARE Strategy
stc DARE Strategy Financial Results Q1,2020 | stc group igitize stc ccelerate Core Asset Performance Digitally transform stc’s operational Extract more value from our core assets capabilities and traditional segments dare einvent Customer xpand Aggressively Experience At World-class Scale And Scope
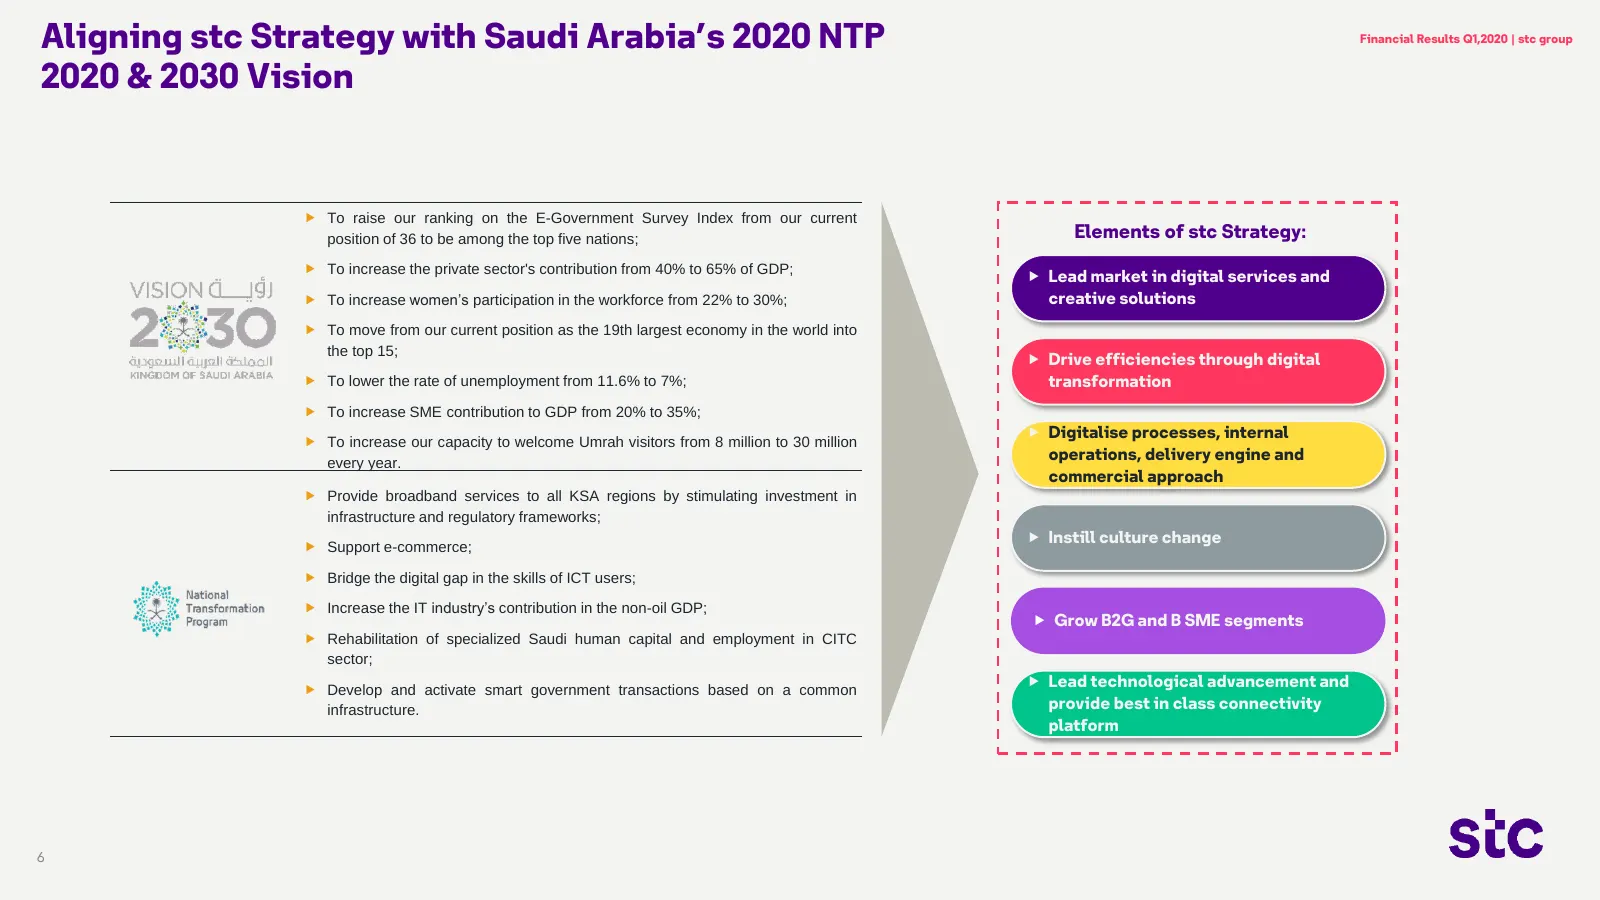
Slide 6: Aligning stc Strategy with Saudi Arabia's 2020 NTP & 2030 Vision
Aligning stc Strategy with Saudi Arabia’s 2020 NTP Financial Results Q1,2020 | stc group 2020 & 2030 Vision To raise our ranking on the E-Government Survey Index from our current position of 36 to be among the top five nations; Elements of stc Strategy: To increase the private sector's contribut
Slide 7: II. KSA Telecom Market Overview
II. KSA Telecom Market Overview
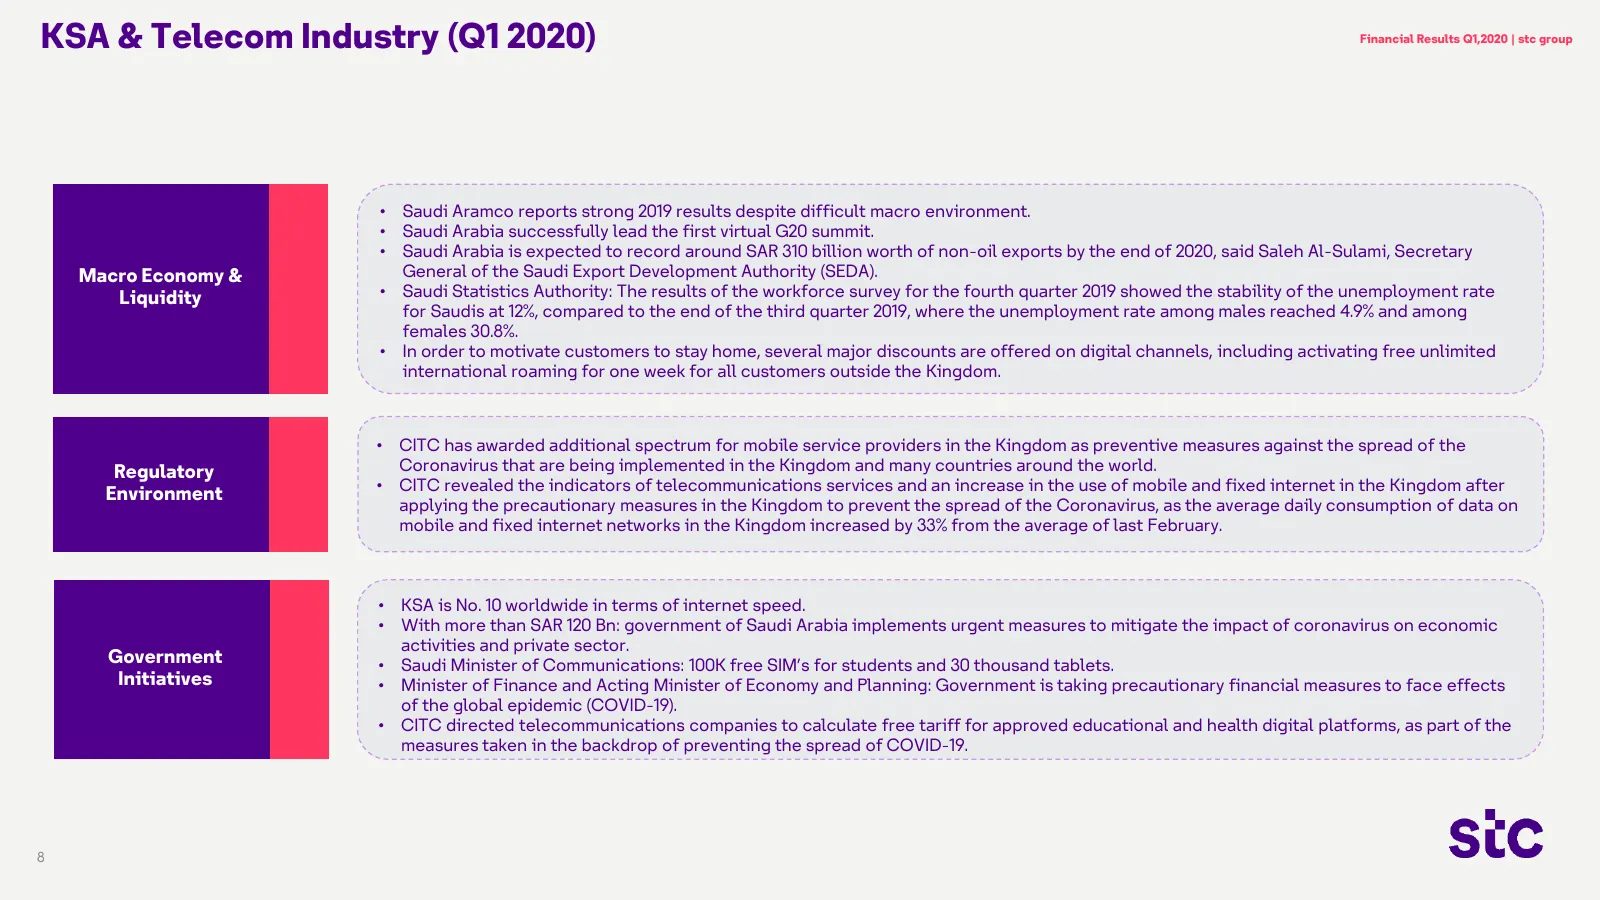
Slide 8: KSA & Telecom Industry (Q1 2020)
KSA & Telecom Industry (Q1 2020) Financial Results Q1,2020 | stc group • Saudi Aramco reports strong 2019 results despite difficult macro environment. • Saudi Arabia successfully lead the first virtual G20 summit. • Saudi Arabia is expected to record around SAR 310 billion worth of non-oil exports b
Slide 9: Business Highlights
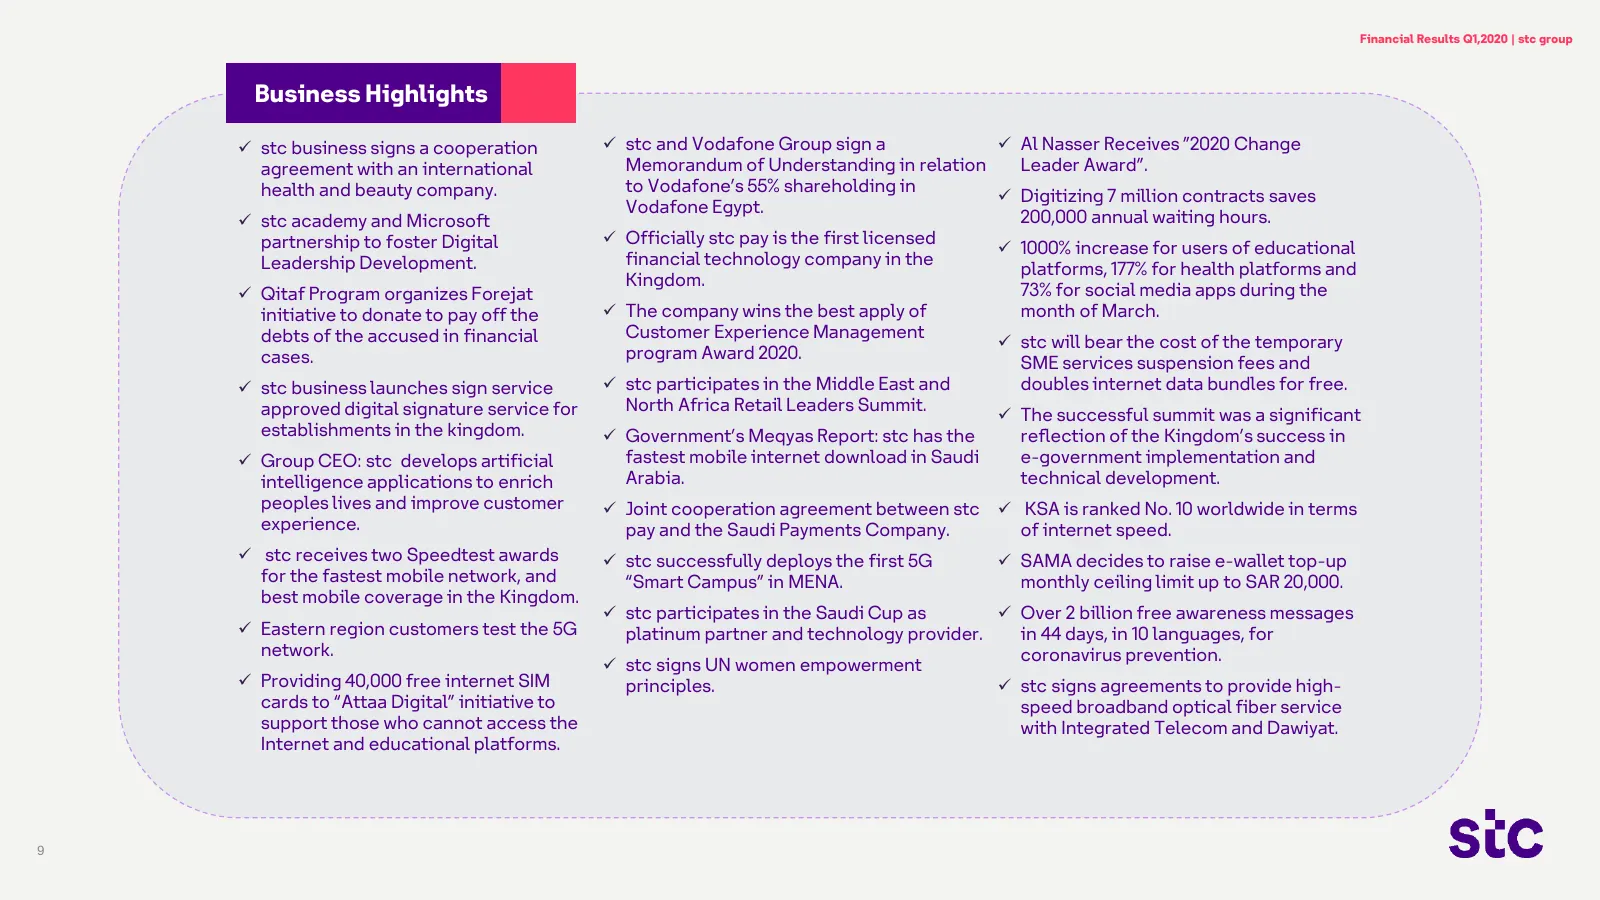
Financial Results Q1,2020 | stc group Business Highlights stc business signs a cooperation stc and Vodafone Group sign a Al Nasser Receives ”2020 Change agreement with an international Memorandum of Understanding in relation Leader Award”. health and beauty company. to Vodafone’s 55% sharehold
Slide 10: III. Financial Highlights
lll. Financial Highlights Sic
Slide 11: Q1 2020 Financial Highlights: Revenue
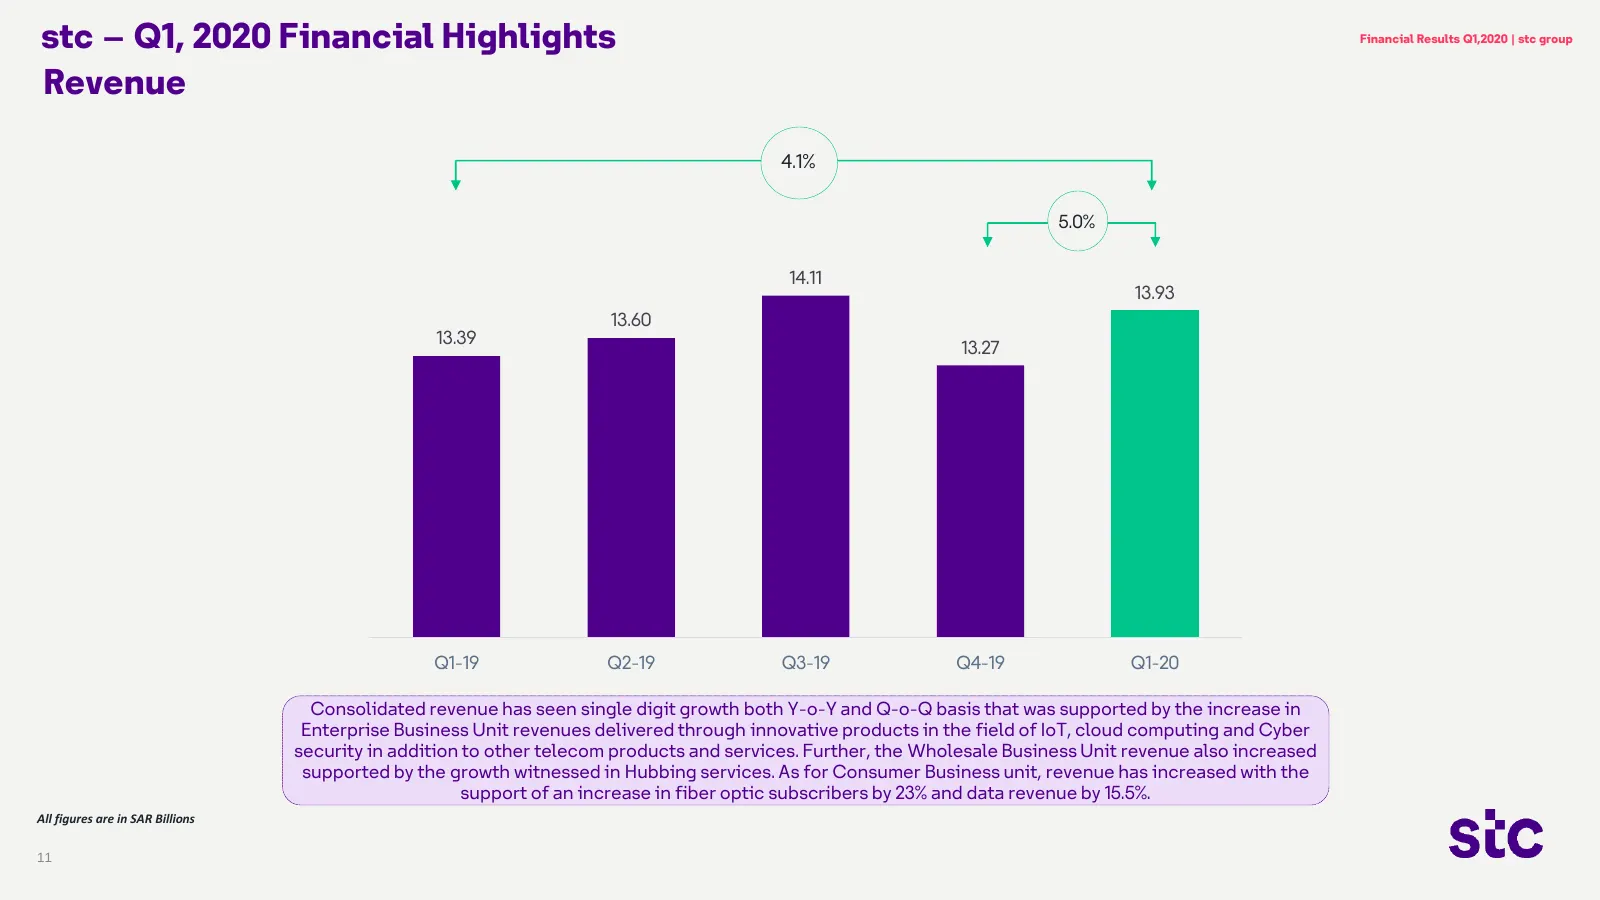
stc – Q1, 2020 Financial Highlights Financial Results Q1,2020 | stc group Revenue 4.1% 5.0% 14.11 13.93 13.60 13.39 13.27 Q1-19 Q2-19 Q3-19 Q4-19 Q1-20 Consolidated revenue has seen single digit growth both Y-o-Y and Q-o-Q basis that was supported by the increase in Enterprise Business Unit revenues
Slide 12: Q1 2020 Financial Highlights: Gross Profit
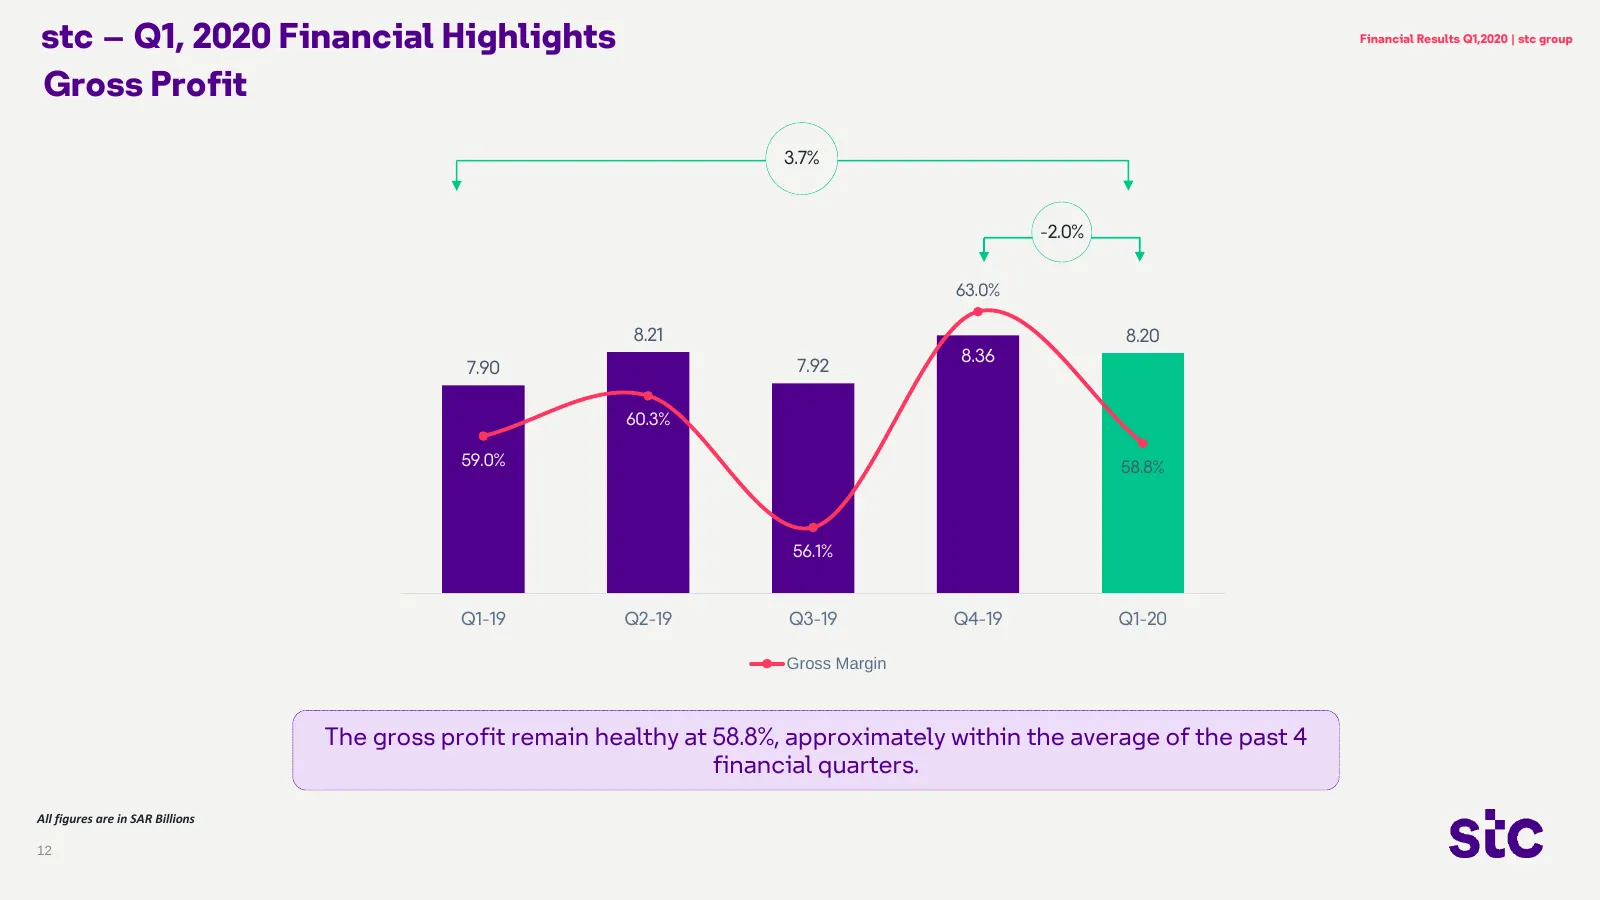
stc – Q1, 2020 Financial Highlights Financial Results Q1,2020 | stc group Gross Profit 10.0 3.7% 68.0% 66.0% -2.0% 64.0% 63.0% 8.21 8.20 62.0% 8.36 8.0 7.90 7.92 60.0% 60.3% 59.0% 58.8% 58.0% 56.0% 56.1% 6.0 54.0% Q1-19 Q2-19 Q3-19 Q4-19 Q1-20 Gross Margin The gross profit remain healthy at 58.8%, a
Slide 13: Q1 2020 Financial Highlights: Operating Profit (EBIT)
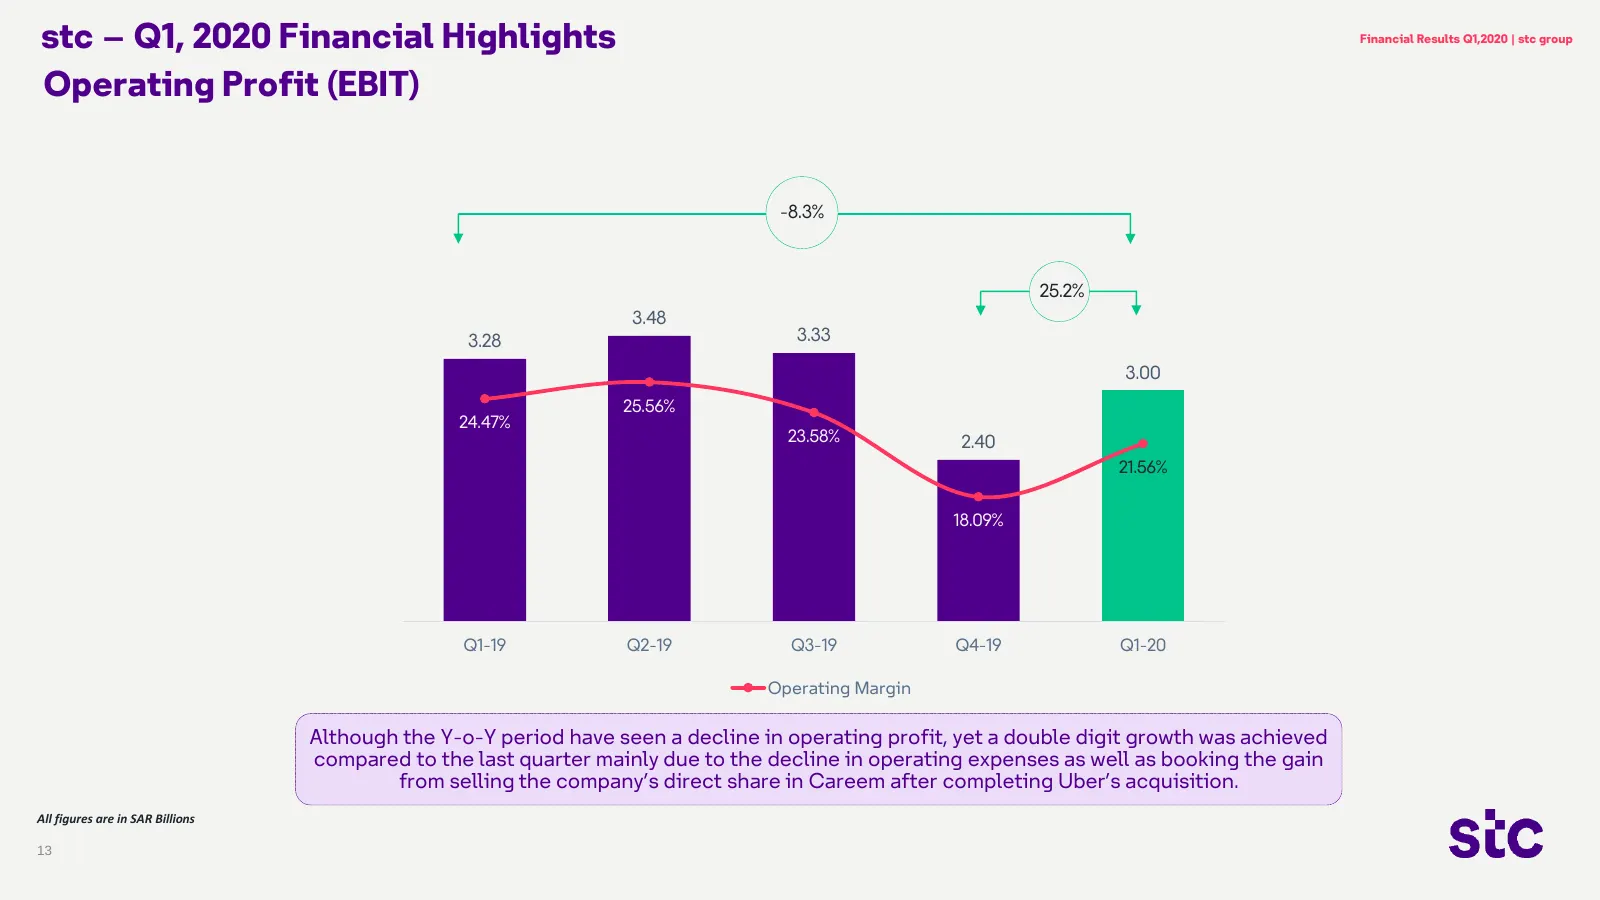
stc – Q1, 2020 Financial Highlights Financial Results Q1,2020 | stc group Operating Profit (EBIT) 5.00 40.00% 4.50 -8.3% 35.00% 4.00 25.2% 3.48 30.00% 3.50 3.28 3.33 3.00 3.00 25.00% 25.56% 24.47% 23.58% 2.40 2.50 21.56% 20.00% 2.00 18.09% 15.00% 1.50 1.00 10.00% Q1-19 Q2-19 Q3-19 Q4-19 Q1-20 Operat
Slide 14: Q1 2020 Financial Highlights: EBITDA
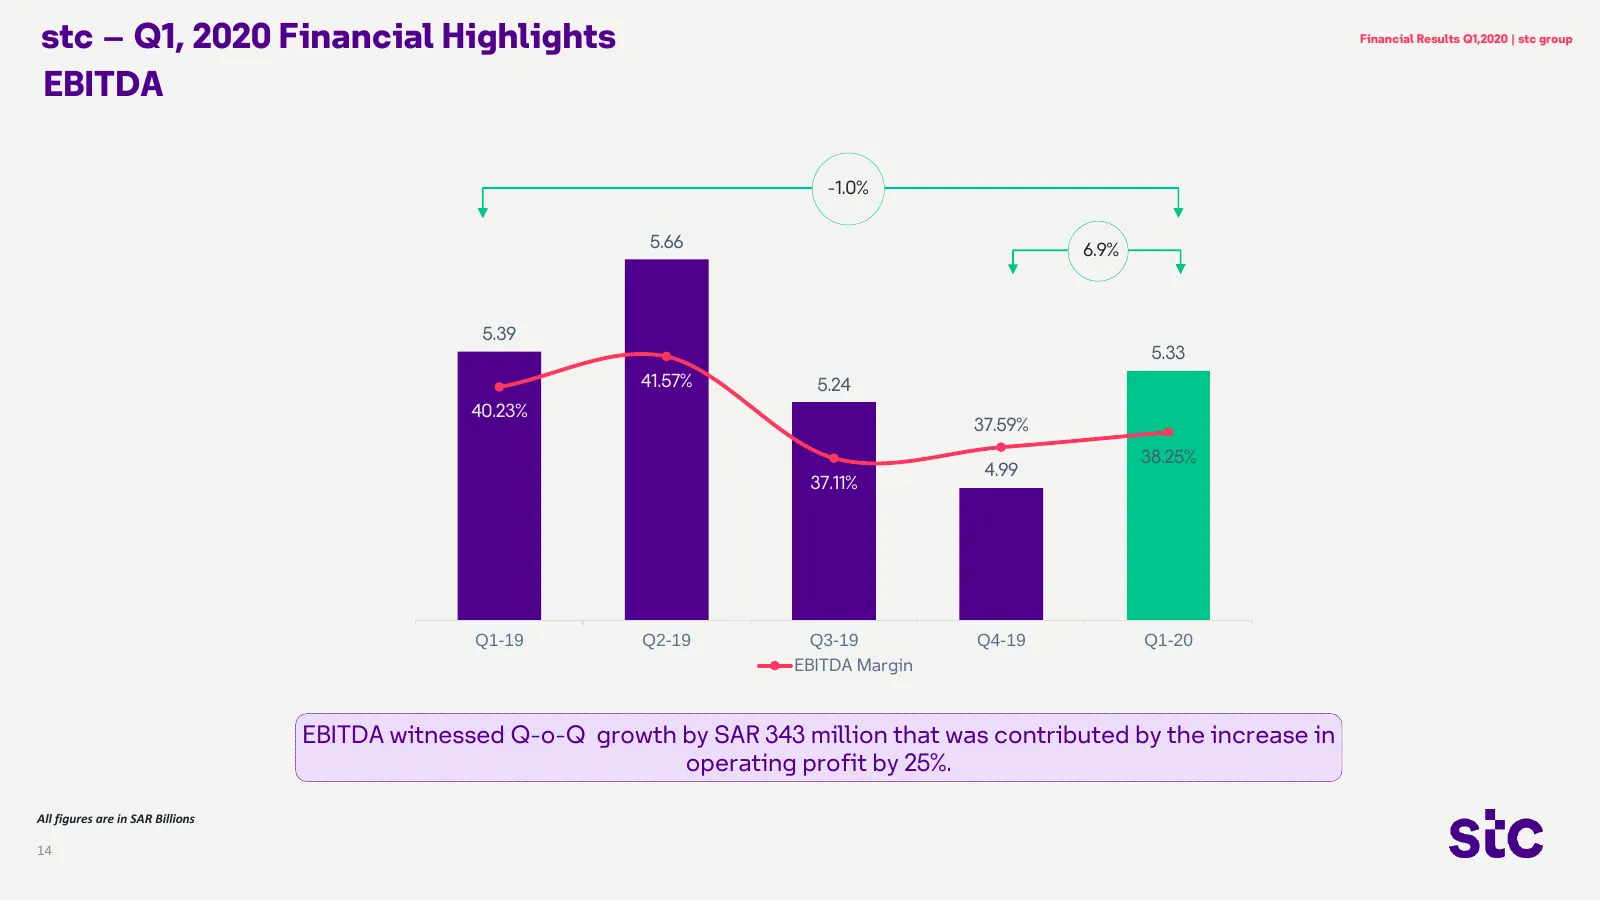
stc – Q1, 2020 Financial Highlights Financial Results Q1,2020 | stc group EBITDA -1.0% 5.80 48.00% 5.66 6.9% 46.00% 5.60 44.00% 5.39 5.33 5.40 42.00% 41.57% 5.24 40.00% 5.20 40.23% 37.59% 38.00% 38.25% 4.99 5.00 37.11% 36.00% 34.00% 4.80 32.00% 4.60 30.00% Q1-19 Q2-19 Q3-19 Q4-19 Q1-20 EBITDA Margin
Slide 15: Q1 2020 Financial Highlights: Net Profit
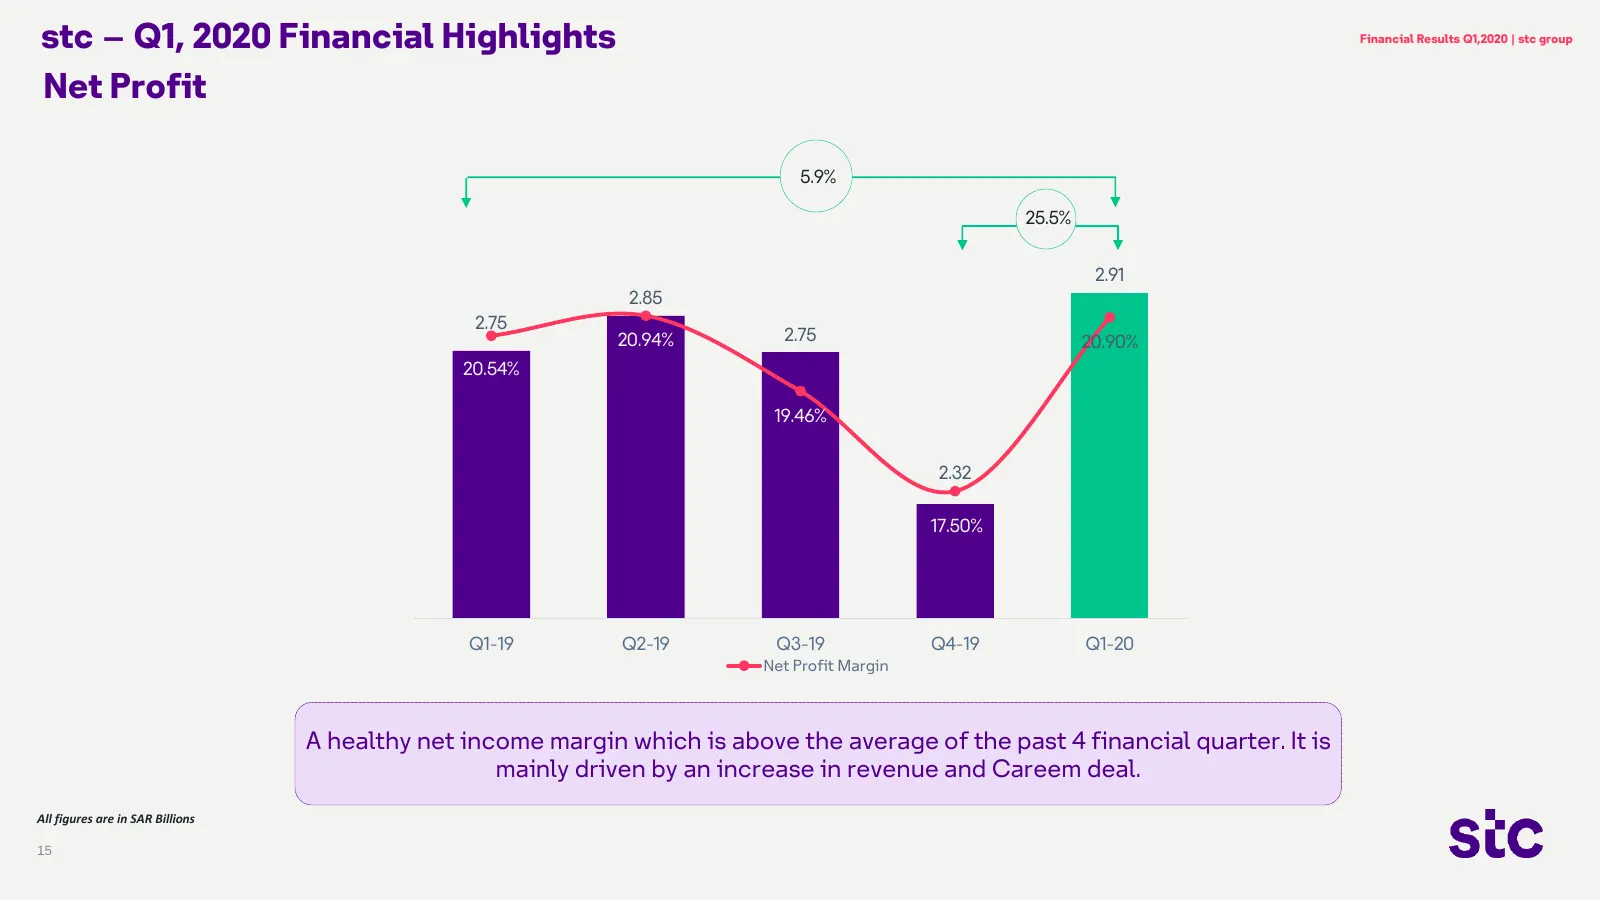
stc – Q1, 2020 Financial Highlights Financial Results Q1,2020 | stc group Net Profit 5.9% 25.5% 3 2.91 22% 2.85 21% 2.75 3 20.94% 2.75 20.90% 20.54% 20% 3 19.46% 19% 2 2.32 18% 17.50% 17% 2 16% 2 15% Q1-19 Q2-19 Q3-19 Q4-19 Q1-20 Net Profit Margin A healthy net income margin which is above the avera
Slide 16: Q1 2020 Financial Highlights: Dividends and Price vs. Yield
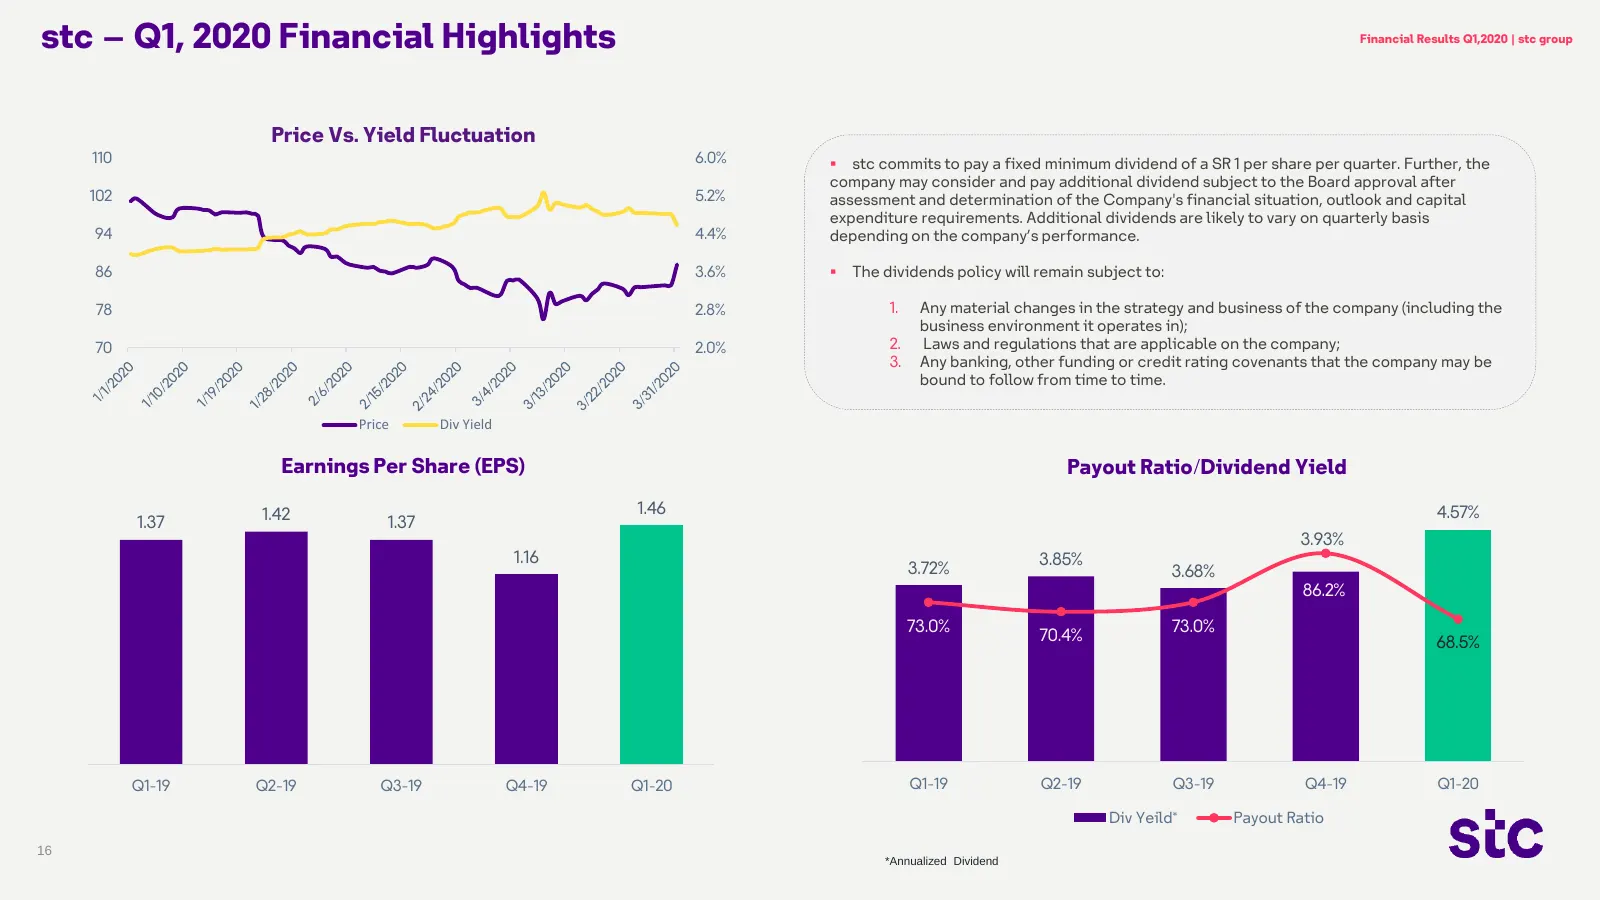
stc – Q1, 2020 Financial Highlights Financial Results Q1,2020 | stc group Price Vs. Yield Fluctuation 110 6.0% stc commits to pay a fixed minimum dividend of a SR 1 per share per quarter. Further, the company may consider and pay additional dividend subject to the Board approval after 102 5.2% ass

Slide 17: Thank You
=] \°) > = c ui) <= _ Stc
Source: company website