Saudi Telecom Co. · TADAWUL:7010
Saudi Telecom — stc group — 9M 2026 Earnings Presentation
24 slides from Saudi Telecom's earnings presentation, November 2026
Slide 1: Financial Results Presentation 9M 2026
Financial Results Presentation 9M 2026 Investor Relations 2026
Slide 2: Table of Contents
Table of 1. 9M 2026 Overview Contents 2. Operational & Strategic Review 3. Financial Performance Investor Relations 2026
Slide 3: 9M 2026 Overview
9M 2026 Overview Investor Relations 2026 3
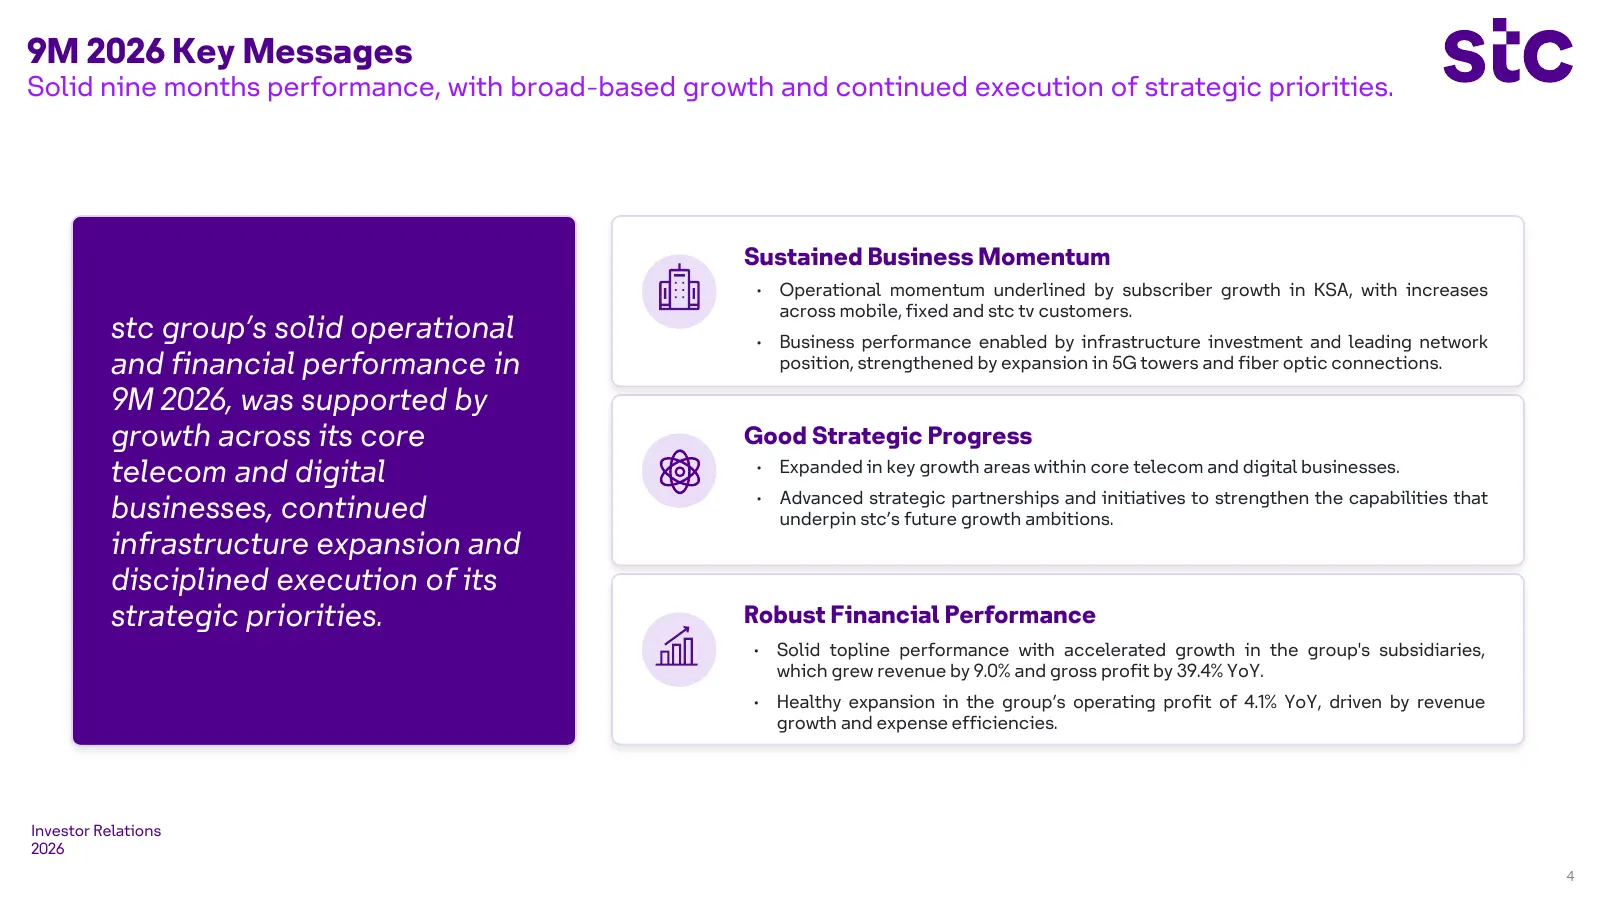
Slide 4: 9M 2026 Key Messages
9M 2026 Key Messages Solid nine months performance, with broad-based growth and continued execution of strategic priorities. Sustained Business Momentum • Operational momentum underlined by subscriber growth in KSA, with increases across mobile, fixed and stc tv customers. stc group’s solid operatio
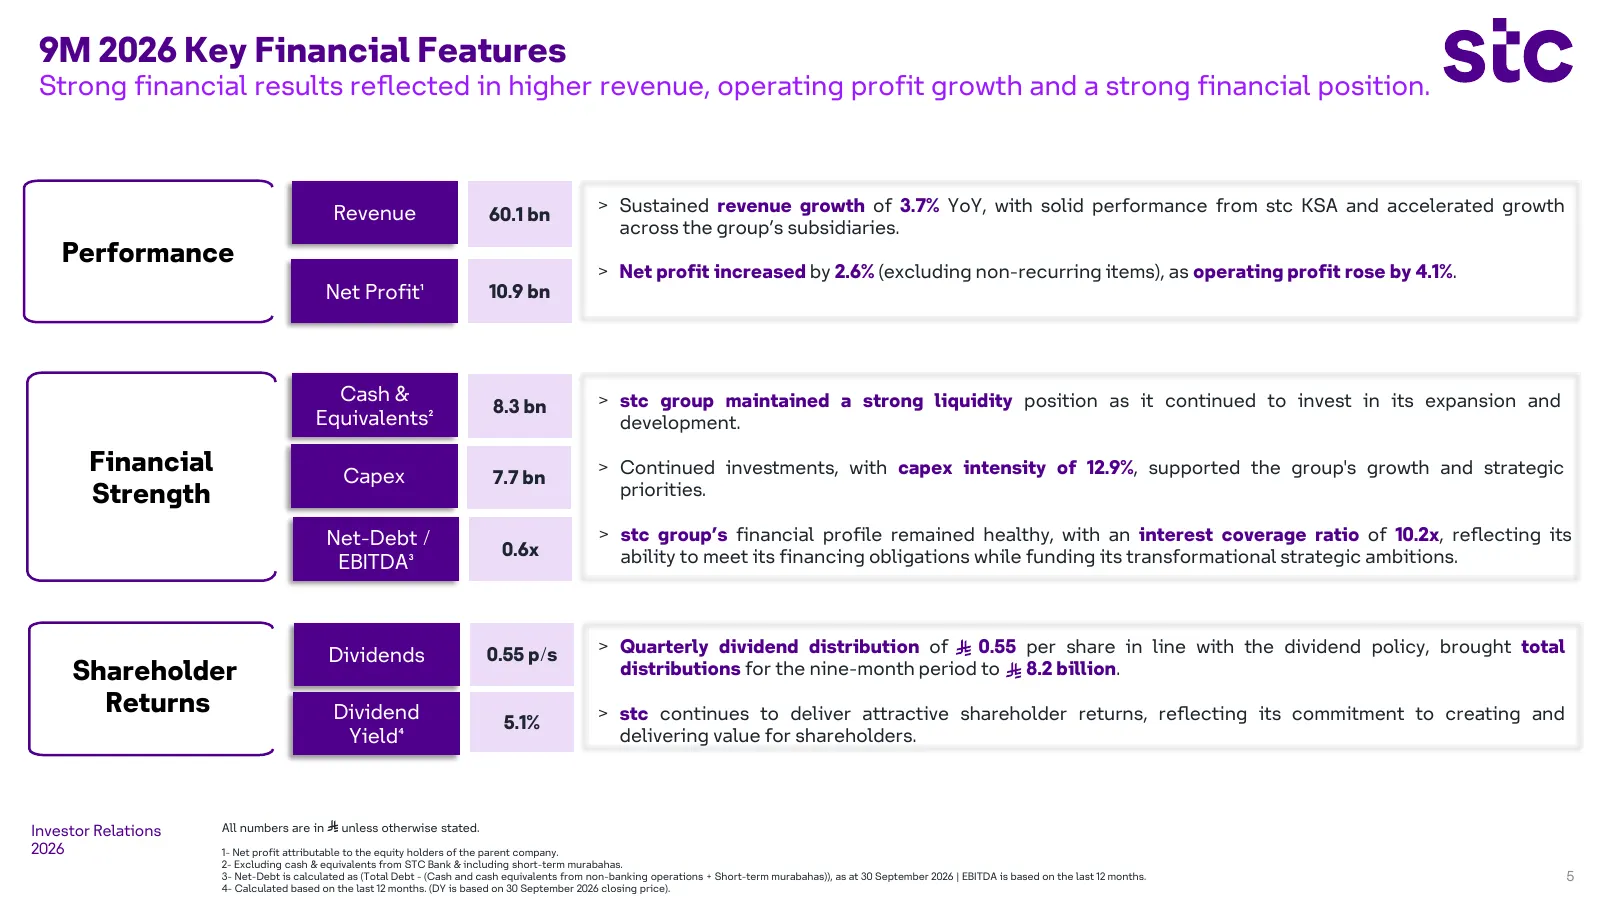
Slide 5: 9M 2026 Key Financial Features
9M 2026 Key Financial Features Strong financial results reflected in higher revenue, operating profit growth and a strong financial position. Revenue 60.1 bn > Sustained revenue growth of 3.7% YoY, with solid performance from stc KSA and accelerated growth across the group’s subsidiaries. Performanc
Slide 6: Operational & Strategic Review
Operational & Strategic Review Investor Relations 2026 6
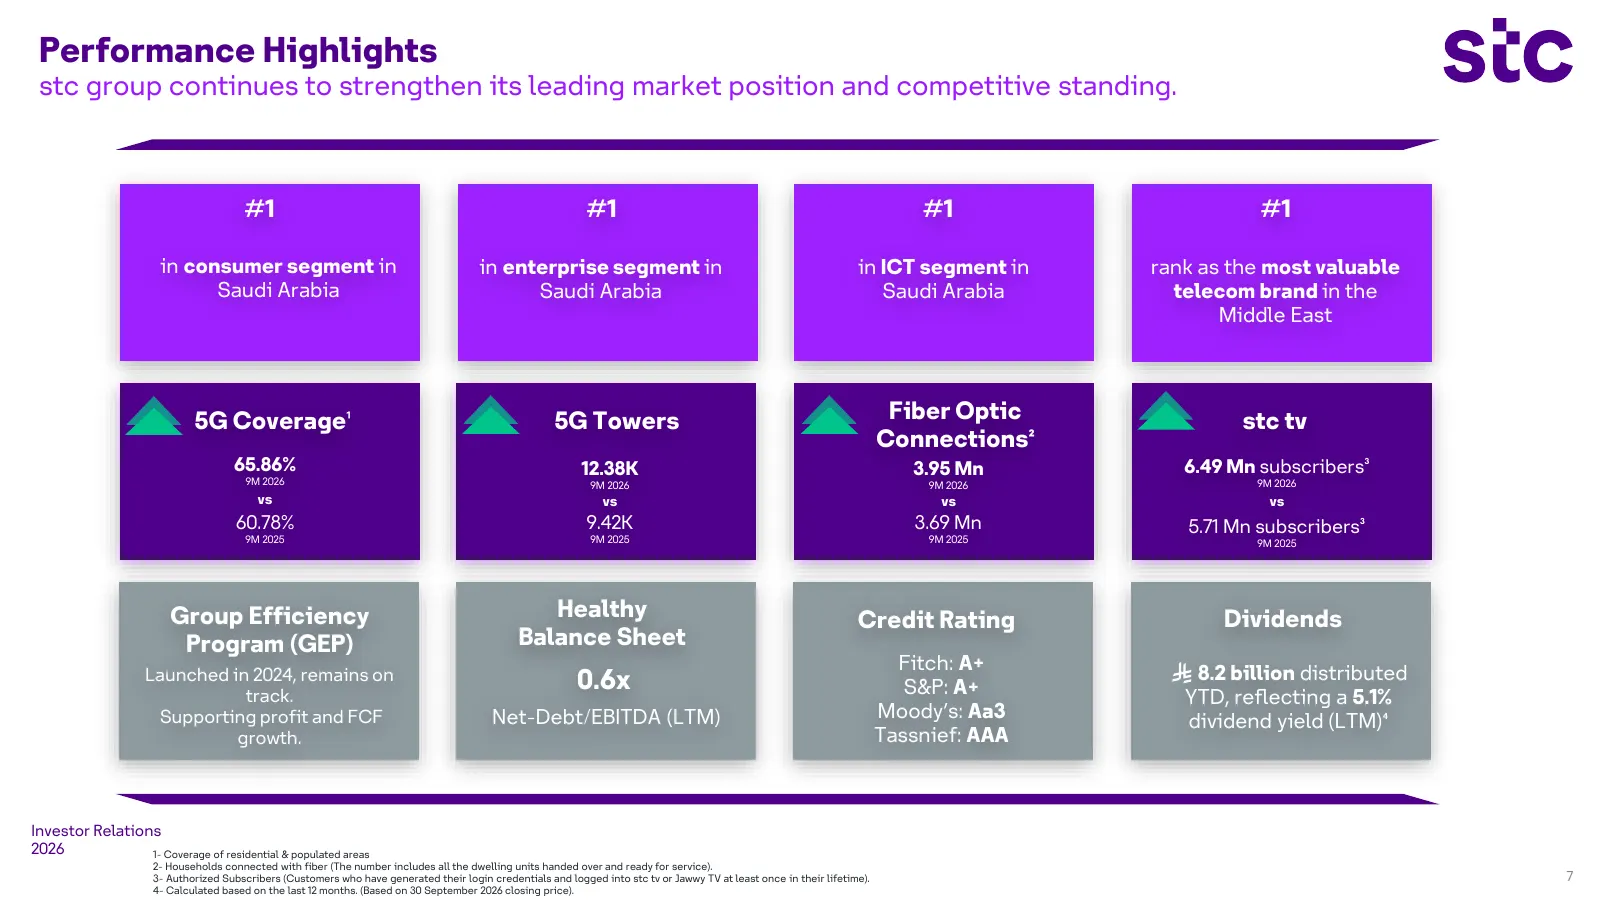
Slide 7: Performance Highlights
Performance Highlights stc group continues to strengthen its leading market position and competitive standing. #1 #1 #1 #1 in consumer segment in in enterprise segment in in ICT segment in rank as the most valuable Saudi Arabia Saudi Arabia Saudi Arabia telecom brand in the Middle East 5G Coverage¹
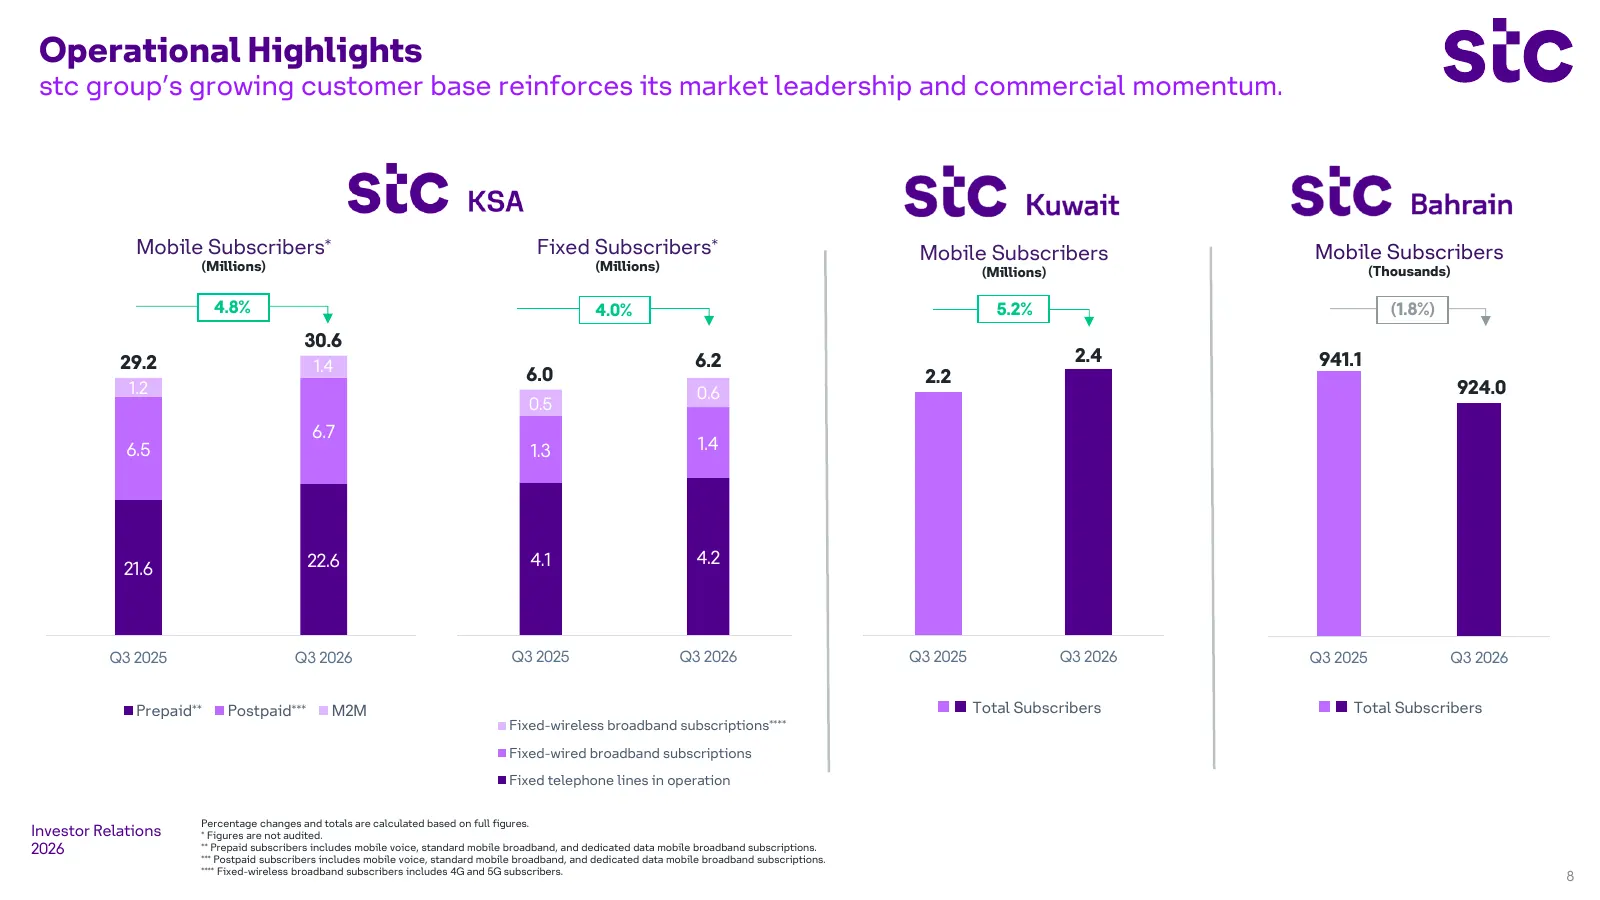
Slide 8: Operational Highlights
Operational Highlights stc group’s growing customer base reinforces its market leadership and commercial momentum. Mobile Subscribers* Fixed Subscribers* Mobile Subscribers Mobile Subscribers (Millions) (Millions) (Millions) (Thousands) 4.8% 4.0% 5.2% (1.8%) 30.6 7.0 29.2 6.2 2.4 941.1 1.4 6.0 2.2 1
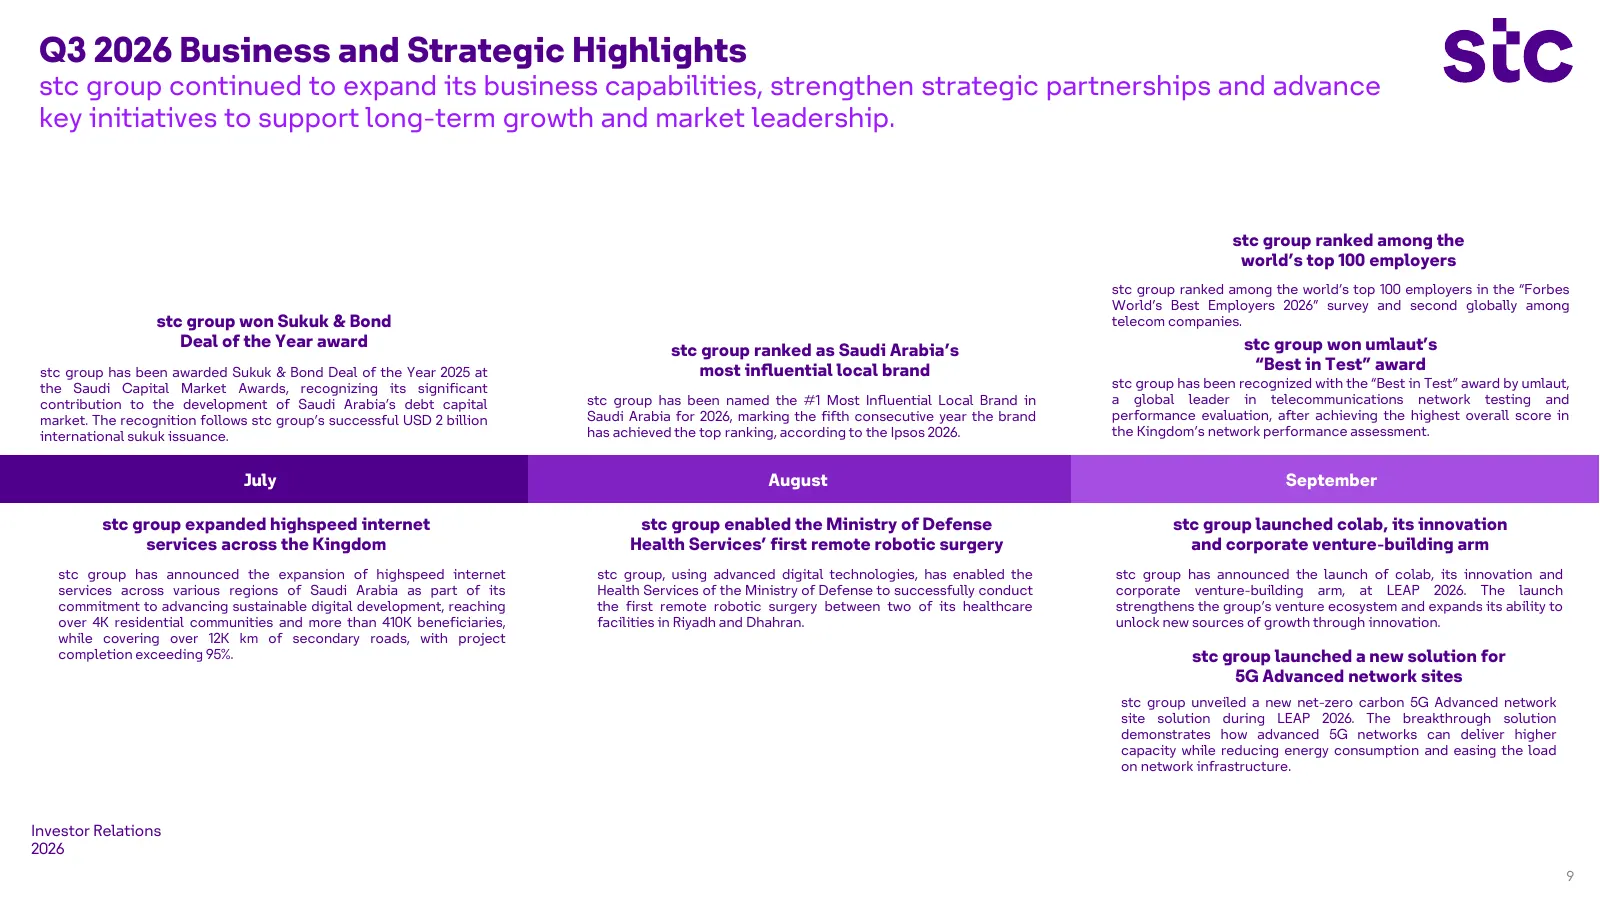
Slide 9: Q3 2026 Business and Strategic Highlights
Q3 2026 Business and Strategic Highlights stc group continued to expand its business capabilities, strengthen strategic partnerships and advance key initiatives to support long-term growth and market leadership. stc group ranked among the world’s top 100 employers stc group ranked among the world’s
Slide 10: Financial Performance
Financial Performance 9M 2026 Investor Relations 2026 10
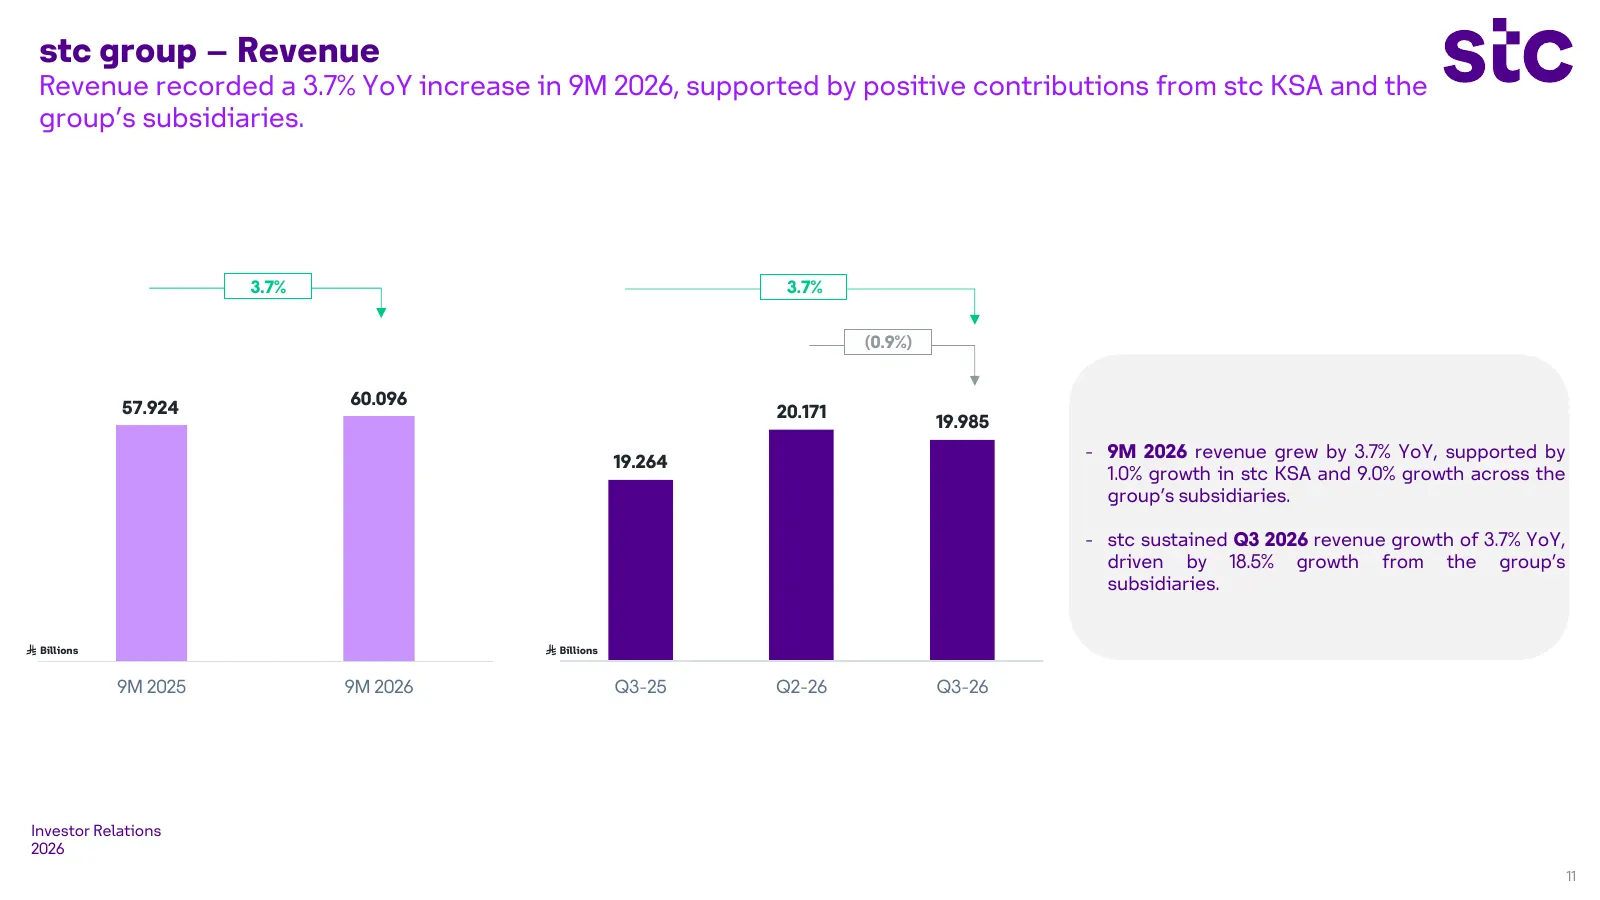
Slide 11: stc group – Revenue
stc group – Revenue Revenue recorded a 3.7% YoY increase in 9M 2026, supported by positive contributions from stc KSA and the group’s subsidiaries. 3.7% 3.7% (0.9%) 60.096 57.924 20.171 19.985 - 9M 2026 revenue grew by 3.7% YoY, supported by 19.264 1.0% growth in stc KSA and 9.0% growth across the g
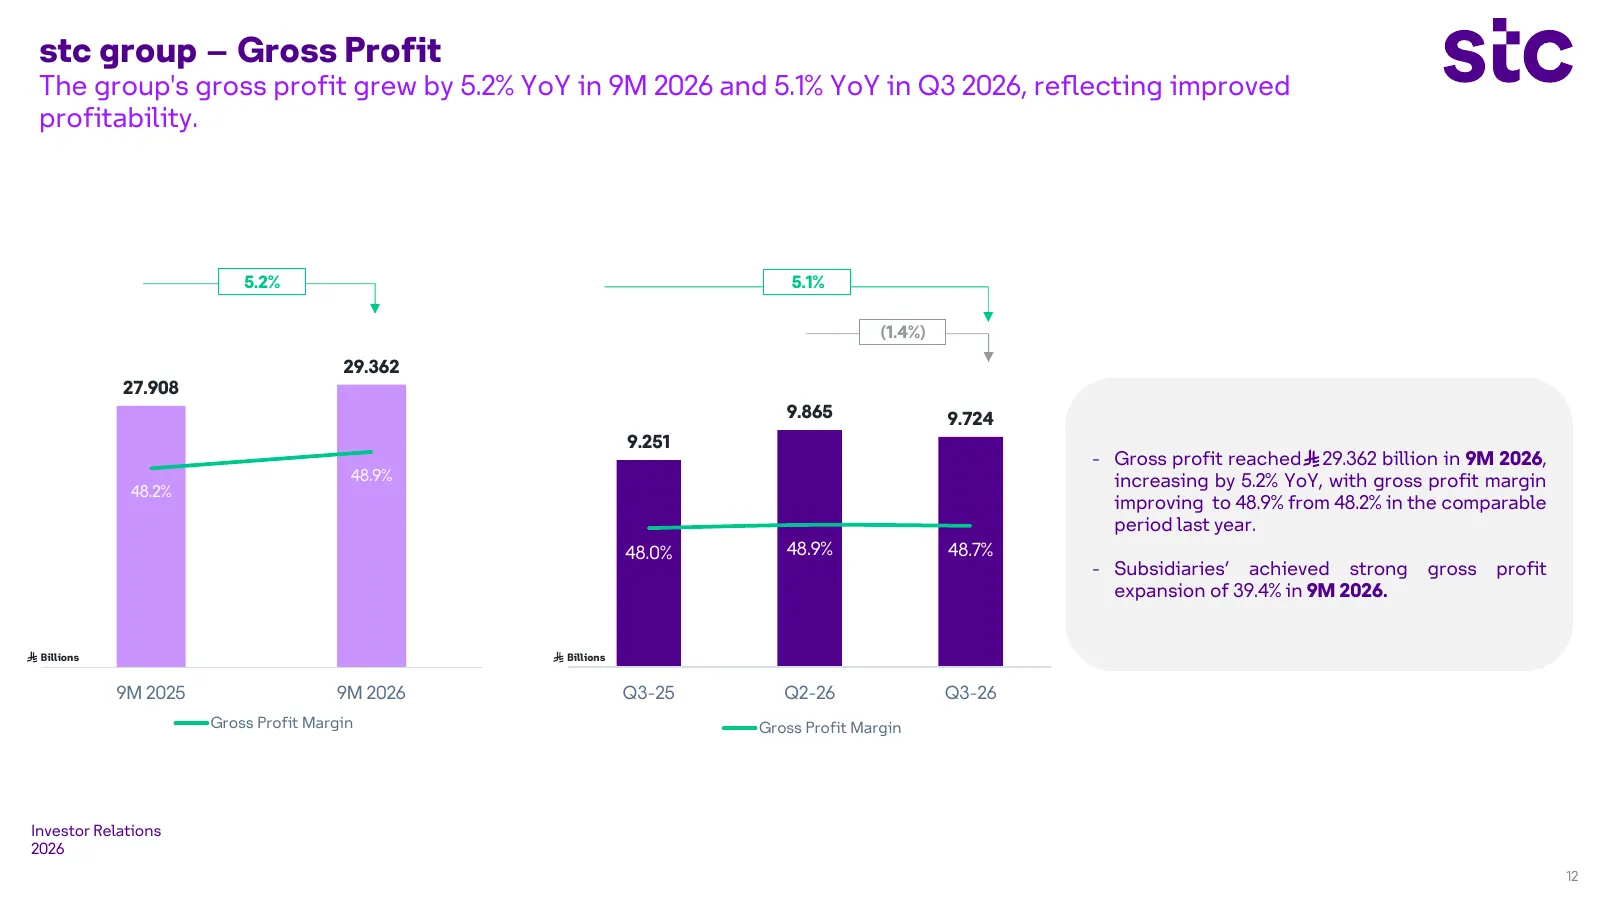
Slide 12: stc group – Gross Profit
stc group – Gross Profit The group's gross profit grew by 5.2% YoY in 9M 2026 and 5.1% YoY in Q3 2026, reflecting improved profitability. 5.2% 5.1% (1.4%) 29.362 27.908 9.865 9.724 9.251 - Gross profit reached 29.362 billion in 9M 2026, 48.9% increasing by 5.2% YoY, with gross profit margin 48.2% im
Slide 13: Revenue Breakdown for stc KSA
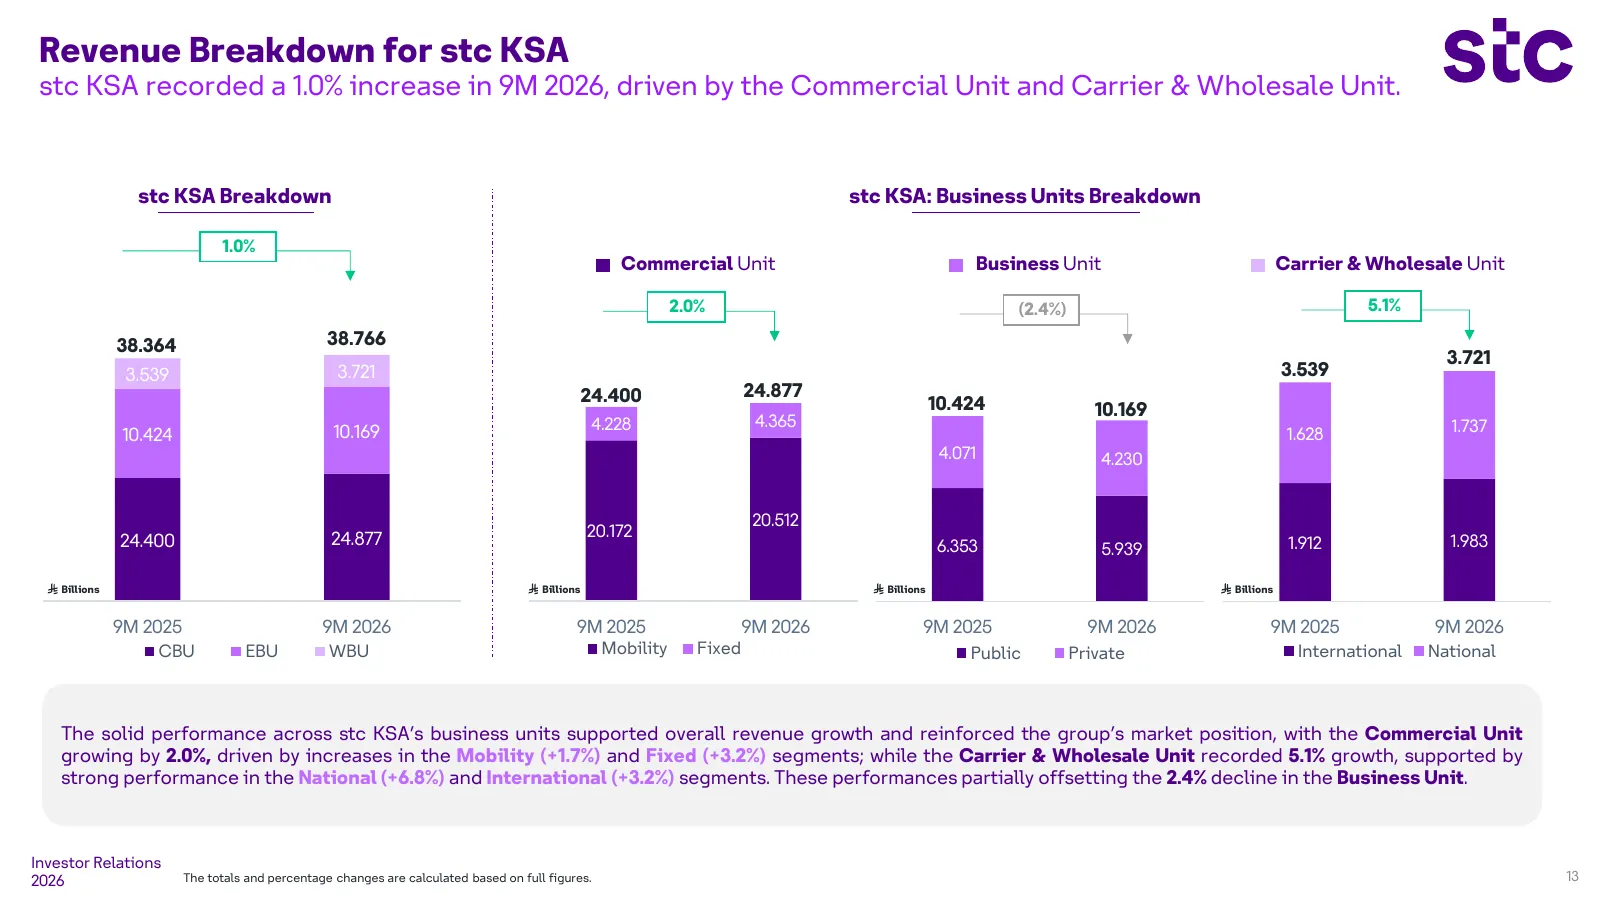
Revenue Breakdown for stc KSA stc KSA recorded a 1.0% increase in 9M 2026, driven by the Commercial Unit and Carrier & Wholesale Unit. stc KSA Breakdown stc KSA: Business Units Breakdown 1.0% Commercial Unit Business Unit Carrier & Wholesale Unit 45.0 2.0% (2.4%) 5.1% 40.0 38.364 38.766 30.0 3.721 3
Slide 14: Revenue Breakdown by Subsidiaries
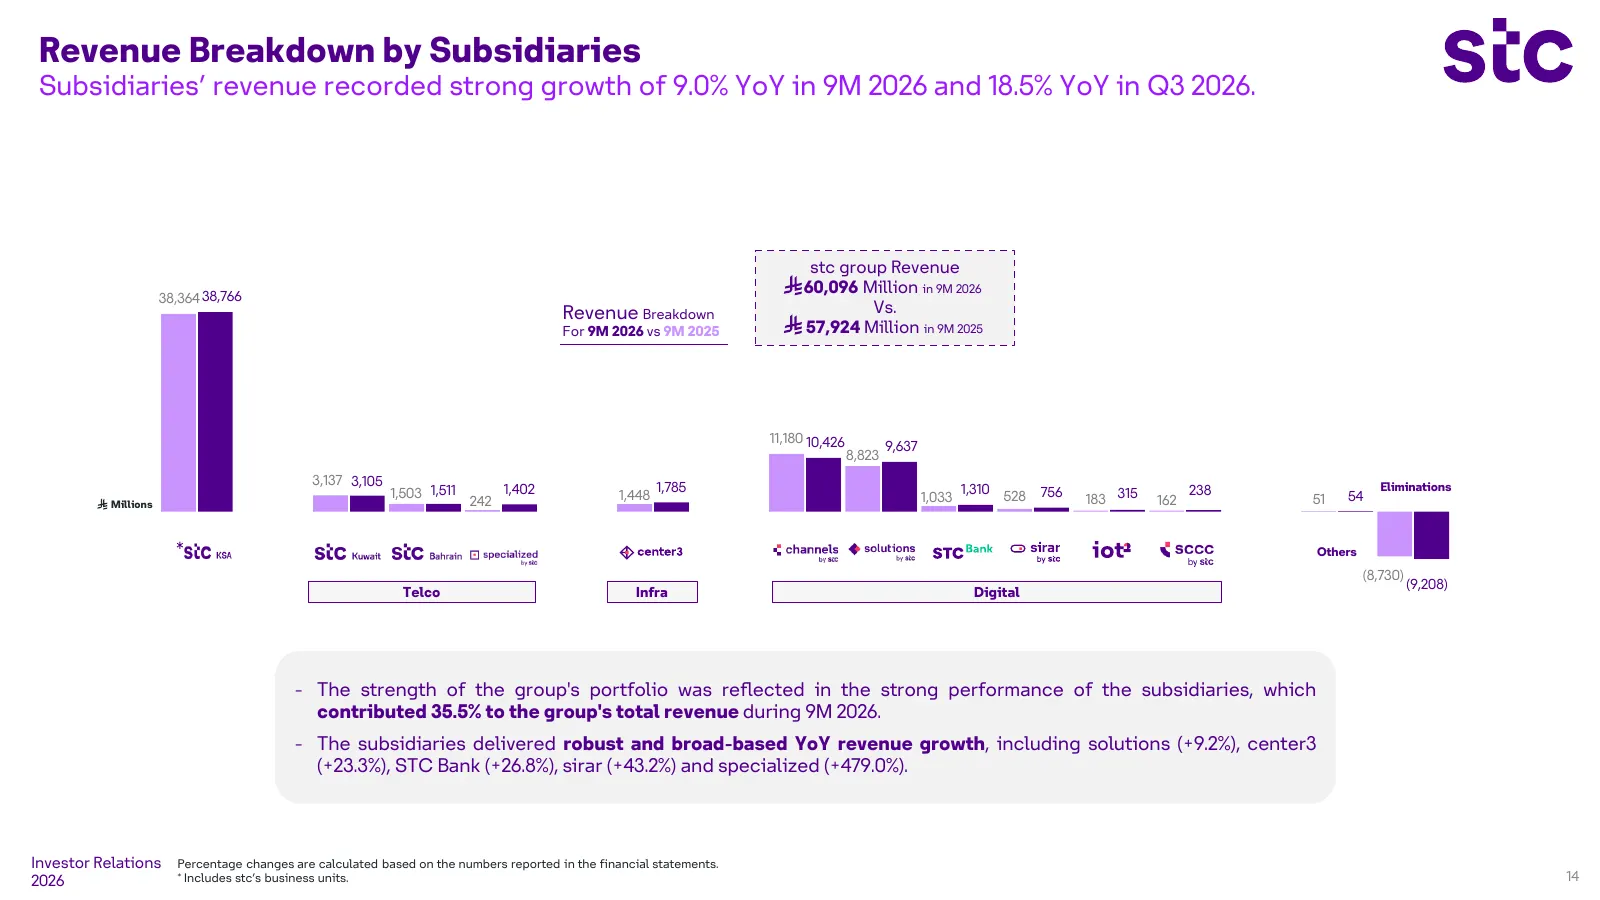
Revenue Breakdown by Subsidiaries Subsidiaries’ revenue recorded strong growth of 9.0% YoY in 9M 2026 and 18.5% YoY in Q3 2026. stc group Revenue 60,096 Million in 9M 2026 38,364 38,766 Revenue Breakdown Vs. For 9M 2026 vs 9M 2025 57,924 Million in 9M 2025 11,180 10,426 9,637 8,823 3,137 3,105 1,503
Slide 15: Gross Profit Breakdown by Subsidiaries
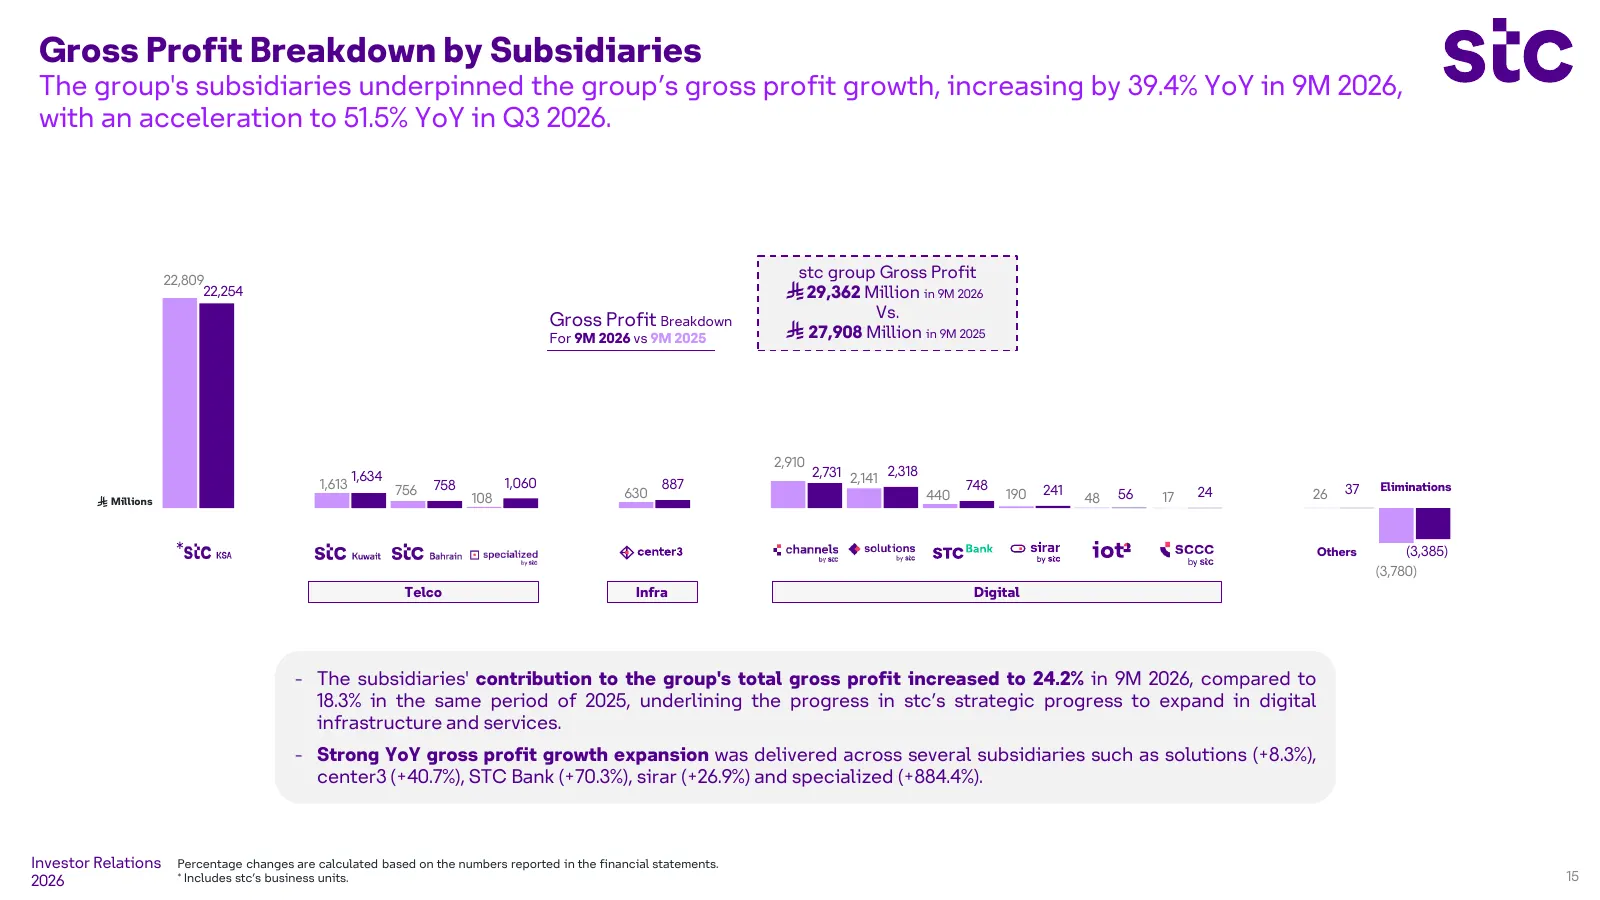
Gross Profit Breakdown by Subsidiaries The group's subsidiaries underpinned the group’s gross profit growth, increasing by 39.4% YoY in 9M 2026, with an acceleration to 51.5% YoY in Q3 2026. 22,809 stc group Gross Profit 22,254 29,362 Million in 9M 2026 Gross Profit Breakdown Vs. For 9M 2026 vs 9M 2
Slide 16: stc group – EBITDA
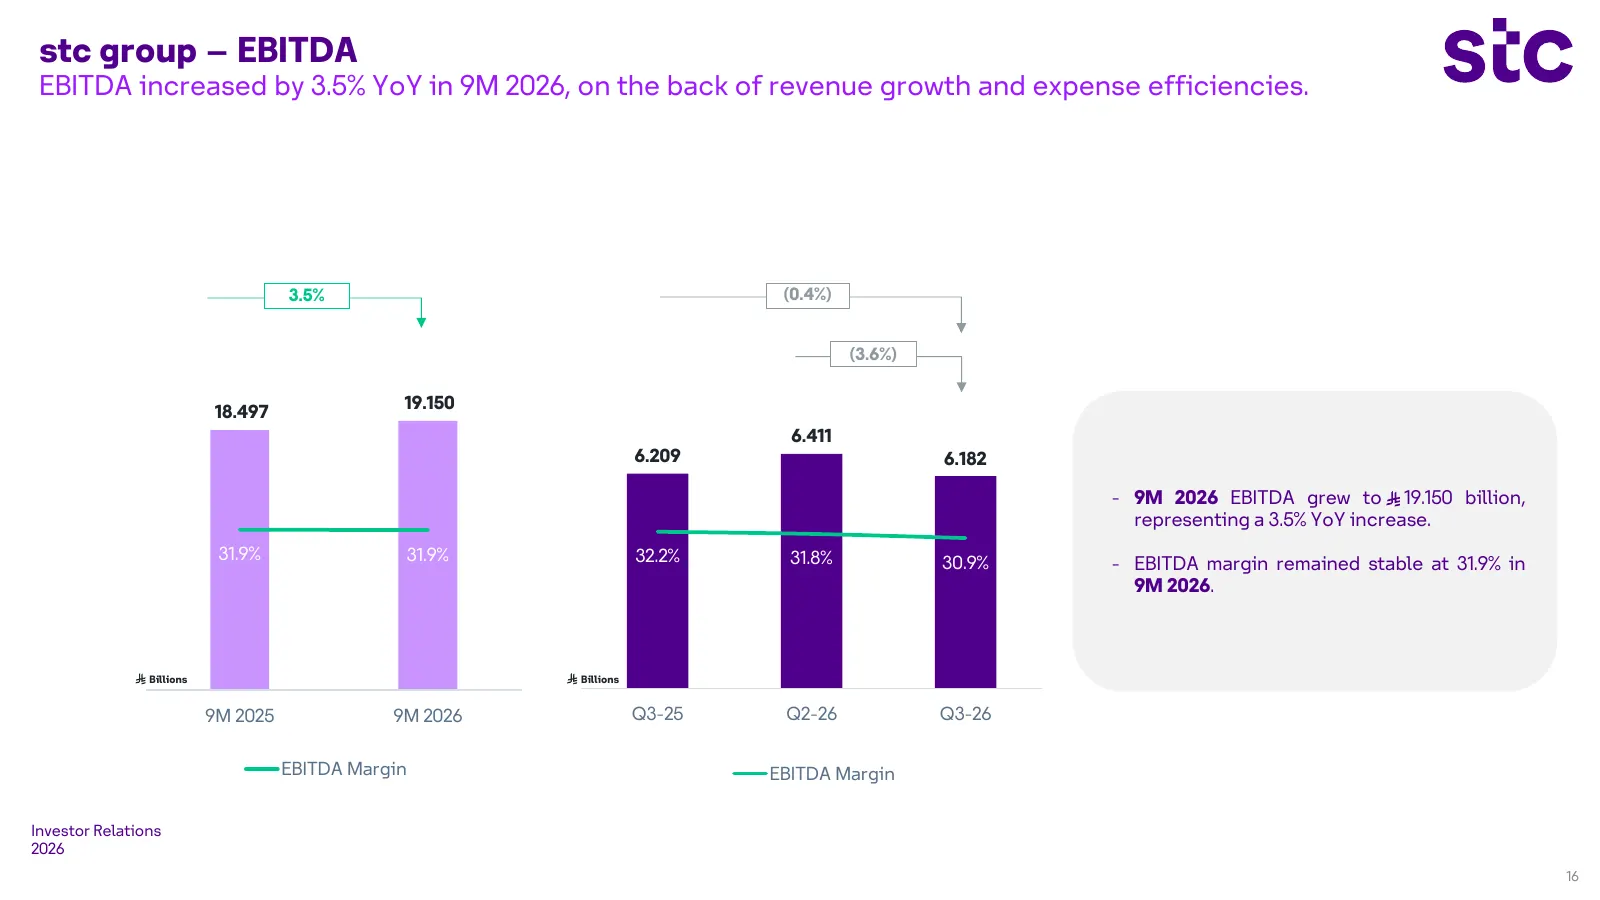
stc group – EBITDA EBITDA increased by 3.5% YoY in 9M 2026, on the back of revenue growth and expense efficiencies. 3.5% (0.4%) (3.6%) 19.150 18.497 6.411 6.209 6.182 - 9M 2026 EBITDA grew to 19.150 billion, representing a 3.5% YoY increase. 31.9% 31.9% 32.2% 31.8% 30.9% - EBITDA margin remained sta
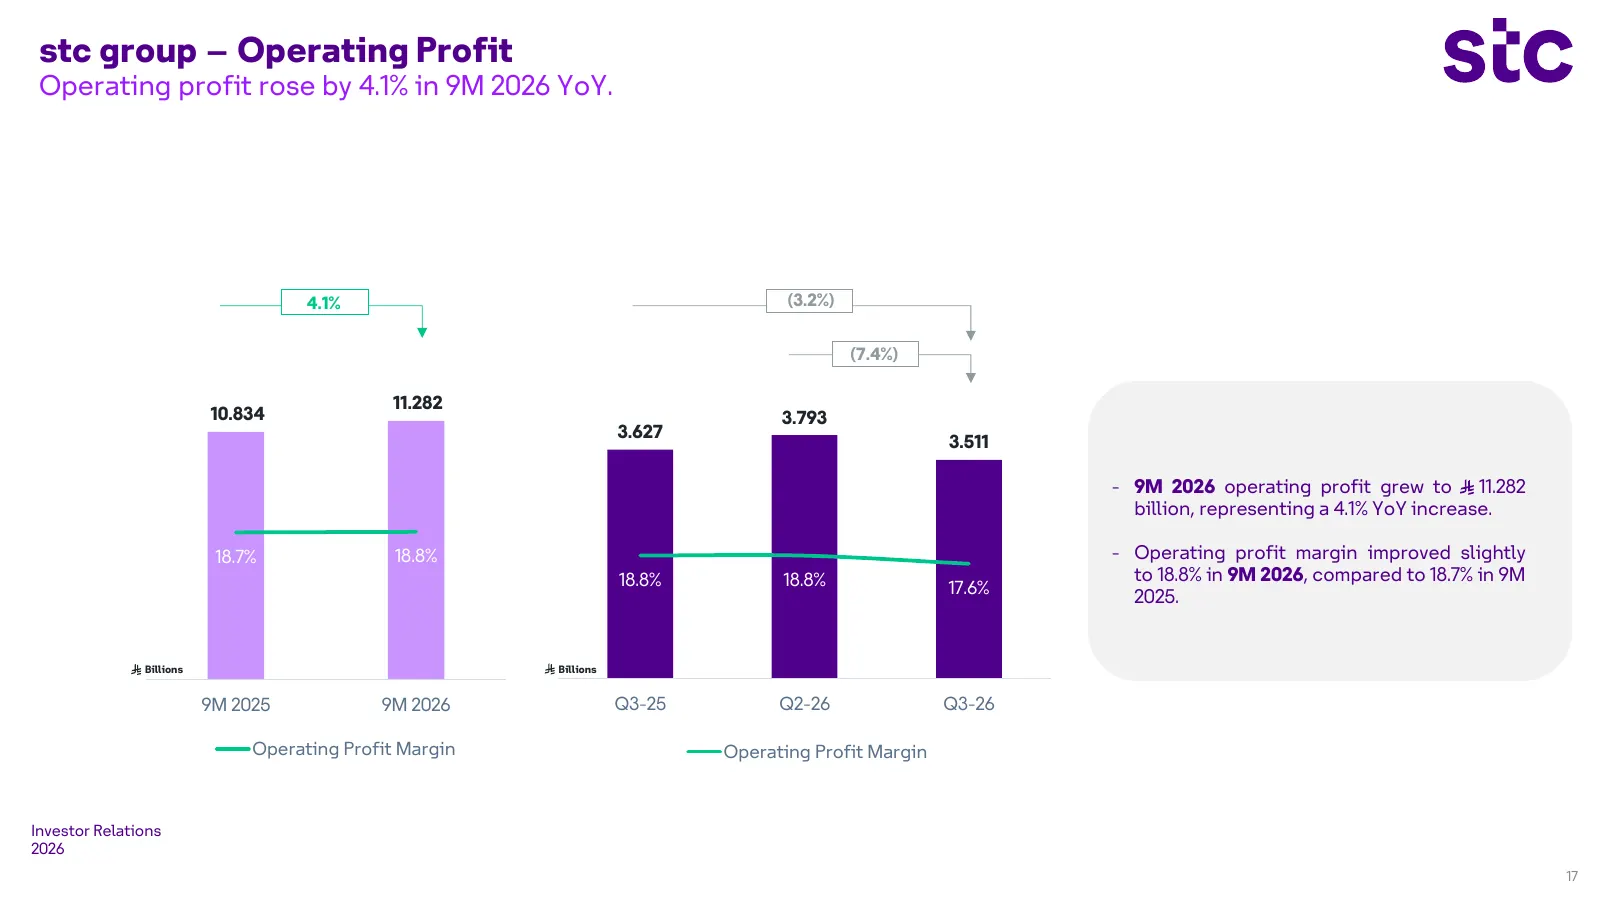
Slide 17: stc group – Operating Profit
stc group – Operating Profit Operating profit rose by 4.1% in 9M 2026 YoY. 4.1% (3.2%) 40.0% (7.4%) 13.000 11.282 35.0% 10.834 3.793 3.627 11.000 30.0% 3.511 - 9M 2026 operating profit grew to 11.282 9.0 00 25.0% 20.0% billion, representing a 4.1% YoY increase. 7.000 18.7% 18.8% 15.0% - Operating pr
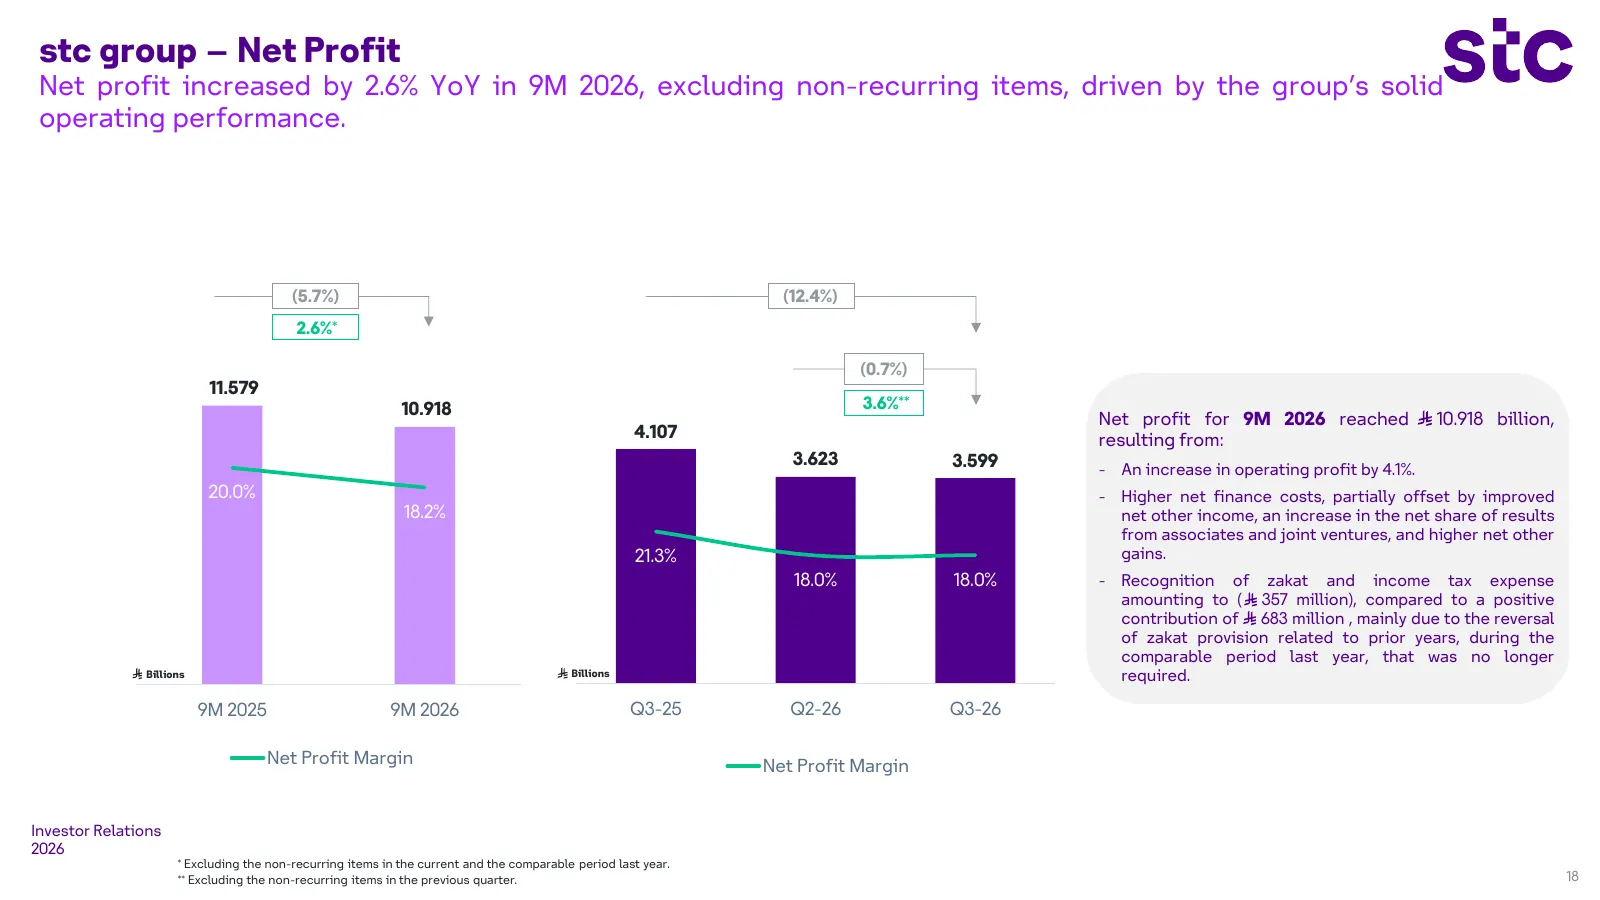
Slide 18: stc group – Net Profit
stc group – Net Profit Net profit increased by 2.6% YoY in 9M 2026, excluding non-recurring items, driven by the group’s solid operating performance. (5.7%) (12.4%) 2.6%* (0.7%) 11.579 10.918 3.6%** Net profit for 9M 2026 reached 10.918 billion, 4.107 resulting from: 3.623 3.599 - An increase in ope
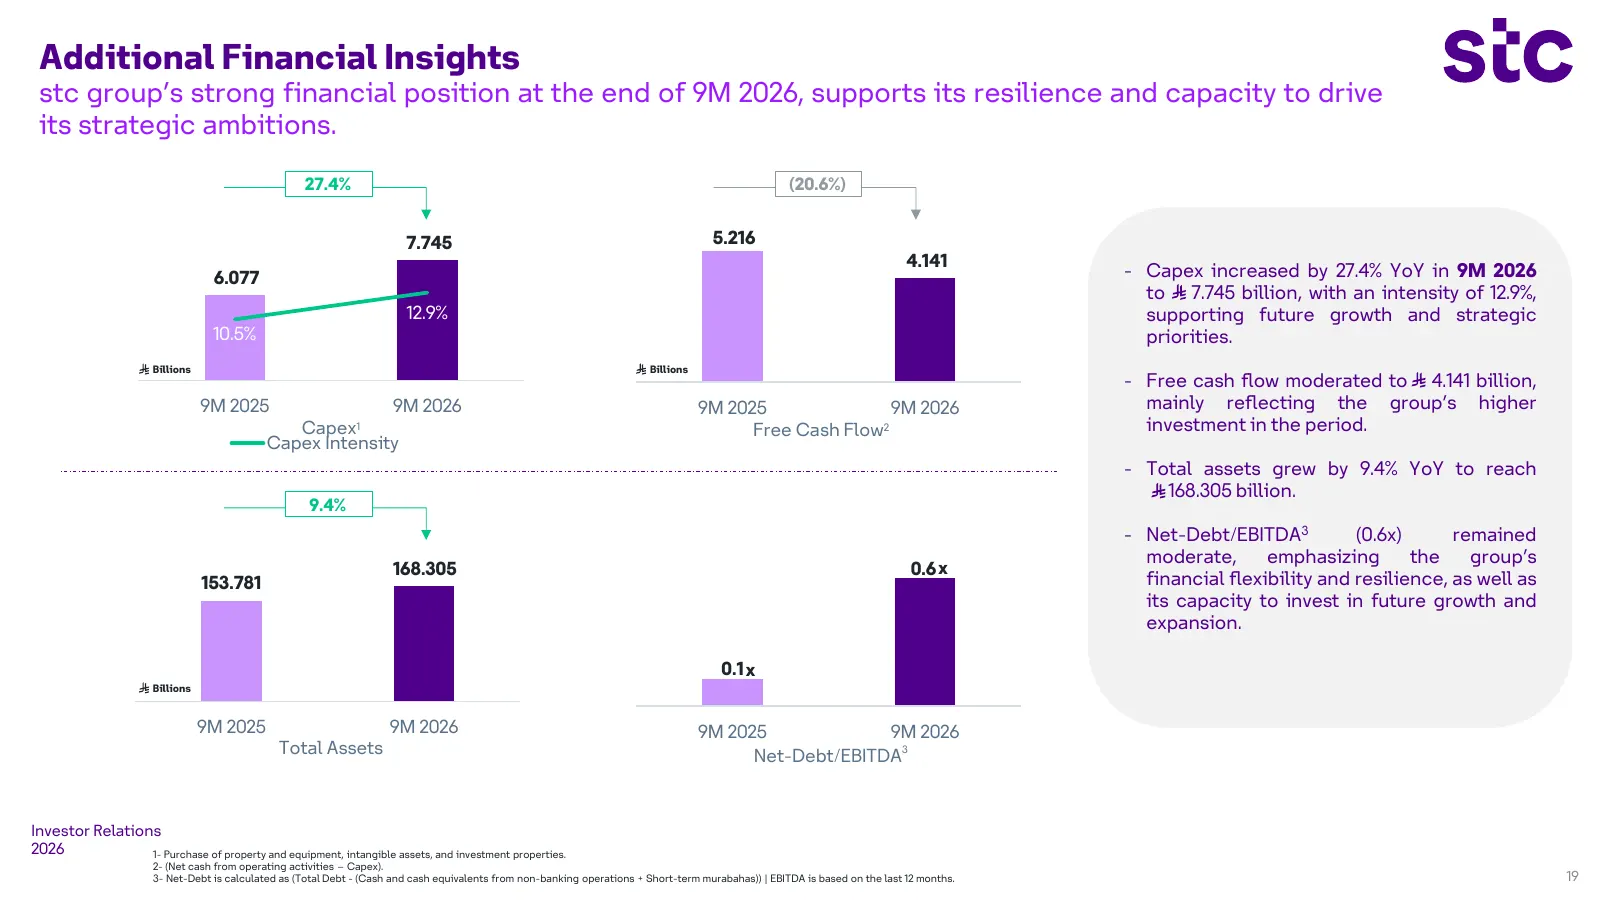
Slide 19: Additional Financial Insights
Additional Financial Insights stc group’s strong financial position at the end of 9M 2026, supports its resilience and capacity to drive its strategic ambitions. 27.4% (20.6%) 7.745 5.216 4.141 6.077 - Capex increased by 27.4% YoY in 9M 2026 to 7.745 billion, with an intensity of 12.9%, 12.9% suppor
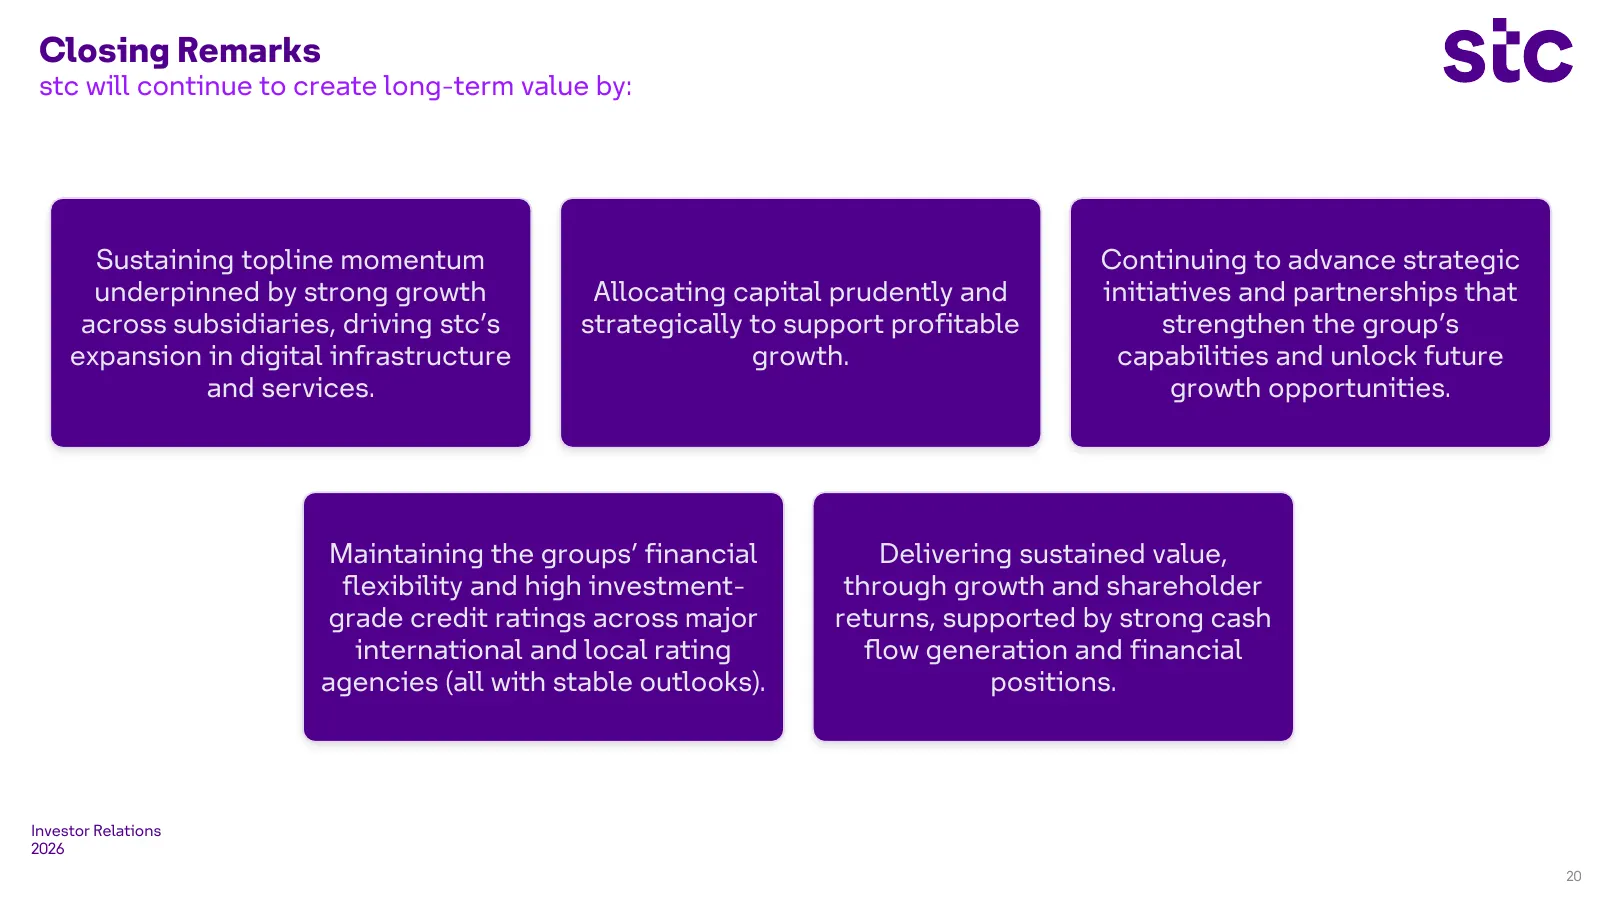
Slide 20: Closing Remarks
Closing Remarks stc will continue to create long-term value by: Sustaining topline momentum Continuing to advance strategic underpinned by strong growth Allocating capital prudently and initiatives and partnerships that across subsidiaries, driving stc’s strategically to support profitable strengthe

Slide 21: Appendix
Appendix Investor Relations 2026 21
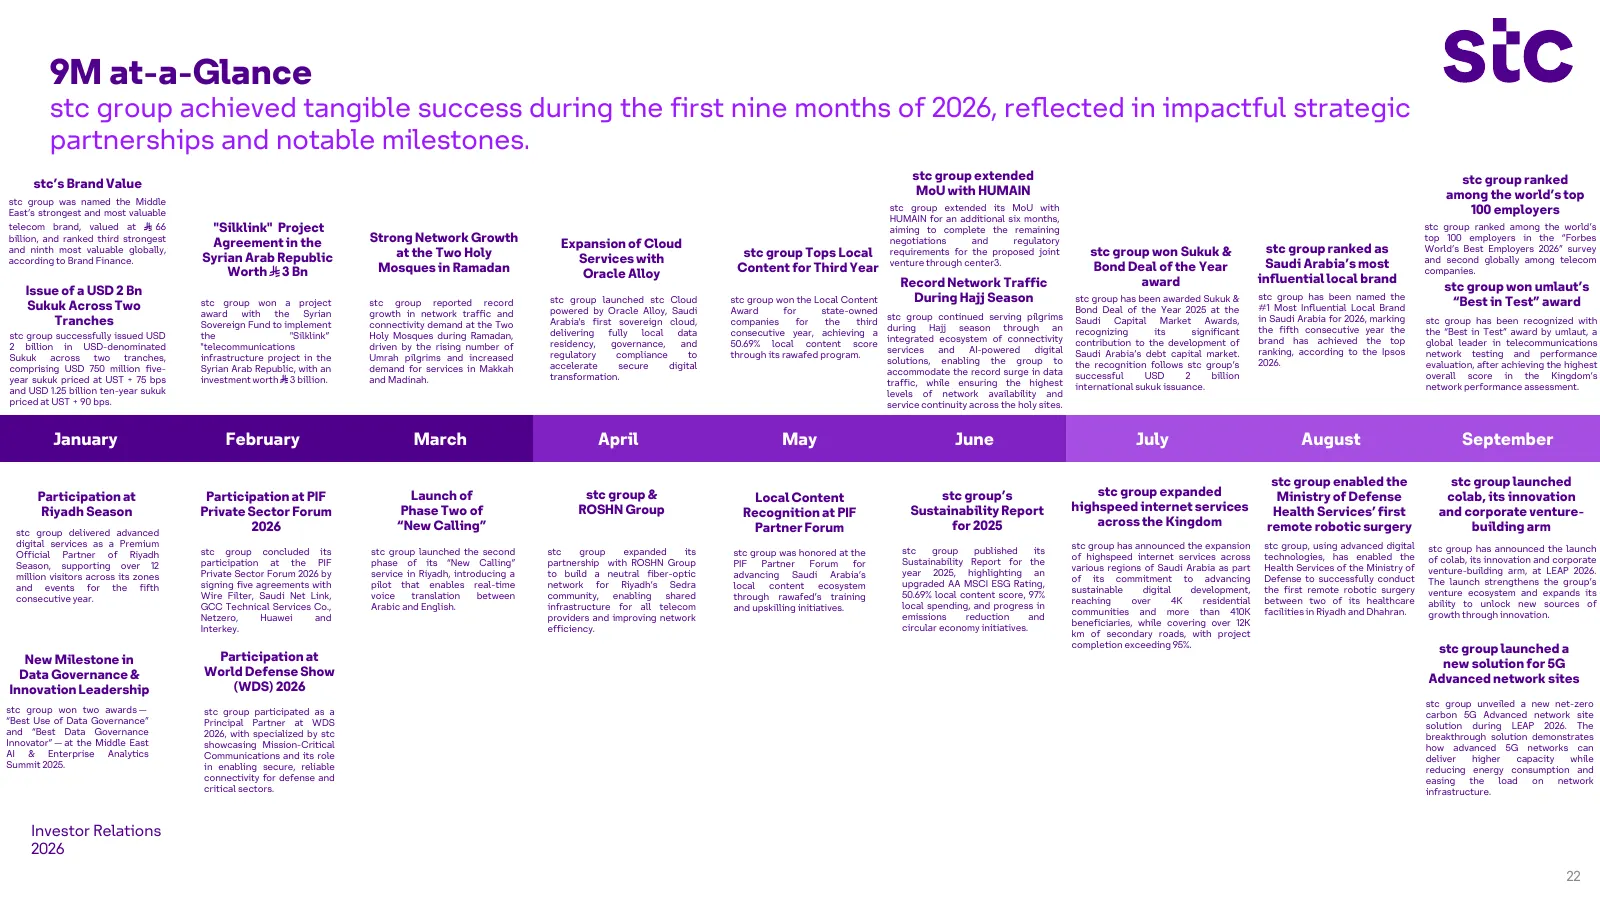
Slide 22: 9M at-a-Glance
9M at-a-Glance stc group achieved tangible success during the first nine months of 2026, reflected in impactful strategic partnerships and notable milestones. stc group extended stc group ranked stc’s Brand Value MoU with HUMAIN among the world’s top stc group was named the Middle stc group extended
Slide 23: Investor Relations app and Disclaimer
Stay updated with the latest stock data, financial information, announcements and more by downloading the Investor Relations app: Investor Relations Website: https://www.stc.com/en/investors.html Disclaimer This presentation has been prepared as an informative guide that might assist interested part

Slide 24: Thank you
Stc Thank you
Source: company website