Aryzta AG · SIX:ARYN
Aryzta — FY2021 Earnings Presentation
44 slides from Aryzta's earnings presentation, Oct 4, 2021
Slide 1: ARYZTA AG – FY 2021 Results
ARYZTA AG – FY 2021 Results 4 October 2021
Slide 2: Forward Looking Statement
Forward Looking Statement This document contains forward looking statements which reflect the Board of Directors' current views and estimates. The forward looking statements involve certain risks and uncertainties that could cause actual results to differ materially from those contained in the forwa
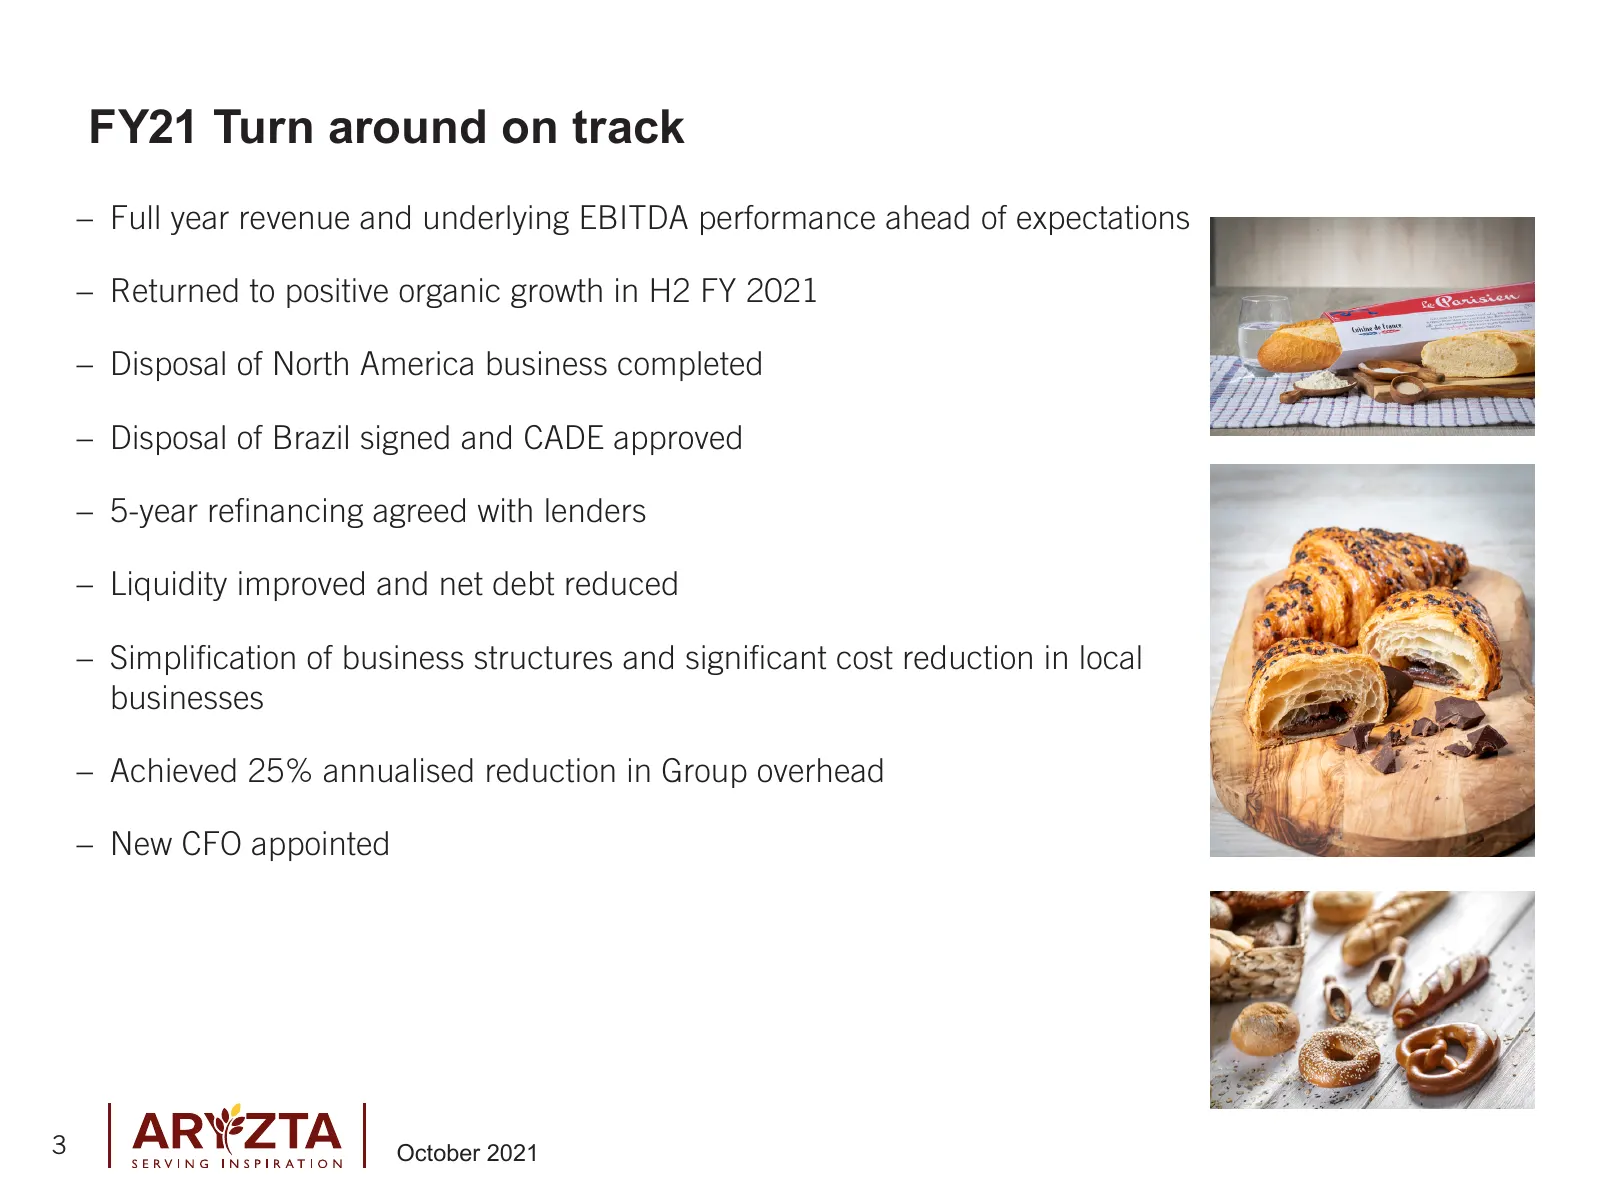
Slide 3: FY21 Turn around on track
FY21 Turn around on track – Full year revenue and underlying EBITDA performance ahead of expectations – Returned to positive organic growth in H2 FY 2021 – Disposal of North America business completed – Disposal of Brazil signed and CADE approved – 5-year refinancing agreed with lenders – Liquidity
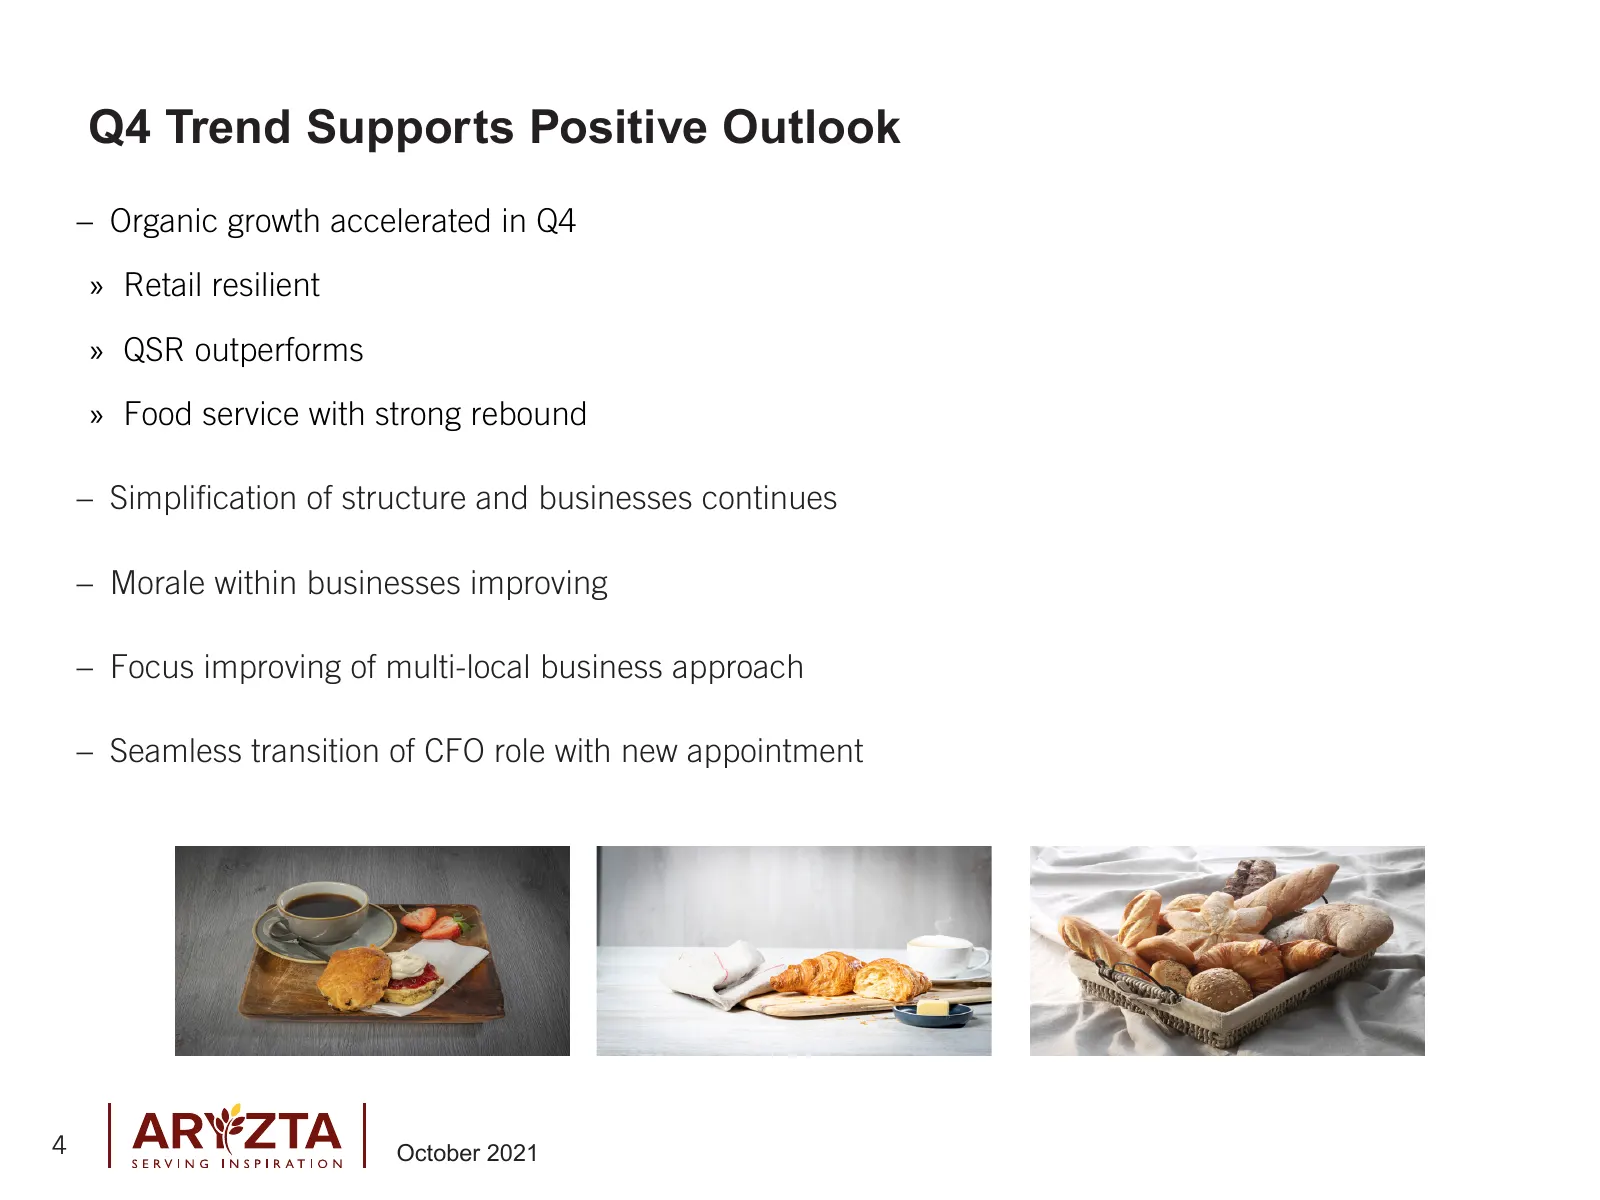
Slide 4: Q4 Trend Supports Positive Outlook
Q4 Trend Supports Positive Outlook – Organic growth accelerated in Q4 » Retail resilient » QSR outperforms » Food service with strong rebound – Simplification of structure and businesses continues – Morale within businesses improving – Focus improving of multi-local business approach – Seamless tran
Slide 5: Strong financial progress achieved
Strong financial progress achieved – Disposal programme delivered – Disposal proceeds ahead of expectations – Maintaining solid liquidity position – Bank debt significantly reduced – New five-year refinancing deal with lenders agreed 5 October 2021
Slide 6: Hybrids
Hybrids – Board conducted expert analysis of hybrid role in current and future capital structure – Disposals and higher business performance improved financial outlook – Paying all accumulated deferred and current interest on the CHF hybrid instruments1 – Paying all accumulated deferred interest and
Slide 7: Input costs inflation
Input costs inflation – Inflation recovery options: » Majority through price increases » Efficiency increases and cost reductions – Significant pricing essential to recovering inflation trends – Mix of pass through and tender pricing – Efforts in automation and continuous review of service and suppl
Slide 8: FY 2022 Outlook
FY 2022 Outlook – Mid-single digit positive organic revenue growth – Margin expansion to run-rate of 12.5% EBITDA pre IFRS 16 (with de minimis non-recurring costs) – Achievement of sustainable net profit 8 October 2021
Slide 9: Financial Review
Financial Review 9 October 2021
Slide 10: Key Highlights
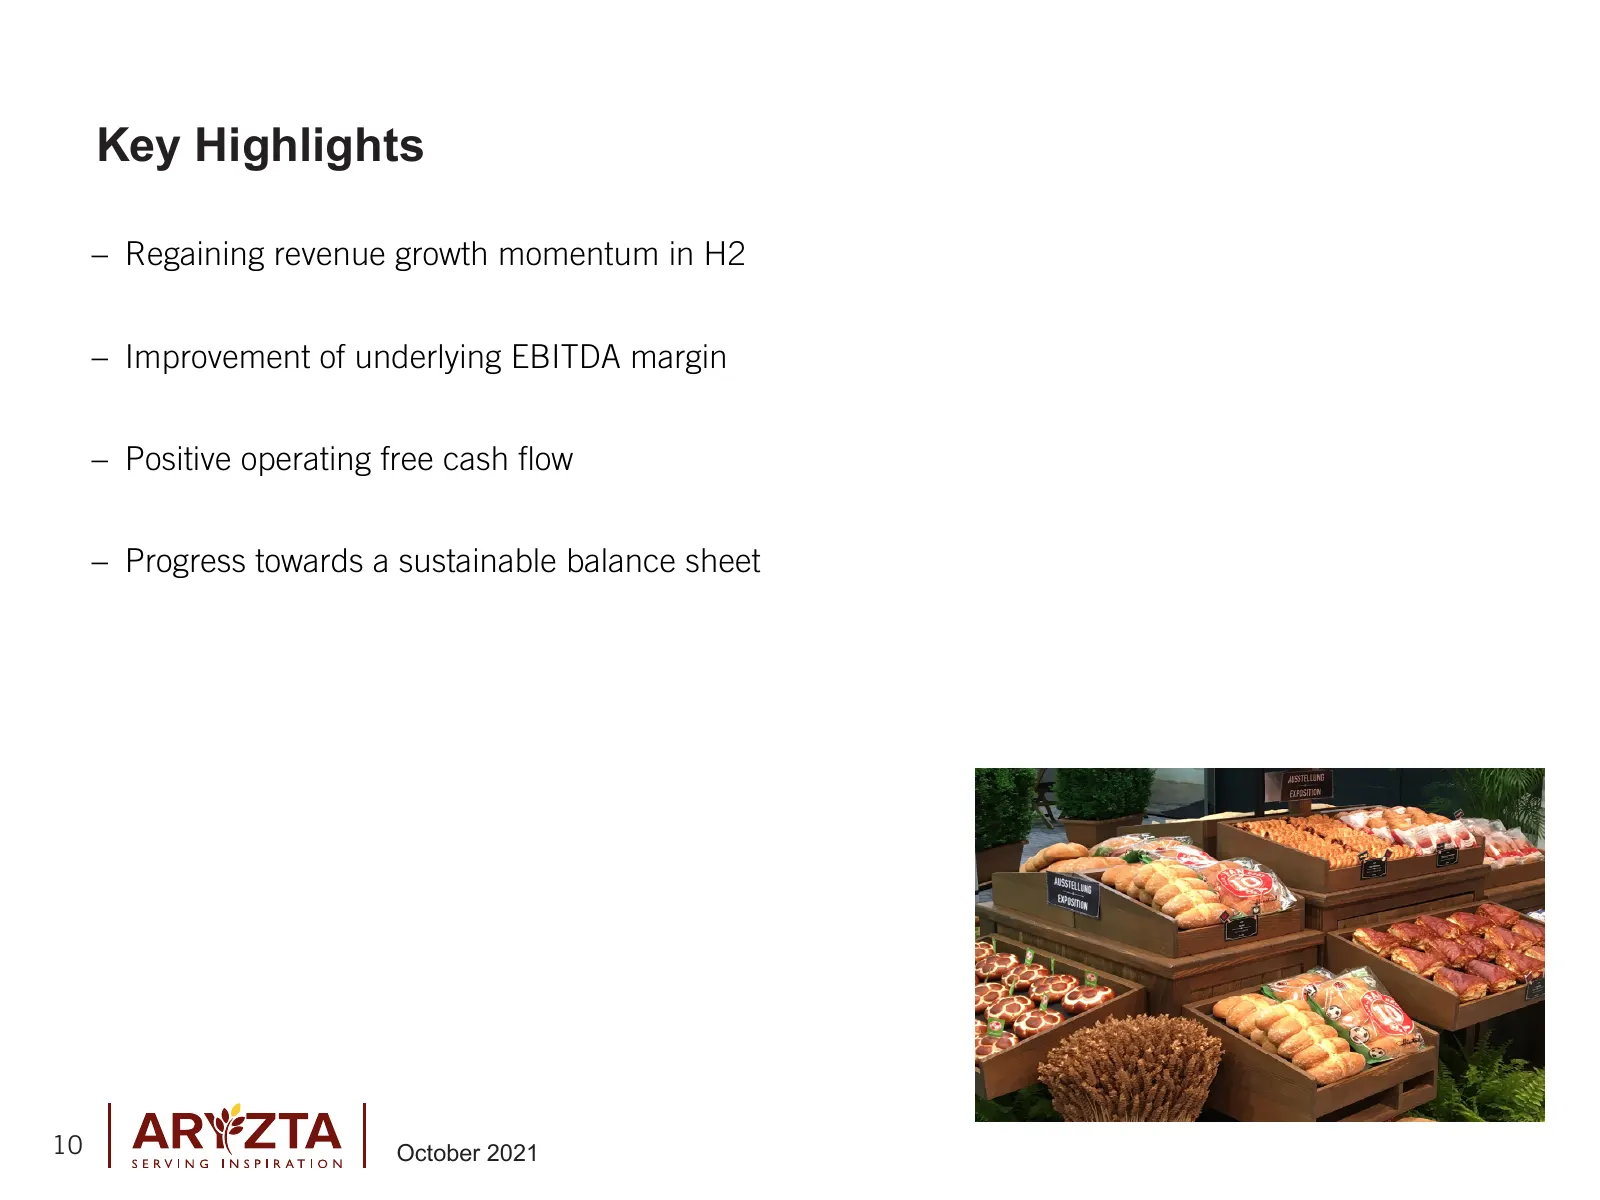
Key Highlights – Regaining revenue growth momentum in H2 – Improvement of underlying EBITDA margin – Positive operating free cash flow – Progress towards a sustainable balance sheet 10 October 2021
Slide 11: Key Financial Highlights
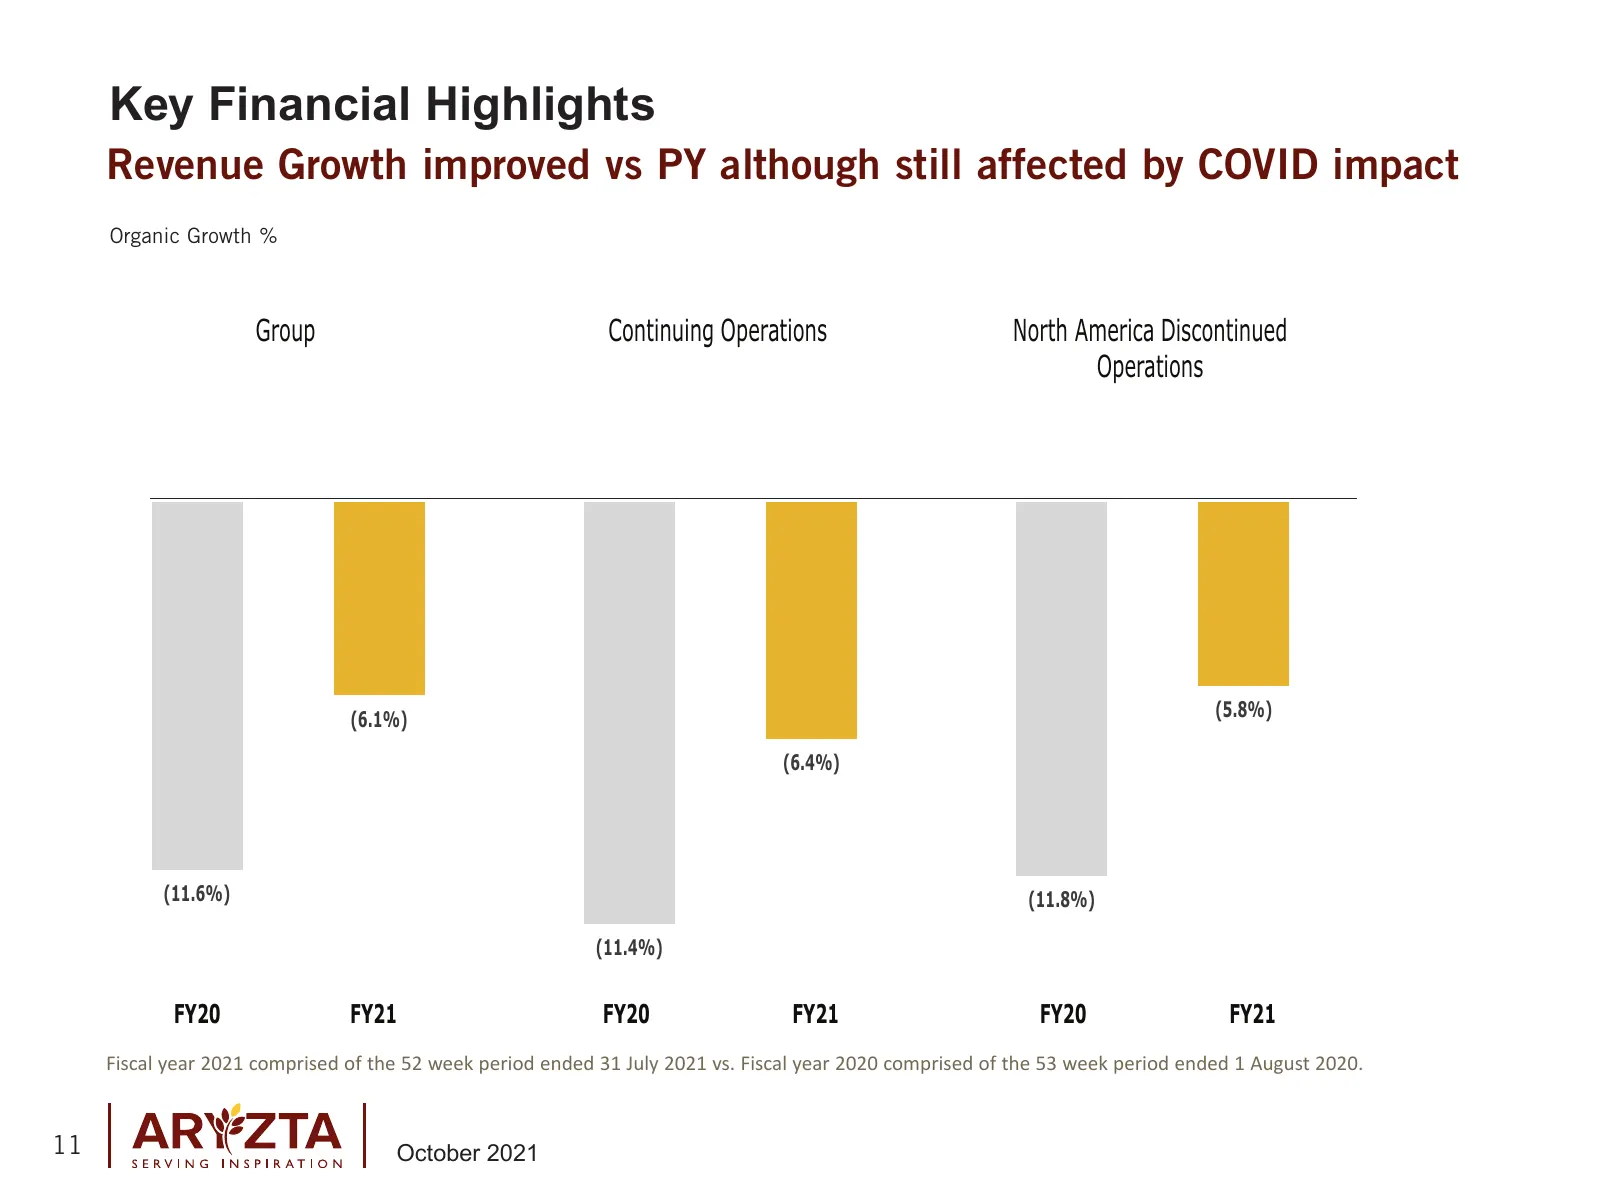
Key Financial Highlights Revenue Growth improved vs PY although still affected by COVID impact Organic Growth % Group Continuing Operations North America Discontinued Operations (6.1%) (5.8%) (6.4%) (11.6%) (11.8%) (11.4%) FY20 FY21 FY20 FY21 FY20 FY21 Fiscal year 2021 comprised of the 52 week perio
Slide 12: Key Financial Highlights
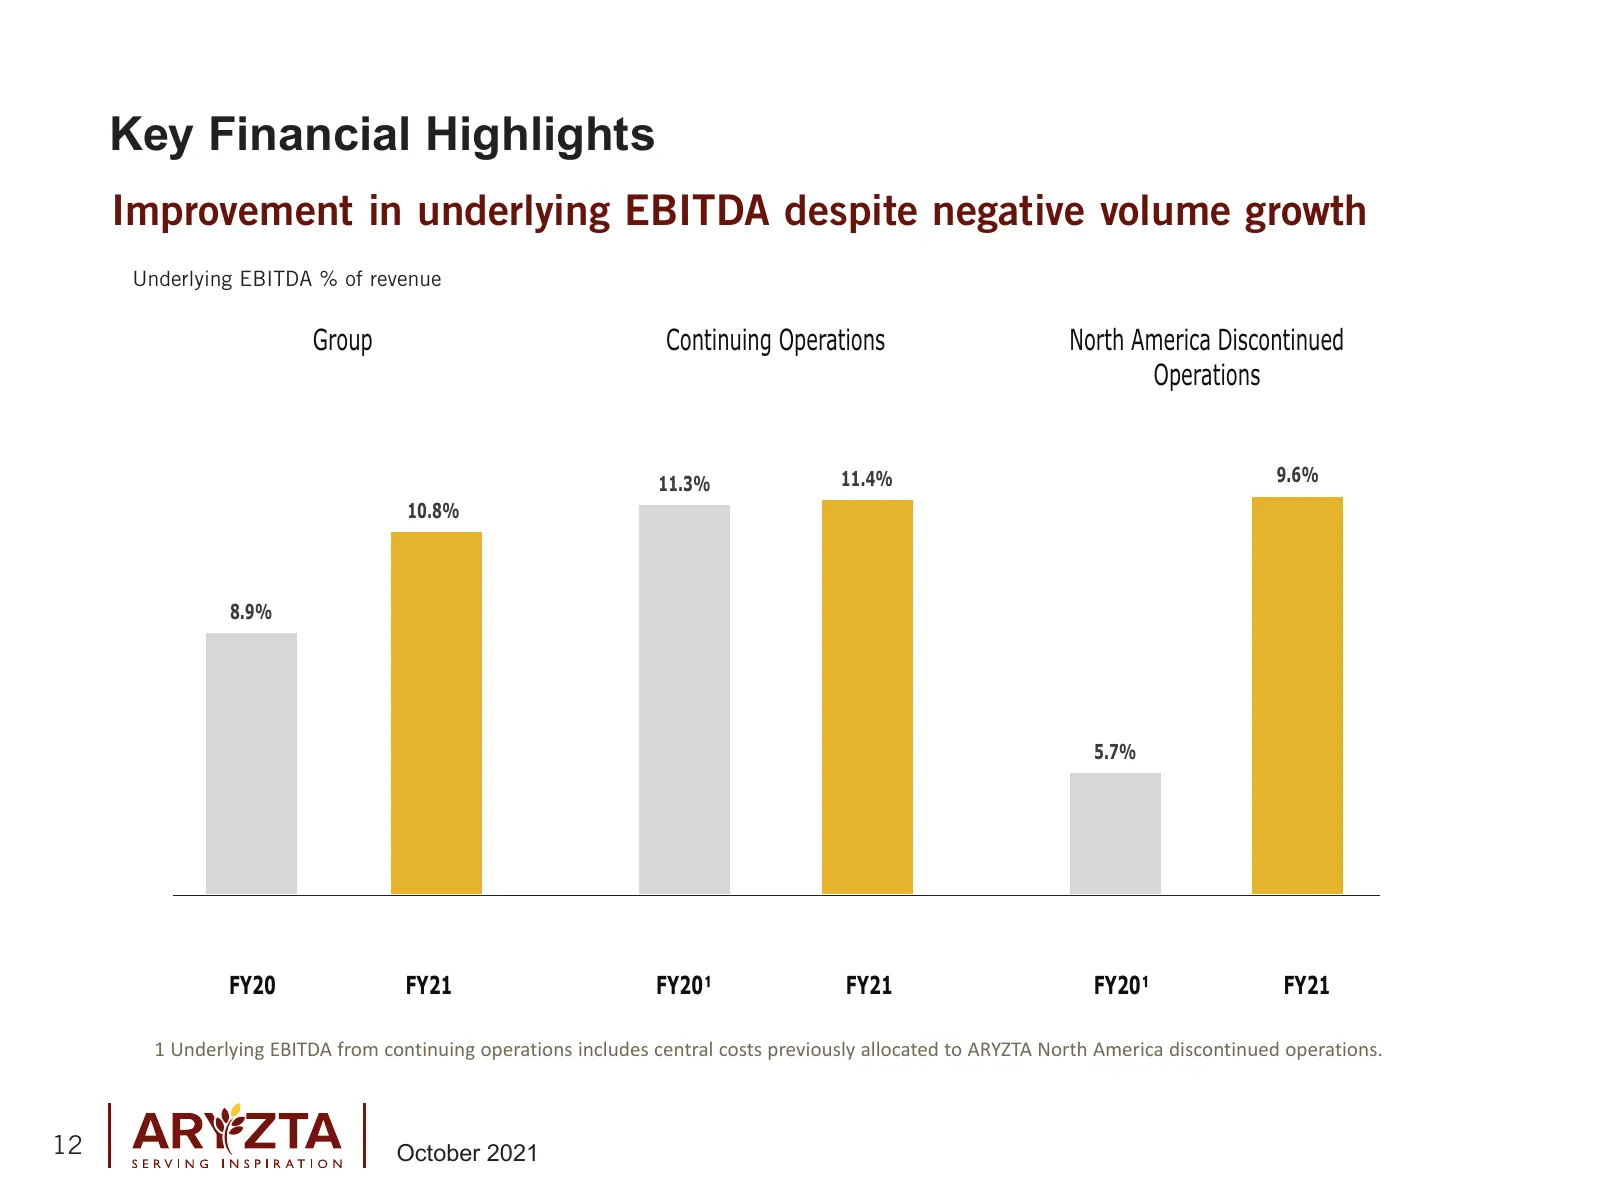
Key Financial Highlights Improvement in underlying EBITDA despite negative volume growth Underlying EBITDA % of revenue Group Continuing Operations North America Discontinued Operations 11.3% 11.4% 9.6% 10.8% 8.9% 5.7% FY20 FY21 FY20 FY21 FY20 FY21 1 Underlying EBITDA from continuing operations incl
Slide 13: Key Financial Highlights
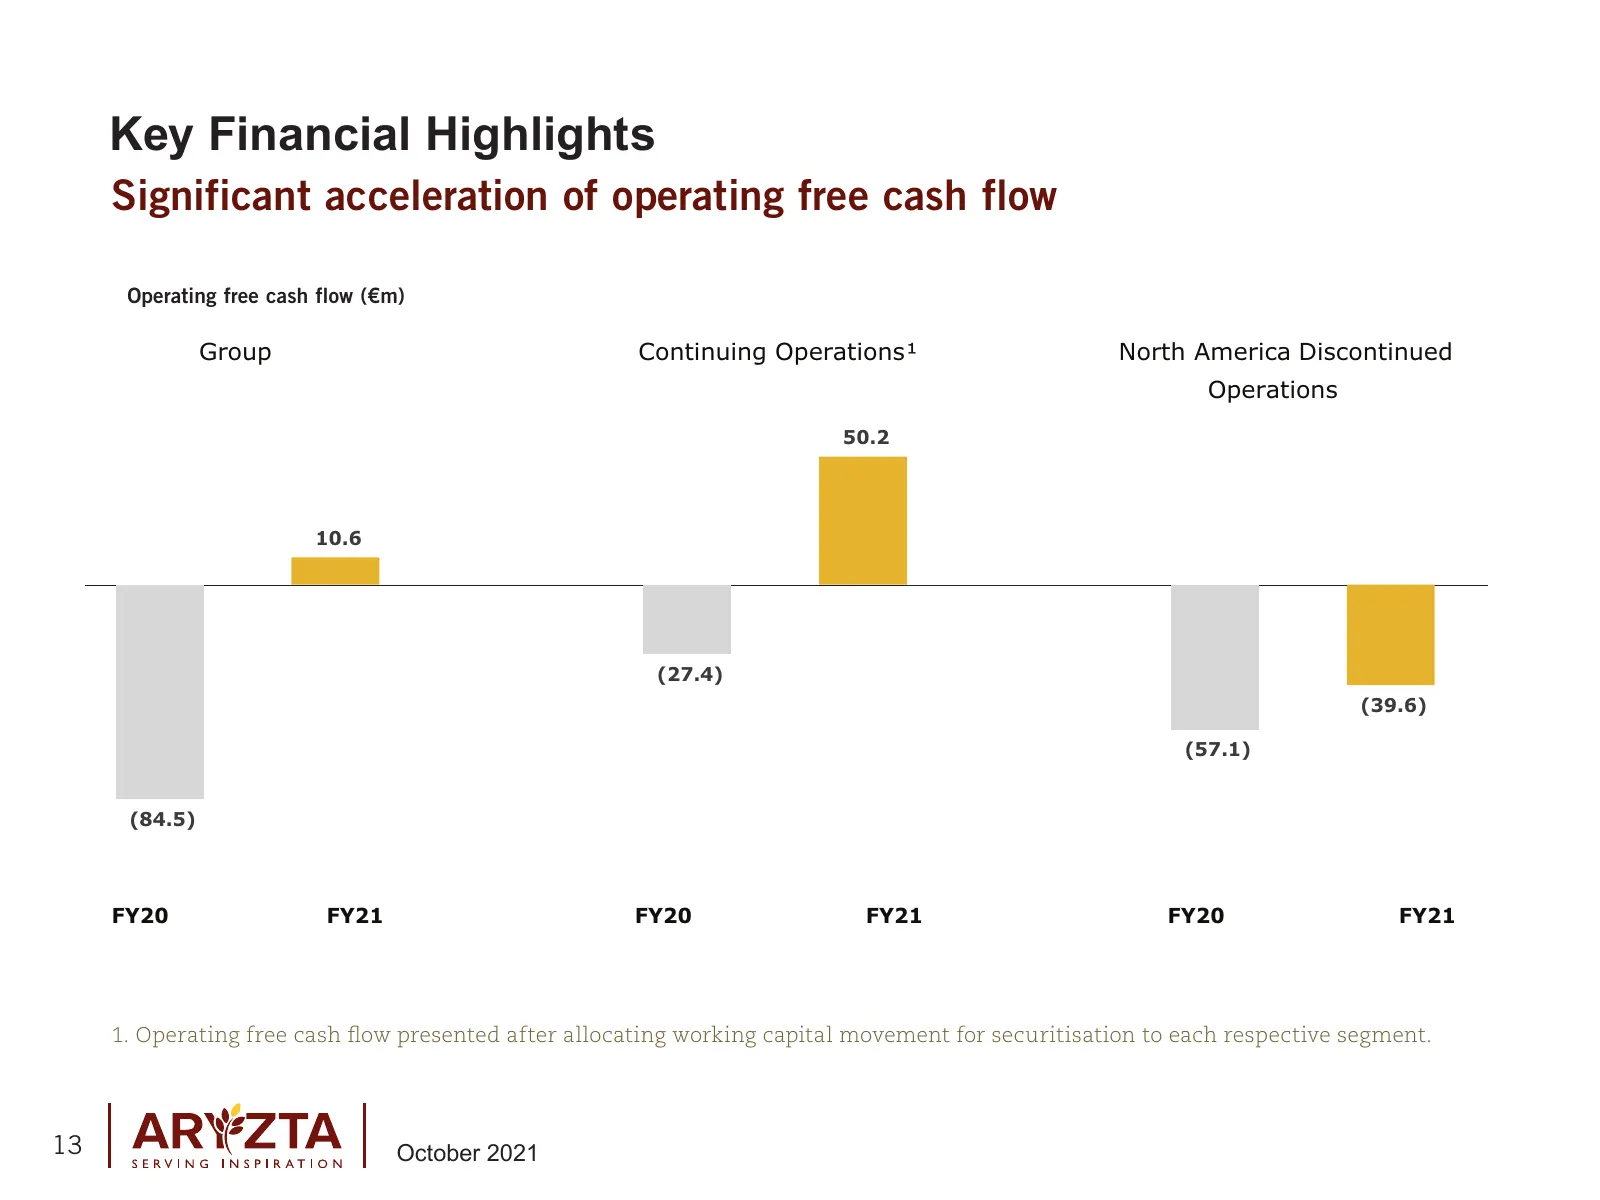
Key Financial Highlights Significant acceleration of operating free cash flow Operating free cash flow (€m) Group Continuing Operations¹ North America Discontinued Operations 50.2 10.6 (27.4) (39.6) (57.1) (84.5) FY20 FY21 FY20 FY21 FY20 FY21 1. Operating free cash flow presented after allocating wo
Slide 14: Key Financial Highlights
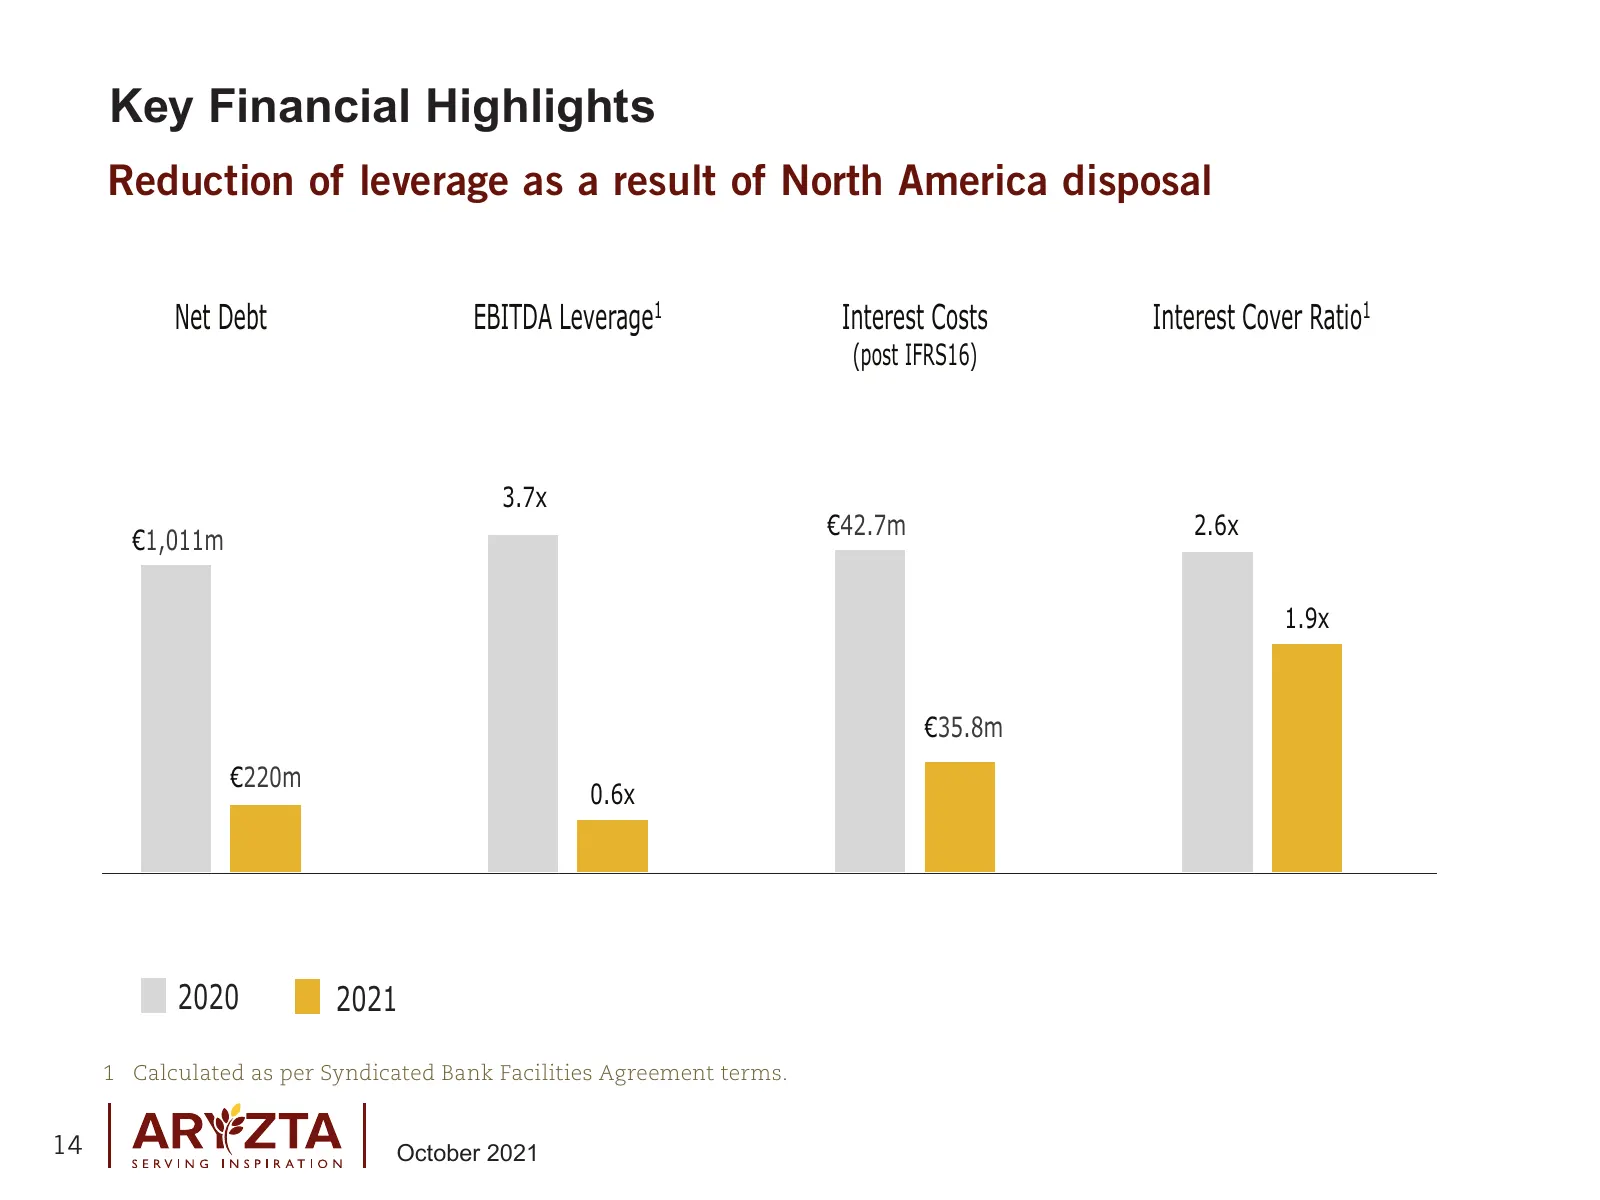
Key Financial Highlights Reduction of leverage as a result of North America disposal Net Debt EBITDA Leverage1 Interest Costs Interest Cover Ratio1 (post IFRS16) 3.7x €42.7m 2.6x €1,011m 1.9x €35.8m €220m 0.6x 2020 2021 1 Calculated as per Syndicated Bank Facilities Agreement terms. 14 October 2021
Slide 15: Continuing Operations Revenue Growth
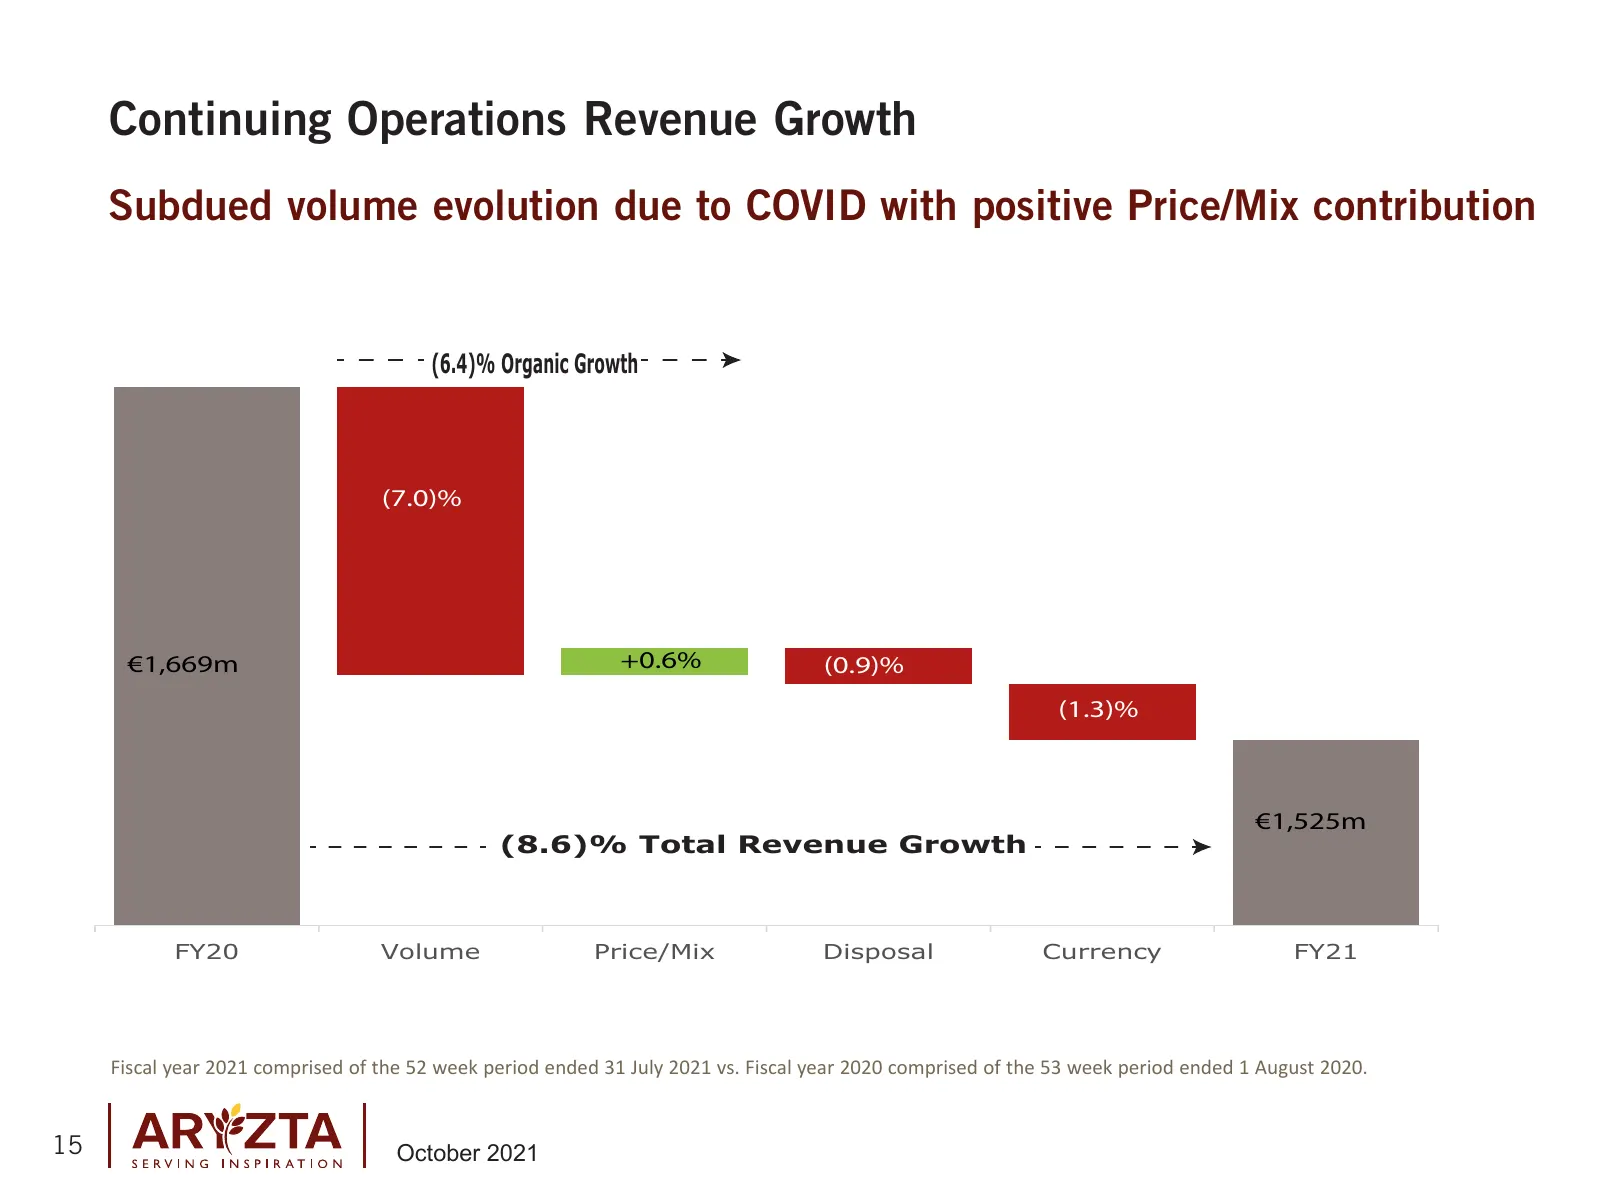
Continuing Operations Revenue Growth Subdued volume evolution due to COVID with positive Price/Mix contribution (6.4)% Organic Growth (7.0)% €1,669m +0.6% (0.9)% (1.3)% €1,525m (8.6)% Total Revenue Growth FY20 Volume Price/Mix Disposal Currency FY21 Fiscal year 2021 comprised of the 52 week period e
Slide 16: Organic Revenue Growth by Geographic Segment
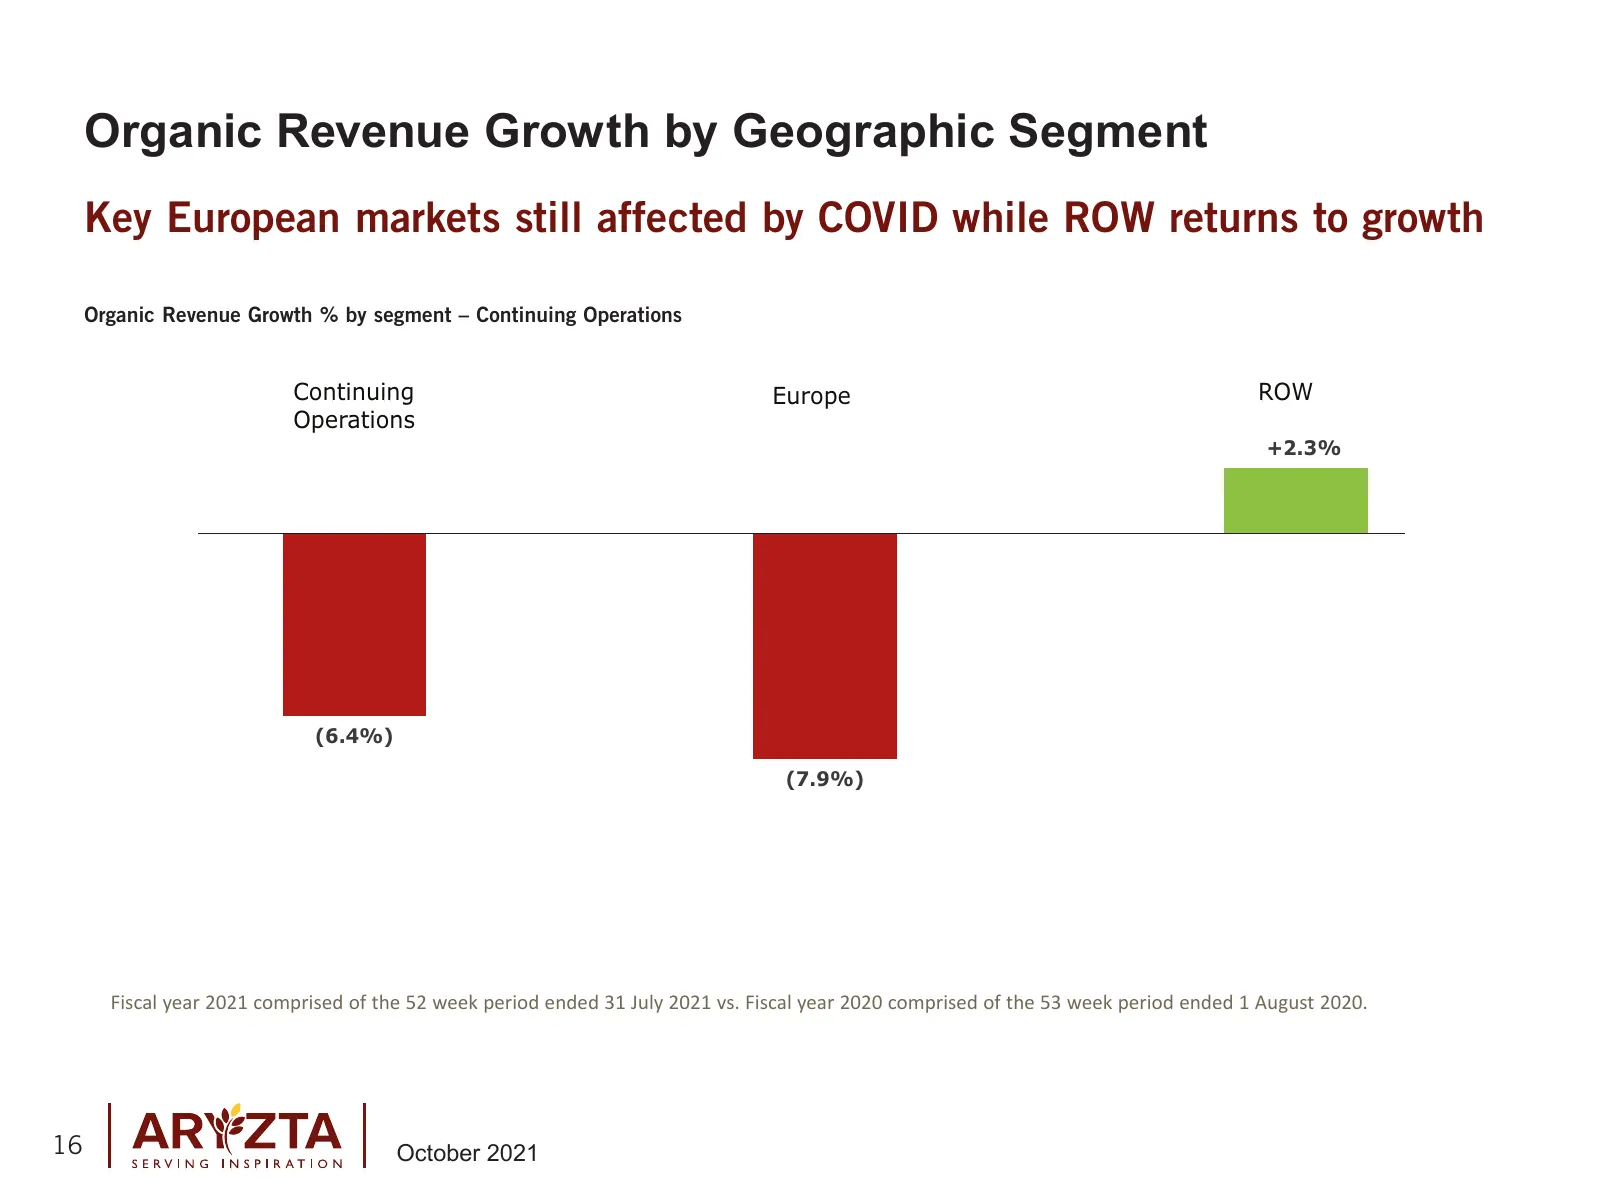
Organic Revenue Growth by Geographic Segment Key European markets still affected by COVID while ROW returns to growth Organic Revenue Growth % by segment – Continuing Operations Continuing Europe ROW Operations +2.3% (6.4%) (7.9%) Fiscal year 2021 comprised of the 52 week period ended 31 July 2021 v
Slide 17: Organic Revenue Growth by Quarter
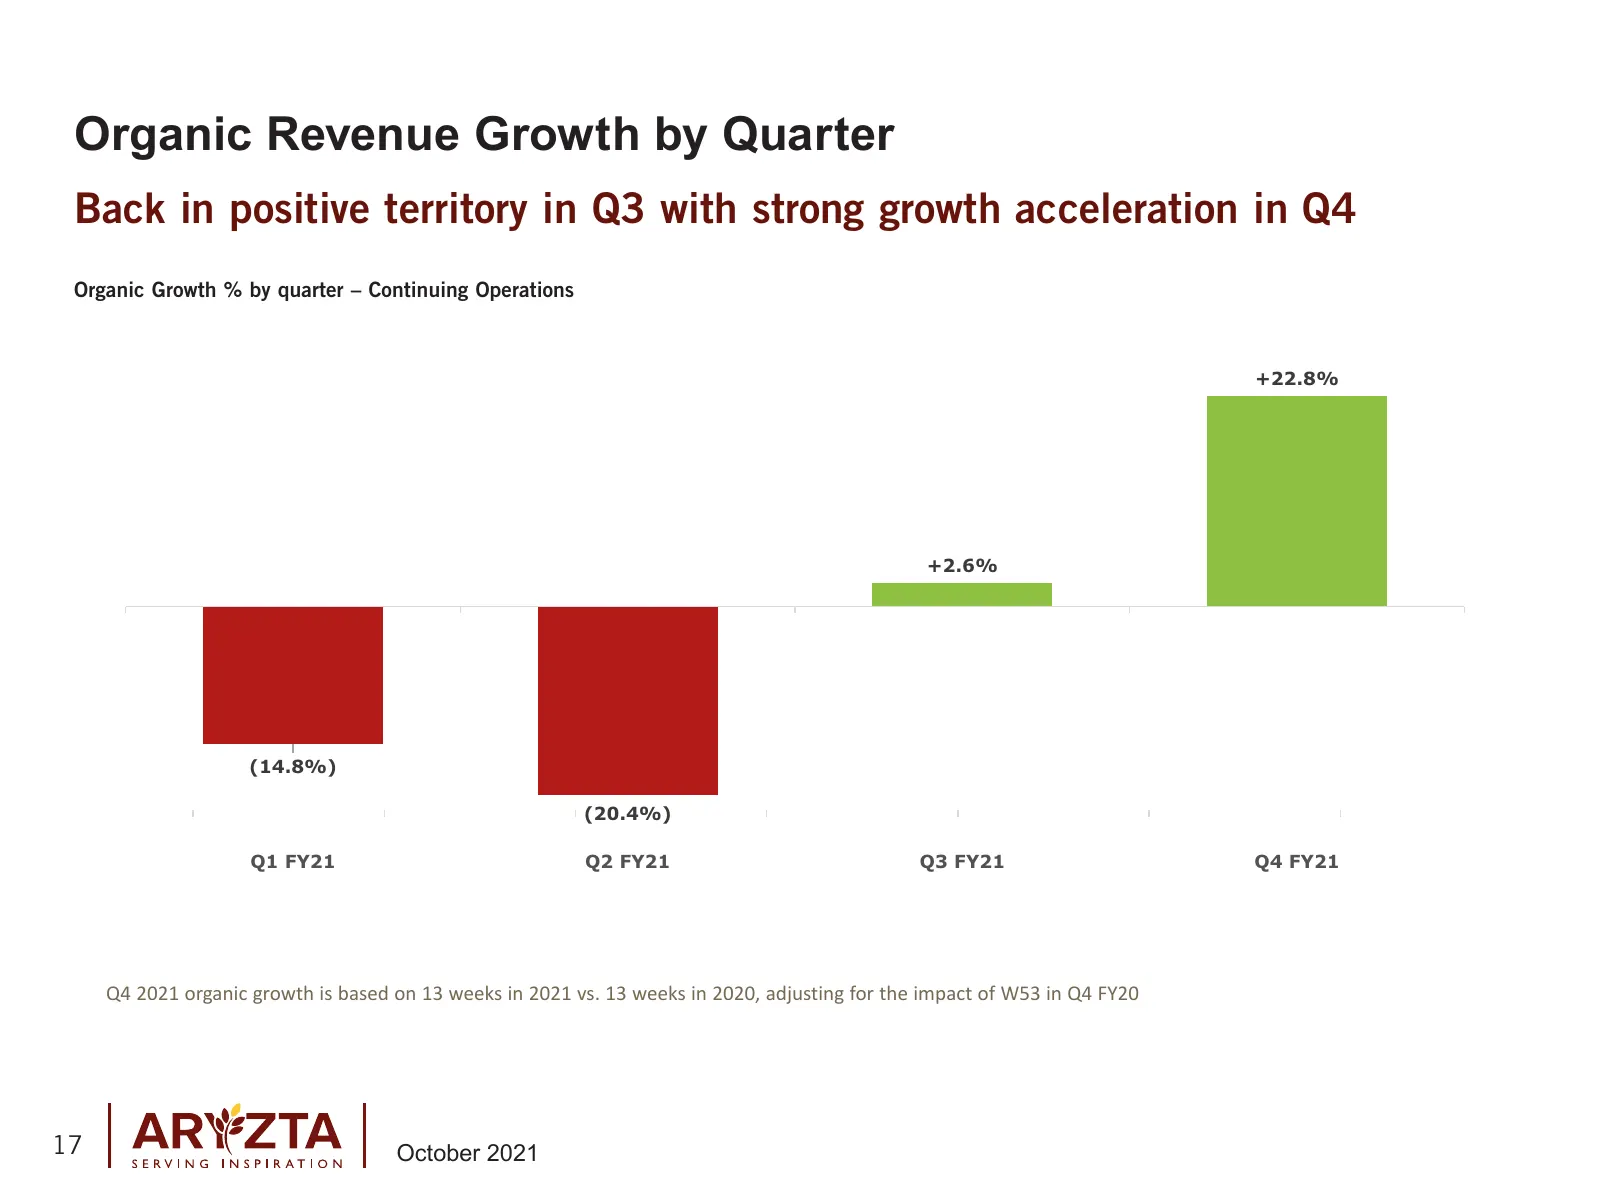
Organic Revenue Growth by Quarter Back in positive territory in Q3 with strong growth acceleration in Q4 Organic Growth % by quarter – Continuing Operations +22.8% +2.6% (14.8%) (20.4%) Q1 FY21 Q2 FY21 Q3 FY21 Q4 FY21 Q4 2021 organic growth is based on 13 weeks in 2021 vs. 13 weeks in 2020, adjustin
Slide 18: Strengthening of Price/Mix Contribution
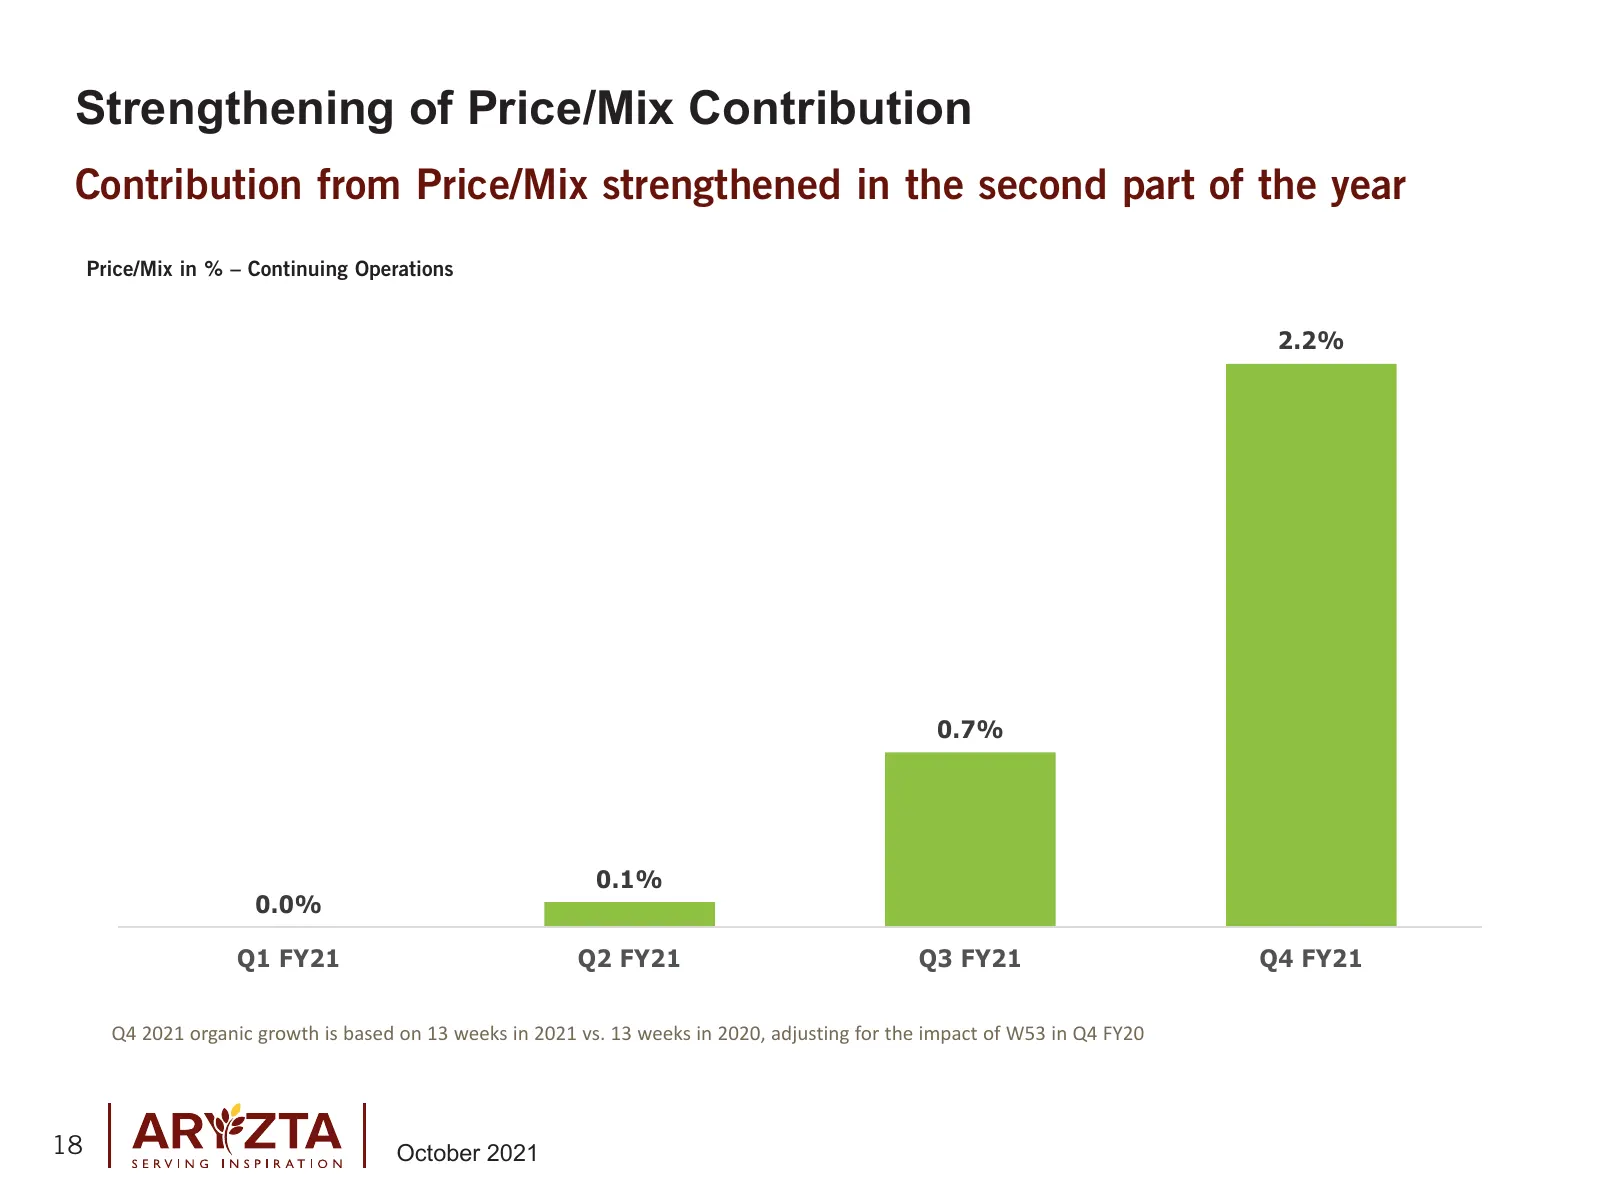
Strengthening of Price/Mix Contribution Contribution from Price/Mix strengthened in the second part of the year Price/Mix in % – Continuing Operations 2.2% 0.7% 0.1% 0.0% Q1 FY21 Q2 FY21 Q3 FY21 Q4 FY21 Q4 2021 organic growth is based on 13 weeks in 2021 vs. 13 weeks in 2020, adjusting for the impac
Slide 19: Organic Revenue Growth by Channel
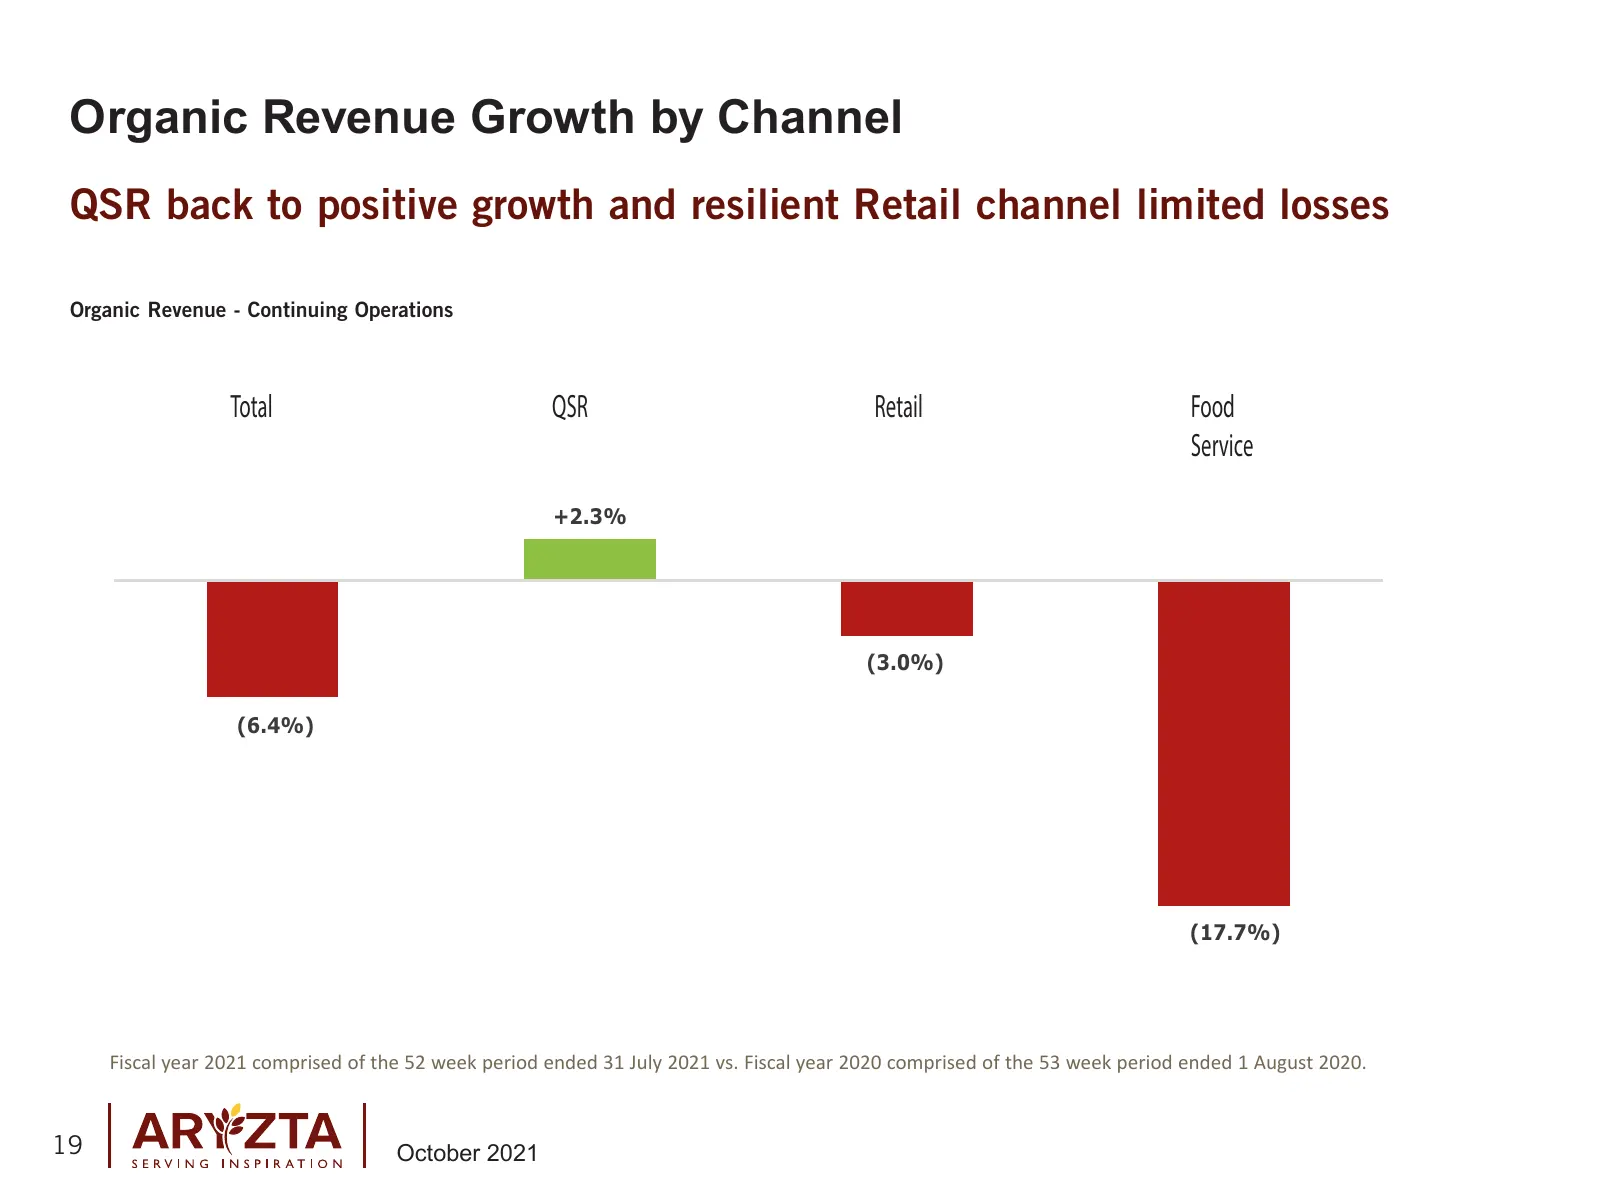
Organic Revenue Growth by Channel QSR back to positive growth and resilient Retail channel limited losses Organic Revenue - Continuing Operations Total QSR Retail Food Service +2.3% (3.0%) (6.4%) (17.7%) Fiscal year 2021 comprised of the 52 week period ended 31 July 2021 vs. Fiscal year 2020 compris
Slide 20: Underlying EBITDA by Geographic Segment
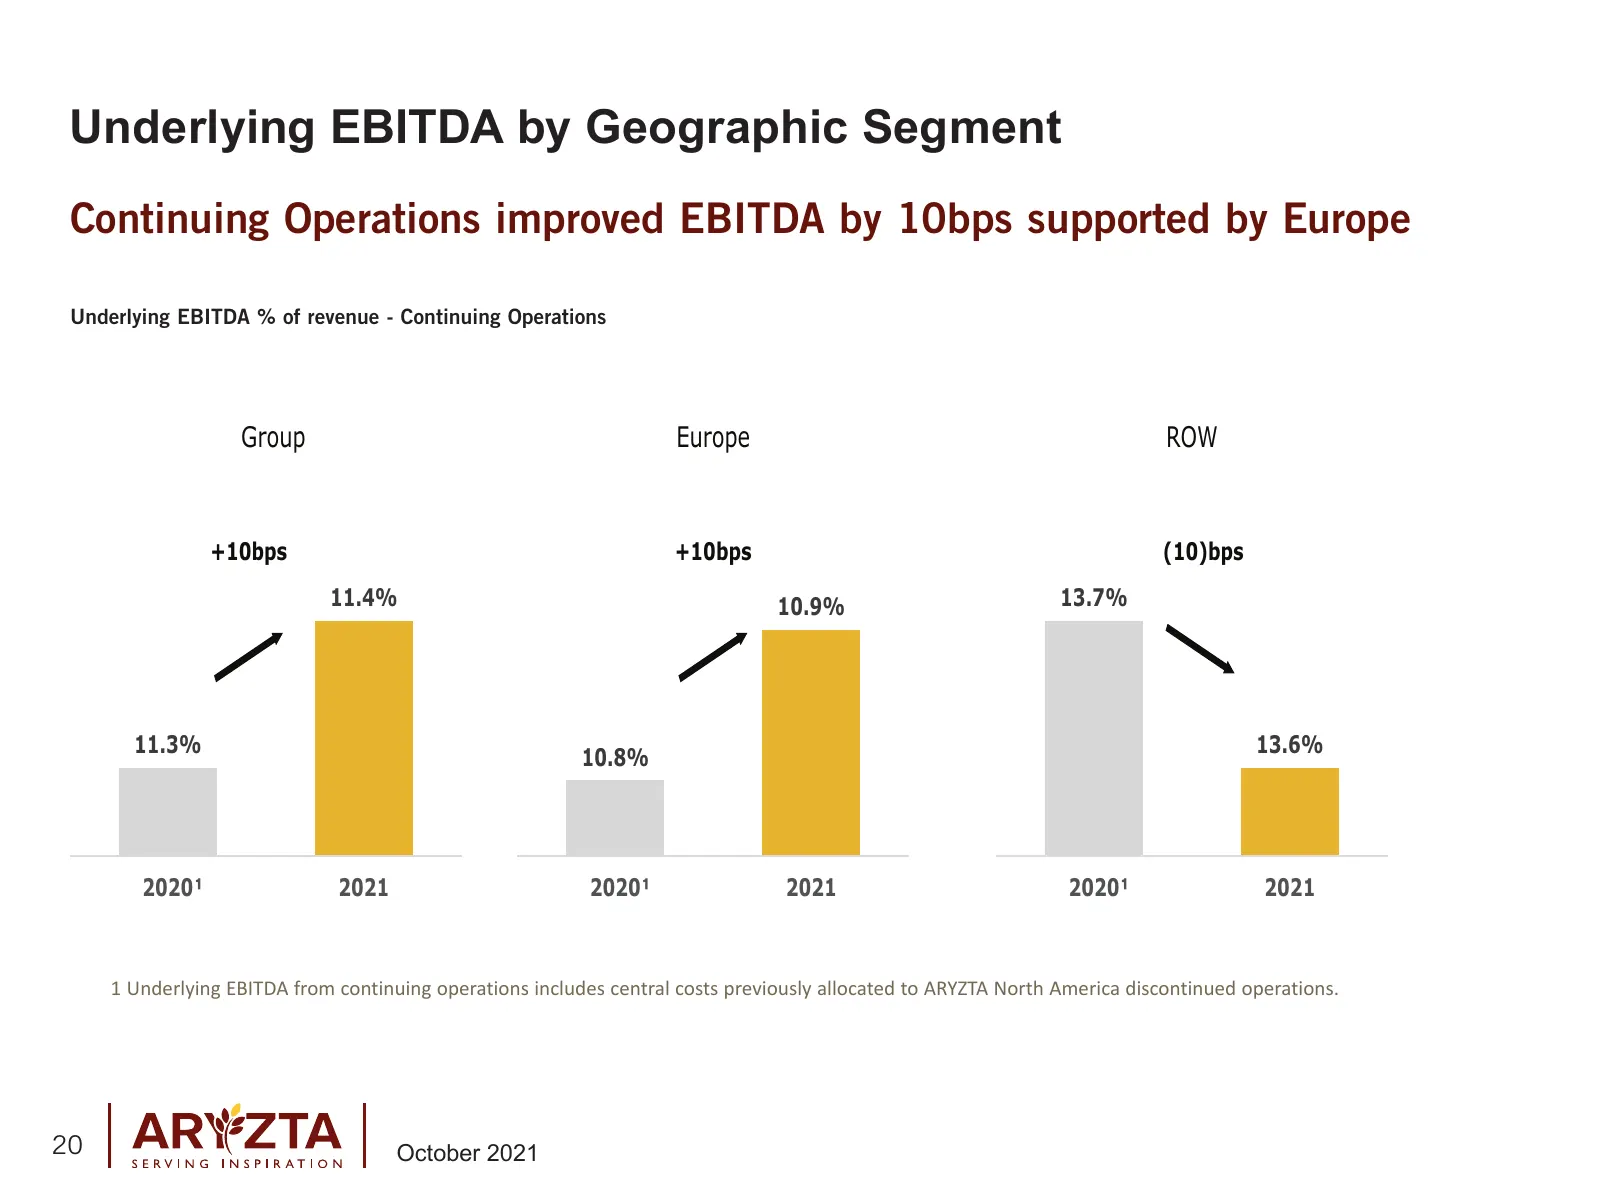
Underlying EBITDA by Geographic Segment Continuing Operations improved EBITDA by 10bps supported by Europe Underlying EBITDA % of revenue - Continuing Operations Group Europe ROW +10bps +10bps (10)bps 11.4% 10.9% 13.7% 11.3% 13.6% 10.8% 2020 2021 2020 2021 2020 2021 1 Underlying EBITDA from continui
Slide 21: Non-Recurring Costs
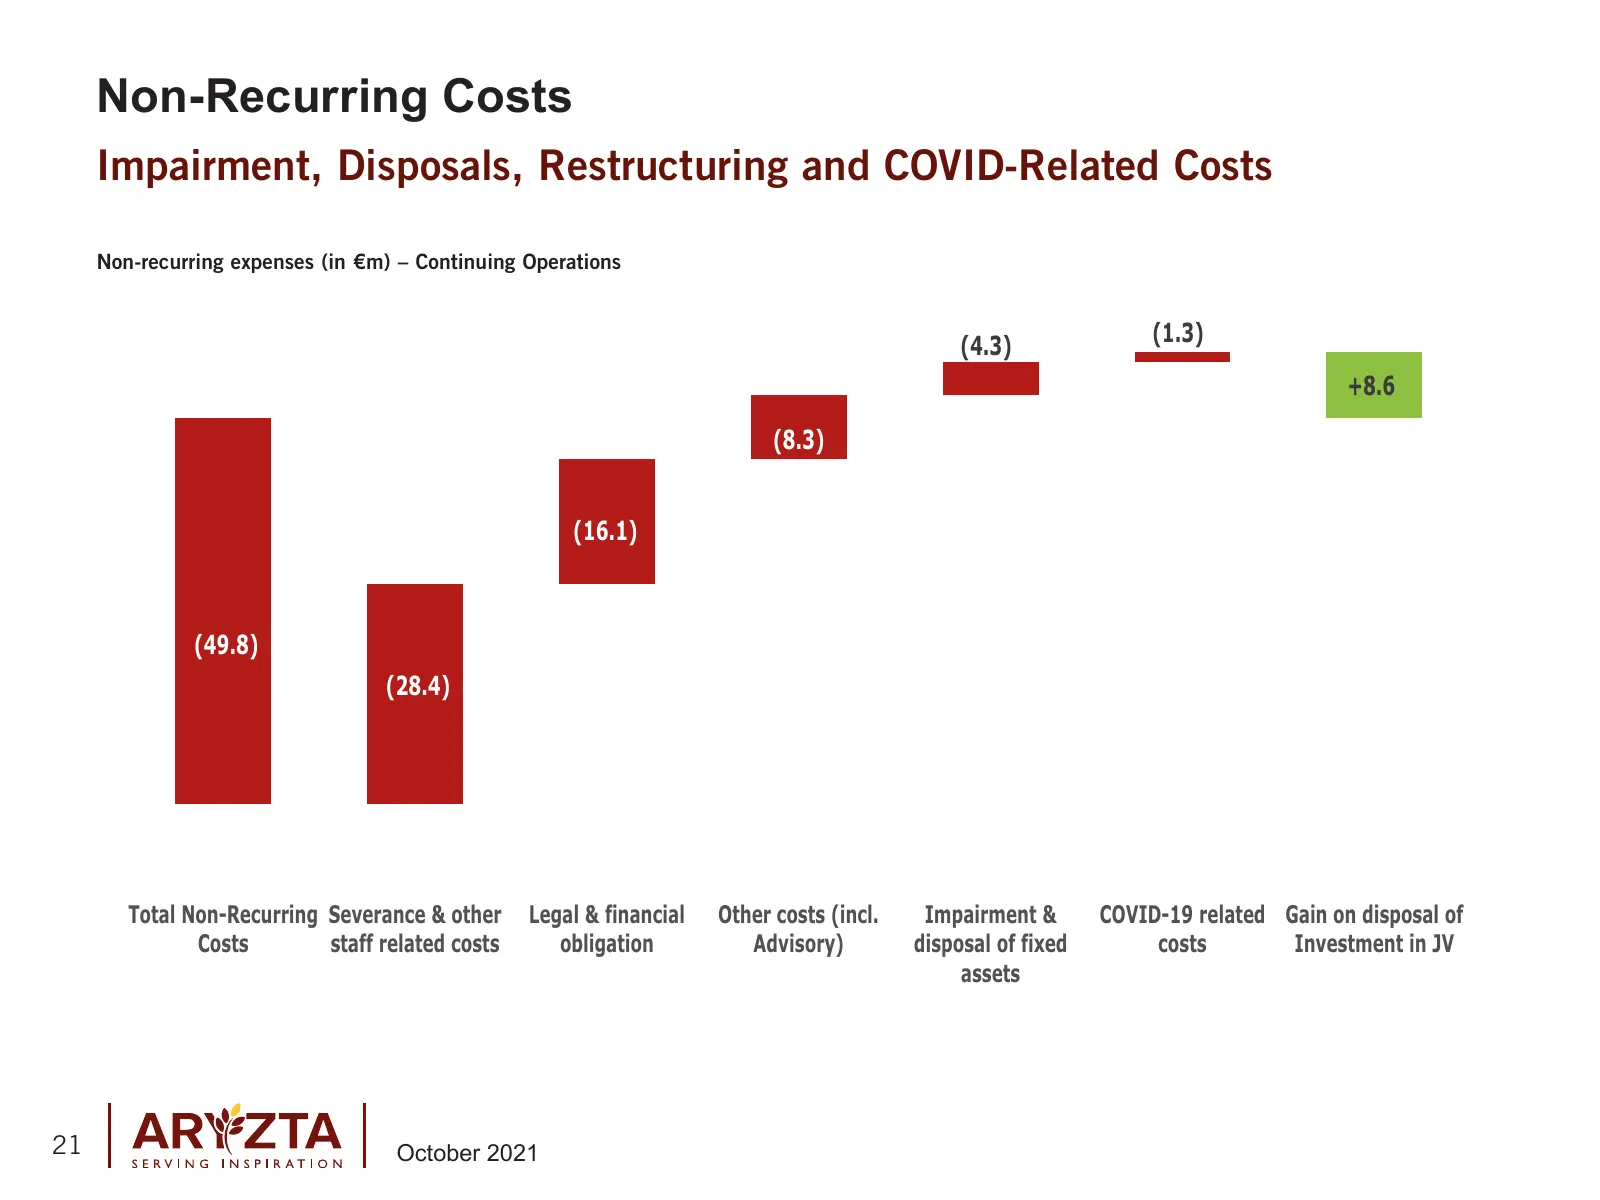
Non-Recurring Costs Impairment, Disposals, Restructuring and COVID-Related Costs Non-recurring expenses (in €m) – Continuing Operations (4.3) (1.3) +8.6 (8.3) (16.1) (49.8) (28.4) Total Non-Recurring Severance & other Legal & financial Other costs (incl. Impairment & COVID-19 related Gain on disposa
Slide 22: Working Capital Performance
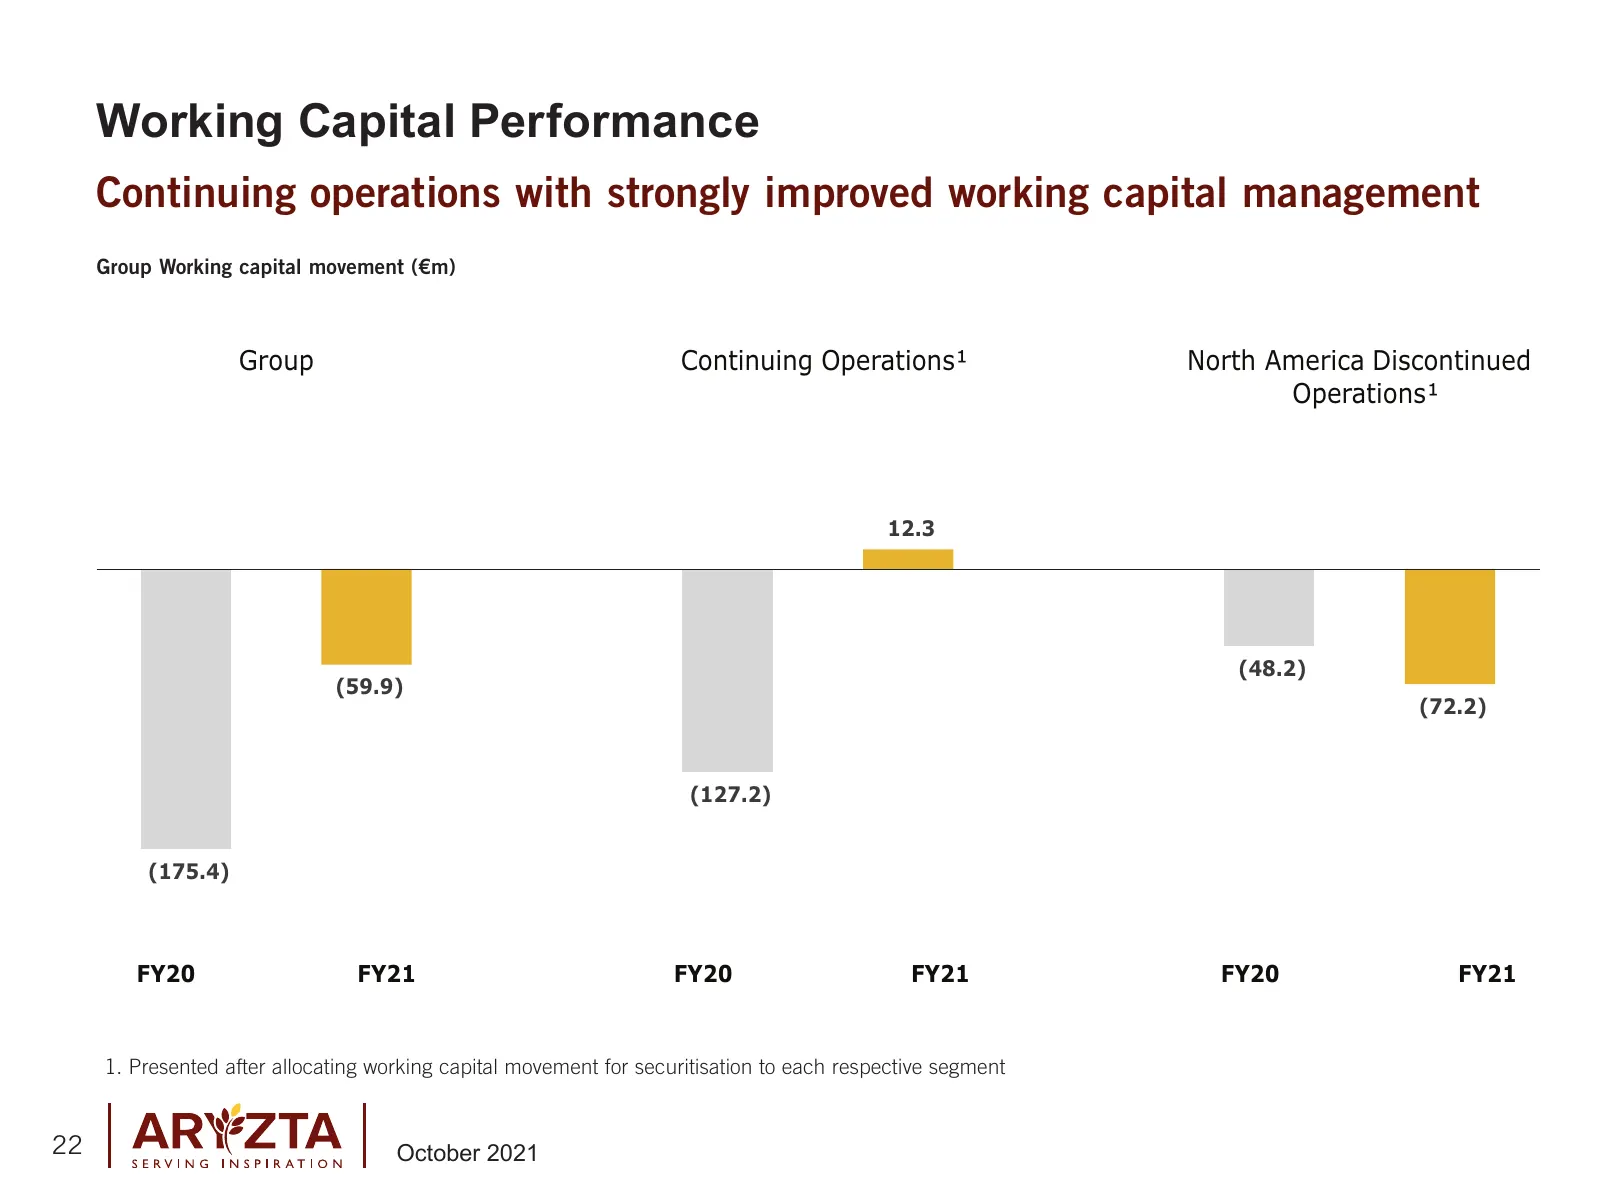
Working Capital Performance Continuing operations with strongly improved working capital management Group Working capital movement (€m) Group Continuing Operations¹ North America Discontinued Operations¹ 12.3 (48.2) (59.9) (72.2) (127.2) (175.4) FY20 FY21 FY20 FY21 FY20 FY21 1. Presented after alloc
Slide 23: Financial Summary
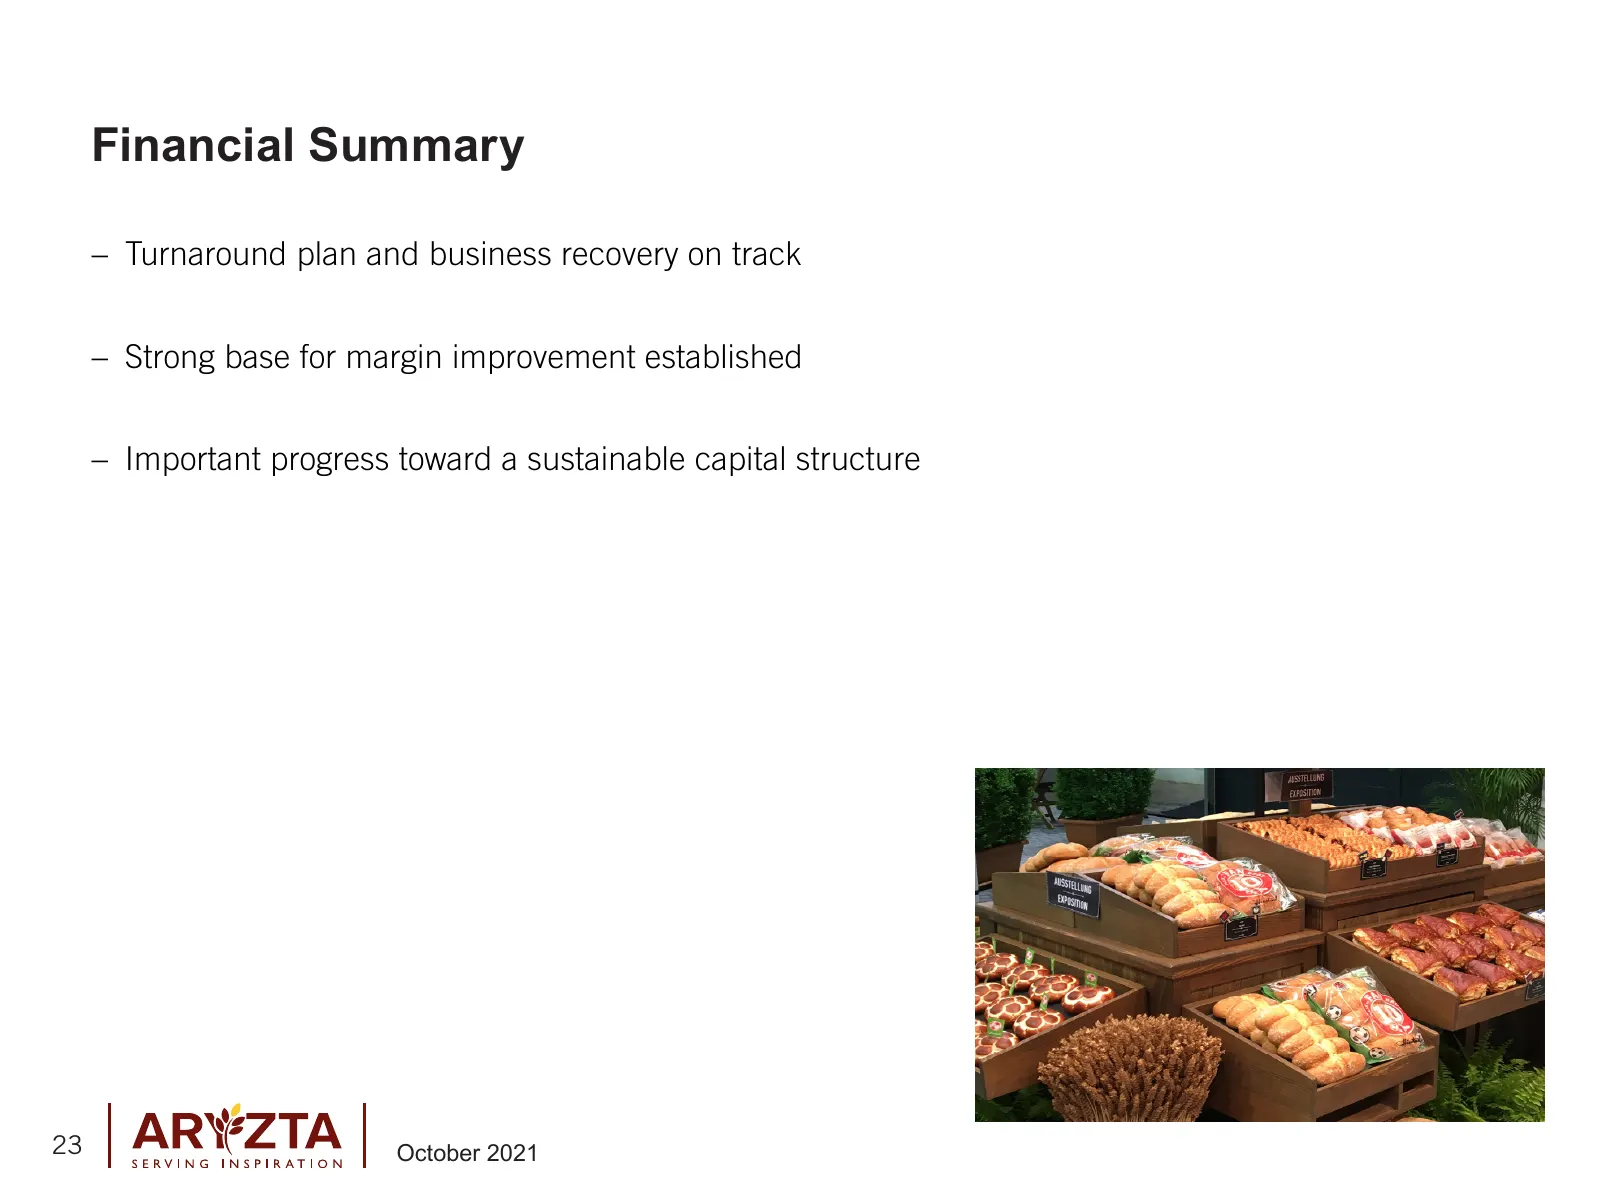
Financial Summary – Turnaround plan and business recovery on track – Strong base for margin improvement established – Important progress toward a sustainable capital structure 23 October 2021
Slide 24: Summary & Outlook
Summary & Outlook 24 October 2021
Slide 25: Value Creation Plan - Progress Update
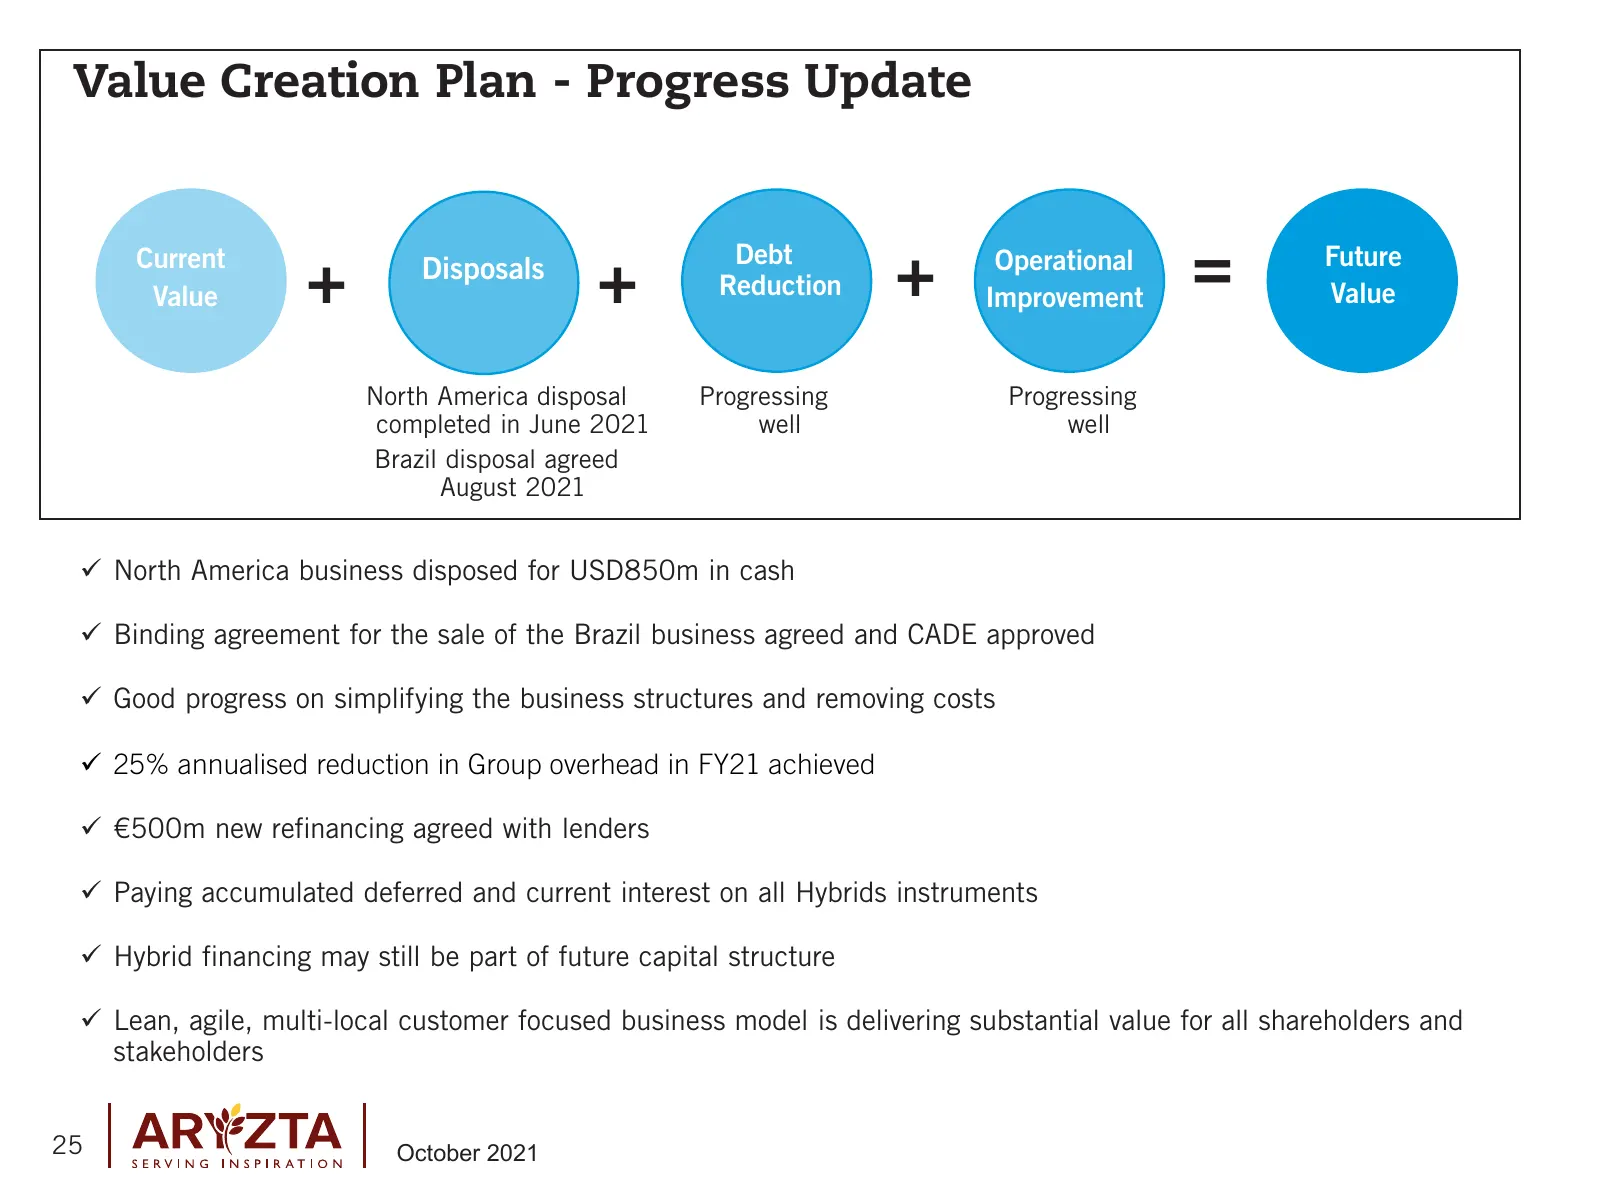
Value Creation Plan - Progress Update Current Value + Disposals + Debt Reduction + Operational Improvement = Future Value North America disposal Progressing Progressing completed in June 2021 well well Brazil disposal agreed August 2021 9 North America business disposed for USD850m in cash 9 Binding
Slide 26: Outlook
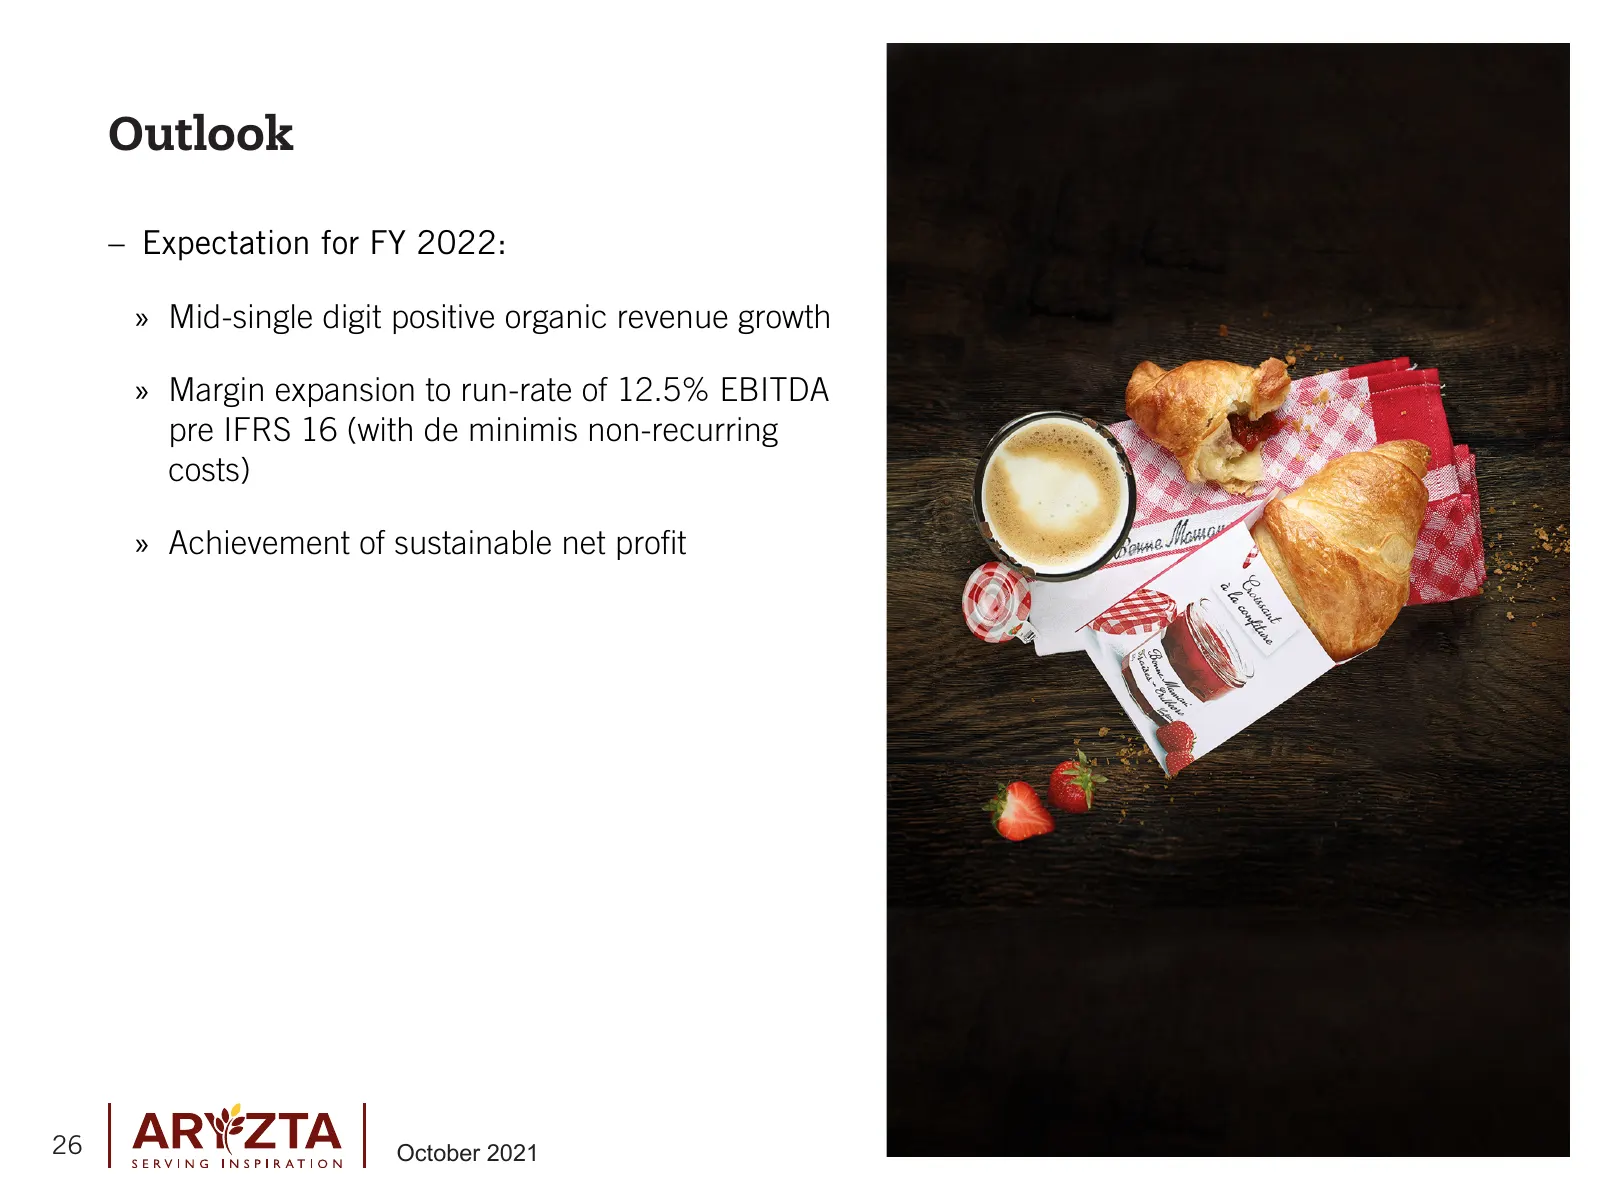
Outlook – Expectation for FY 2022: » Mid-single digit positive organic revenue growth » Margin expansion to run-rate of 12.5% EBITDA pre IFRS 16 (with de minimis non-recurring costs) » Achievement of sustainable net profit 26 October 2021

Slide 27: Appendix
o7 | ARWZTA SERVING INSPIRATION October 2021
Slide 28: ARYZTA Group Underlying Income Statement
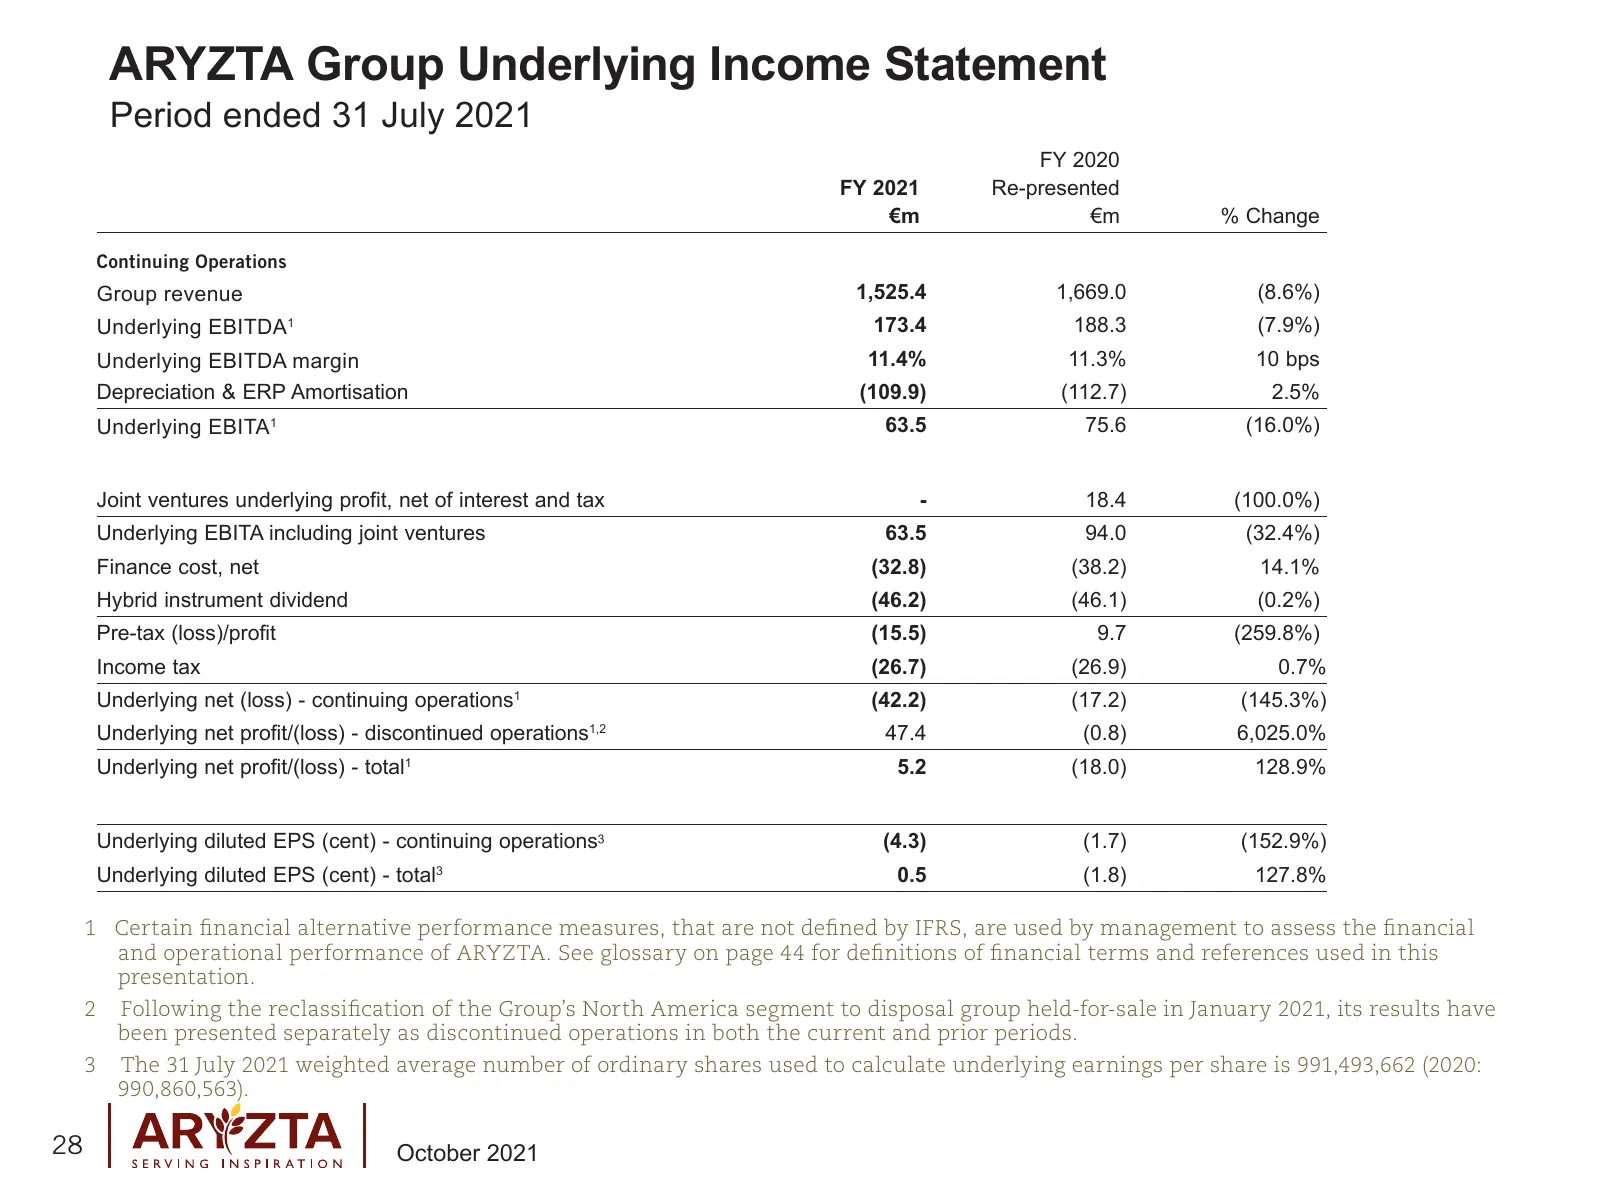
ARYZTA Group Underlying Income Statement Period ended 31 July 2021 FY 2020 FY 2021 Re-presented €m €m % Change Continuing Operations Group revenue 1,525.4 1,669.0 (8.6%) Underlying EBITDA 1 173.4 188.3 (7.9%) Underlying EBITDA margin 11.4% 11.3% 10 bps Depreciation & ERP Amortisation (109.9) (112.7)
Slide 29: Underlying Income Statement Reconciliation to IFRS
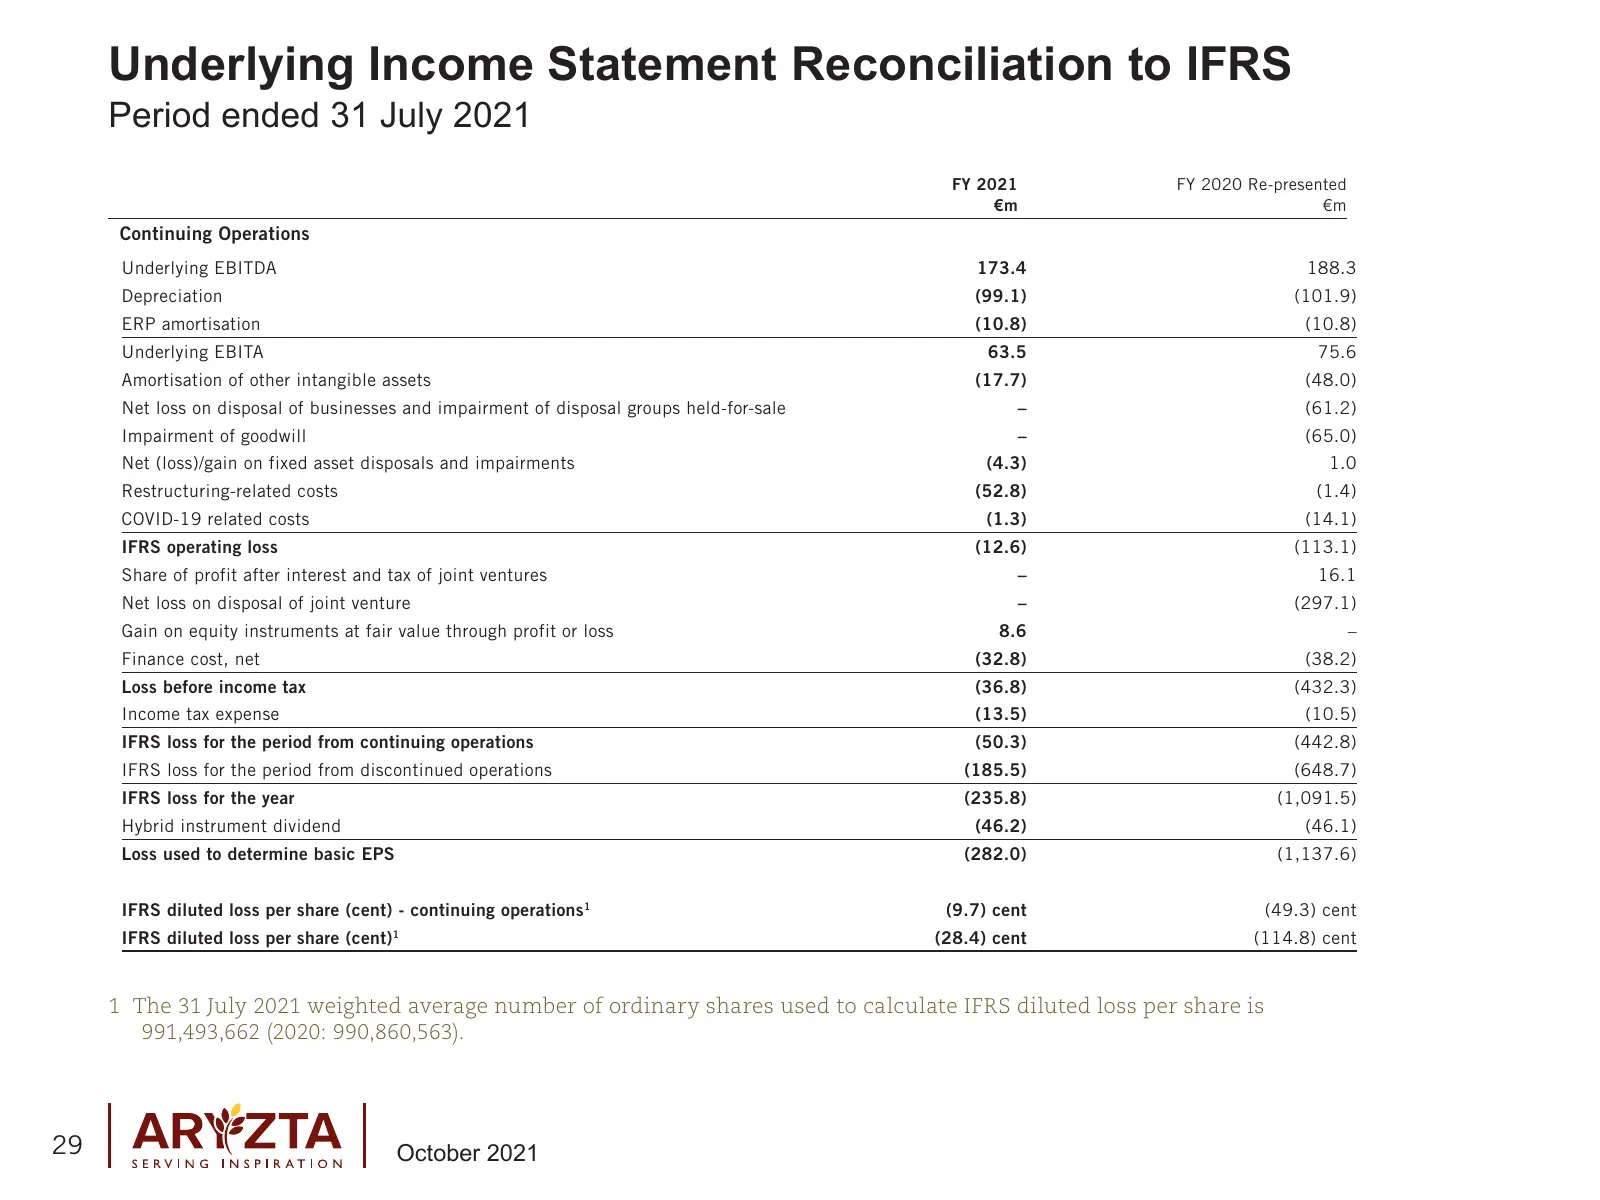
Underlying Income Statement Reconciliation to IFRS Period ended 31 July 2021 FY 2021 FY 2020 Re-presented €m €m Continuing Operations Underlying EBITDA 173.4 188.3 Depreciation (99.1) (101.9) ERP amortisation (10.8) (10.8) Underlying EBITA 63.5 75.6 Amortisation of other intangible assets (17.7) (48
Slide 30: Reconciliation of Underlying EBITDA to IFRS EBITDA
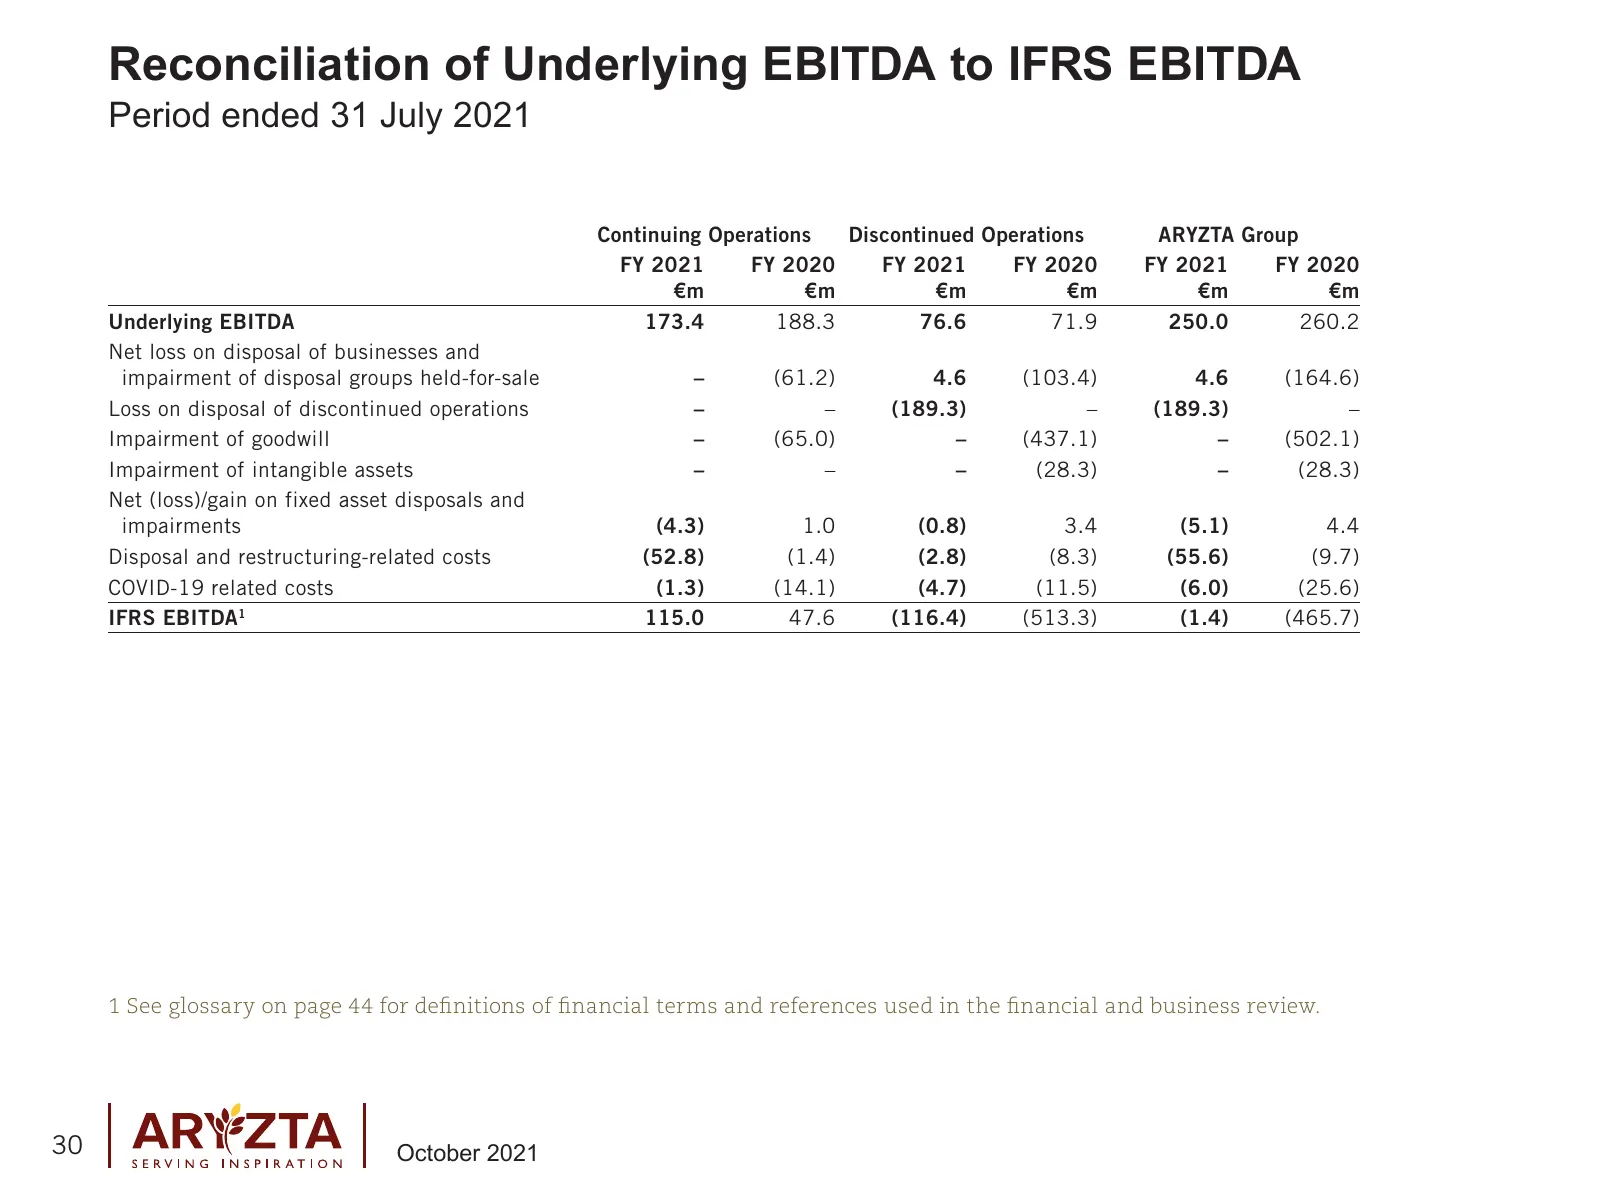
Reconciliation of Underlying EBITDA to IFRS EBITDA Period ended 31 July 2021 Continuing Operations Discontinued Operations ARYZTA Group FY 2021 FY 2020 FY 2021 FY 2020 FY 2021 FY 2020 €m €m €m €m €m €m Underlying EBITDA 173.4 188.3 76.6 71.9 250.0 260.2 Net loss on disposal of businesses and impairm
Slide 31: Organic revenue
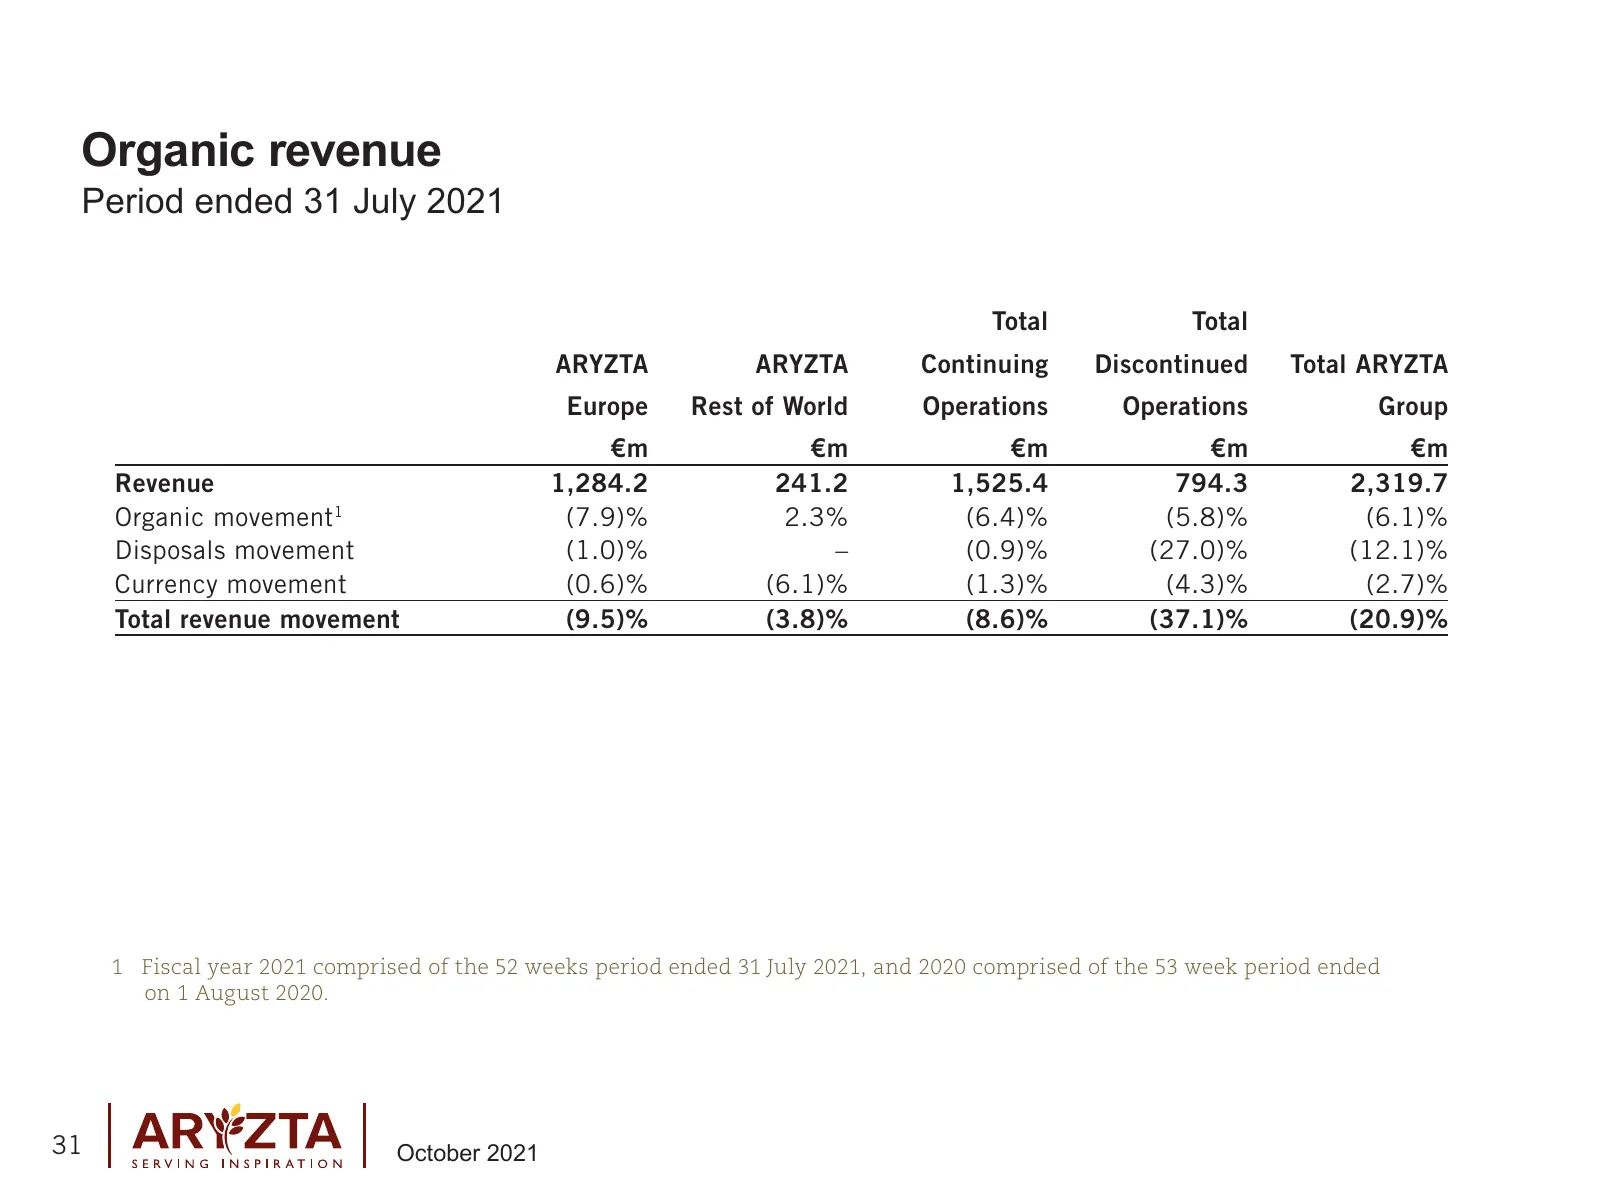
Organic revenue Period ended 31 July 2021 Total Total ARYZTA ARYZTA Continuing Discontinued Total ARYZTA Europe Rest of World Operations Operations Group €m €m €m €m €m Revenue 1,284.2 241.2 1,525.4 794.3 2,319.7 Organic movement1 (7.9)% 2.3% (6.4)% (5.8)% (6.1)% Disposals movement (1.0)% – (0.9)% (
Slide 32: Quarterly Organic revenue
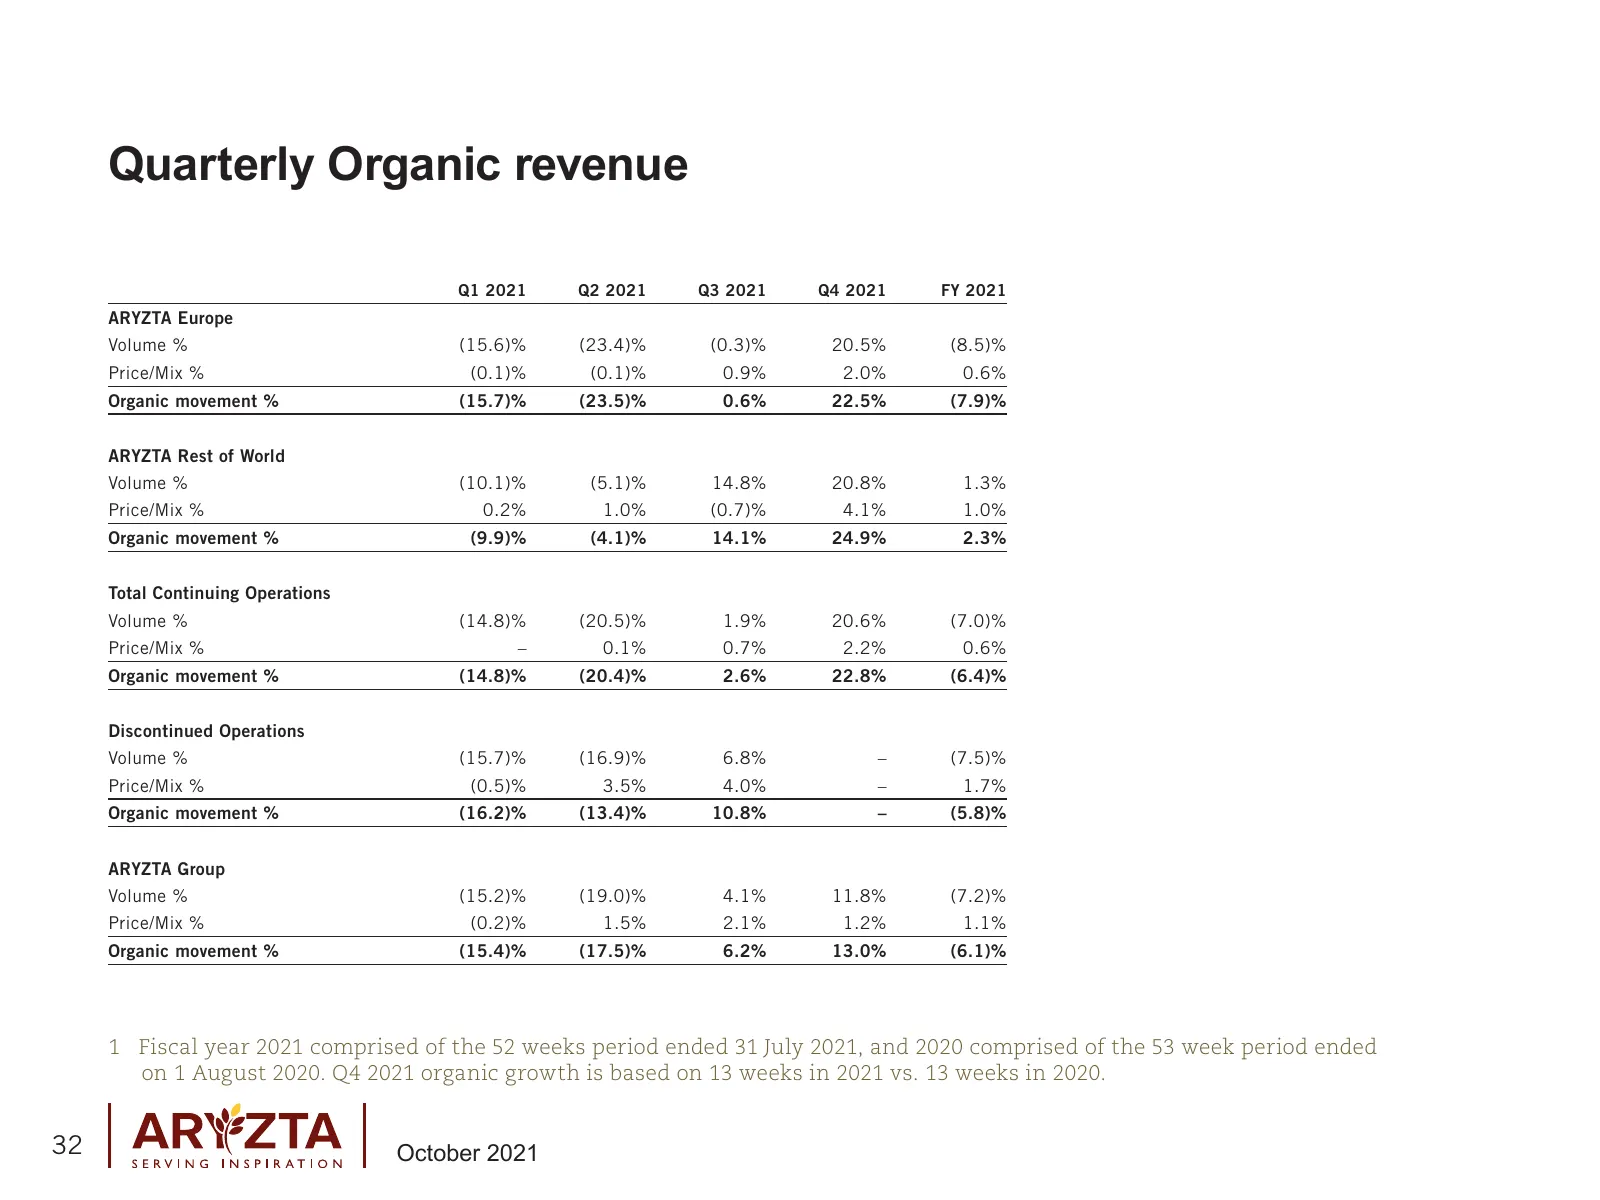
Quarterly Organic revenue Q1 2021 Q2 2021 Q3 2021 Q4 2021 FY 2021 ARYZTA Europe Volume % (15.6)% (23.4)% (0.3)% 20.5% (8.5)% Price/Mix % (0.1)% (0.1)% 0.9% 2.0% 0.6% Organic movement % (15.7)% (23.5)% 0.6% 22.5% (7.9)% ARYZTA Rest of World Volume % (10.1)% (5.1)% 14.8% 20.8% 1.3% Price/Mix % 0.2% 1.
Slide 33: Segmental Underlying EBITDA
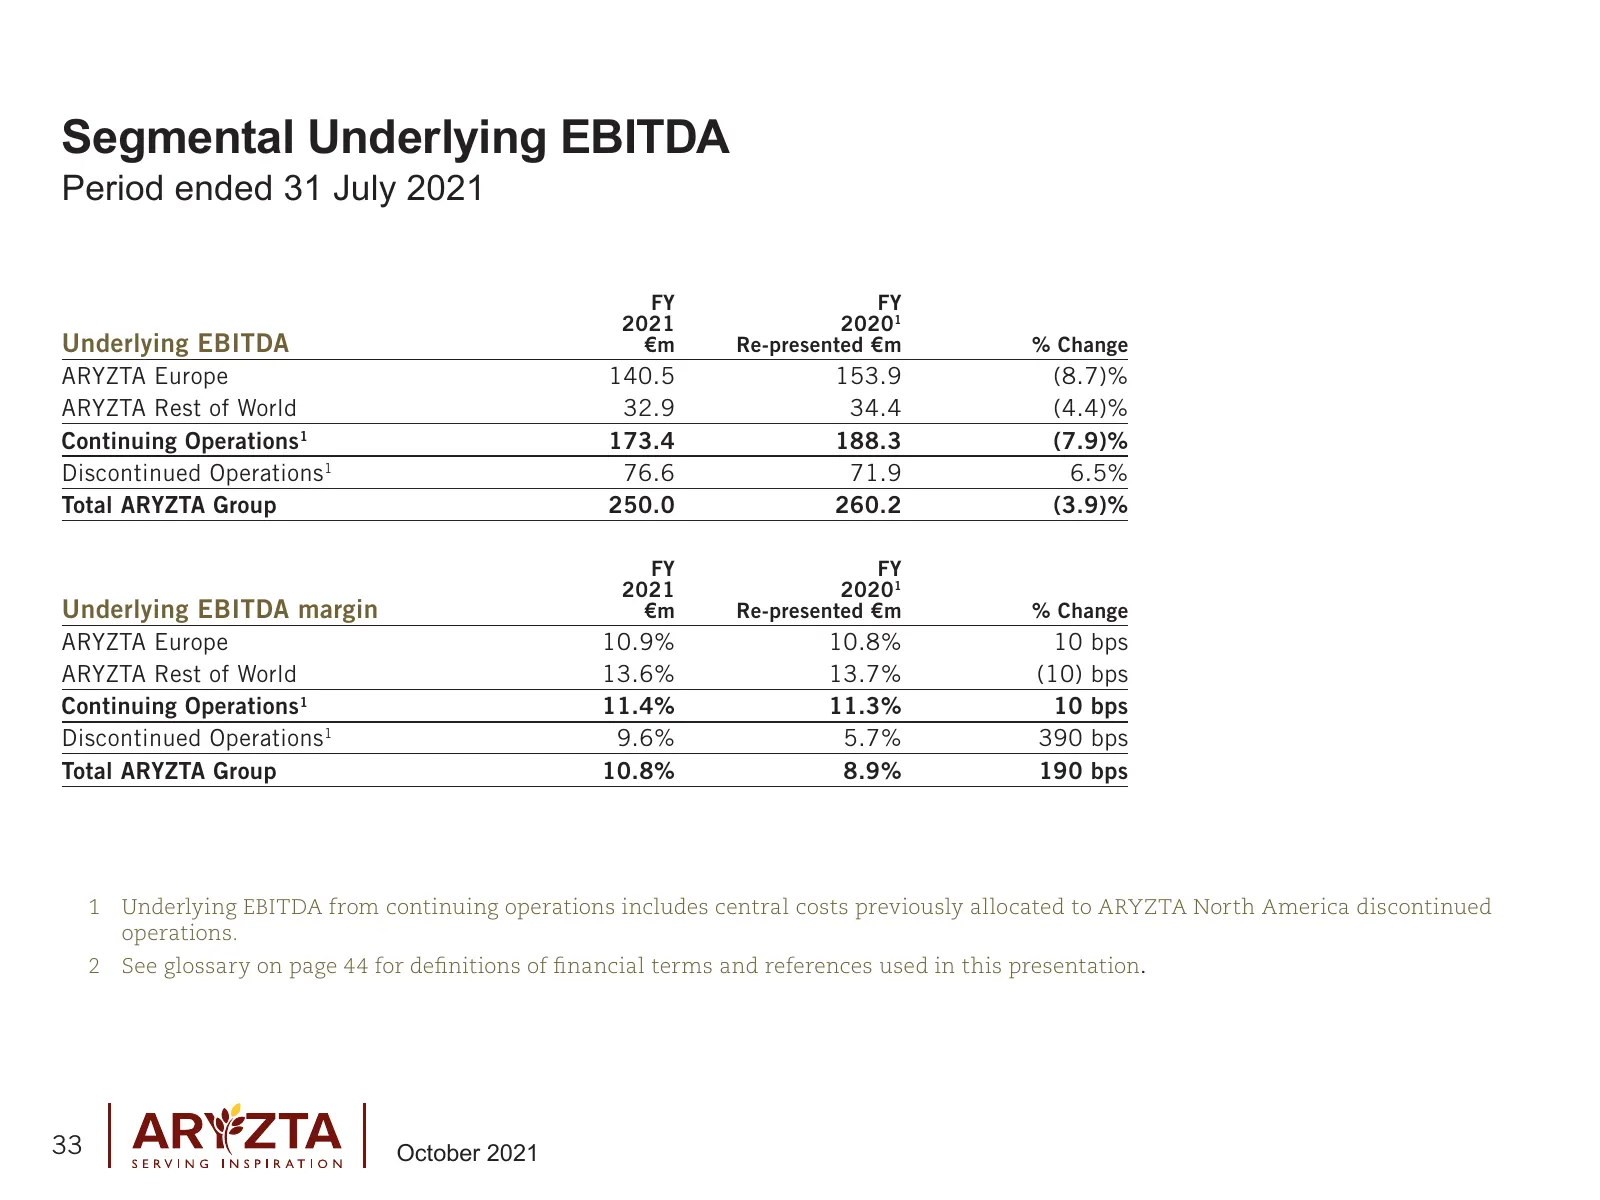
Segmental Underlying EBITDA Period ended 31 July 2021 FY FY 2021 20201 Underlying EBITDA €m Re-presented €m % Change ARYZTA Europe 140.5 153.9 (8.7)% ARYZTA Rest of World 32.9 34.4 (4.4)% Continuing Operations1 173.4 188.3 (7.9)% Discontinued Operations1 76.6 71.9 6.5% Total ARYZTA Group 250.0 260.2
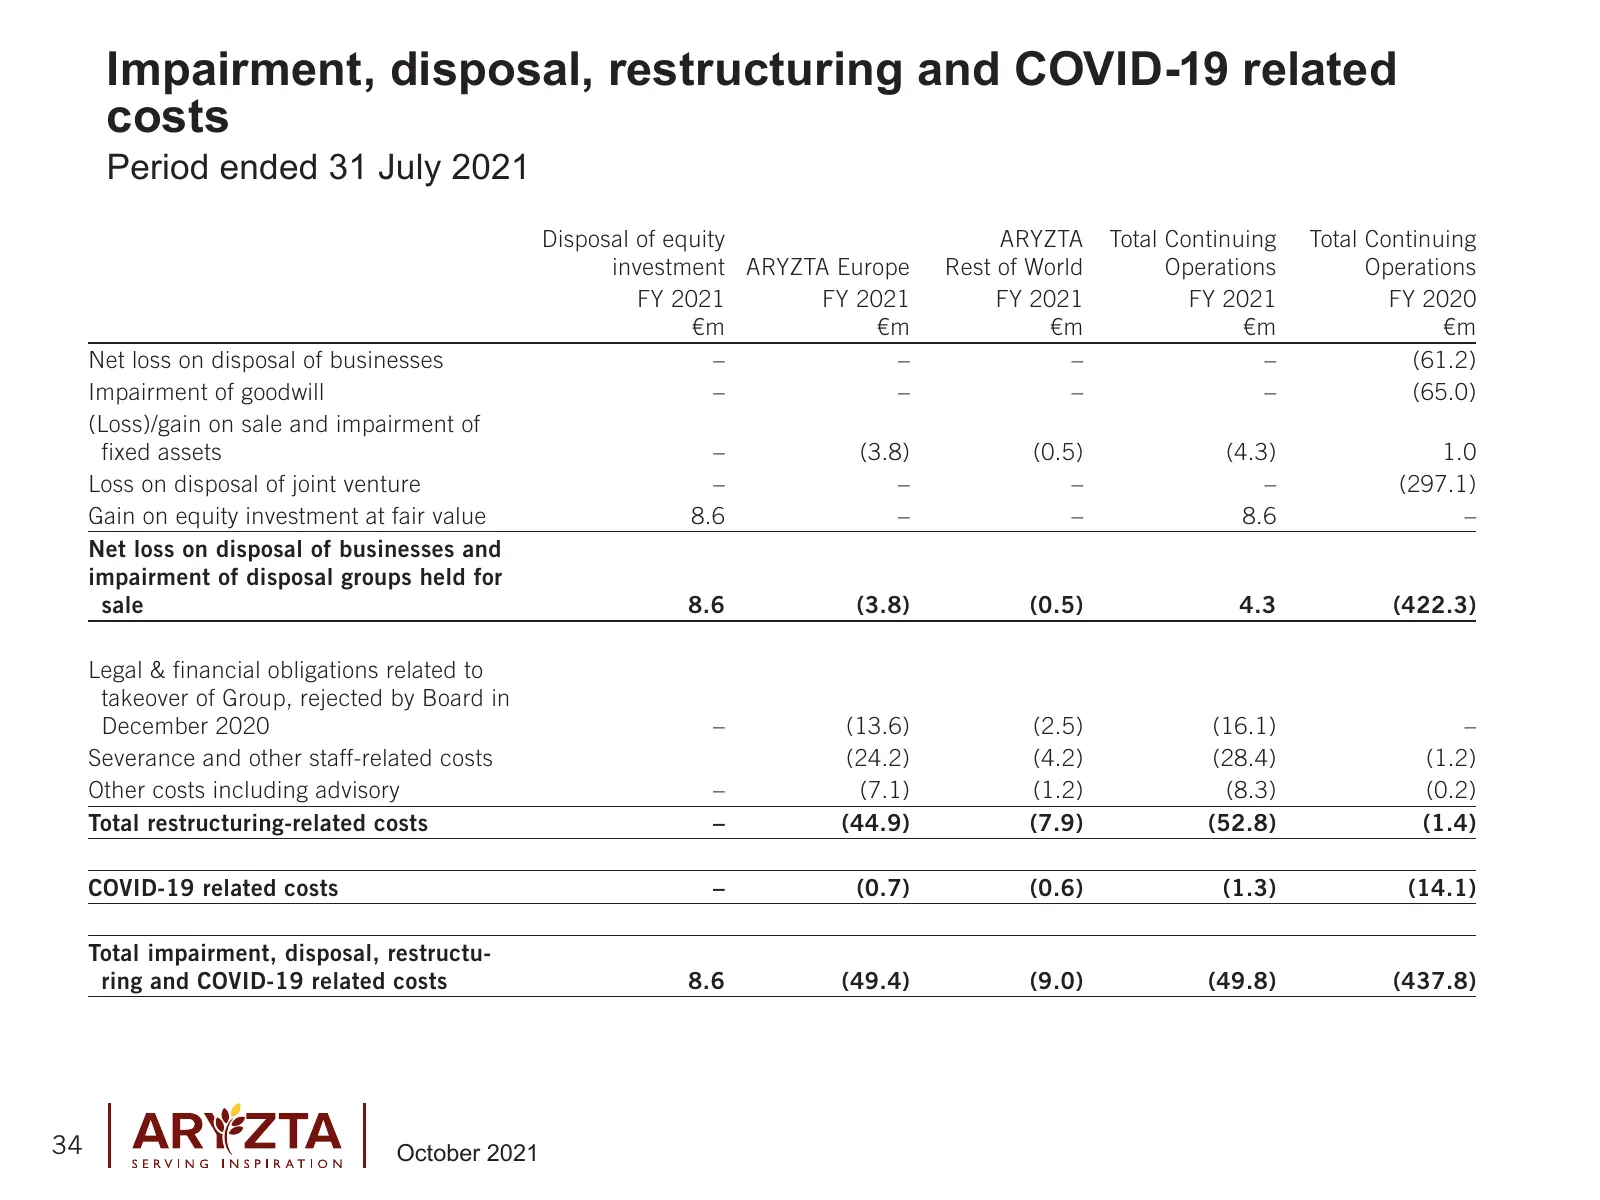
Slide 34: Impairment, disposal, restructuring and COVID-19 related costs
Impairment, disposal, restructuring and COVID-19 related costs Period ended 31 July 2021 Disposal of equity ARYZTA Total Continuing Total Continuing investment ARYZTA Europe Rest of World Operations Operations FY 2021 FY 2021 FY 2021 FY 2021 FY 2020 €m €m €m €m €m Net loss on disposal of businesses
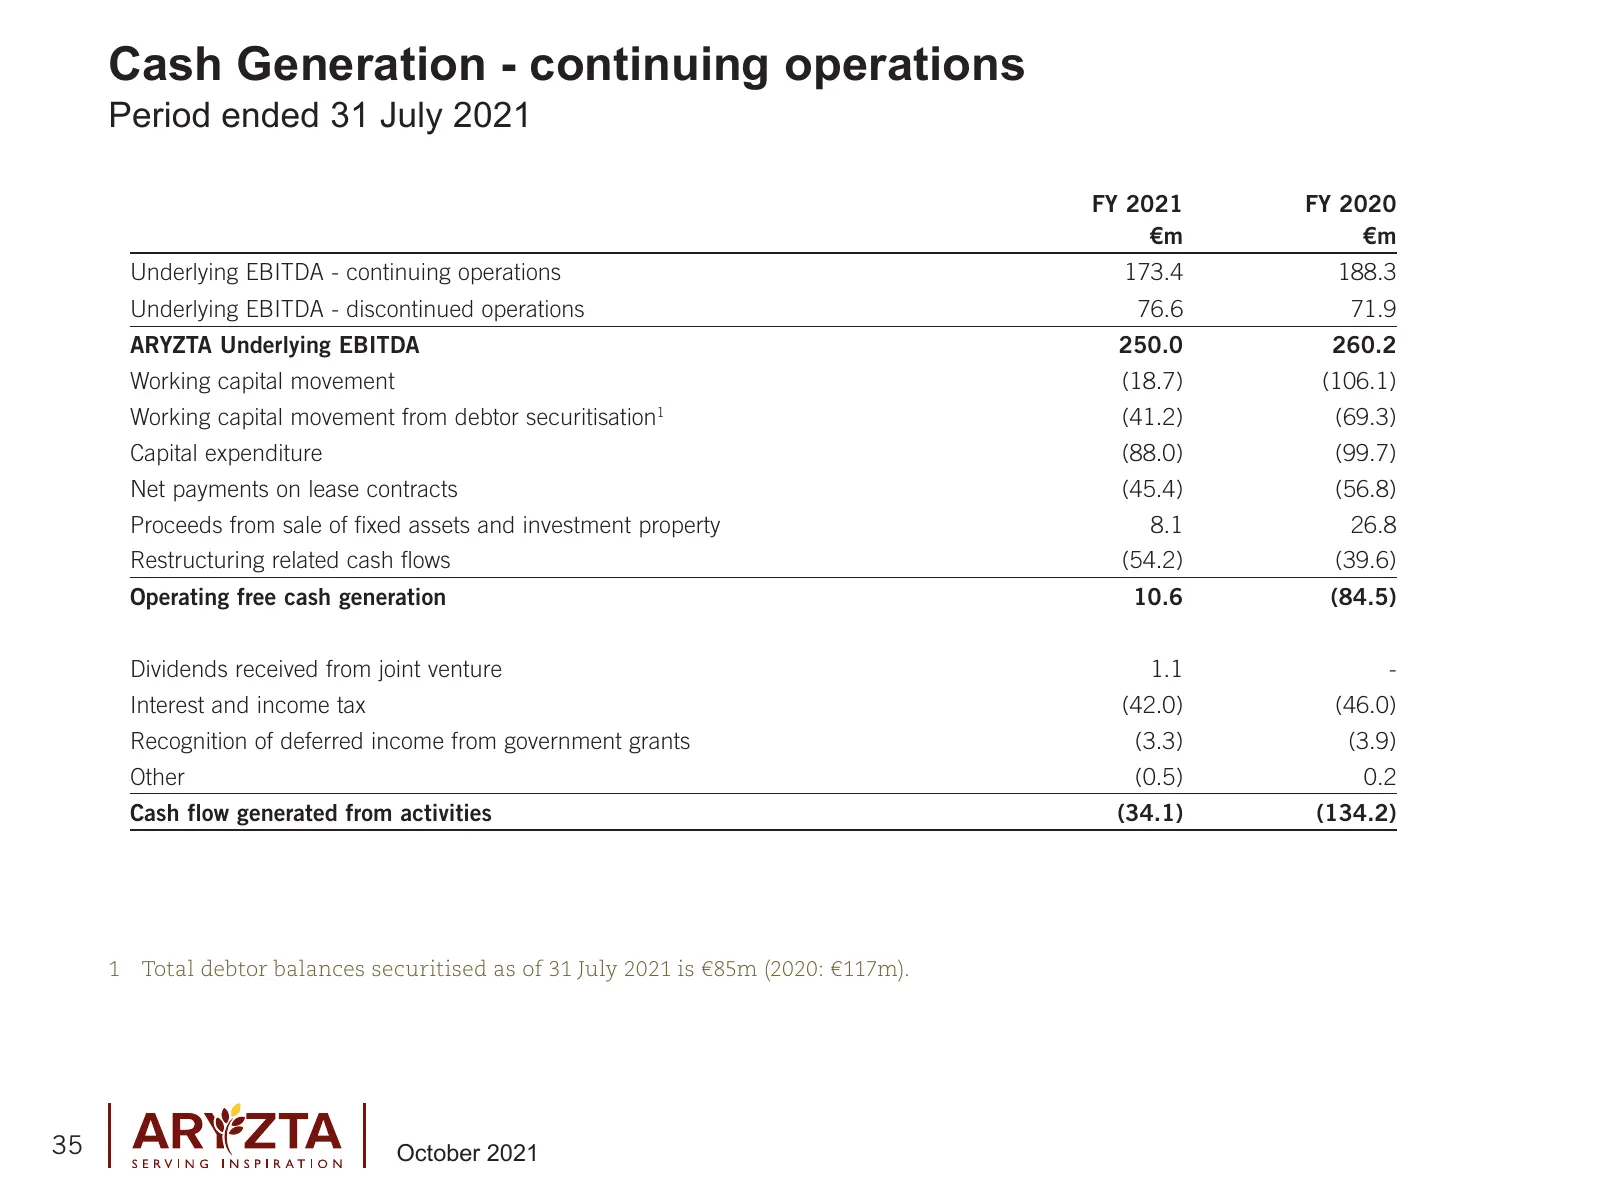
Slide 35: Cash Generation - continuing operations
Cash Generation - continuing operations Period ended 31 July 2021 FY 2021 FY 2020 €m €m Underlying EBITDA - continuing operations 173.4 188.3 Underlying EBITDA - discontinued operations 76.6 71.9 ARYZTA Underlying EBITDA 250.0 260.2 Working capital movement (18.7) (106.1) Working capital movement fr
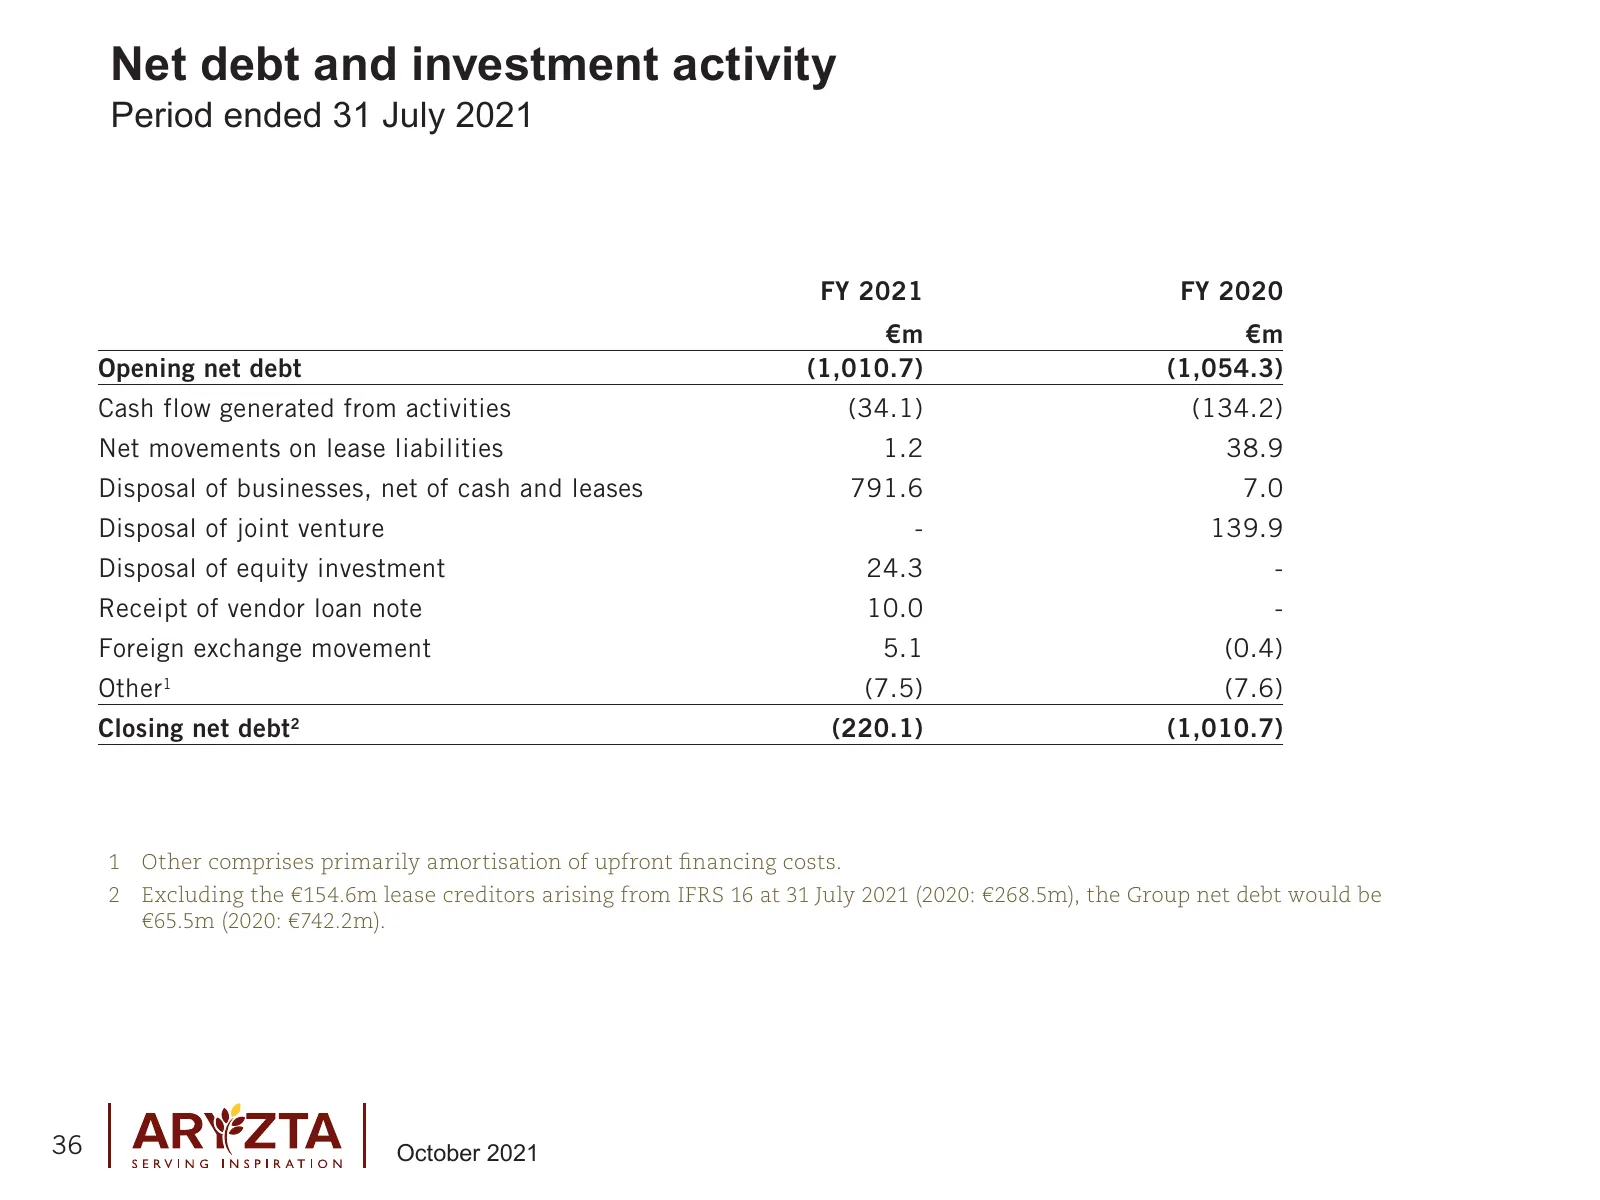
Slide 36: Net debt and investment activity
Net debt and investment activity Period ended 31 July 2021 FY 2021 FY 2020 €m €m Opening net debt (1,010.7) (1,054.3) Cash flow generated from activities (34.1) (134.2) Net movements on lease liabilities 1.2 38.9 Disposal of businesses, net of cash and leases 791.6 7.0 Disposal of joint venture - 13
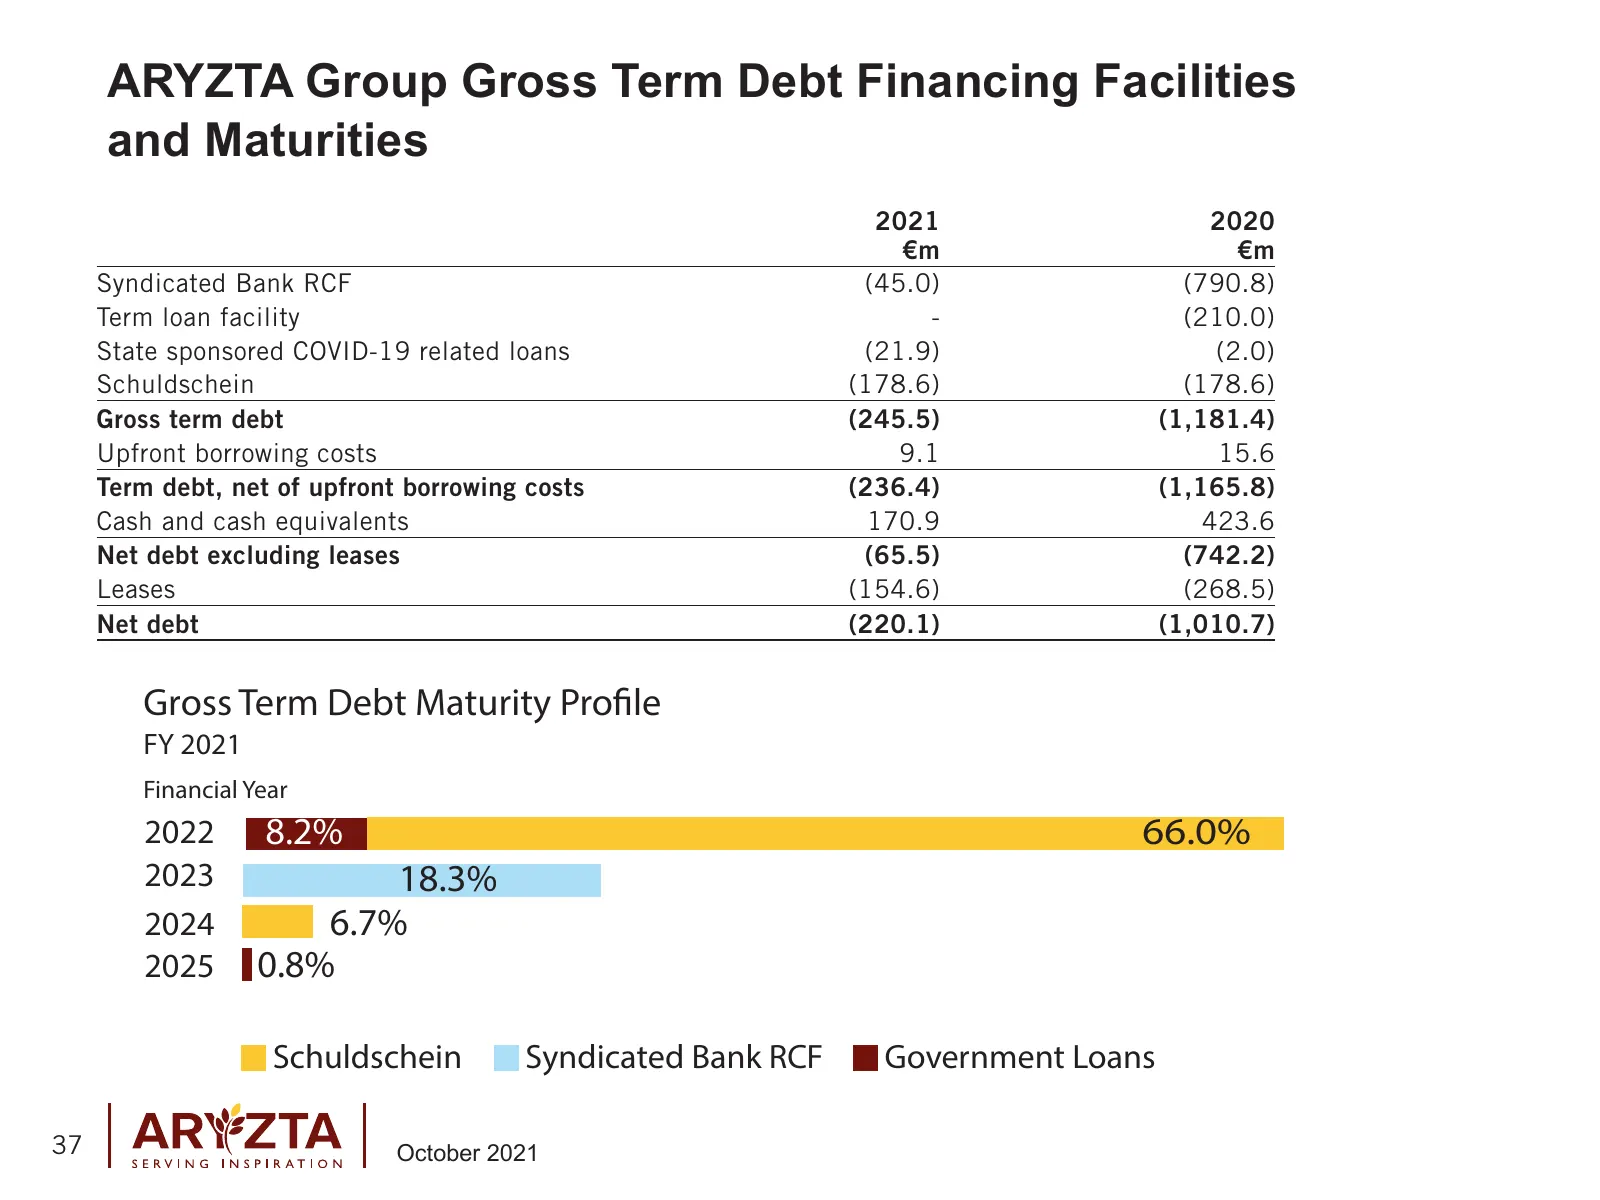
Slide 37: ARYZTA Group Gross Term Debt Financing Facilities and Maturities
ARYZTA Group Gross Term Debt Financing Facilities and Maturities 2021 2020 €m €m Syndicated Bank RCF (45.0) (790.8) Term loan facility - (210.0) State sponsored COVID-19 related loans (21.9) (2.0) Schuldschein (178.6) (178.6) Gross term debt (245.5) (1,181.4) Upfront borrowing costs 9.1 15.6 Term de
Slide 38: Covenants
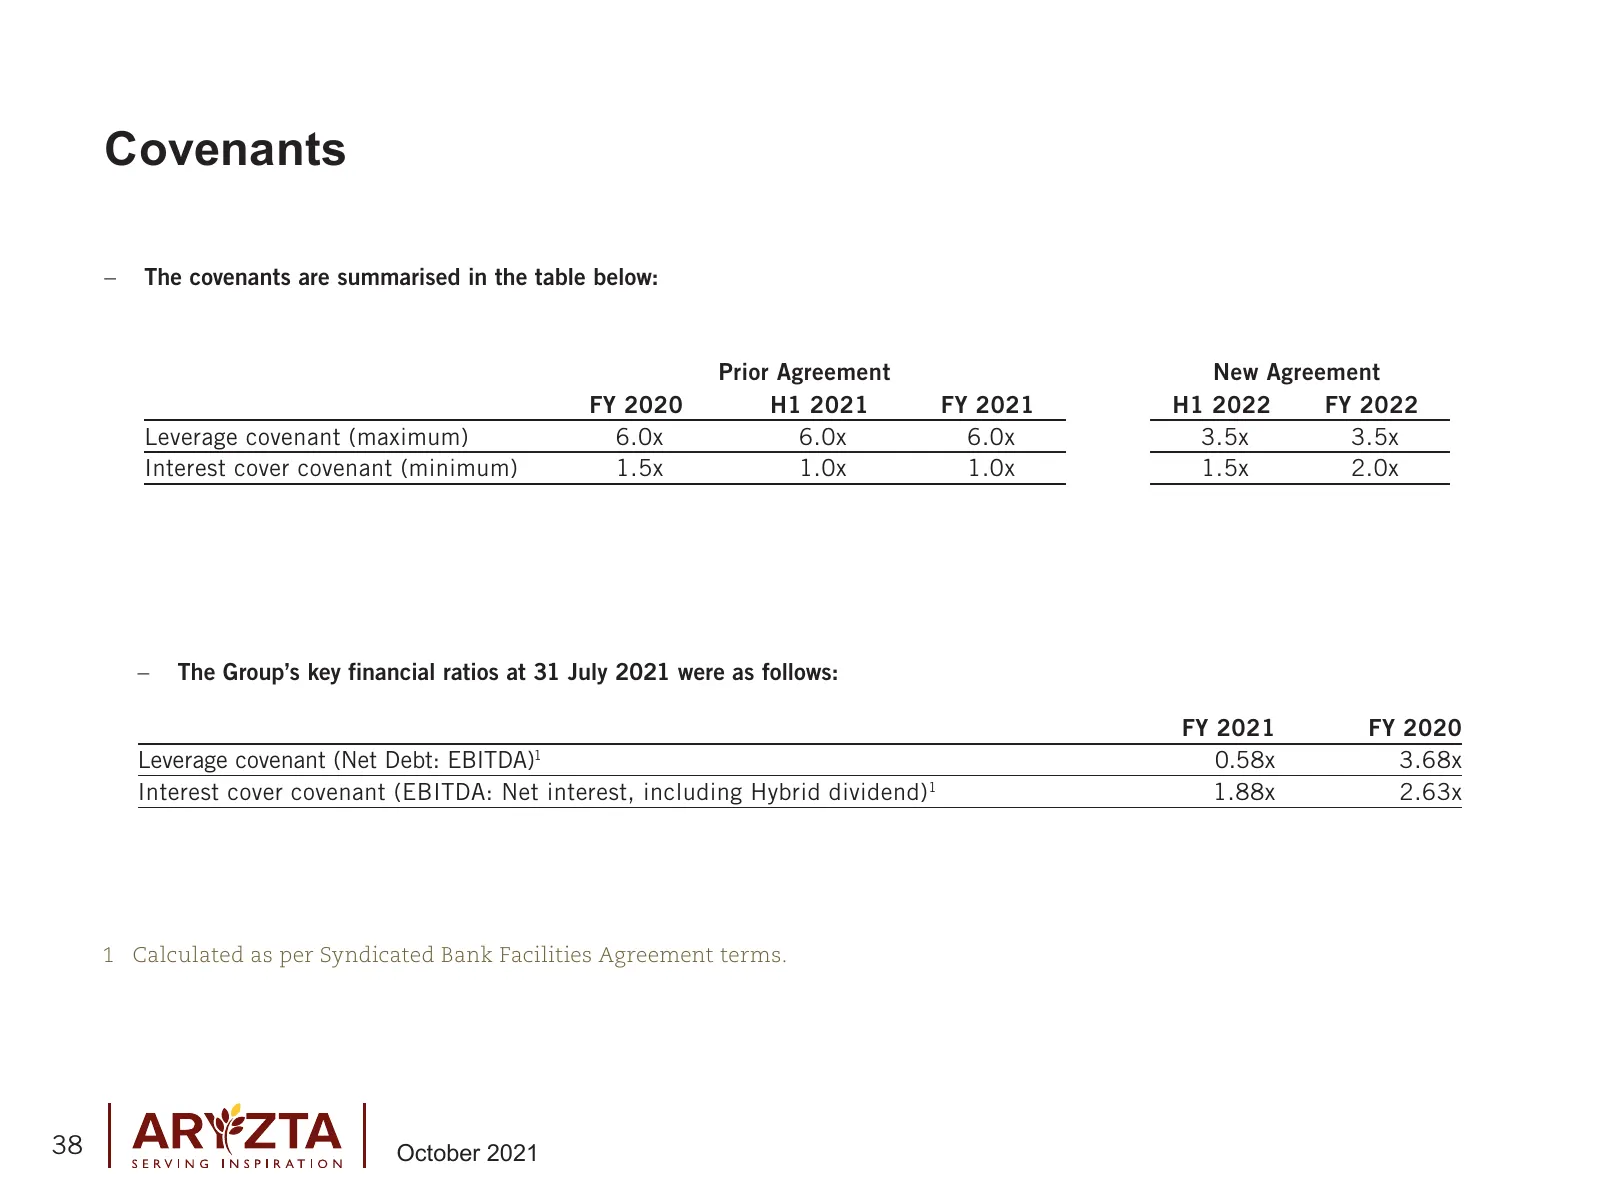
Covenants – The covenants are summarised in the table below: Prior Agreement New Agreement FY 2020 H1 2021 FY 2021 H1 2022 FY 2022 Leverage covenant (maximum) 6.0x 6.0x 6.0x 3.5x 3.5x Interest cover covenant (minimum) 1.5x 1.0x 1.0x 1.5x 2.0x – The Group’s key financial ratios at 31 July 2021 were a
Slide 39: Hybrid Funding
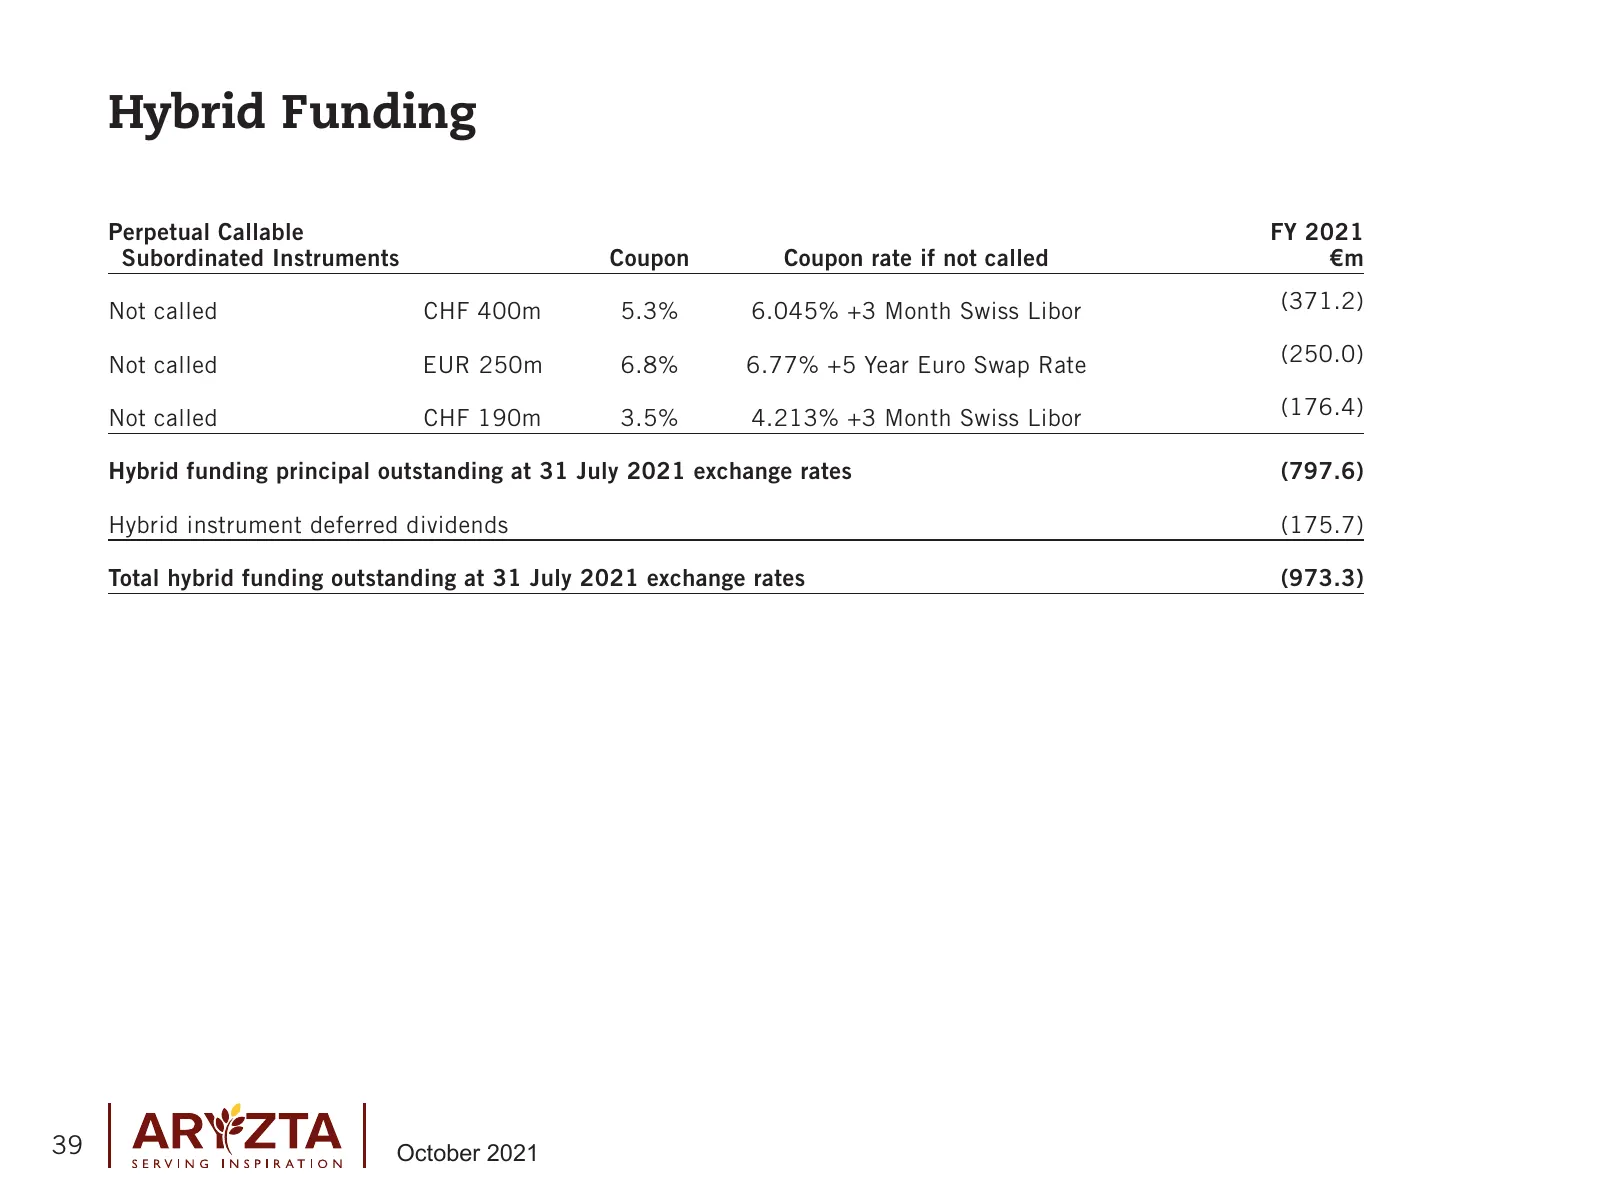
Hybrid Funding Perpetual Callable FY 2021 Subordinated Instruments Coupon Coupon rate if not called €m Not called CHF 400m 5.3% 6.045% +3 Month Swiss Libor (371.2) Not called EUR 250m 6.8% 6.77% +5 Year Euro Swap Rate (250.0) Not called CHF 190m 3.5% 4.213% +3 Month Swiss Libor (176.4) Hybrid fundin
Slide 40: Hybrid Payment Strategy
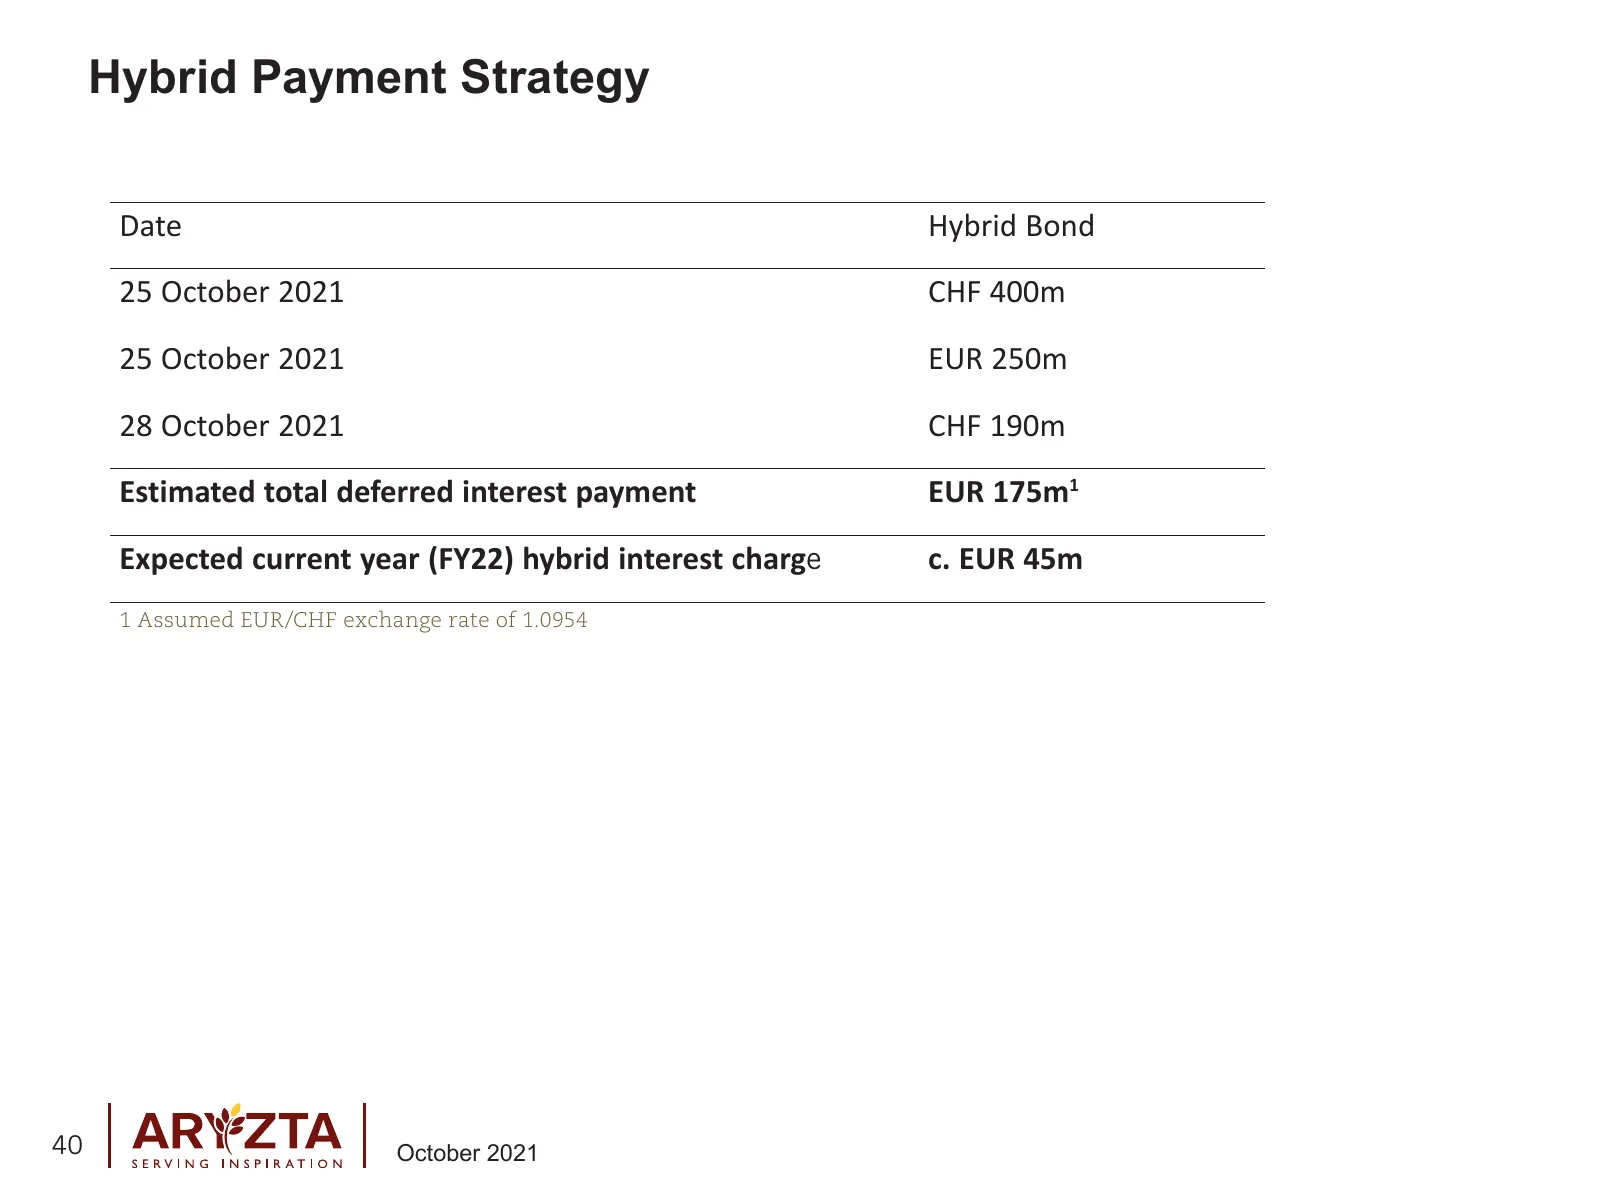
Hybrid Payment Strategy Date Hybrid Bond 25 October 2021 CHF 400m 25 October 2021 EUR 250m 28 October 2021 CHF 190m Estimated total deferred interest payment EUR 175m1 Expected current year (FY22) hybrid interest charge c. EUR 45m 1 Assumed EUR/CHF exchange rate of 1.0954 40 October 2021
Slide 41: EUR Closing and Average FX Rates
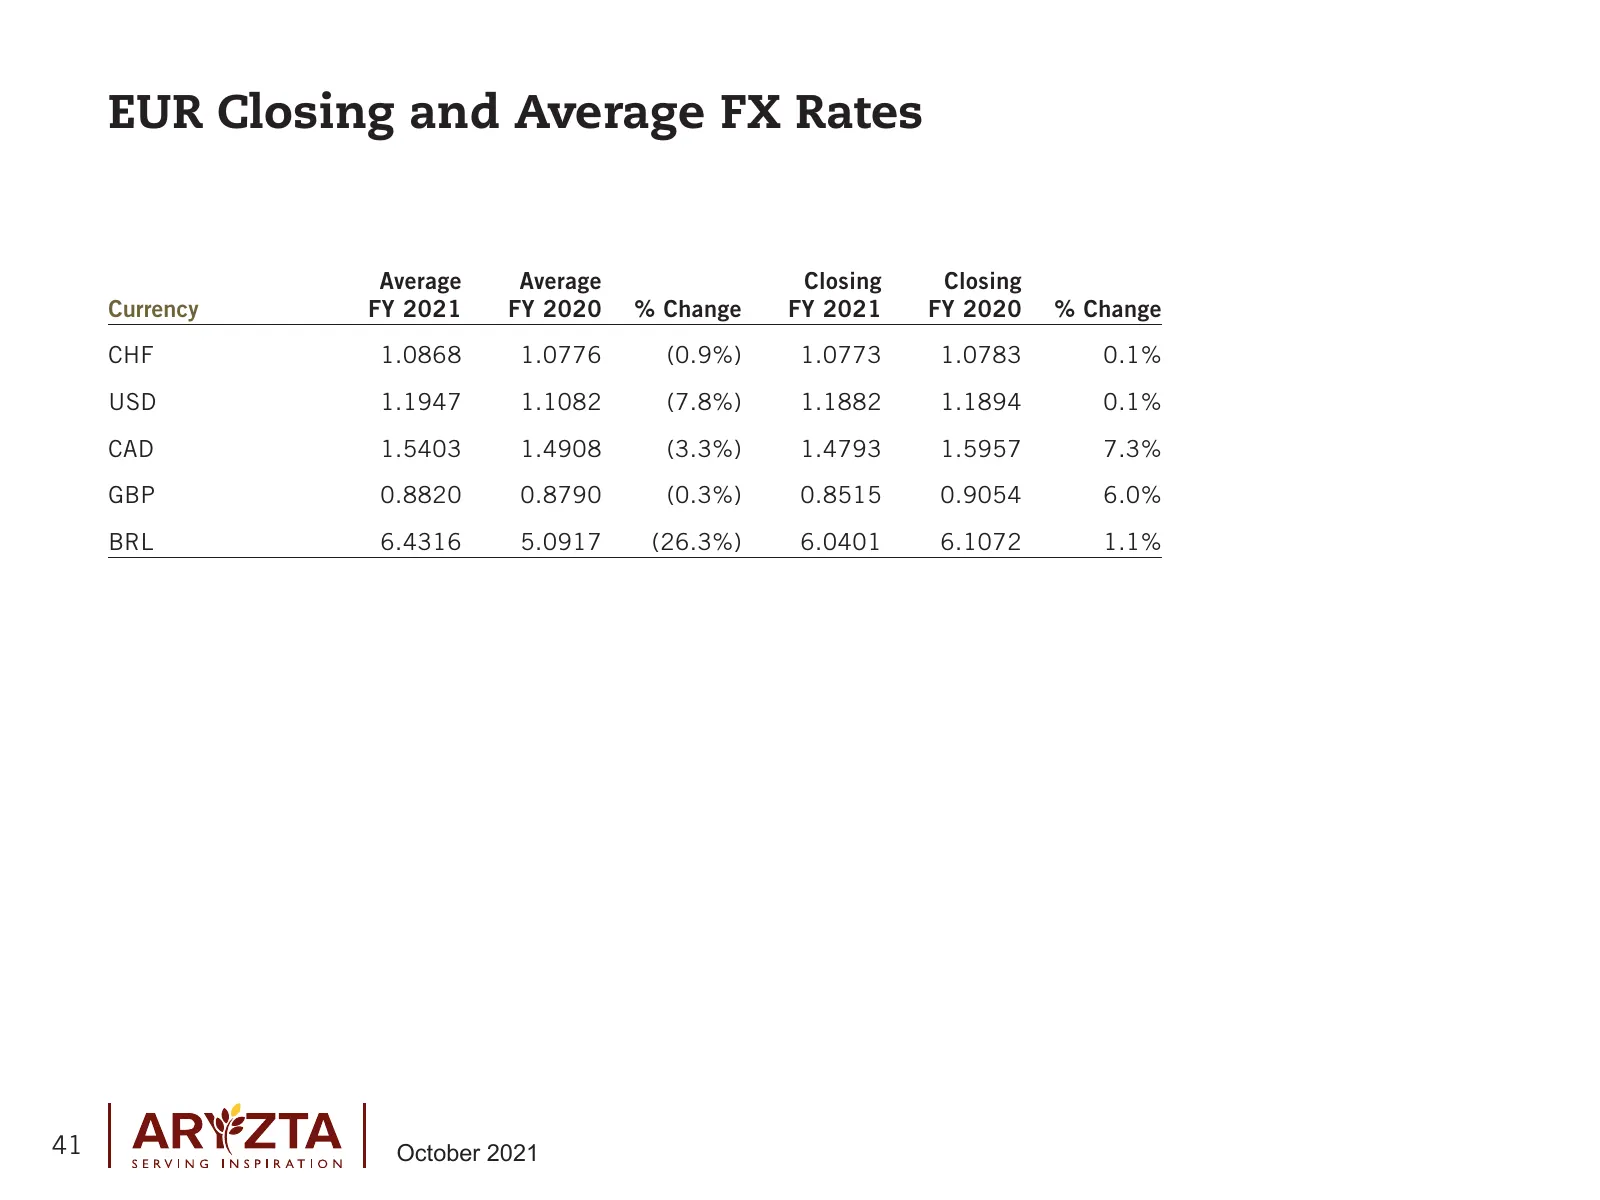
EUR Closing and Average FX Rates Average Average Closing Closing Currency FY 2021 FY 2020 % Change FY 2021 FY 2020 % Change CHF 1.0868 1.0776 (0.9%) 1.0773 1.0783 0.1% USD 1.1947 1.1082 (7.8%) 1.1882 1.1894 0.1% CAD 1.5403 1.4908 (3.3%) 1.4793 1.5957 7.3% GBP 0.8820 0.8790 (0.3%) 0.8515 0.9054 6.0%
Slide 42: ARYZTA Group – Return on Invested Capital
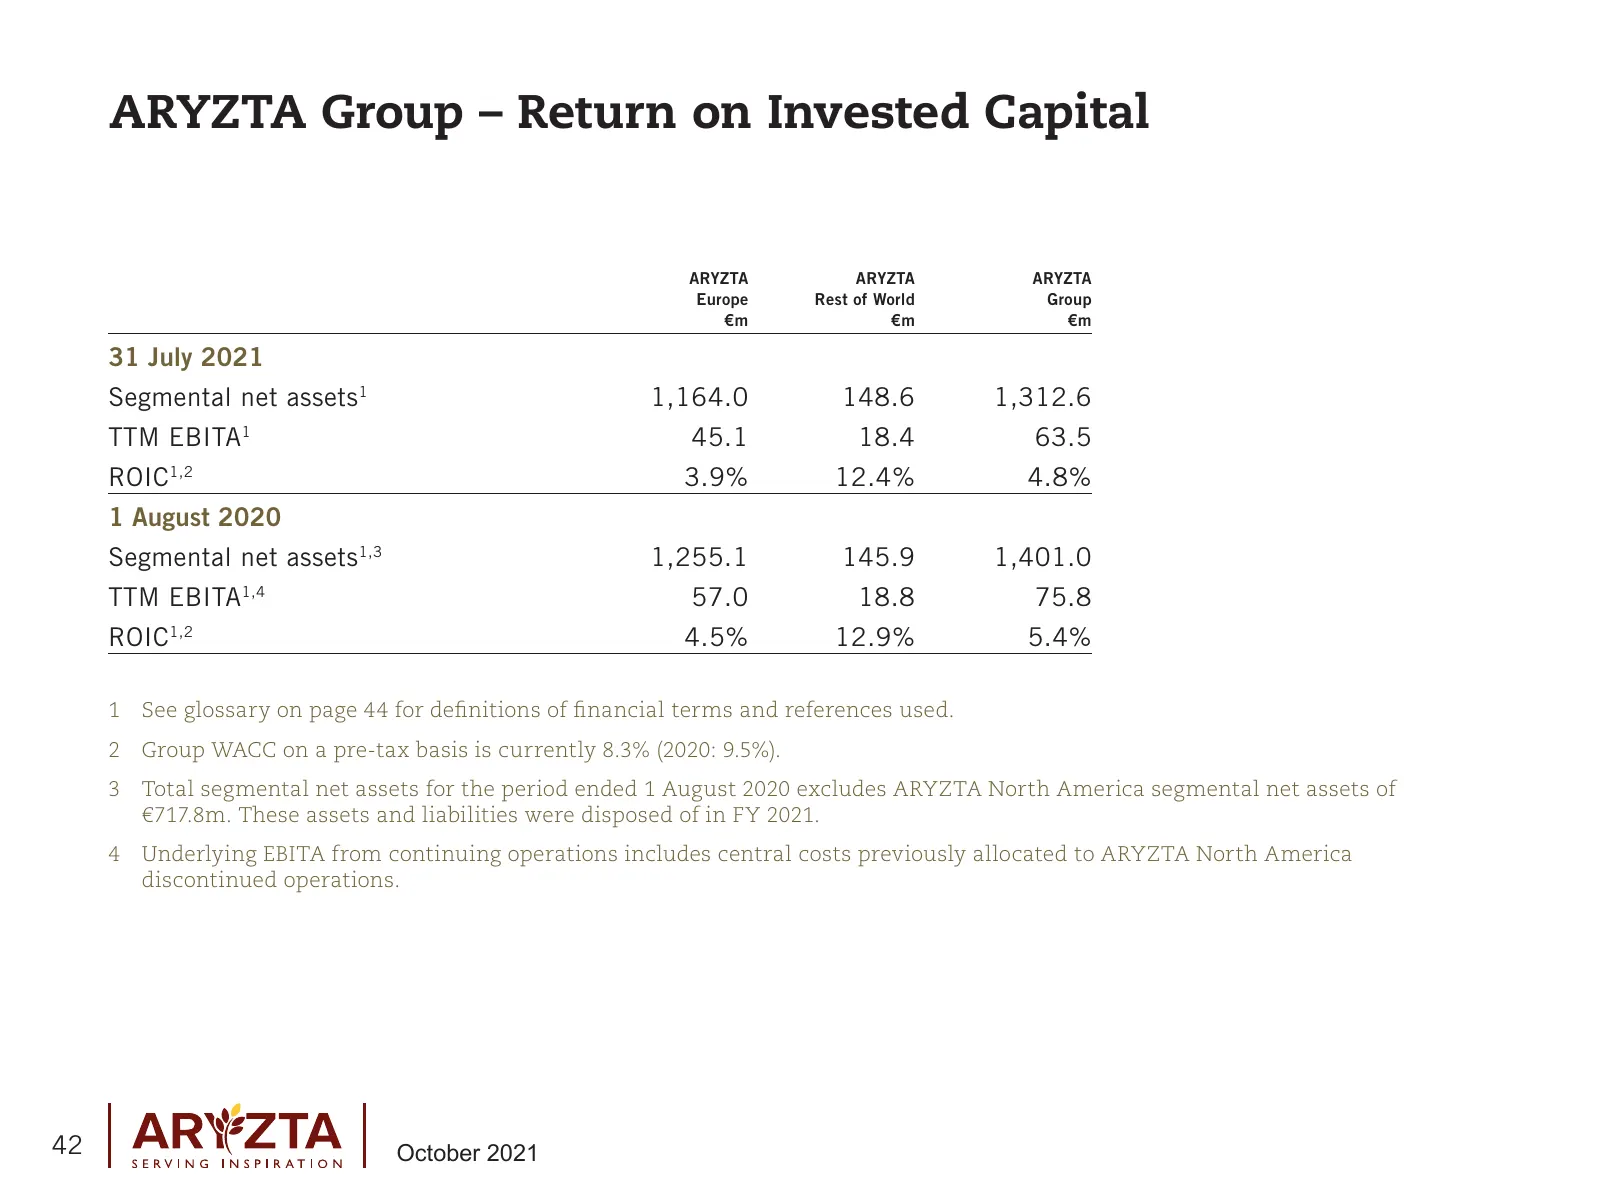
ARYZTA Group – Return on Invested Capital ARYZTA ARYZTA ARYZTA Europe Rest of World Group €m €m €m 31 July 2021 Segmental net assets1 1,164.0 148.6 1,312.6 TTM EBITA 1 45.1 18.4 63.5 ROIC 1,2 3.9% 12.4% 4.8% 1 August 2020 Segmental net assets1,3 1,255.1 145.9 1,401.0 TTM EBITA 1,4 57.0 18.8 75.8 ROI
Slide 43: ARYZTA Group Balance Sheet
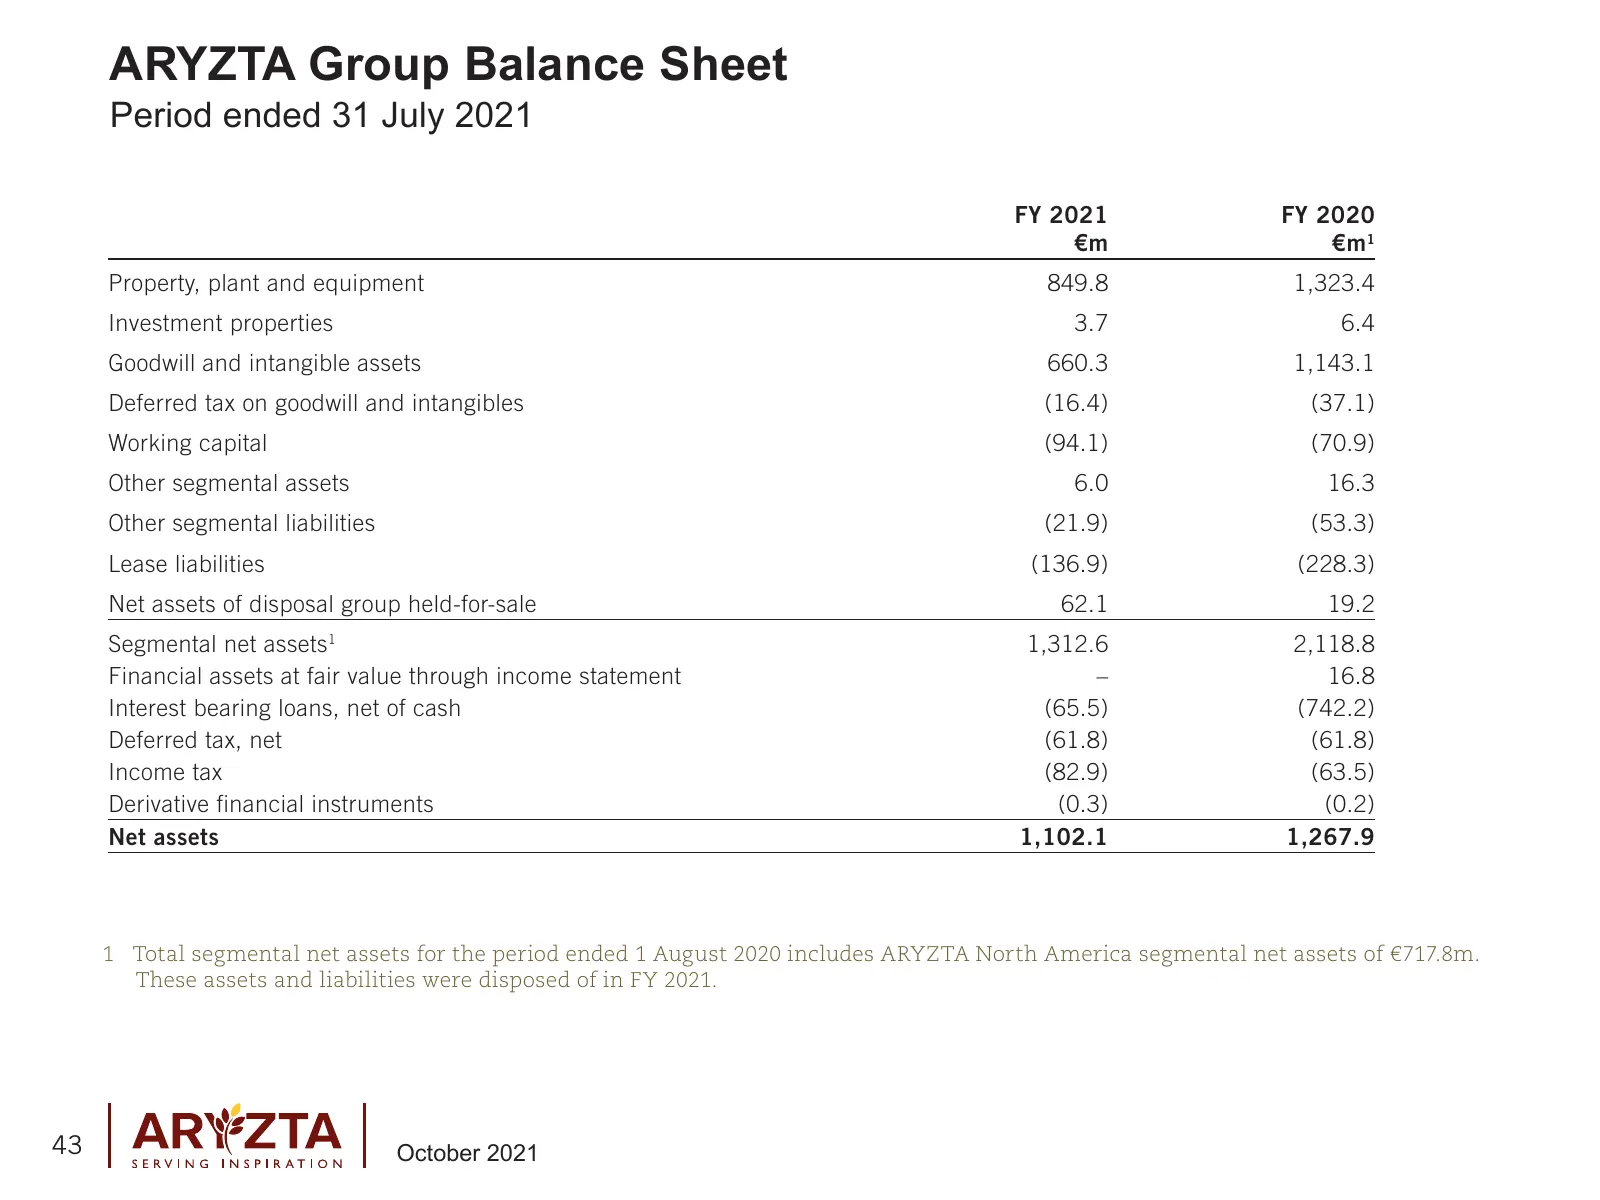
ARYZTA Group Balance Sheet Period ended 31 July 2021 FY 2021 FY 2020 €m €m1 Property, plant and equipment 849.8 1,323.4 Investment properties 3.7 6.4 Goodwill and intangible assets 660.3 1,143.1 Deferred tax on goodwill and intangibles (16.4) (37.1) Working capital (94.1) (70.9) Other segmental asse
Slide 44: Presentation Glossary
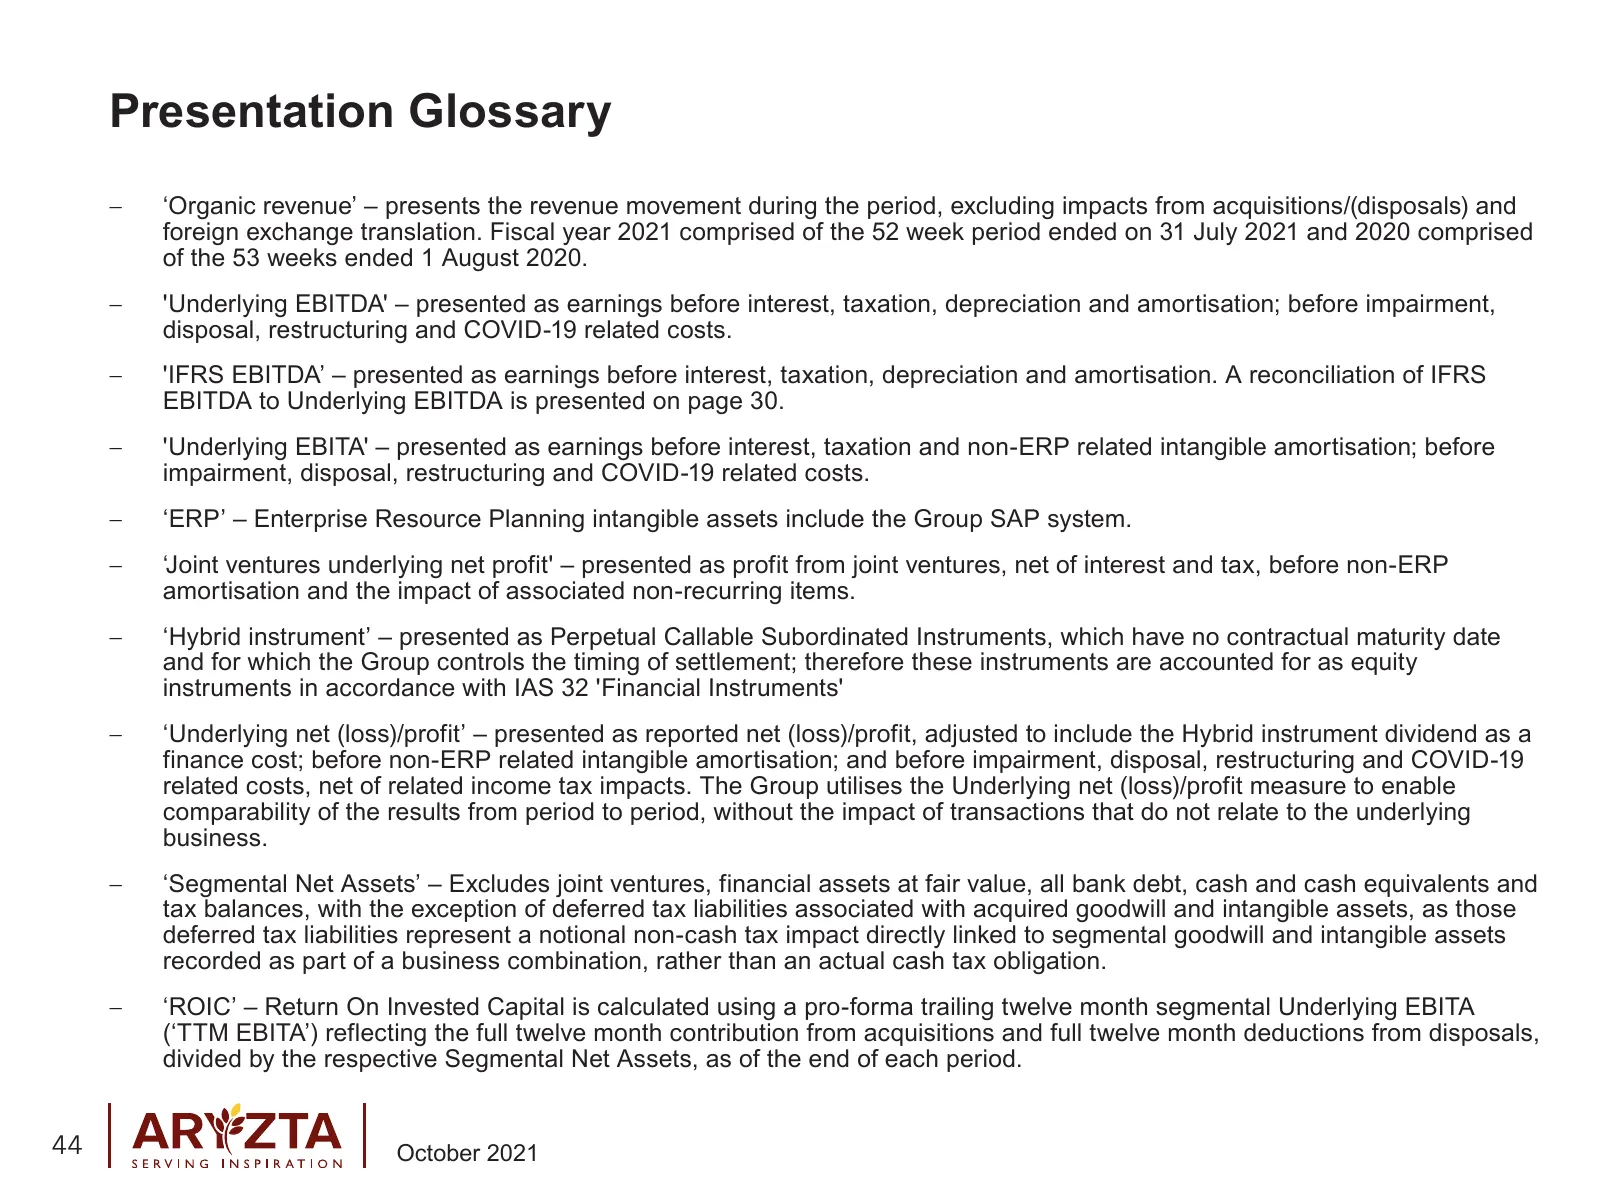
Presentation Glossary – ‘Organic revenue’ – presents the revenue movement during the period, excluding impacts from acquisitions/(disposals) and foreign exchange translation. Fiscal year 2021 comprised of the 52 week period ended on 31 July 2021 and 2020 comprised of the 53 weeks ended 1 August 2020
Source: Internet Archive copy of aryzta.com
More decks from Aryzta AG
 H1 2026 Earnings Presentation32 slides · Aug 10, 2026
 FY2025 Earnings Presentation7 slides · Jan 22, 2026
 Q3 2025 Earnings Presentation15 slides · Oct 20, 2025
 H1 2025 Earnings Presentation34 slides · Aug 11, 2025
 Investor Day (May 2025)48 slides · May 7, 2025
 Q1 2025 Earnings Presentation35 slides · Mar 2, 2025