Soltec Power Holdings SA · BME:SOL
Soltec Power Holdings SA — 9M 2021 Earnings Presentation
23 slides from Soltec Power Holdings SA's earnings presentation, Nov 4, 2021
Slide 1: 9M 2021 Results
9M 202) Results

Slide 2: Disclaimer
DISCLAIMER This document has been prepared by Soltec Power Holdings, S.A. (“Soltec”) exclusively for use during the financial results presentation for the nine-month period ended on September 30th, 2021. Therefore, thereof, this document may not be disclosed or published, nor used by any other perso
Slide 3: Agenda
AGENDA 01 9M 2021 02 Operational 03 9M 2021 04 Closing 05 Appendix Key Highlights Indicators Financial Results Remarks 3
Slide 4: 9M 2021 Key Highlights
O01 9M 2021 Key Highlights 2021
Slide 5: 9M 2021 Key Highlights
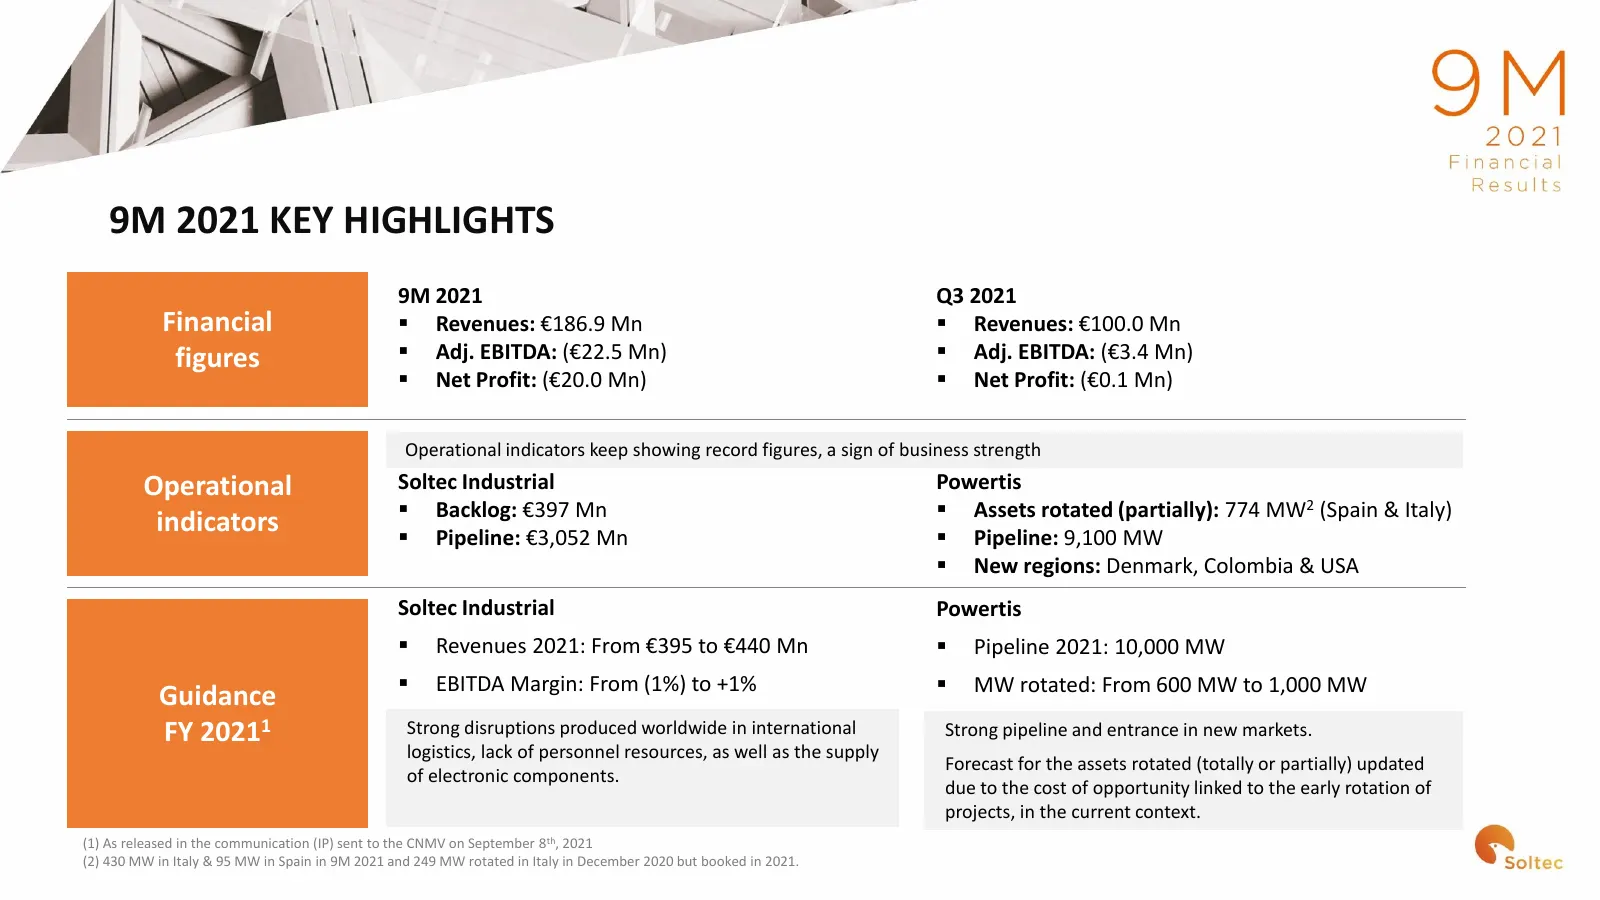
9M 2021 KEY HIGHLIGHTS 9M 2021 Q3 2021 Financial ▪ Revenues: €186.9 Mn ▪ Revenues: €100.0 Mn figures ▪ Adj. EBITDA: (€22.5 Mn) ▪ Adj. EBITDA: (€3.4 Mn) ▪ Net Profit: (€20.0 Mn) ▪ Net Profit: (€0.1 Mn) Operational indicators keep showing record figures, a sign of business strength Operational Soltec
Slide 6: Operational Indicators
oo 4\\\, ~~“ —- Aru 02 Operational Indicators
Slide 7: Track Record & Diversification
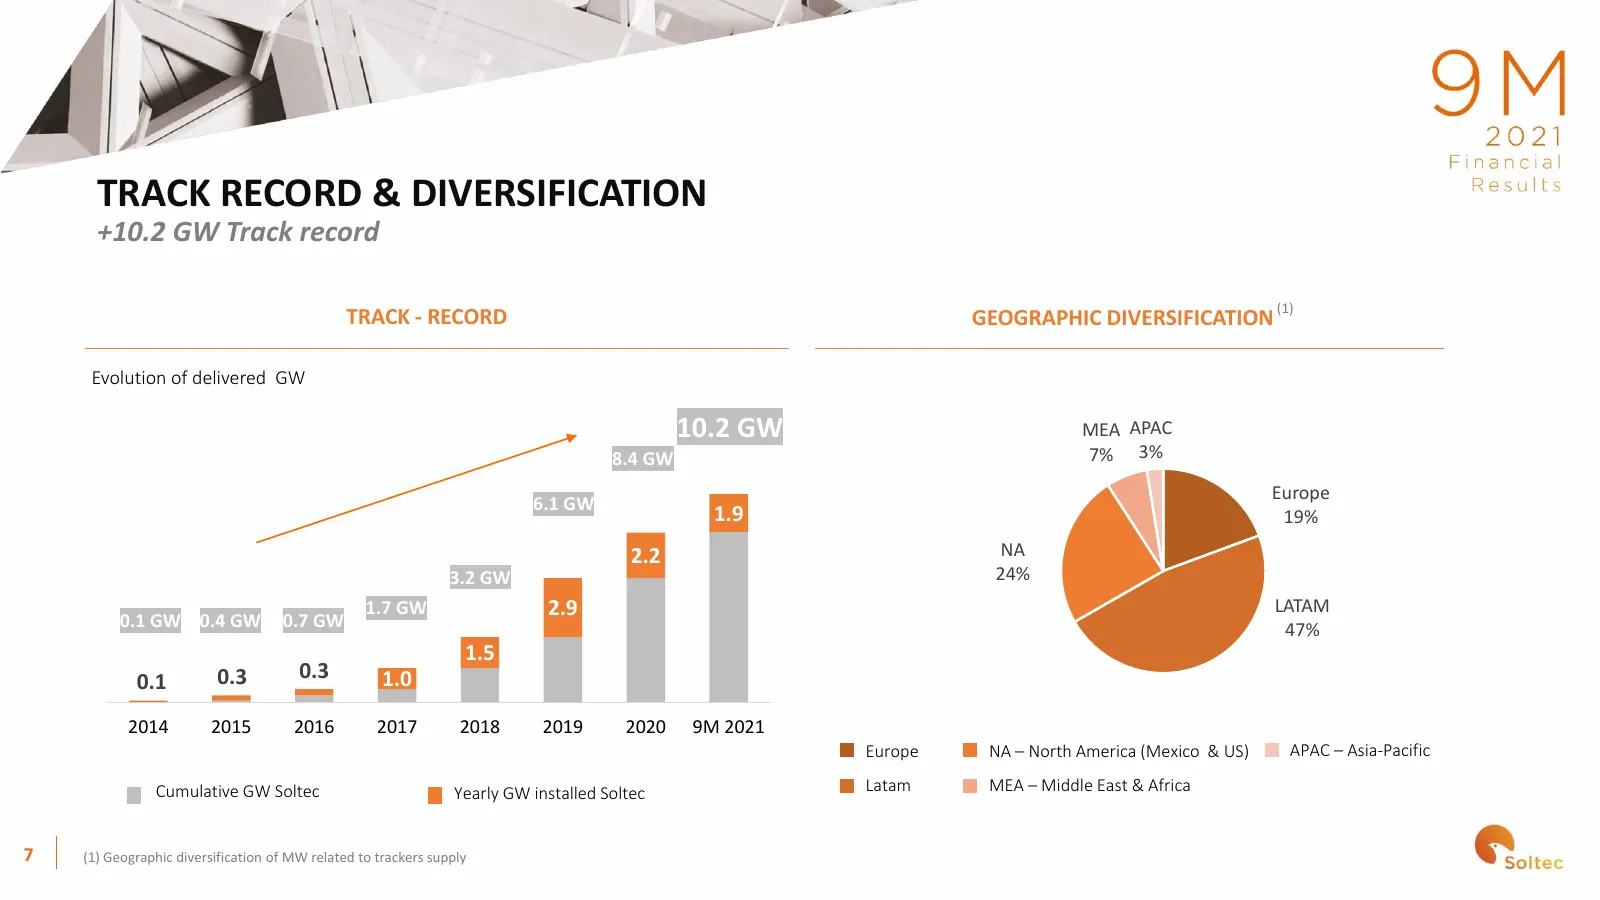
TRACK RECORD & DIVERSIFICATION +10.2 GW Track record TRACK - RECORD GEOGRAPHIC DIVERSIFICATION (1) Evolution of delivered GW 10.2 GW MEA APAC 8.4 GW 7% 3% Europe 6.1 GW 1.9 19% 2.2 NA 3.2 GW 24% 1.7 GW 2.9 LATAM 0.1 GW 0.4 GW 0.7 GW 47% 1.5 0.1 0.3 0.3 1.0 2014 2015 2016 2017 2018 2019 2020 9M 2021
Slide 8: 9M 2021 Soltec Industrial
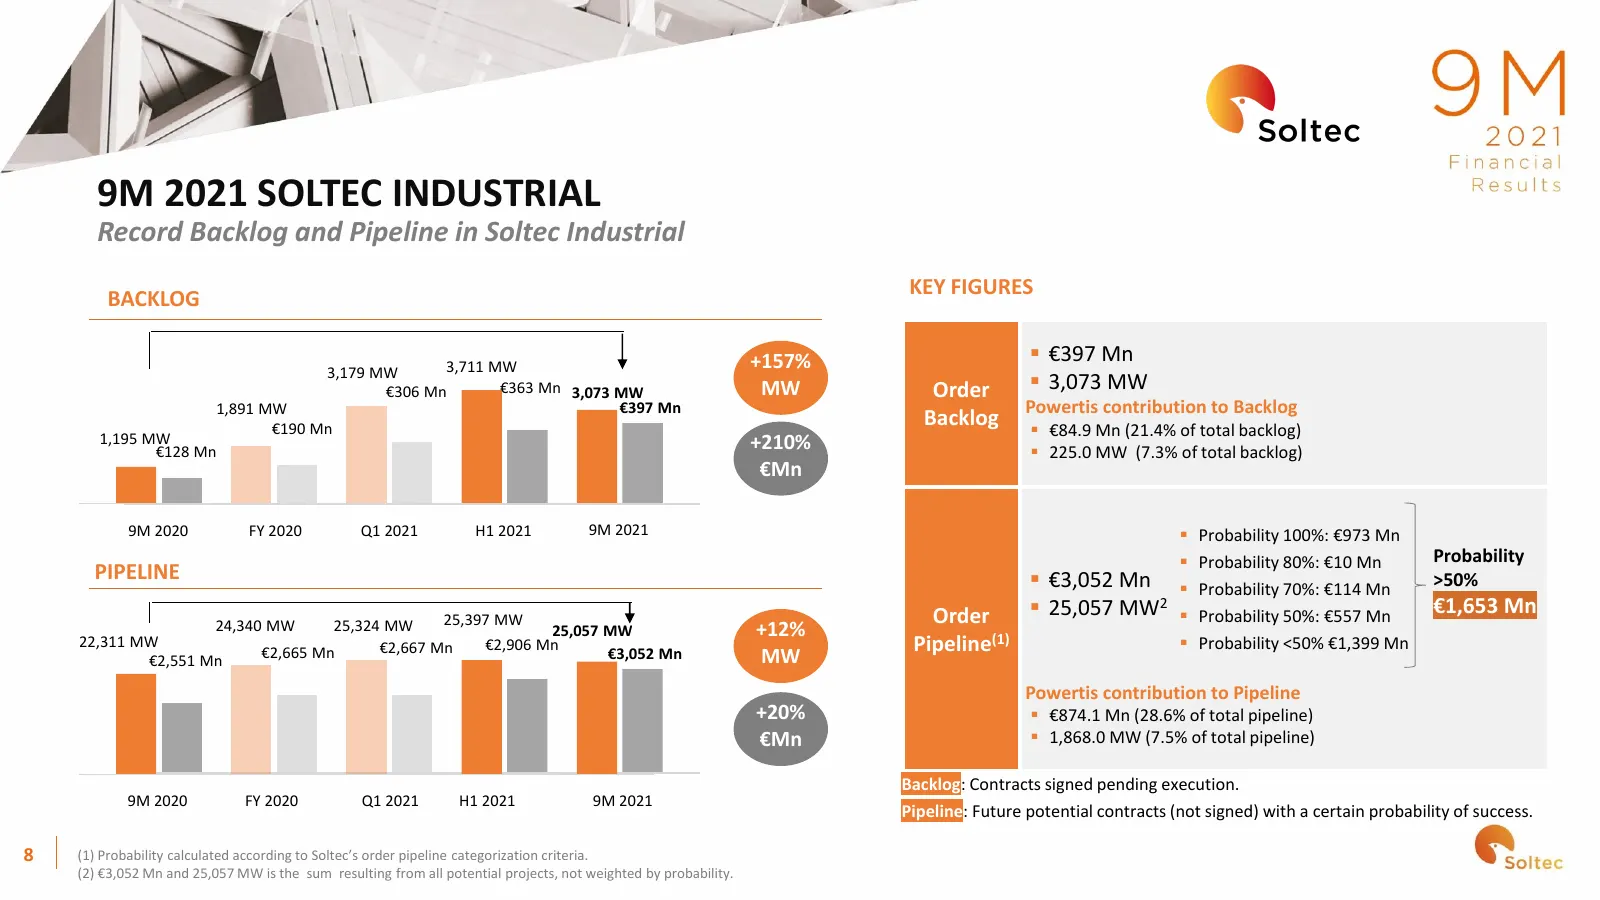
9M 2021 SOLTEC INDUSTRIAL Record Backlog and Pipeline in Soltec Industrial KEY FIGURES BACKLOG 3,711 MW +157% ▪ €397 Mn 3,179 MW €306 Mn €363 Mn 3,073 MW MW Order ▪ 3,073 MW 1,891 MW €397 Mn Powertis contribution to Backlog €190 Mn Backlog ▪ €84.9 Mn (21.4% of total backlog) 1,195 MW +210% €128 Mn ▪
Slide 9: 9M 2021 Soltec Industrial
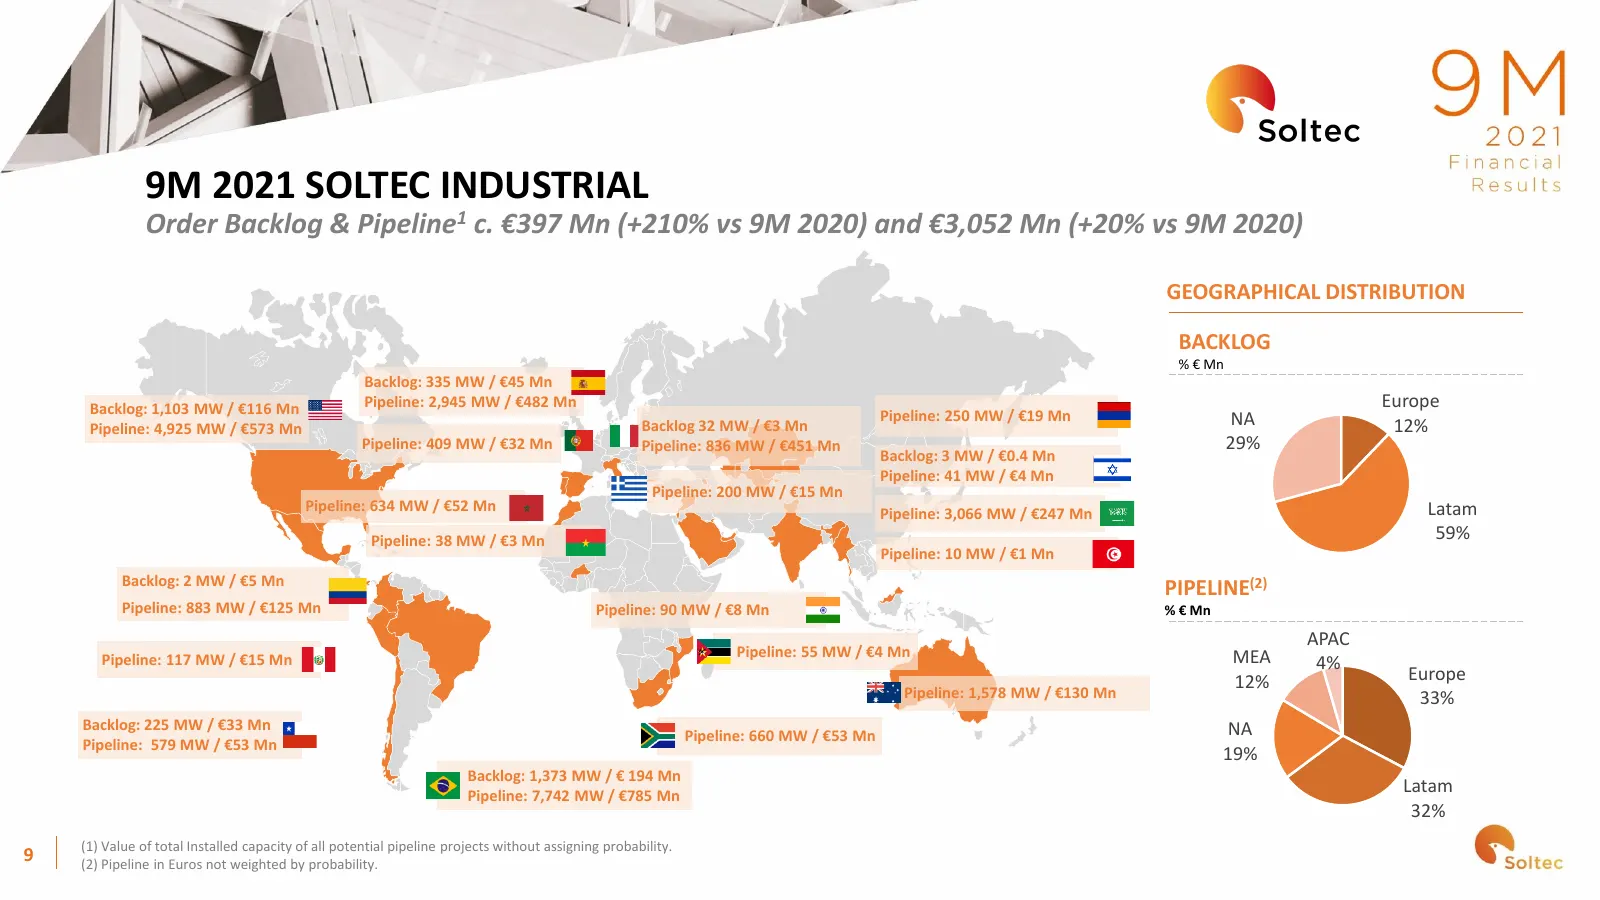
9M 2021 SOLTEC INDUSTRIAL Order Backlog & Pipeline1 c. €397 Mn (+210% vs 9M 2020) and €3,052 Mn (+20% vs 9M 2020) GEOGRAPHICAL DISTRIBUTION BACKLOG % € Mn Backlog: 335 MW / €45 Mn Backlog: 1,103 MW / €116 Mn Pipeline: 2,945 MW / €482 Mn Europe Pipeline: 250 MW / €19 Mn NA Pipeline: 4,925 MW / €573 M
Slide 10: 9M 2021 Powertis
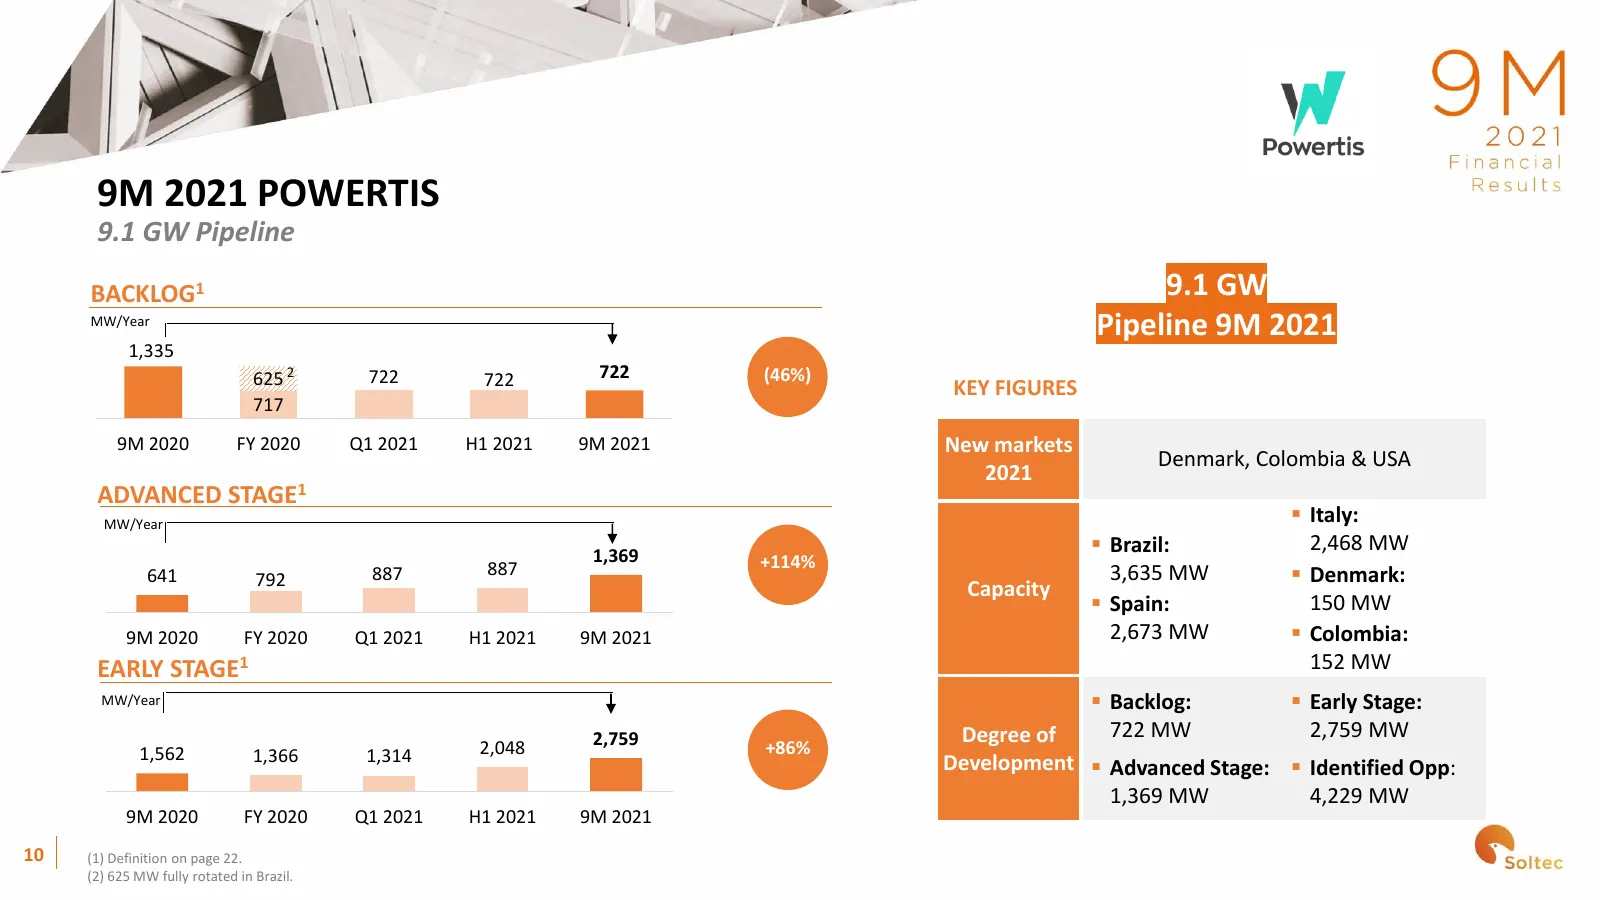
9M 2021 POWERTIS 9.1 GW Pipeline BACKLOG1 9.1 GW MW/Year Pipeline 9M 2021 1,335 625 2 722 722 722 (46%) KEY FIGURES 717 9M 2020 FY 2020 Q1 2021 H1 2021 9M 2021 New markets Denmark, Colombia & USA 2021 ADVANCED STAGE1 MW/Year ▪ Italy: 1,369 ▪ Brazil: 2,468 MW 887 +114% 641 792 887 3,635 MW ▪ Denmark:
Slide 11: 9M 2021 Powertis
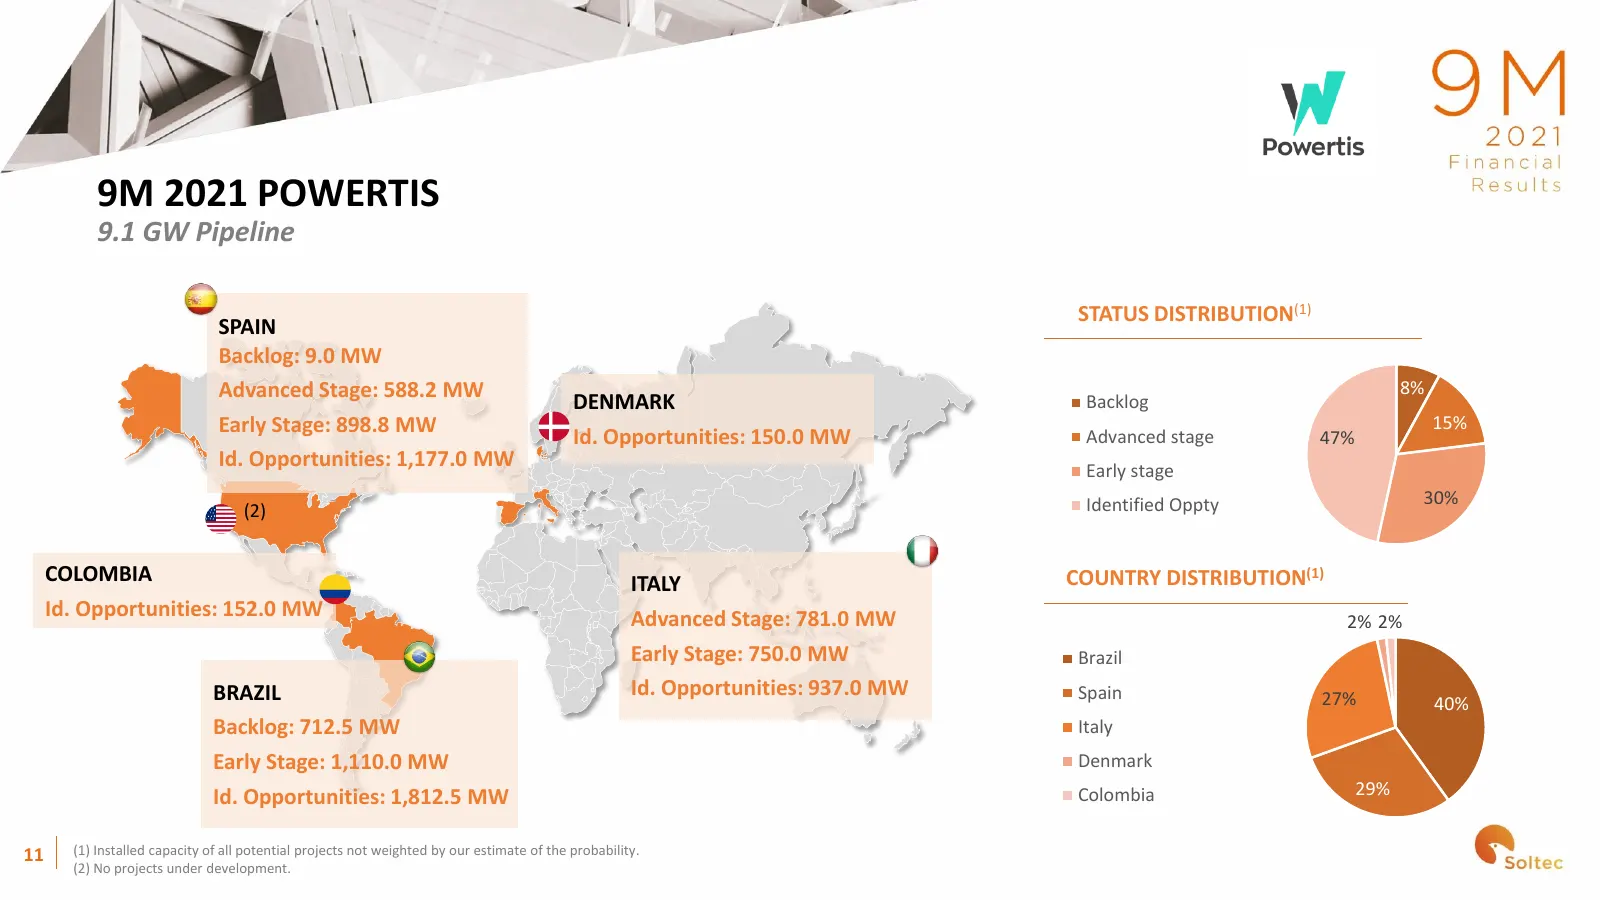
9M 2021 POWERTIS 9.1 GW Pipeline STATUS DISTRIBUTION(1) SPAIN Backlog: 9.0 MW Advanced Stage: 588.2 MW 8% DENMARK Backlog Early Stage: 898.8 MW 15% Id. Opportunities: 150.0 MW Advanced stage 47% Id. Opportunities: 1,177.0 MW Early stage Identified Oppty 30% (2) COLOMBIA ITALY COUNTRY DISTRIBUTION(1)
Slide 12: 9M 2021 Financial Results
A P| \ \ Pe 03 9M 2021 Financial Results
Slide 13: Quarterly Results by Business
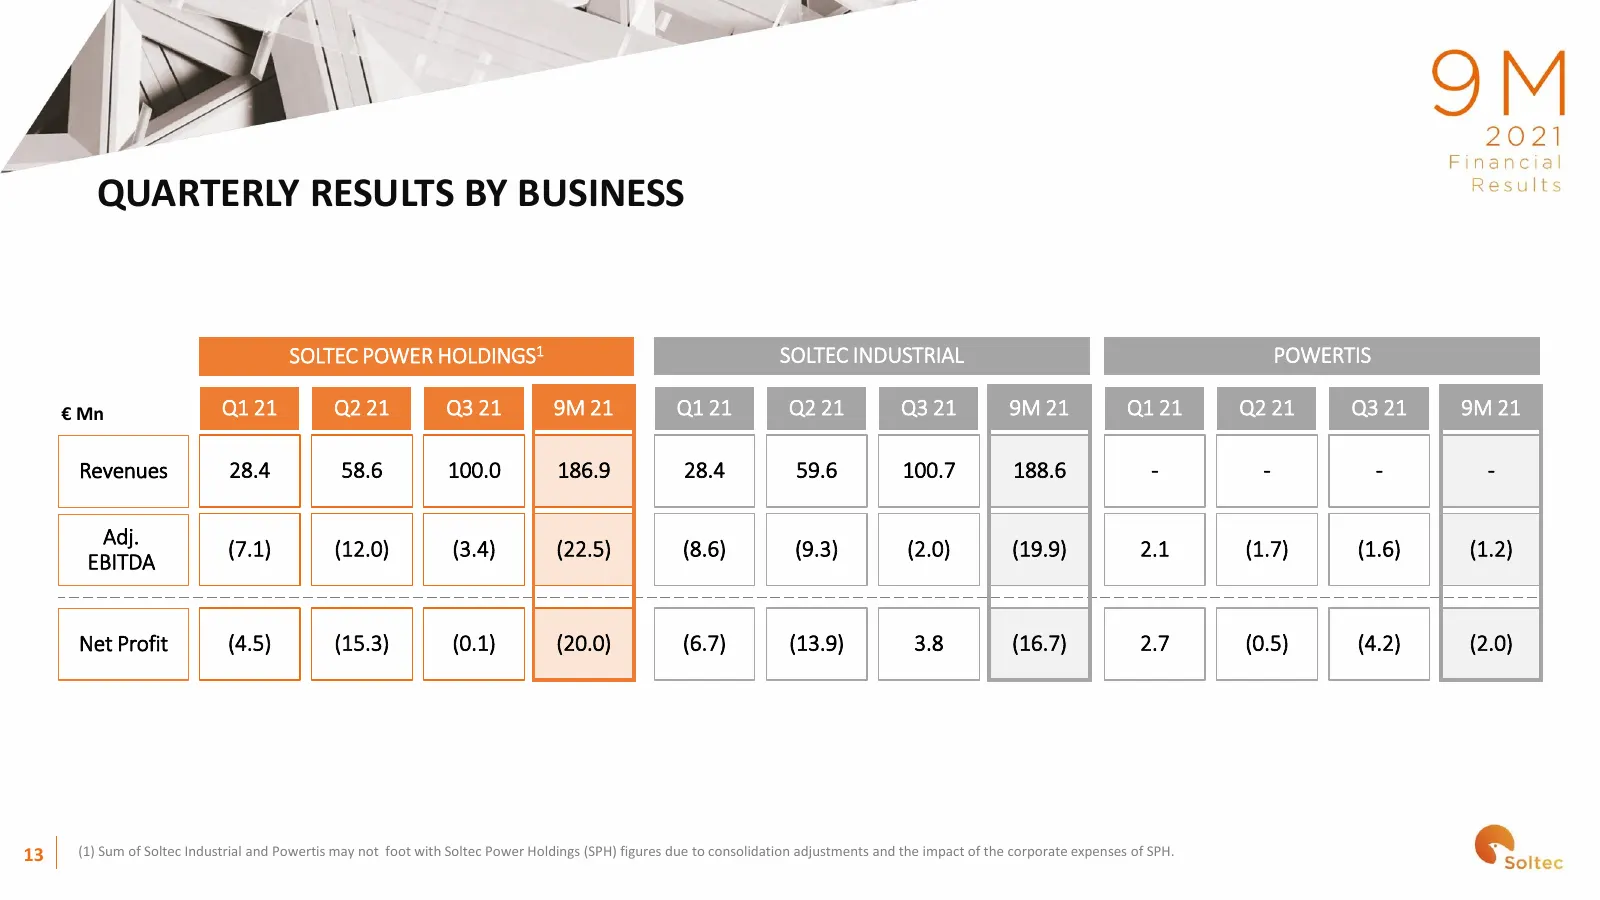
QUARTERLY RESULTS BY BUSINESS SOLTEC POWER HOLDINGS1 SOLTEC INDUSTRIAL POWERTIS € Mn Q1 21 Q2 21 Q3 21 9M 21 Q1 21 Q2 21 Q3 21 9M 21 Q1 21 Q2 21 Q3 21 9M 21 Revenues 28.4 58.6 100.0 186.9 28.4 59.6 100.7 188.6 - - - - Adj. (7.1) (12.0) (3.4) (22.5) (8.6) (9.3) (2.0) (19.9) 2.1 (1.7) (1.6) (1.2) EBIT
Slide 14: 9M 2021 by Business
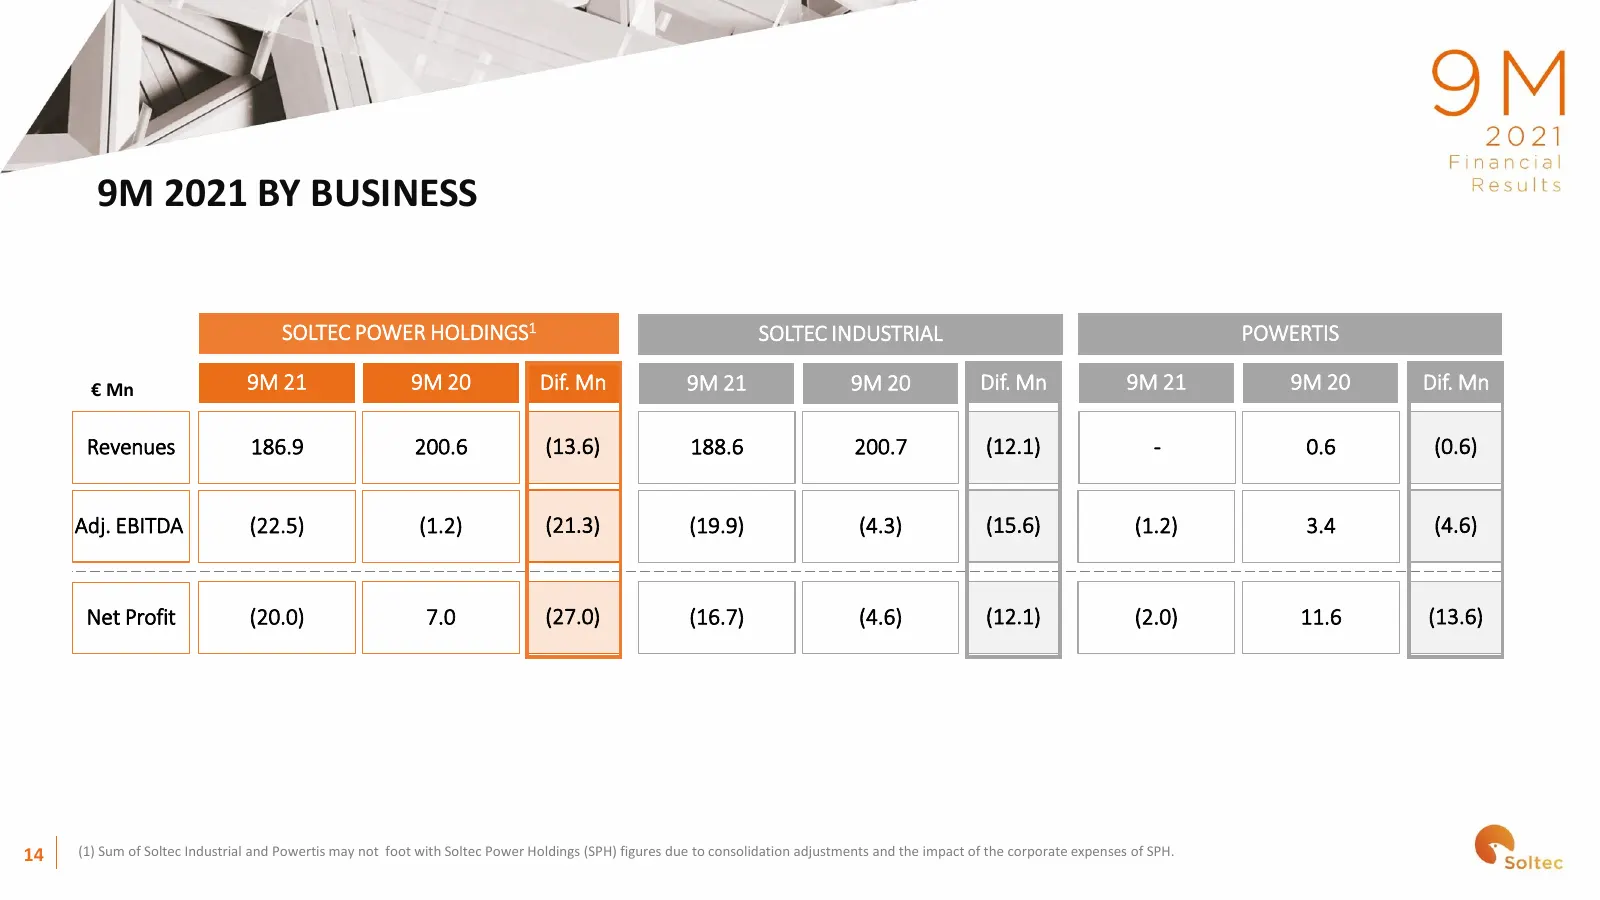
9M 2021 BY BUSINESS SOLTEC POWER HOLDINGS1 SOLTEC INDUSTRIAL POWERTIS € Mn 9M 21 9M 20 Dif. Mn 9M 21 9M 20 Dif. Mn 9M 21 9M 20 Dif. Mn Revenues 186.9 200.6 (13.6) 188.6 200.7 (12.1) - 0.6 (0.6) Adj. EBITDA (22.5) (1.2) (21.3) (19.9) (4.3) (15.6) (1.2) 3.4 (4.6) Net Profit (20.0) 7.0 (27.0) (16.7) (4
Slide 15: Q3 2021 by Business
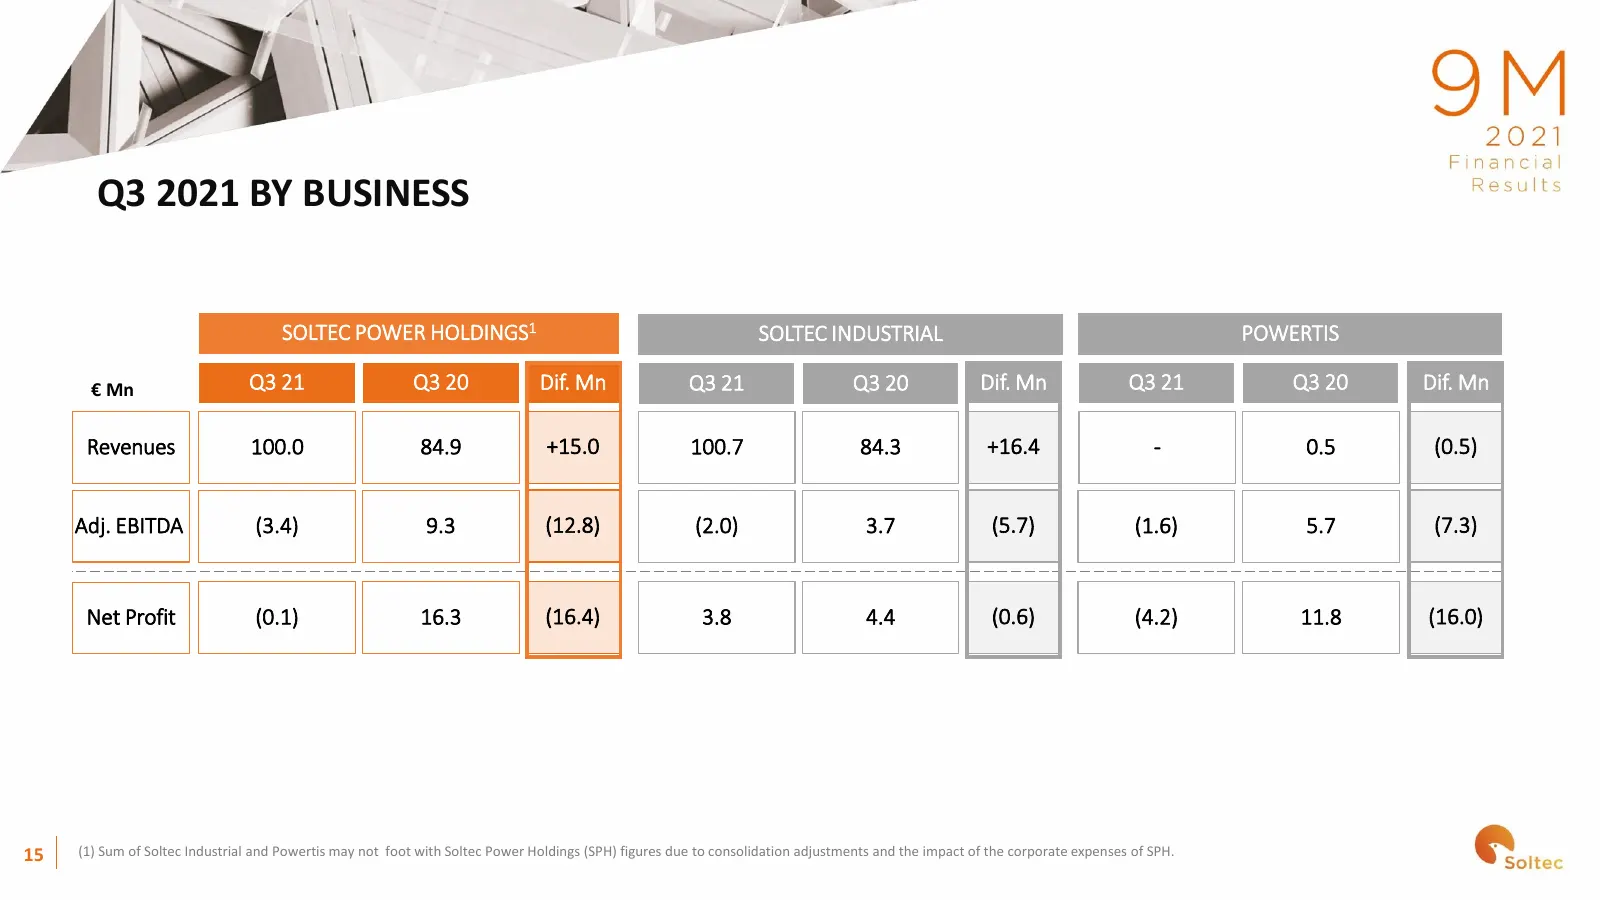
Q3 2021 BY BUSINESS SOLTEC POWER HOLDINGS1 SOLTEC INDUSTRIAL POWERTIS € Mn Q3 21 Q3 20 Dif. Mn Q3 21 Q3 20 Dif. Mn Q3 21 Q3 20 Dif. Mn Revenues 100.0 84.9 +15.0 100.7 84.3 +16.4 - 0.5 (0.5) Adj. EBITDA (3.4) 9.3 (12.8) (2.0) 3.7 (5.7) (1.6) 5.7 (7.3) Net Profit (0.1) 16.3 (16.4) 3.8 4.4 (0.6) (4.2)
Slide 16: FY 2021 Guidance
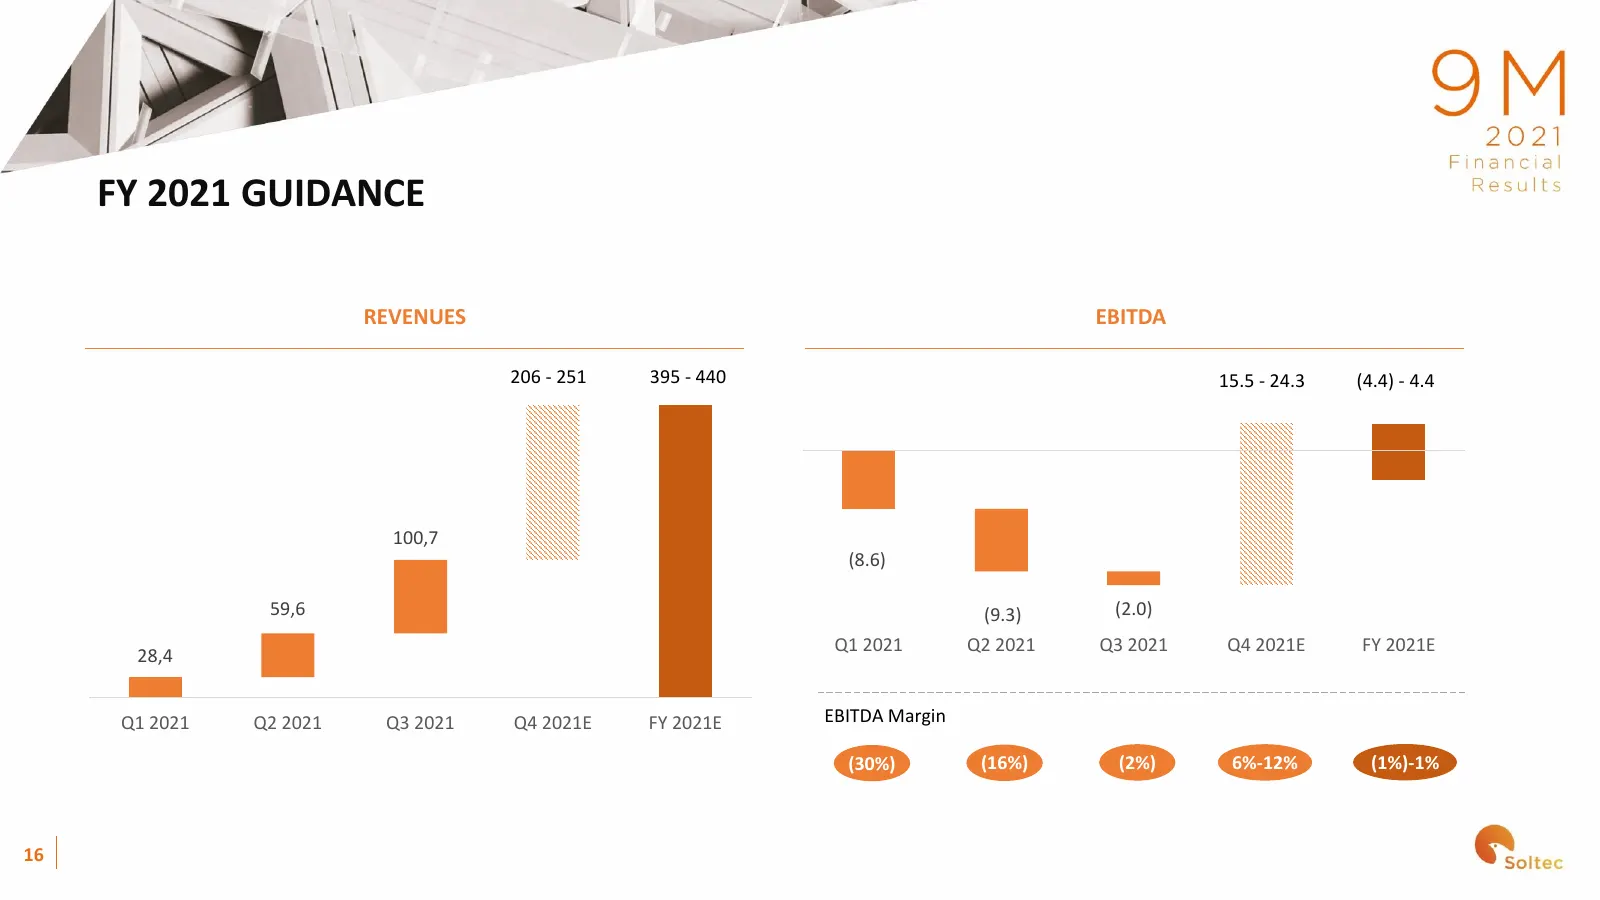
FY 2021 GUIDANCE REVENUES EBITDA 206 - 251 395 - 440 15.5 - 24.3 (4.4) - 4.4 100,7 (8.6) 59,6 (9.3) (2.0) Q1 2021 Q2 2021 Q3 2021 Q4 2021E FY 2021E 28,4 Q1 2021 Q2 2021 Q3 2021 Q4 2021E FY 2021E EBITDA Margin (30%) (16%) (2%) 6%-12% (1%)-1% 16
Slide 17: Closing remarks
— 4\\; “Ee Lr 04 Closing remarks 2021 nancial
Slide 18: Closing Remarks
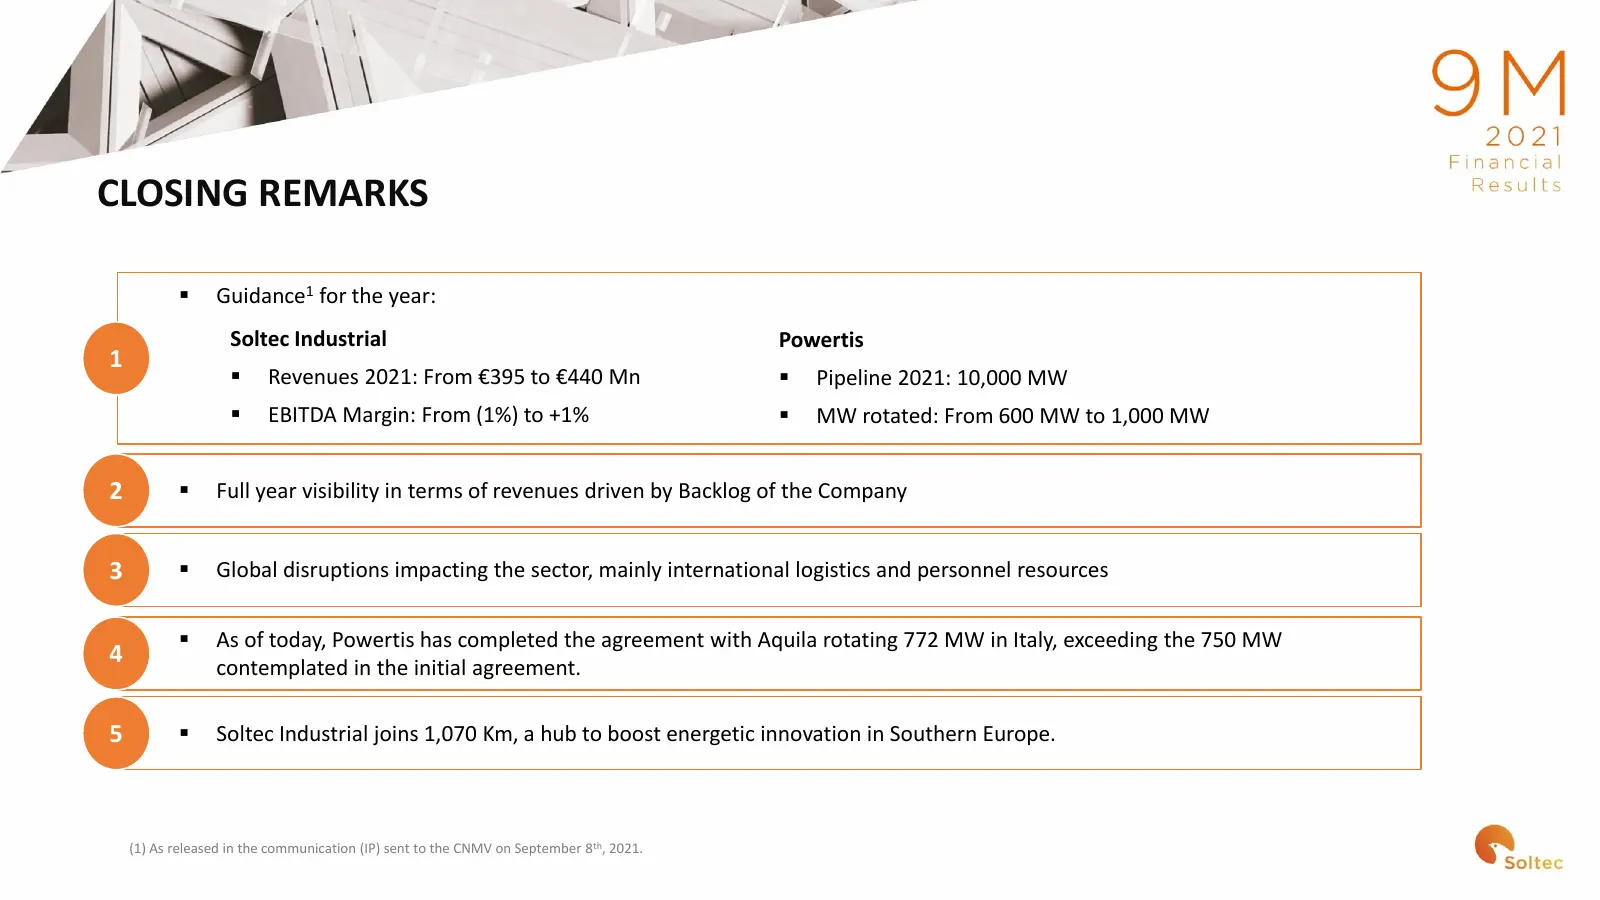
CLOSING REMARKS ▪ Guidance1 for the year: Soltec Industrial Powertis 1 ▪ Revenues 2021: From €395 to €440 Mn ▪ Pipeline 2021: 10,000 MW ▪ EBITDA Margin: From (1%) to +1% ▪ MW rotated: From 600 MW to 1,000 MW 2 ▪ Full year visibility in terms of revenues driven by Backlog of the Company 3 ▪ Global di
Slide 19: Appendix
— 4\\; Err AP O05 Appendix 2021 Financial
Slide 20: Soltec Power Holdings P&L
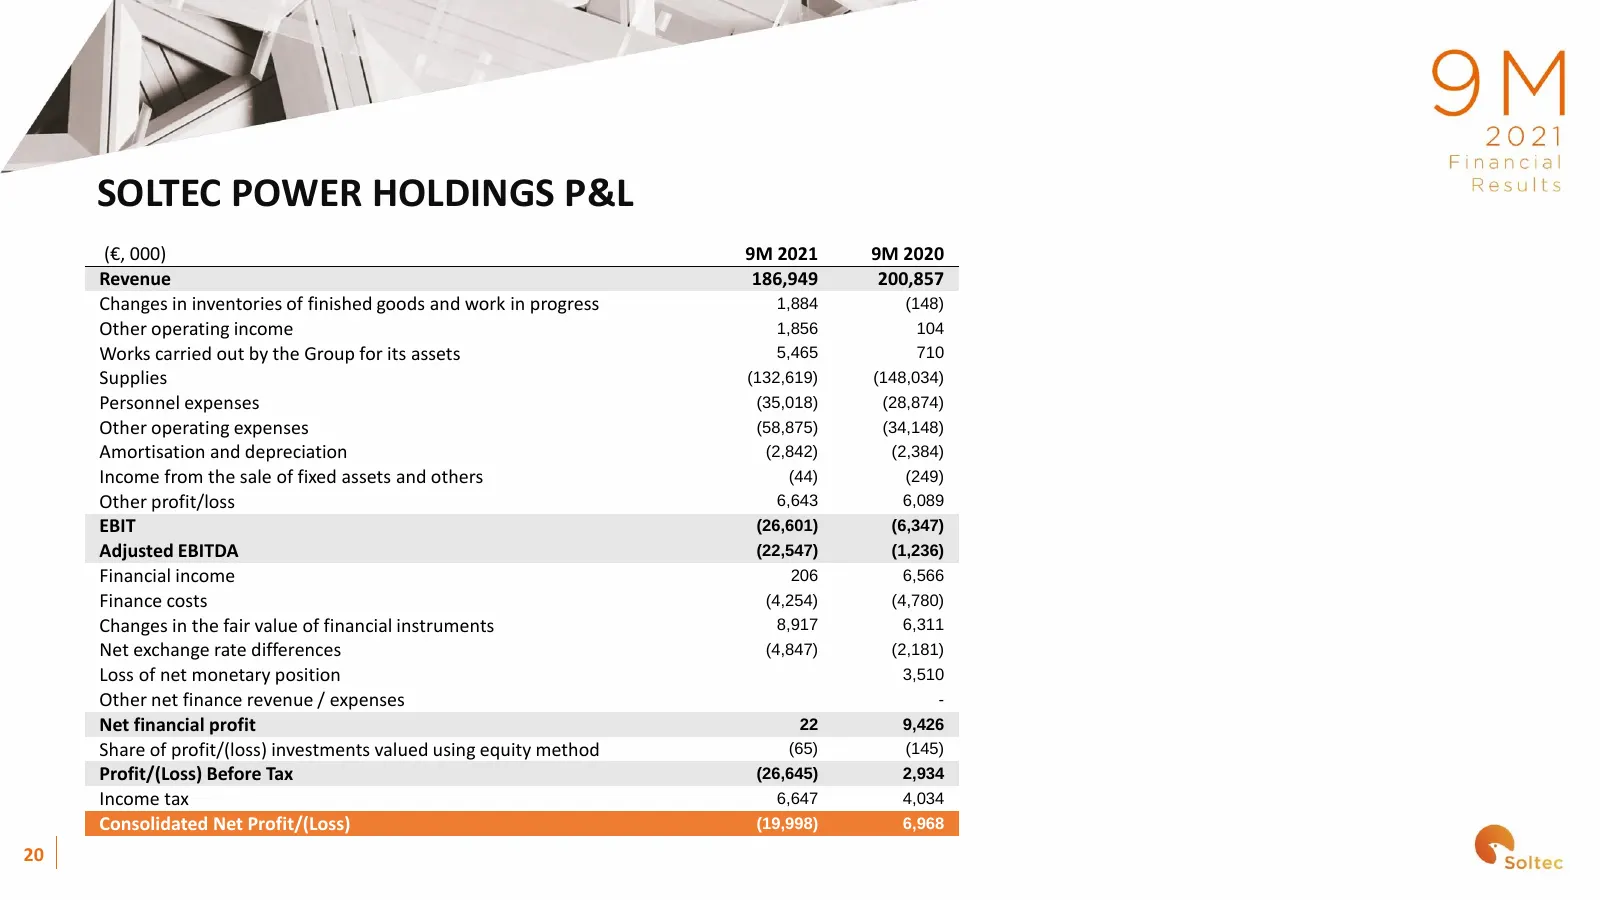
SOLTEC POWER HOLDINGS P&L (€, 000) 9M 2021 9M 2020 Revenue 186,949 200,857 Changes in inventories of finished goods and work in progress 1,884 (148) Other operating income 1,856 104 Works carried out by the Group for its assets 5,465 710 Supplies (132,619) (148,034) Personnel expenses (35,018) (28,8
Slide 21: Order Pipeline Categorization Criteria
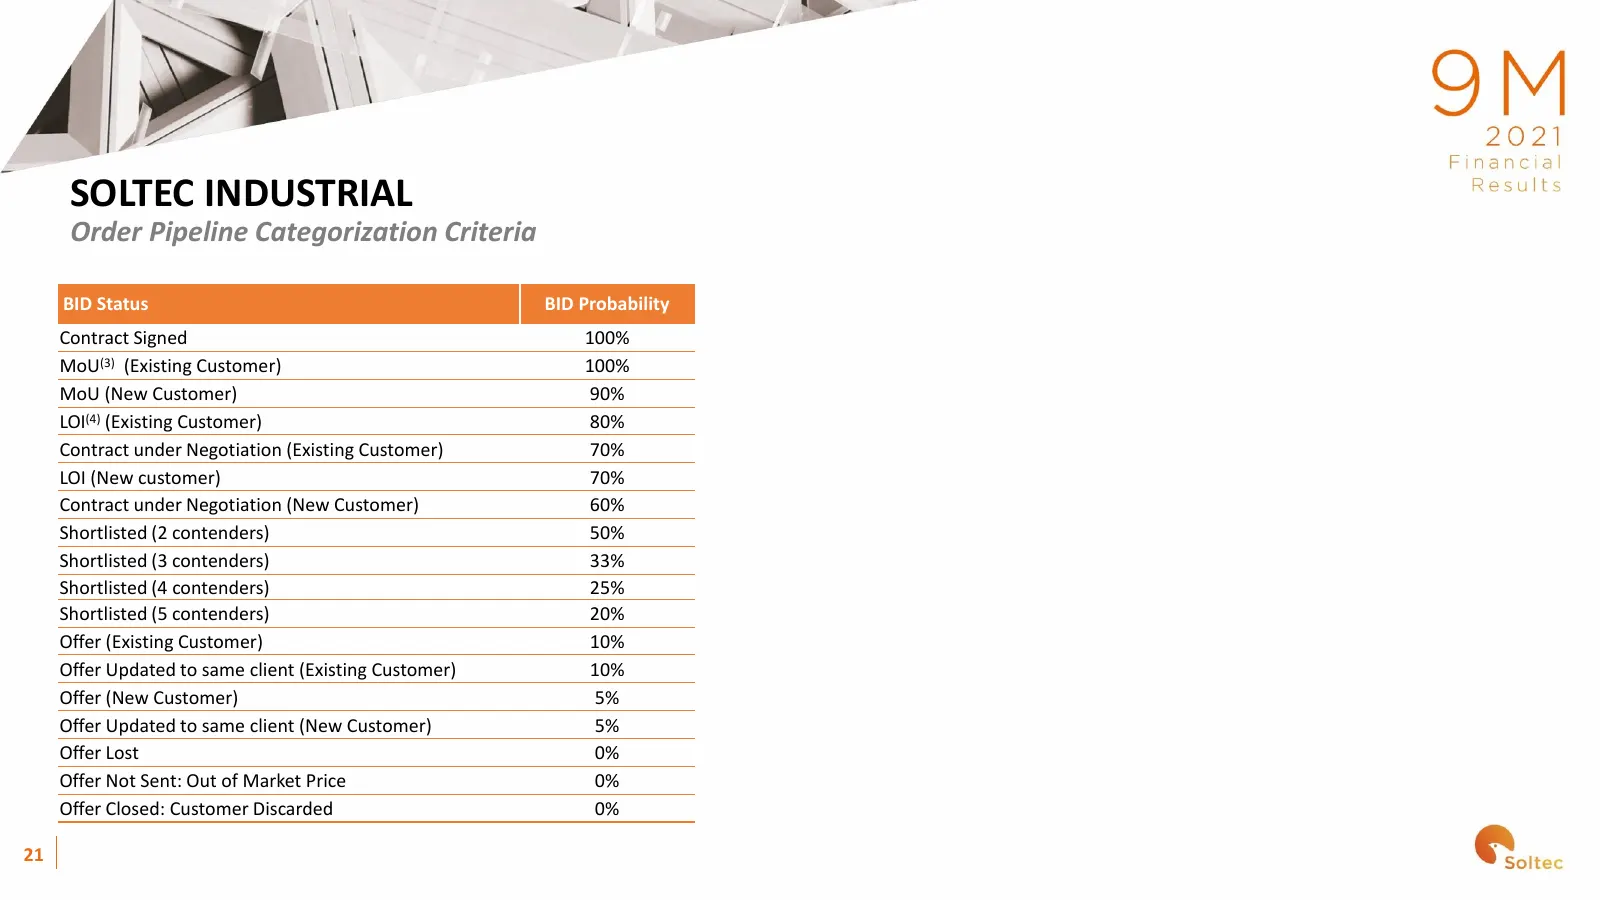
SOLTEC INDUSTRIAL Order Pipeline Categorization Criteria BID Status BID Probability Contract Signed 100% MoU(3) (Existing Customer) 100% MoU (New Customer) 90% LOI(4) (Existing Customer) 80% Contract under Negotiation (Existing Customer) 70% LOI (New customer) 70% Contract under Negotiation (New Cus
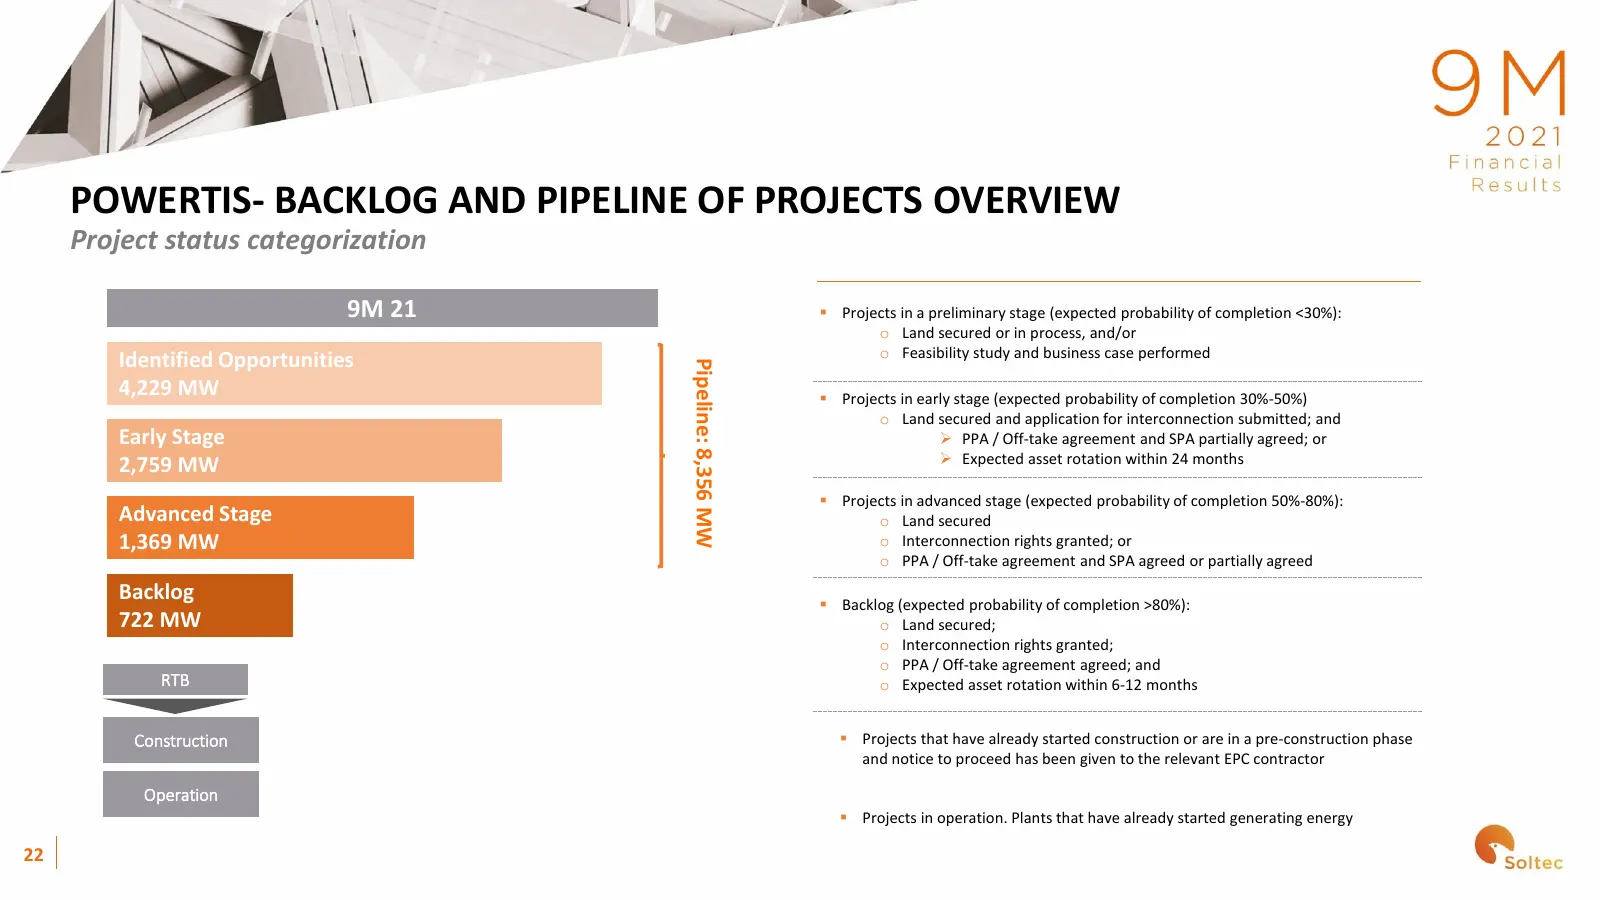
Slide 22: Powertis Backlog and Pipeline of Projects Overview
POWERTIS- BACKLOG AND PIPELINE OF PROJECTS OVERVIEW Project status categorization 9M 21 ▪ Projects in a preliminary stage (expected probability of completion <30%): o Land secured or in process, and/or o Feasibility study and business case performed Identified Opportunities Pipeline: 8,356 MW 4,229
Slide 23: Thank You
THANK YOU
Source: Internet Archive copy of soltec.com
More decks from Soltec Power Holdings SA
 H1 2026 Earnings Presentation26 slides · September 2026
 H1 2026 Earnings Presentation26 slides · September 2026
 FY2025 Earnings Presentation37 slides · Mar 26, 2026
 H1 2024 Earnings Presentation54 slides · Feb 27, 2025
 Investor Presentation (April 2024)54 slides · April 2024
 FY2023 Earnings Presentation31 slides · Apr 1, 2024