Kimball International — Q1 FY2022 Earnings Presentation
16 slides from Kimball International's earnings presentation, Nov 4, 2021
Slide 1: Q1 FY '22 Quarterly Earnings & Strategic Update
Q1 FY ‘22 Quarterly Earnings & Strategic Update

Slide 2: Forward-looking statements
This document may contain certain forward-looking statements about the Company, such as discussions of Company’s pricing trends, liquidity, new business results, expansion plans, anticipated expenses and planned schedules. The Company intends such forward- looking statements to be covered by the saf
Slide 3: Key Takeaways
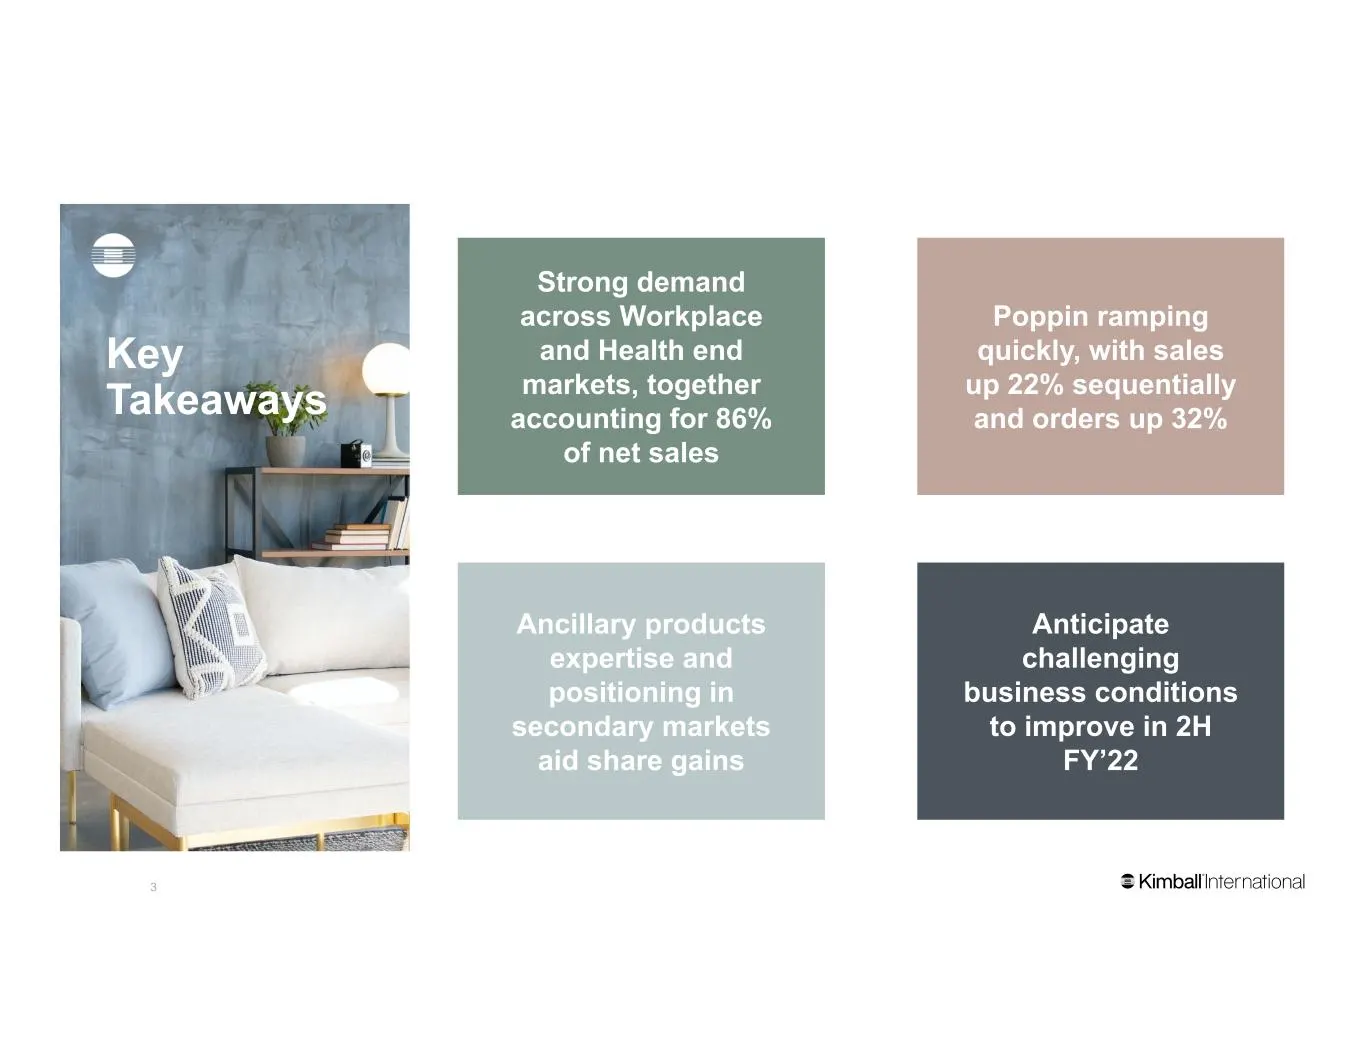
Strong demand across Workplace and Health end markets, together accounting for 86% of net sales Ancillary products expertise and positioning in secondary markets aid share gains Poppin ramping quickly, with sales up 22% sequentially and orders up 32% Anticipate challenging business conditions to imp
Slide 4: Workplace
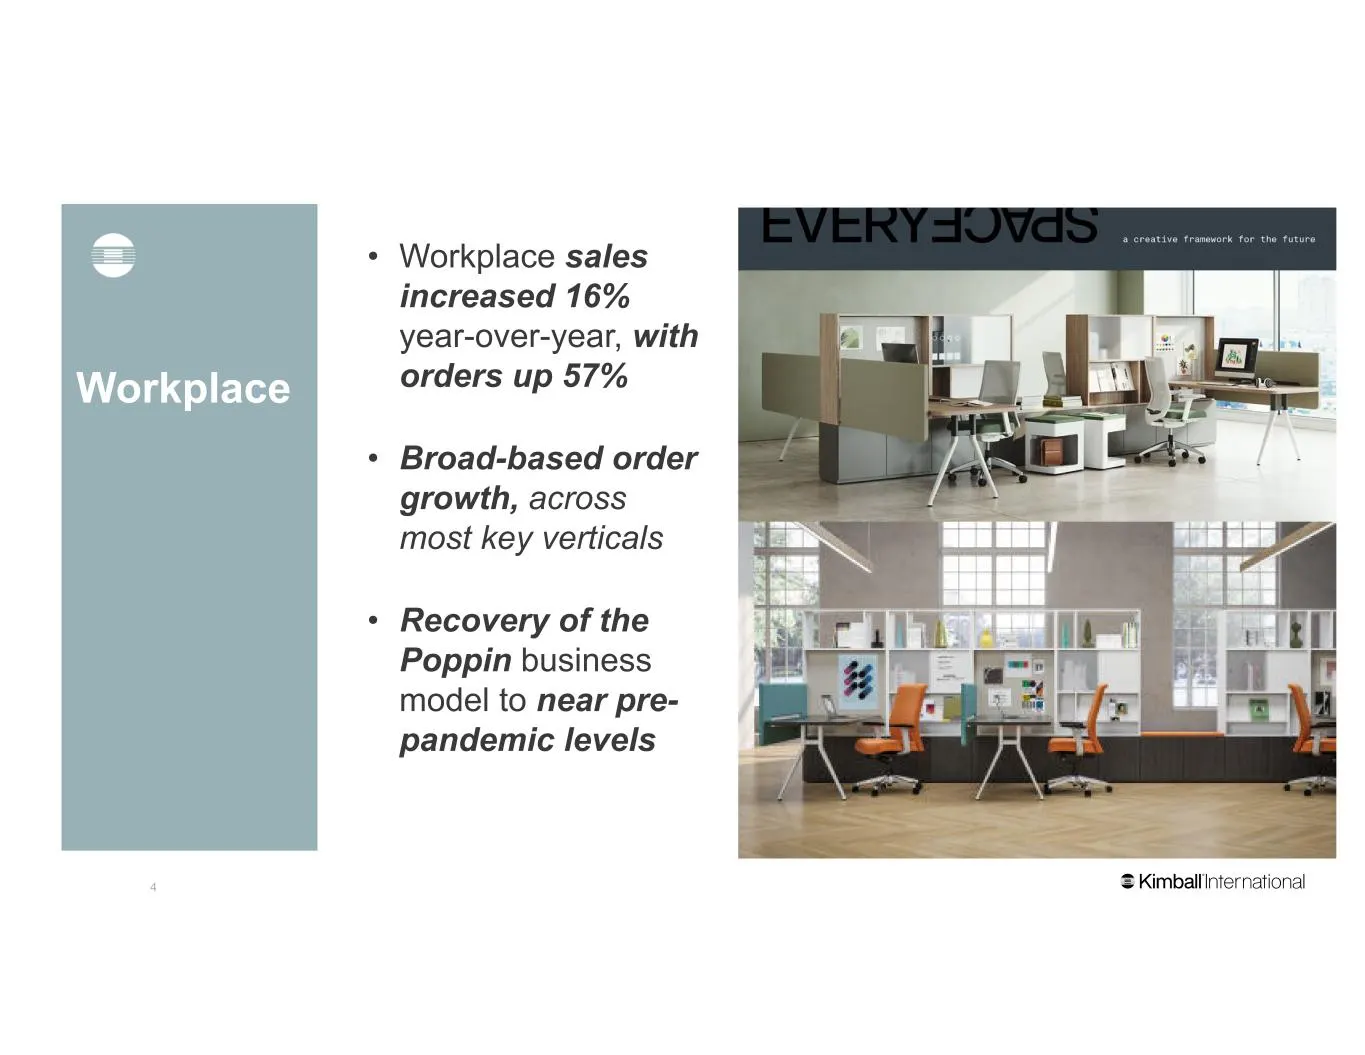
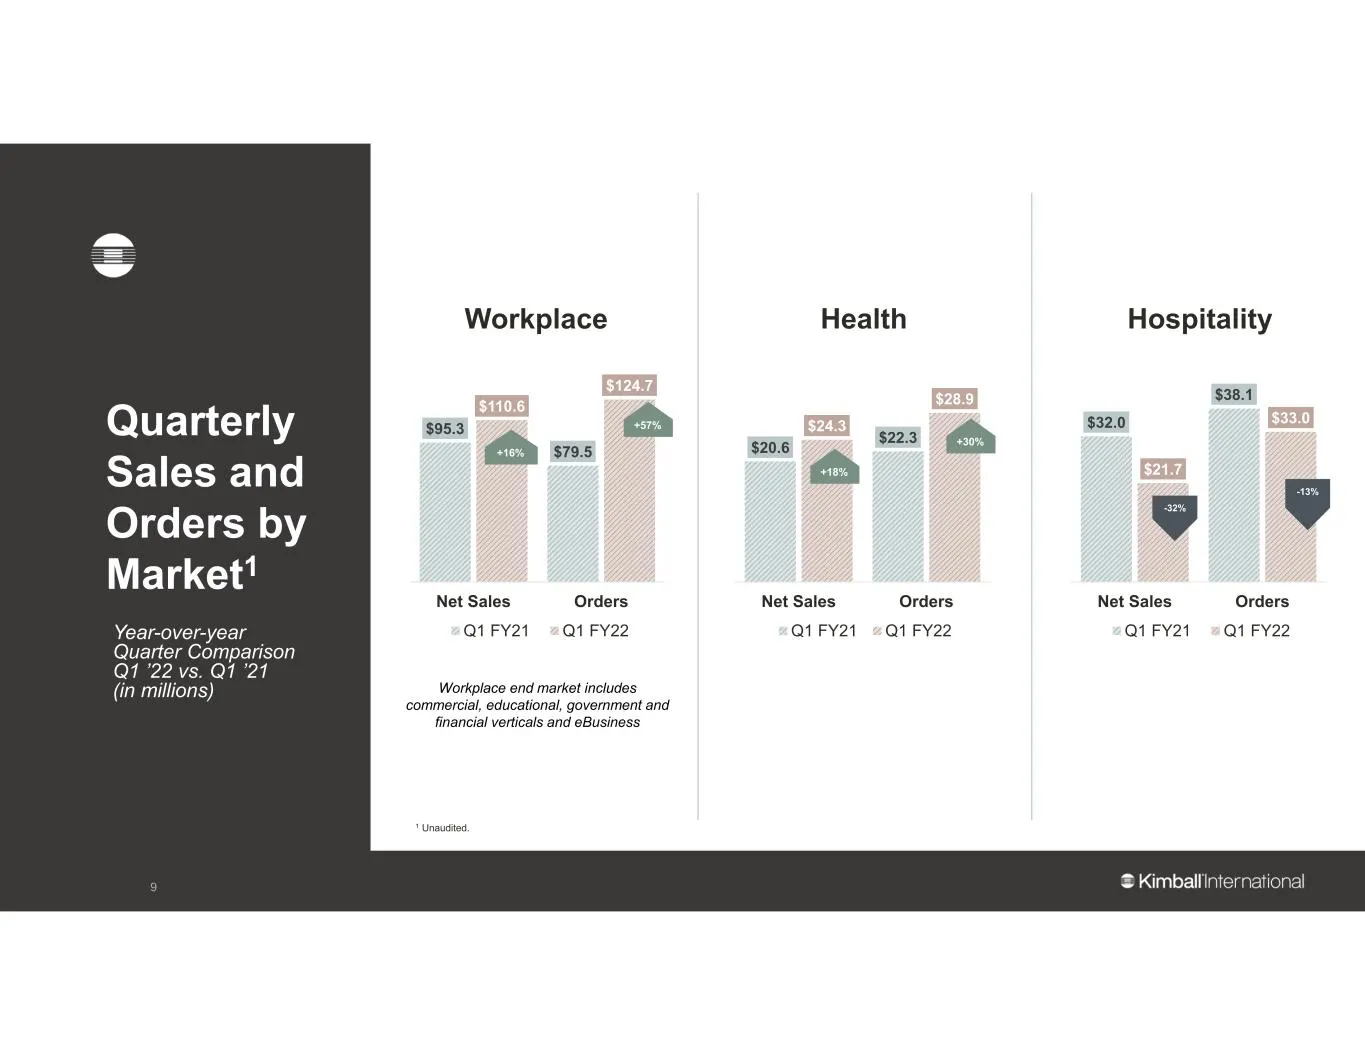
Workplace • Workplace sales increased 16% year-over-year, with orders up 57% • Broad-based order growth, across most key verticals • Recovery of the Poppin business model to near pre- pandemic levels 4
Slide 5: Health
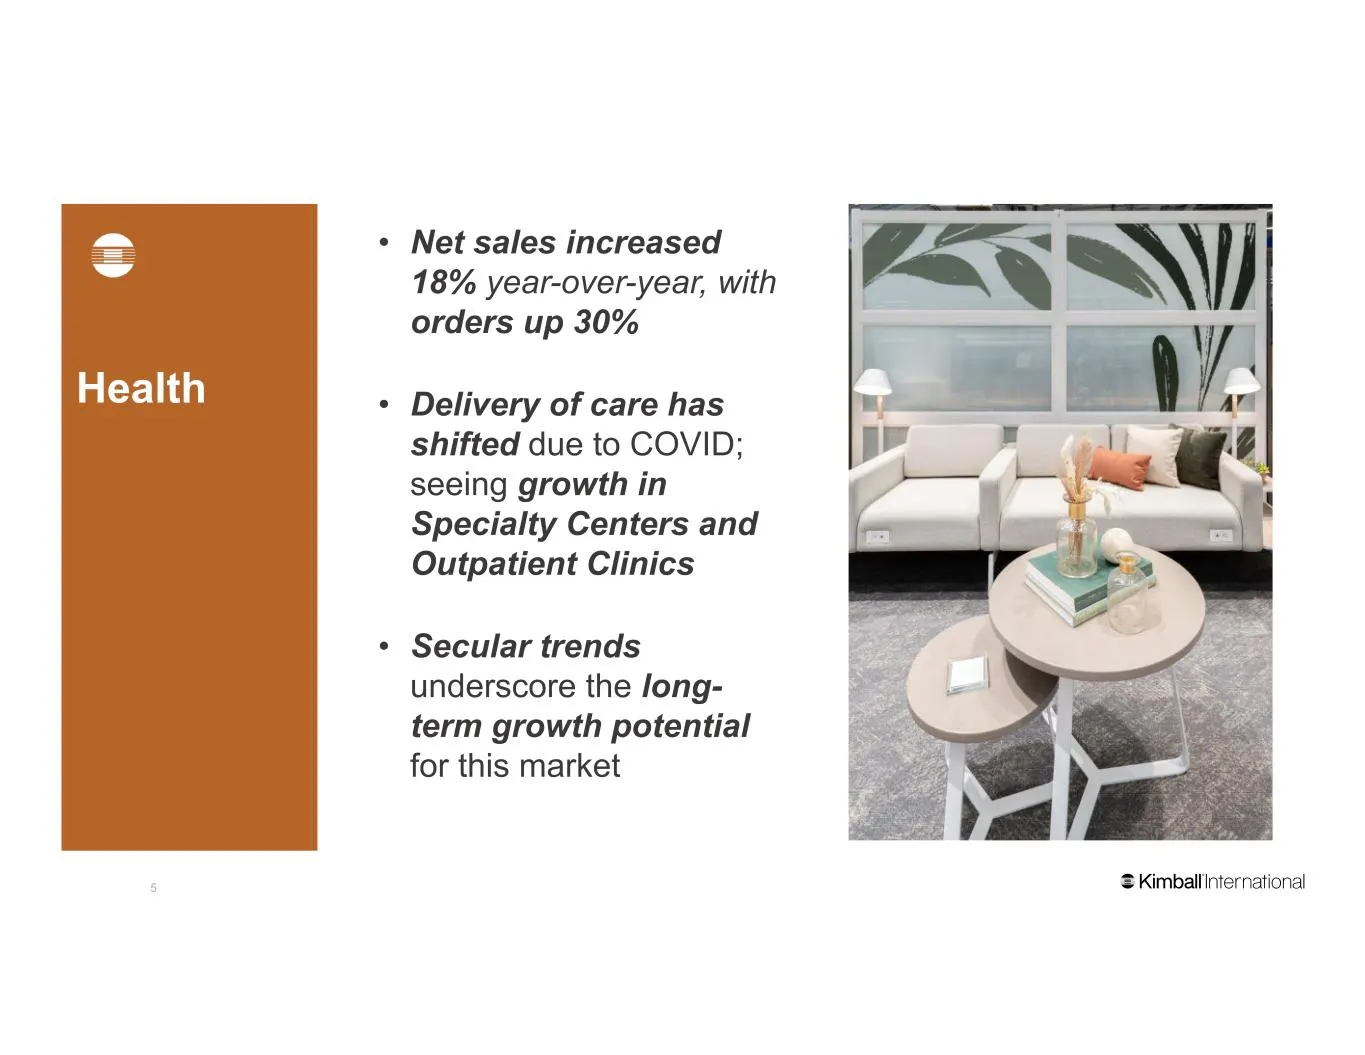
Health • Net sales increased 18% year-over-year, with orders up 30% • Delivery of care has shifted due to COVID; seeing growth in Specialty Centers and Outpatient Clinics • Secular trends underscore the long- term growth potential for this market Health 5
Slide 6: Looking Ahead
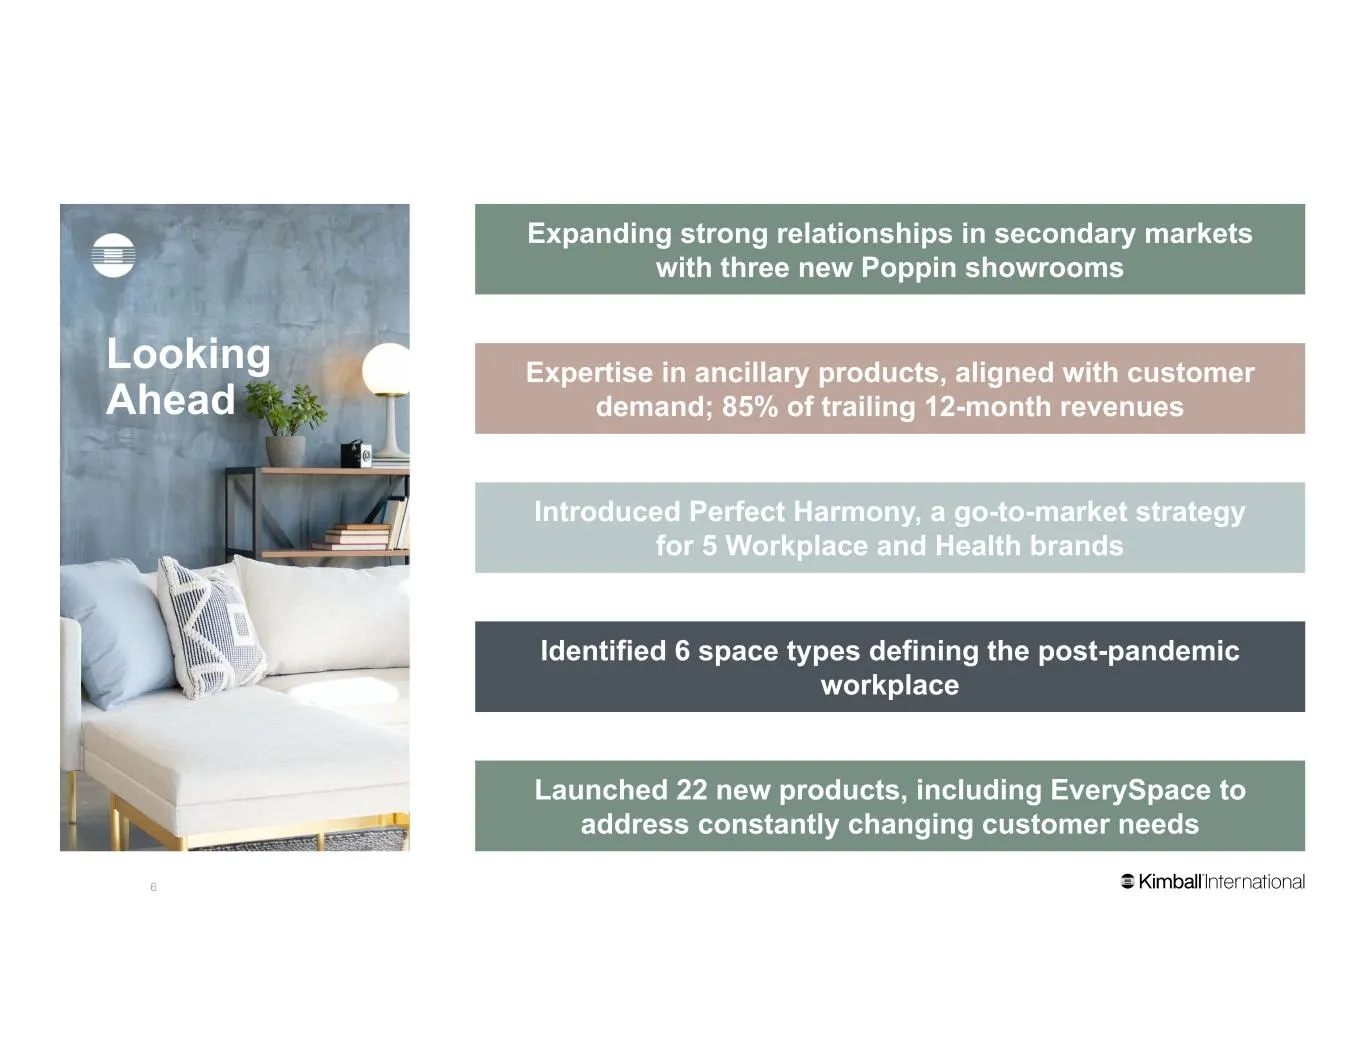
Looking Ahead Expanding strong relationships in secondary markets with three new Poppin showrooms Expertise in ancillary products, aligned with customer demand; 85% of trailing 12-month revenues Introduced Perfect Harmony, a go-to-market strategy for 5 Workplace and Health brands Identified 6 space
Slide 7: Q1 FY '22 Financial Highlights
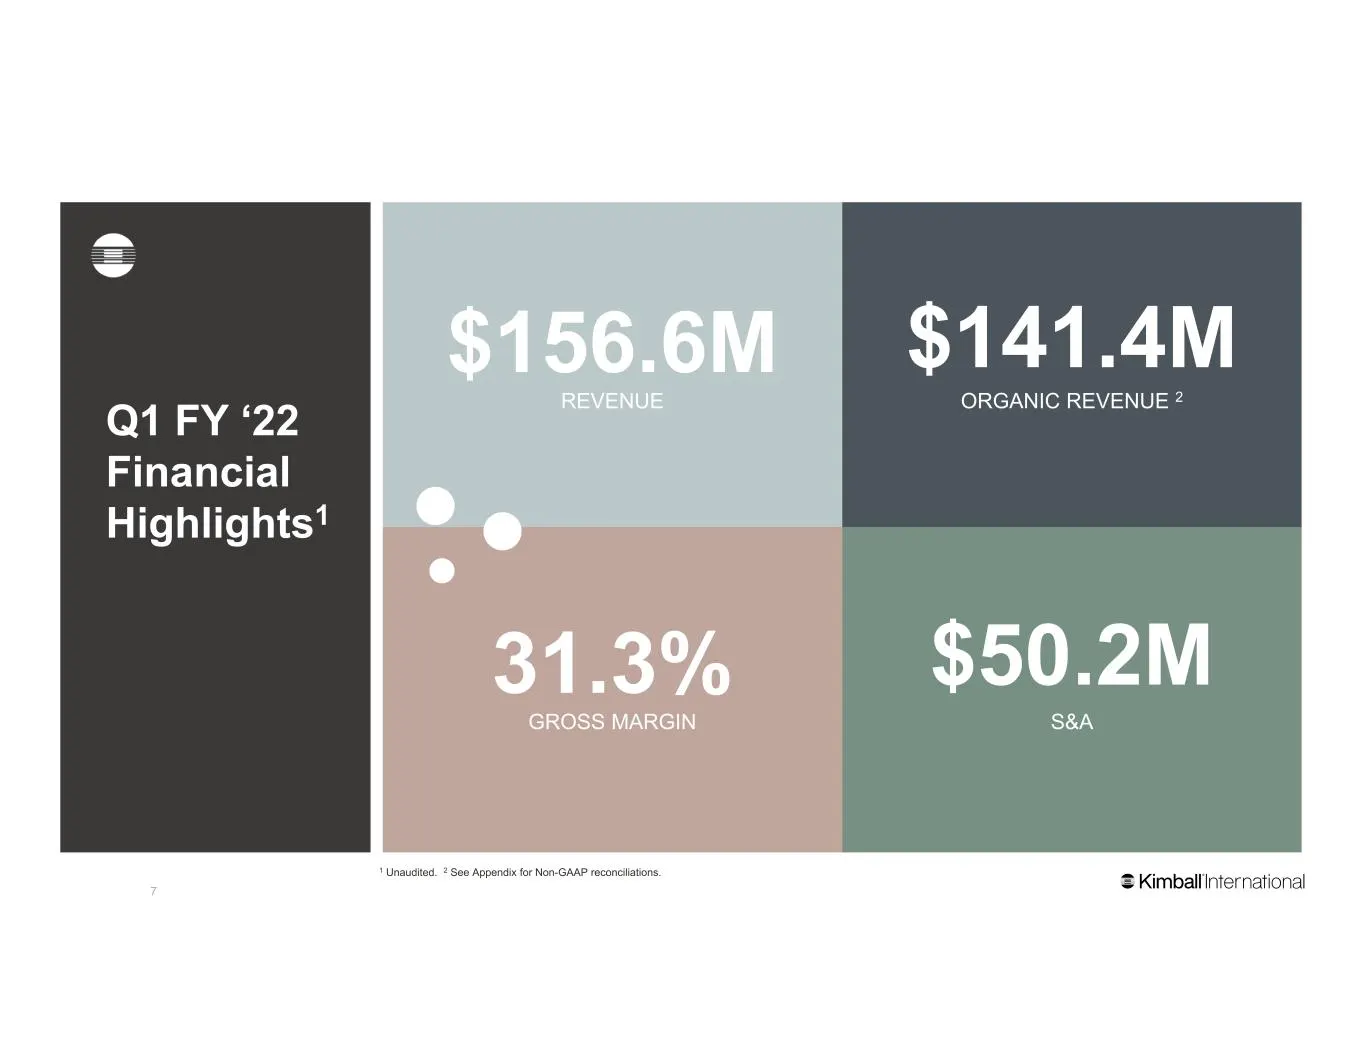
$156.6M REVENUE $141.4M ORGANIC REVENUE 2 31.3% GROSS MARGIN $50.2M S&A 1 Unaudited. 2 See Appendix for Non-GAAP reconciliations. Q1 FY ‘22 Financial Highlights1 7
Slide 8: Q1 FY '22 Financial Highlights (Continued)
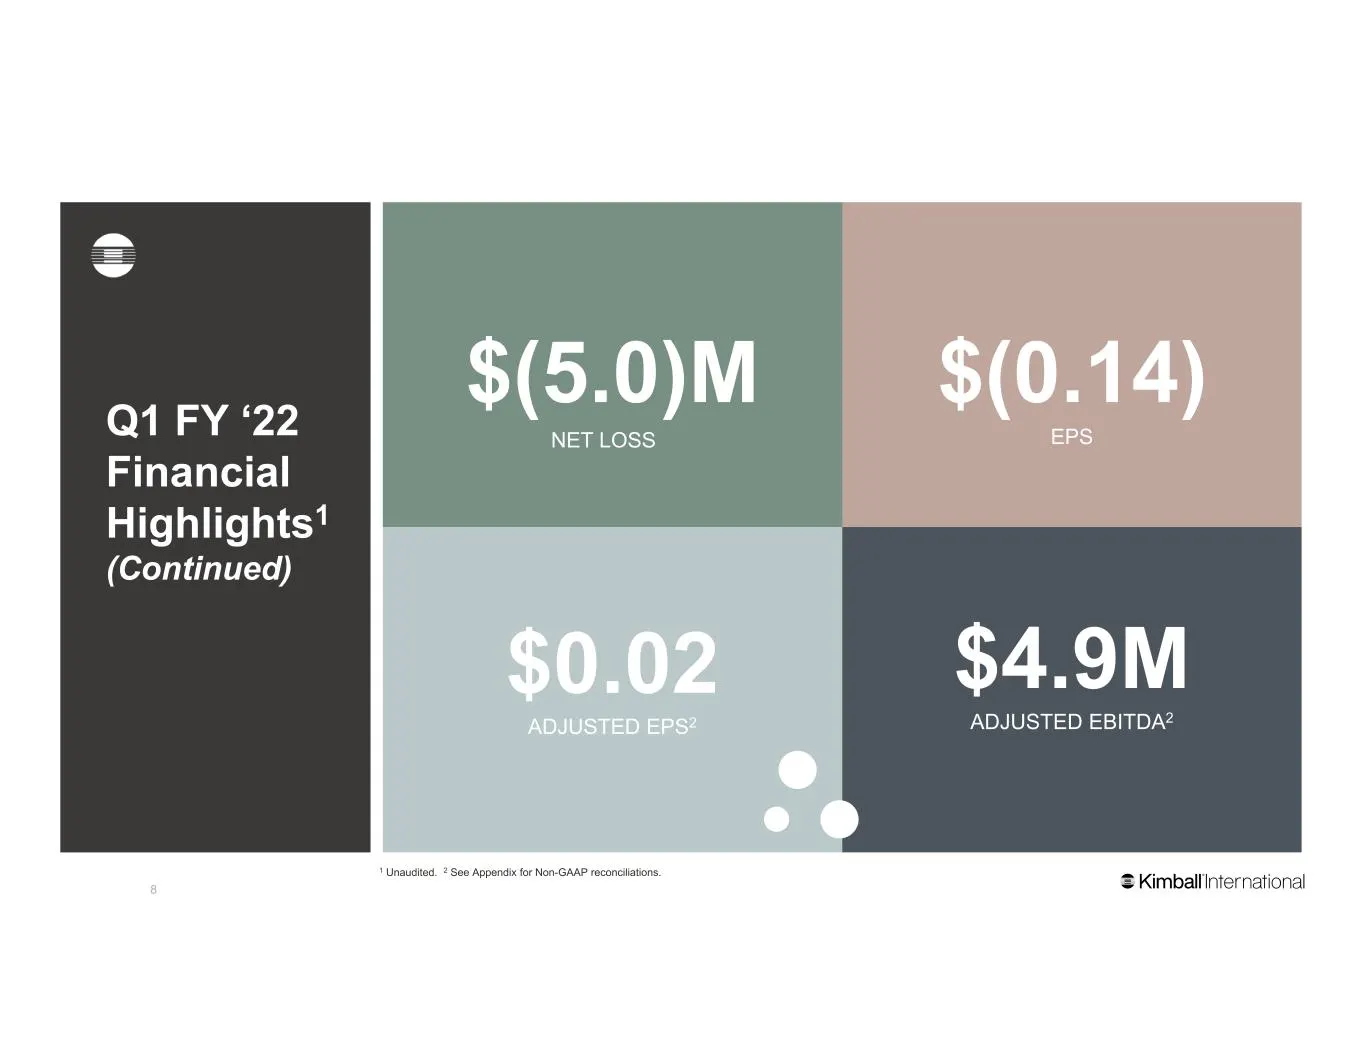
$(5.0)M $0.02 ADJUSTED EPS2 $4.9M ADJUSTED EBITDA2 $(0.14) 1 Unaudited. 2 See Appendix for Non-GAAP reconciliations. EPSNET LOSSQ1 FY ‘22 Financial Highlights1 (Continued) 8
Slide 9: Quarterly Sales and Orders by Market
Year-over-year Quarter Comparison Q1 ’22 vs. Q1 ’21 (in millions) Workplace end market includes commercial, educational, government and financial verticals and eBusiness 1 Unaudited. $95.3 $79.5 $110.6 $124.7 Net Sales Orders Q1 FY21 Q1 FY22 +16% Workplace $20.6 $22.3 $24.3 $28.9 Net Sales Orders Q1
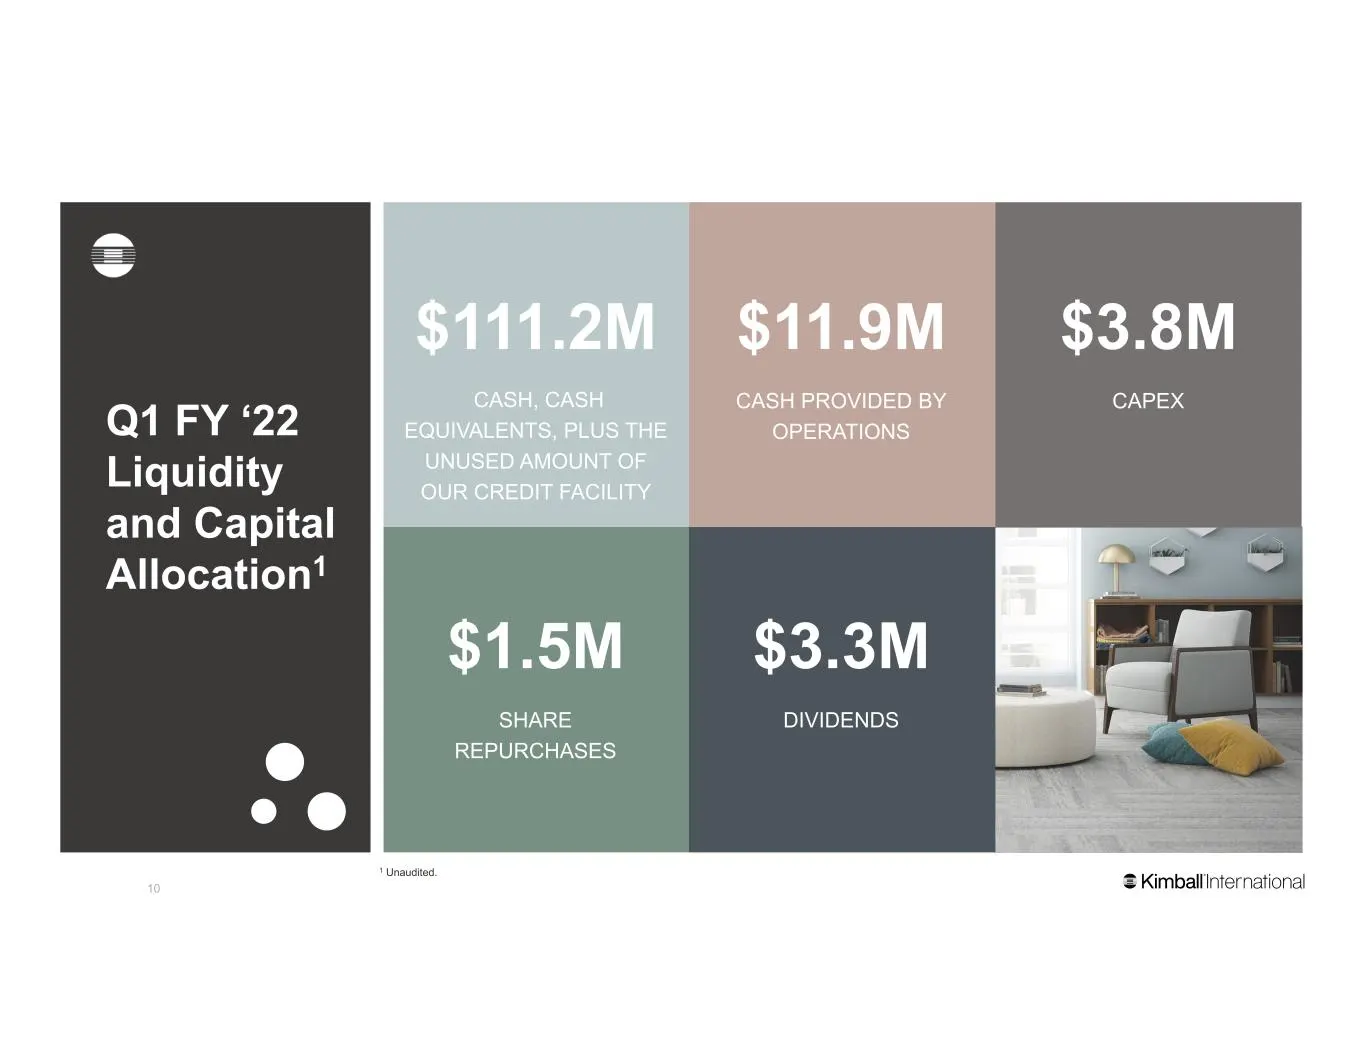
Slide 10: Q1 FY '22 Liquidity and Capital Allocation
$111.2M CASH, CASH EQUIVALENTS, PLUS THE UNUSED AMOUNT OF OUR CREDIT FACILITY $11.9M CASH PROVIDED BY OPERATIONS $3.8M CAPEX $1.5M SHARE REPURCHASES $3.3M DIVIDENDS 1 Unaudited. Q1 FY ‘22 Liquidity and Capital Allocation1 10
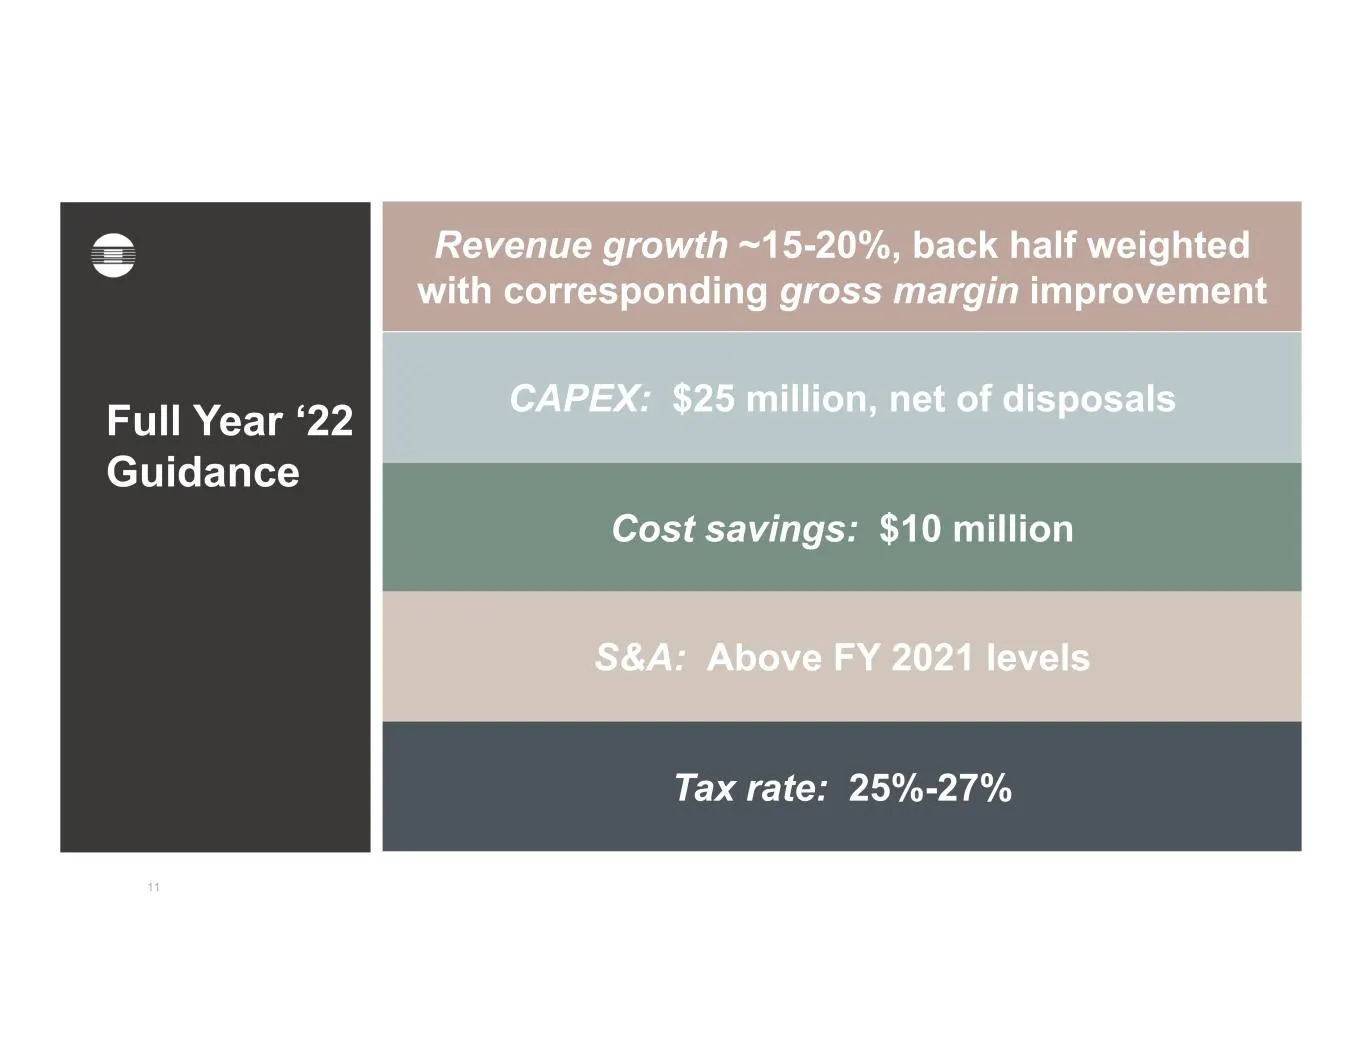
Slide 11: Full Year '22 Guidance
Revenue growth ~15-20%, back half weighted with corresponding gross margin improvement CAPEX: $25 million, net of disposals Cost savings: $10 million S&A: Above FY 2021 levels Full Year ‘22 Guidance Tax rate: 25%-27% 11
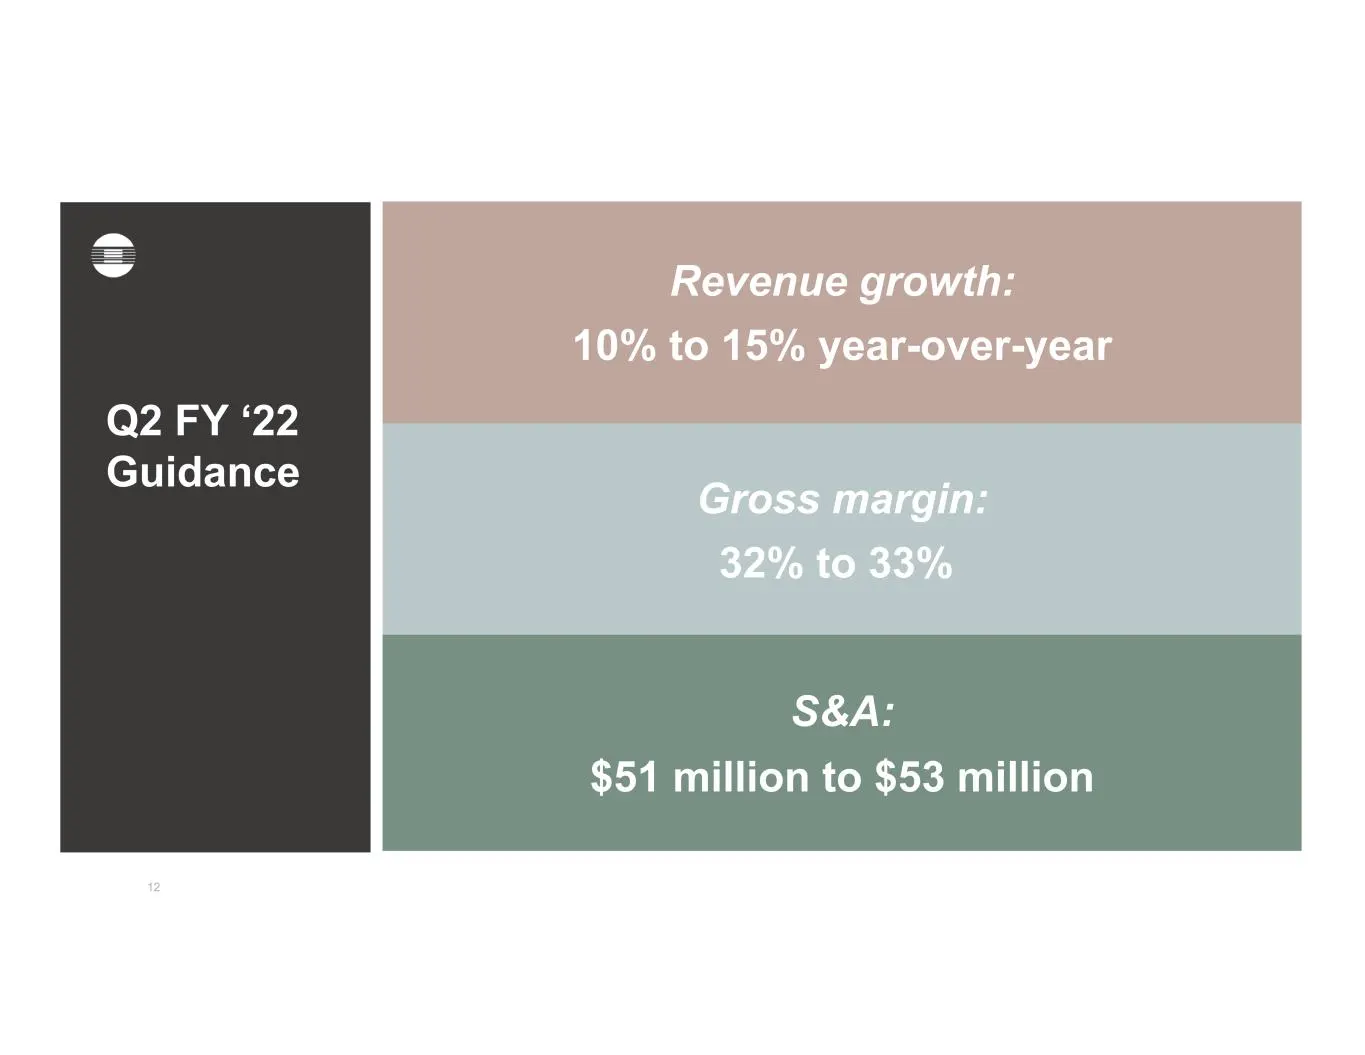
Slide 12: Q2 FY '22 Guidance
Revenue growth: 10% to 15% year-over-year Gross margin: 32% to 33% S&A: $51 million to $53 million Q2 FY ‘22 Guidance 12
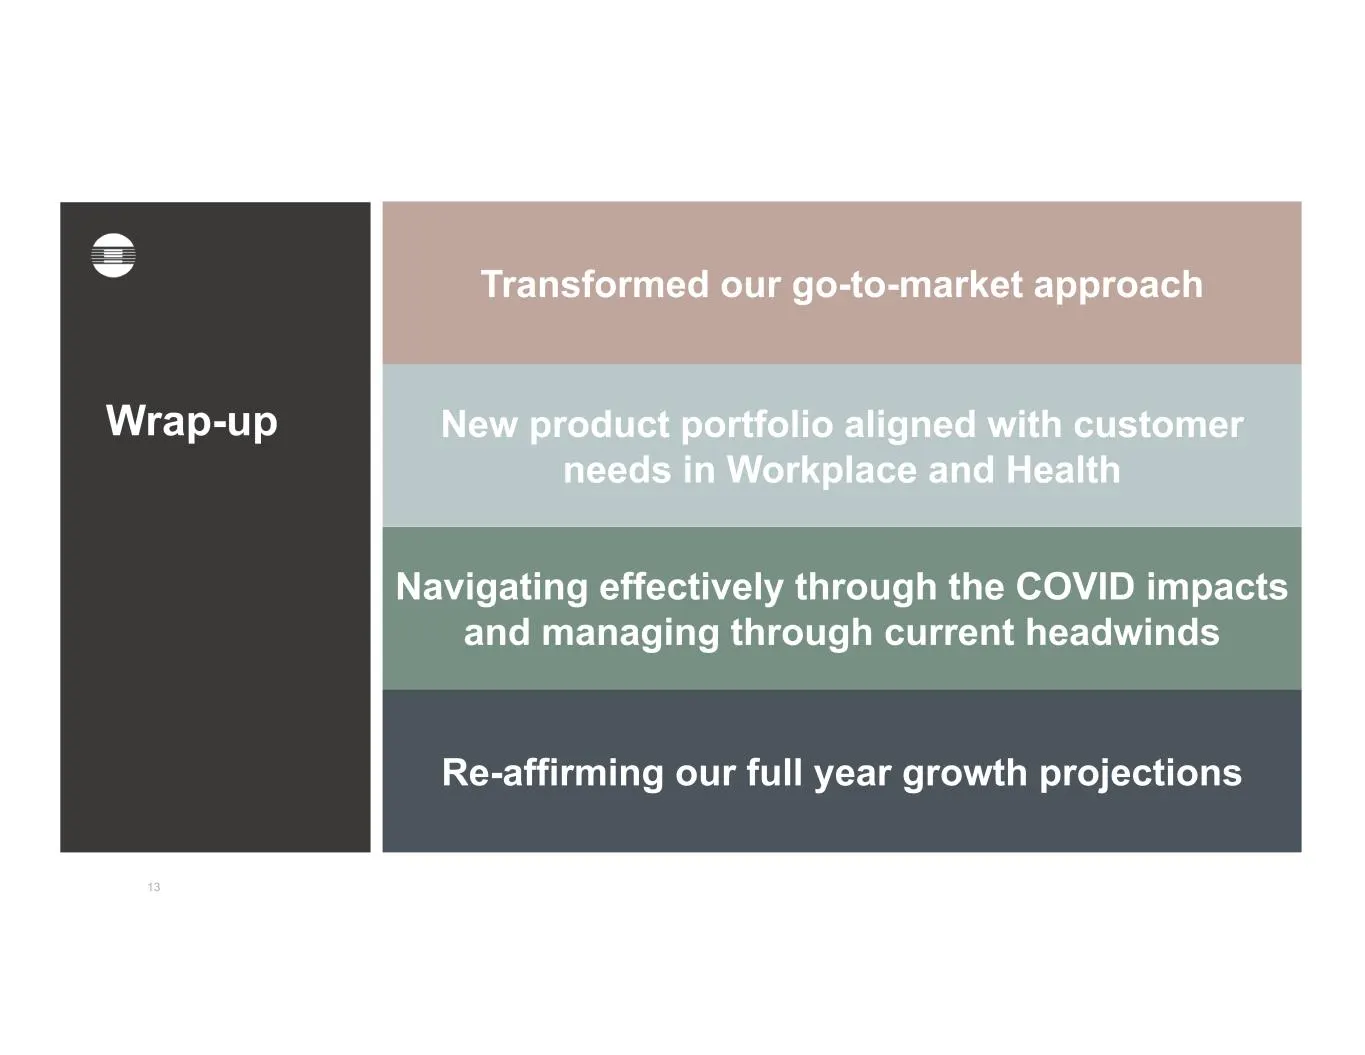
Slide 13: Wrap-up
Transformed our go-to-market approach New product portfolio aligned with customer needs in Workplace and Health Re-affirming our full year growth projections Navigating effectively through the COVID impacts and managing through current headwinds Wrap-up 13
Slide 14: Our Vision for Impact: ESG Roadmap
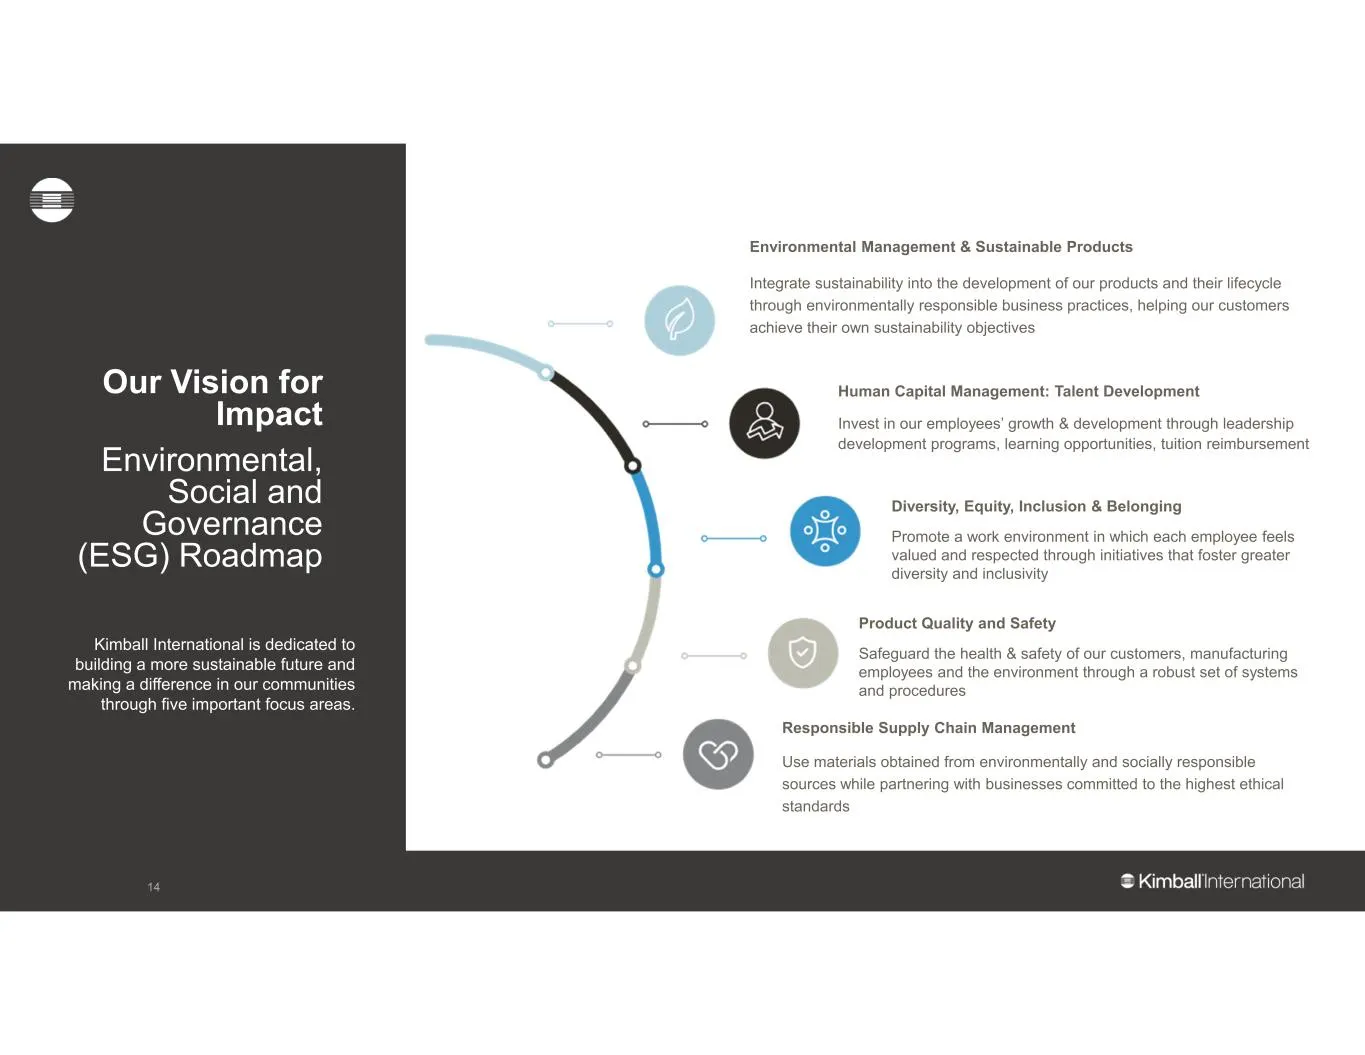
Our Vision for Impact Environmental, Social and Governance (ESG) Roadmap Kimball International is dedicated to building a more sustainable future and making a difference in our communities through five important focus areas. Environmental Management & Sustainable Products Integrate sustainability in
Slide 15: Appendix
APPENDIX = Kimball International
Slide 16: Non-GAAP Reconciliation (Unaudited)
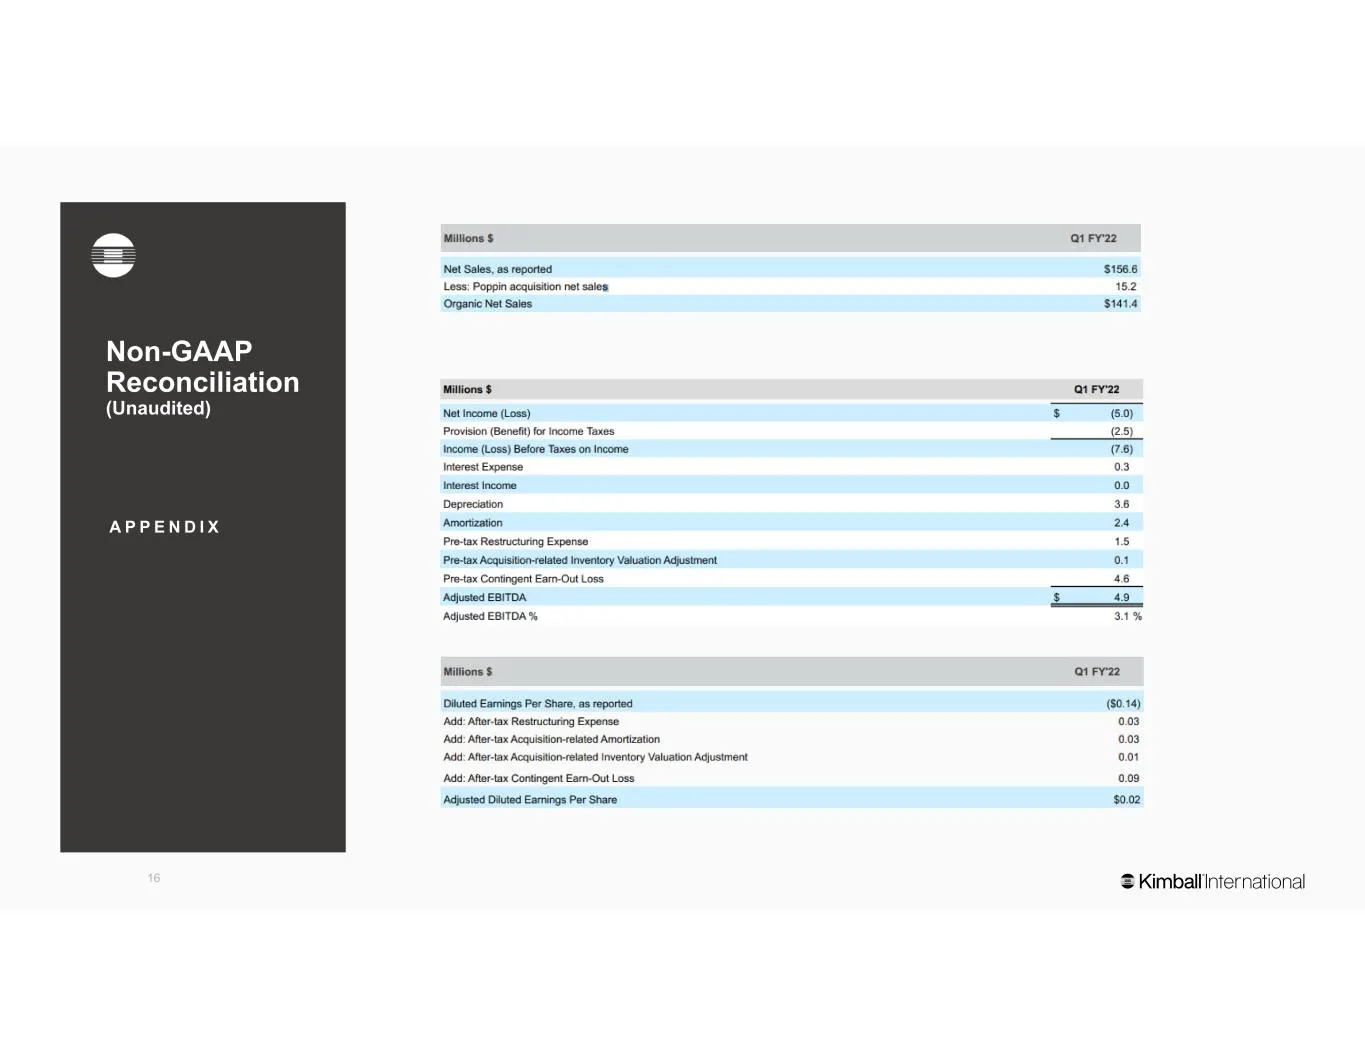
16 Non-GAAP Reconciliation (Unaudited) A P P E N D I X 16
Source: SEC EDGAR · 8-K filed Nov 4, 2021
More decks from Kimball International Inc
 Merger or Acquisition (May 2023)30 slides · May 23, 2023
 Merger or Acquisition (March 2023)15 slides · Mar 8, 2023
 Q2 FY2023 Earnings Presentation16 slides · Feb 2, 2023
 Q1 FY2023 Earnings Presentation17 slides · Nov 3, 2022
 Q4 FY2022 Earnings Presentation18 slides · Aug 4, 2022
 Q3 FY2022 Earnings Presentation17 slides · May 3, 2022