RFA Financial Inc. · TSX:RFA
RFA Financial — Artis Real Estate Investment Trust — Q3 2017 Earnings Presentation
22 slides from RFA Financial's earnings presentation, November 2017
Slide 1: Q3 – 2017 Investor Presentation
Q3 – 2017 Investor Presentation Artis Real Estate Investment Trust
Slide 2: Forward Looking Statements
Forward Looking Statements This presentation may contain forward-looking statements. For this purpose, any statements contained herein that are not statements of historical fact may be deemed to be forward-looking statements. Without limiting the foregoing, the words “expects”, “anticipates”, “inten
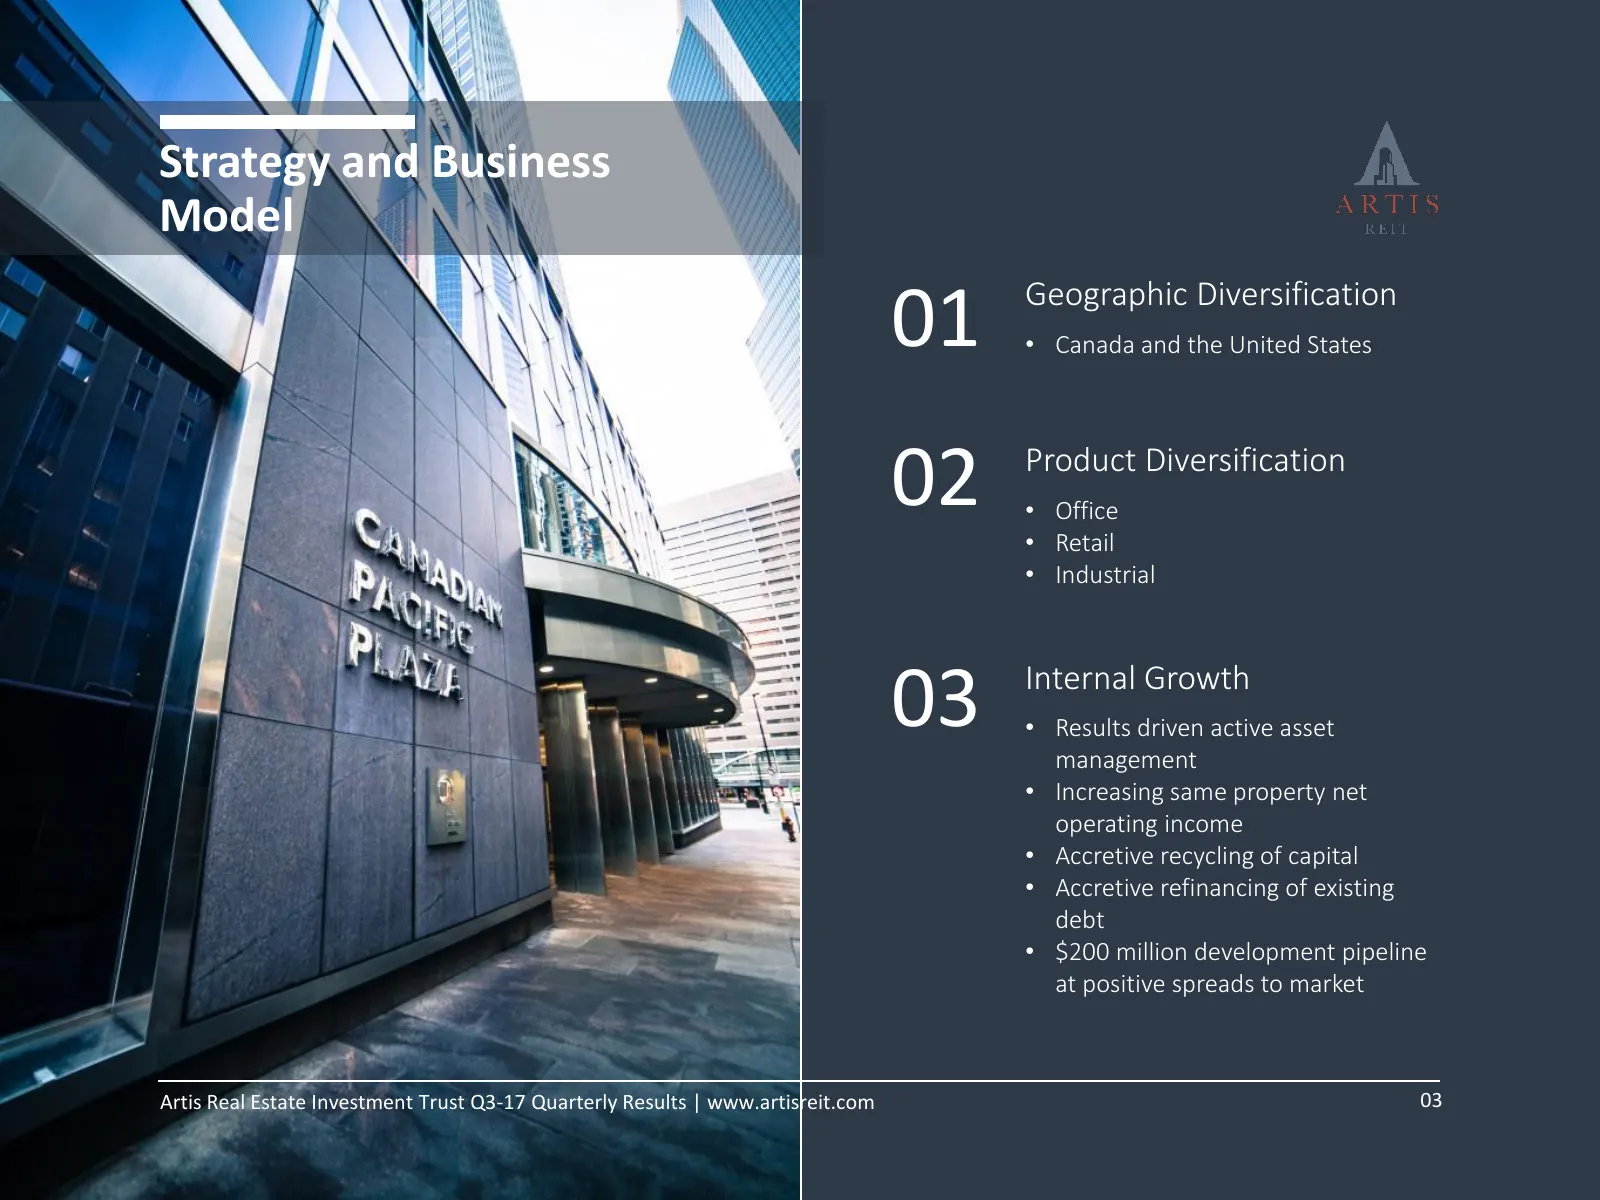
Slide 3: Strategy and Business Model
Strategy and Business Model Geographic Diversification 01 • Canada and the United States 02 Product Diversification • Office • Retail • Industrial 03 Internal Growth • Results driven active asset management • Increasing same property net operating income • Accretive recycling of capital • Accretive
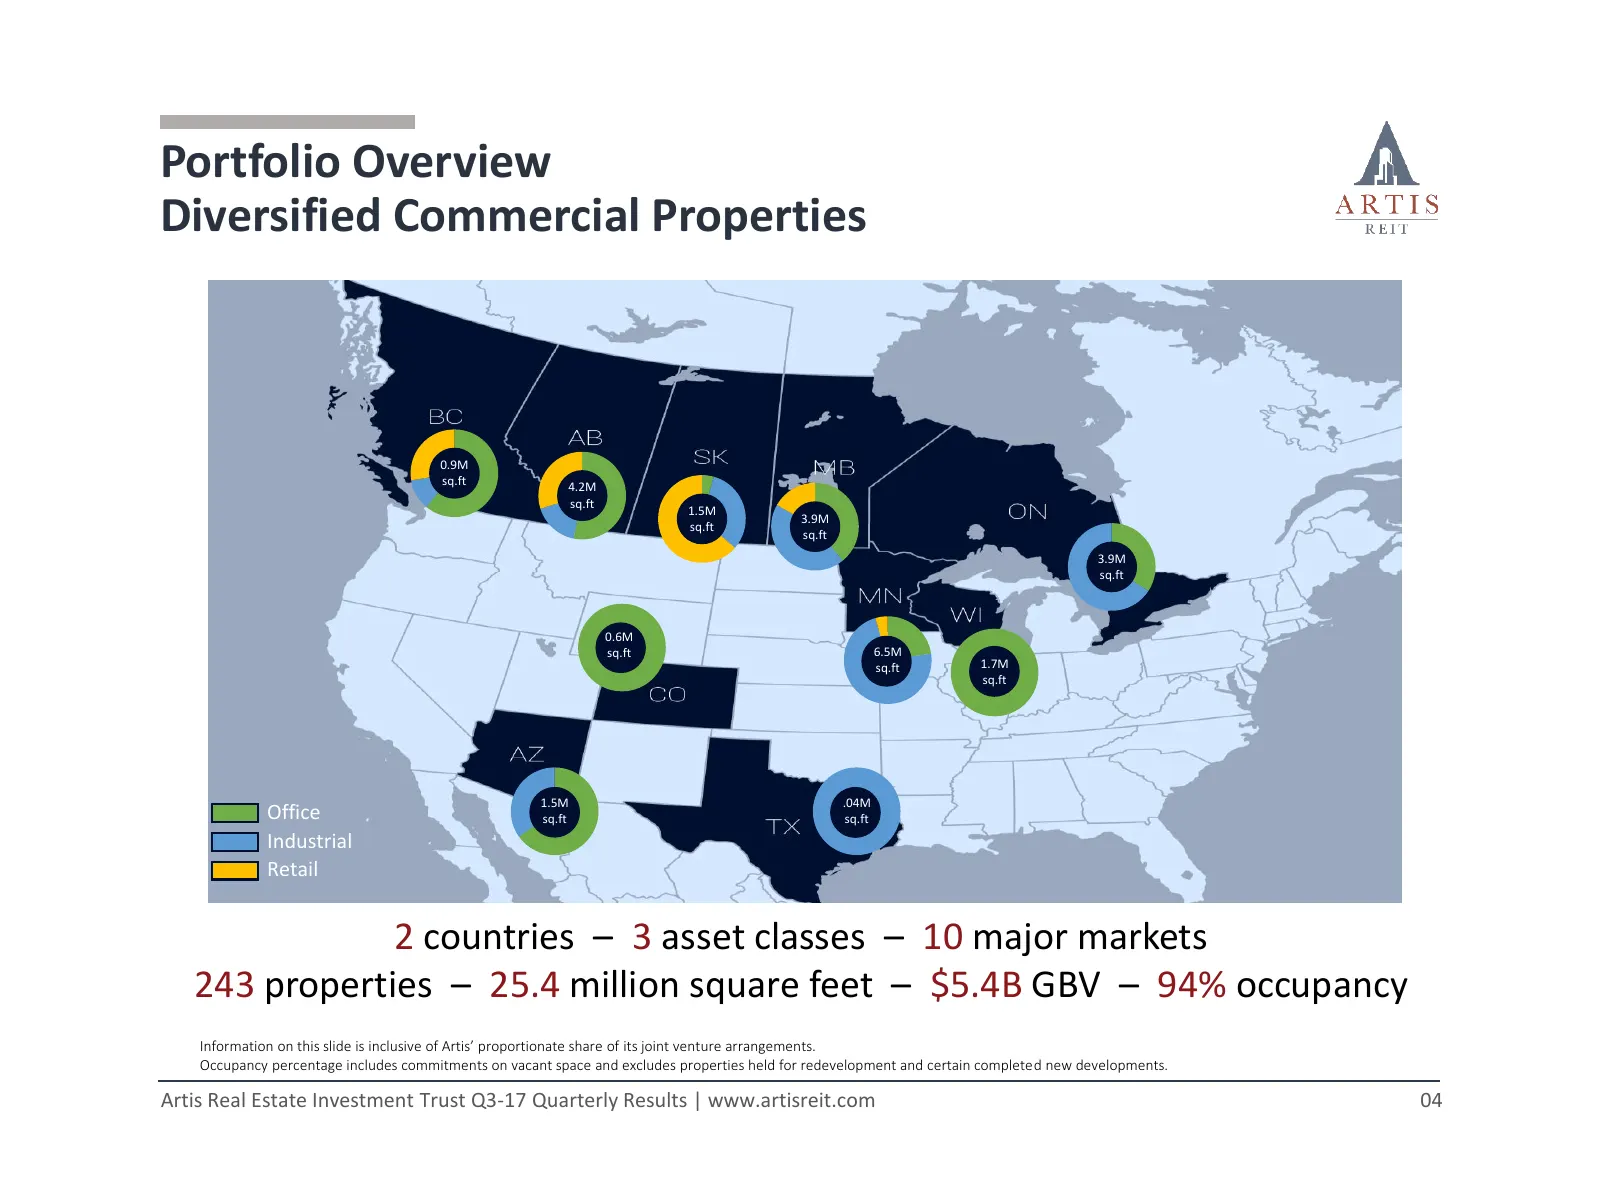
Slide 4: Portfolio Overview Diversified Commercial Properties
Portfolio Overview Diversified Commercial Properties 0.9M sq.ft 4.2M sq.ft 1.5M 3.9M sq.ft sq.ft 3.9M sq.ft 0.6M sq.ft 6.5M sq.ft 1.7M sq.ft 1.5M .04M Office sq.ft sq.ft Industrial Retail 2 countries – 3 asset classes – 10 major markets 243 properties – 25.4 million square feet – $5.4B GBV – 94% occ
Slide 5: Portfolio Diversification
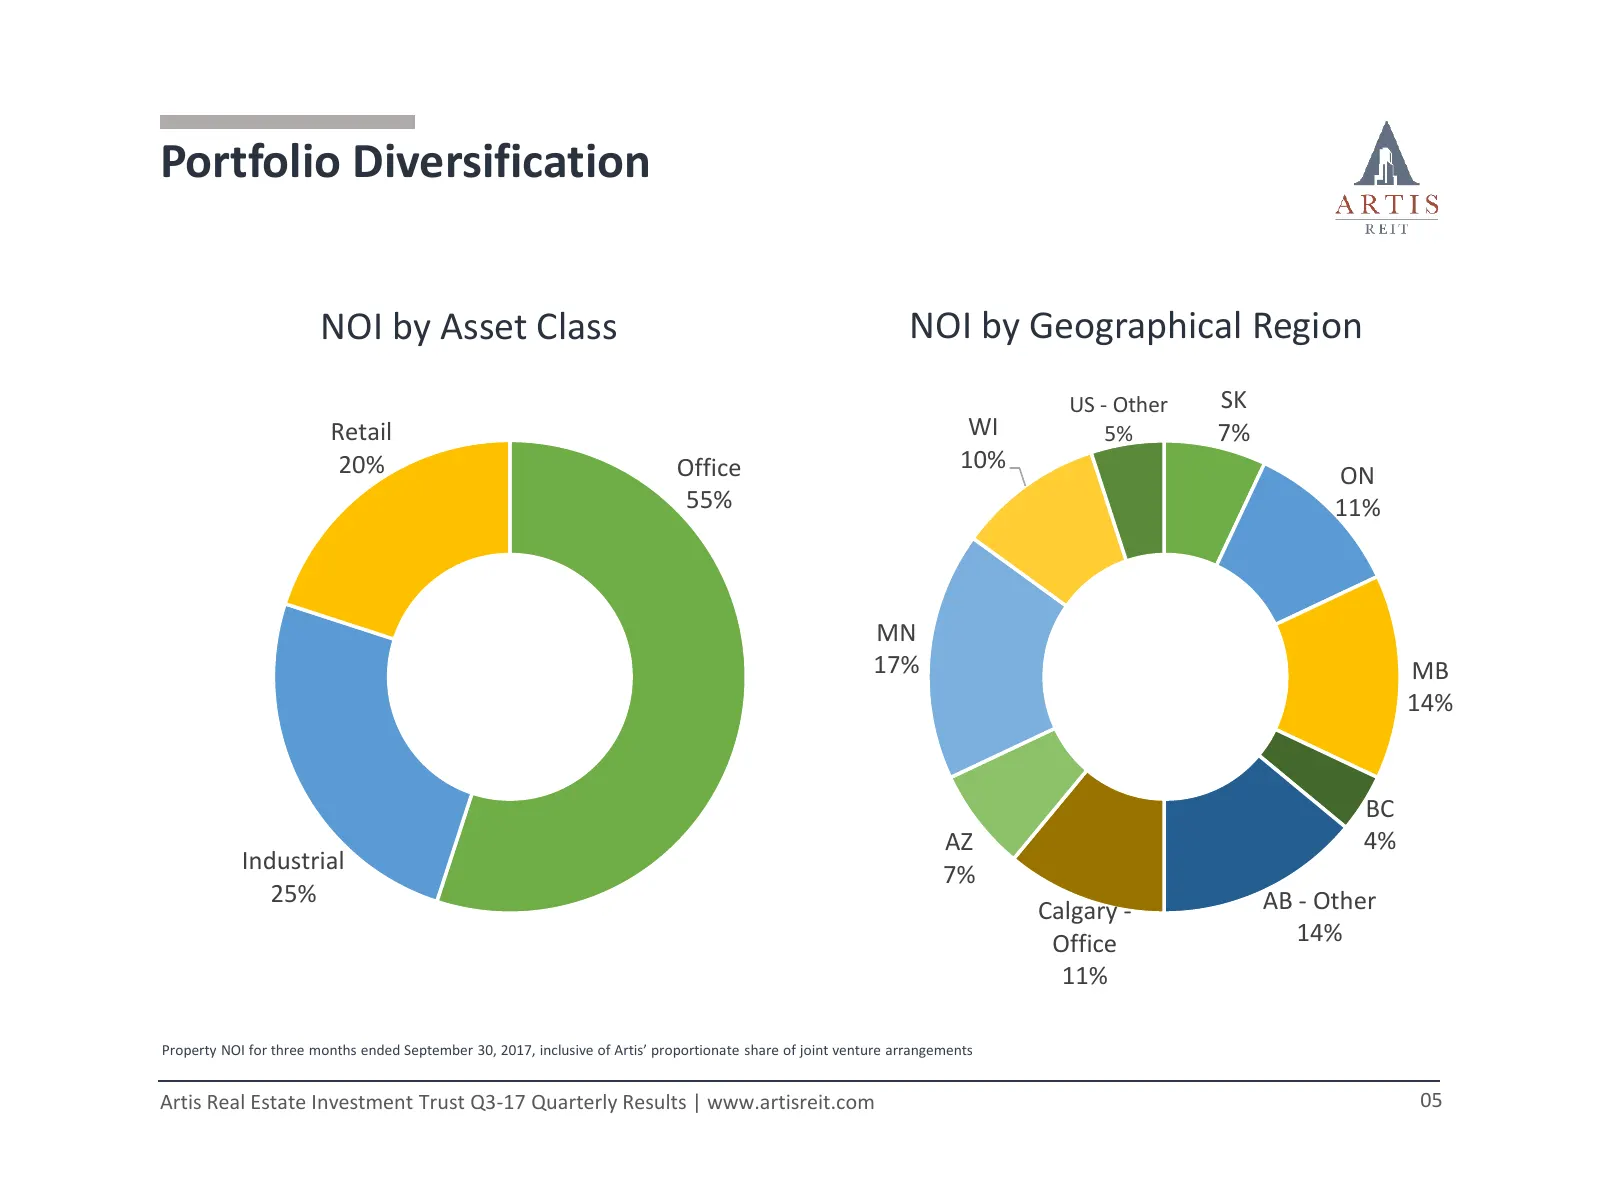
Portfolio Diversification NOI by Asset Class NOI by Geographical Region US - Other SK Retail WI 5% 7% 20% Office 10% ON 55% 11% MN 17% MB 14% BC AZ 4% Industrial 7% 25% AB - Other Calgary - Office 14% 11% Property NOI for three months ended September 30, 2017, inclusive of Artis’ proportionate share
Slide 6: Lease Expiration Schedule
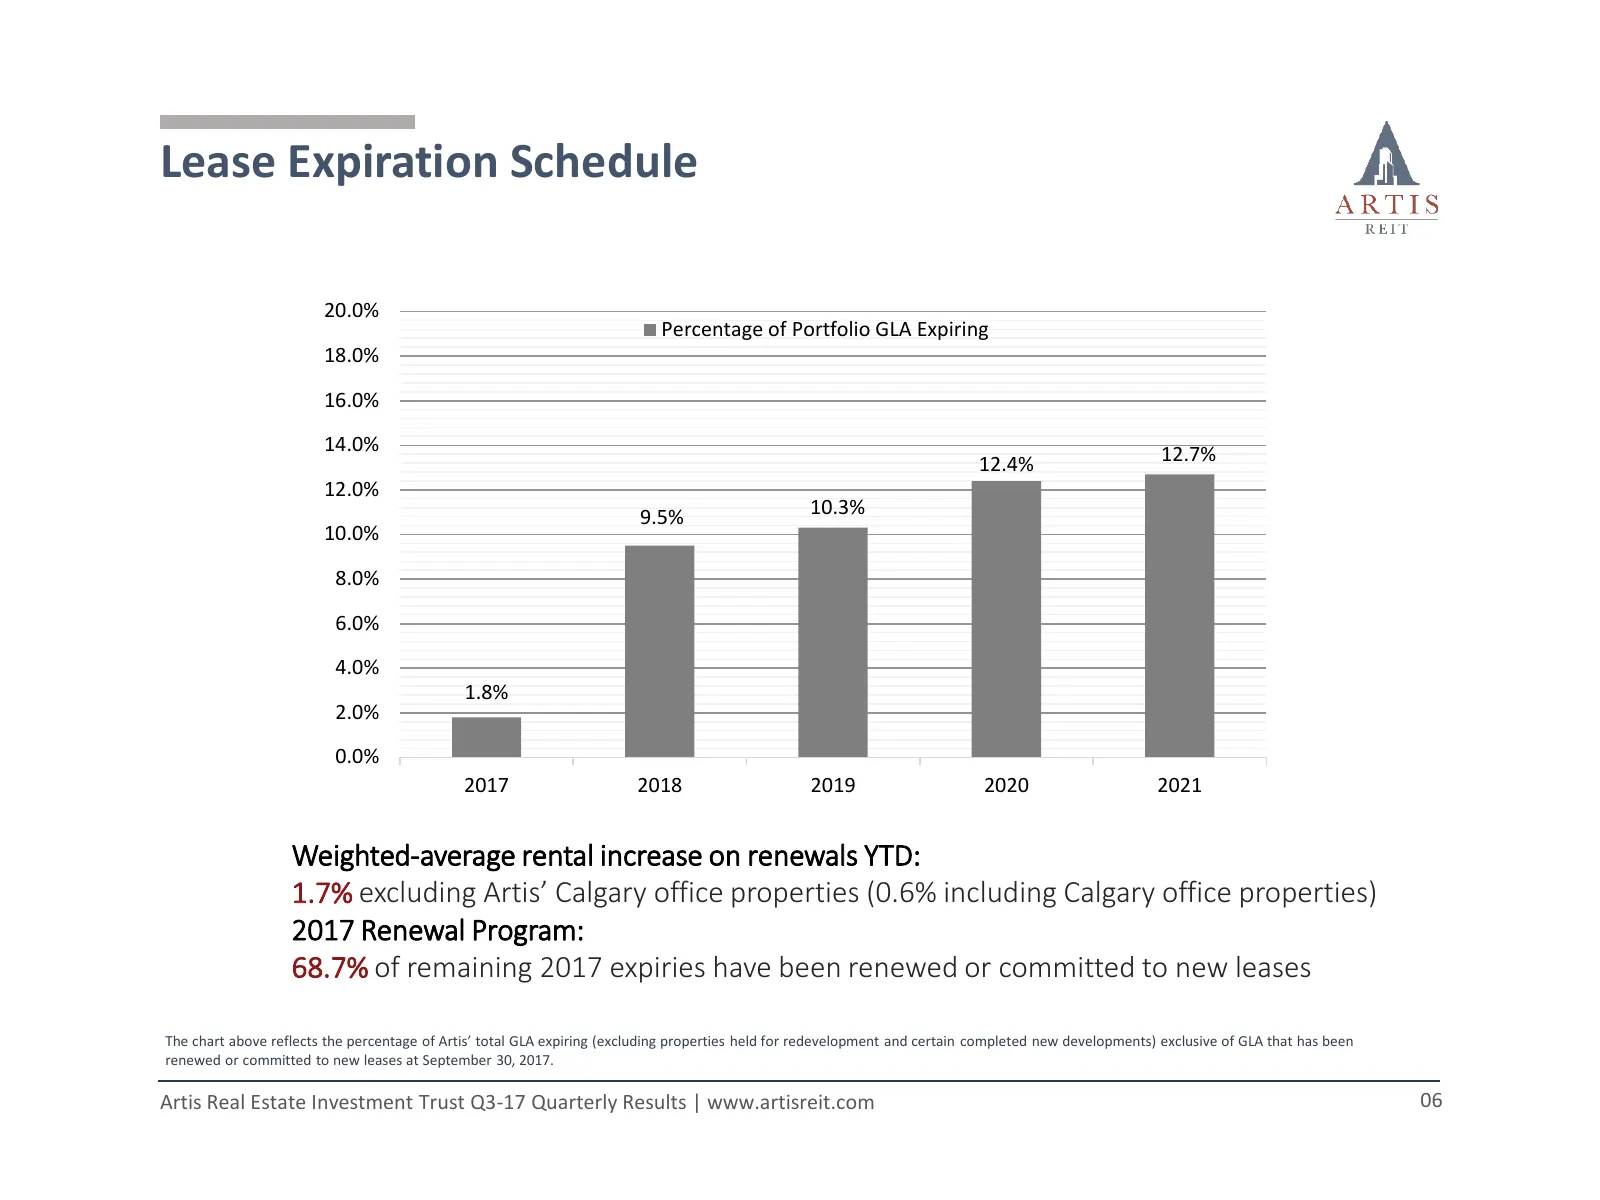
Lease Expiration Schedule 20.0% Percentage of Portfolio GLA Expiring 18.0% 16.0% 14.0% 12.7% 12.4% 12.0% 9.5% 10.3% 10.0% 8.0% 6.0% 4.0% 1.8% 2.0% 0.0% 2017 2018 2019 2020 2021 Weighted-average rental increase on renewals YTD: 1.7% excluding Artis’ Calgary office properties (0.6% including Calgary o
Slide 7: Artis’ Investment in Alberta
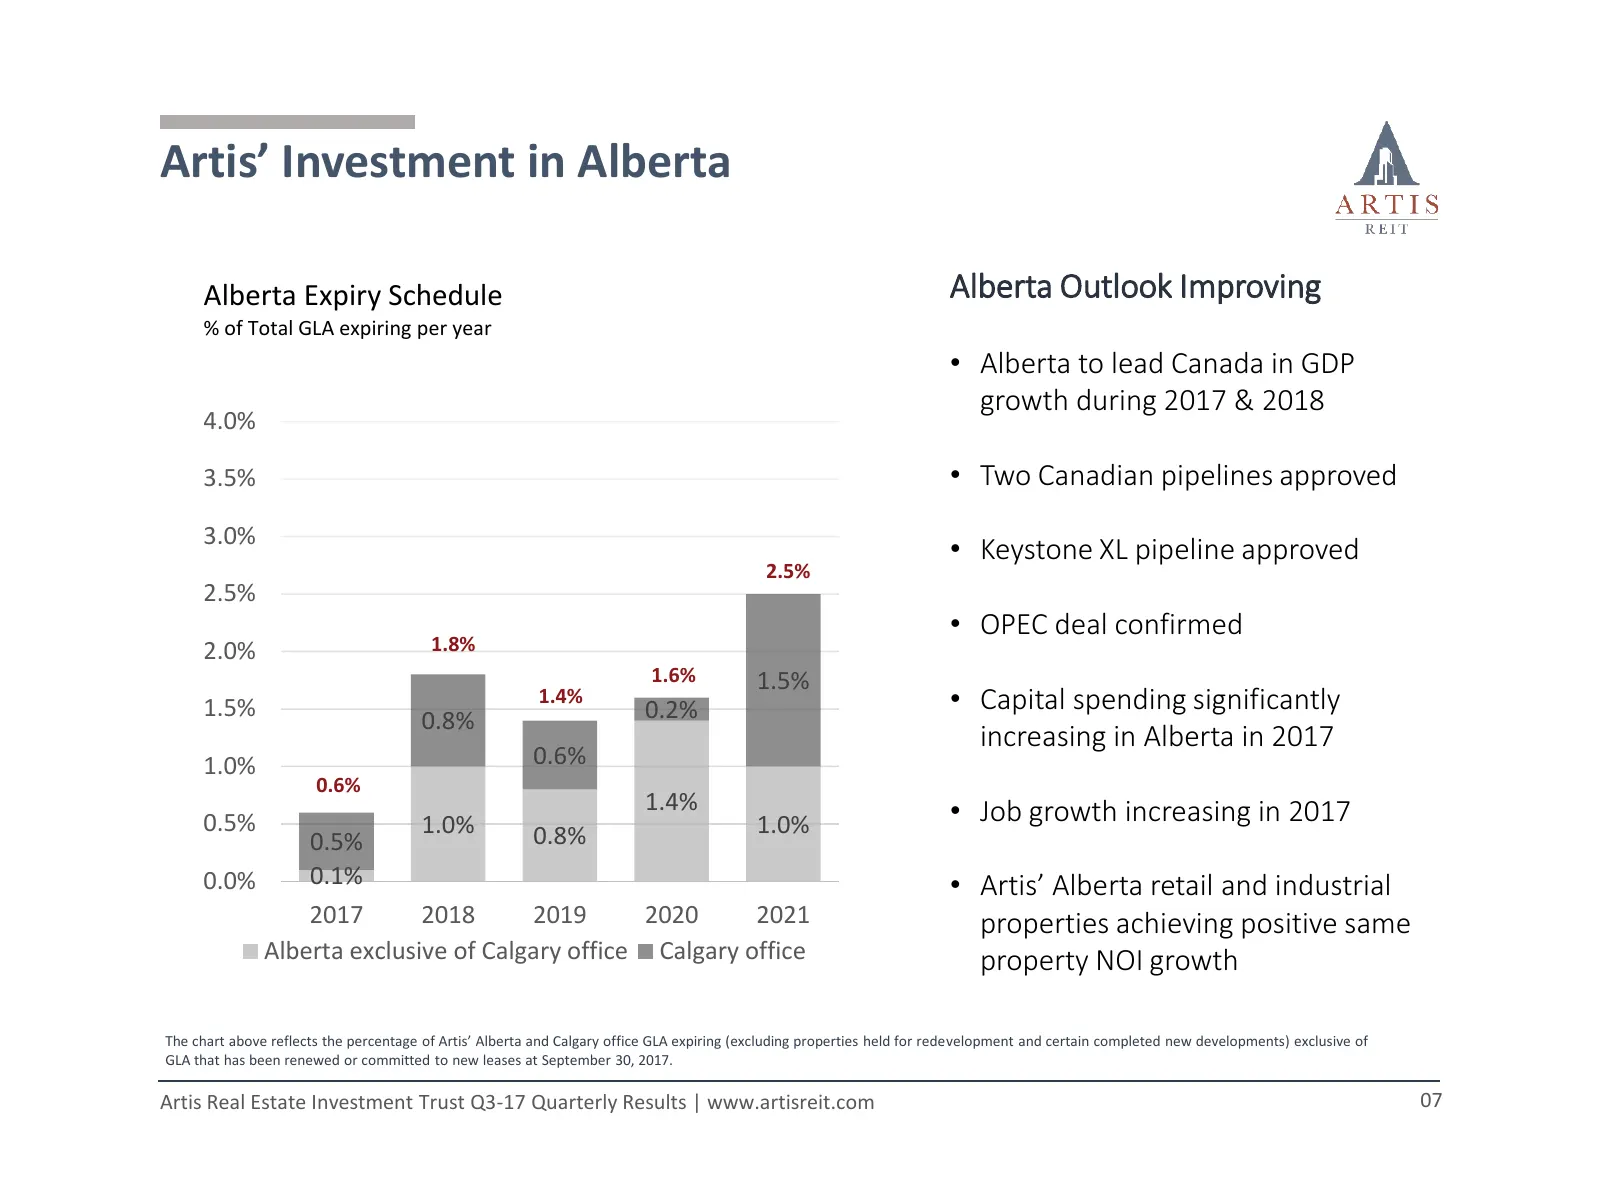
Artis’ Investment in Alberta Alberta Expiry Schedule Alberta Outlook Improving % of Total GLA expiring per year • Alberta to lead Canada in GDP growth during 2017 & 2018 4.0% 3.5% • Two Canadian pipelines approved 3.0% • Keystone XL pipeline approved 2.5% 2.5% • OPEC deal confirmed 2.0% 1.8% 1.6% 1.
Slide 8: Artis’ Investment in Alberta
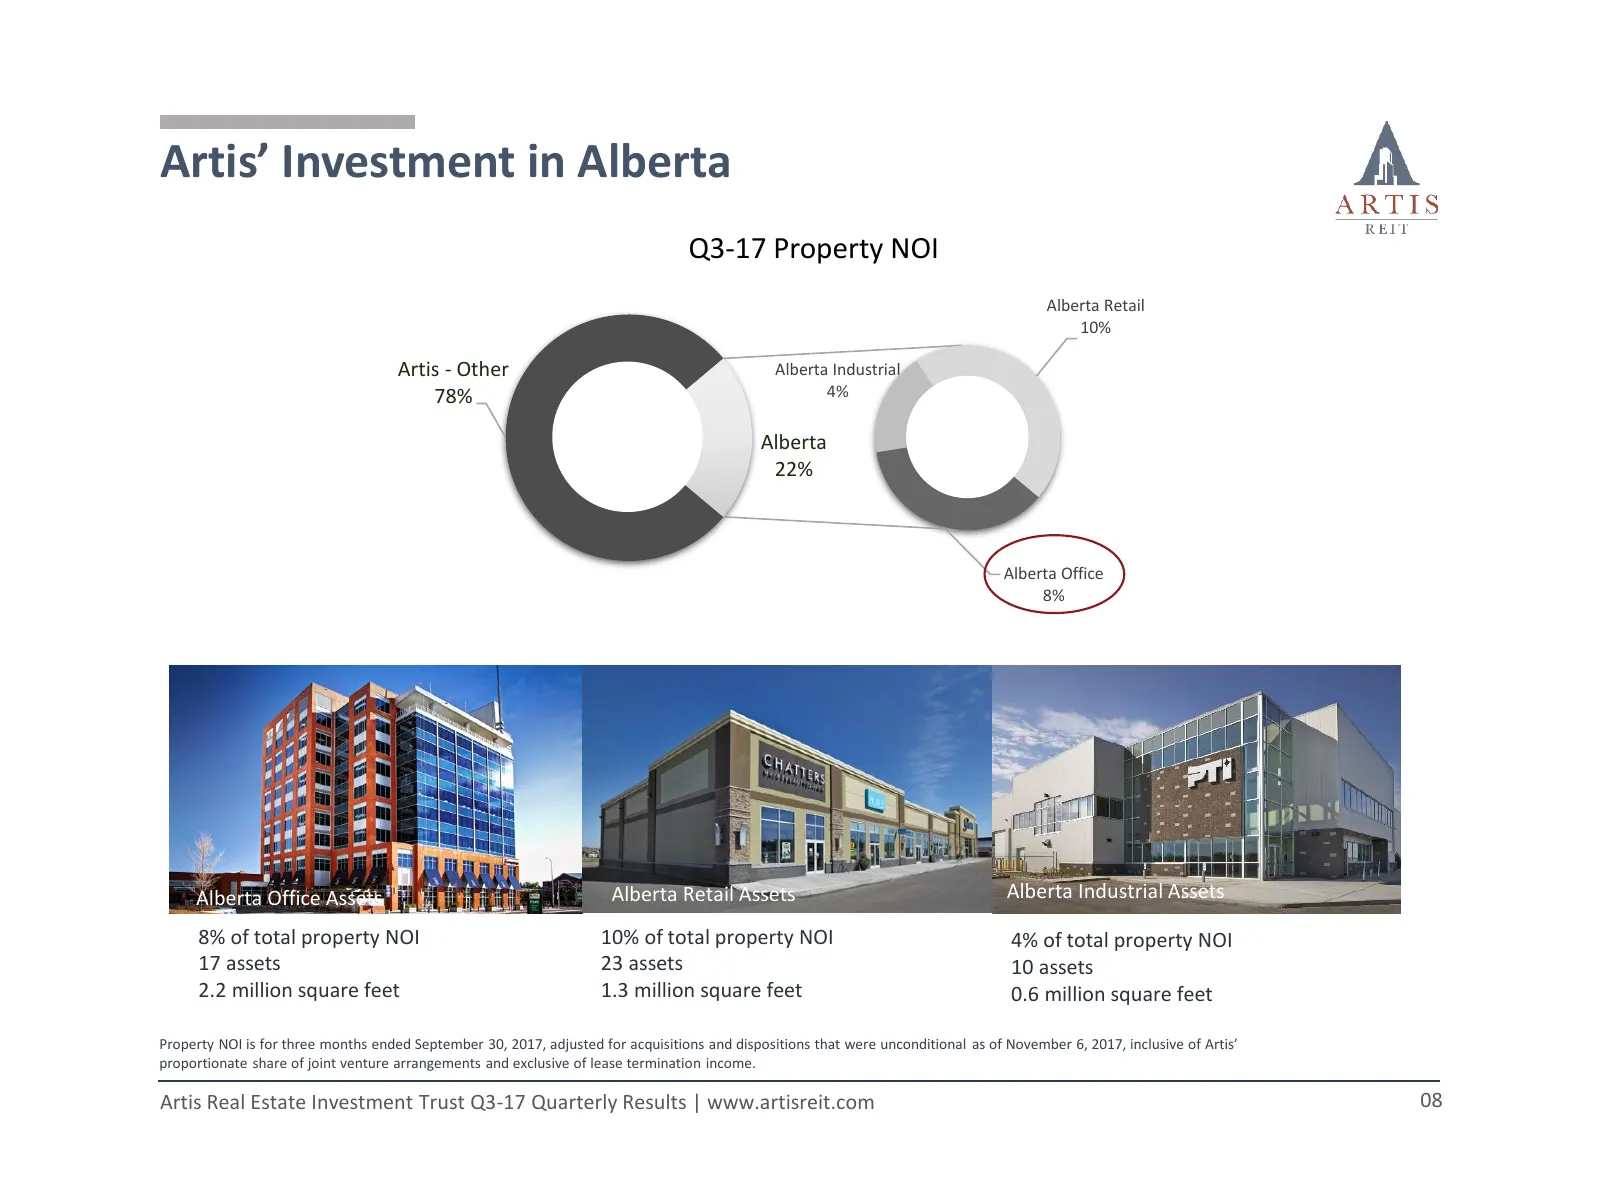
Artis’ Investment in Alberta Q3-17 Property NOI Alberta Retail 10% Artis - Other Alberta Industrial 78% 4% Alberta 22% Alberta Office 8% Alberta Office Assets Alberta Retail Assets Alberta Industrial Assets 8% of total property NOI 10% of total property NOI 4% of total property NOI 17 assets 23 asse
Slide 9: Leverage Profile
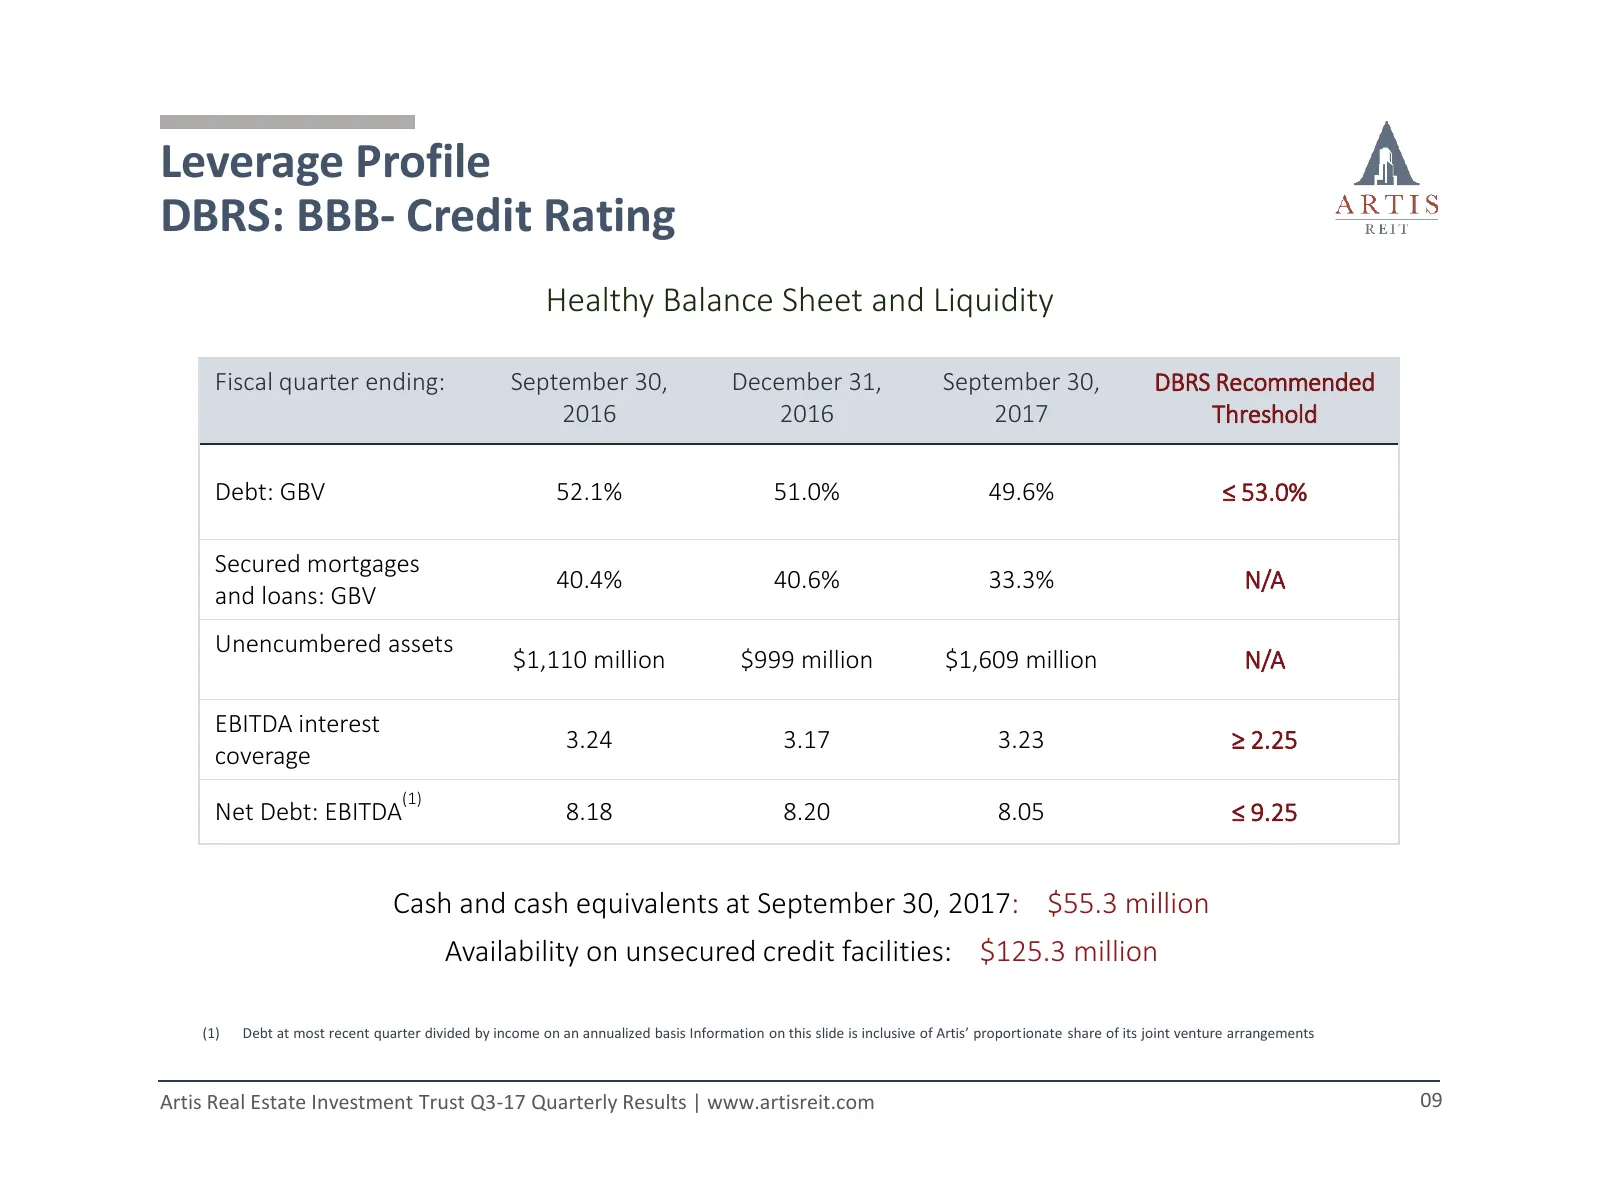
Leverage Profile DBRS: BBB- Credit Rating Healthy Balance Sheet and Liquidity Fiscal quarter ending: September 30, December 31, September 30, DBRS Recommended 2016 2016 2017 Threshold Debt: GBV 52.1% 51.0% 49.6% ≤ 53.0% Secured mortgages 40.4% 40.6% 33.3% N/A and loans: GBV Unencumbered assets $1,11
Slide 10: Select Financial Information
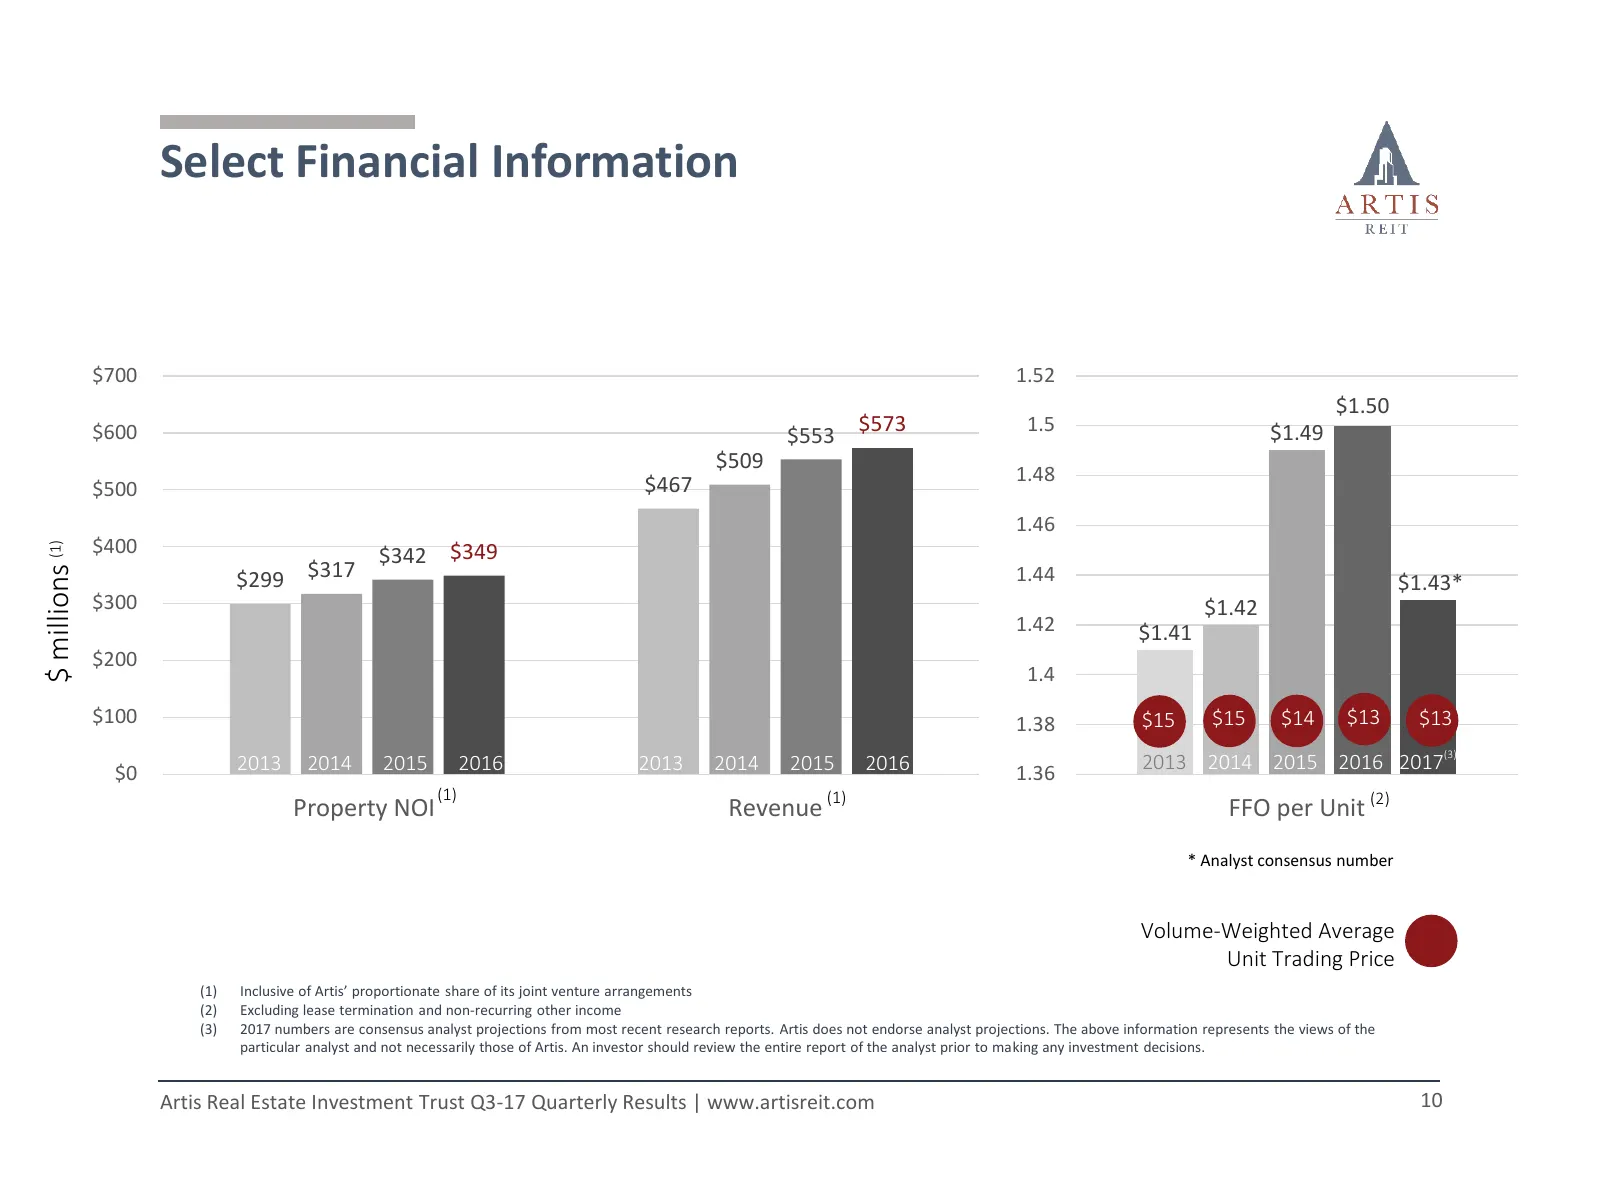
Select Financial Information $700 1.52 $1.50 $600 $553 $573 1.5 $1.49 $509 $467 1.48 $500 1.46 $400 $ millions (1) $342 $349 $299 $317 1.44 $1.43* $300 $1.42 1.42 $1.41 $200 1.4 $100 1.38 $15 $15 $14 $13 $13 2013 2014 2015 2016 2013 2014 2015 2016 2013 2014 2015 2016 2017(3) $0 1.36 (1) Property NOI
Slide 11: Recently Completed Development Projects
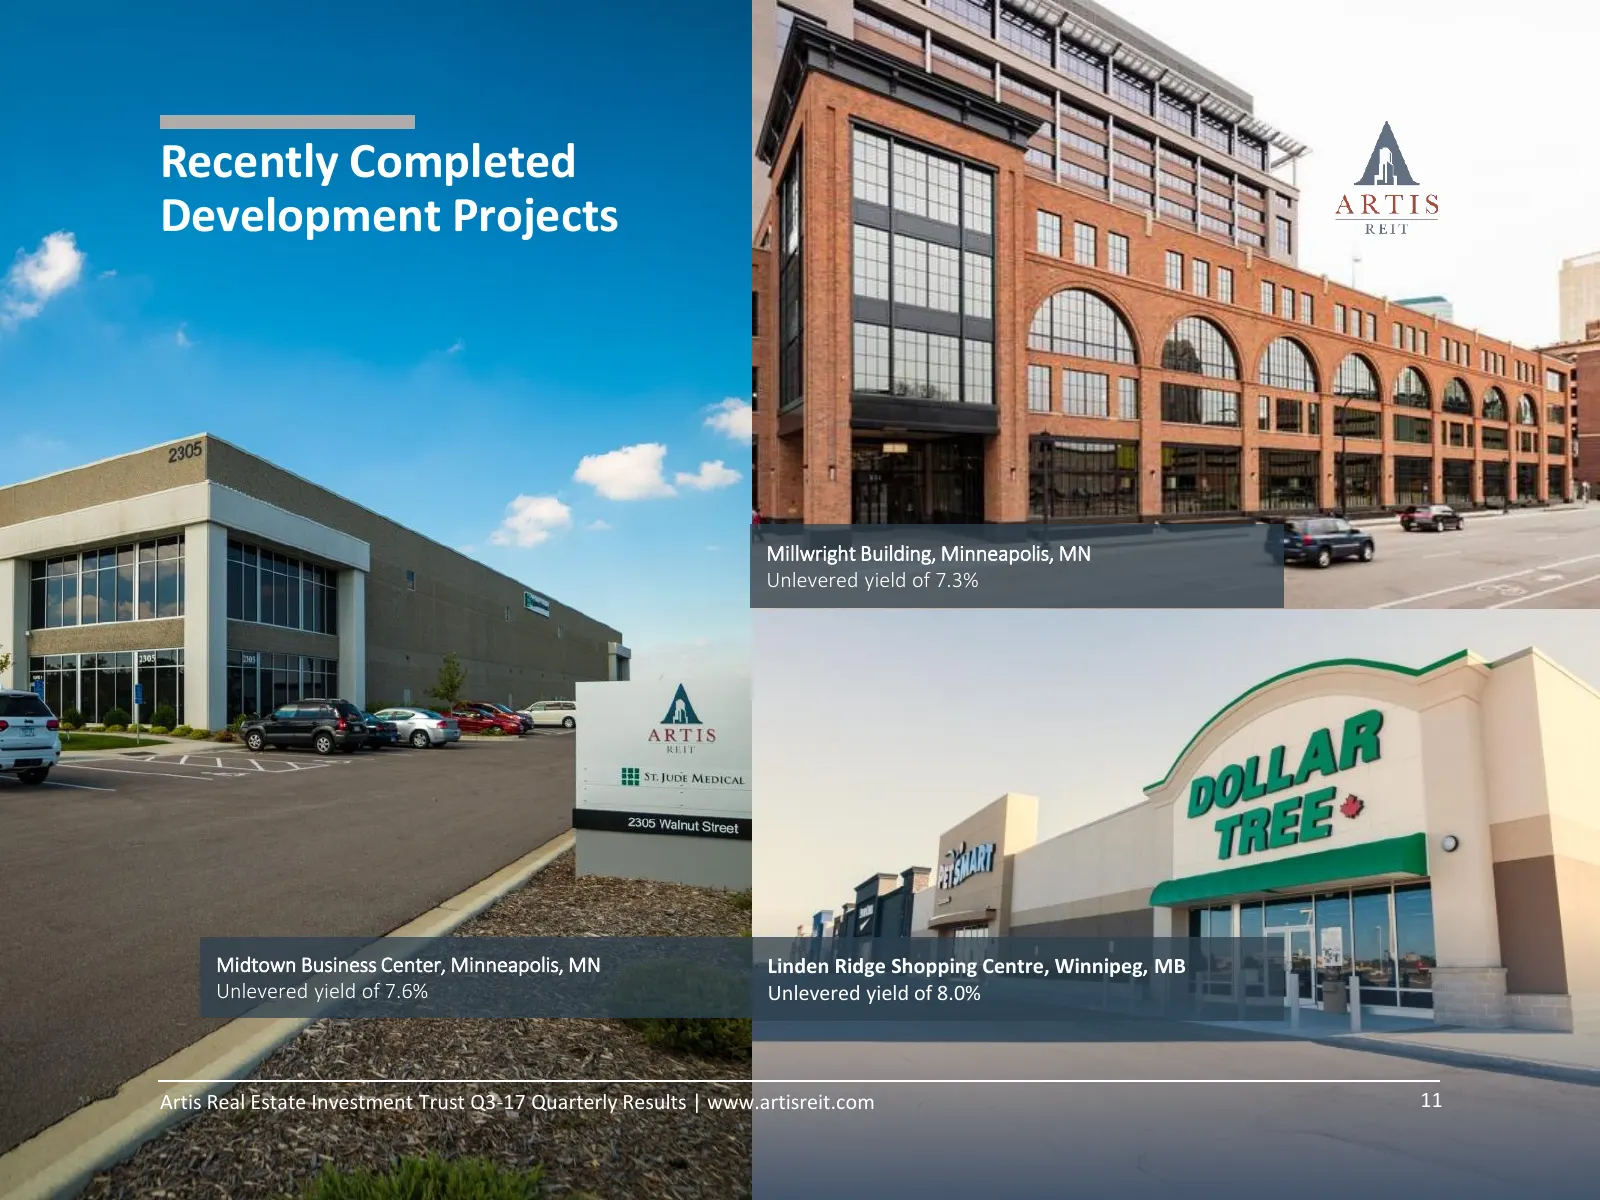
Recently Completed Development Projects Millwright Building, Minneapolis, MN Unlevered yield of 7.3% Midtown Business Center, Minneapolis, MN Linden Ridge Shopping Centre, Winnipeg, MB Unlevered yield of 7.6% Unlevered yield of 8.0% Artis Real Estate Investment Trust Q3-17 Quarterly Results | www.ar
Slide 12: New Development Activity
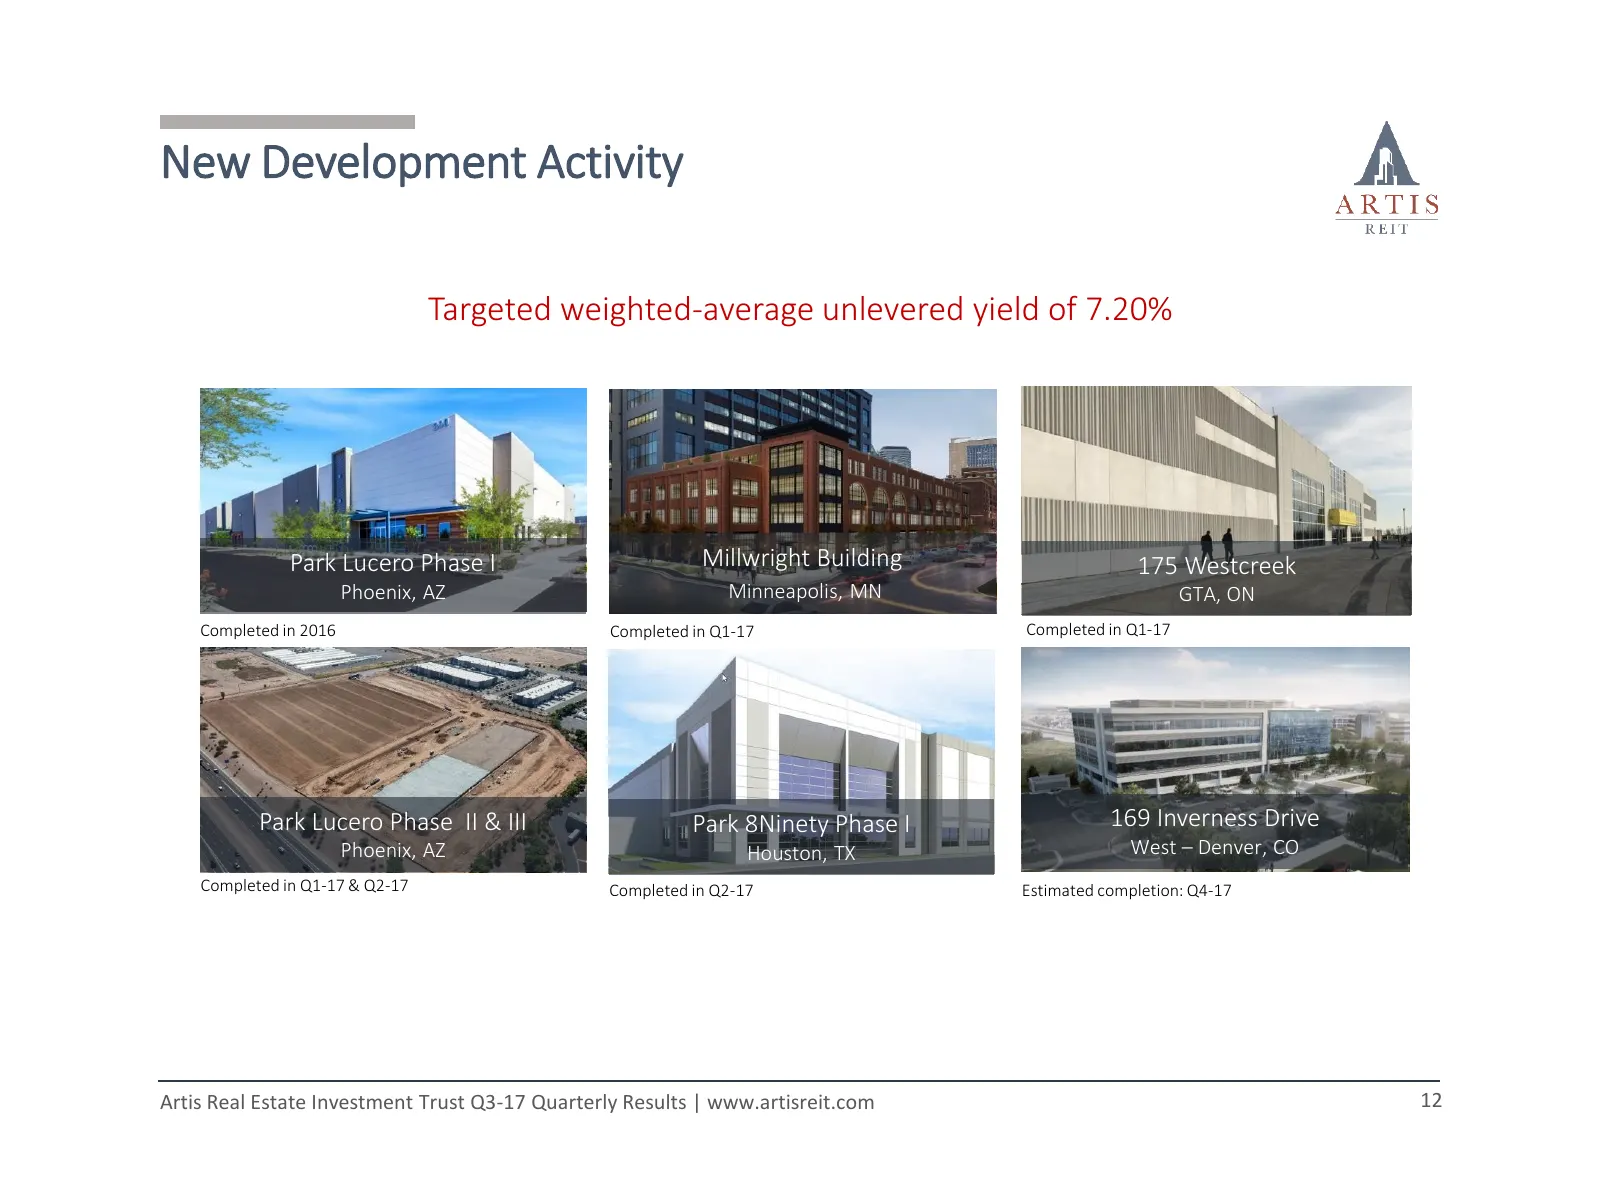
New Development Activity Targeted weighted-average unlevered yield of 7.20% Park Lucero Phase I Millwright Building 175 Westcreek Phoenix, AZ Minneapolis, MN GTA, ON Completed in 2016 Completed in Q1-17 Completed in Q1-17 Park Lucero Phase II & III Park 8Ninety Phase I 169 Inverness Drive Phoenix, A
Slide 13: Active Development Pipeline
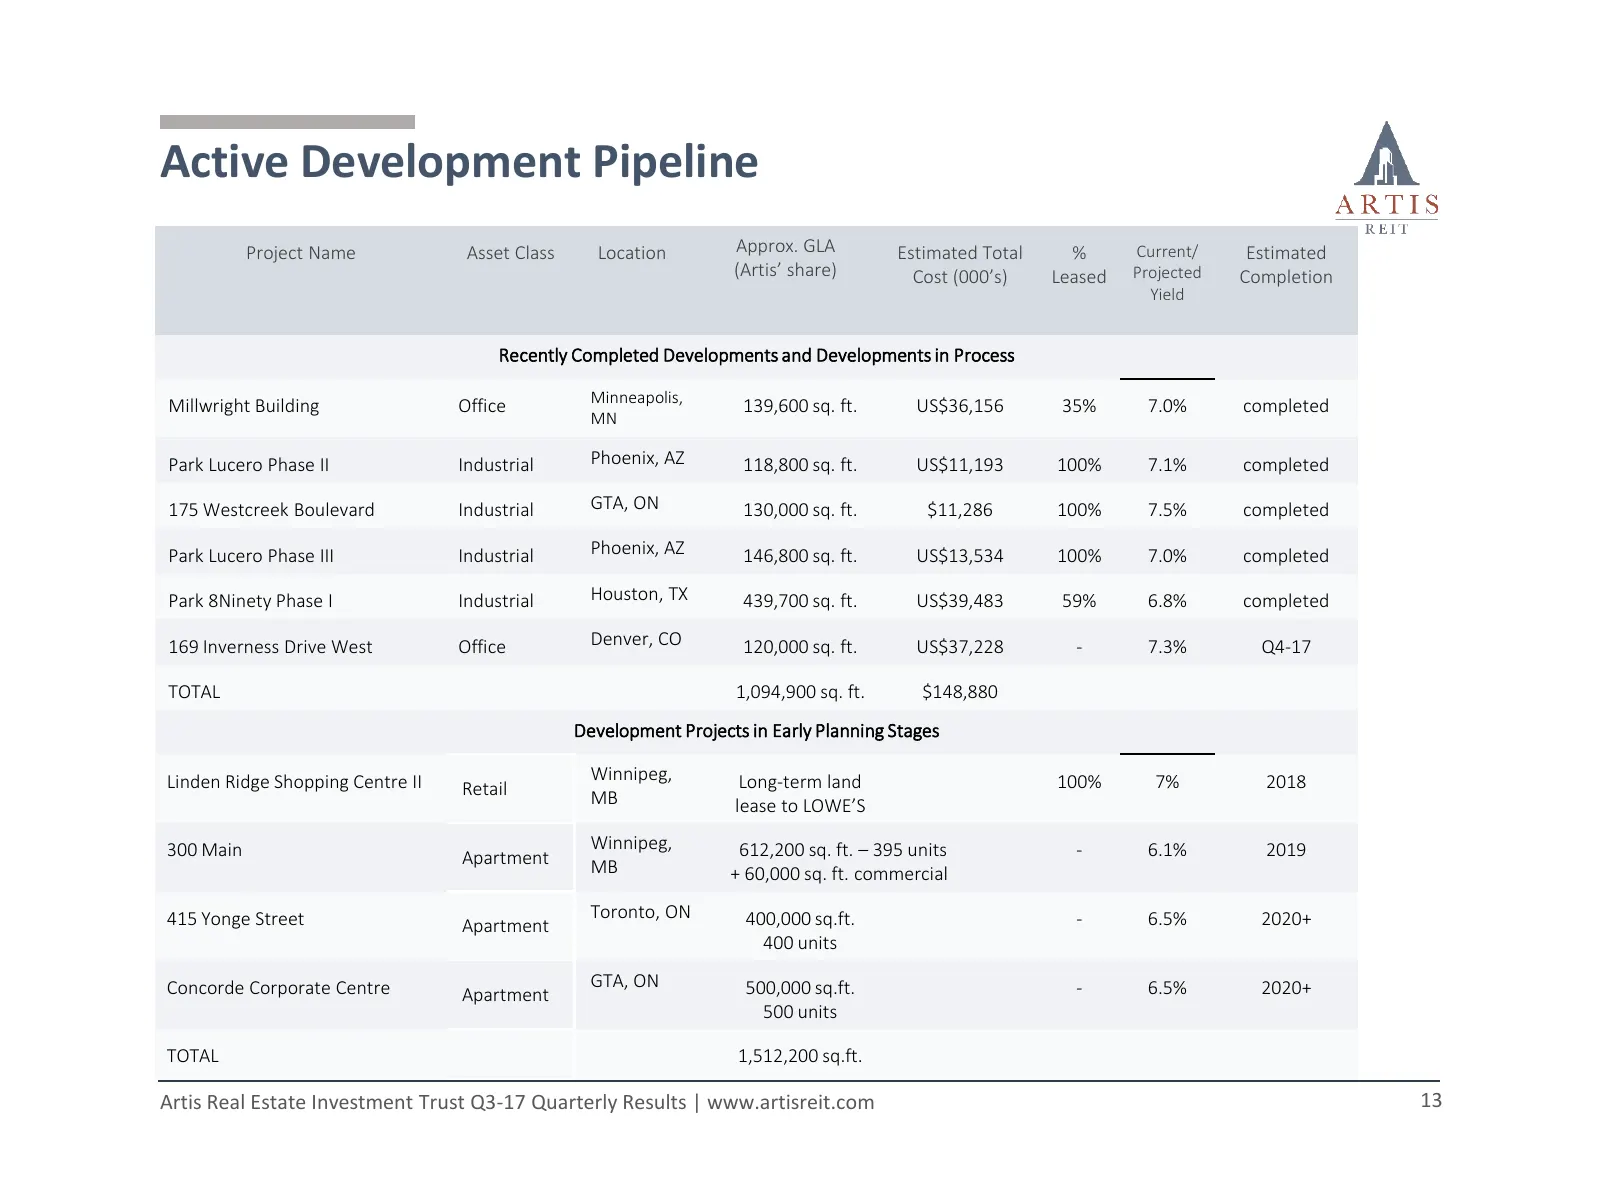
Active Development Pipeline Project Name Asset Class Location Approx. GLA Estimated Total % Current/ Estimated (Artis’ share) Cost (000’s) Leased Projected Completion Yield Recently Completed Developments and Developments in Process Minneapolis, Millwright Building Office 139,600 sq. ft. US$36,156 3
Slide 14: Future Development Pipeline
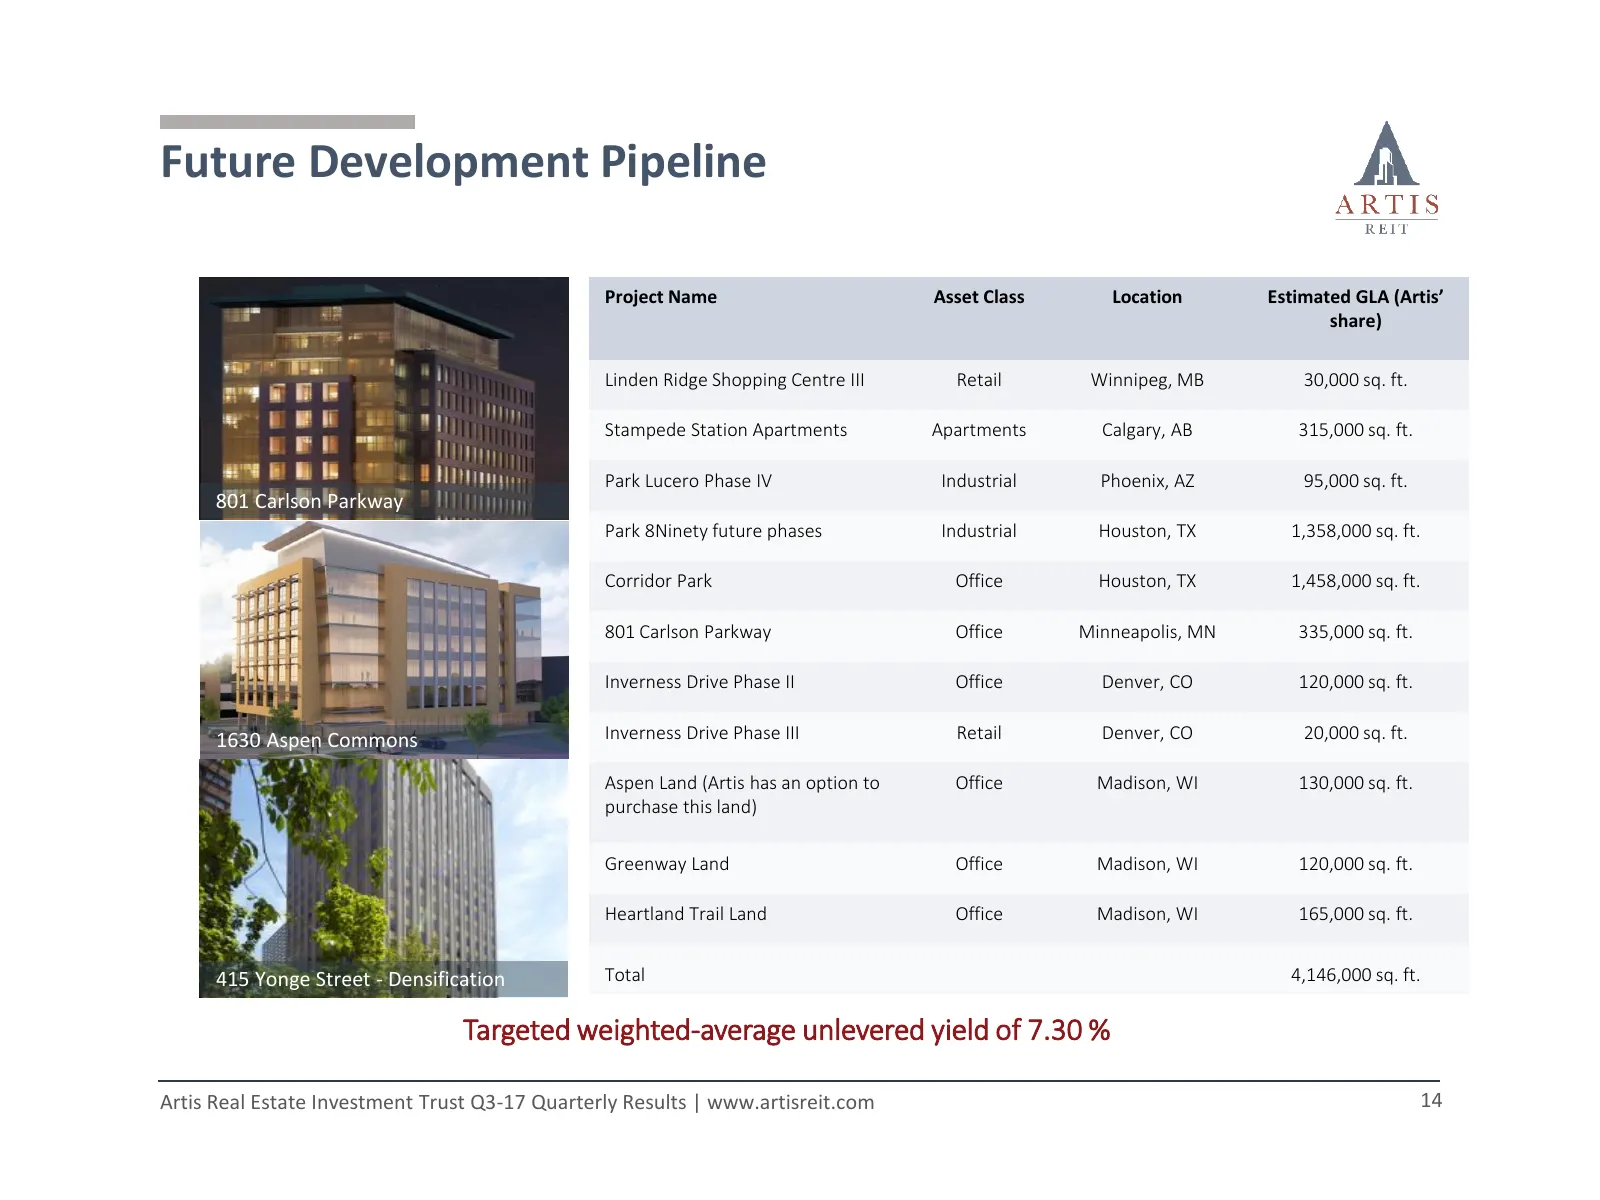
Future Development Pipeline Project Name Asset Class Location Estimated GLA (Artis’ share) Linden Ridge Shopping Centre III Retail Winnipeg, MB 30,000 sq. ft. Stampede Station Apartments Apartments Calgary, AB 315,000 sq. ft. Park Lucero Phase IV Industrial Phoenix, AZ 95,000 sq. ft. 801 Carlson Par
Slide 15: Value Creation from Developments
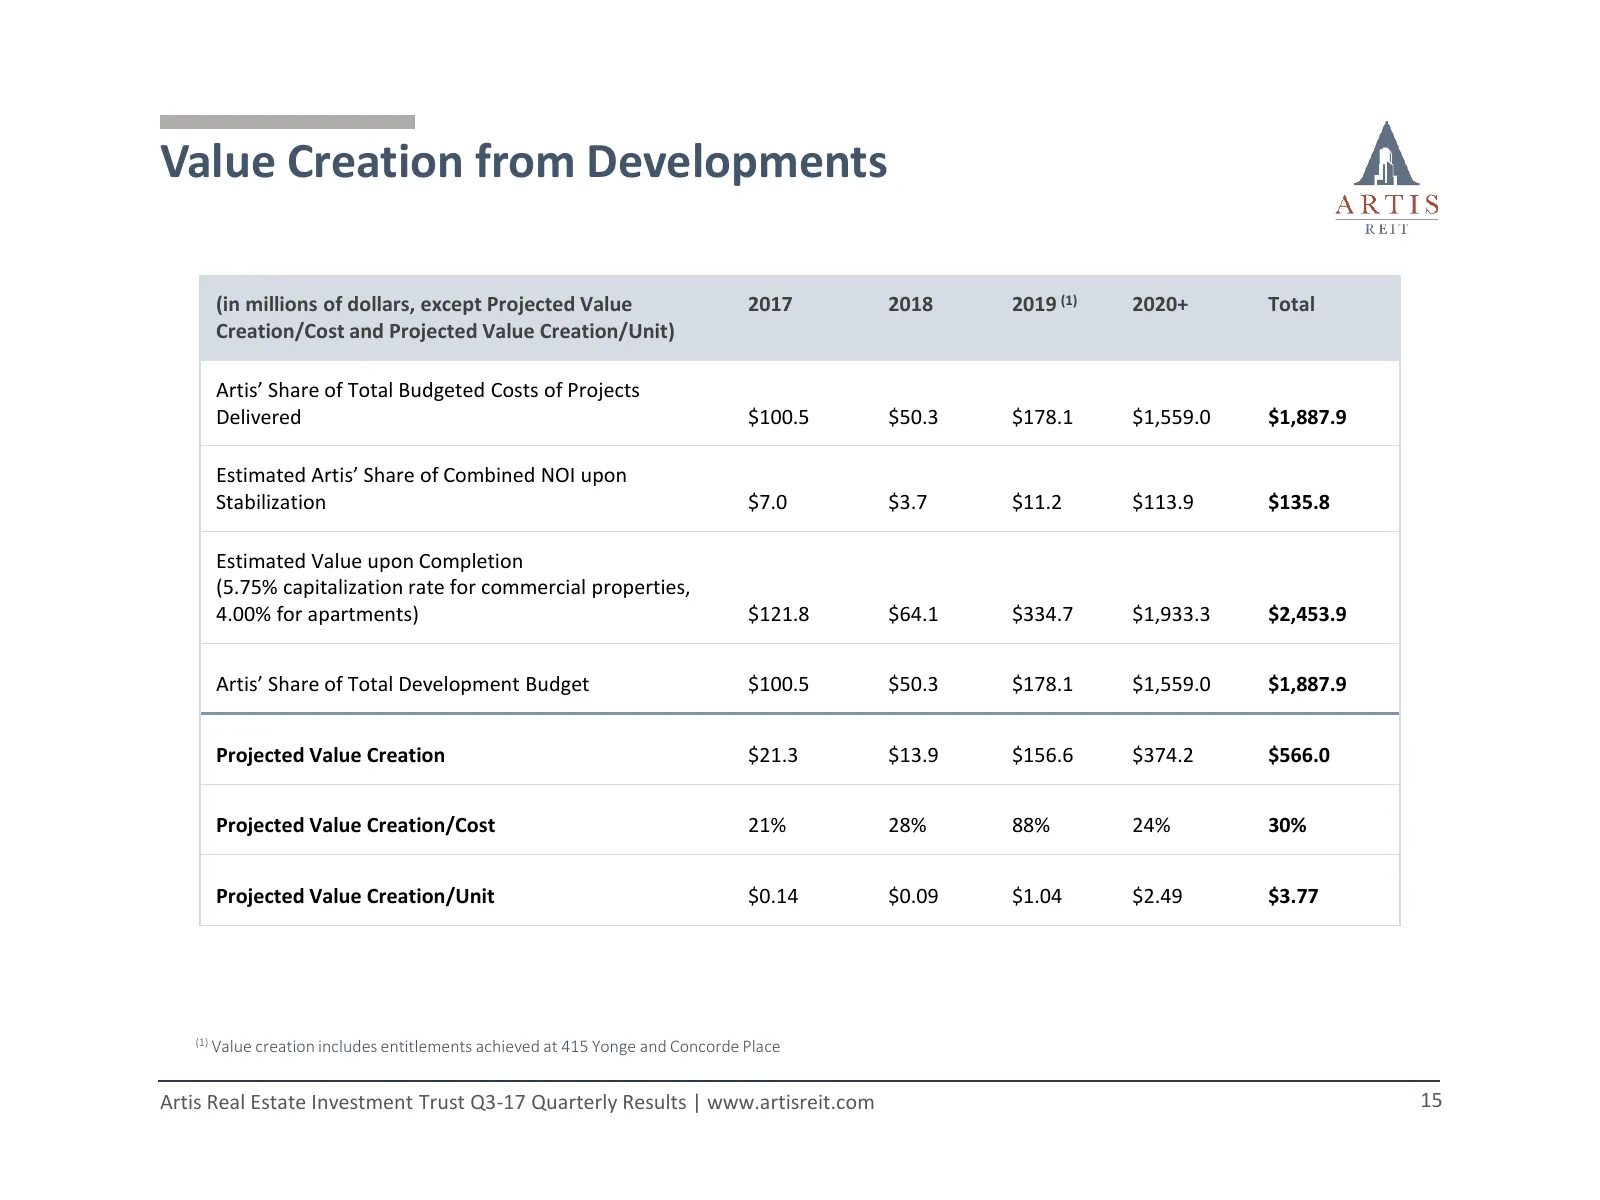
Value Creation from Developments (in millions of dollars, except Projected Value 2017 2018 2019 (1) 2020+ Total Creation/Cost and Projected Value Creation/Unit) Artis’ Share of Total Budgeted Costs of Projects Delivered $100.5 $50.3 $178.1 $1,559.0 $1,887.9 Estimated Artis’ Share of Combined NOI upo
Slide 16: Upcoming Development Projects
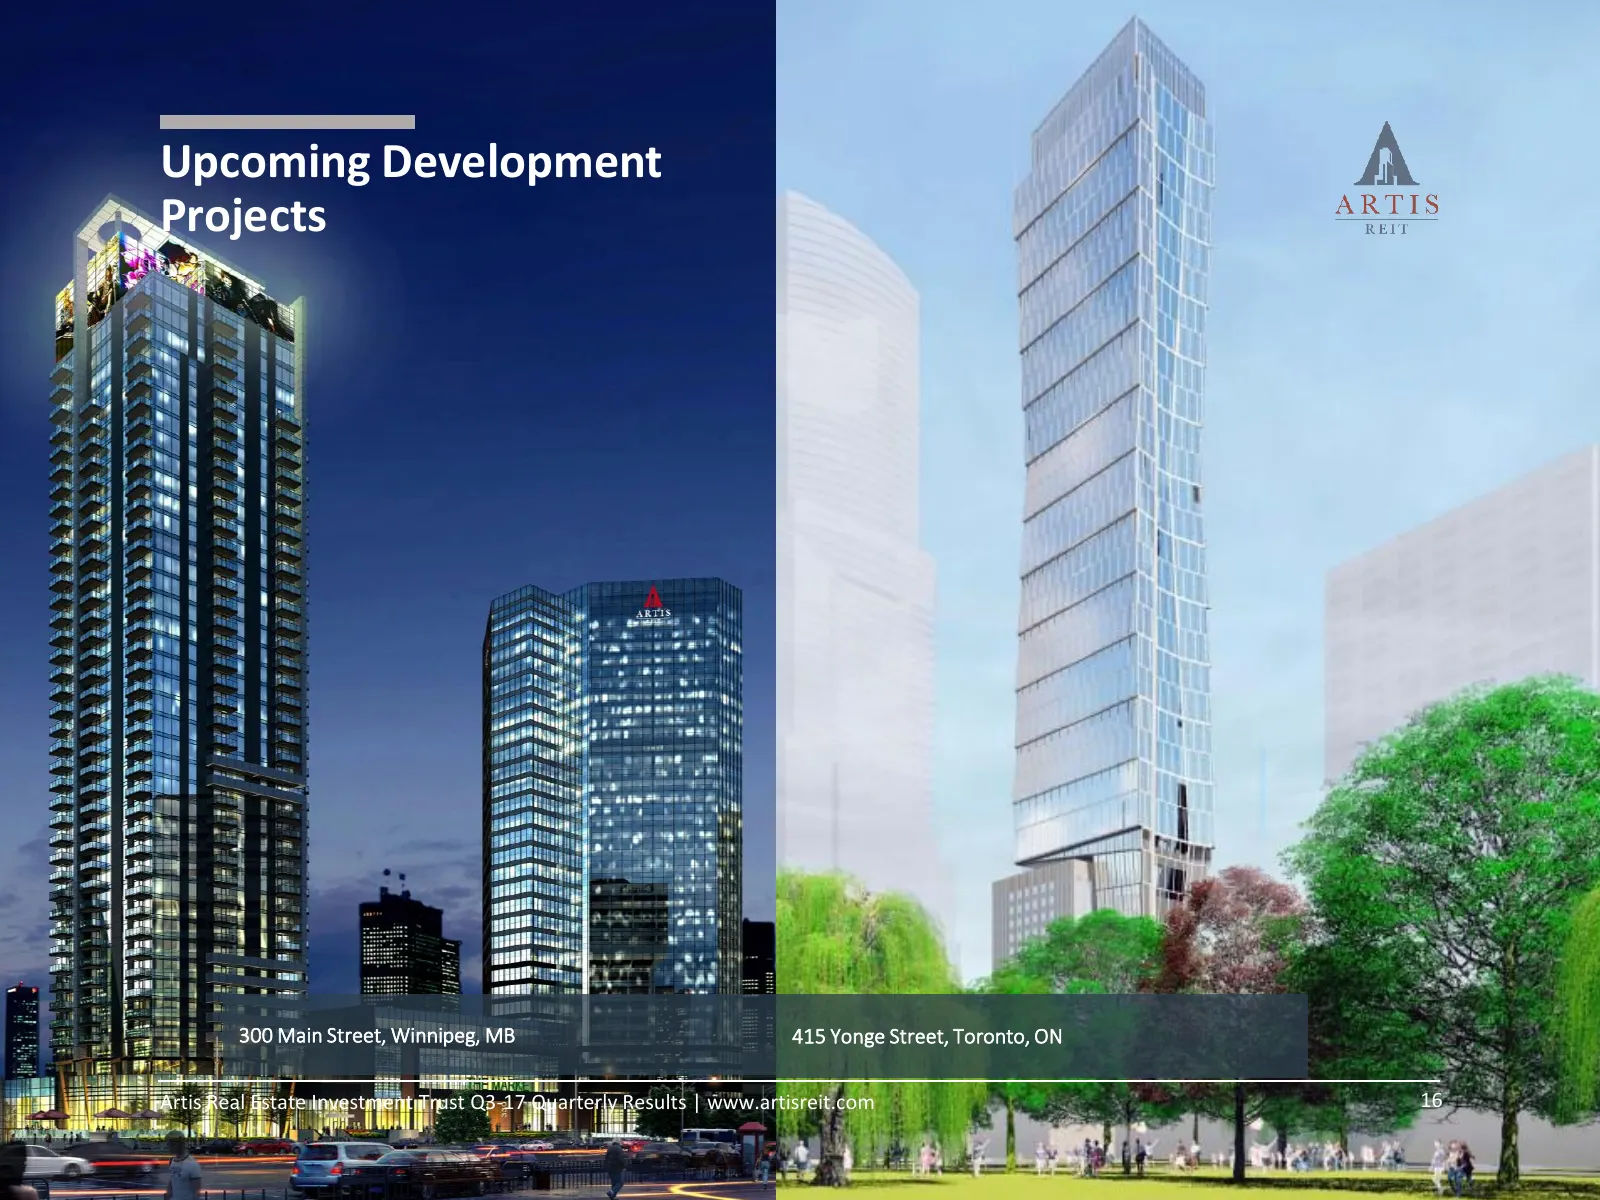
Upcoming Development Projects 300 Main Street, Winnipeg, MB 415 Yonge Street, Toronto, ON Artis Real Estate Investment Trust Q3-17 Quarterly Results | www.artisreit.com 16
Slide 17: Market and Analyst Information
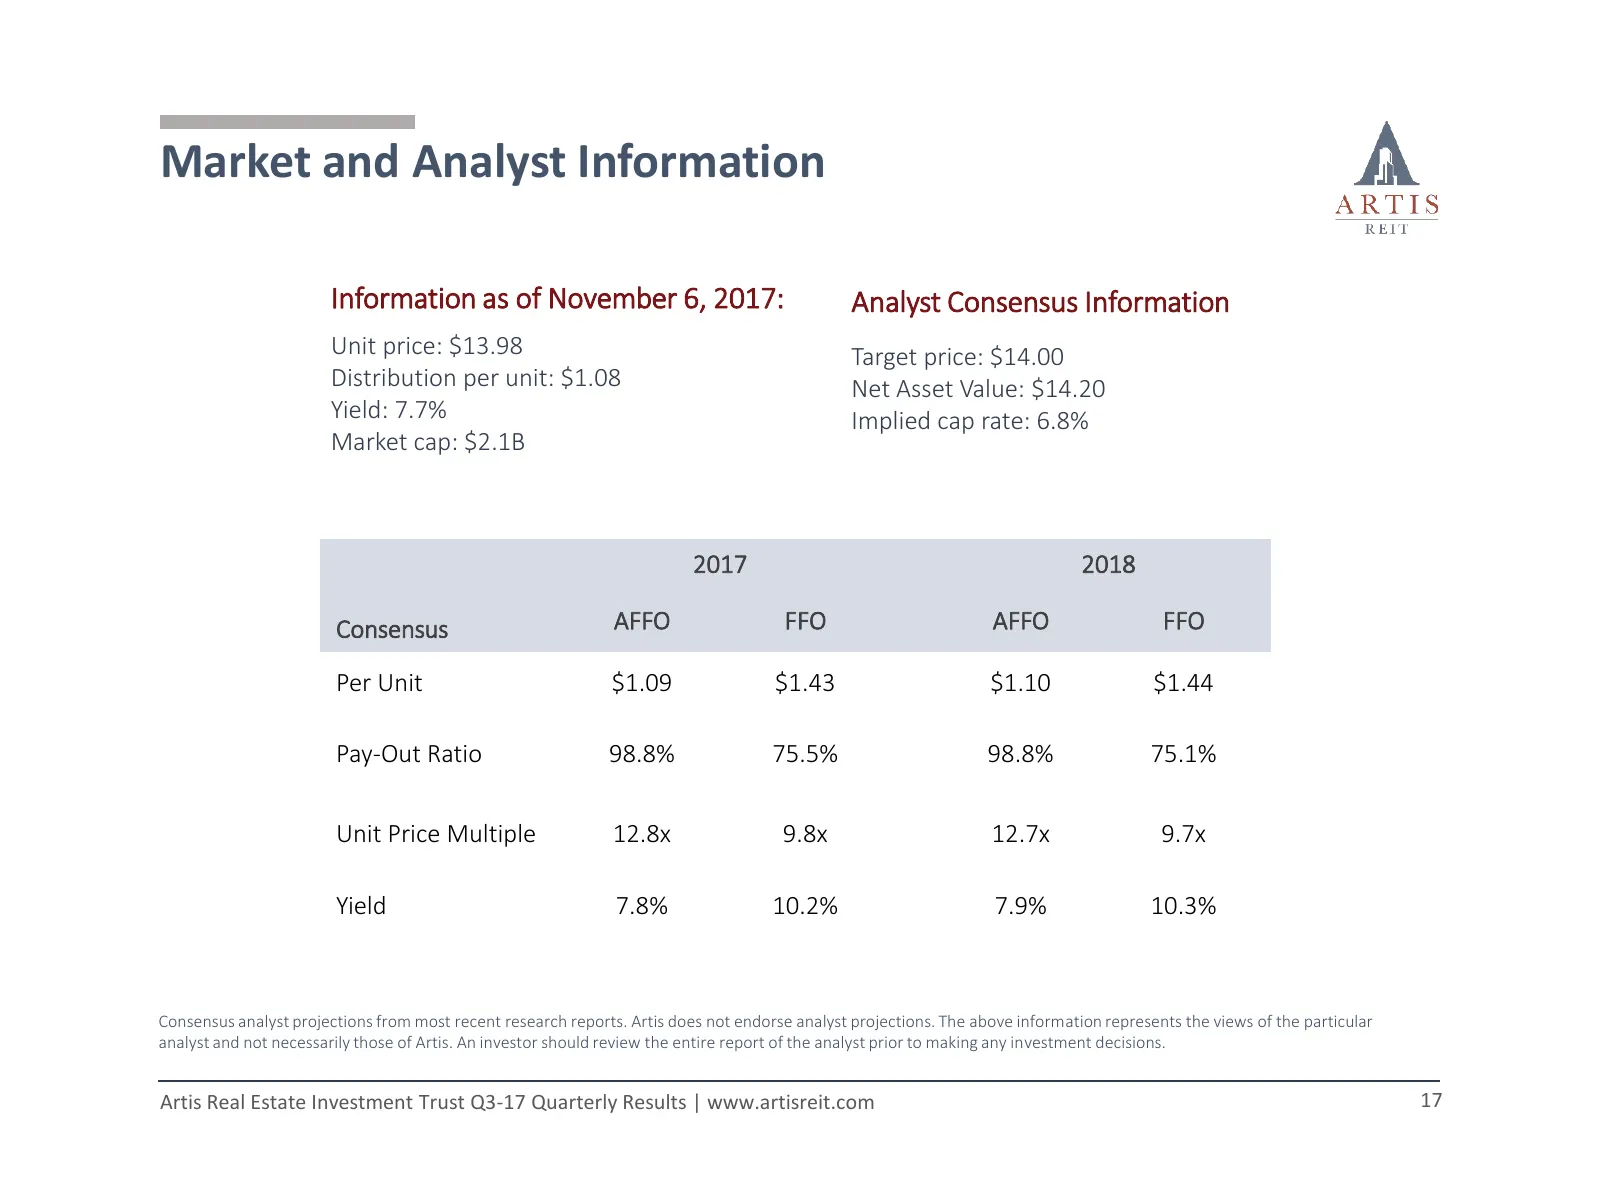
Market and Analyst Information Information as of November 6, 2017: Analyst Consensus Information Unit price: $13.98 Target price: $14.00 Distribution per unit: $1.08 Net Asset Value: $14.20 Yield: 7.7% Implied cap rate: 6.8% Market cap: $2.1B 2017 2018 Consensus AFFO FFO AFFO FFO Per Unit $1.09 $1.4
Slide 18: Artis Peer Comparisons at December 29, 2017
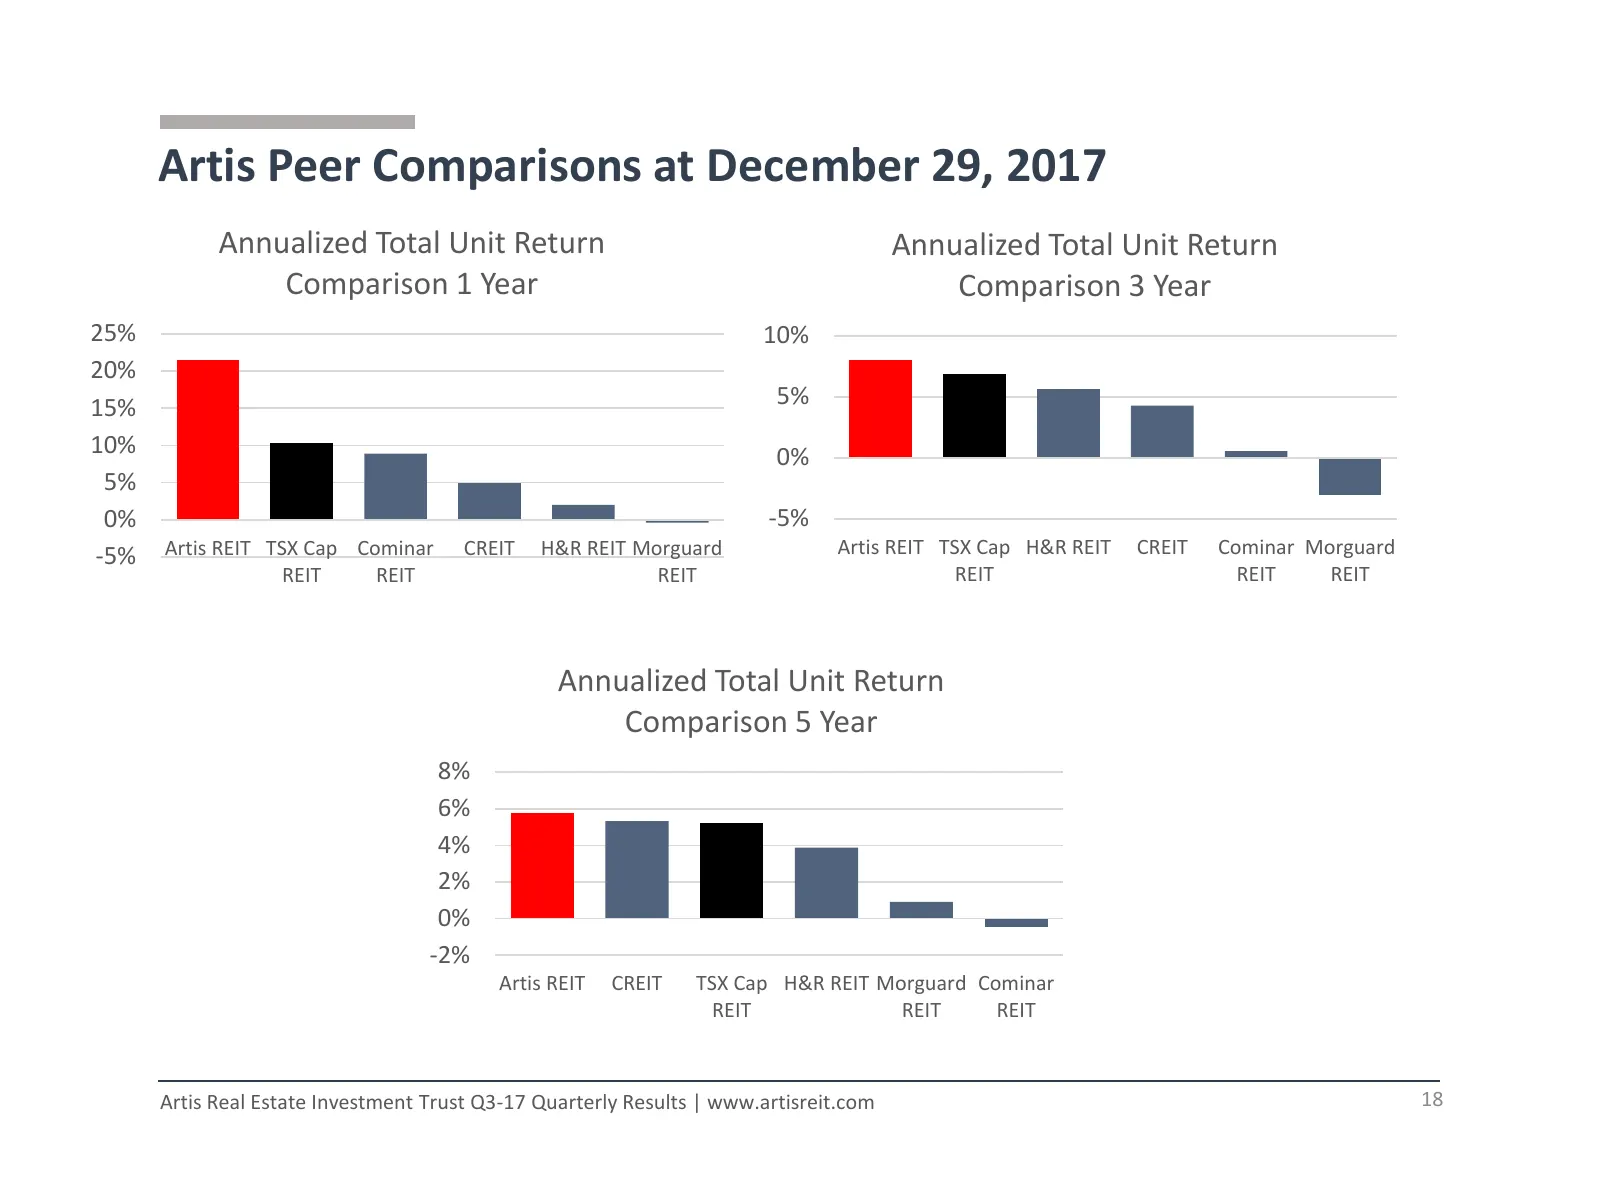
Artis Peer Comparisons at December 29, 2017 Annualized Total Unit Return Annualized Total Unit Return Comparison 1 Year Comparison 3 Year 25% 10% 20% 15% 5% 10% 0% 5% 0% -5% -5% Artis REIT TSX Cap Cominar CREIT H&R REIT Morguard Artis REIT TSX Cap H&R REIT CREIT Cominar Morguard REIT REIT REIT REIT
Slide 19: Guideposts for 2017 and Beyond
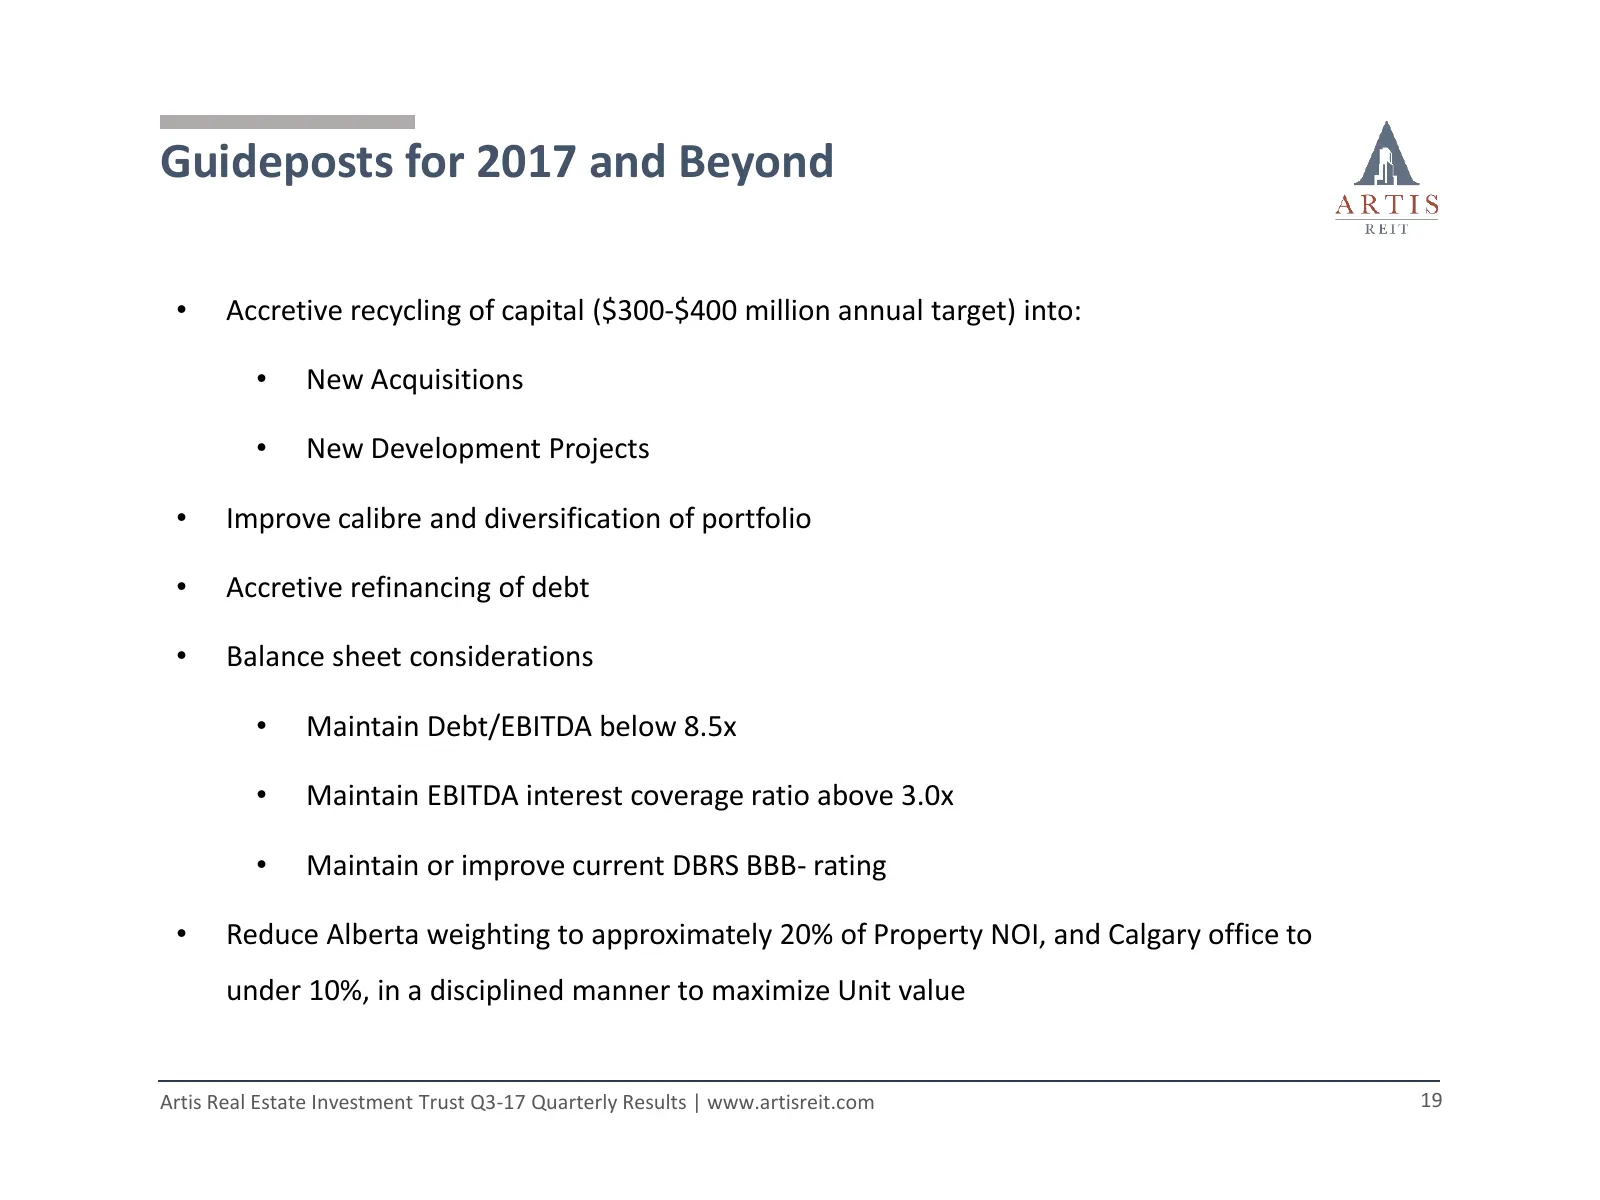
Guideposts for 2017 and Beyond • Accretive recycling of capital ($300-$400 million annual target) into: • New Acquisitions • New Development Projects • Improve calibre and diversification of portfolio • Accretive refinancing of debt • Balance sheet considerations • Maintain Debt/EBITDA below 8.5x •
Slide 20: Why Invest in Artis?
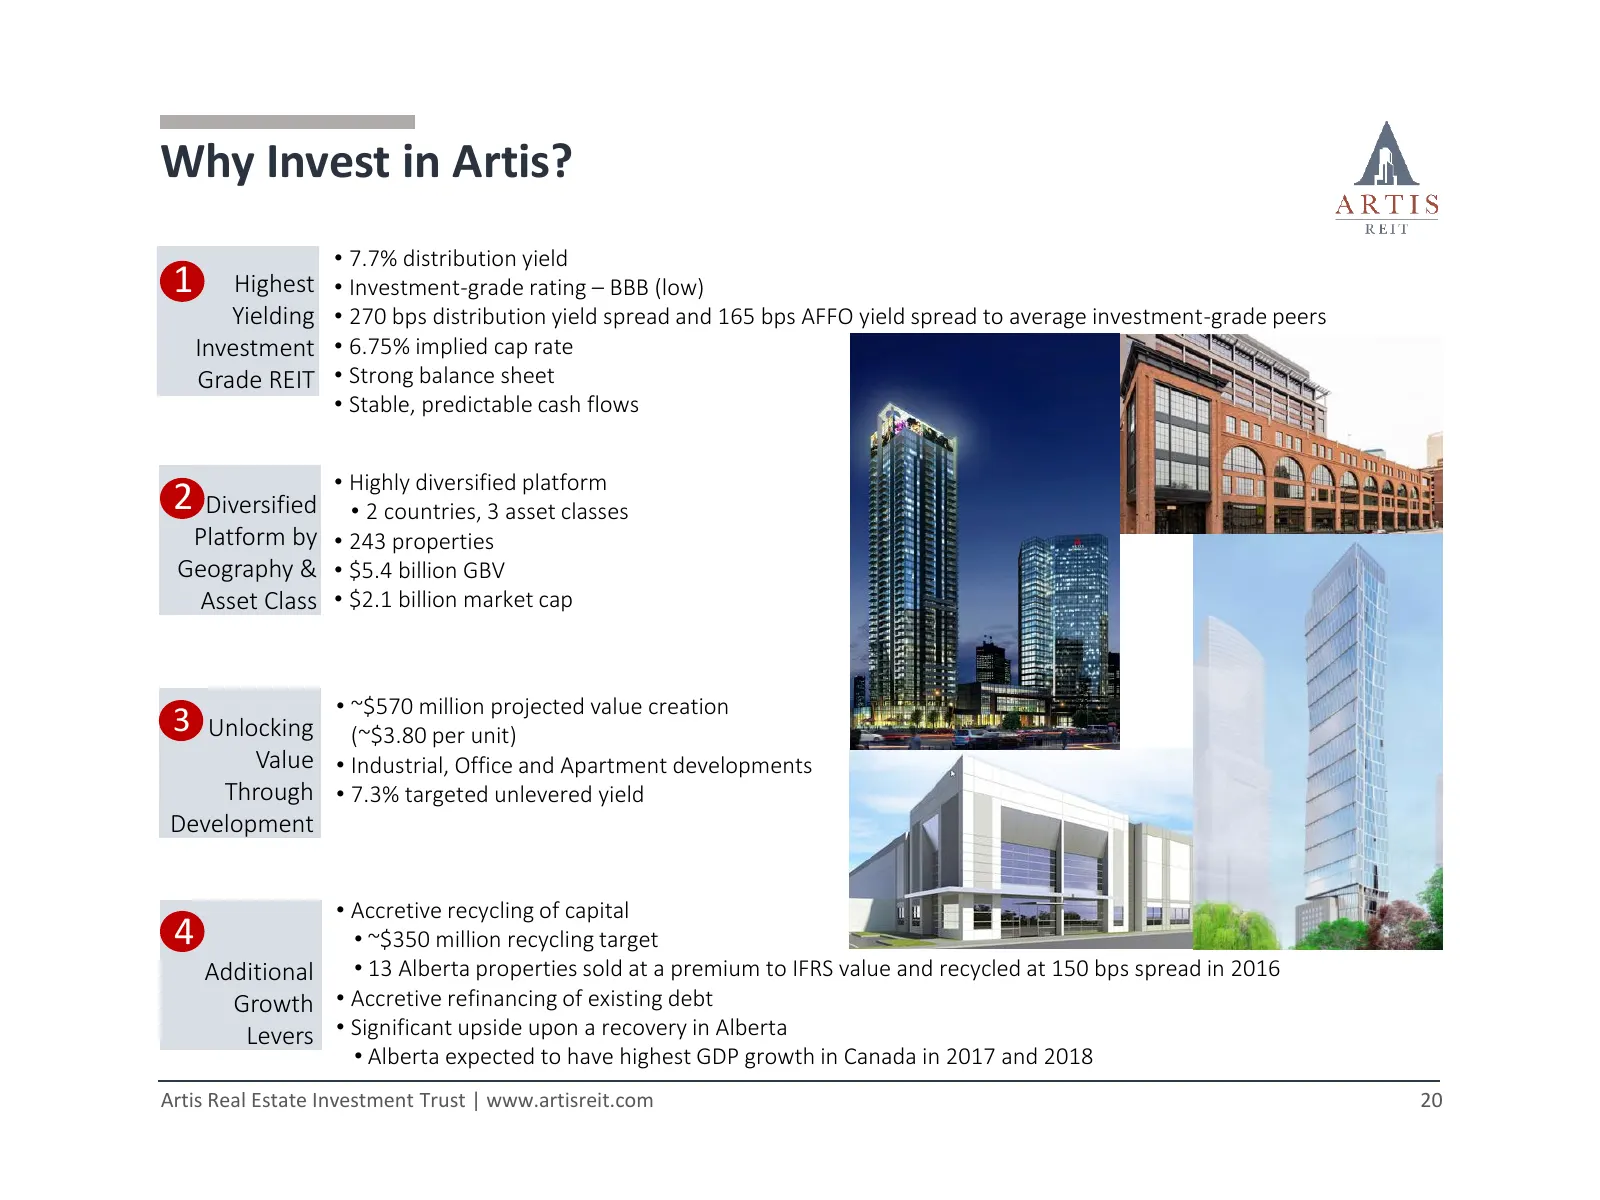
Why Invest in Artis? • 7.7% distribution yield 1 Highest • Investment-grade rating – BBB (low) Yielding • 270 bps distribution yield spread and 165 bps AFFO yield spread to average investment-grade peers Investment • 6.75% implied cap rate Grade REIT • Strong balance sheet • Stable, predictable cash
Slide 21: Portfolio Overview Diversified Commercial Properties
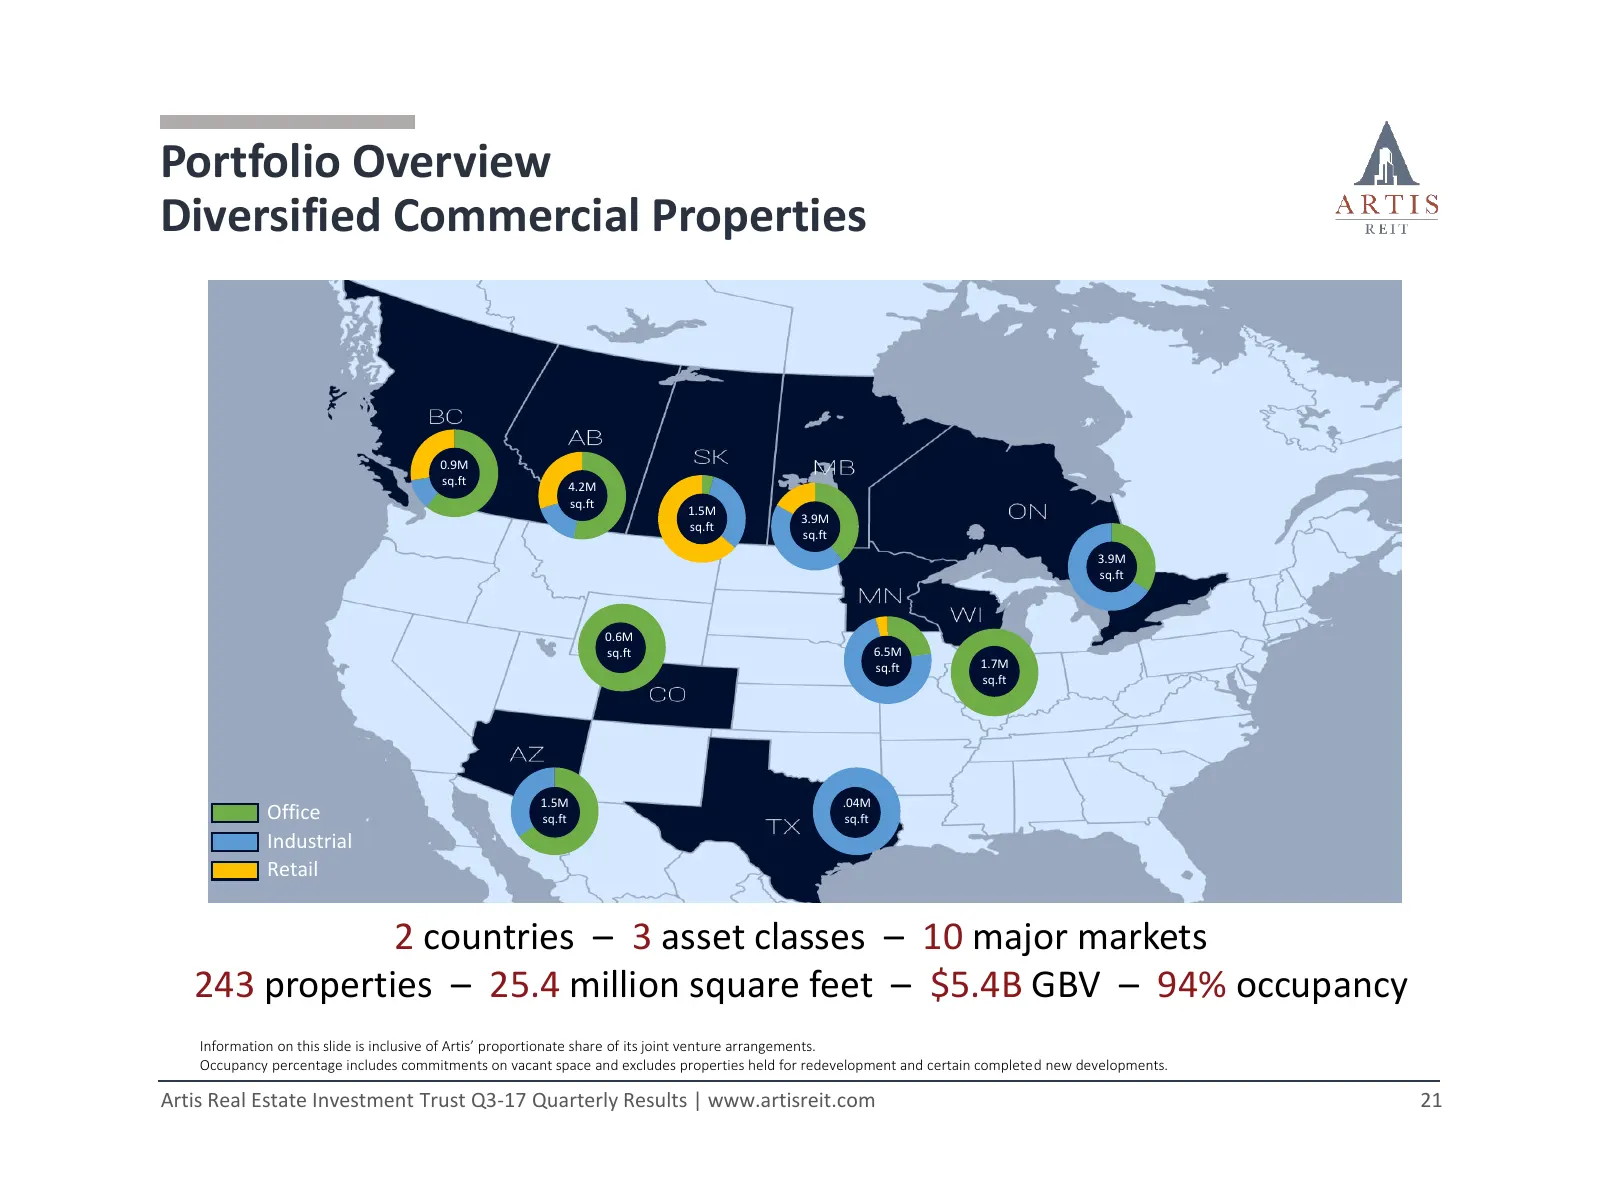
Portfolio Overview Diversified Commercial Properties 0.9M sq.ft 4.2M sq.ft 1.5M 3.9M sq.ft sq.ft 3.9M sq.ft 0.6M sq.ft 6.5M sq.ft 1.7M sq.ft 1.5M .04M Office sq.ft sq.ft Industrial Retail 2 countries – 3 asset classes – 10 major markets 243 properties – 25.4 million square feet – $5.4B GBV – 94% occ
Slide 22: Q3 – 2017 Investor Presentation
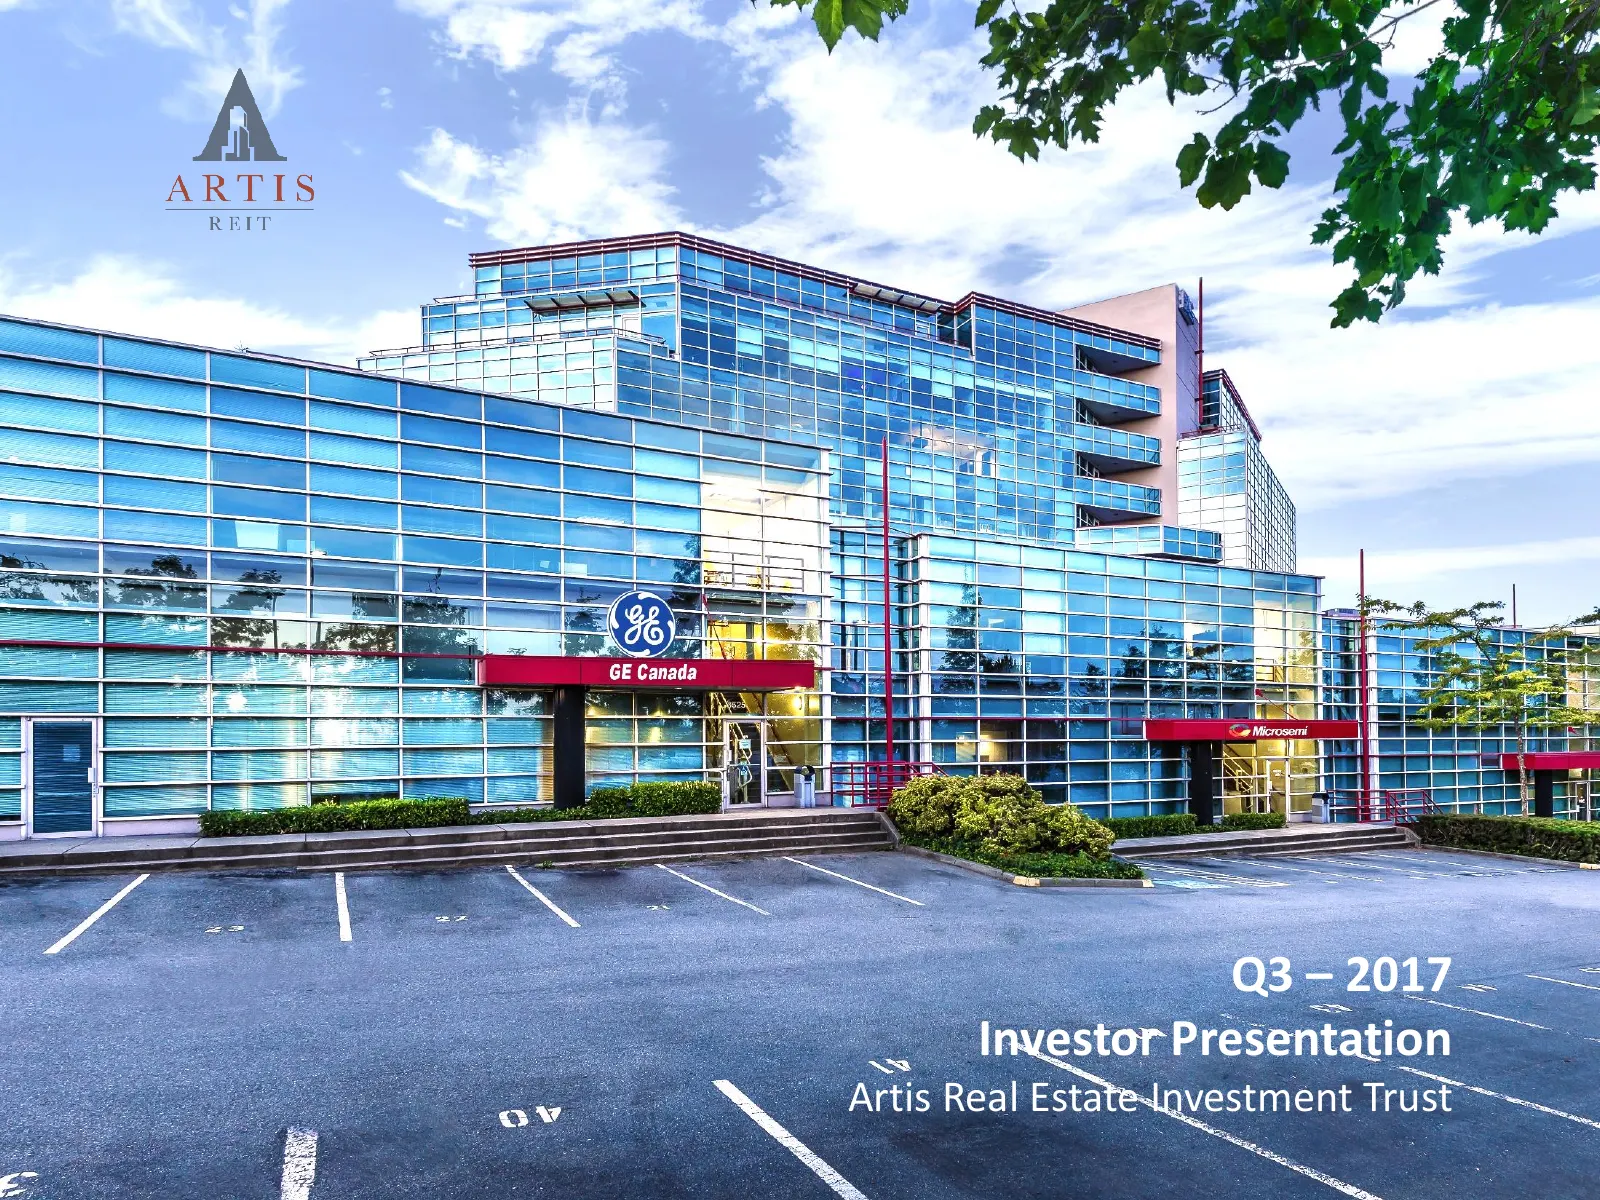
Q3 – 2017 Investor Presentation Artis Real Estate Investment Trust
Source: Internet Archive copy of arwebstore.blob.core.windows.net
More decks from RFA Financial Inc.
 Q3 2026 Earnings Presentation19 slides · Nov 11, 2026
 Q2 2026 Earnings Presentation21 slides · Aug 14, 2026
 Q1 2026 Earnings Presentation28 slides · May 13, 2026
 Merger or Acquisition (September 2025)18 slides · Sep 15, 2025
 Artis Real Estate Investment Trust — Q2 2025 Earnings Presentation22 slides · Aug 7, 2025
 Artis Real Estate Investment Trust — Q1 2025 Earnings Presentation22 slides · May 8, 2025