Rural Metro — Investor Day (April 2009)
51 slides from Rural Metro's investor day presentation, Apr 2, 2009
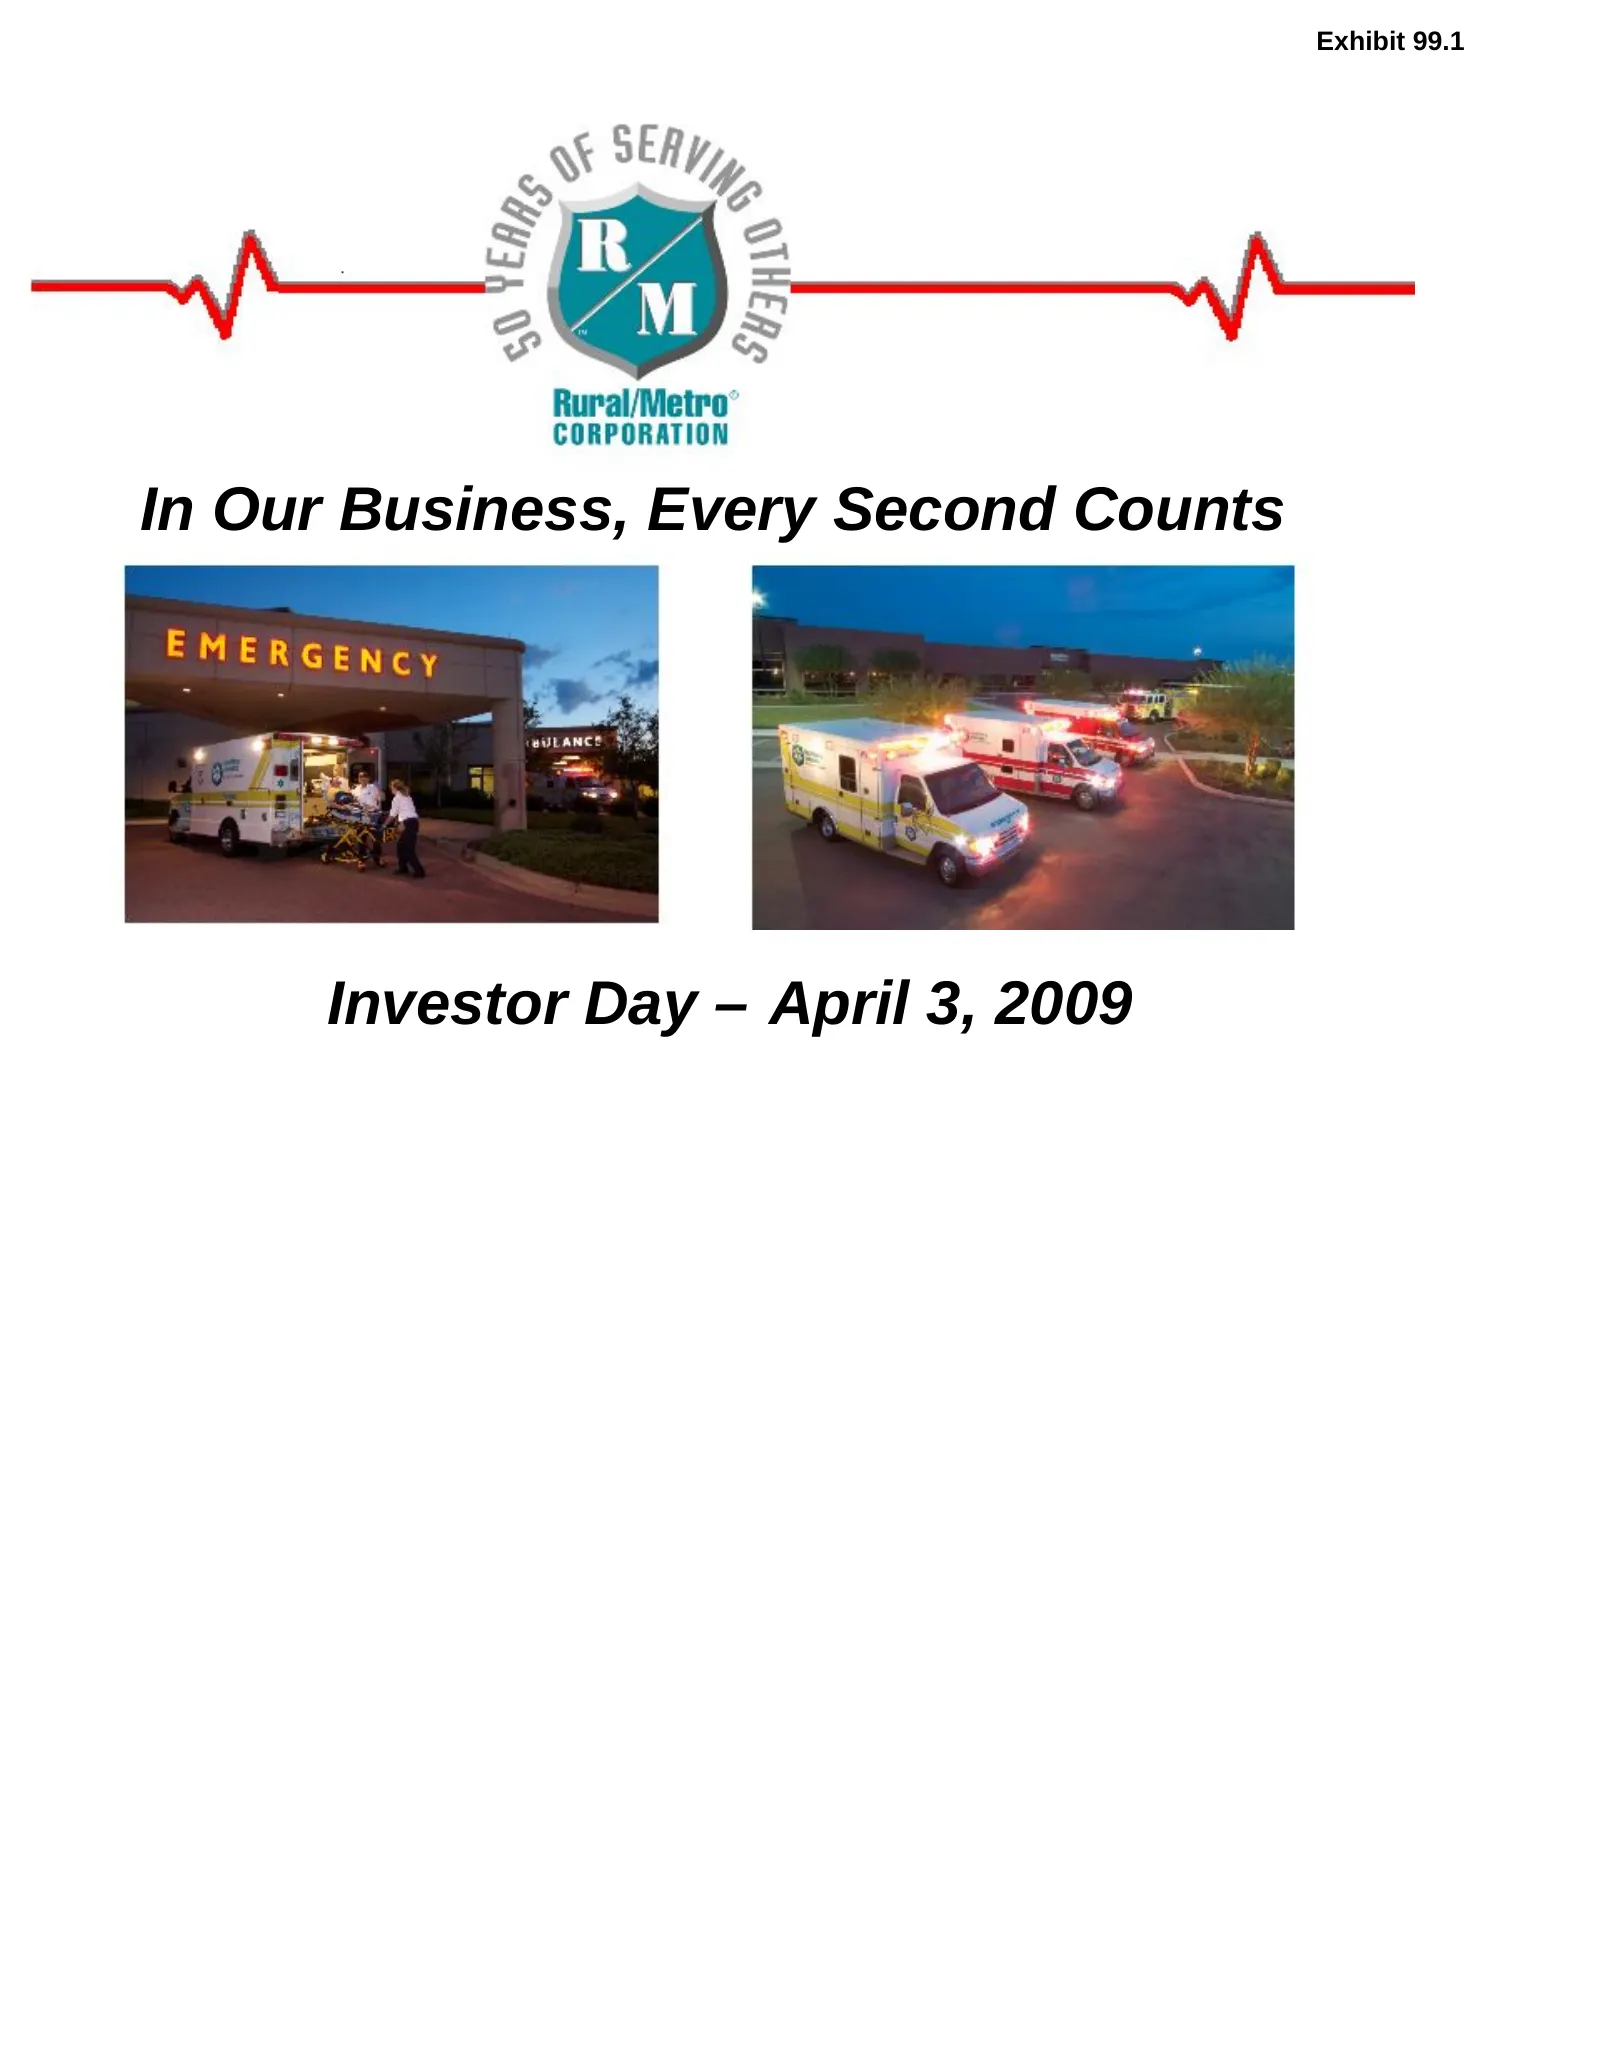
Slide 1: In Our Business, Every Second Counts – Investor Day
Exhibit 99.1 In Our Business, Every Second Counts Investor Day – April 3, 2009
Slide 2: Forward Looking Statements
Forward Looking Statements Nothing contained in this presentation is, or should be relied upon as, a promise or representation as to the future. Any projections contained herein or otherwise made available are based on management’s analysis of information available at the time this presentation was

Slide 3: Welcome & Introductions
—————————c }— Welcome & Introductions CORPORKTION
Slide 4: Agenda
Agenda 10:00 a.m. Registration & Check-In 10:15 a.m. Welcome and Introductions (Liz Merritt, Managing Director of (Tab 1) Investor Relations) 10:20 a.m. The Industry, the Company, and the Business (Tab 2) (Jack Brucker, President & CEO) 10:45 a.m. Operational Technology & Revenue Cycle Management (T
Slide 5: Management Presenters
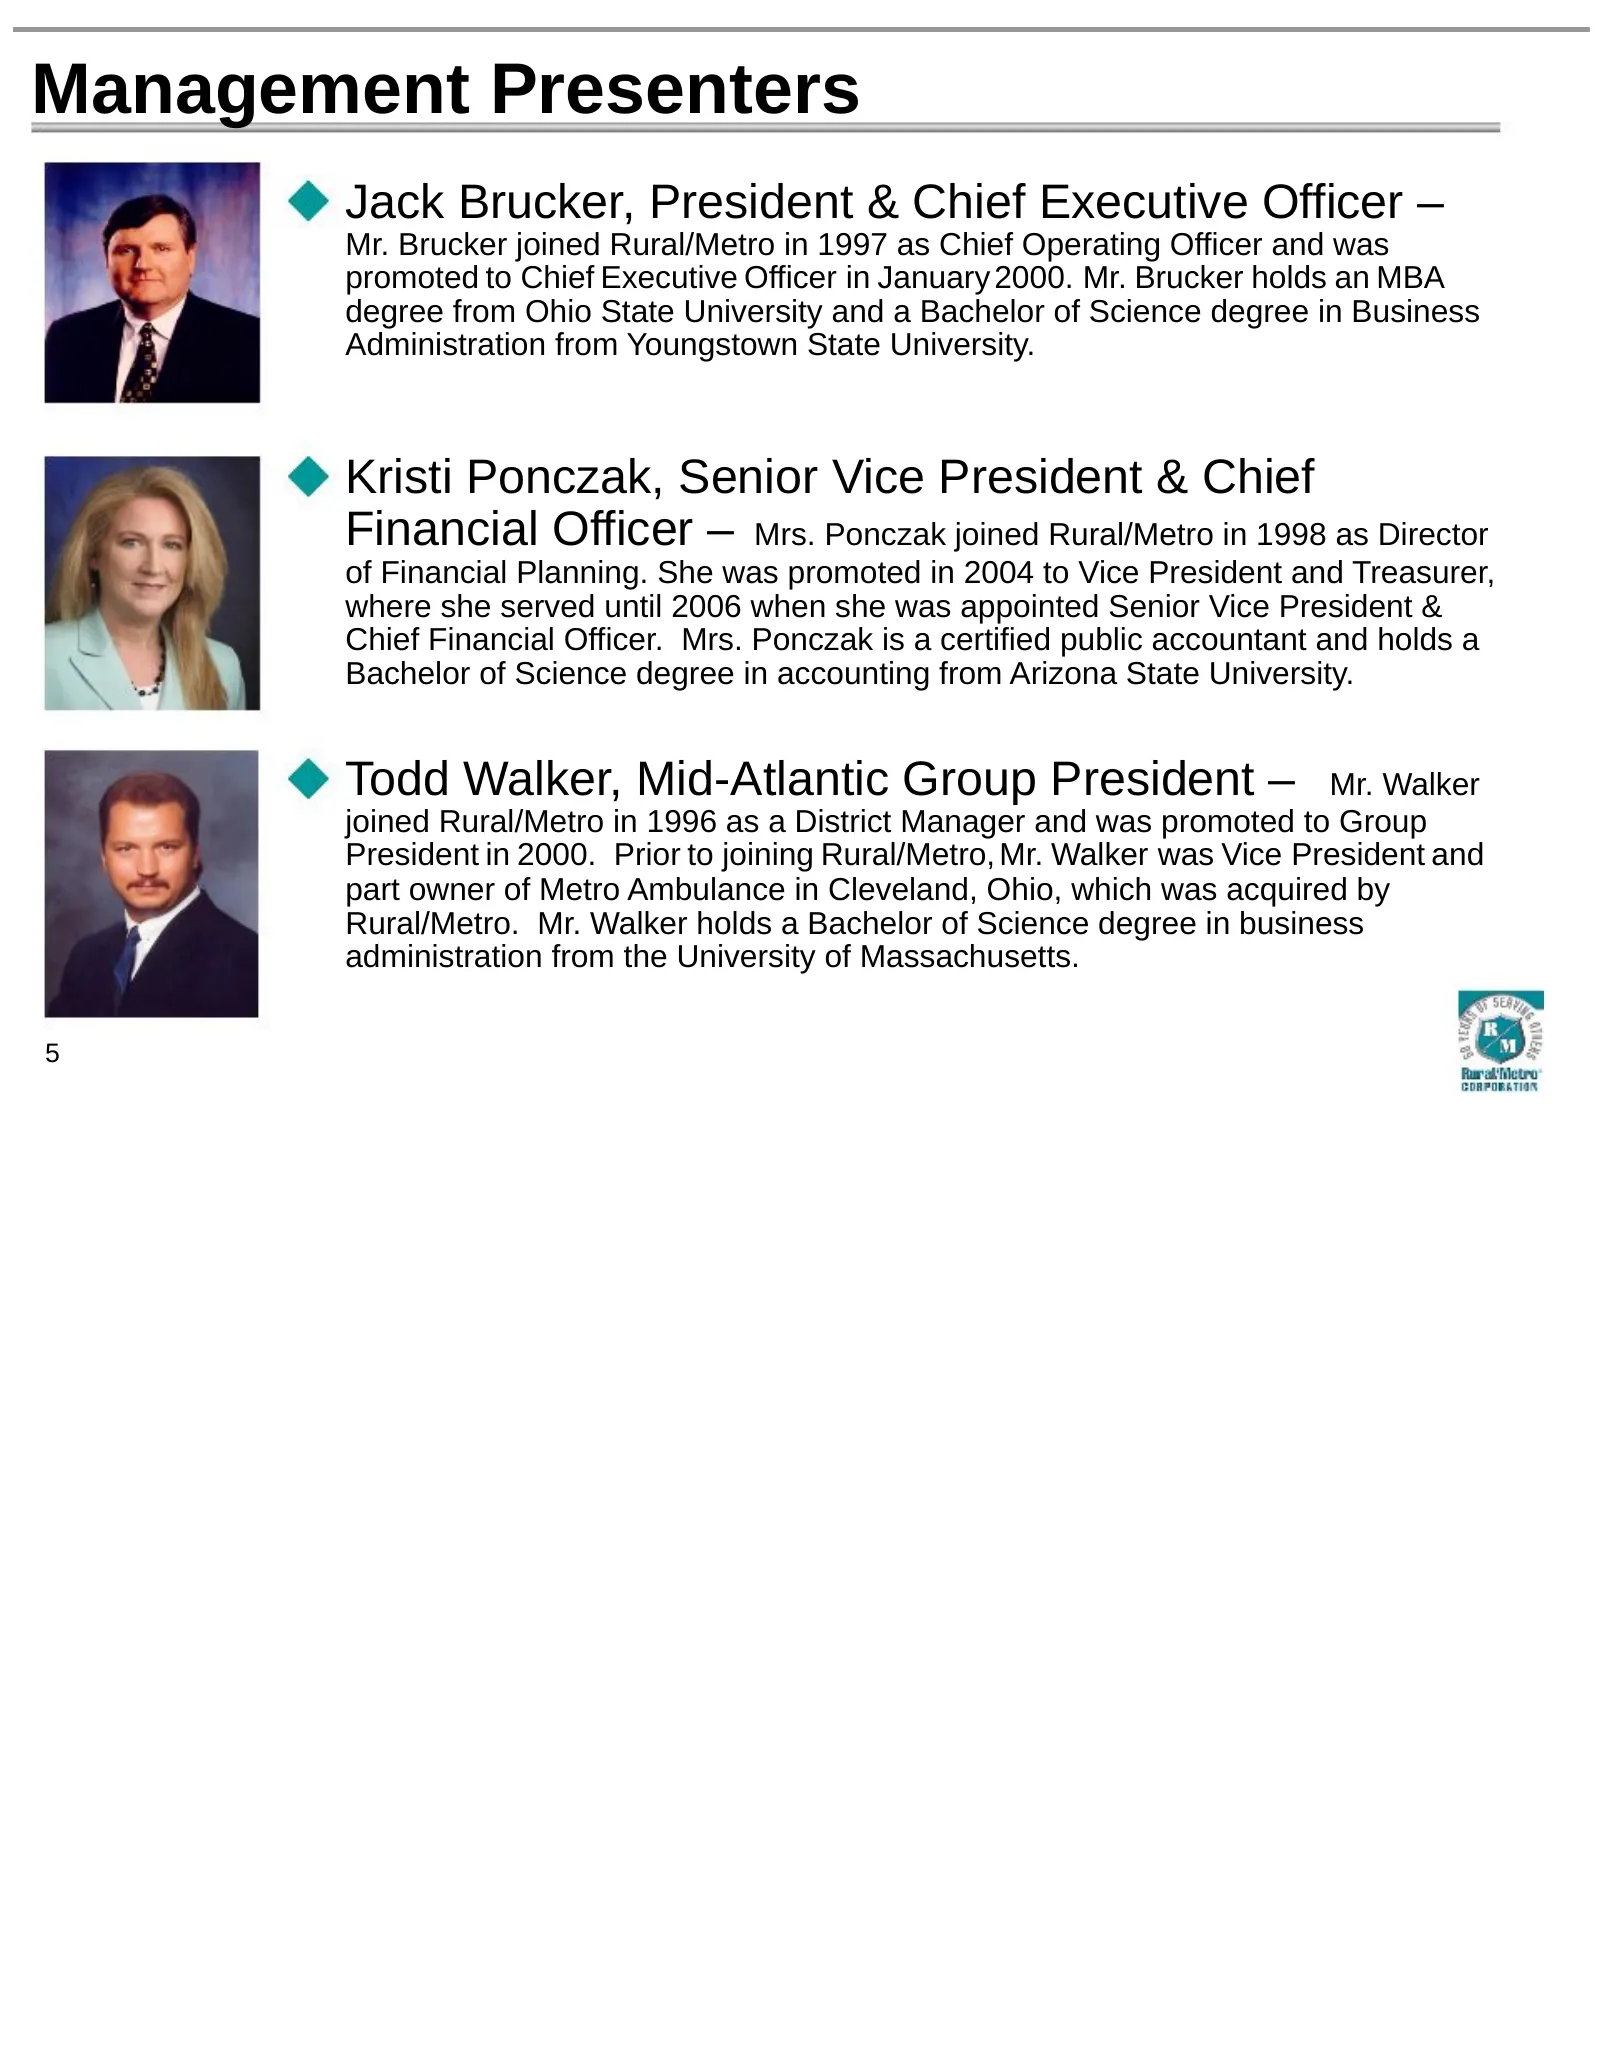
Management Presenters Jack Brucker, President & Chief Executive Officer – Mr. Brucker joined Rural/Metro in 1997 as Chief Operating Officer and was promoted to Chief Executive Officer in January 2000. Mr. Brucker holds an MBA degree from Ohio State University and a Bachelor of Science degree in Busi

Slide 6: The Industry, The Company, & The Business
The Industry, The Company, & The Business Jack Brucker, President & CEO 6
Slide 7: Industry Overview
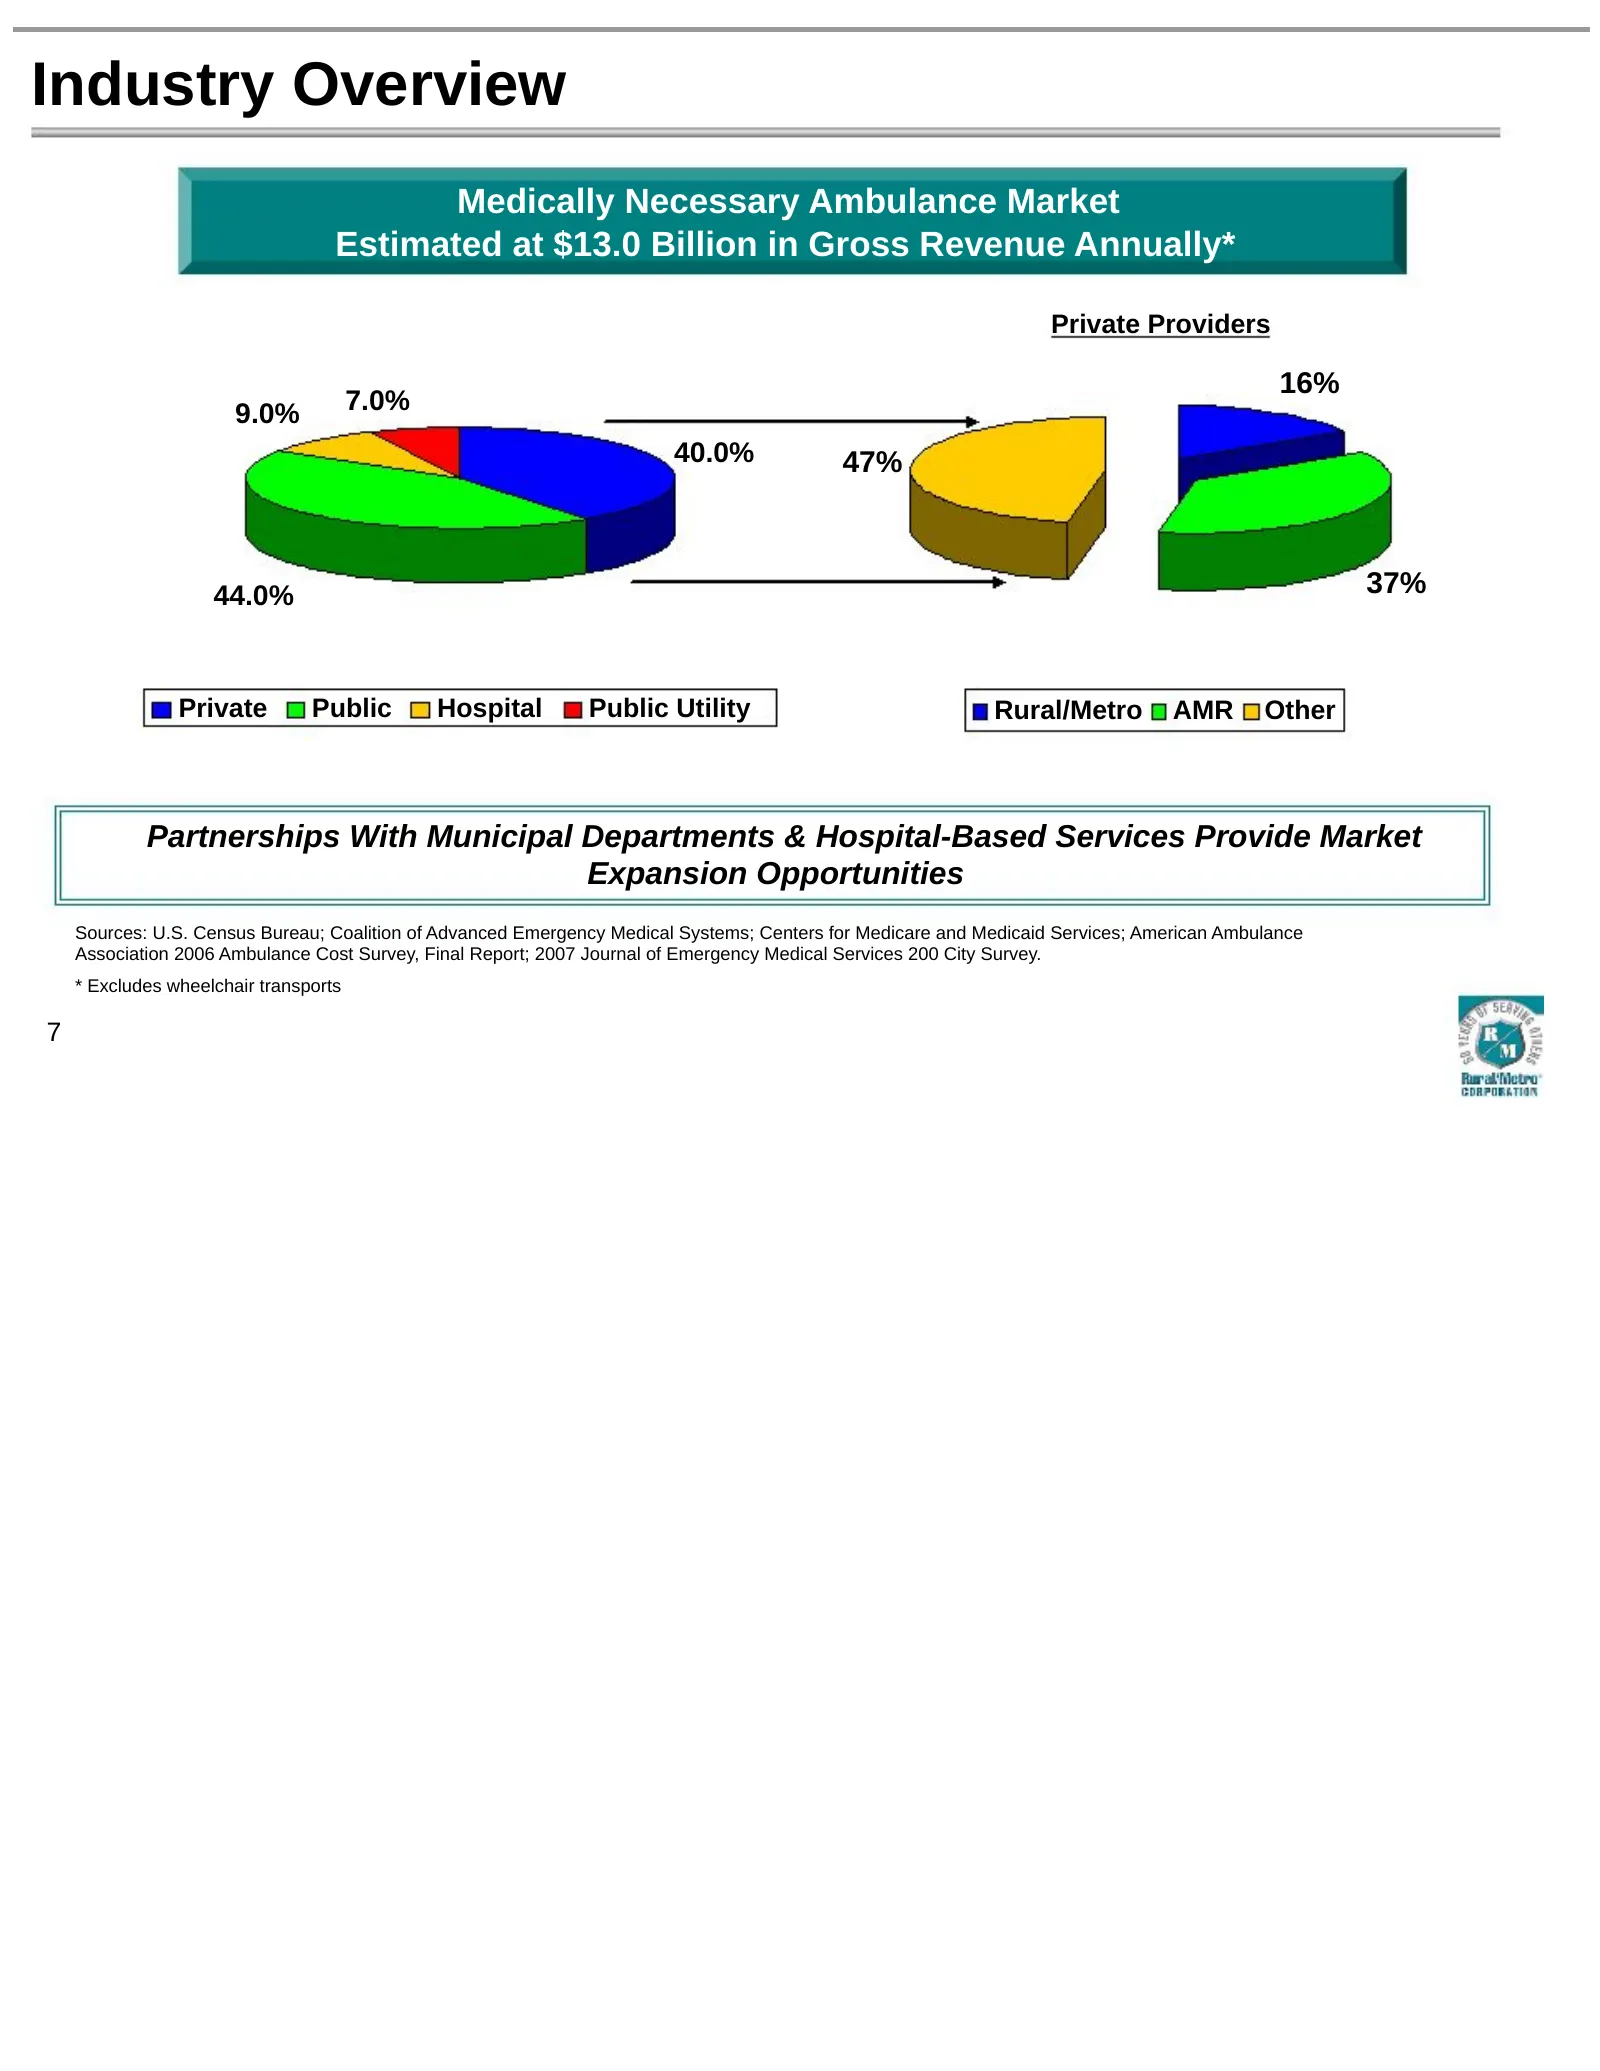
Industry Overview Medically Necessary Ambulance Market Estimated at $13.0 Billion in Gross Revenue Annually* Private Providers 16% 9.0% 7.0% 40.0% 47% 44.0% 37% Private Public Hospital Public Utility Rural/Metro AMR Other Partnerships With Municipal Departments & Hospital-Based Services Provide Mark
Slide 8: Types of Ambulance Services
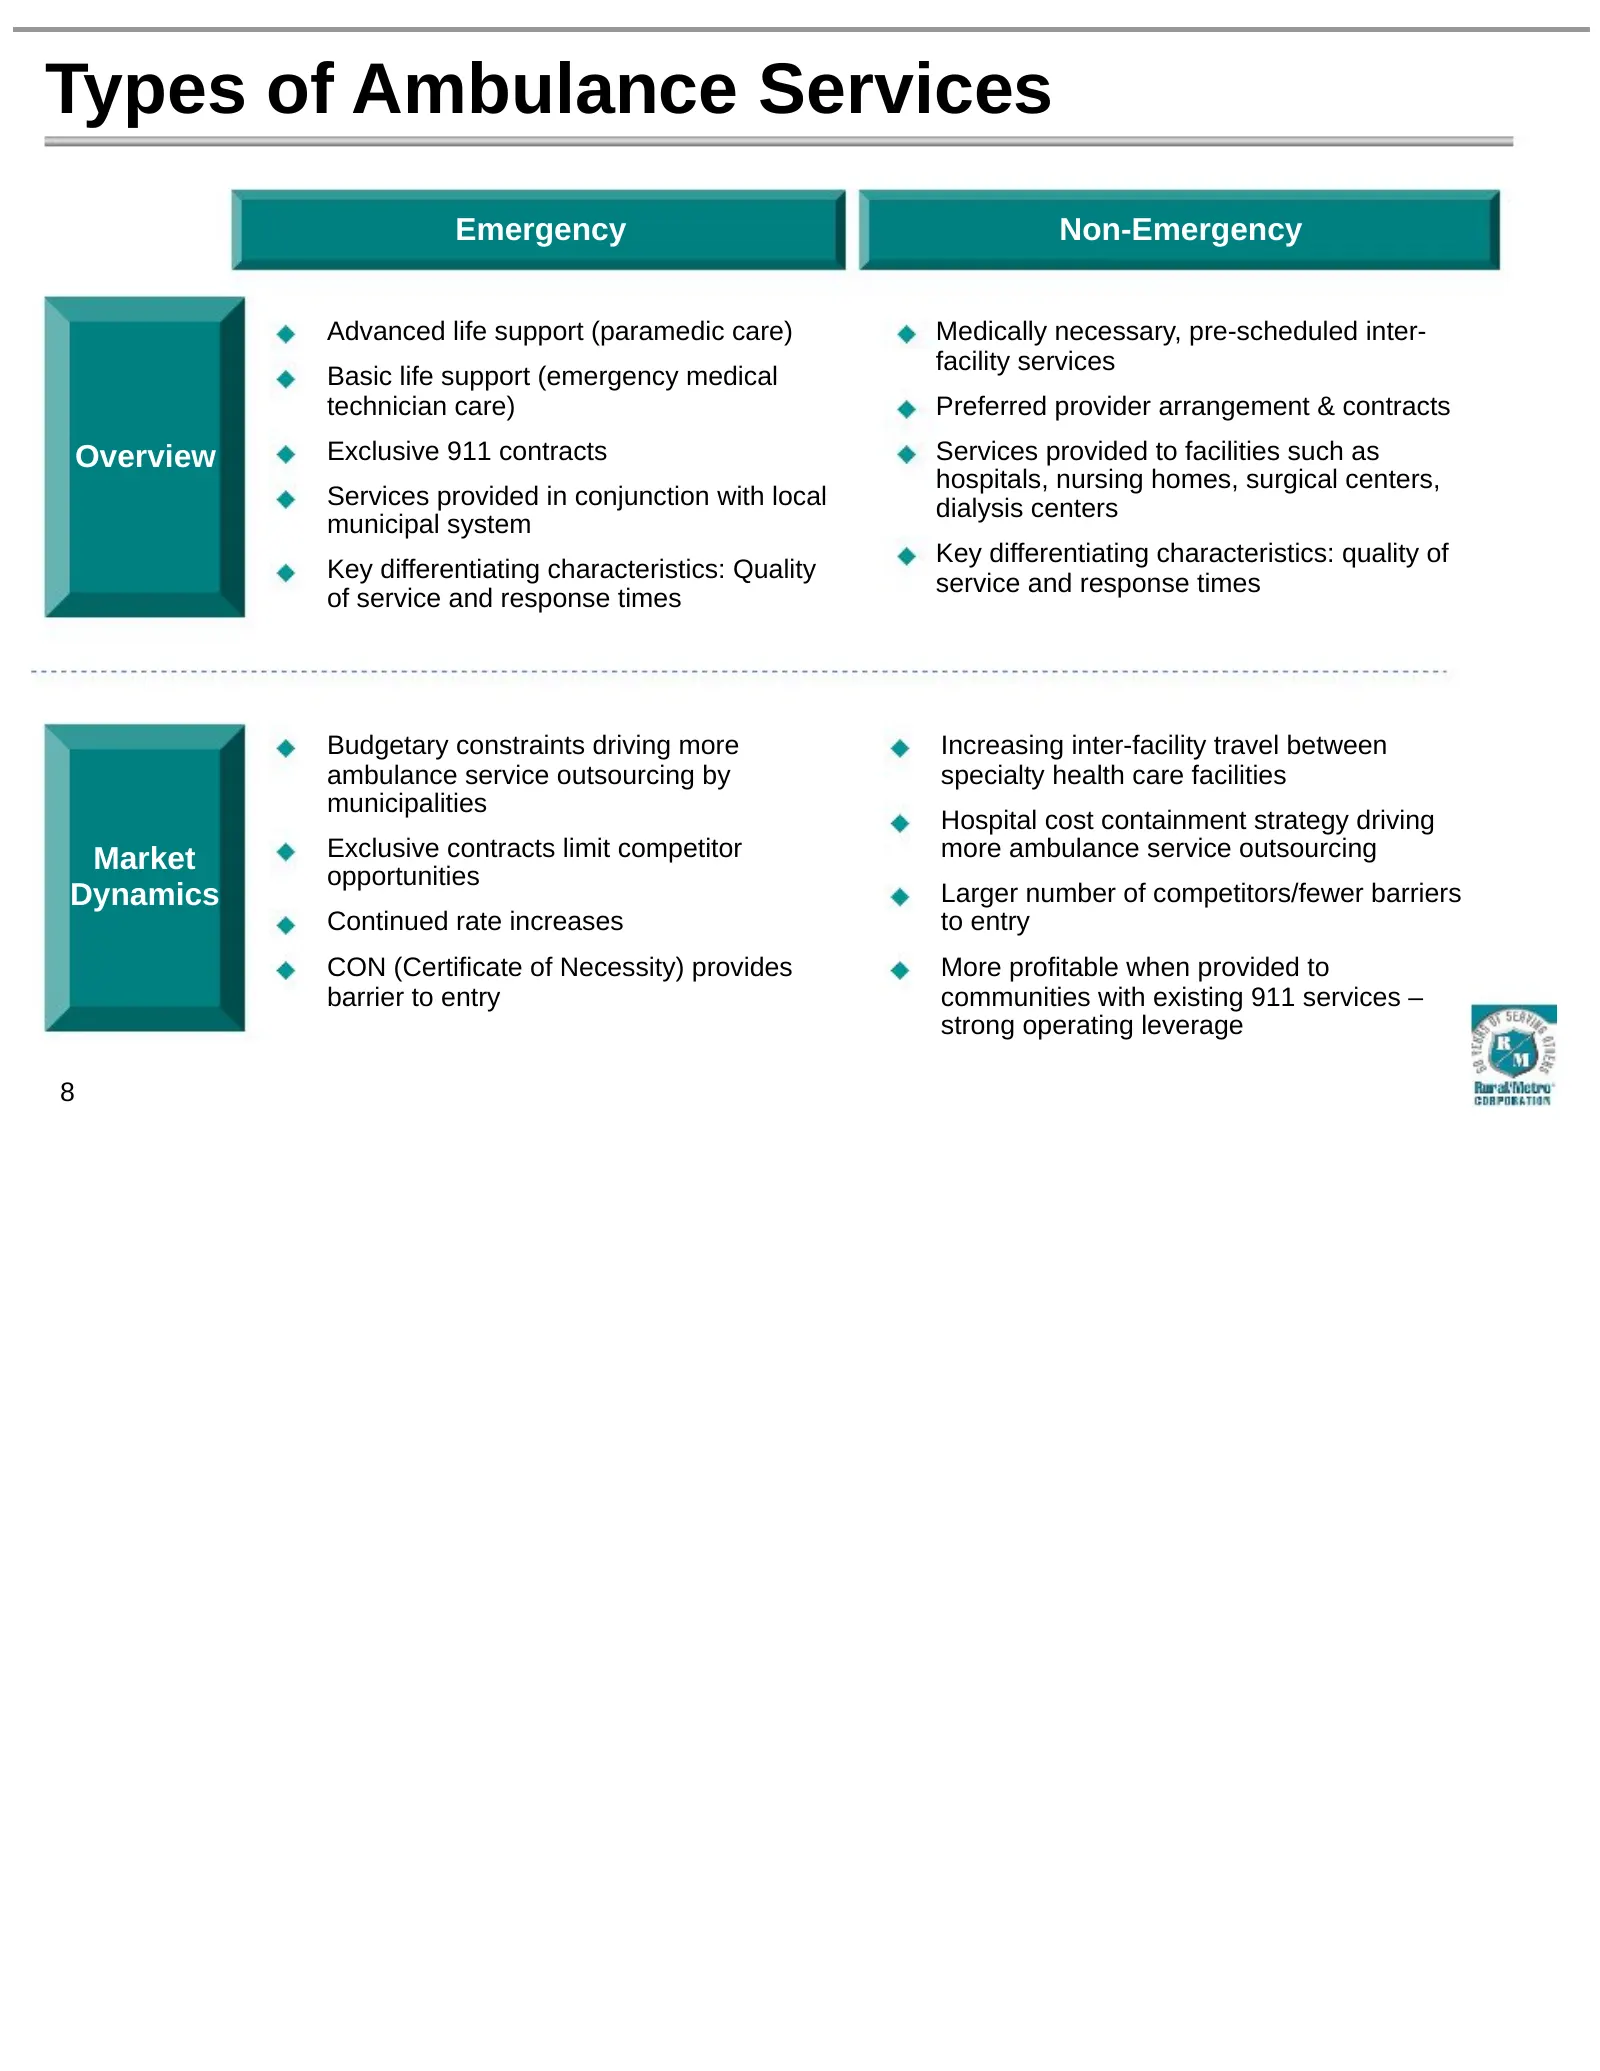
Types of Ambulance Services Emergency Non-Emergency Advanced life support (paramedic care) Medically necessary, pre-scheduled inter- facility services Basic life support (emergency medical technician care) Preferred provider arrangement & contracts Overview Exclusive 911 contracts Services provided
Slide 9: Growth Drivers in Ambulance Reimbursement
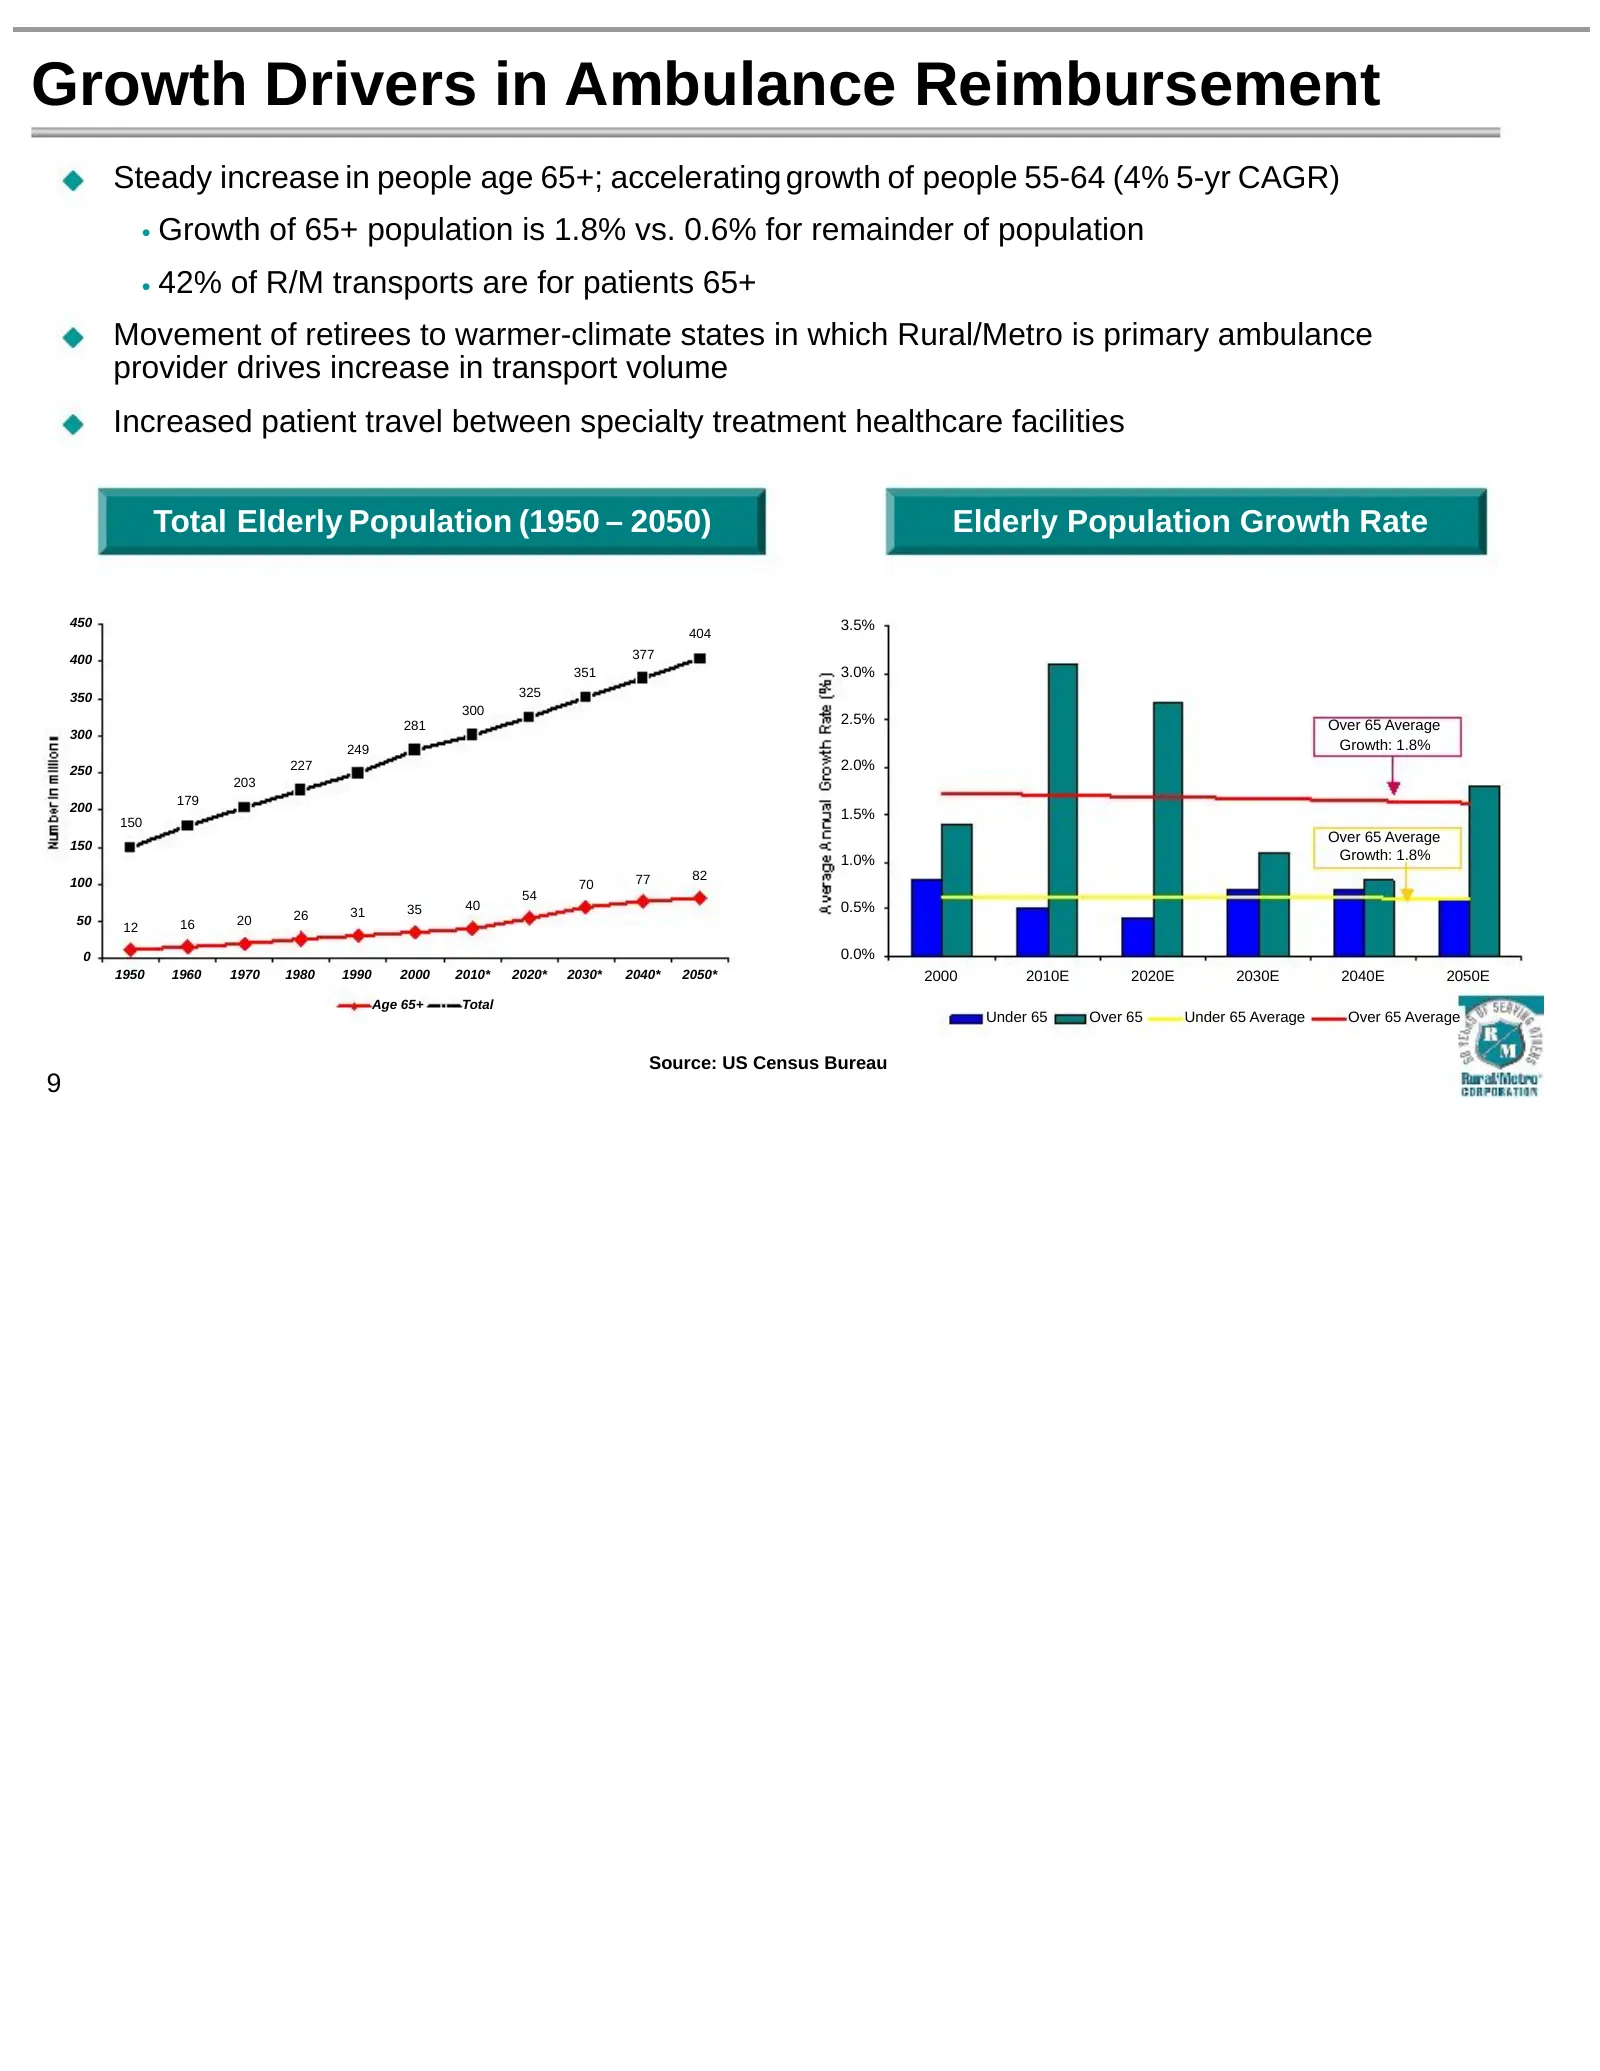
Growth Drivers in Ambulance Reimbursement Steady increase in people age 65+; accelerating growth of people 55-64 (4% 5-yr CAGR) • Growth of 65+ population is 1.8% vs. 0.6% for remainder of population • 42% of R/M transports are for patients 65+ Movement of retirees to warmer-climate states in which
Slide 10: Positive Impact of Federal Healthcare Reform
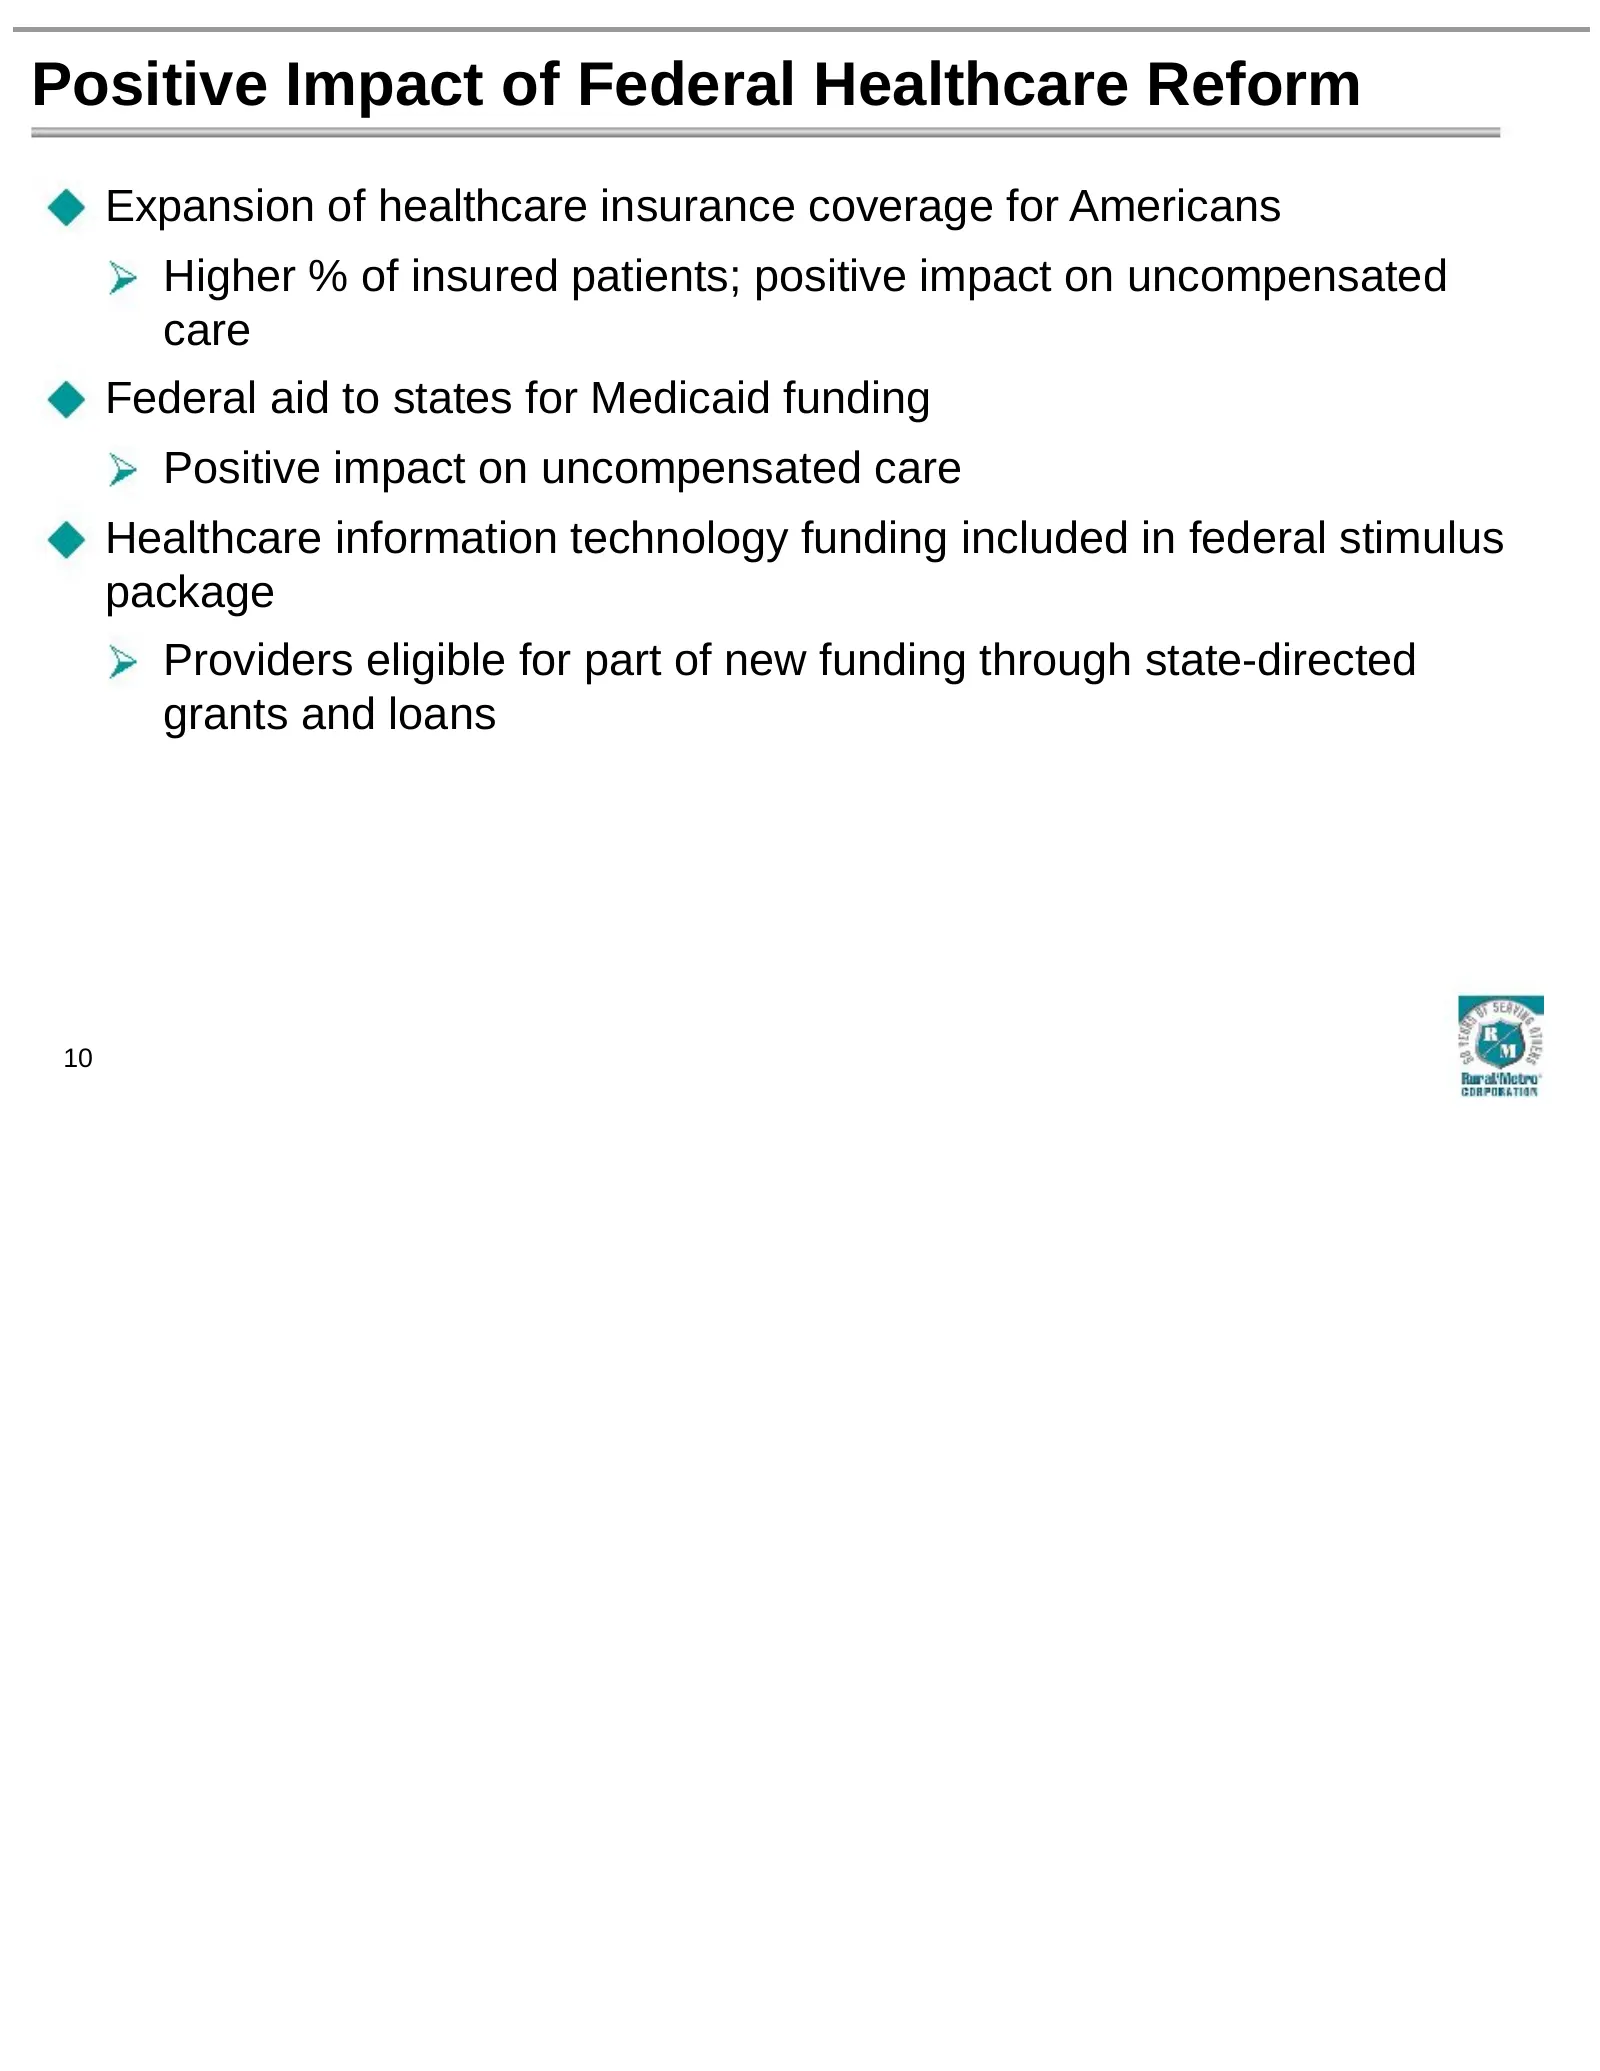
Positive Impact of Federal Healthcare Reform Expansion of healthcare insurance coverage for Americans Higher % of insured patients; positive impact on uncompensated care Federal aid to states for Medicaid funding Positive impact on uncompensated care Healthcare information technology funding include
Slide 11: Reimbursement Environment
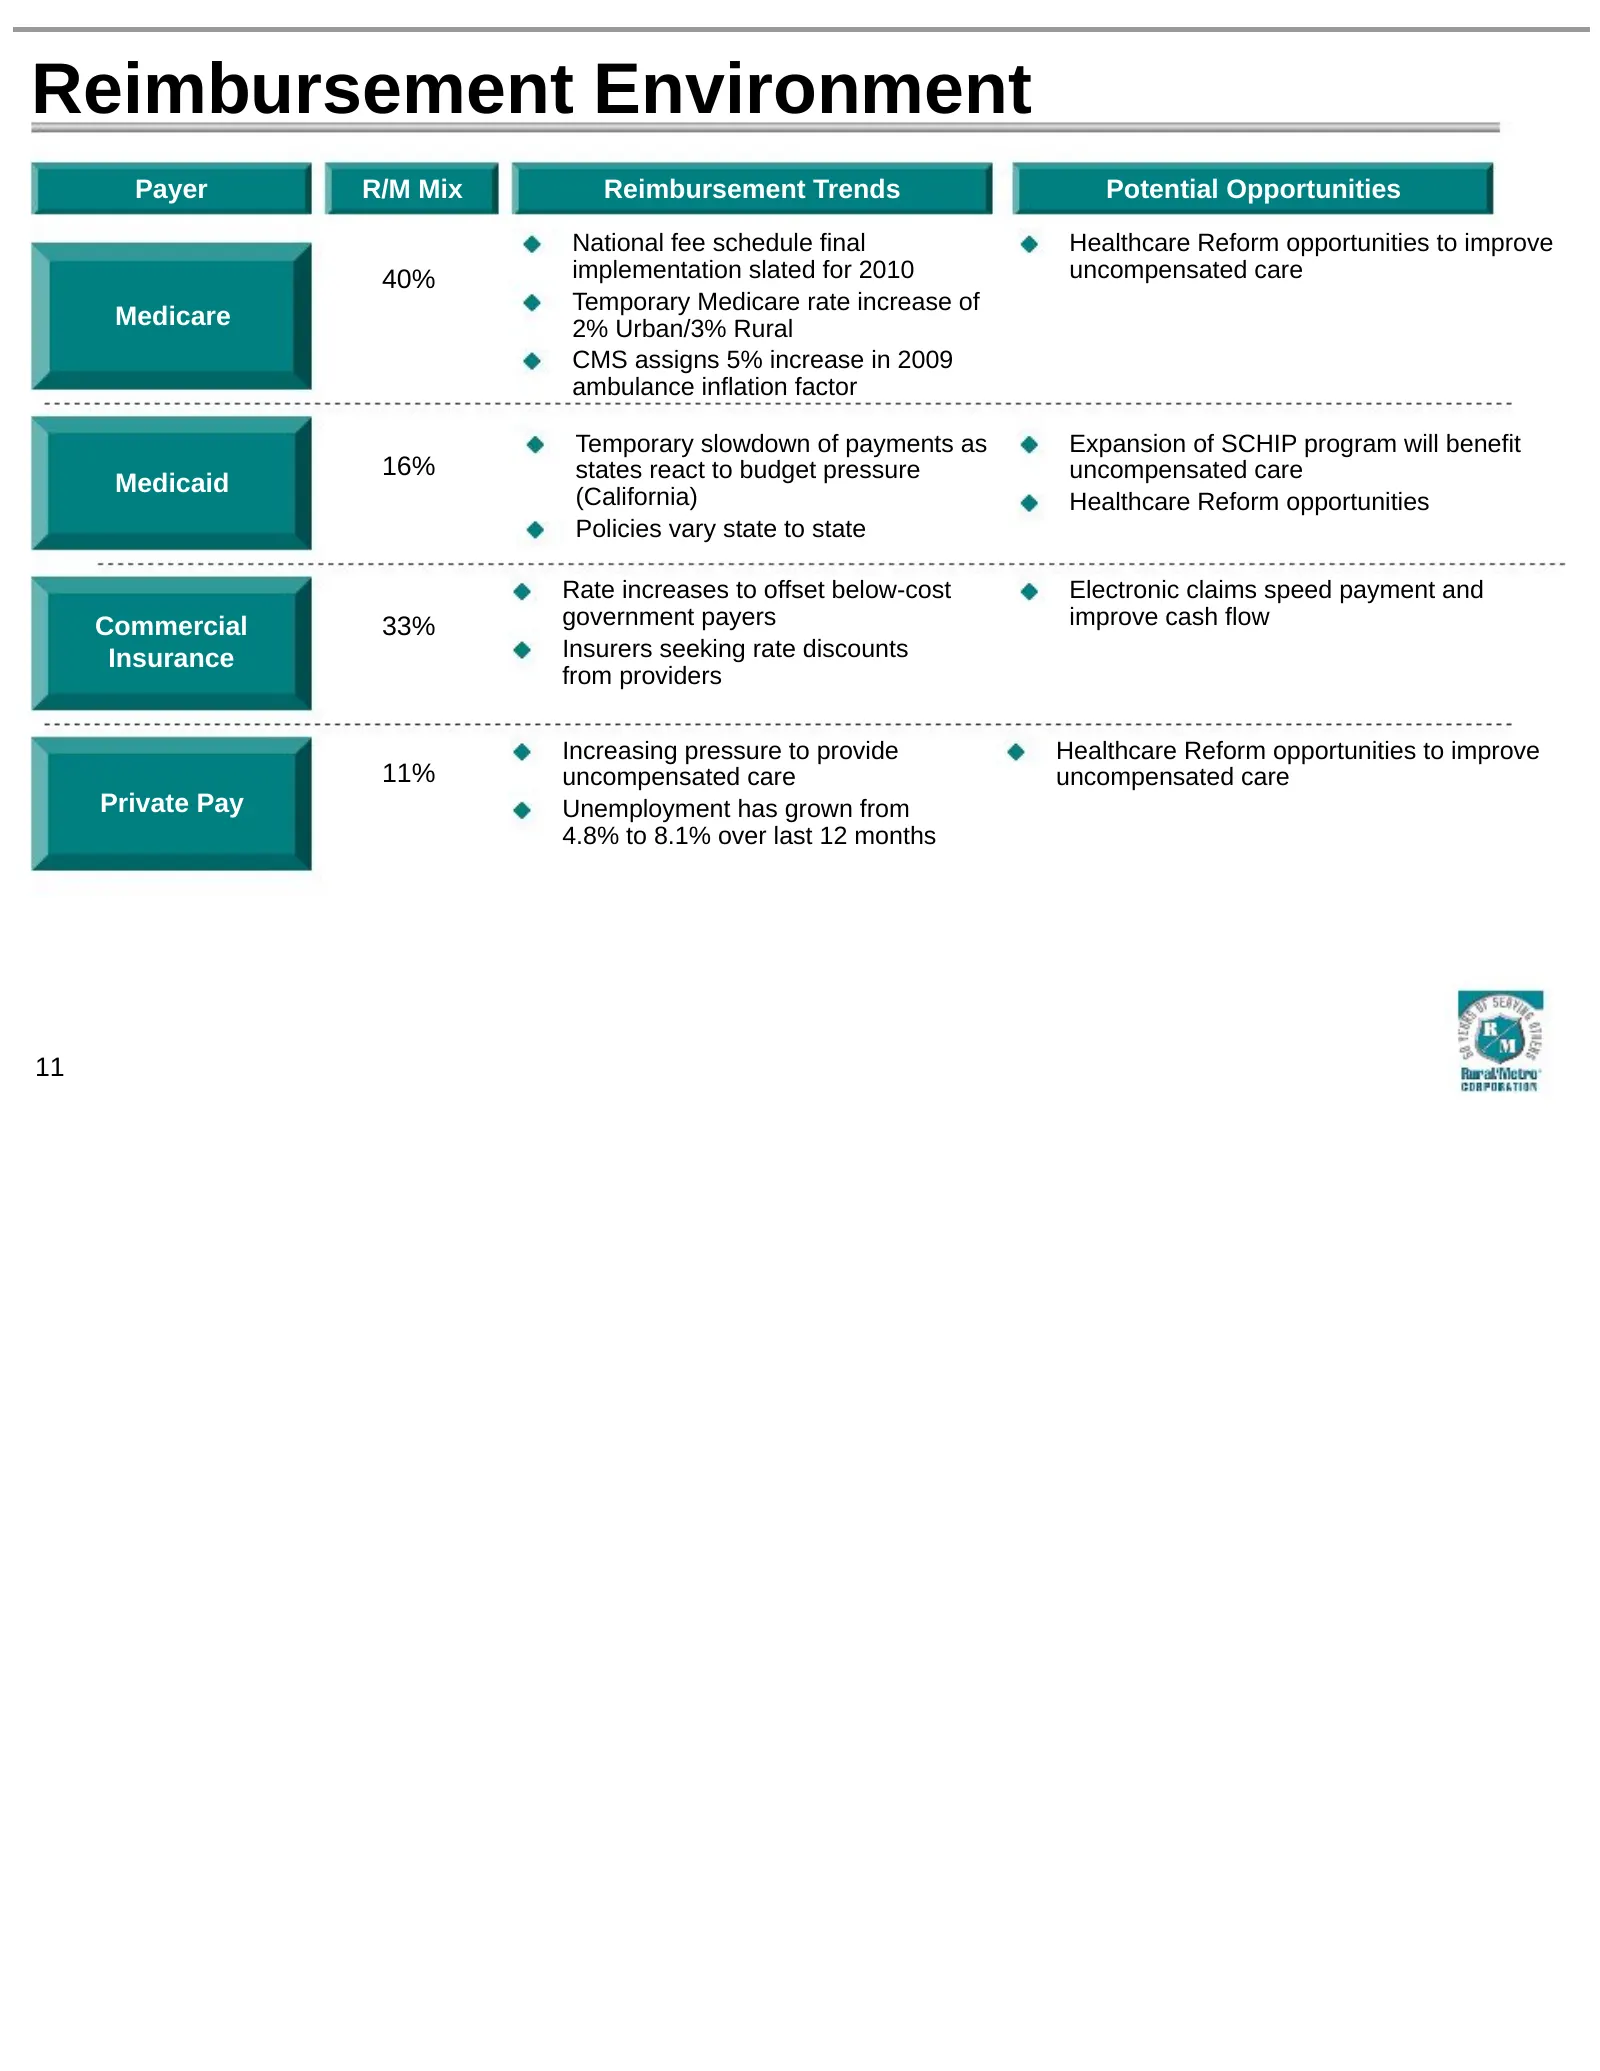
Reimbursement Environment Payer R/M Mix Reimbursement Trends Potential Opportunities National fee schedule final Healthcare Reform opportunities to improve 40% implementation slated for 2010 uncompensated care Temporary Medicare rate increase of Medicare 2% Urban/3% Rural CMS assigns 5% increase in
Slide 12: Company Overview
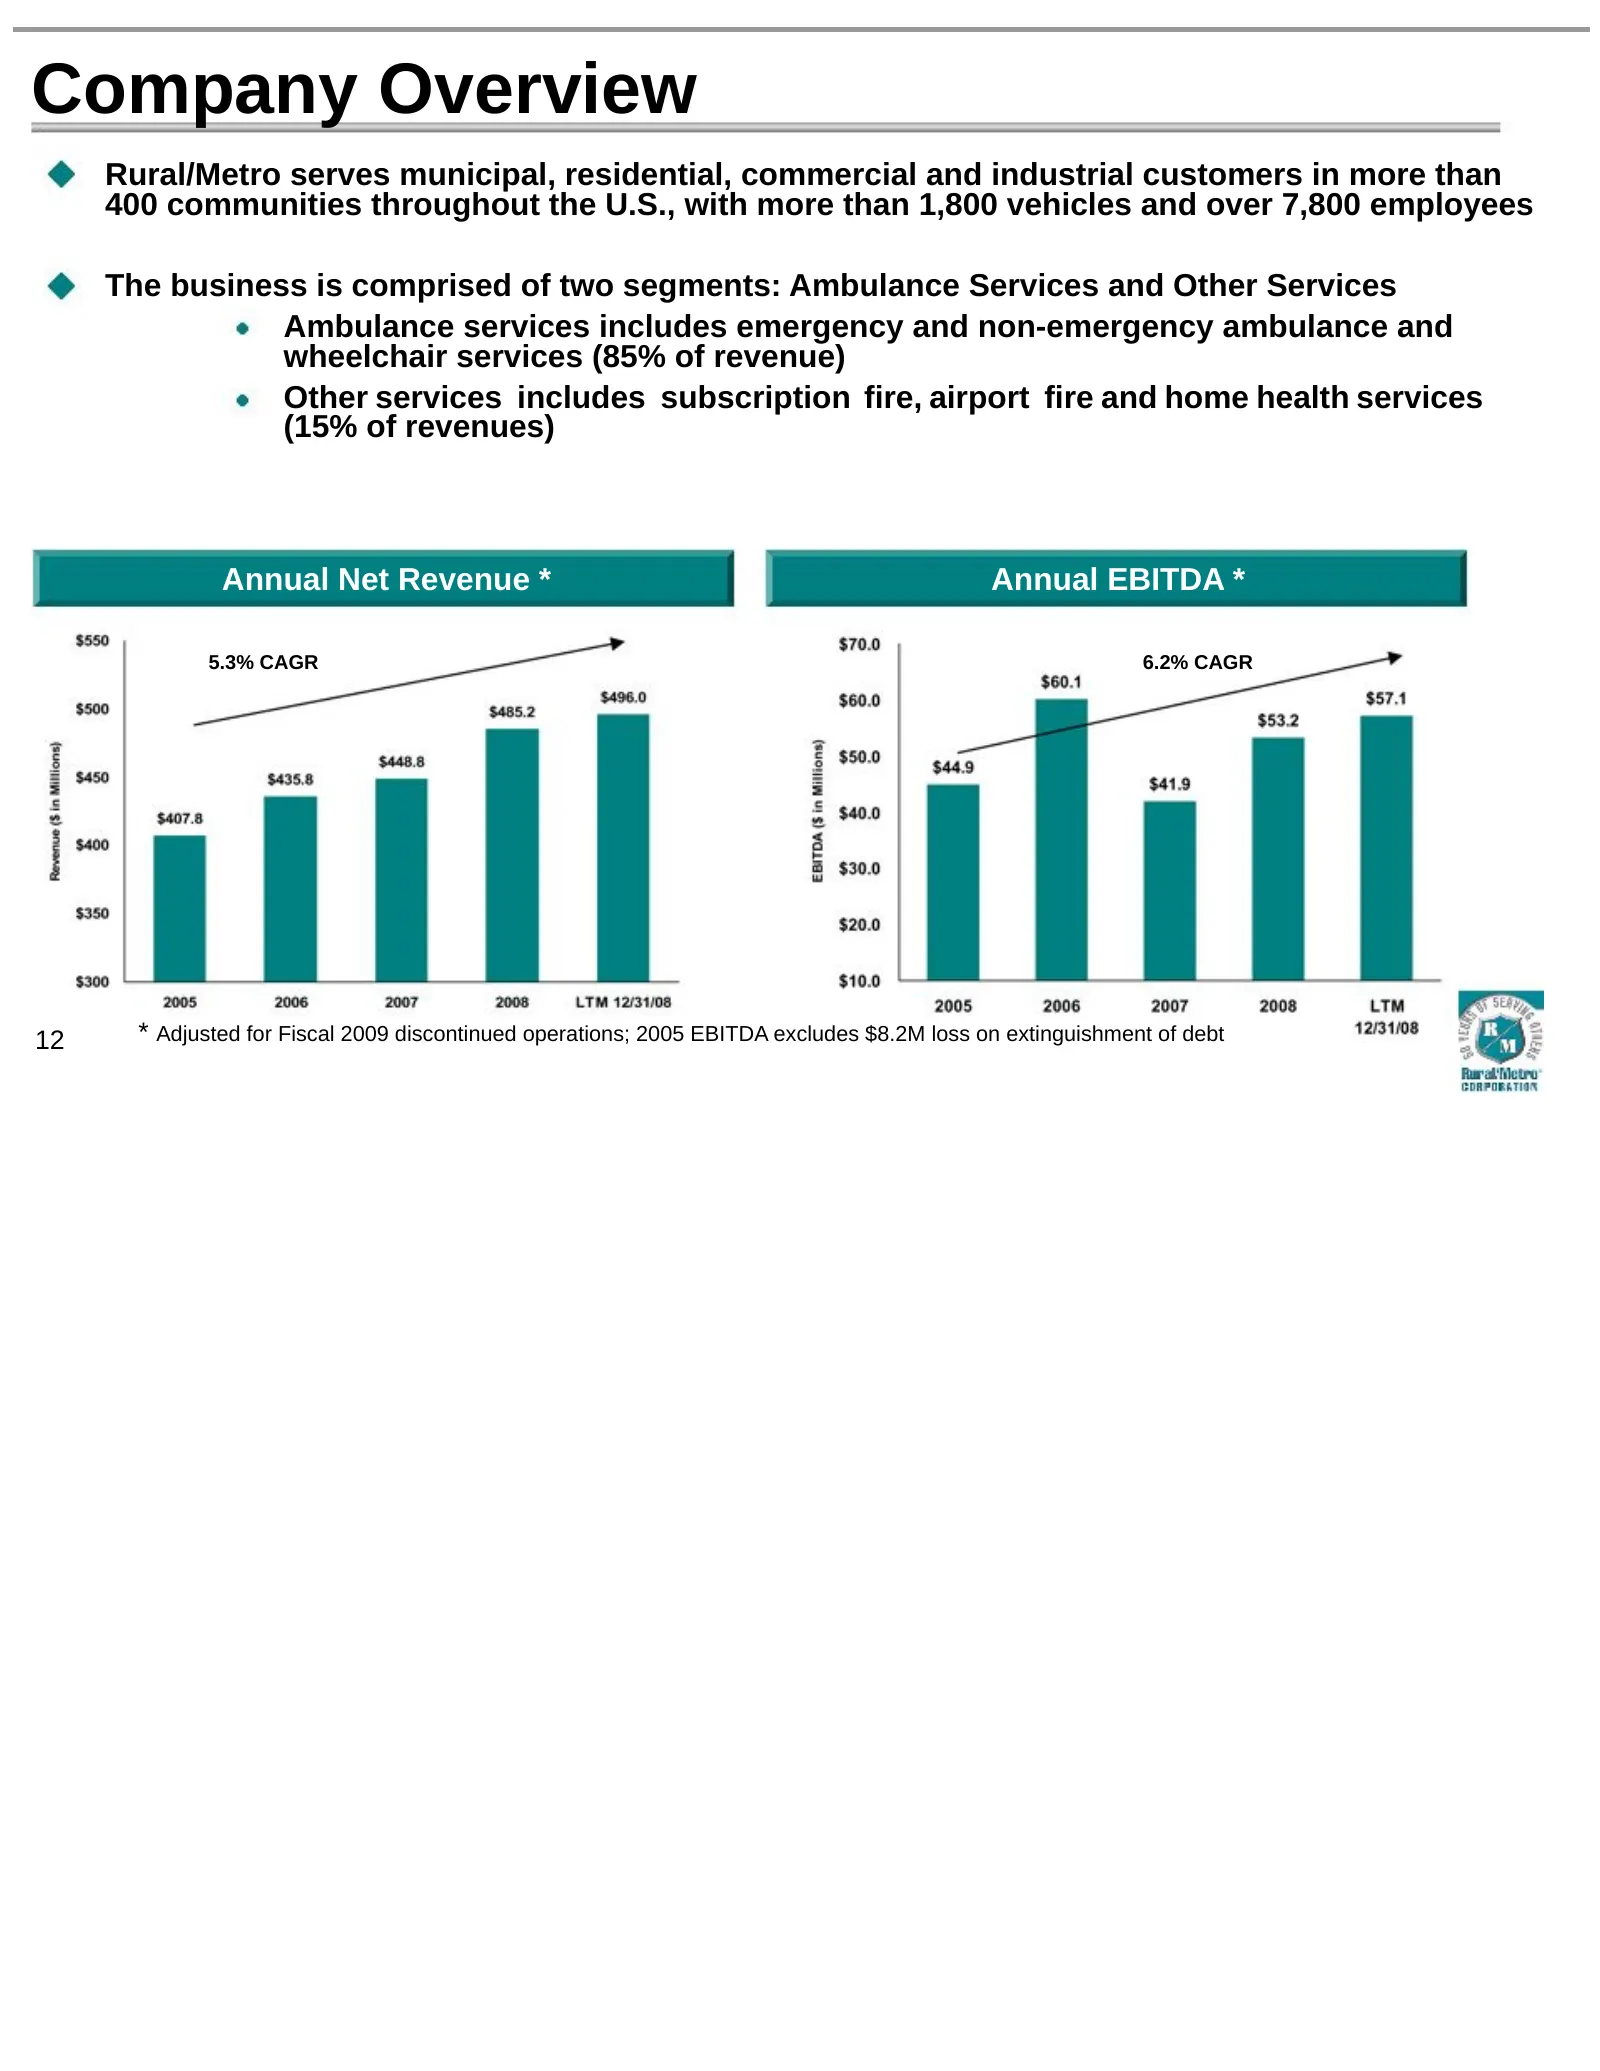
Company Overview Rural/Metro serves municipal, residential, commercial and industrial customers in more than 400 communities throughout the U.S., with more than 1,800 vehicles and over 7,800 employees The business is comprised of two segments: Ambulance Services and Other Services Ambulance services
Slide 13: National Presence
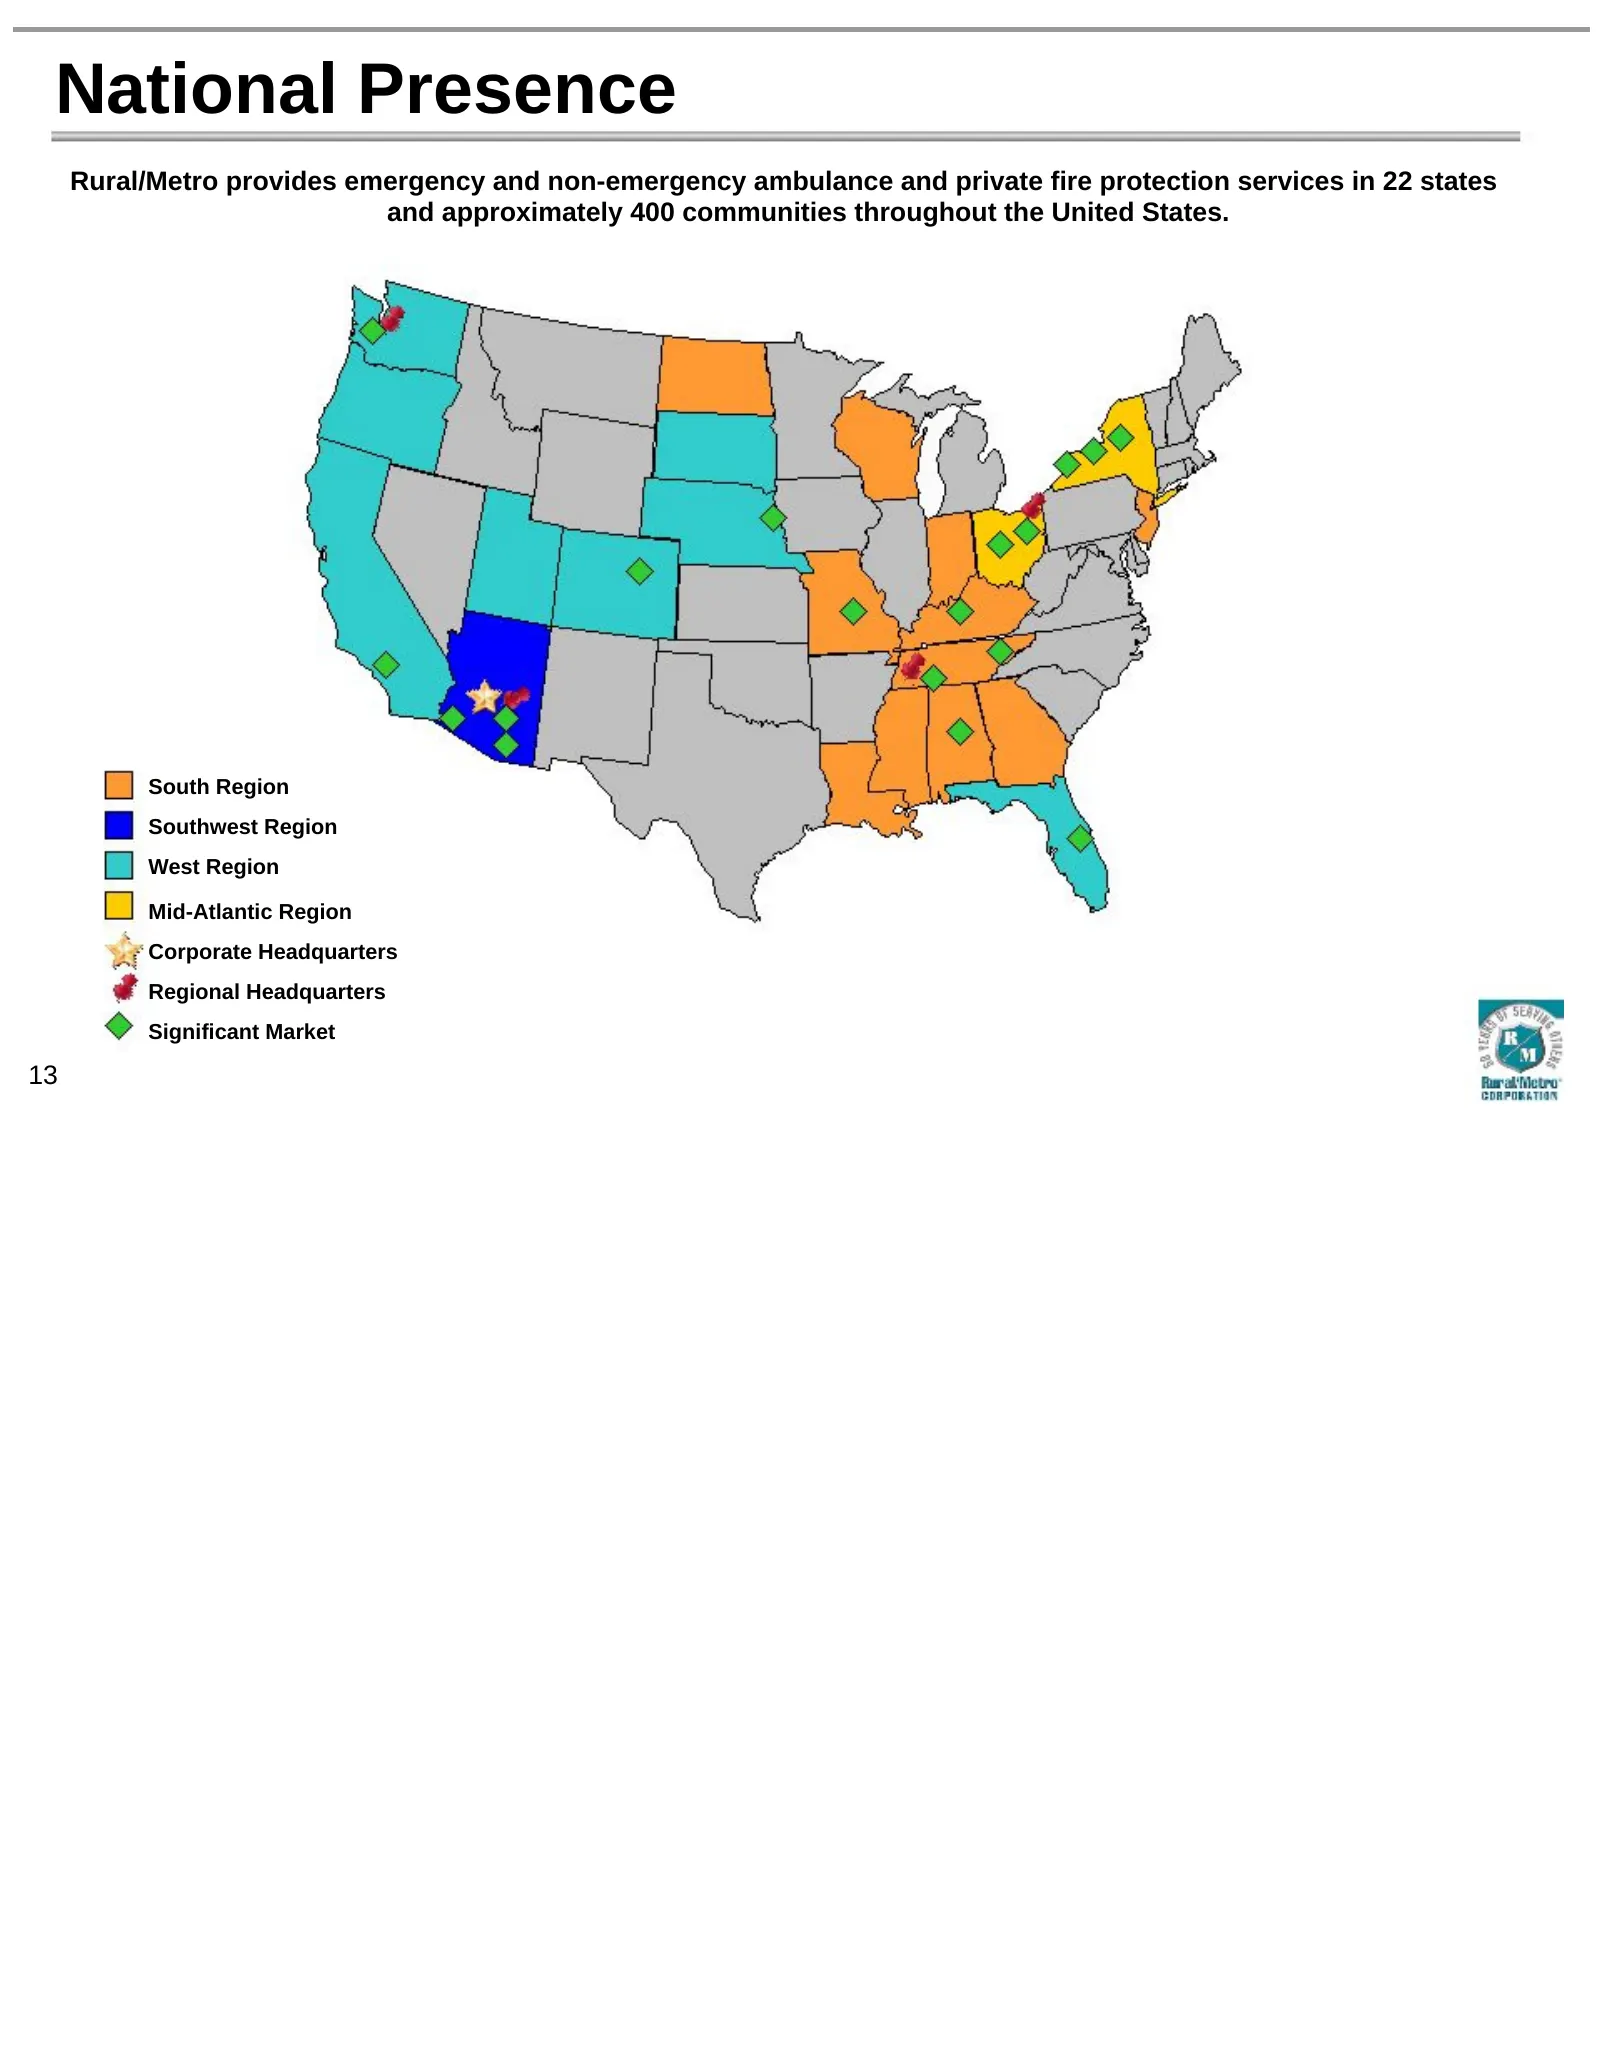
National Presence Rural/Metro provides emergency and non-emergency ambulance and private fire protection services in 22 states and approximately 400 communities throughout the United States. South Region Southwest Region West Region Mid-Atlantic Region Corporate Headquarters Regional Headquarters Si
Slide 14: Company History
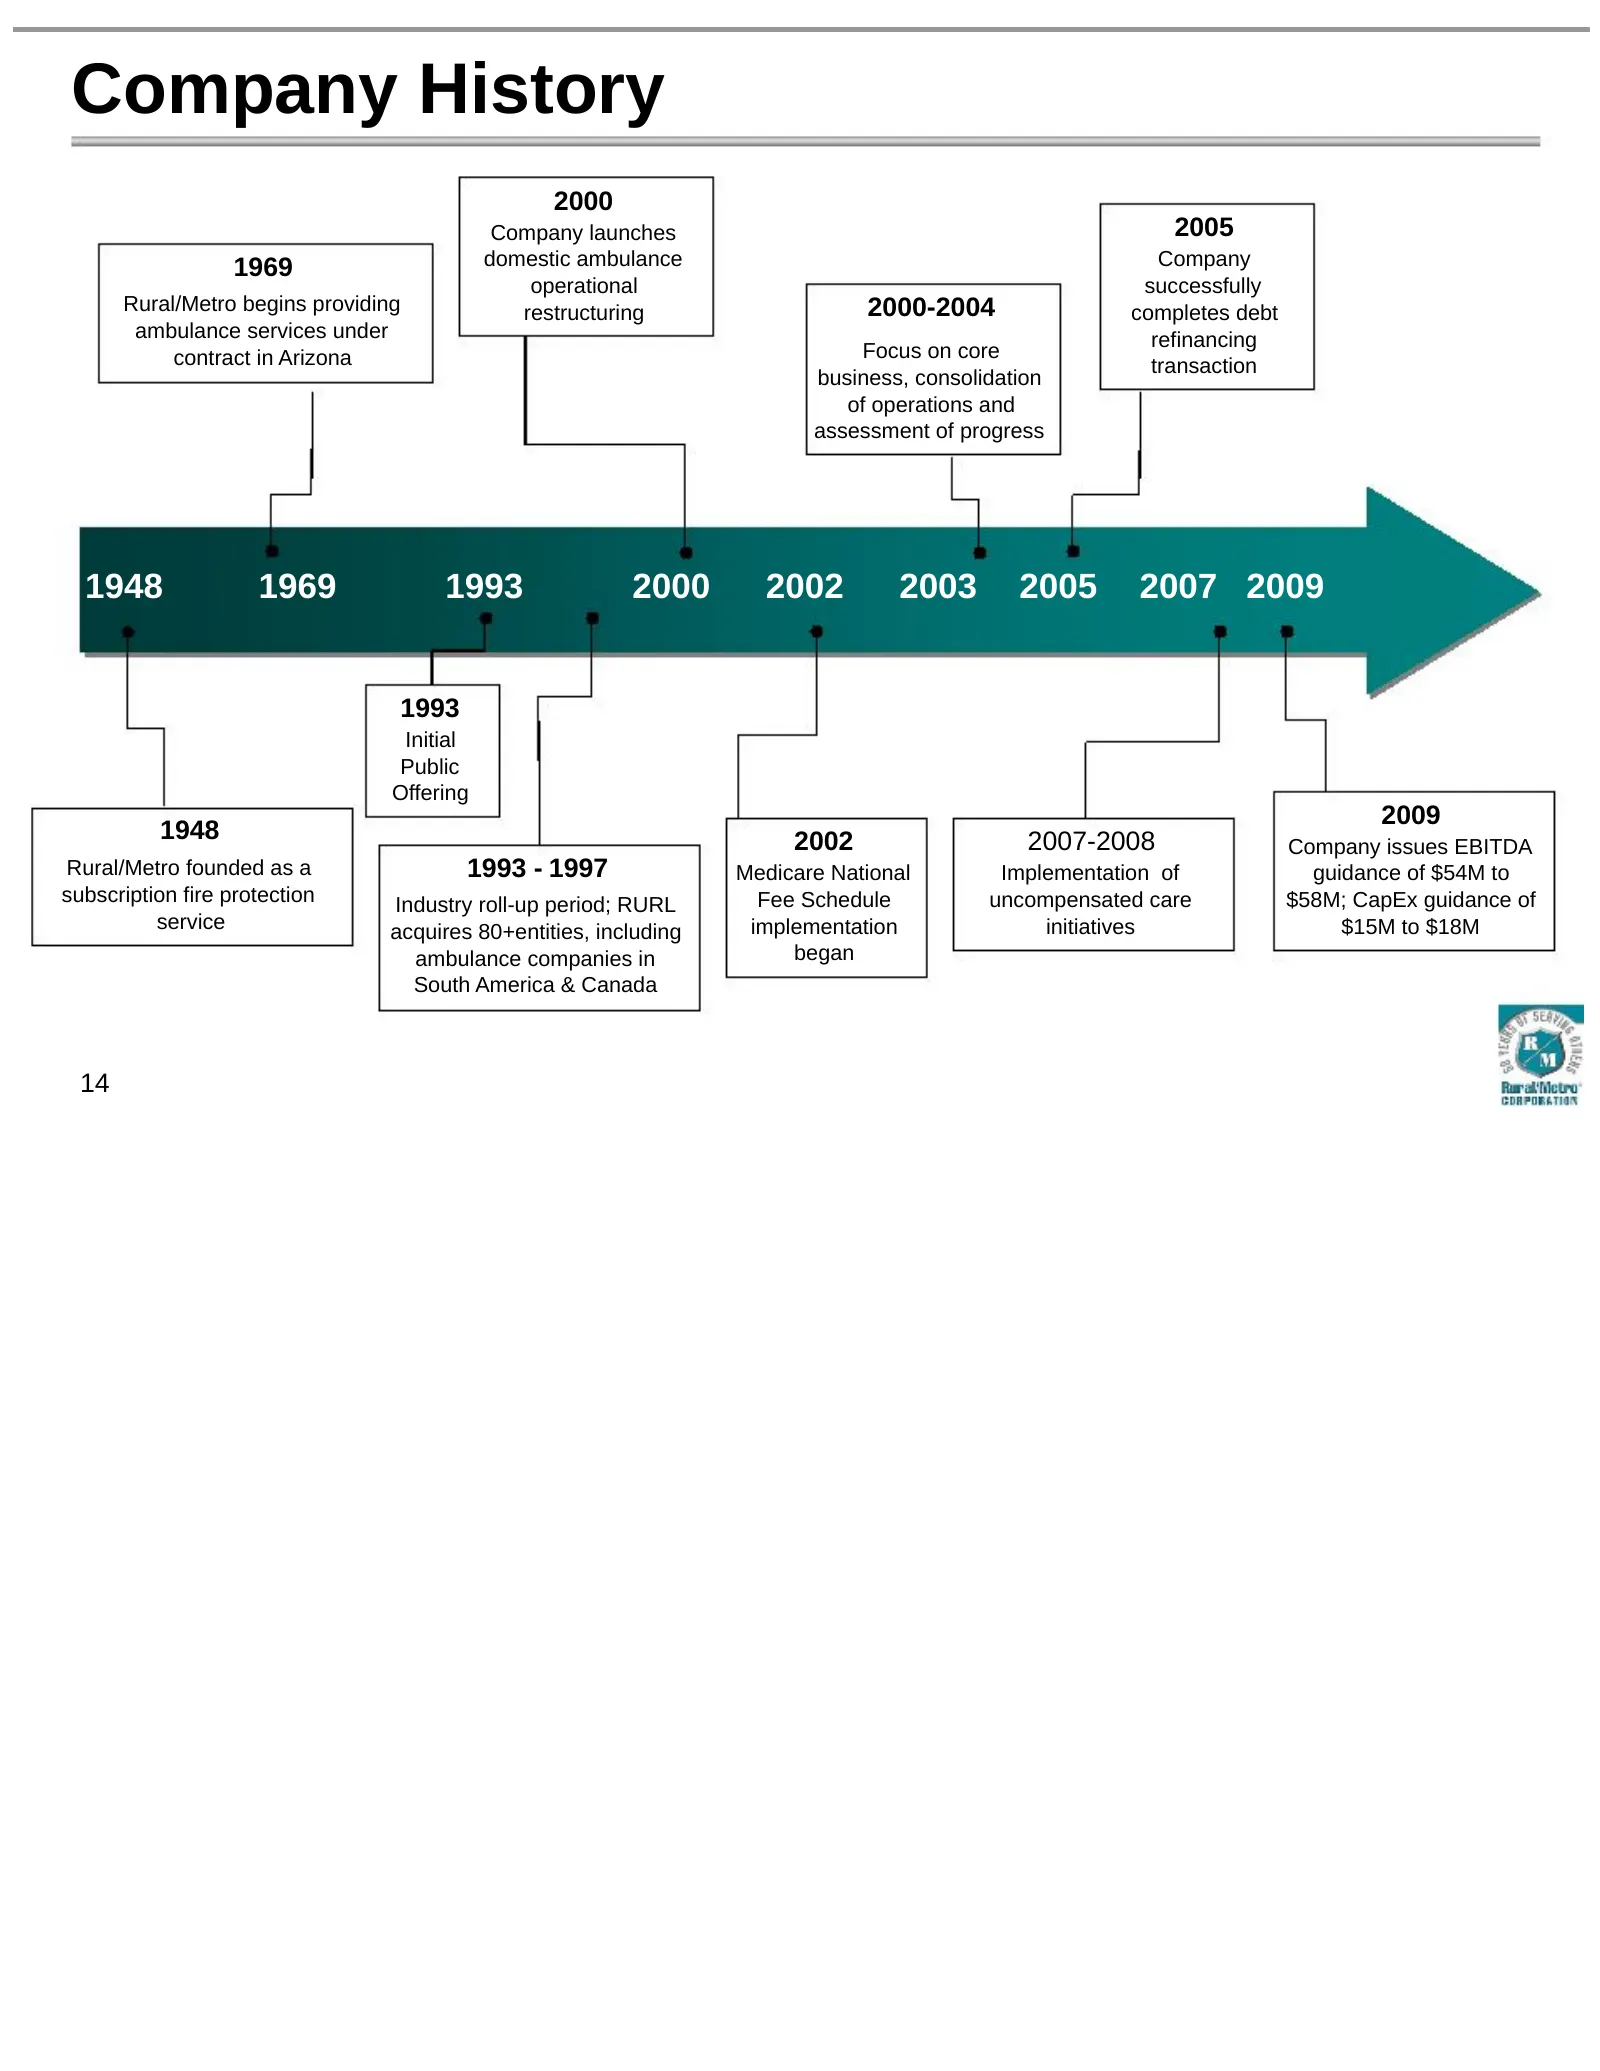
Company History 2000 Company launches 2005 1969 domestic ambulance Company operational successfully Rural/Metro begins providing restructuring 2000-2004 completes debt ambulance services under refinancing contract in Arizona Focus on core transaction business, consolidation of operations and assessm
Slide 15: Lines of Business
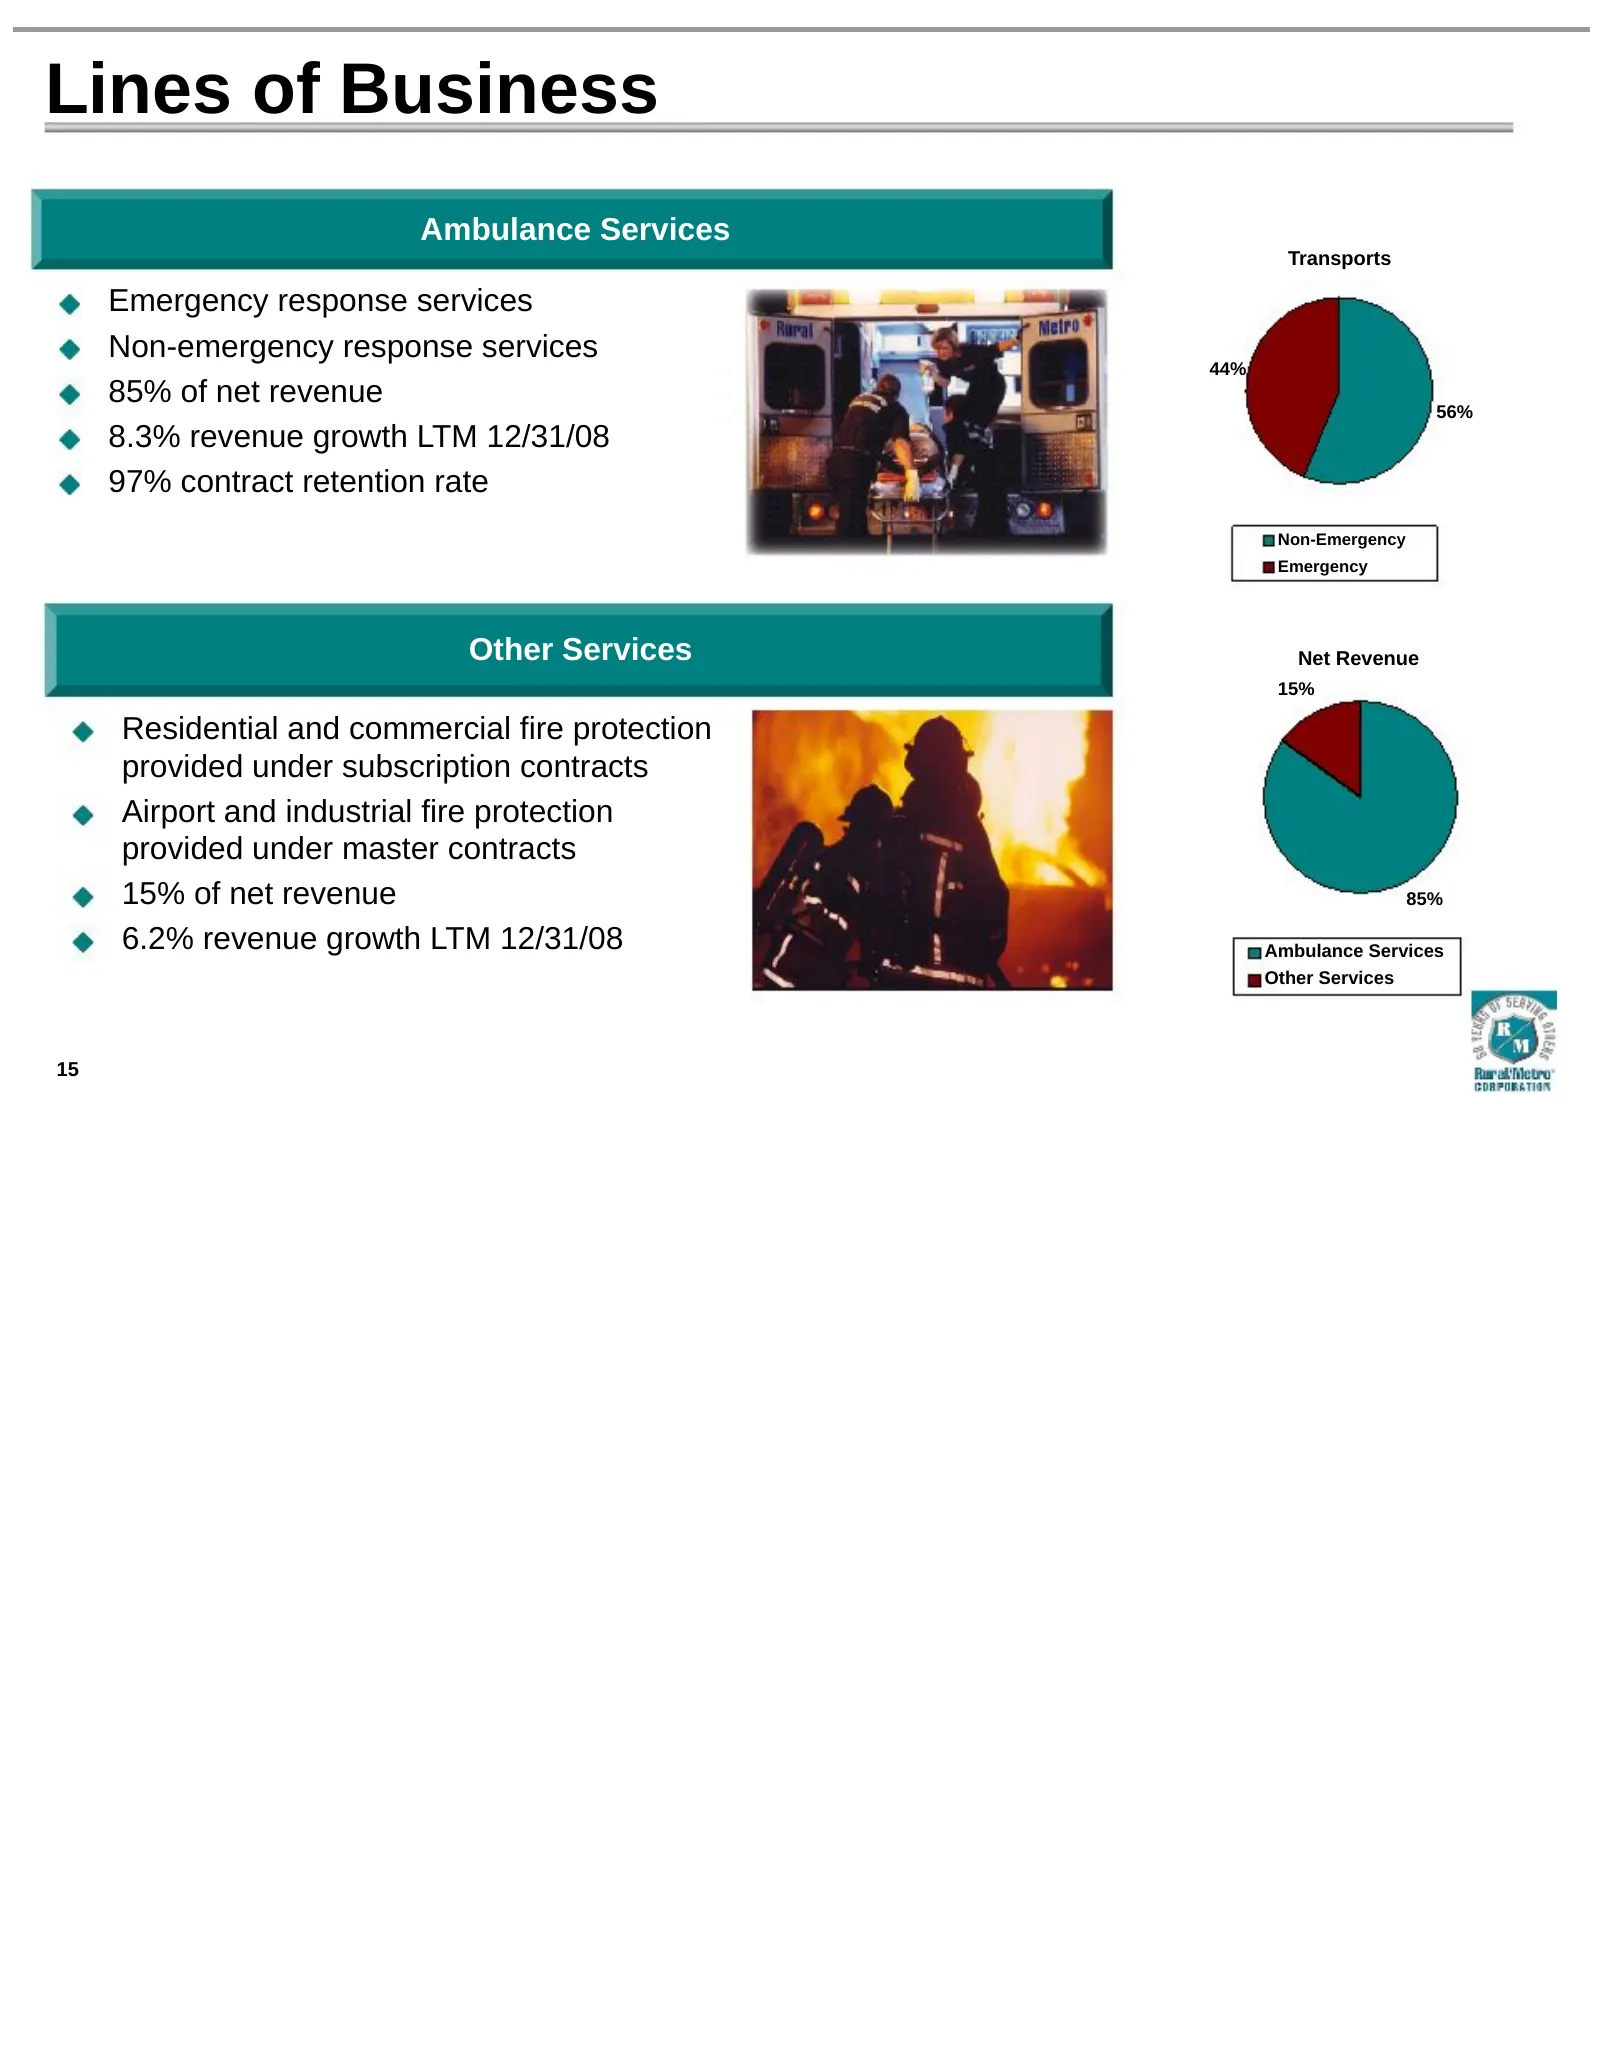
Lines of Business Ambulance Services Transports Emergency response services Non-emergency response services 44% 85% of net revenue 56% 8.3% revenue growth LTM 12/31/08 97% contract retention rate Non-Emergency Emergency Other Services Net Revenue 15% Residential and commercial fire protection provid
Slide 16: Regional Overview
Regional Overview 4 operating segments: Mid-Atlantic, South, Southwest, West Management structure includes Group Presidents, Division General Managers, Market General Managers Shared services at corporate level include risk management, financial services, Medicare compliance, national purchasing, na
Slide 17: Examples of Customers
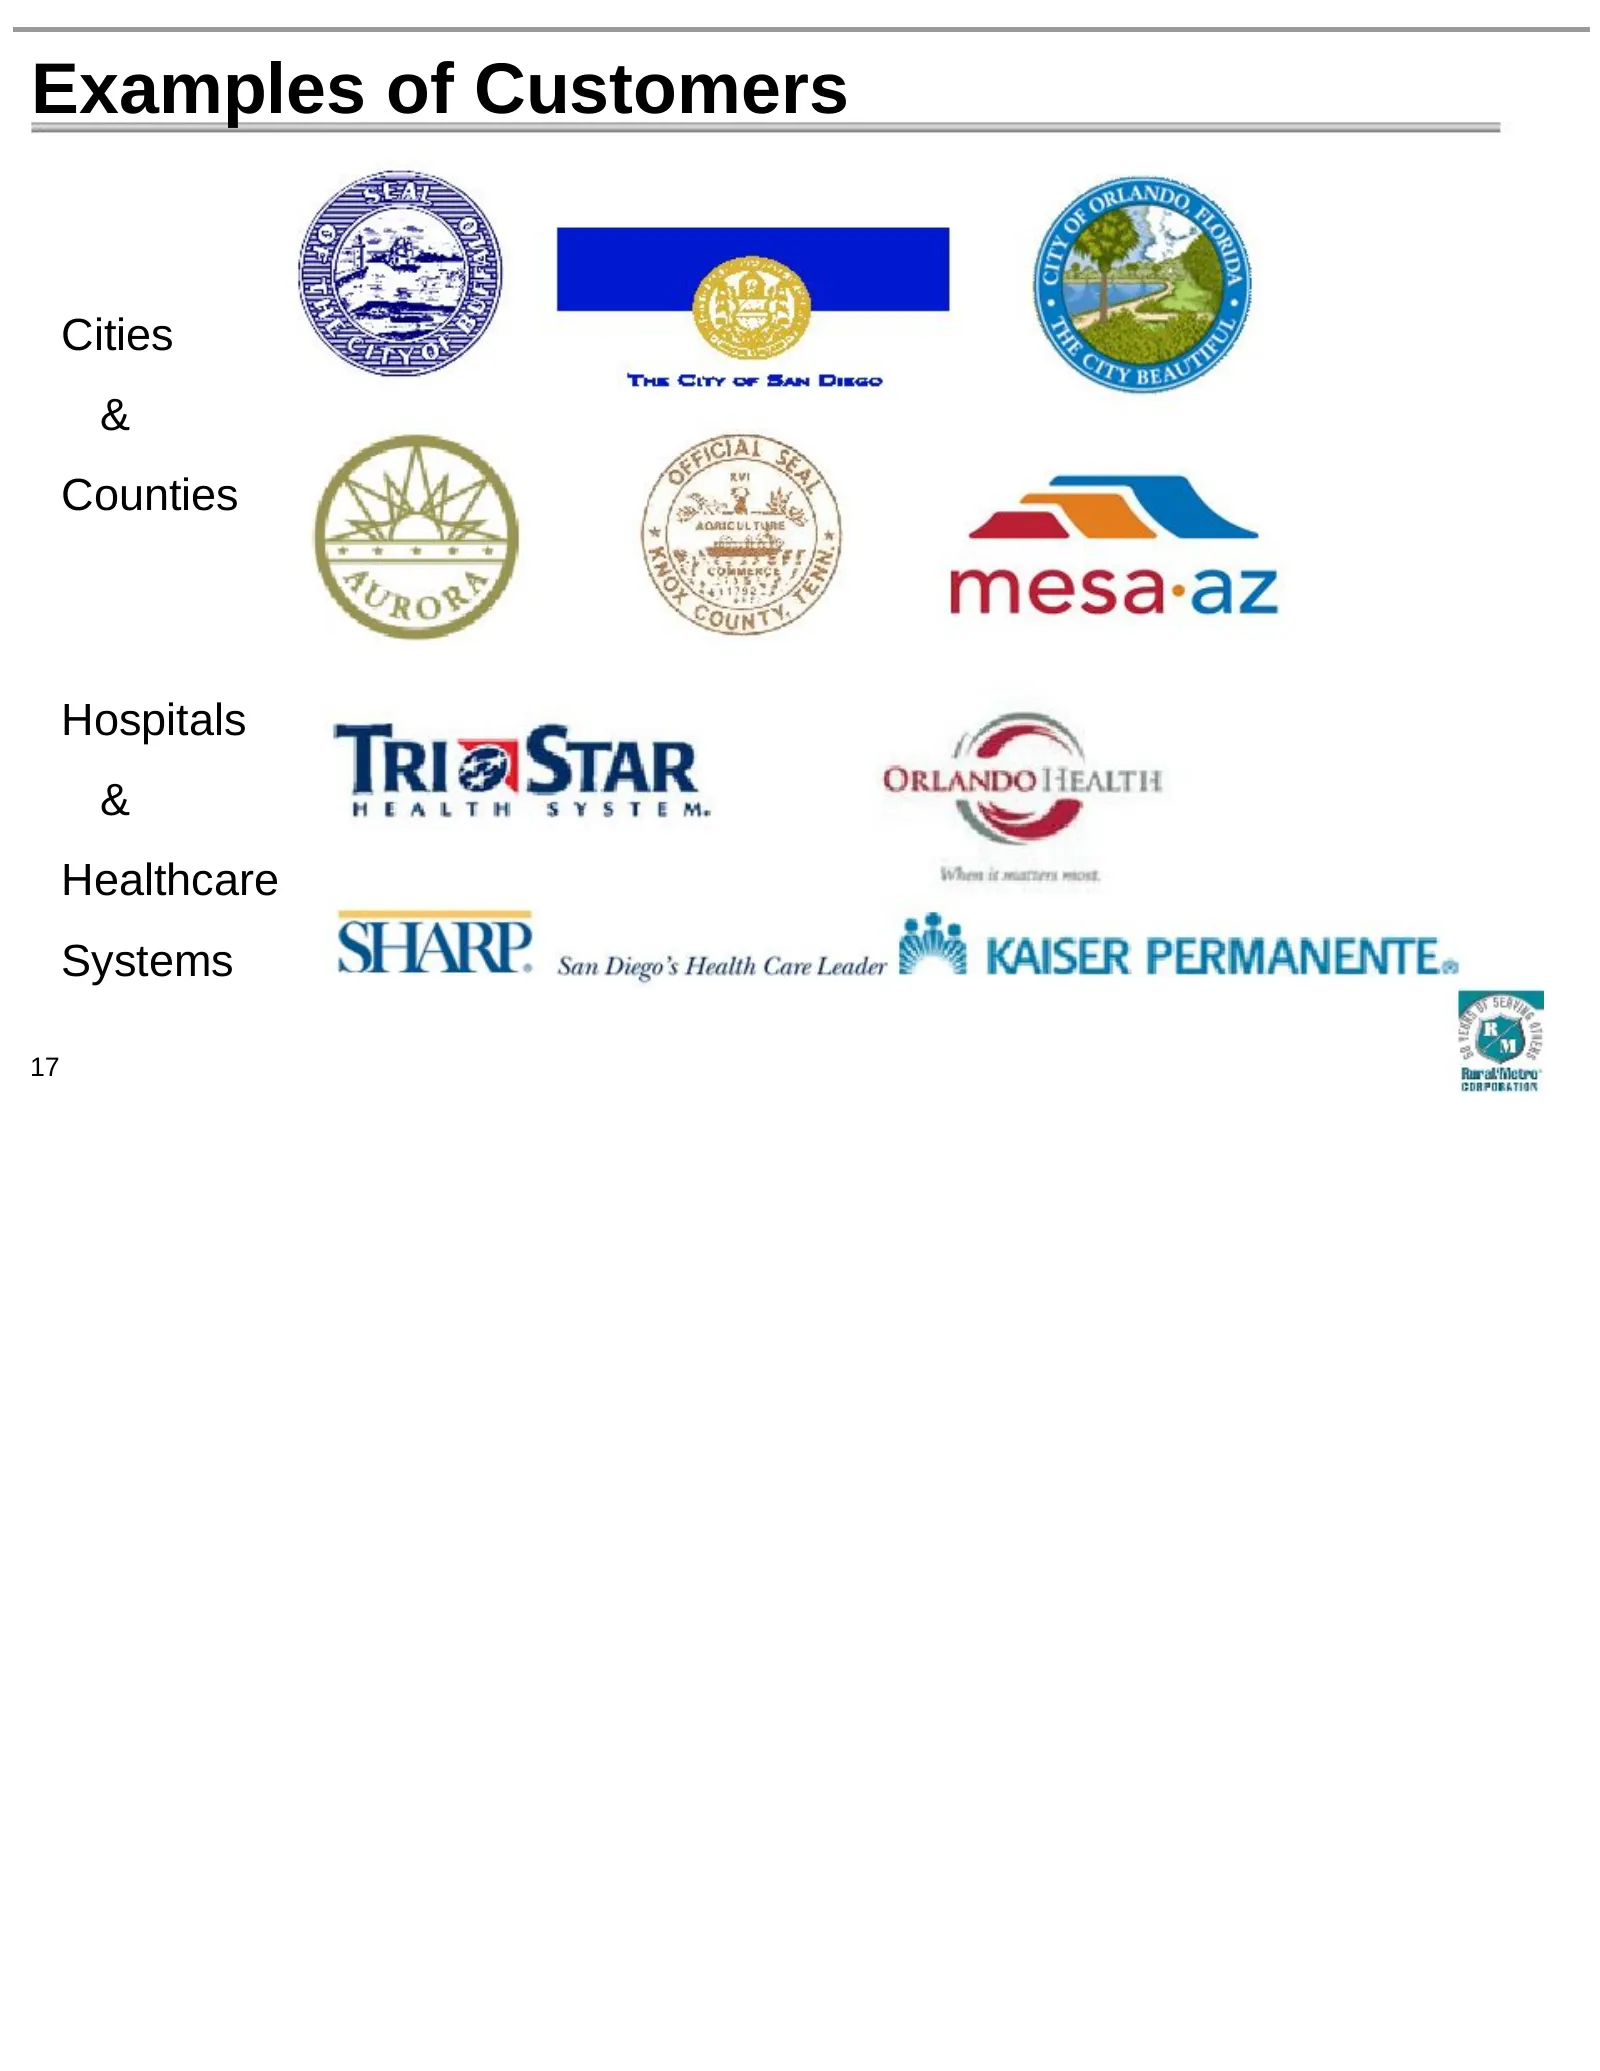
Examples of Customers Cities & Counties Hospitals & Healthcare Systems 17
Slide 18: San Diego Medical Services Enterprise
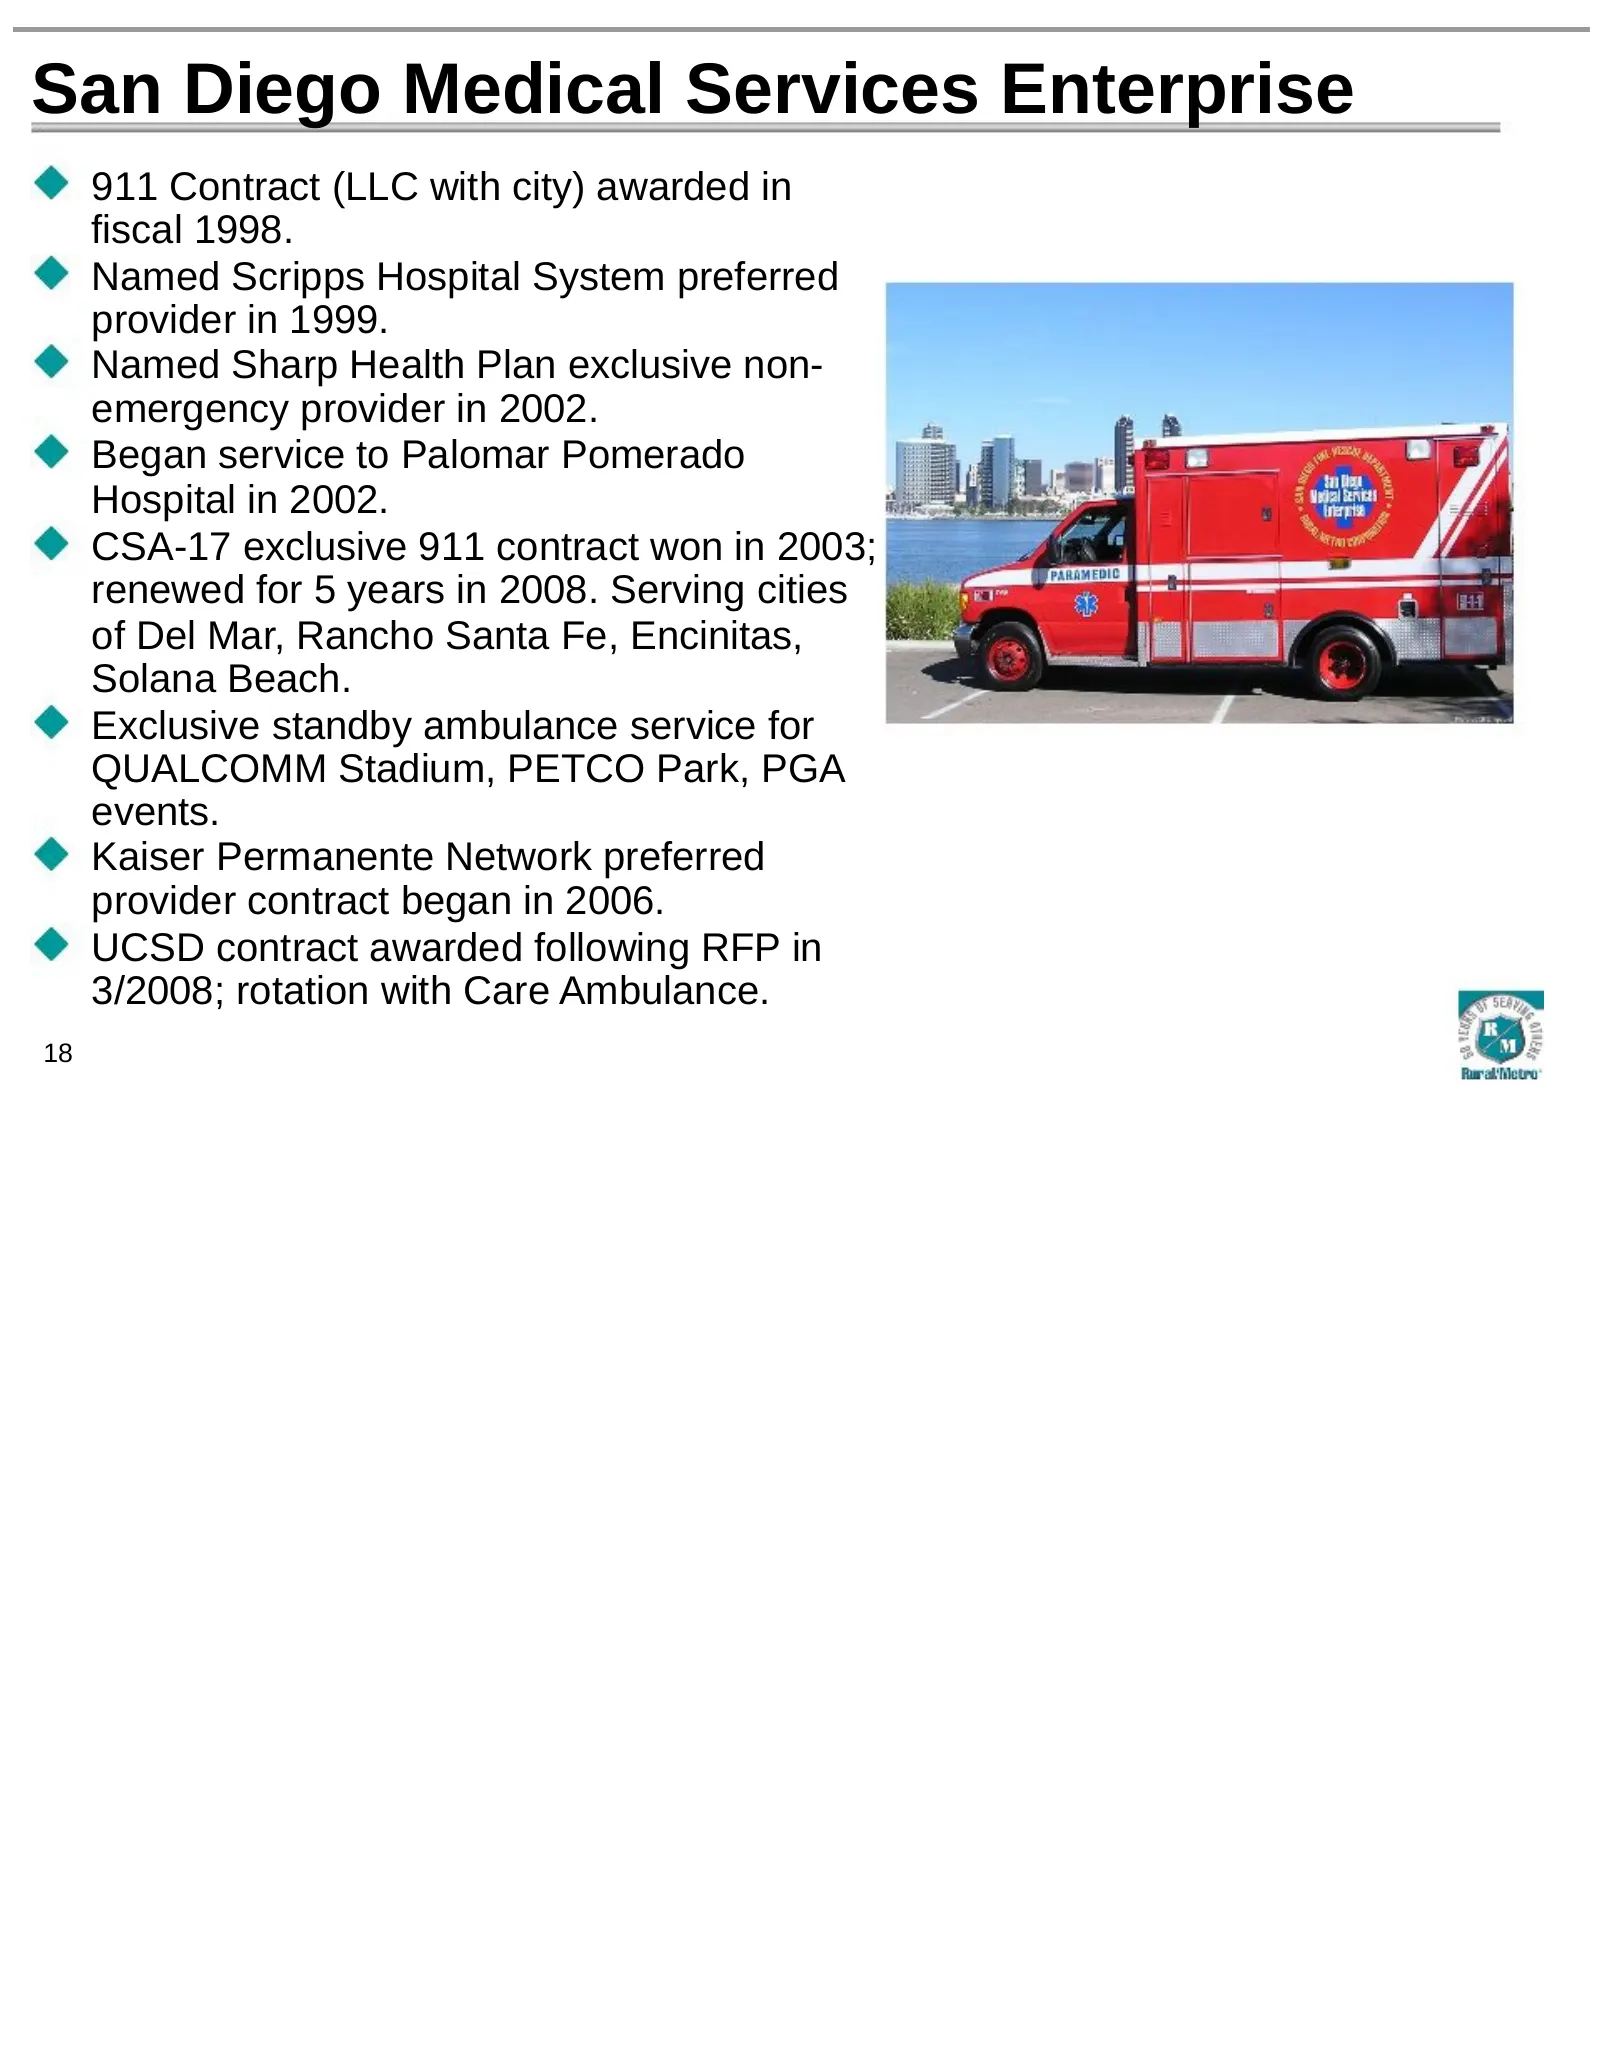
San Diego Medical Services Enterprise 911 Contract (LLC with city) awarded in fiscal 1998. Named Scripps Hospital System preferred provider in 1999. Named Sharp Health Plan exclusive non- emergency provider in 2002. Began service to Palomar Pomerado Hospital in 2002. CSA-17 exclusive 911 contract wo
Slide 19: Strategic Approach to Growth
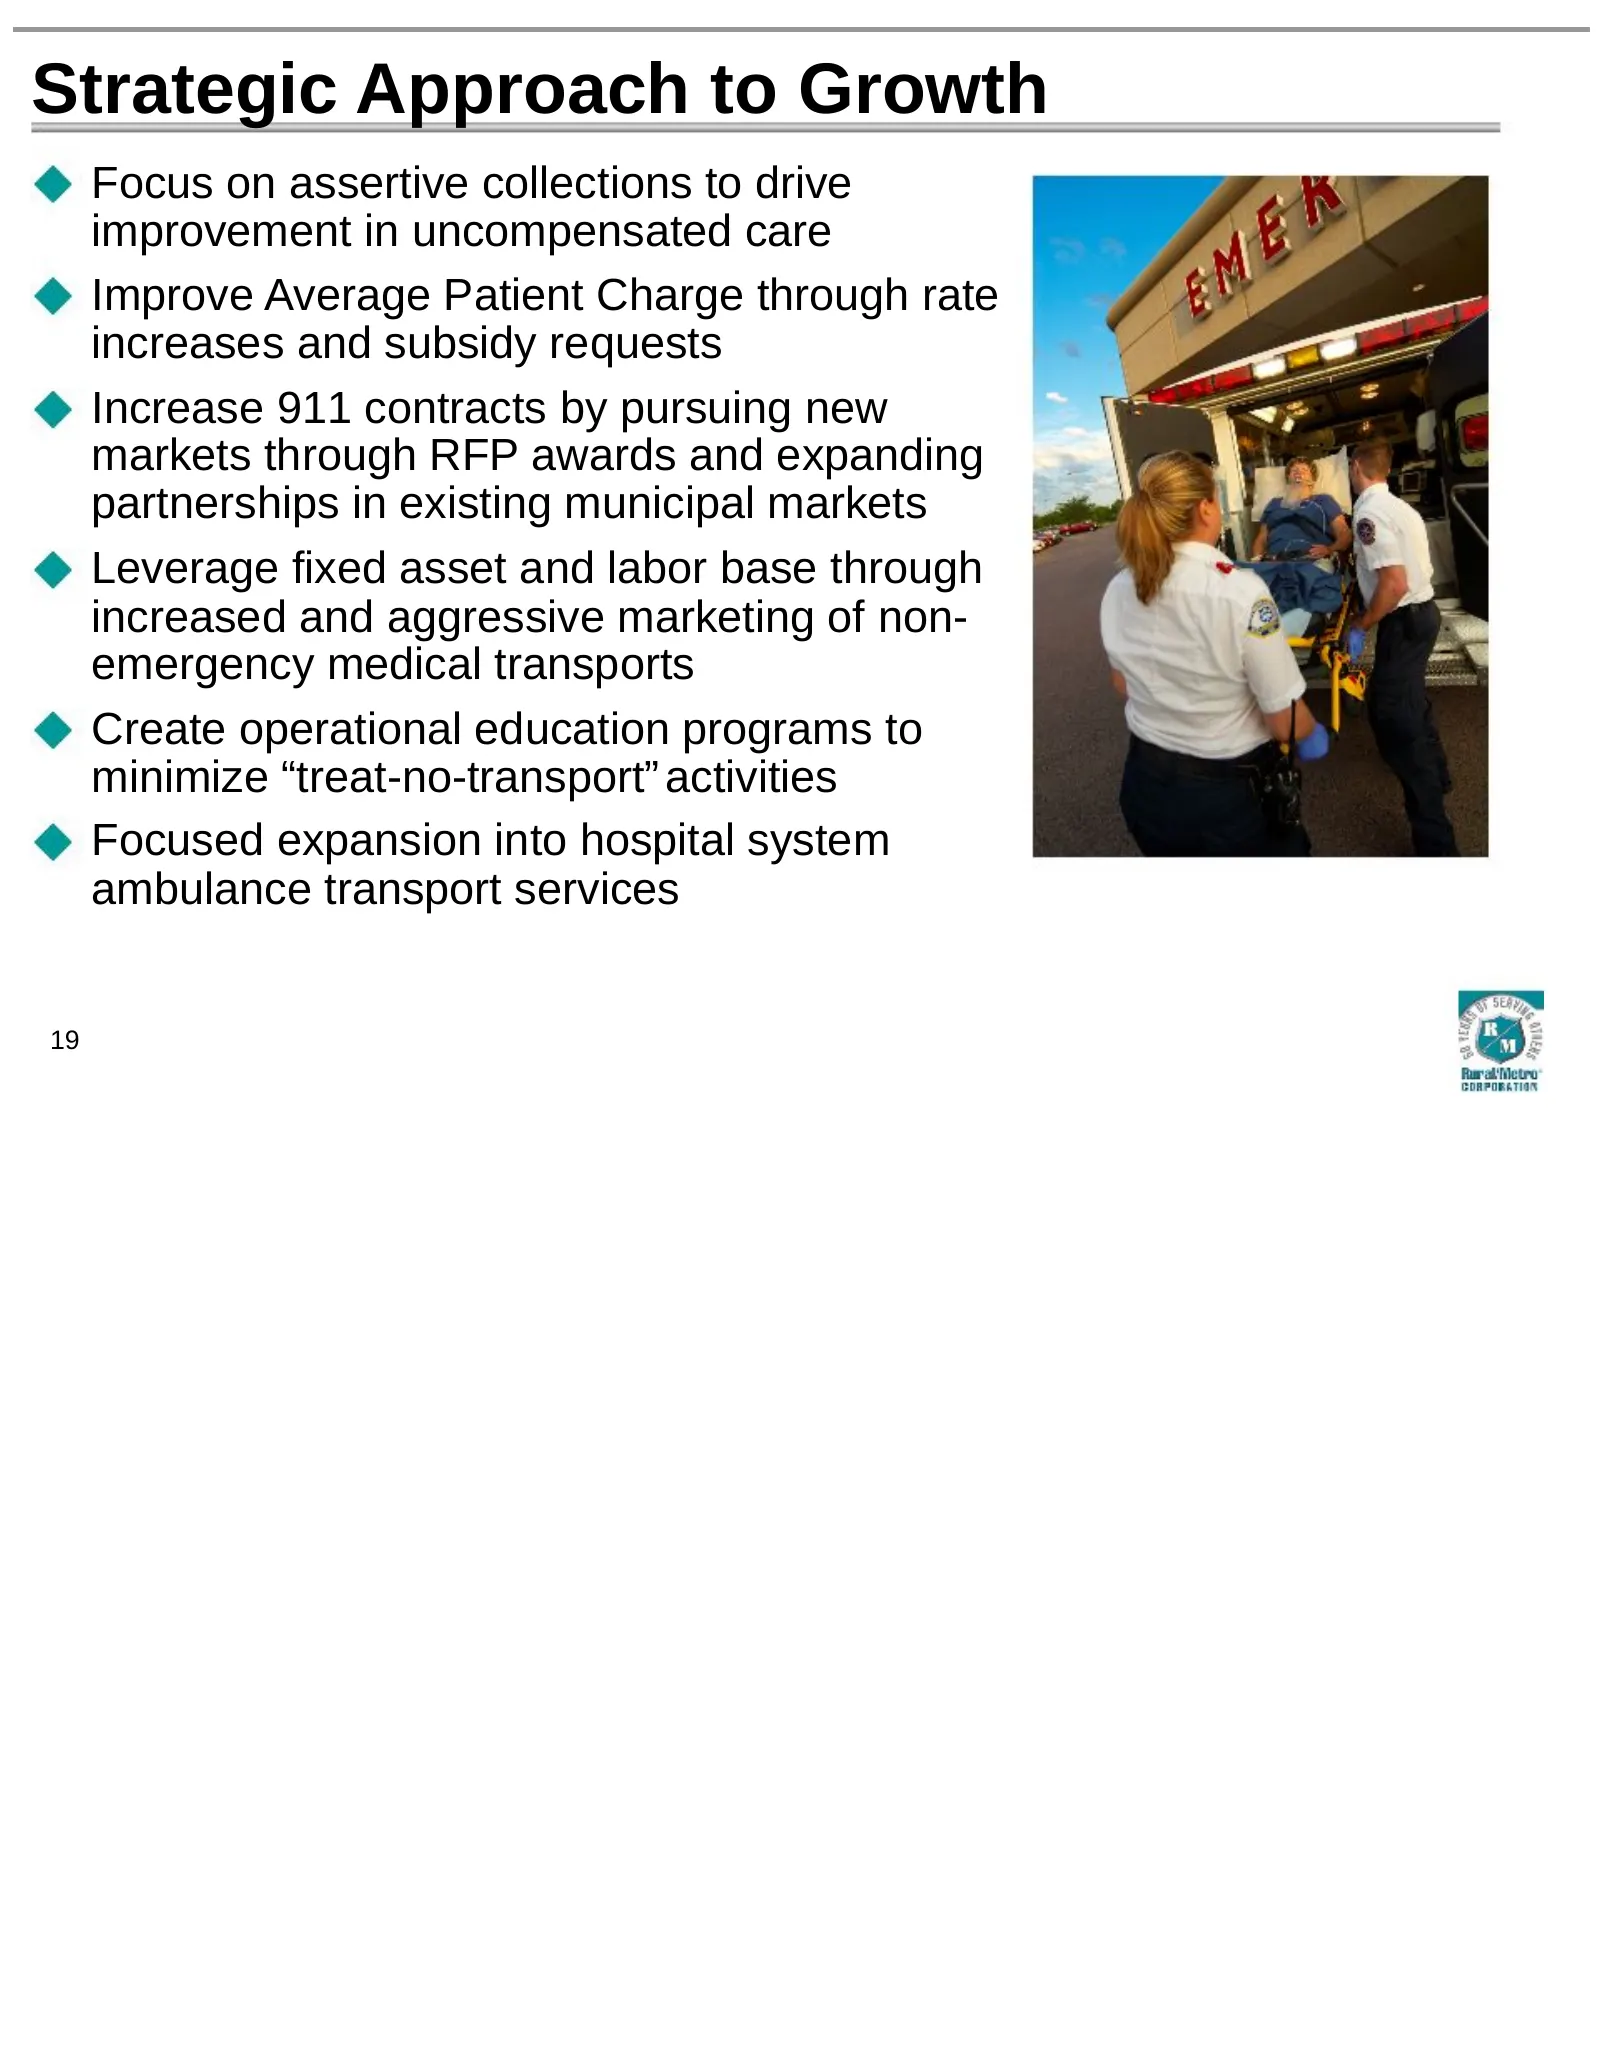
Strategic Approach to Growth Focus on assertive collections to drive improvement in uncompensated care Improve Average Patient Charge through rate increases and subsidy requests Increase 911 contracts by pursuing new markets through RFP awards and expanding partnerships in existing municipal markets
Slide 20: Tactical Approach to Growth
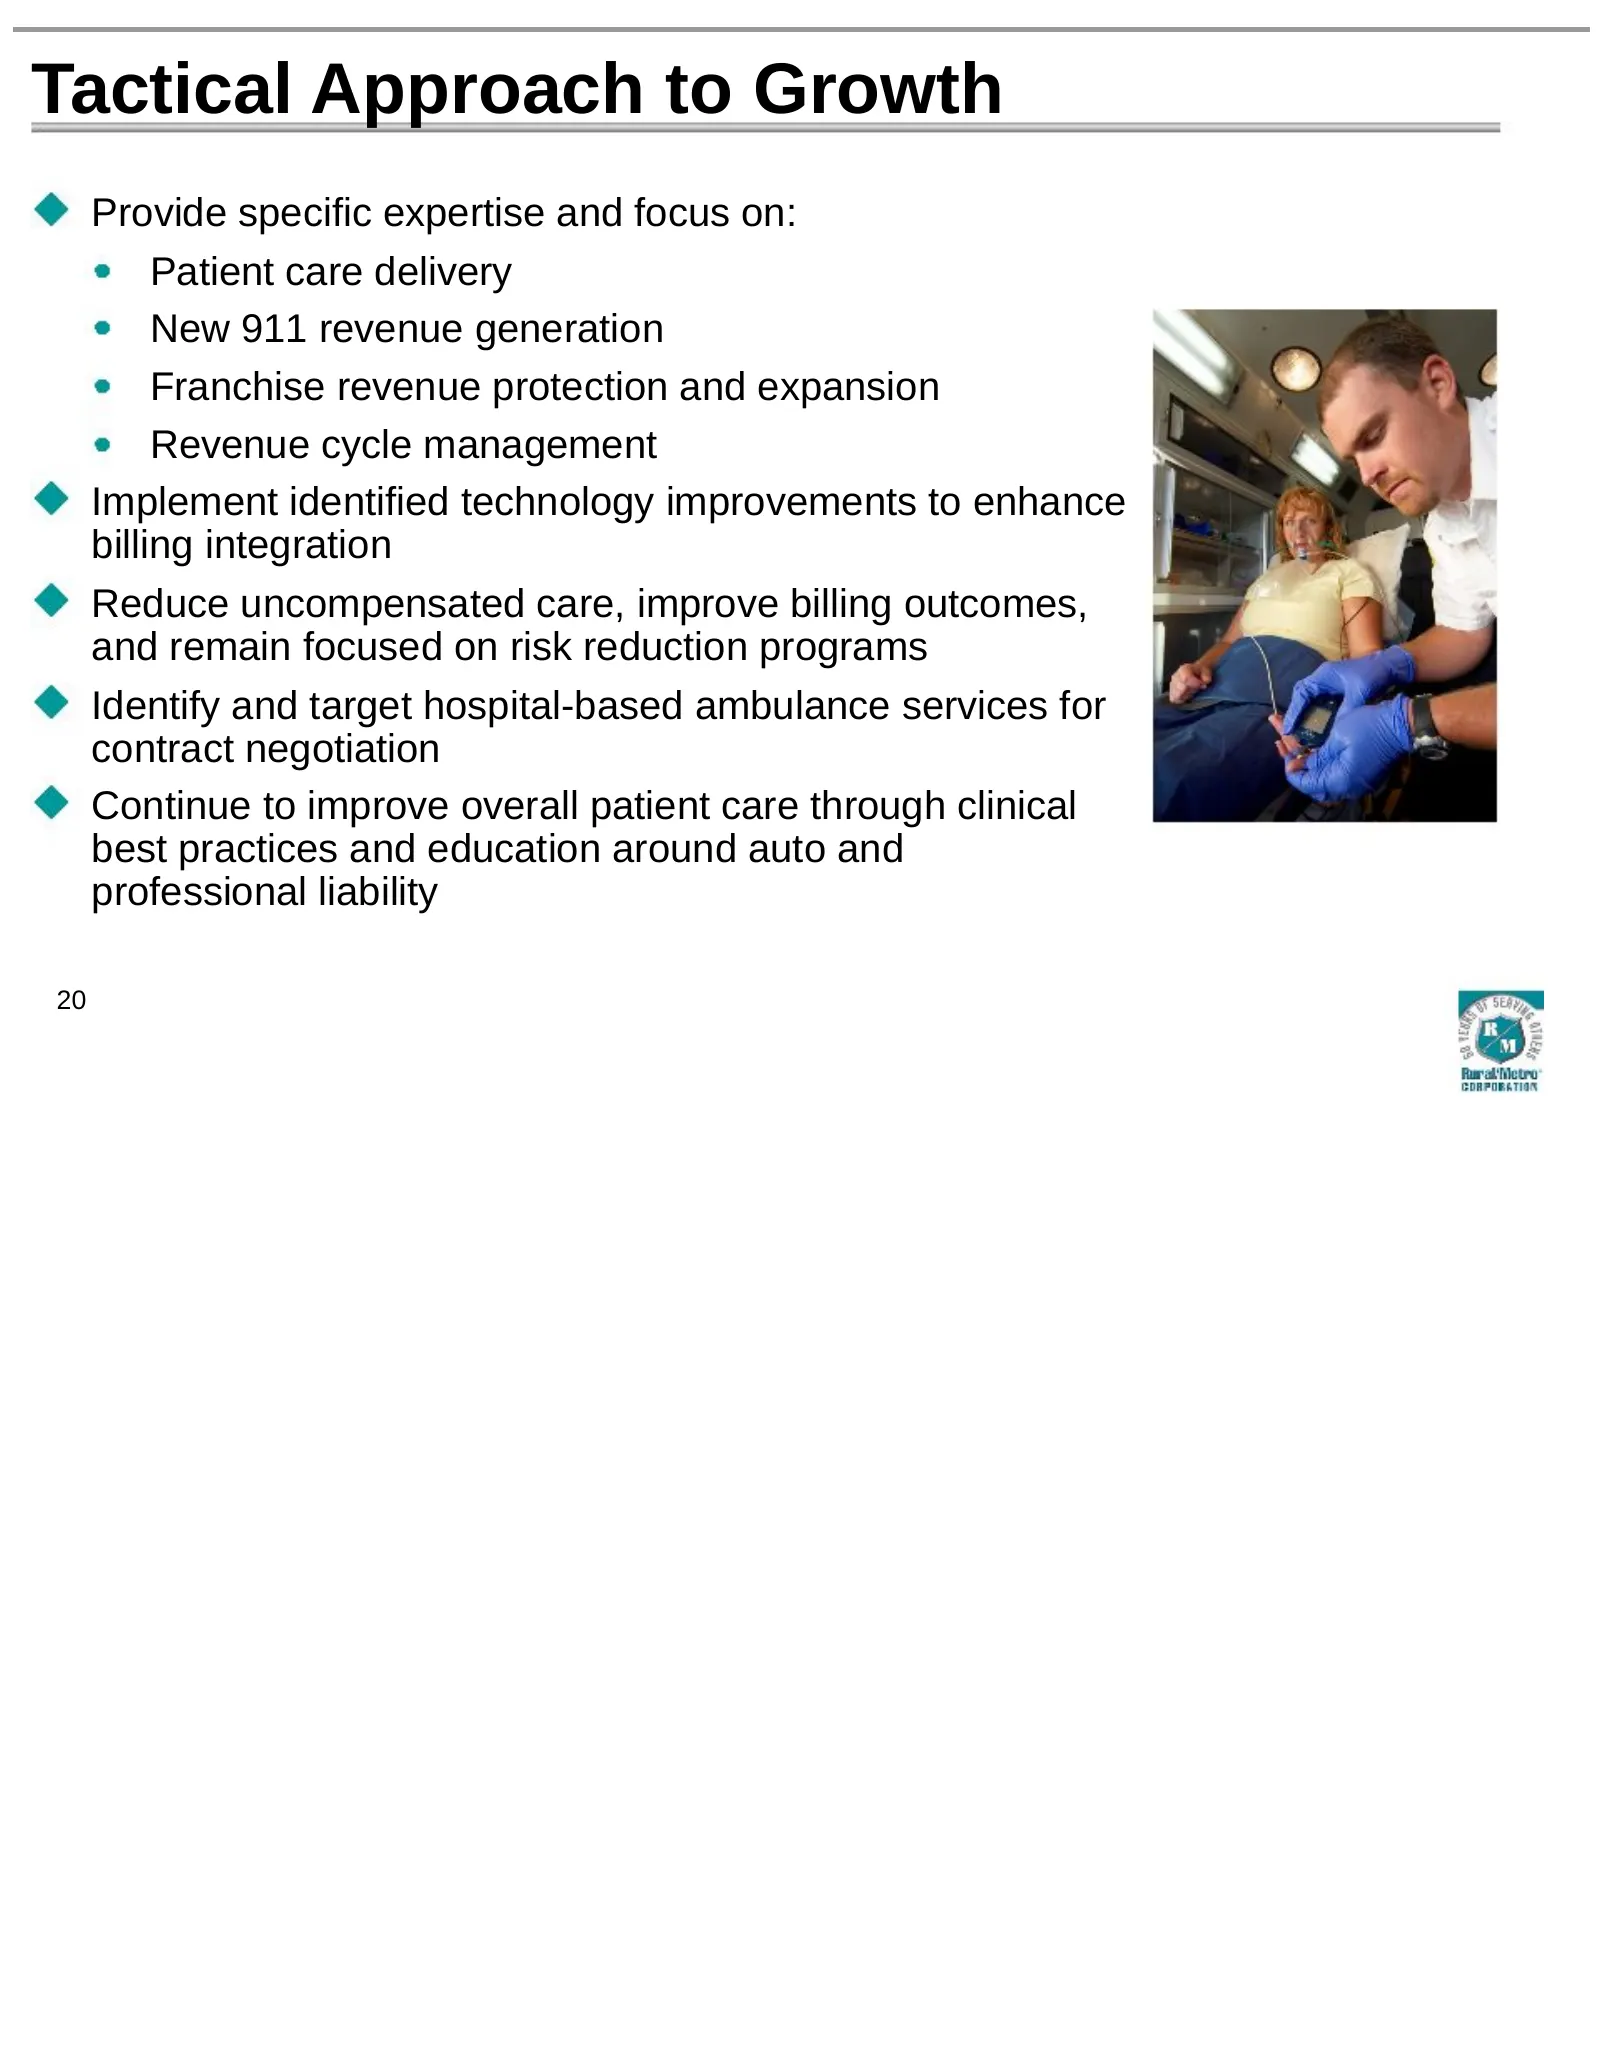
Tactical Approach to Growth Provide specific expertise and focus on: Patient care delivery New 911 revenue generation Franchise revenue protection and expansion Revenue cycle management Implement identified technology improvements to enhance billing integration Reduce uncompensated care, improve bil
Slide 21: Unit Hour Utilization
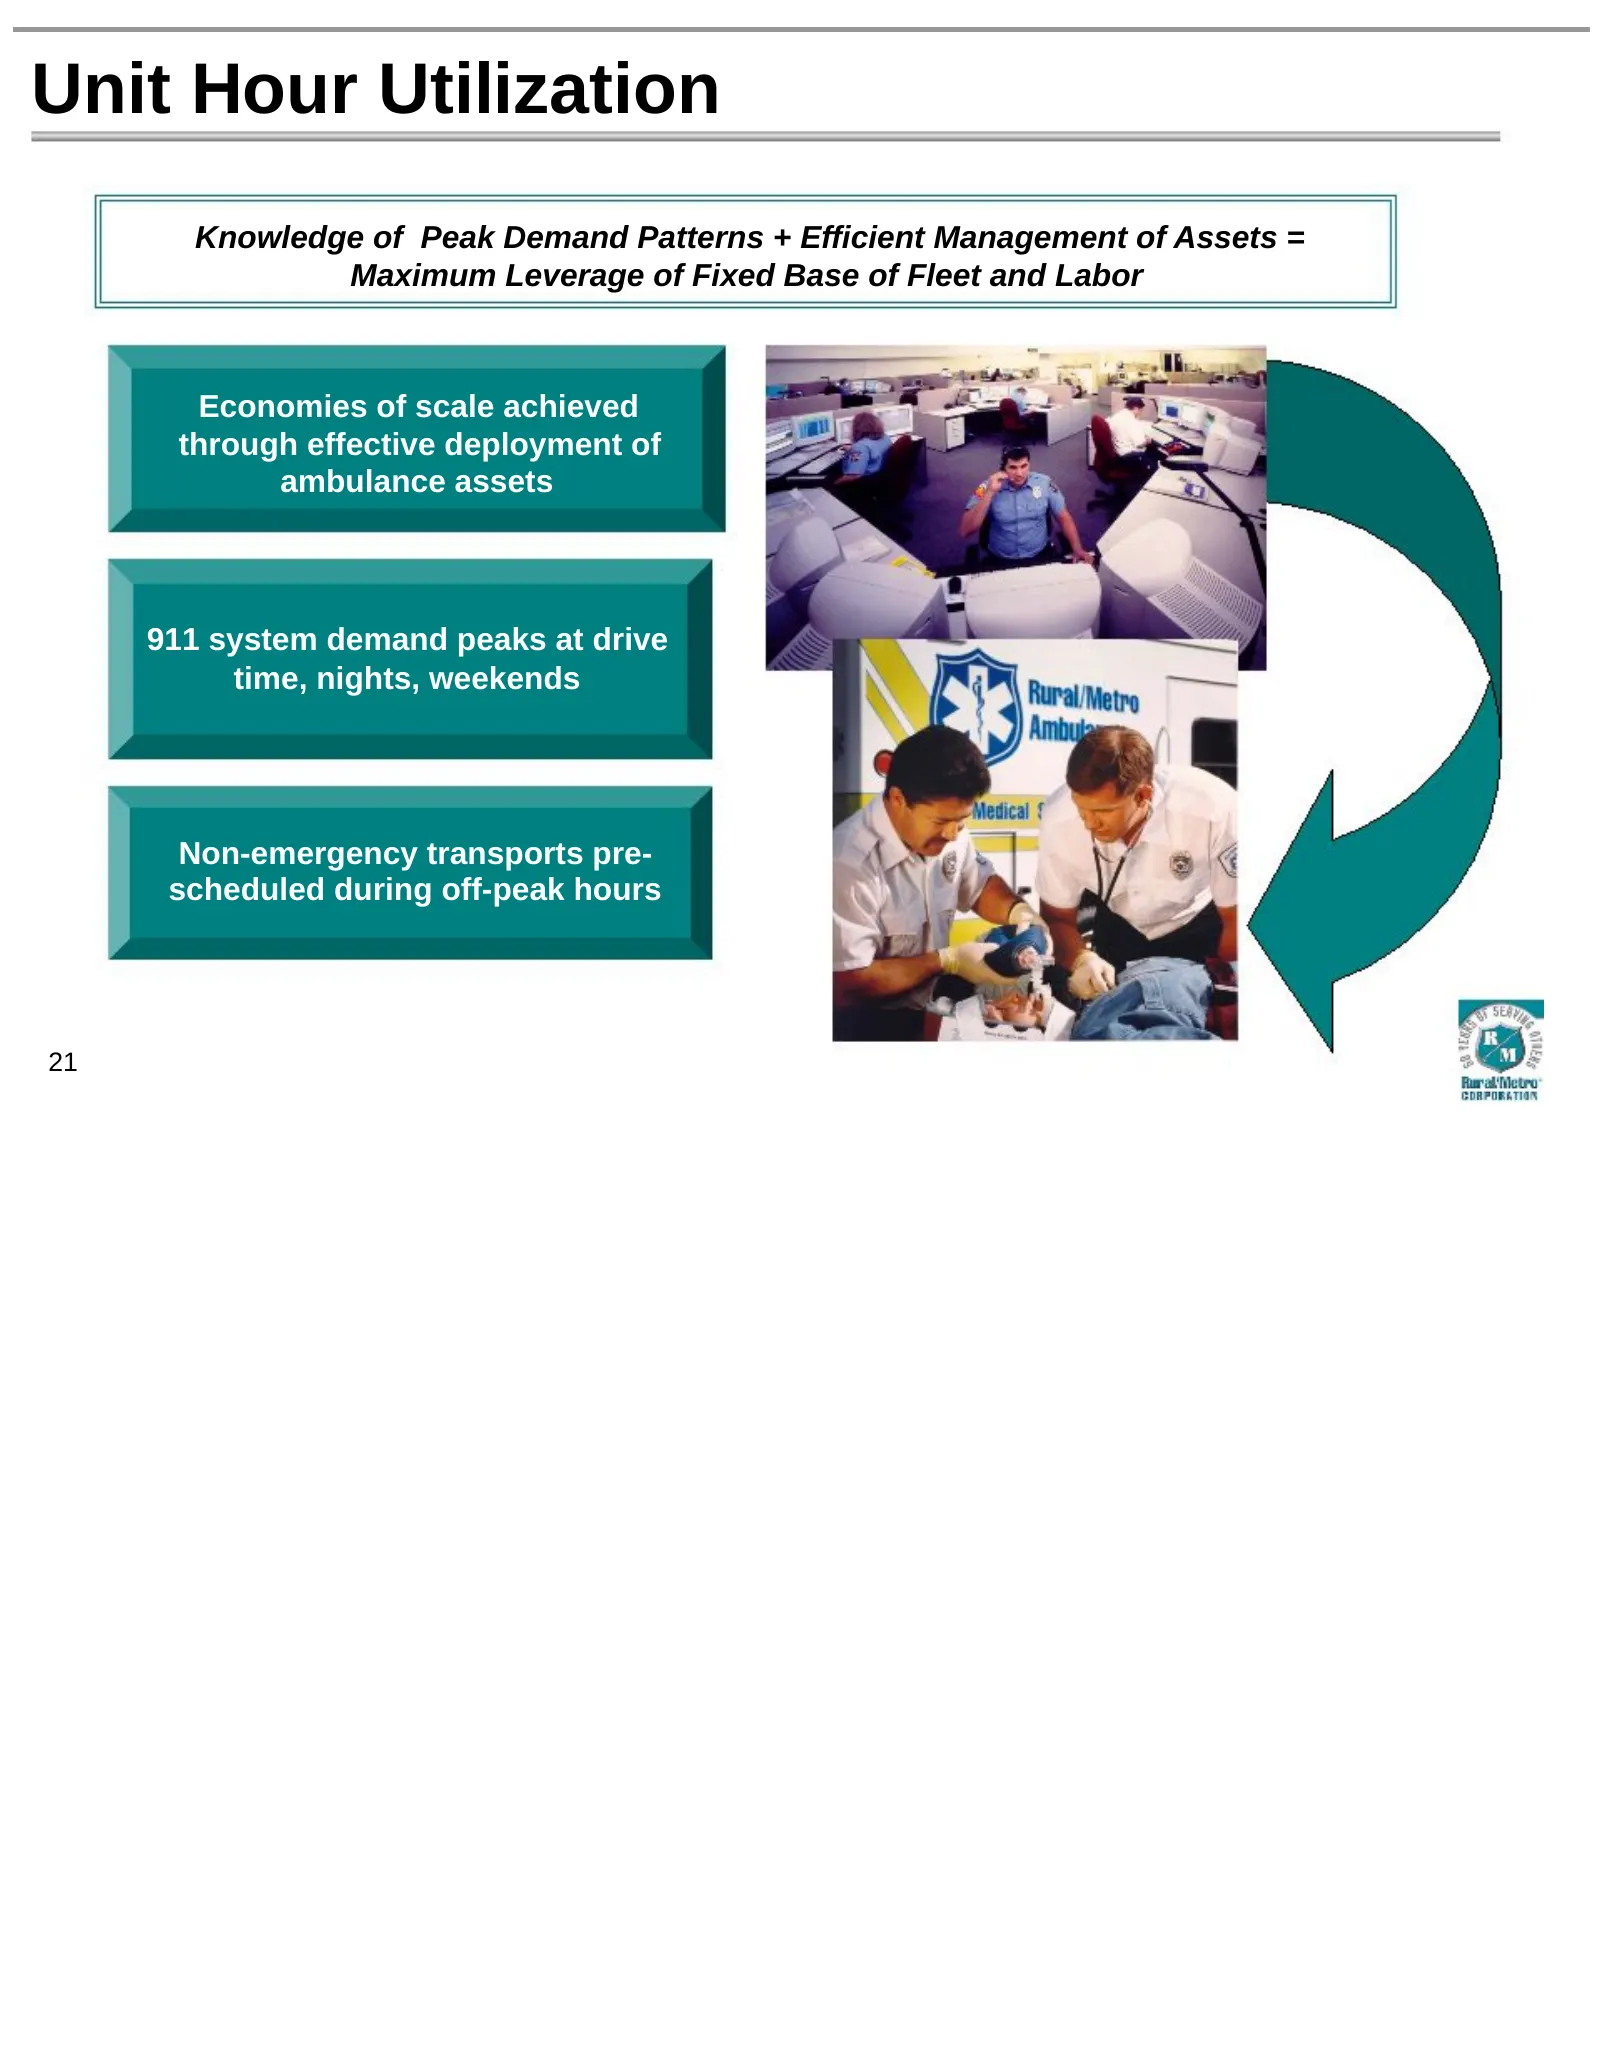
Unit Hour Utilization Knowledge of Peak Demand Patterns + Efficient Management of Assets = Maximum Leverage of Fixed Base of Fleet and Labor Economies of scale achieved through effective deployment of ambulance assets 911 system demand peaks at drive time, nights, weekends Non-emergency transports p
Slide 22: Emergency (911) Contract Process
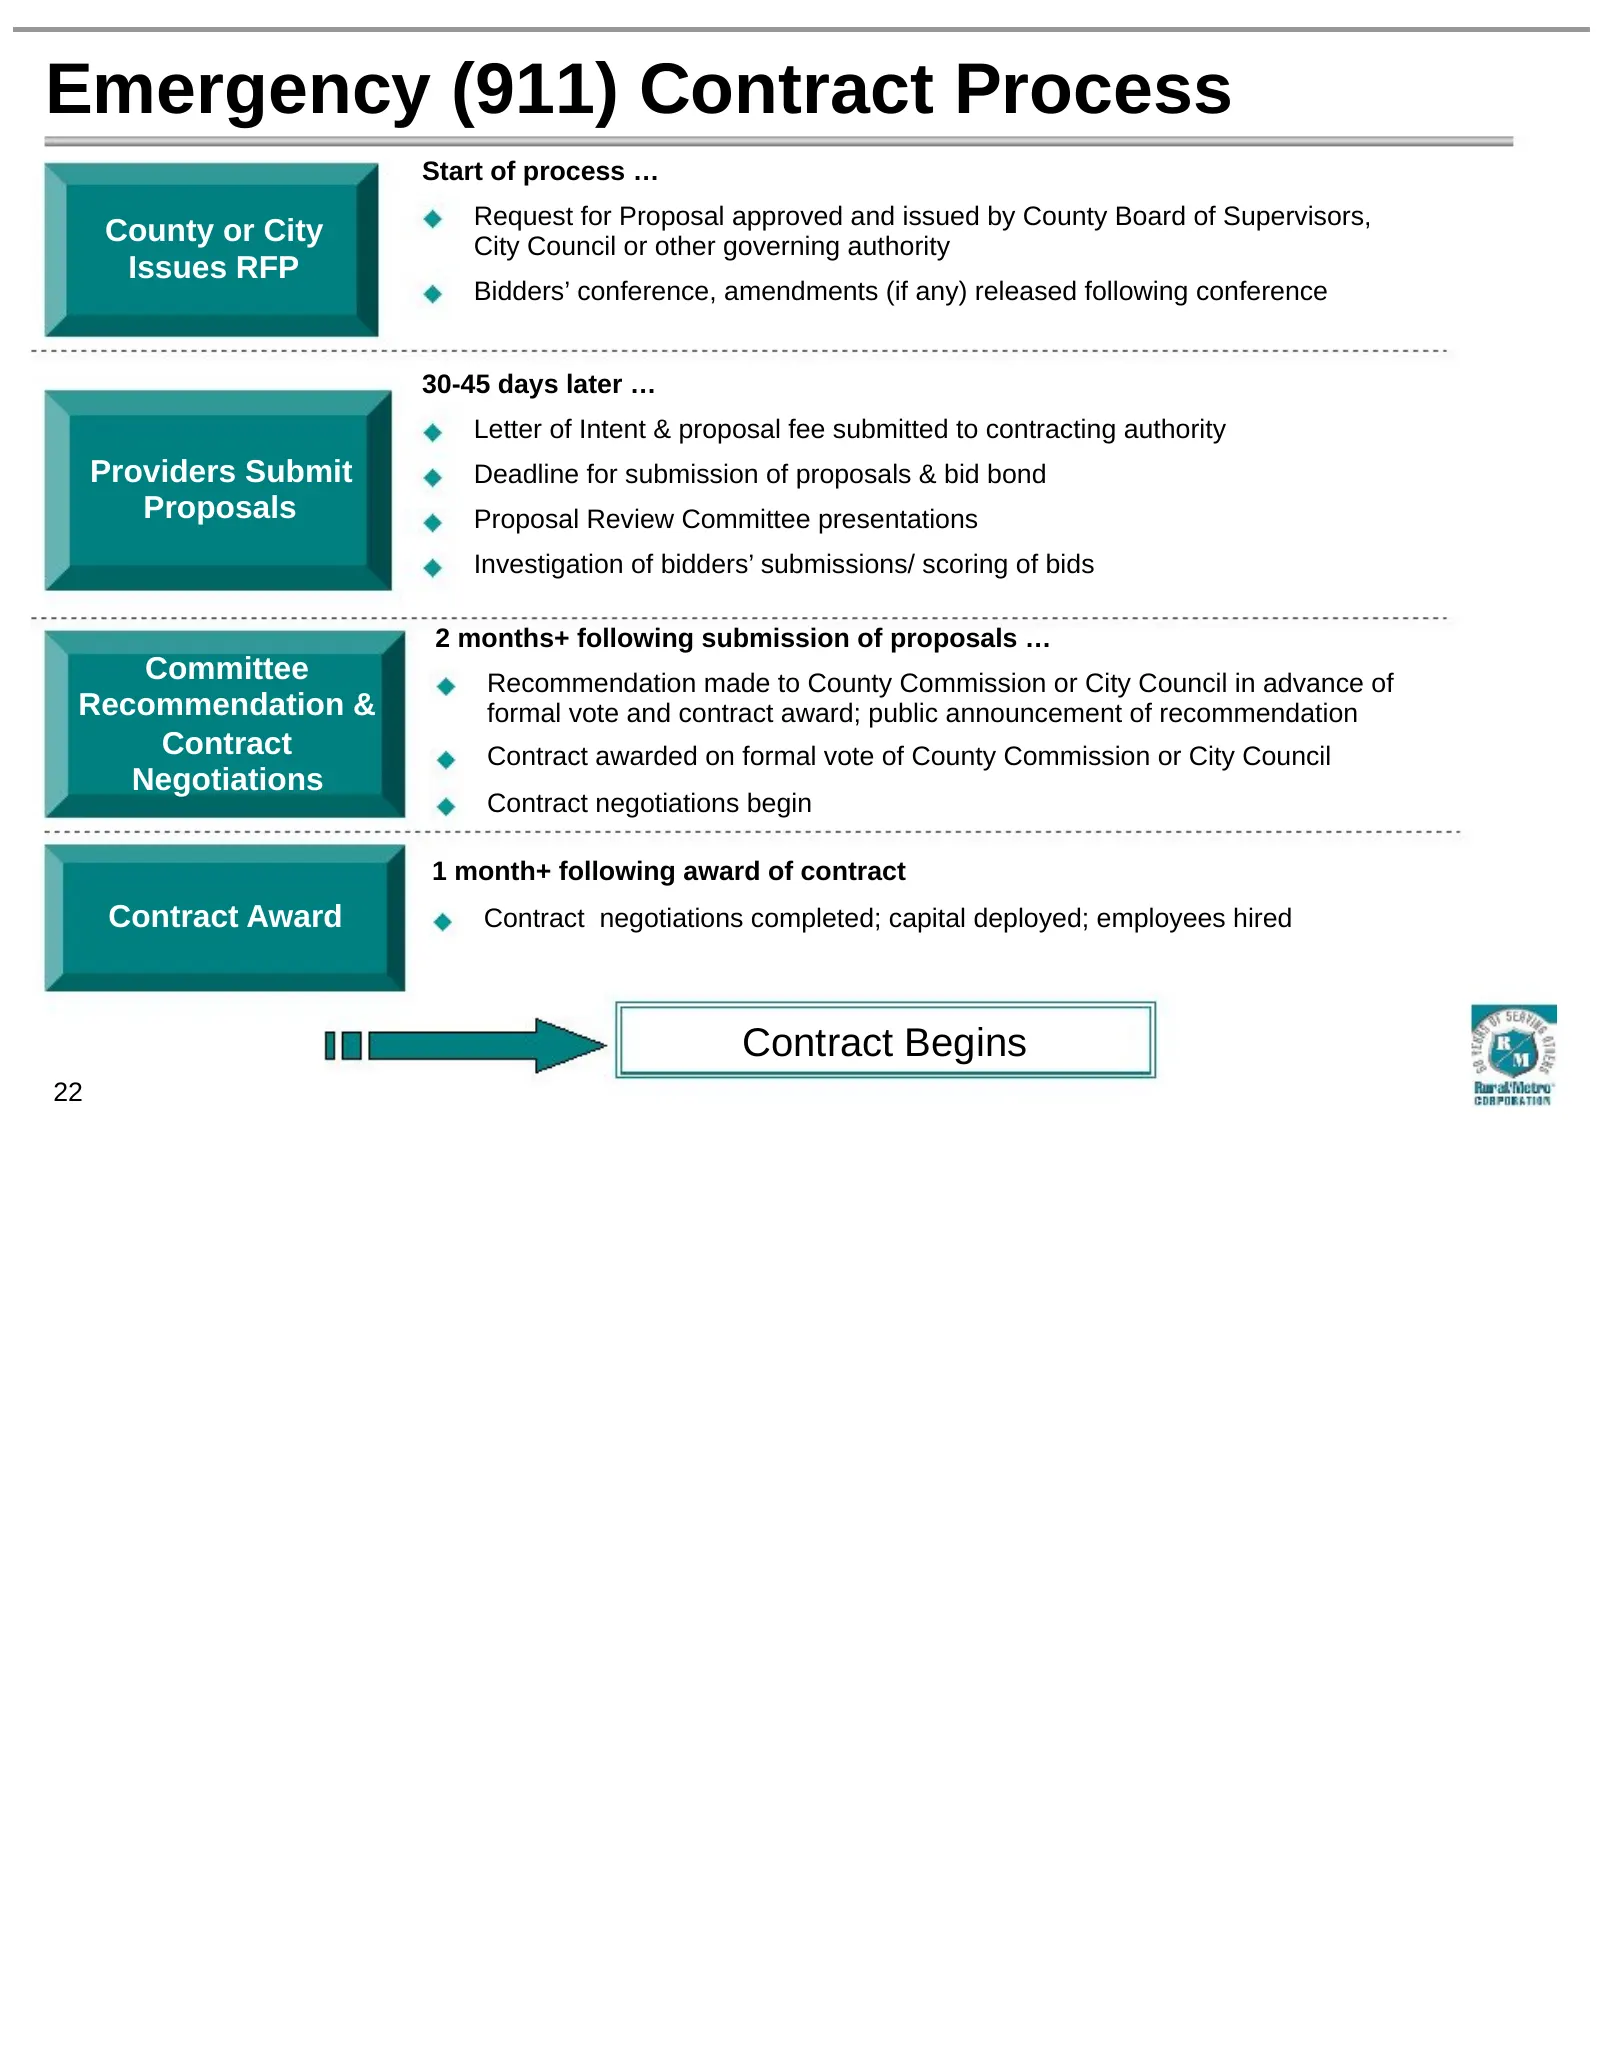
Emergency (911) Contract Process Start of process … Request for Proposal approved and issued by County Board of Supervisors, County or City City Council or other governing authority Issues RFP Bidders’ conference, amendments (if any) released following conference 30-45 days later … Letter of Intent
Slide 23: Non-Emergency Contract Process
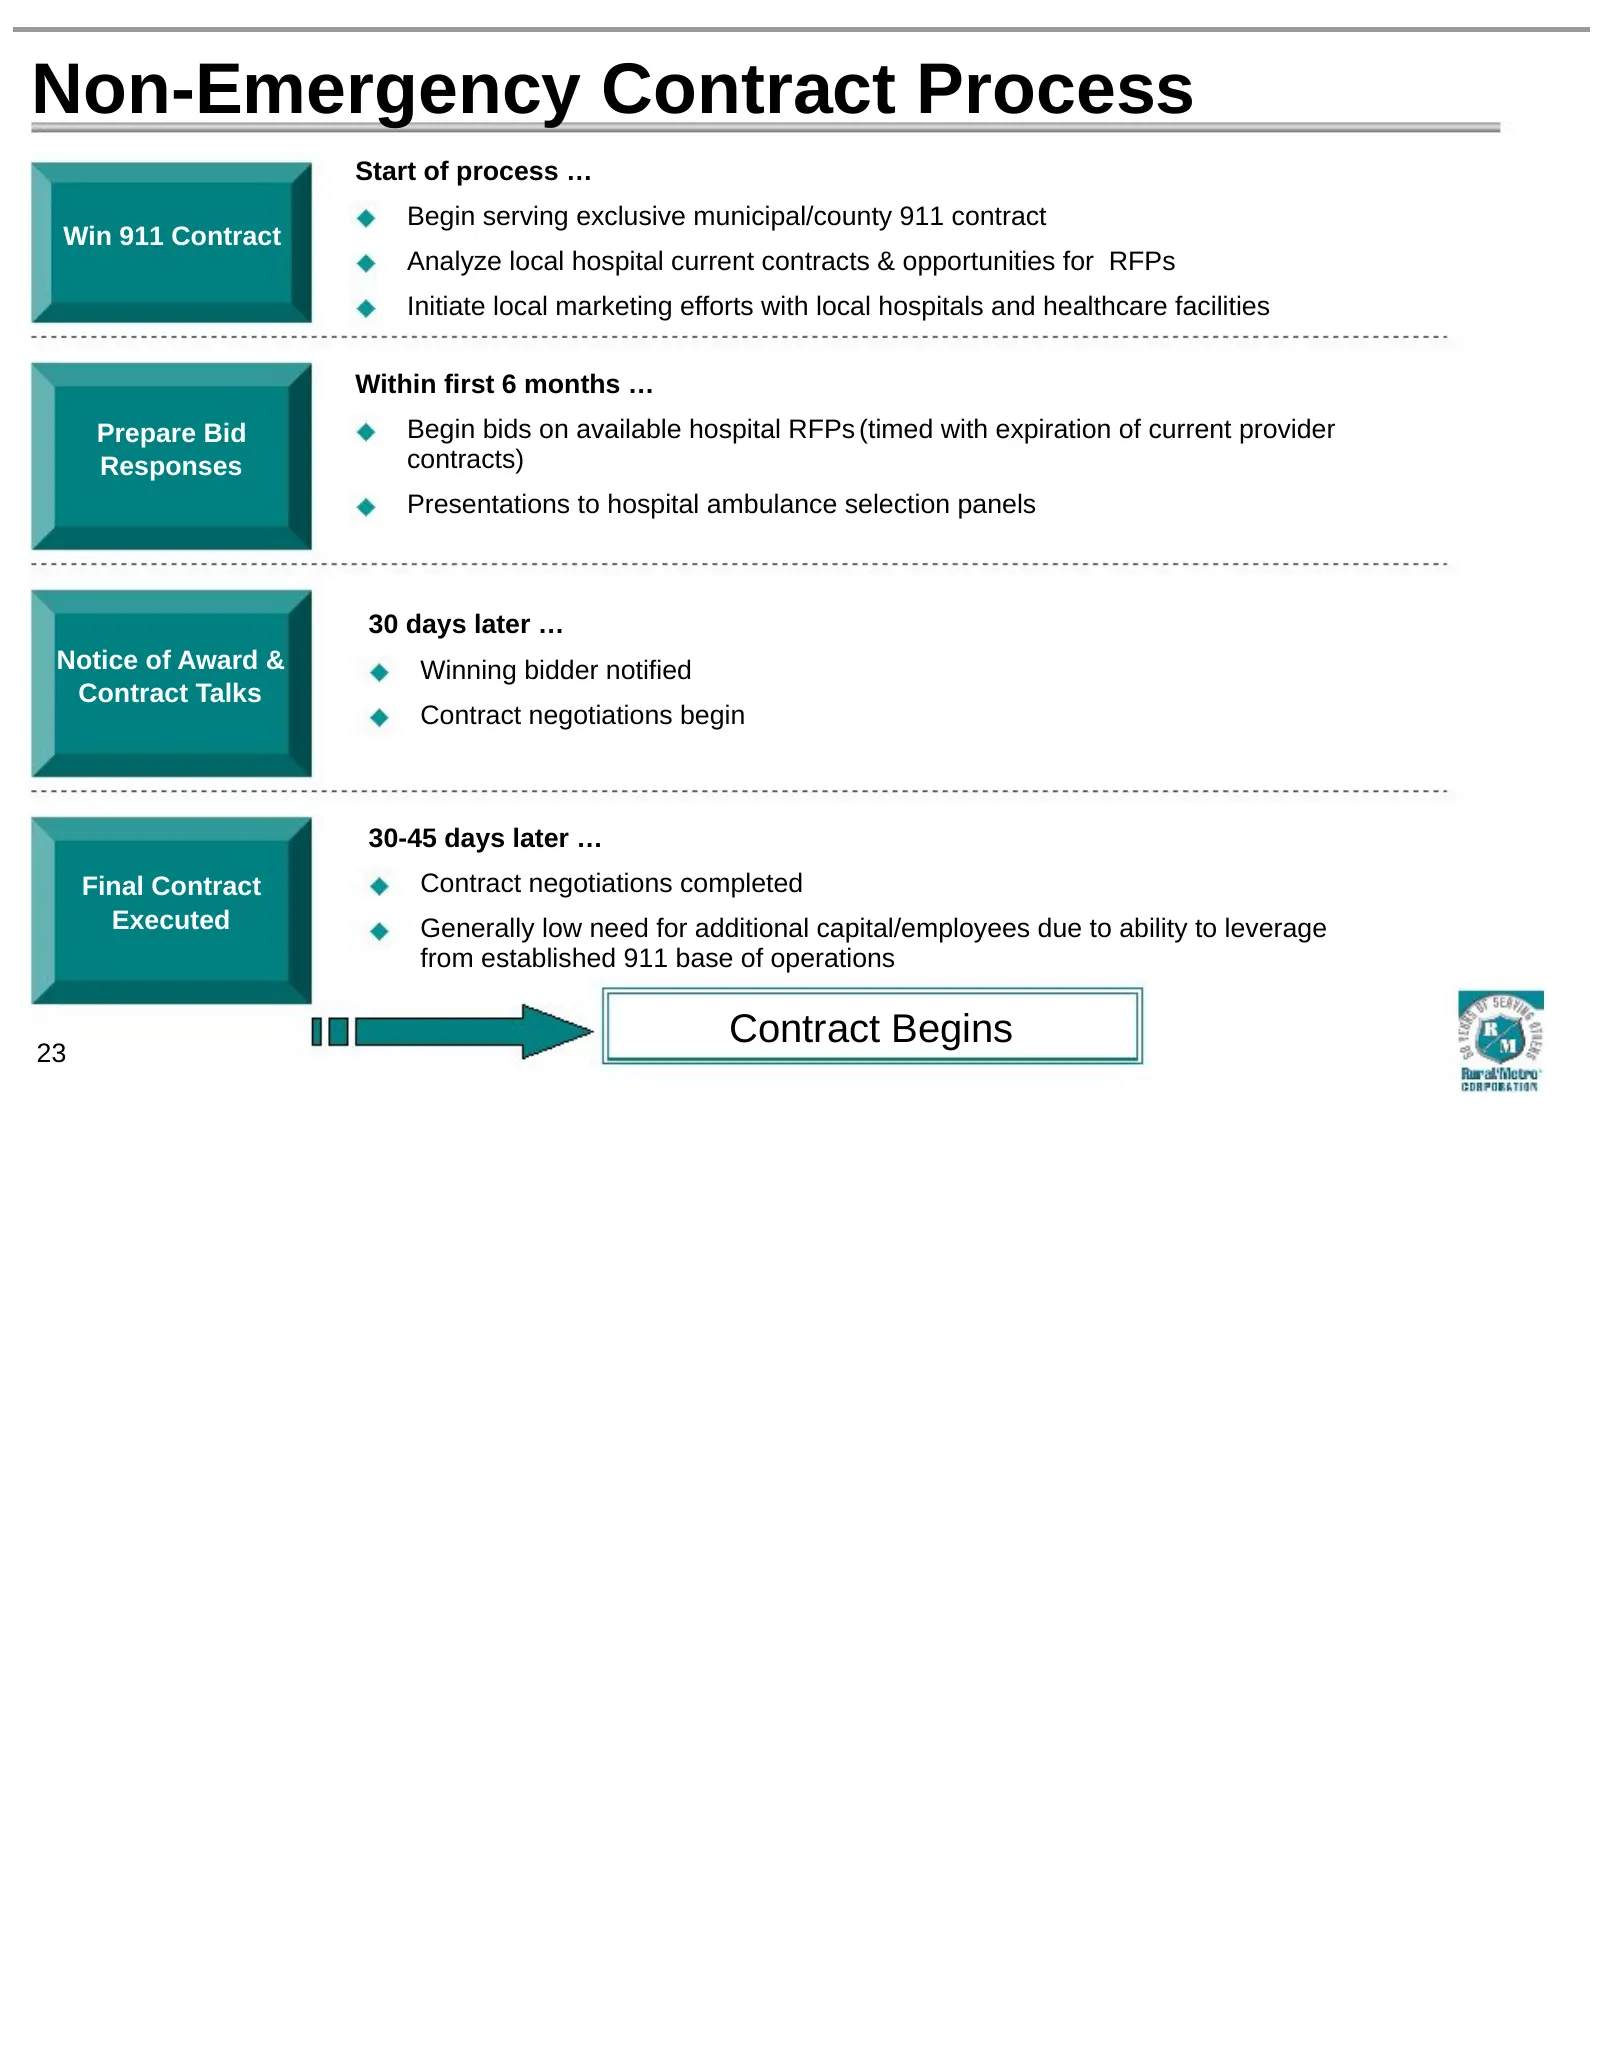
Non-Emergency Contract Process Start of process … Begin serving exclusive municipal/county 911 contract Win 911 Contract Analyze local hospital current contracts & opportunities for RFPs Initiate local marketing efforts with local hospitals and healthcare facilities Within first 6 months … Prepare B
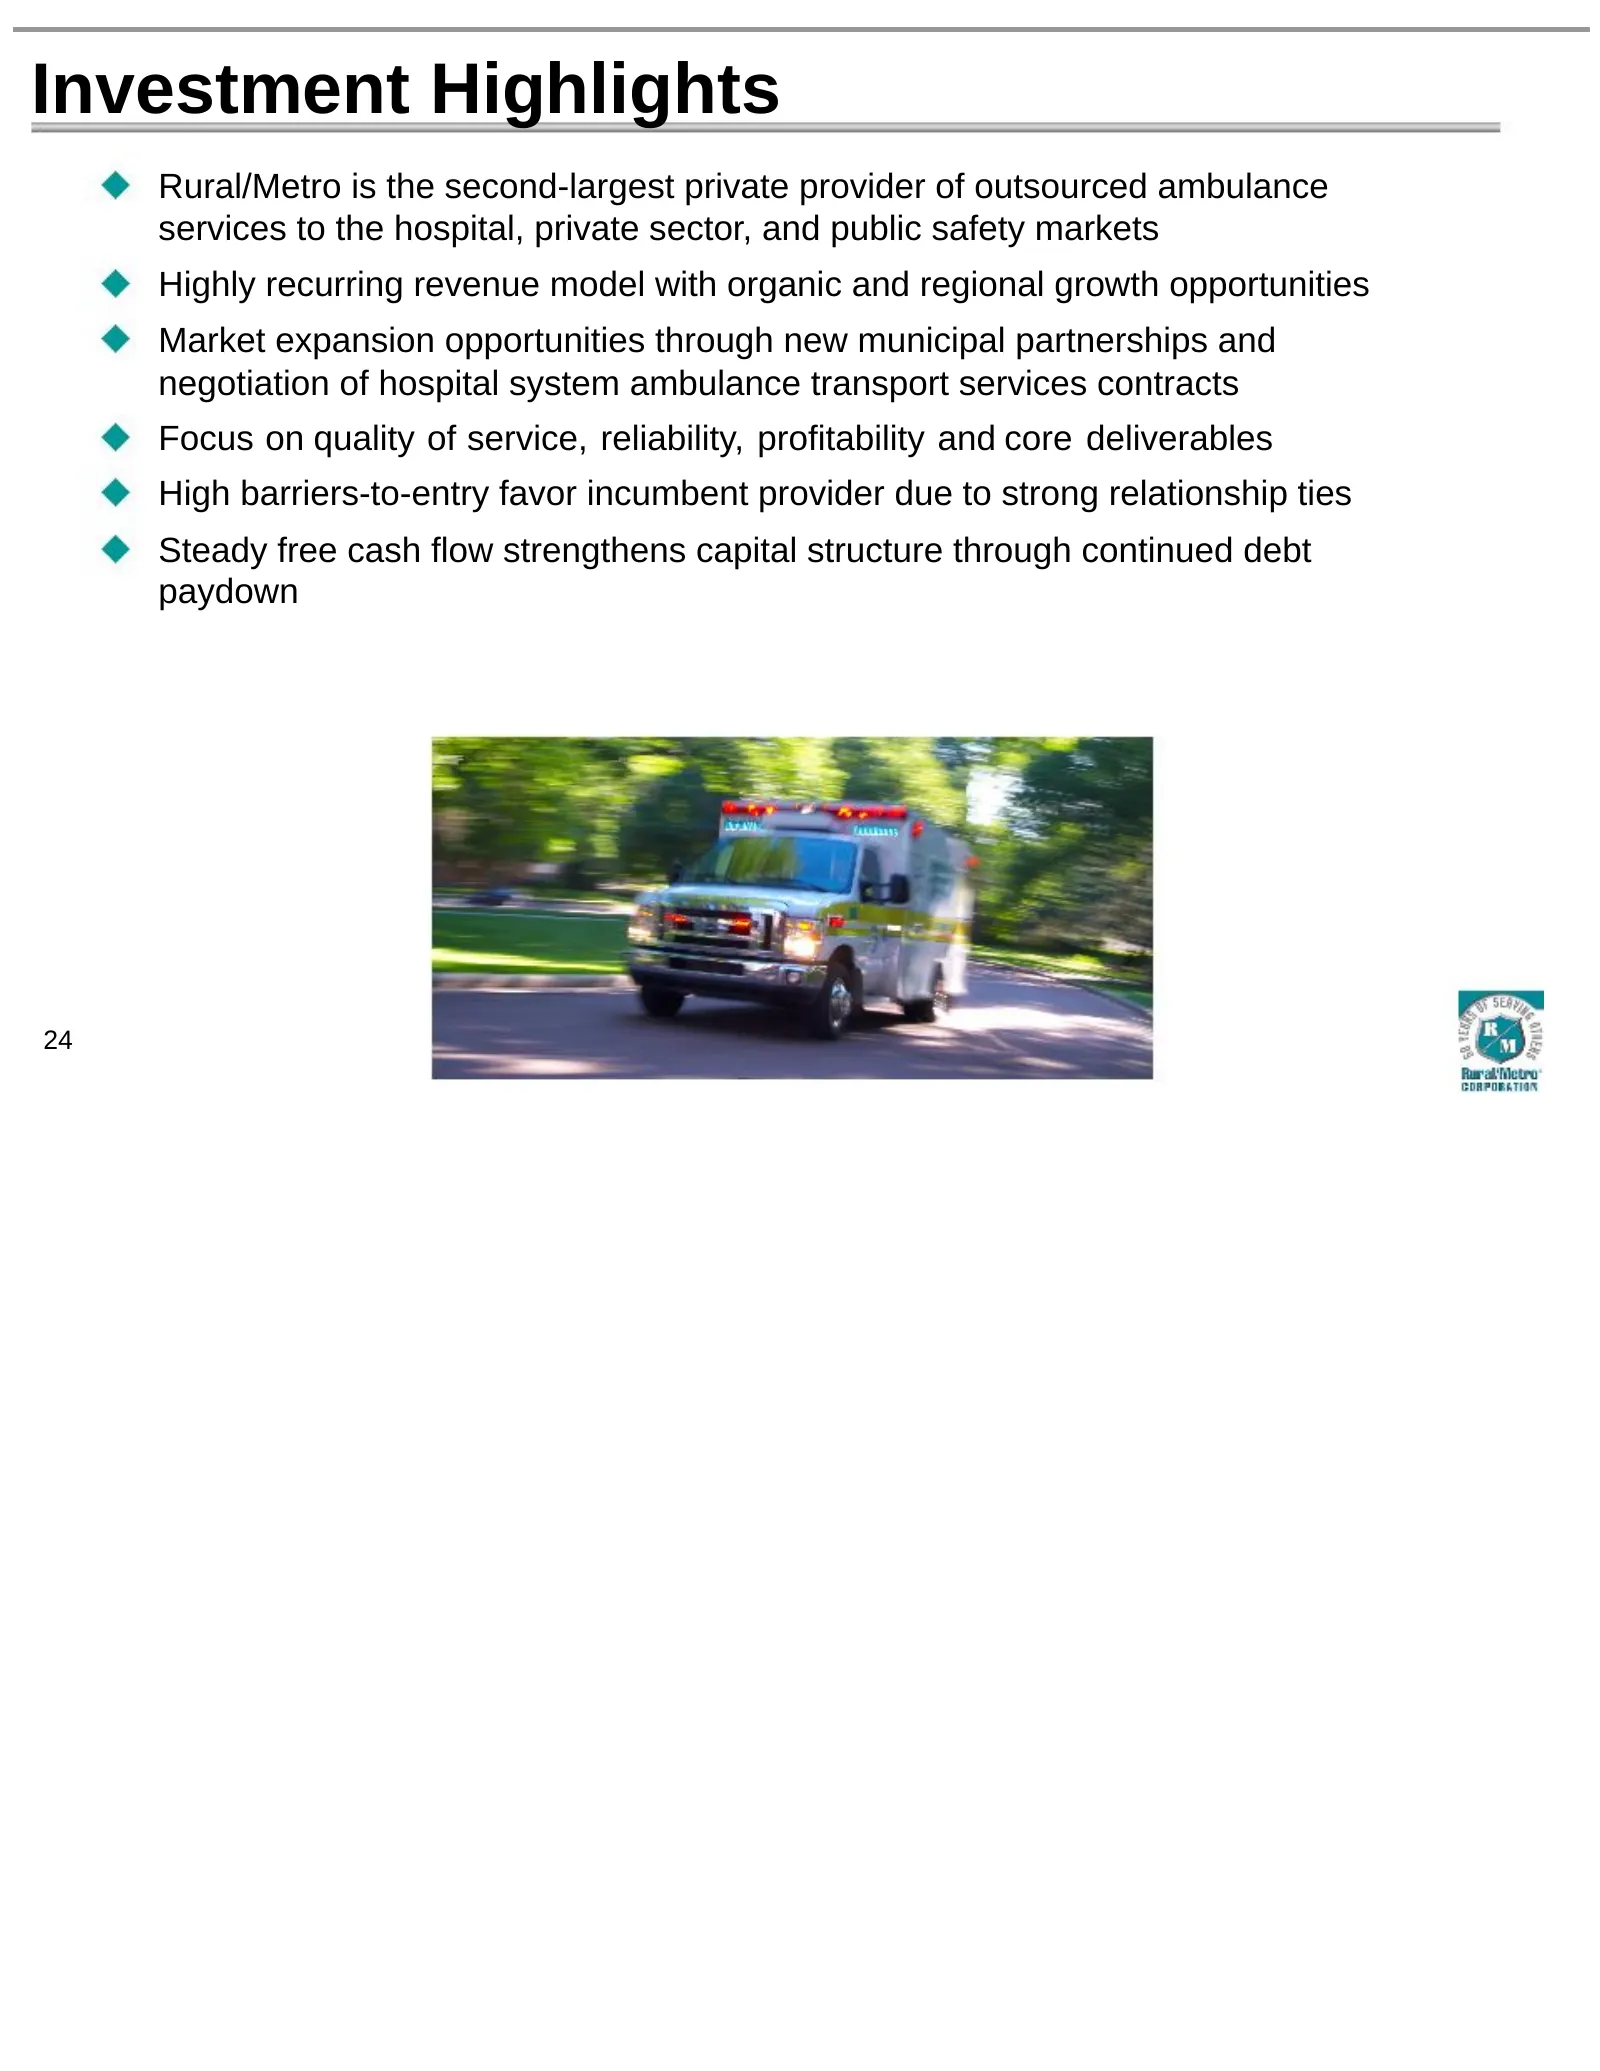
Slide 24: Investment Highlights
Investment Highlights Rural/Metro is the second-largest private provider of outsourced ambulance services to the hospital, private sector, and public safety markets Highly recurring revenue model with organic and regional growth opportunities Market expansion opportunities through new municipal part
Slide 25: Technology & Revenue Cycle Management
Technology & Revenue Cycle Management Todd Walker, Mid-Atlantic Group President 25
Slide 26: Patient Care Reports
Patient Care Reports Patient Care Report (PCR) must be completed for every patient transported Four primary functions: – Detailed narrative of patient’s condition and treatment provided – Primary source for billing information – Record of medicines, supplies and equipment used in patient treatment –
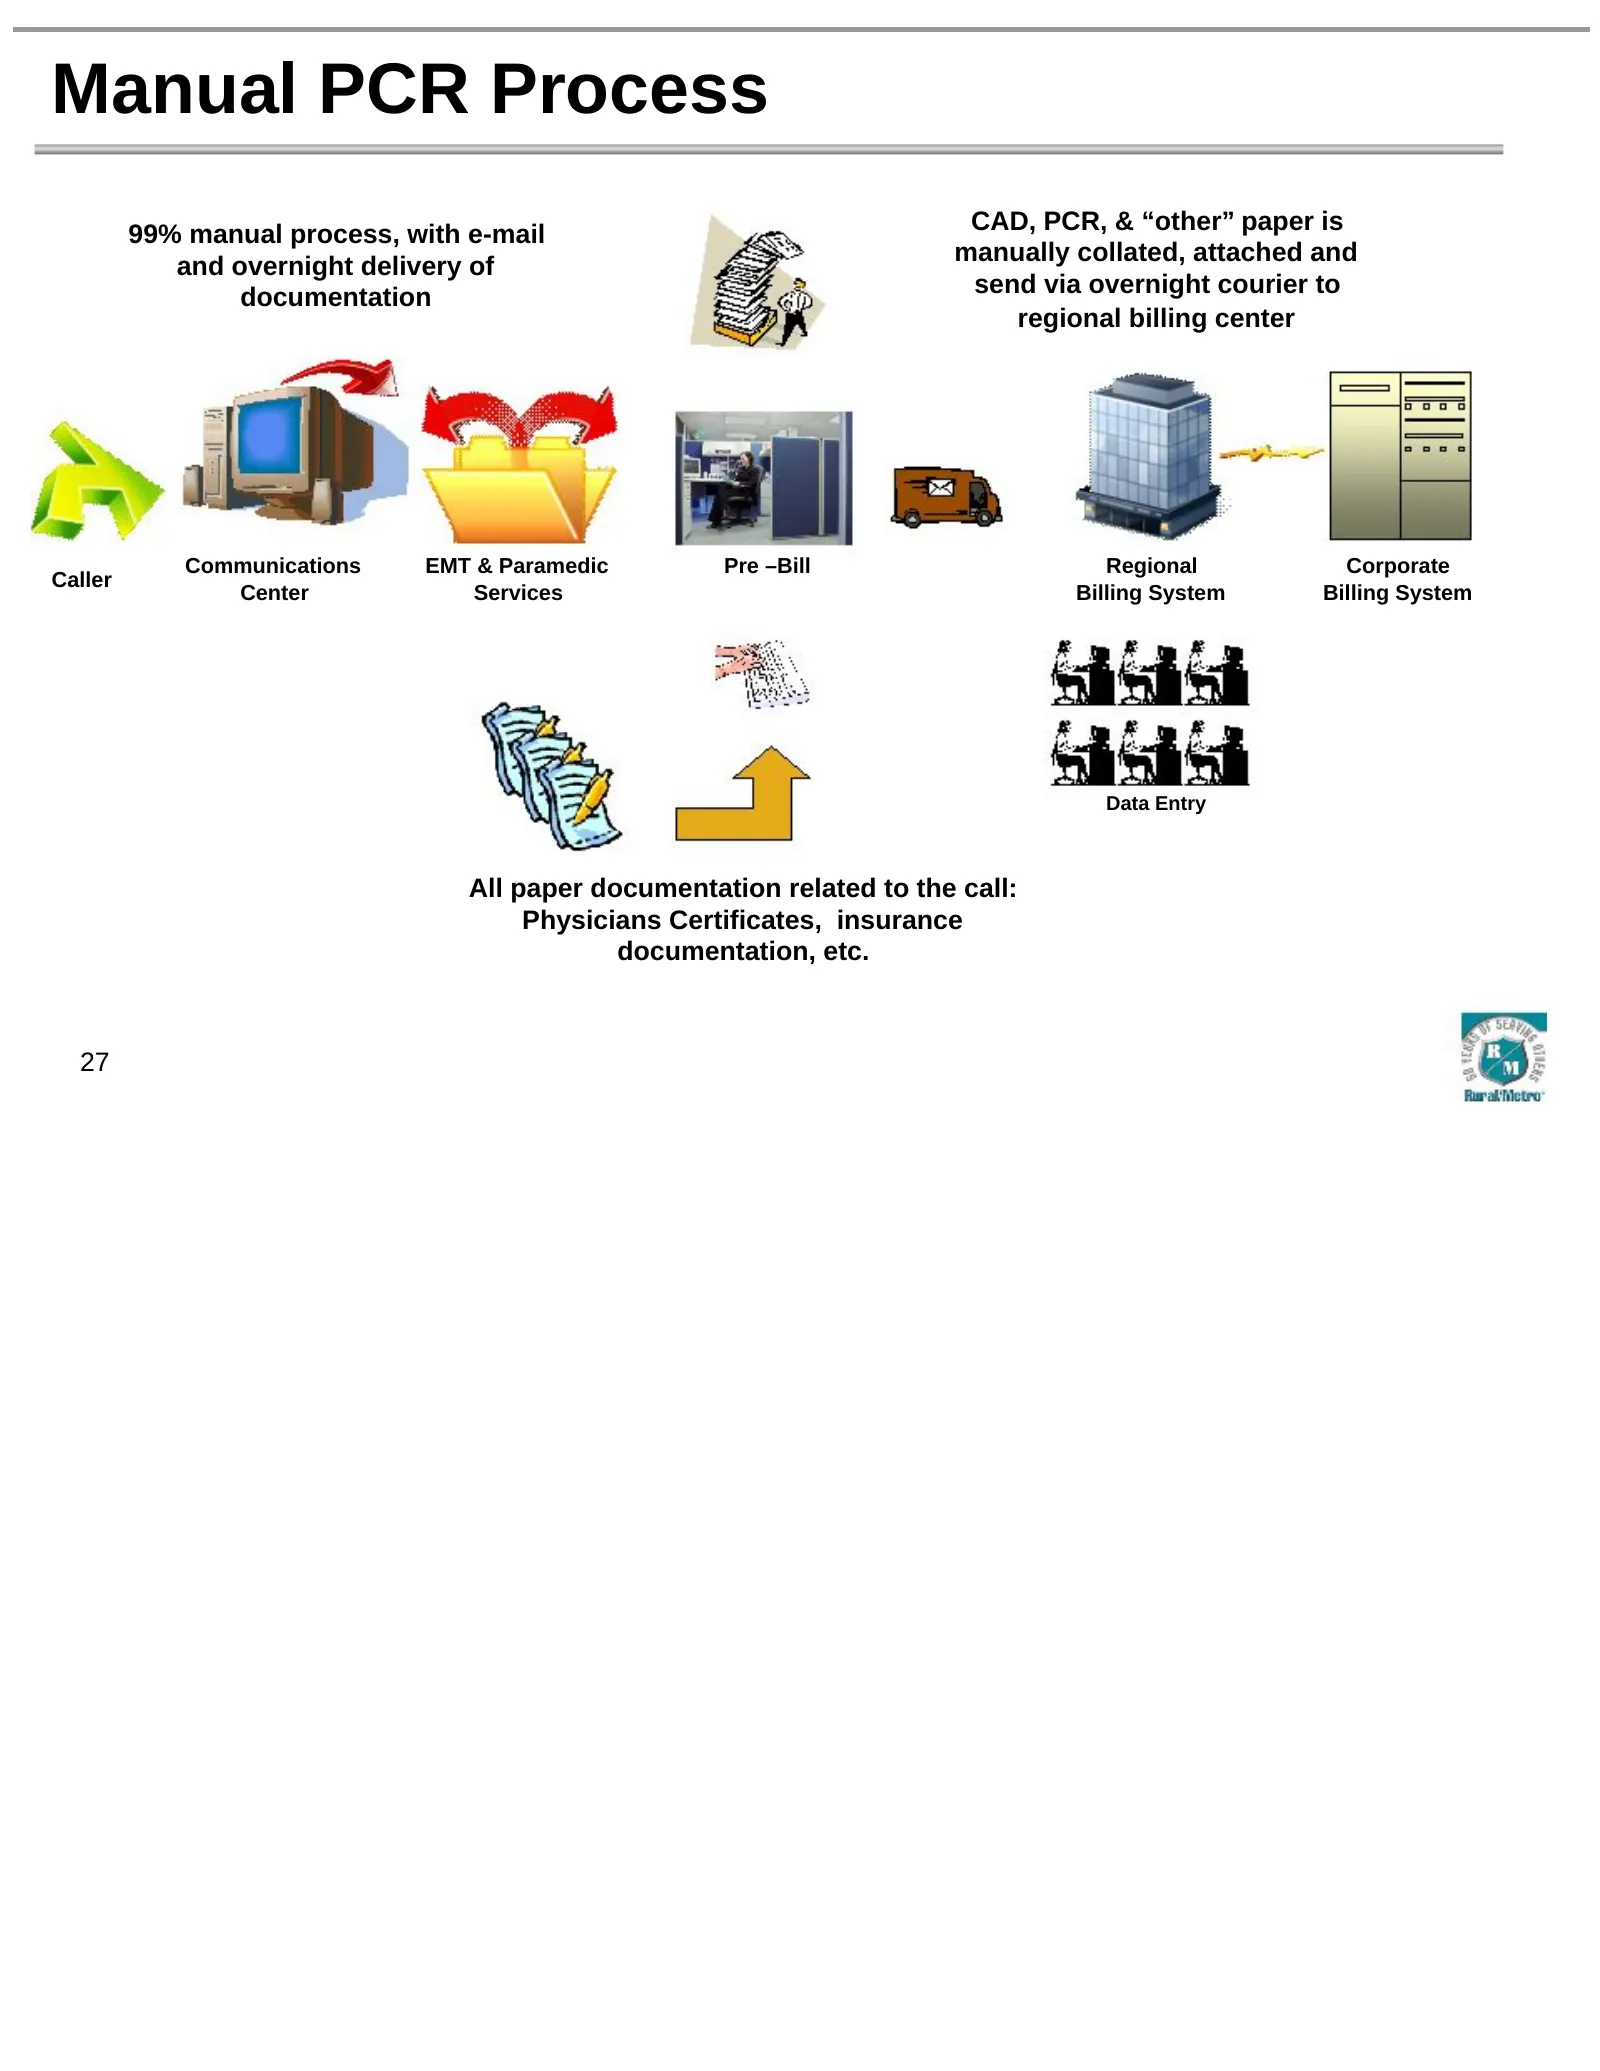
Slide 27: Manual PCR Process
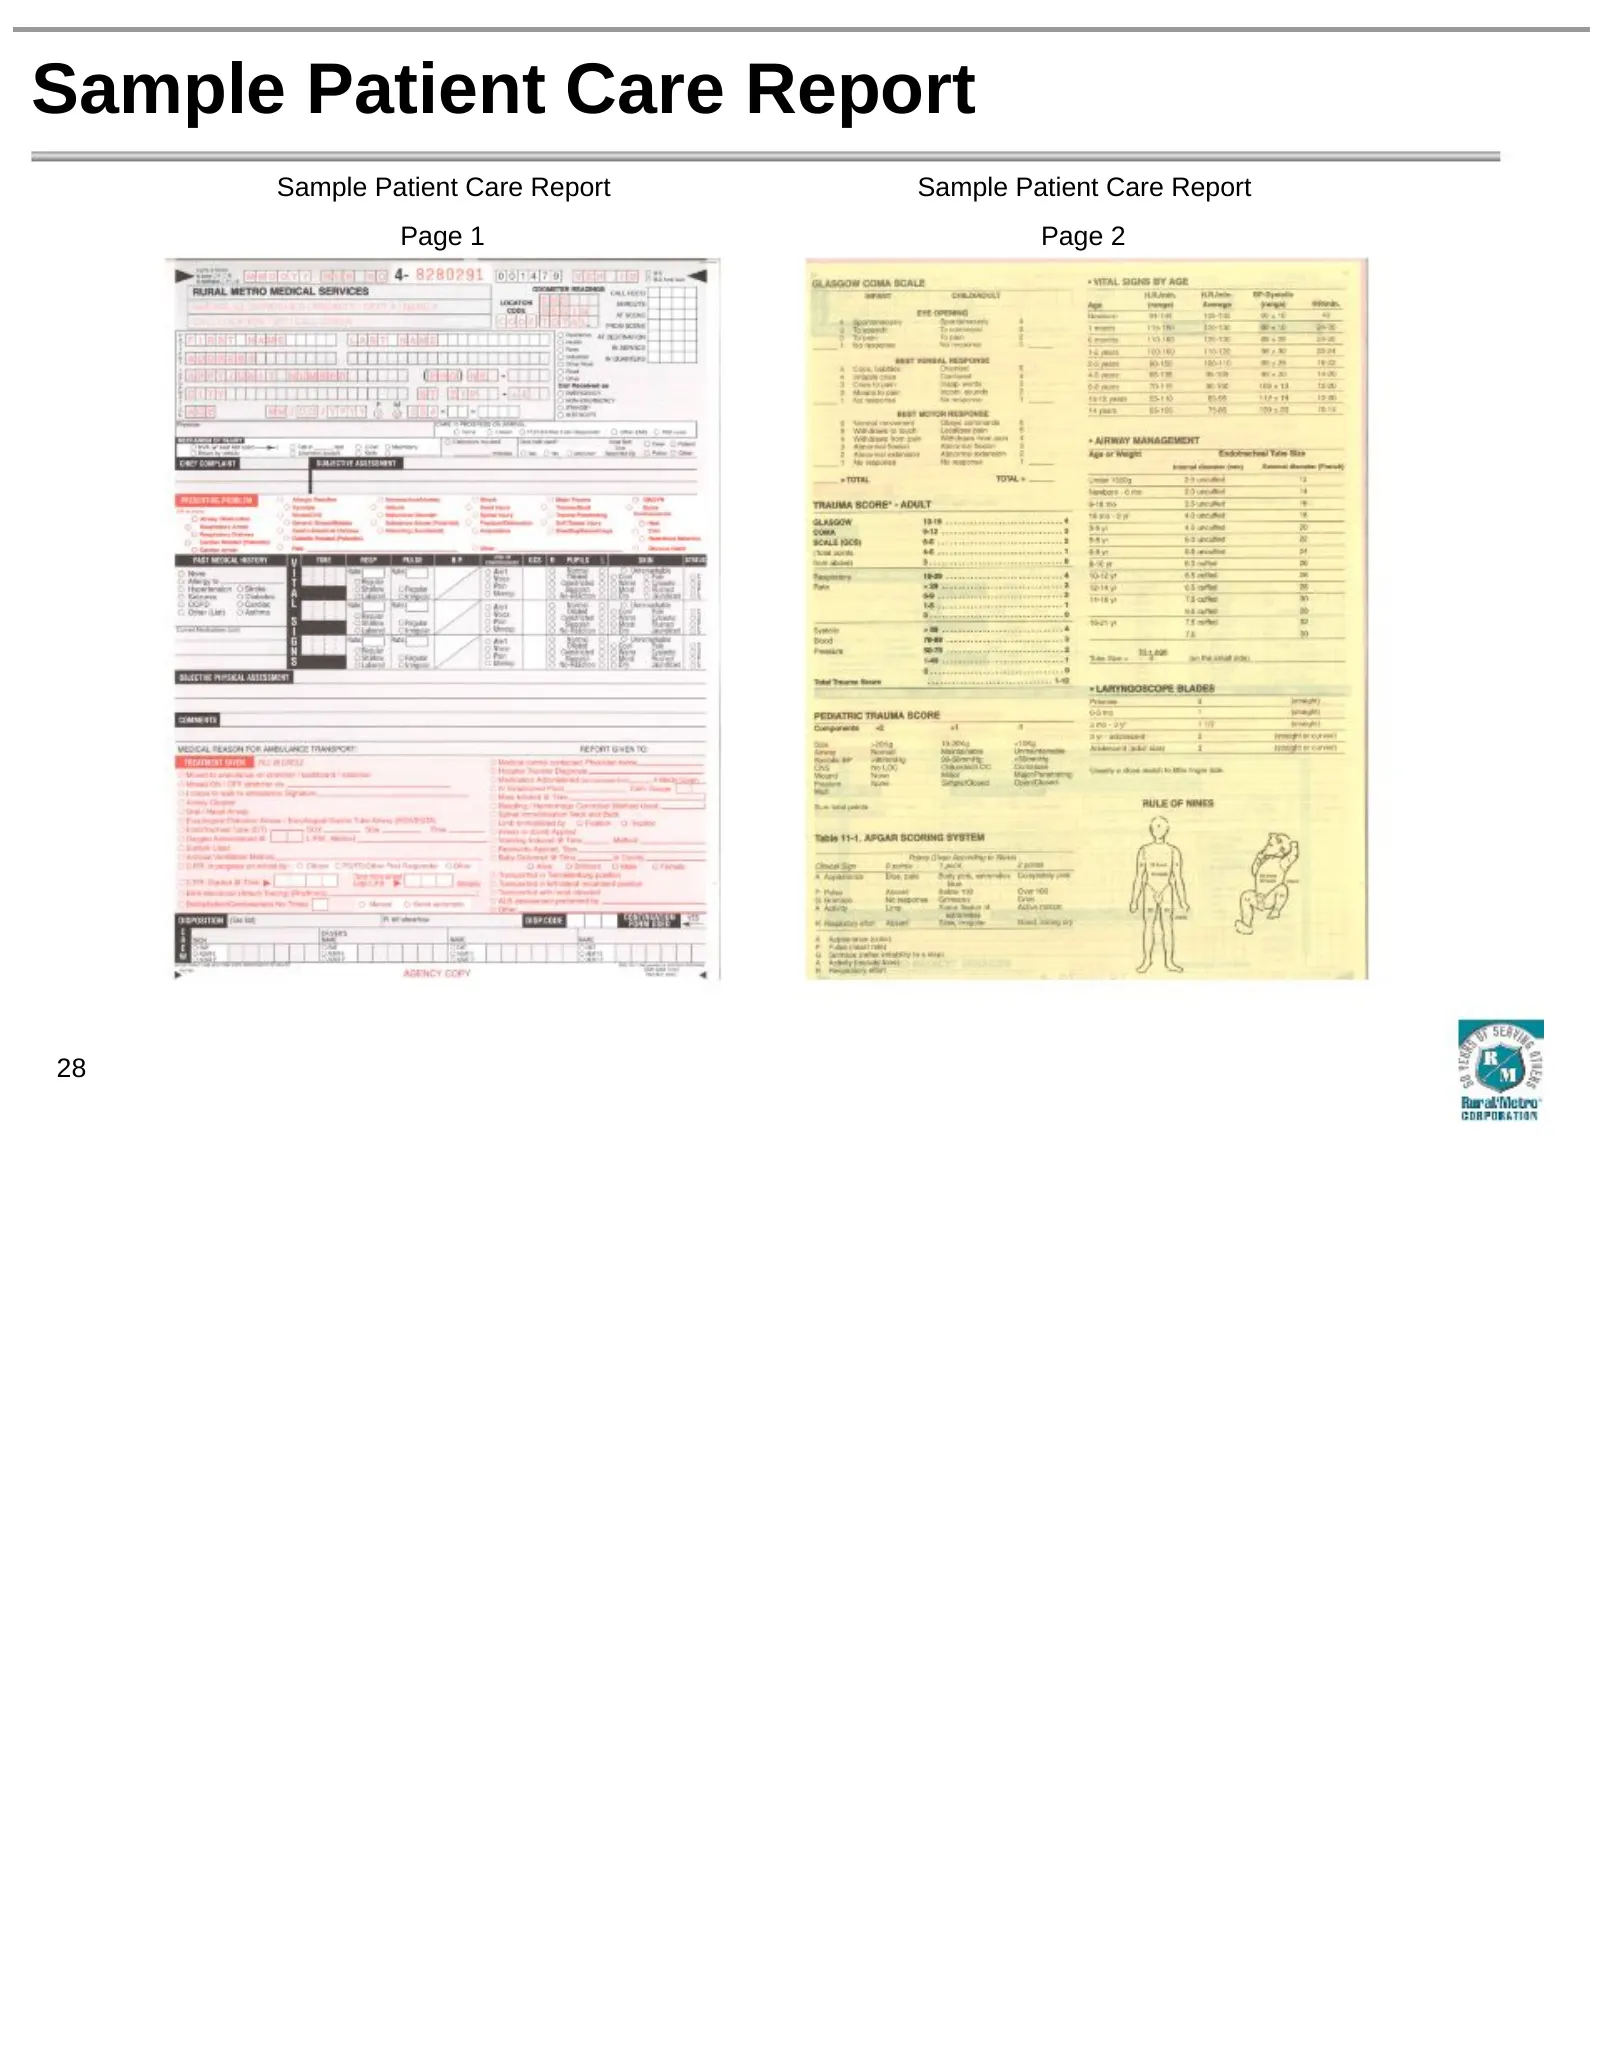
Manual PCR Process 99% manual process, with e-mail CAD, PCR, & “other” paper is and overnight delivery of manually collated, attached and send via overnight courier to documentation regional billing center Communications EMT & Paramedic Pre –Bill Regional Corporate Caller Center Services Billing Sys
Slide 28: Sample Patient Care Report
Sample Patient Care Report Sample Patient Care Report Sample Patient Care Report Page 1 Page 2 28
Slide 29: ePCR Implementation
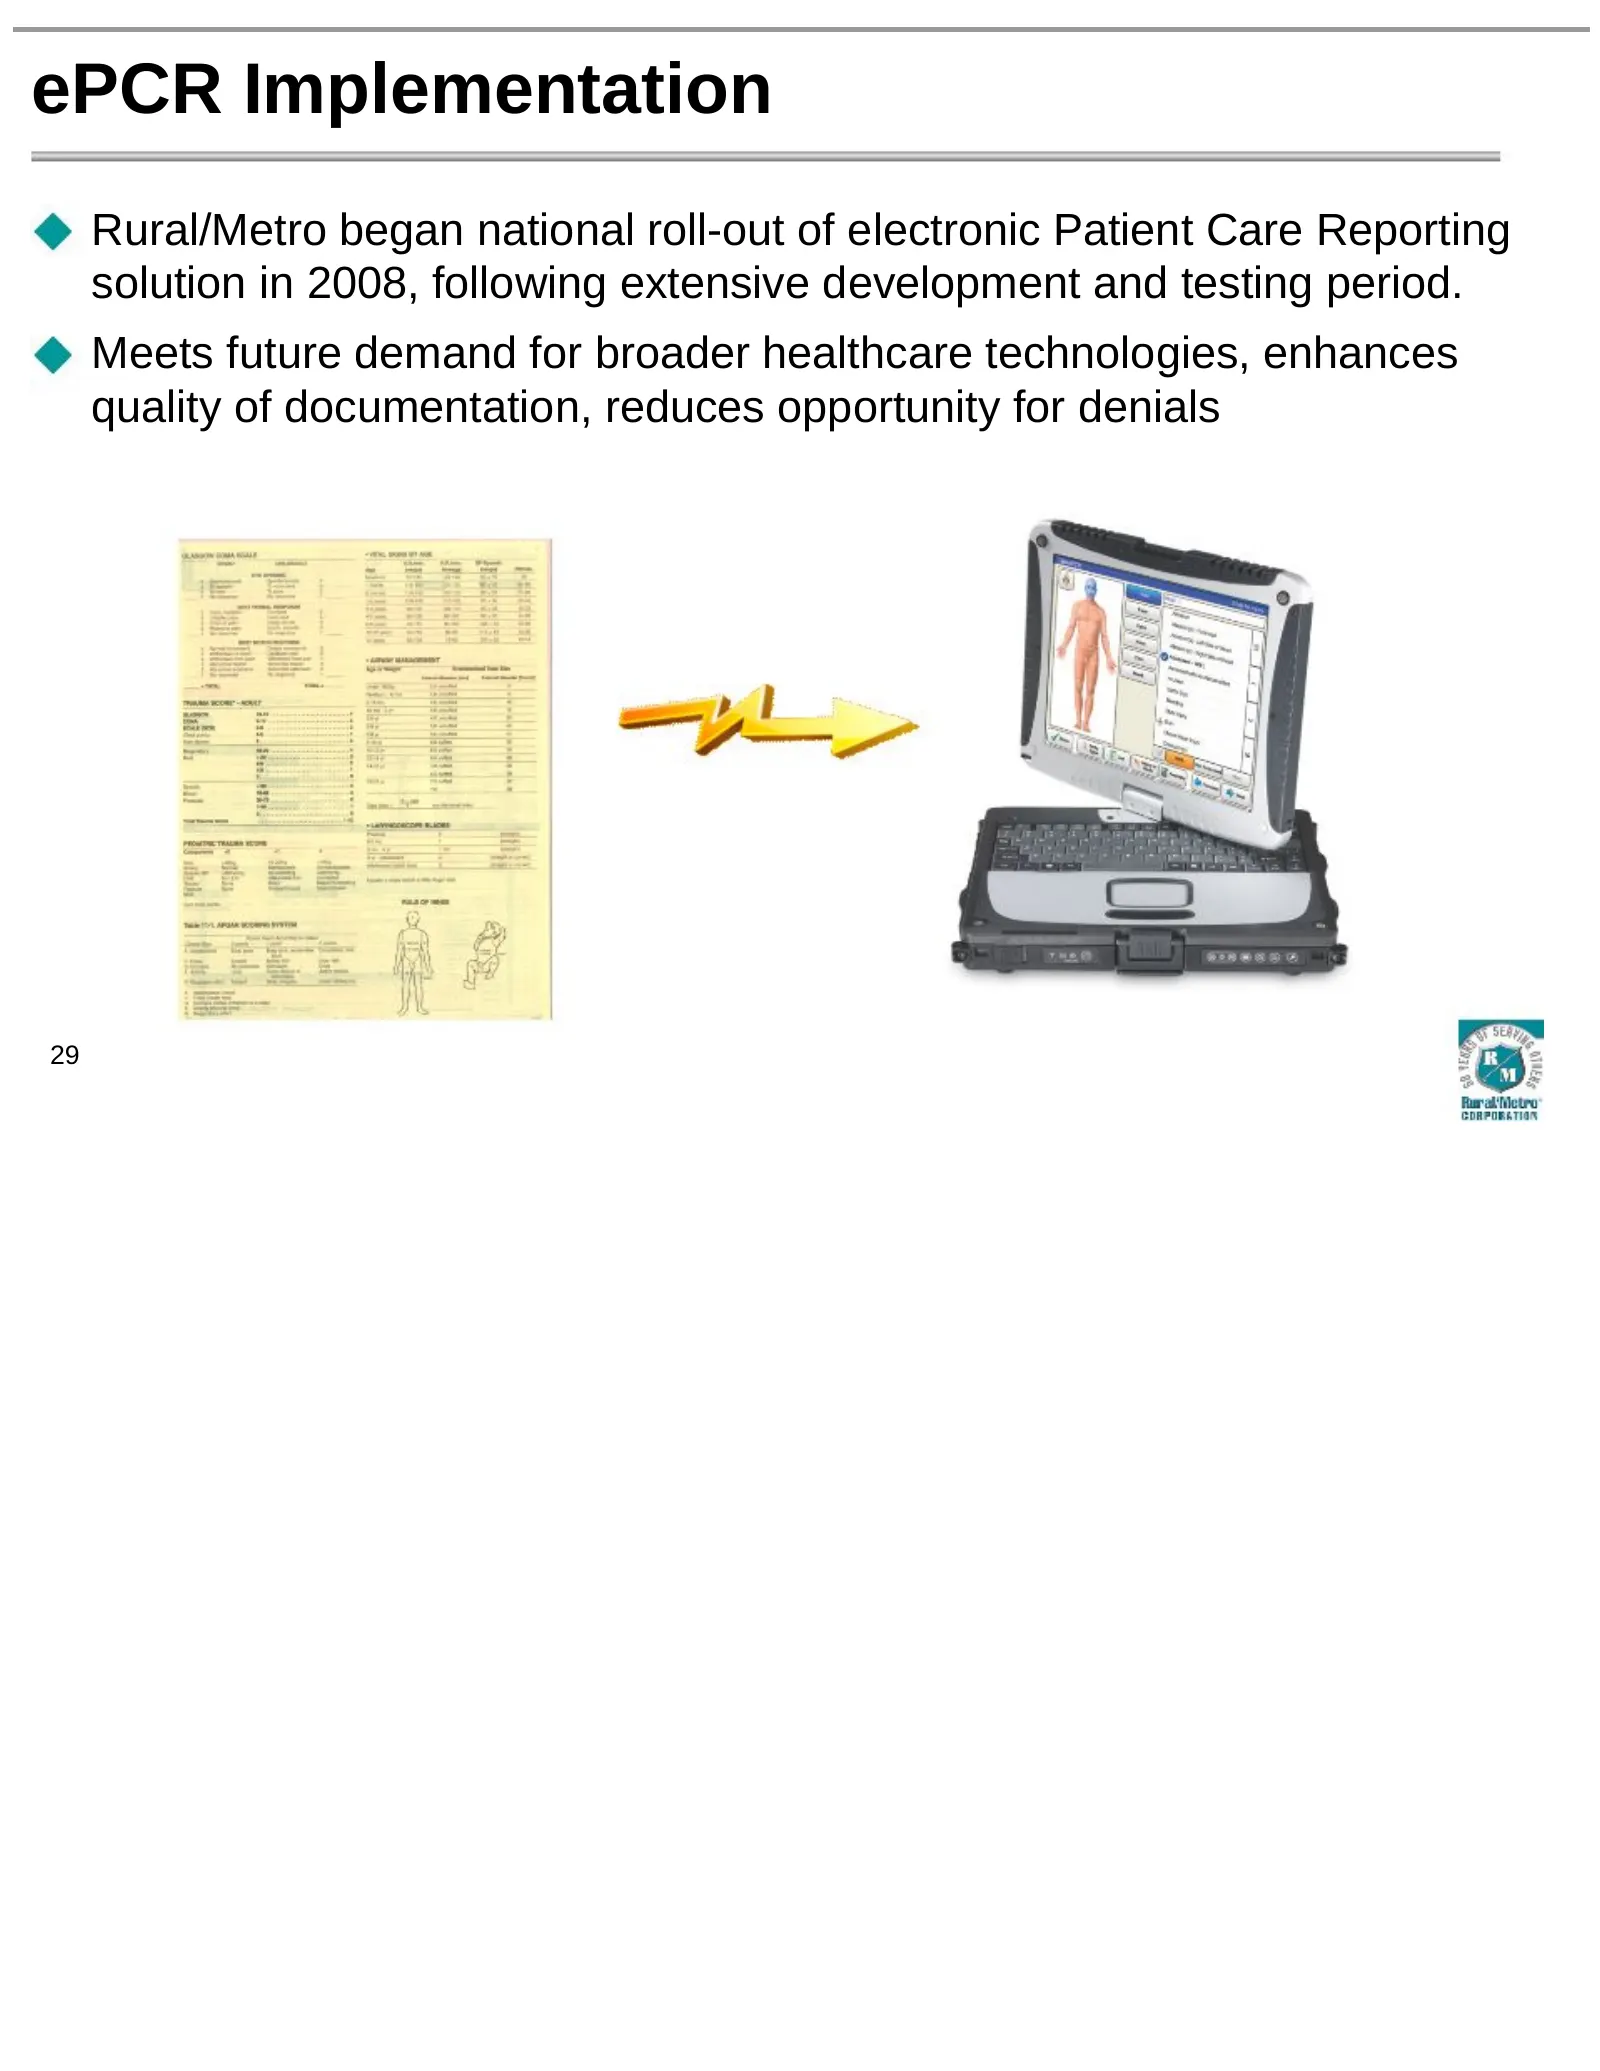
ePCR Implementation Rural/Metro began national roll-out of electronic Patient Care Reporting solution in 2008, following extensive development and testing period. Meets future demand for broader healthcare technologies, enhances quality of documentation, reduces opportunity for denials 29
Slide 30: ePCR Locations
ePCR Locations Rural/Metro markets currently utilizing ePCR technology: Youngstown, Ohio Salem, Oregon Metro Denver/Aurora, Colorado Western New York/Buffalo Orlando, Florida Rochester, New York Markets scheduled for implementation in calendar 2009 Seattle, Washington Memphis, Tennessee Atlanta, Geo
Slide 31: ePCR Functions & Capabilities
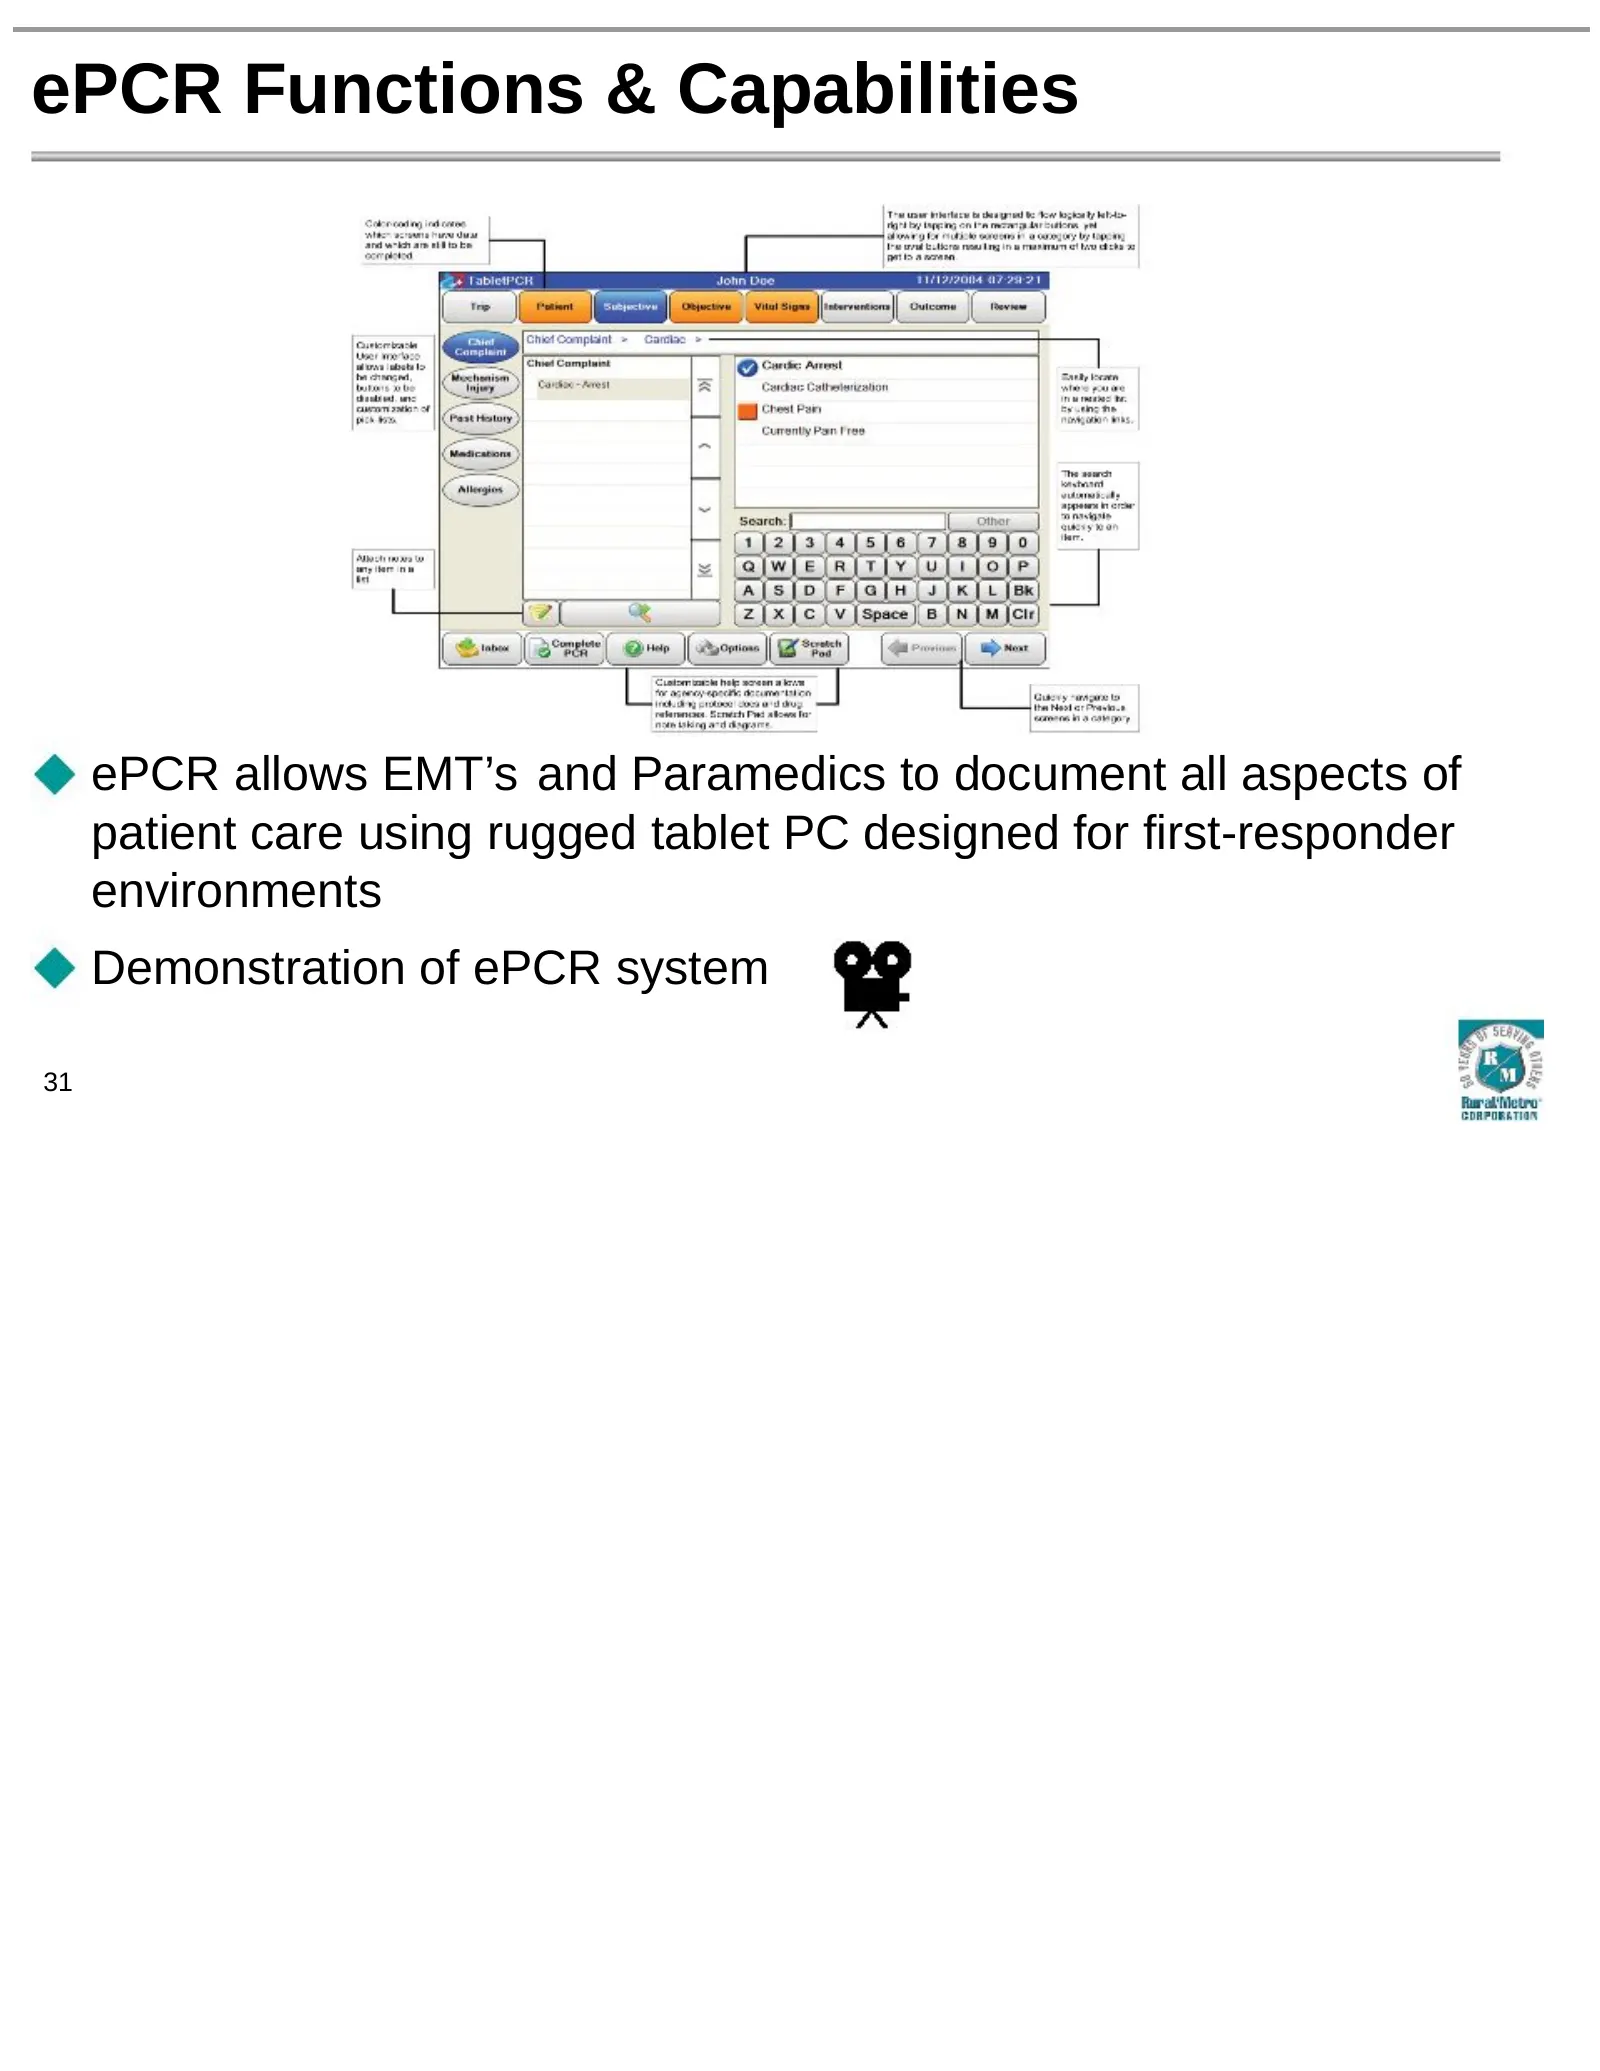
ePCR Functions & Capabilities ePCR allows EMT’s and Paramedics to document all aspects of patient care using rugged tablet PC designed for first-responder environments Demonstration of ePCR system 31
Slide 32: Electronic PCR Process
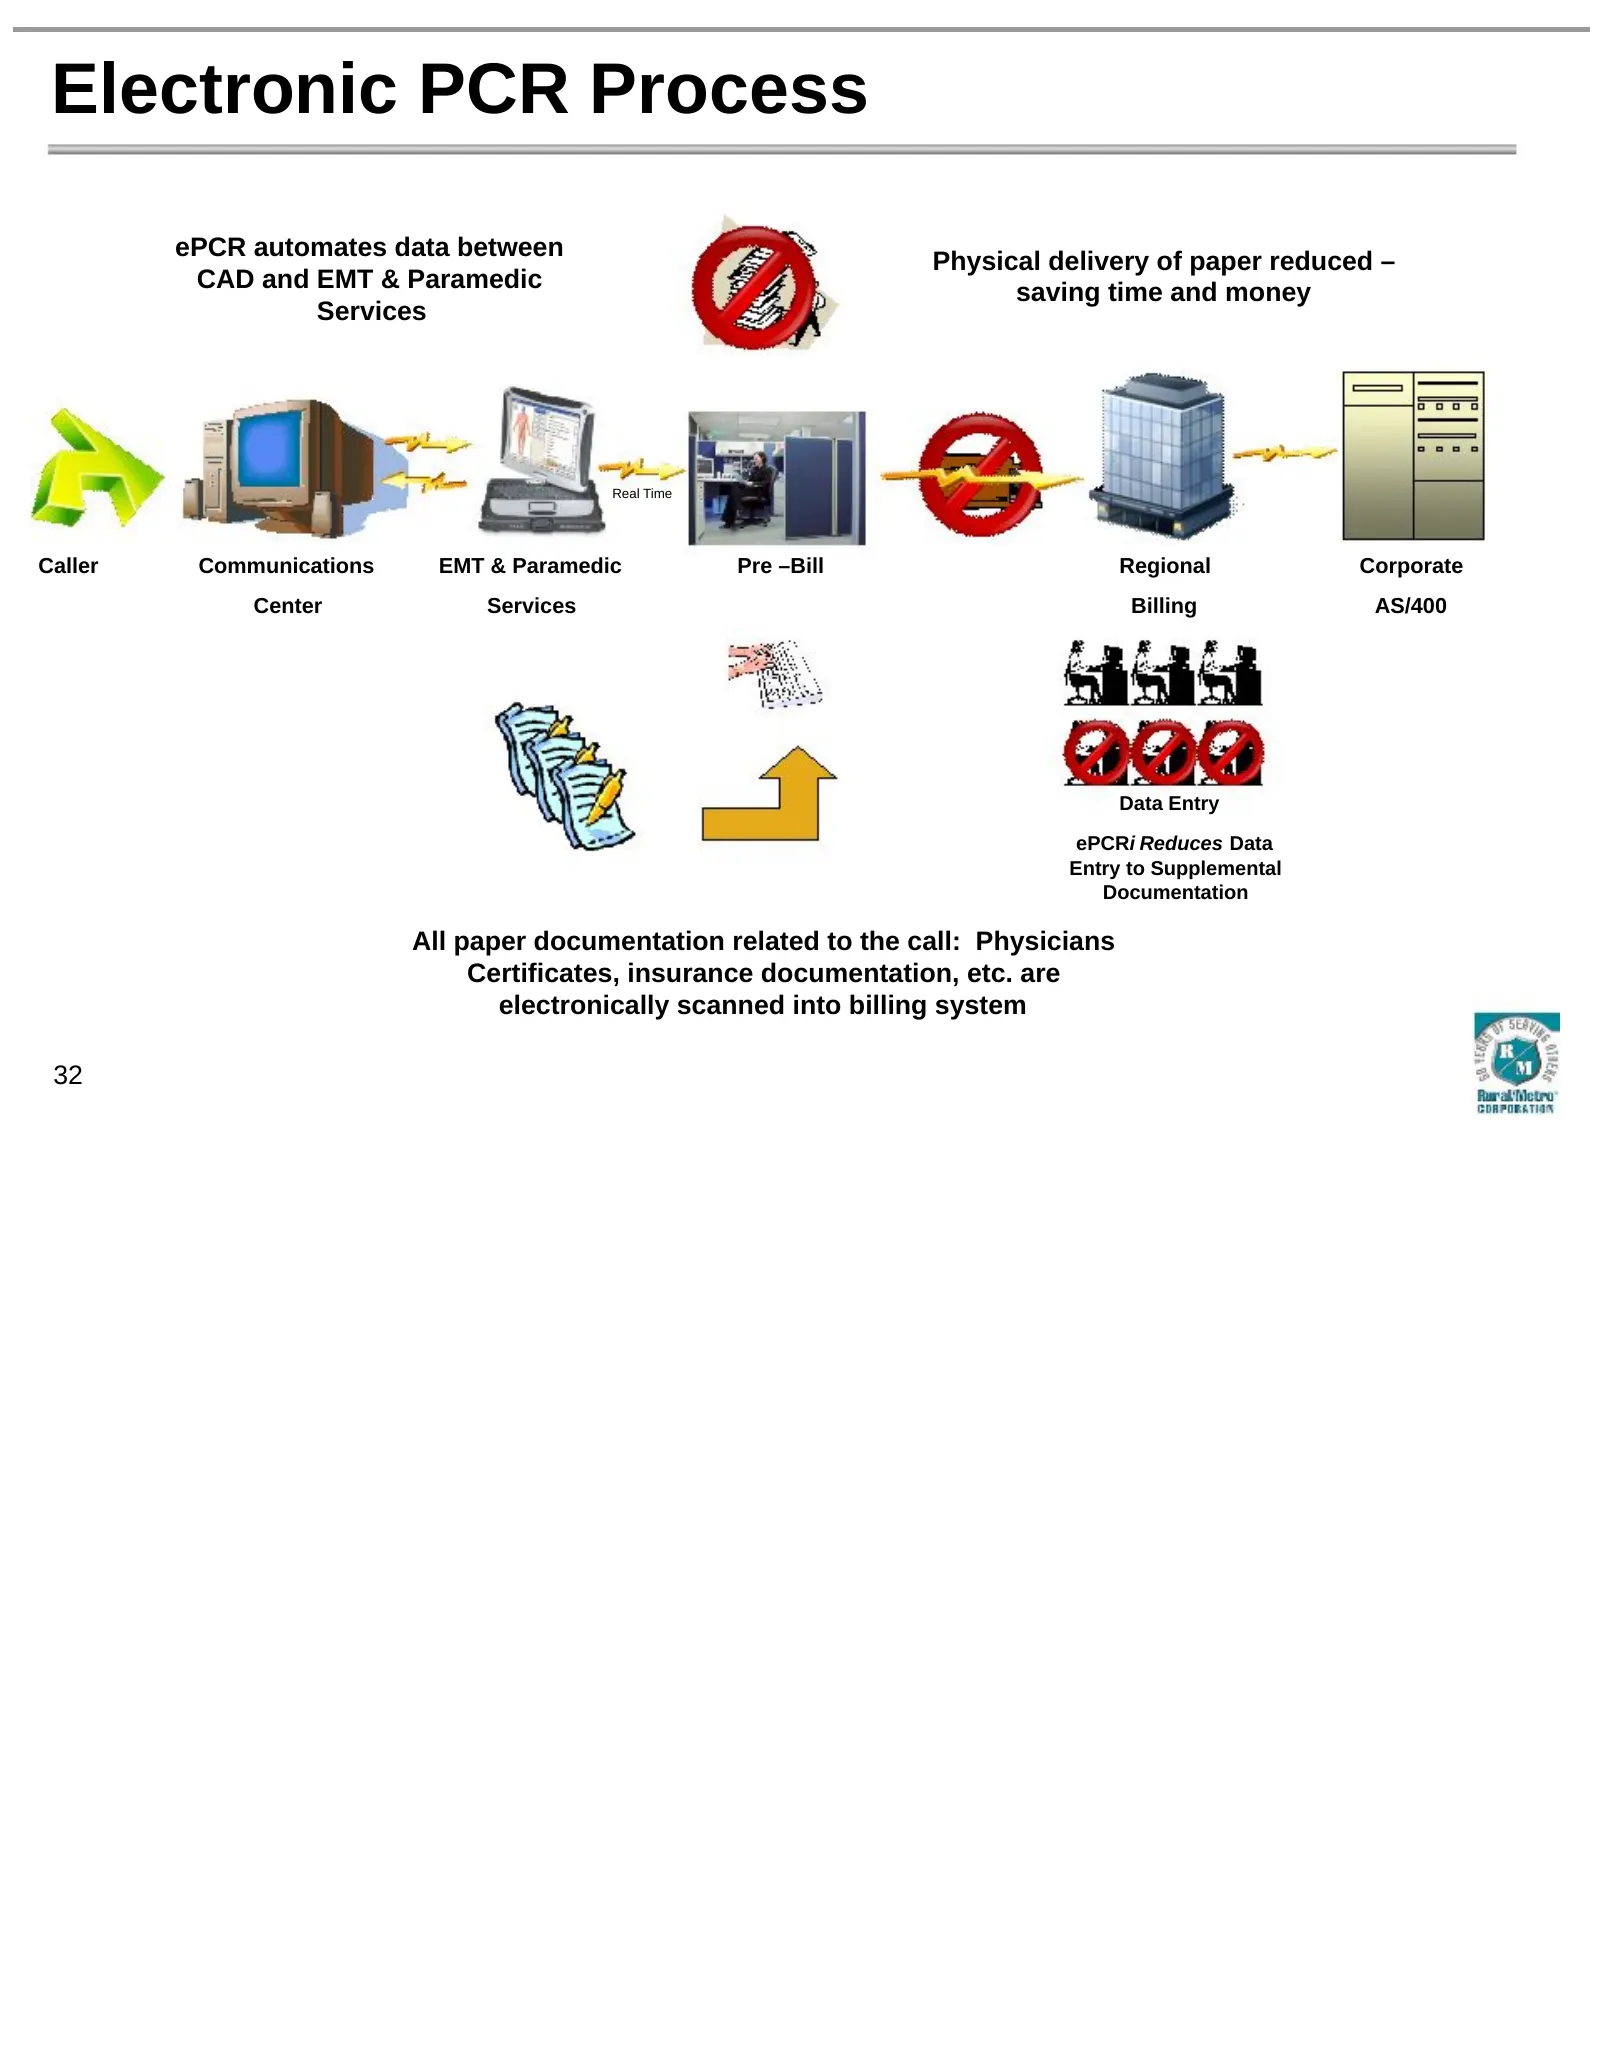
Electronic PCR Process ePCR automates data between Physical delivery of paper reduced – CAD and EMT & Paramedic saving time and money Services Real Time Caller Communications EMT & Paramedic Pre –Bill Regional Corporate Center Services Billing AS/400 Data Entry ePCRi Reduces Data Entry to Supplement
Slide 33: Operational Benefits of ePCR
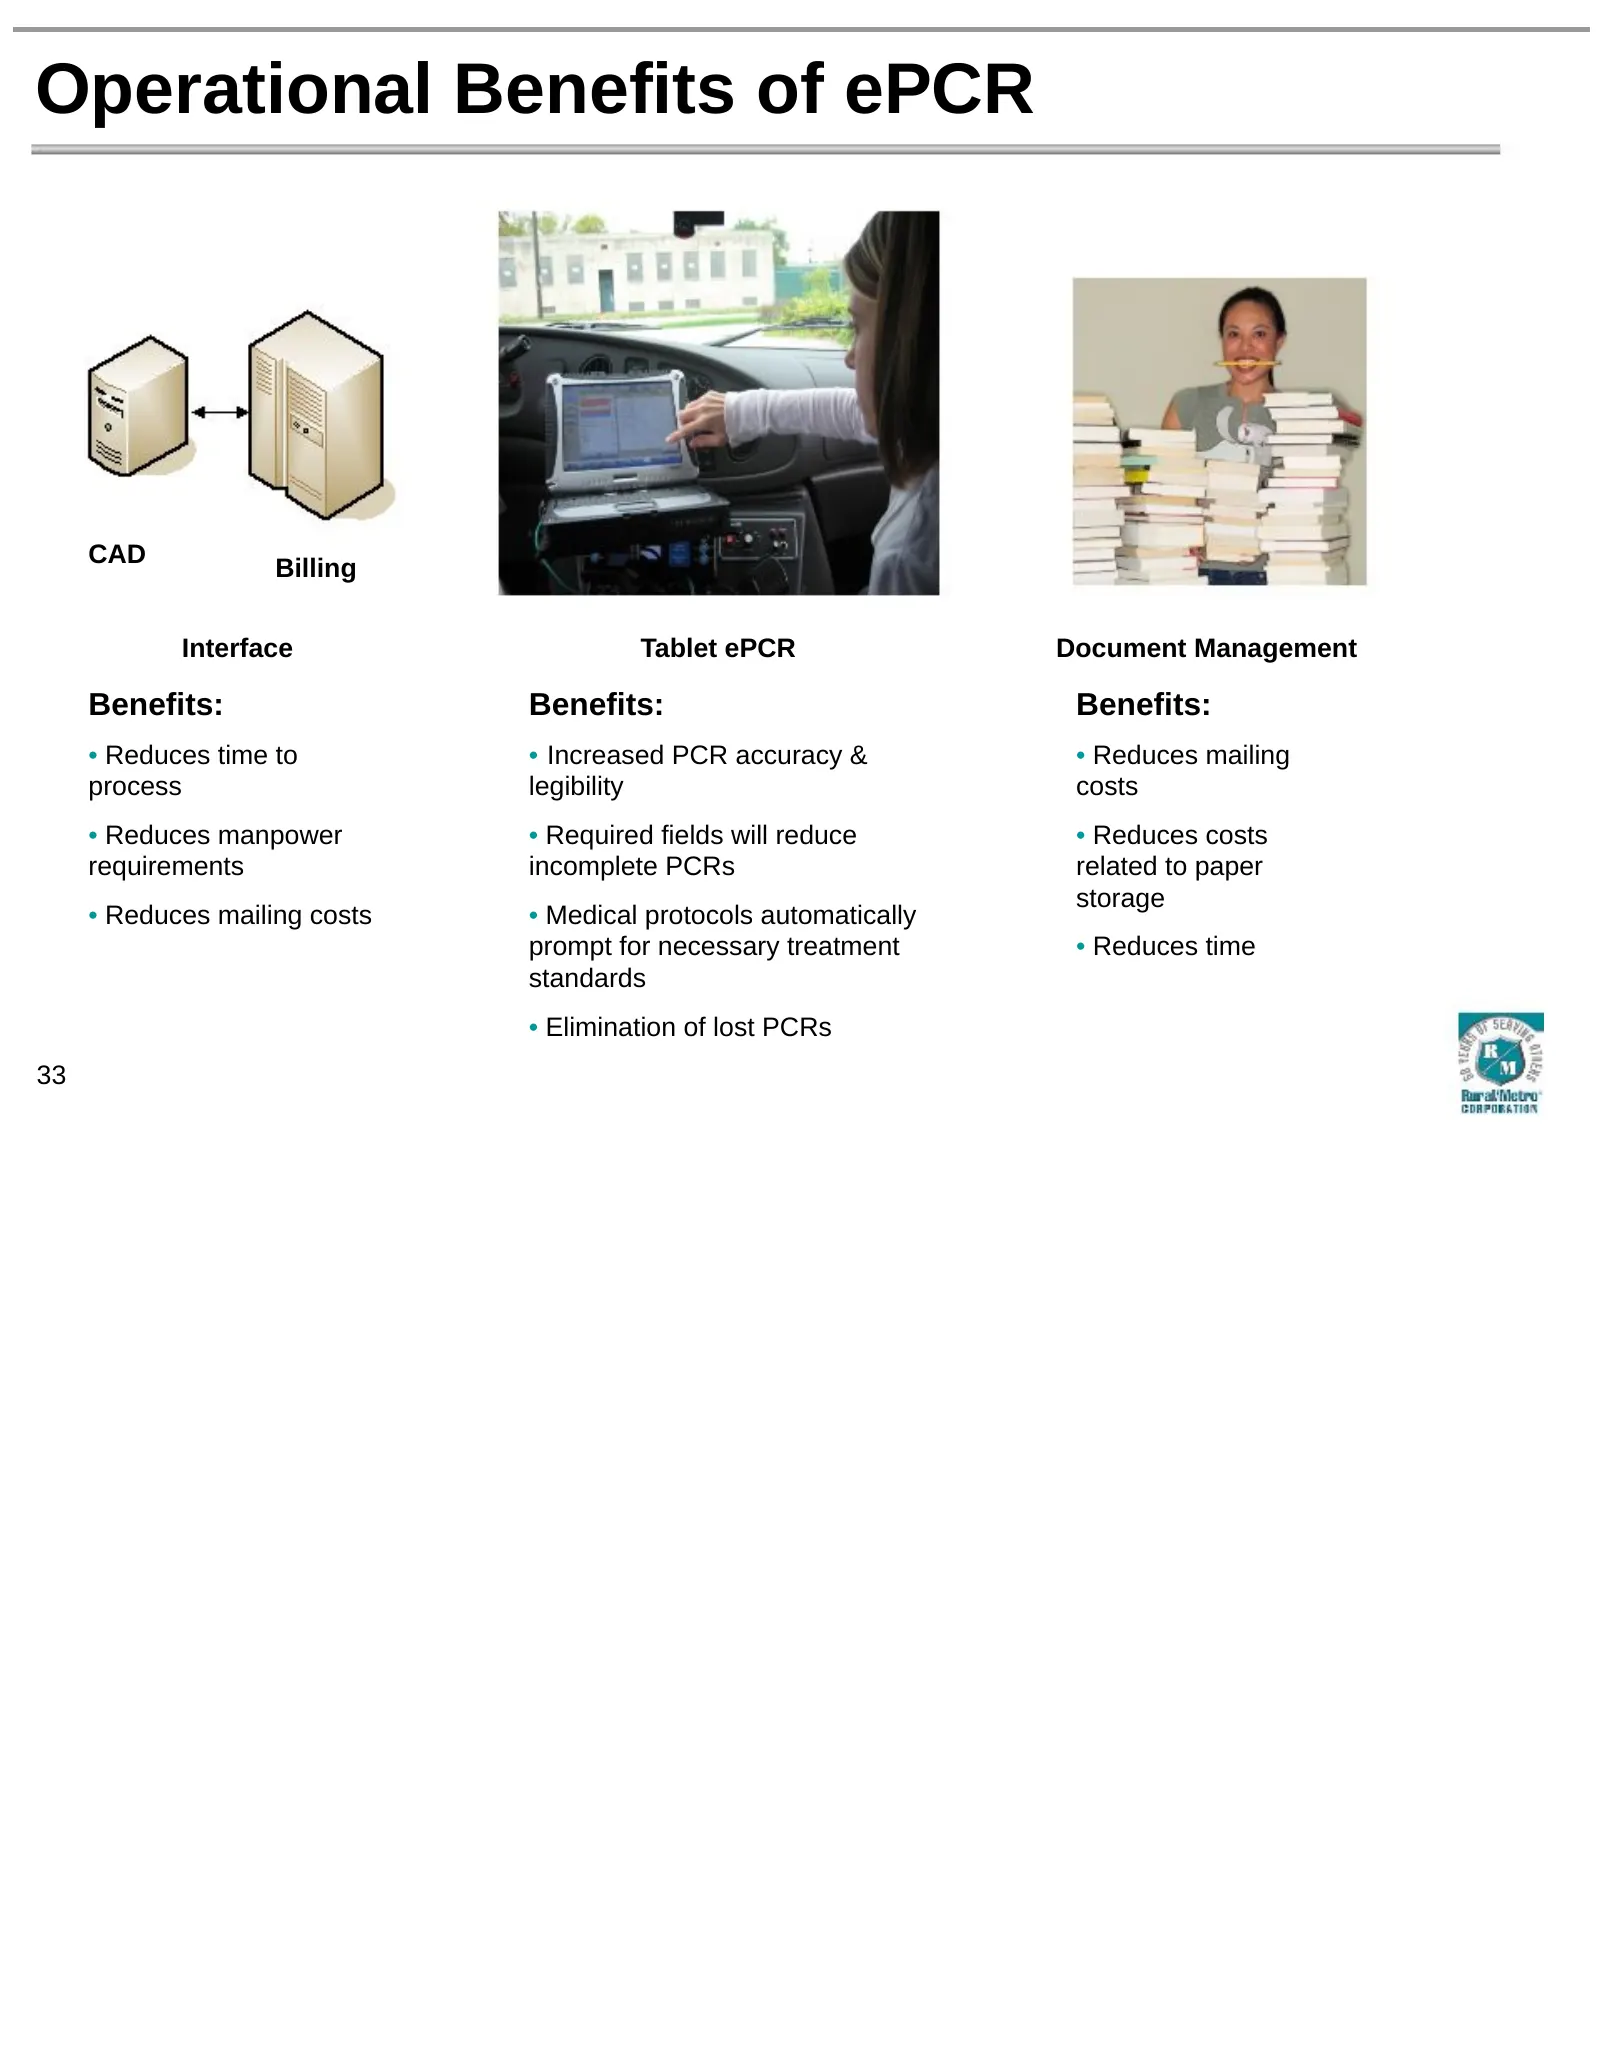
Operational Benefits of ePCR CAD Billing Interface Tablet ePCR Document Management Benefits: Benefits: Benefits: • Reduces time to • Increased PCR accuracy & • Reduces mailing process legibility costs • Reduces manpower • Required fields will reduce • Reduces costs requirements incomplete PCRs relat
Slide 34: Sample ePCR Report
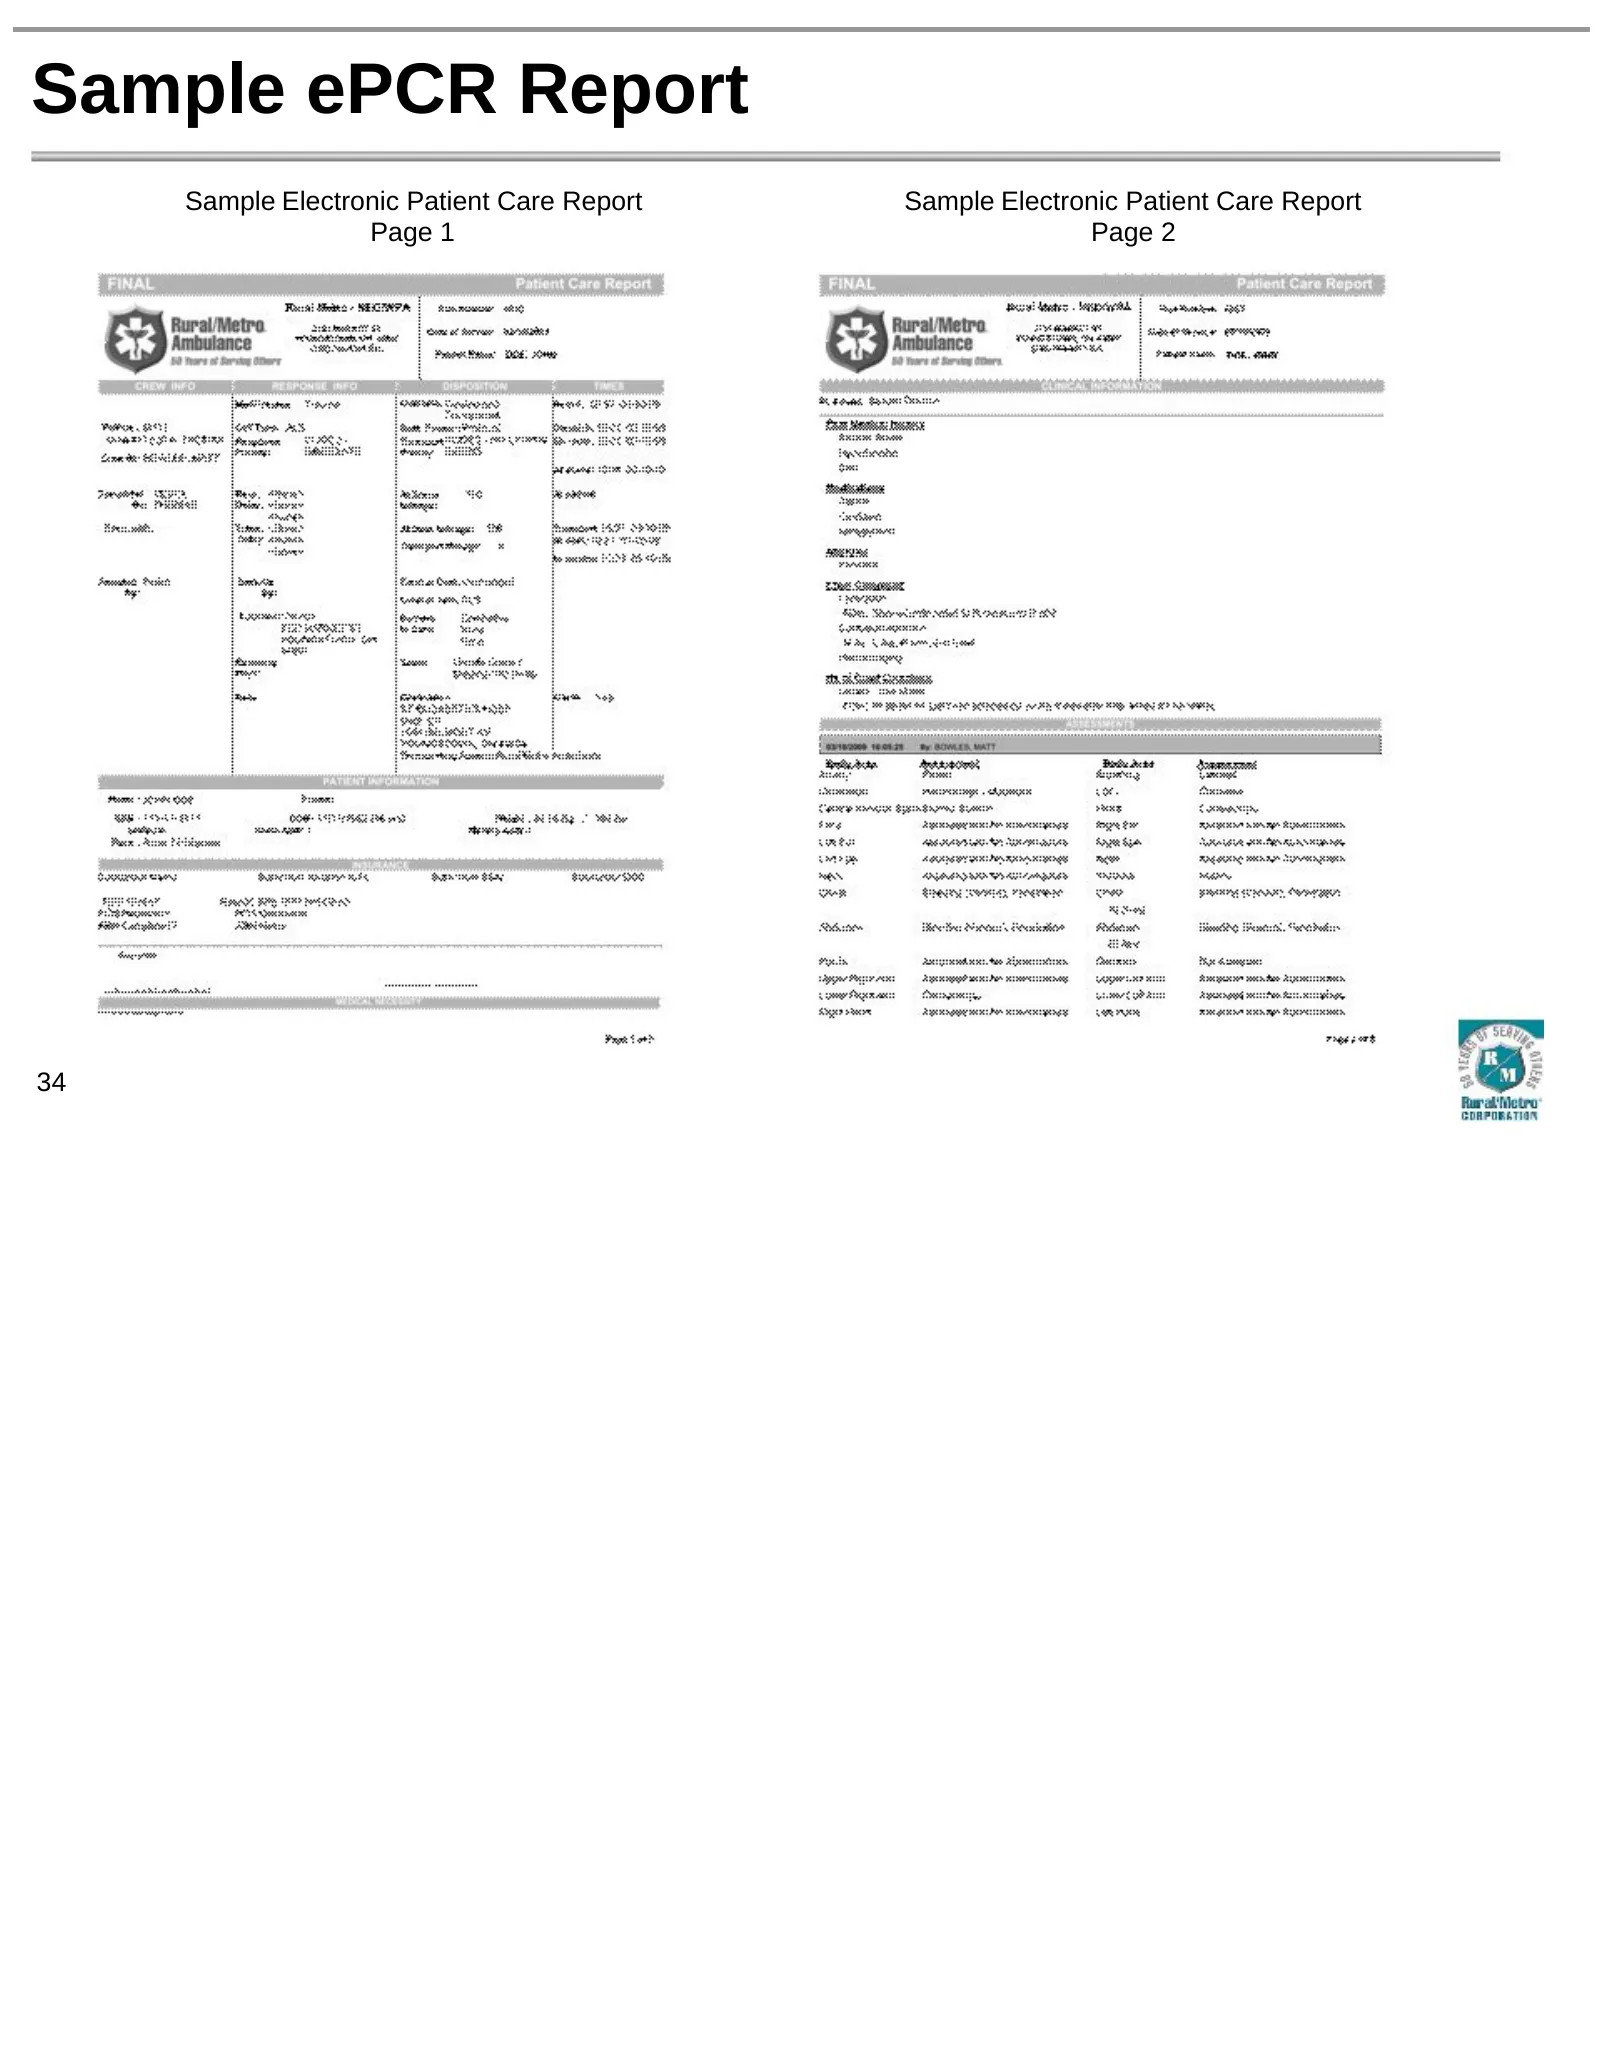
Sample ePCR Report Sample Electronic Patient Care Report Sample Electronic Patient Care Report Page 1 Page 2 34
Slide 35: Sample ePCR Report
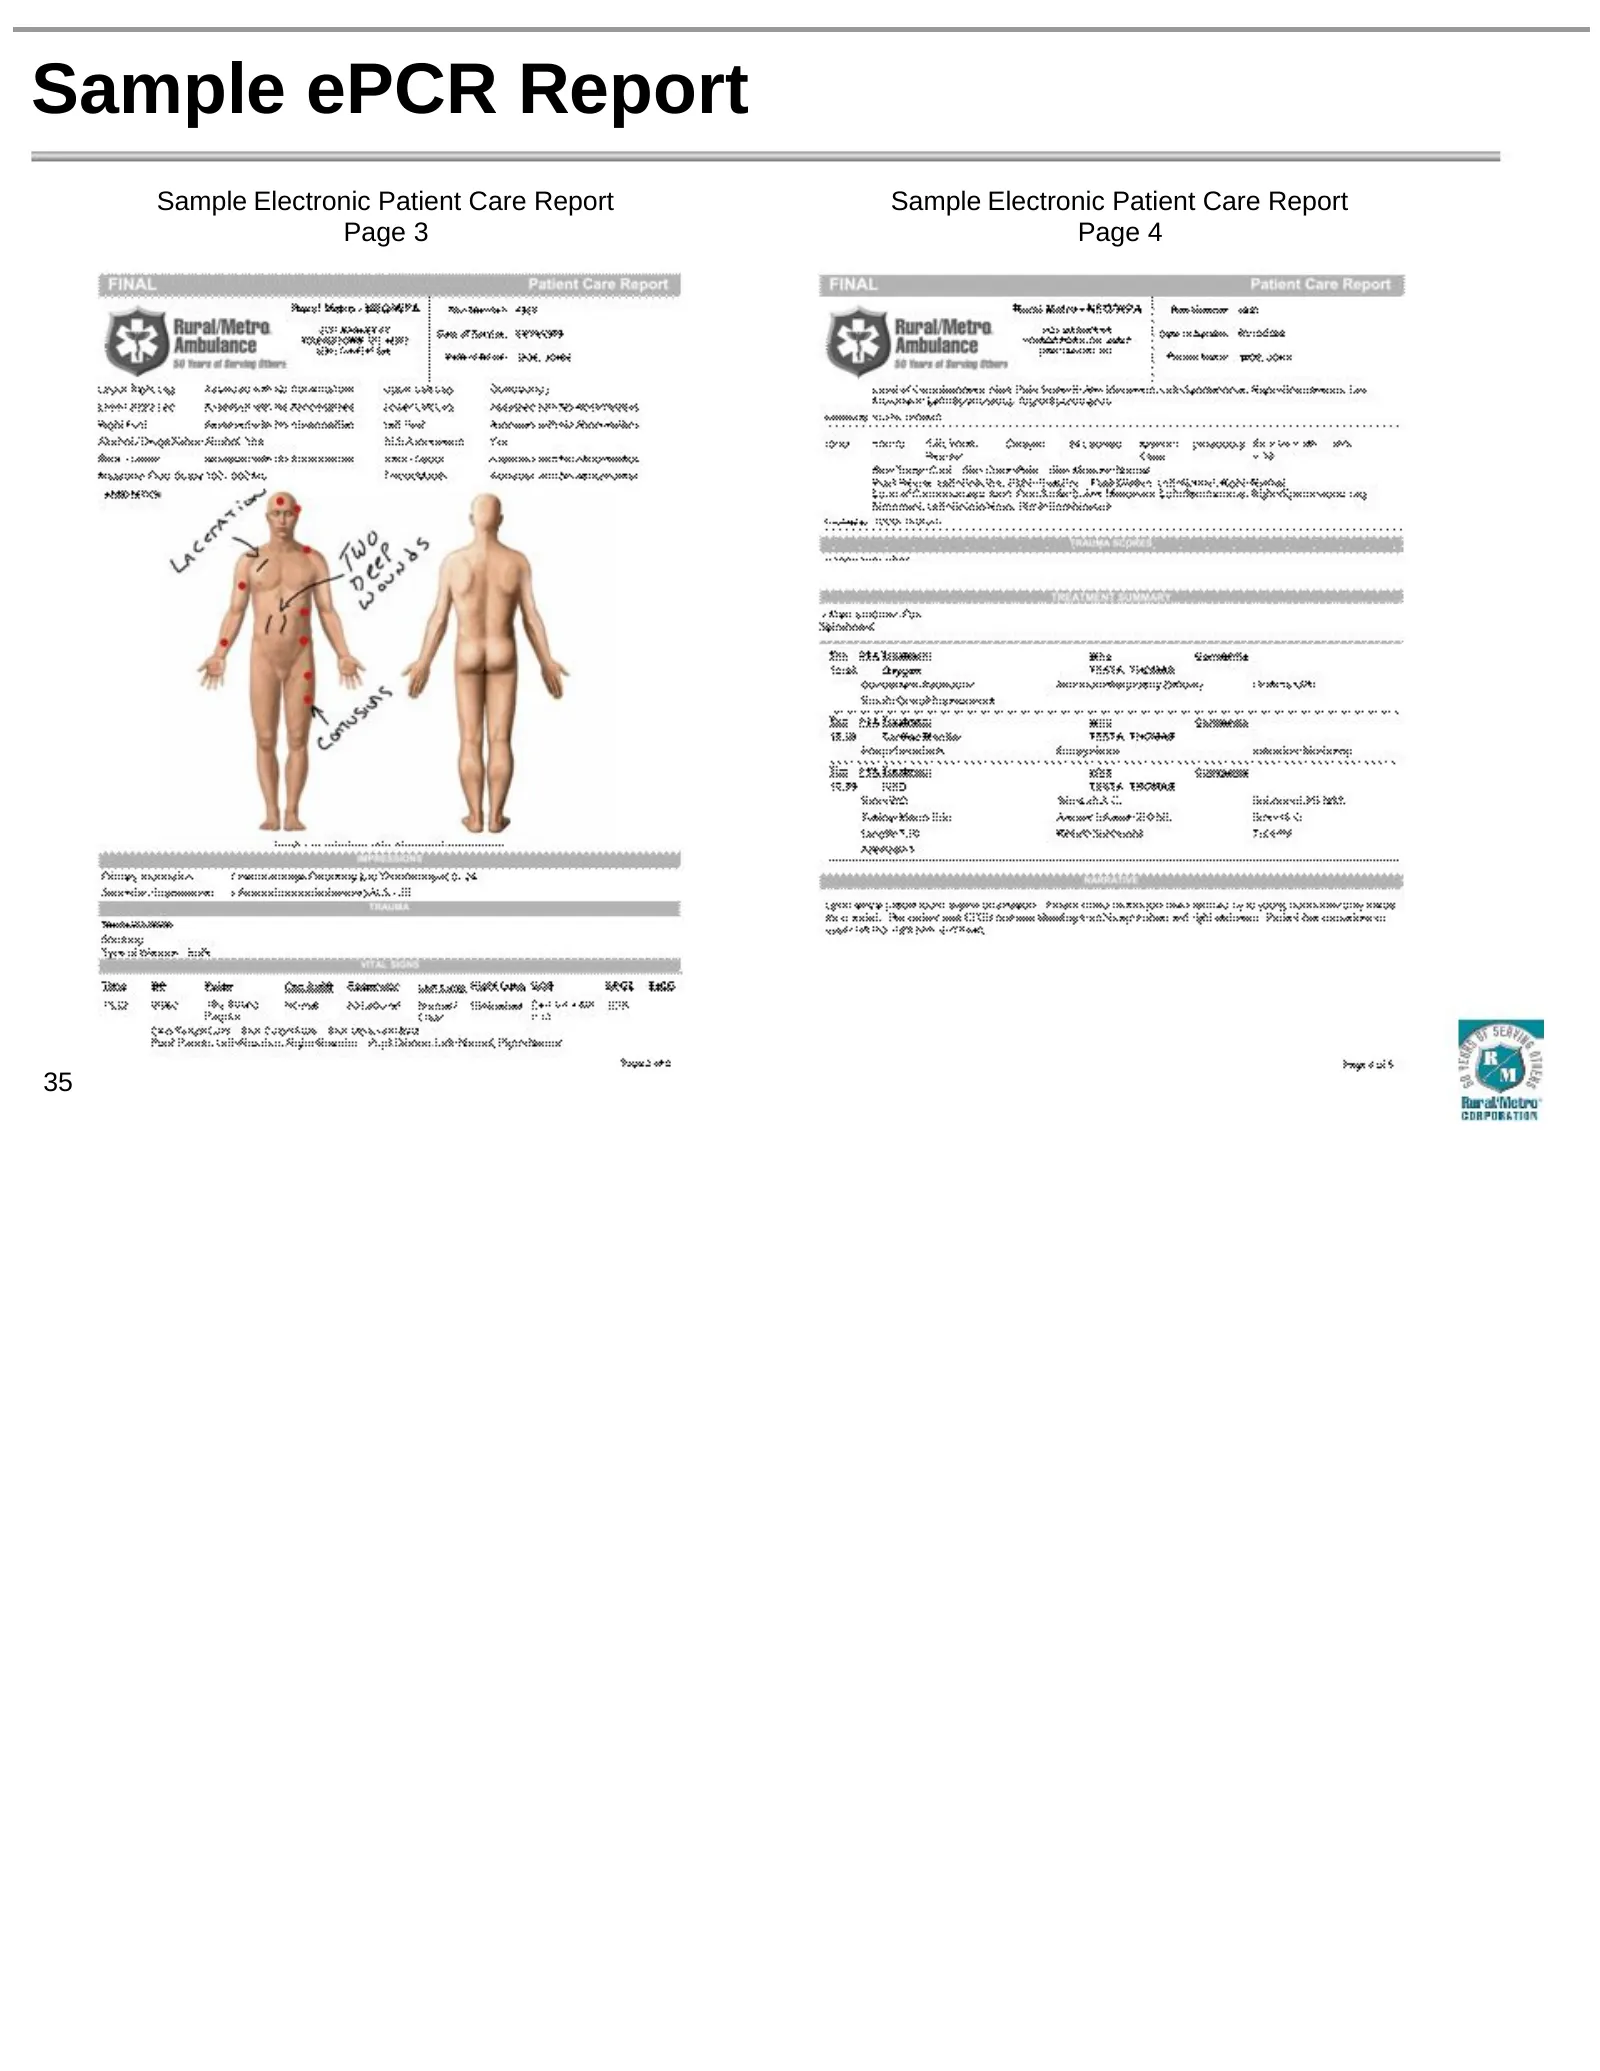
Sample ePCR Report Sample Electronic Patient Care Report Sample Electronic Patient Care Report Page 3 Page 4 35
Slide 36: Sample ePCR Report
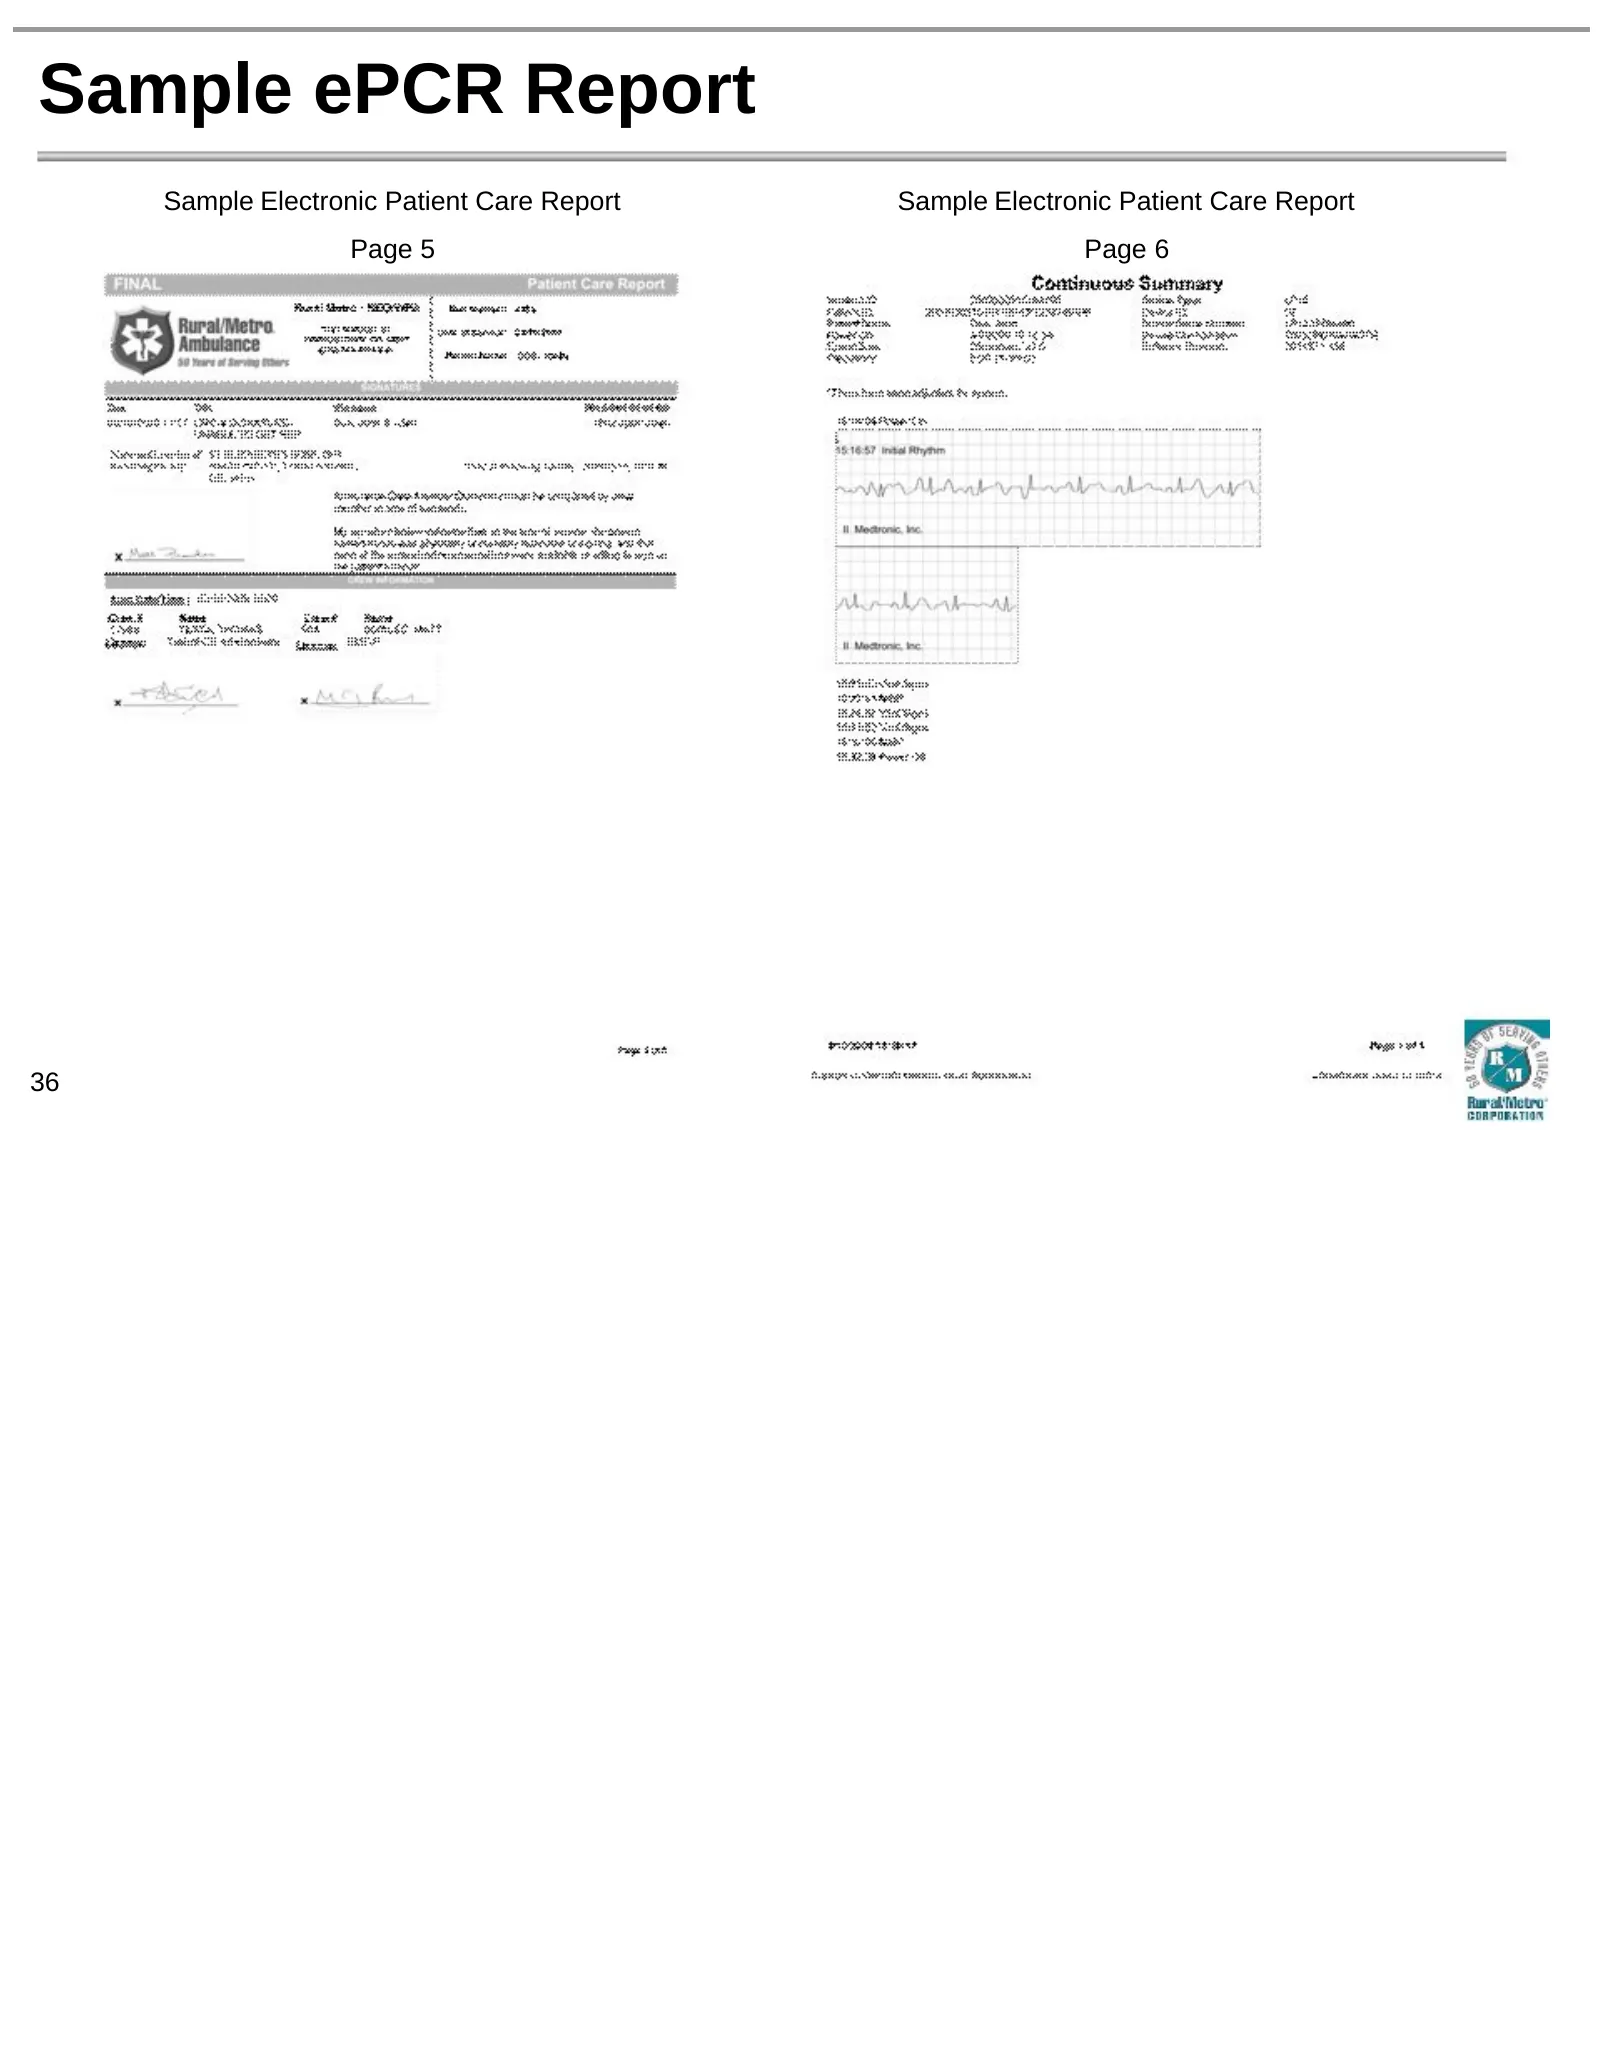
Sample ePCR Report Sample Electronic Patient Care Report Sample Electronic Patient Care Report Page 5 Page 6 36
Slide 37: Quality of Documentation
Quality of Documentation At local operations and regional billing centers, ePCR reports are reviewed to ensure medical protocols were followed for every patient transport. ePCR reports are cross-checked for: Appropriate on-scene response & assessment ALS vs. BLS Appropriate documentation of care (i.

Slide 38: Financial Drivers & Performance
Financial Drivers & Performance Kristi Ponczak, Sr. VP & CFO 38
Slide 39: Historical Net Revenue and Drivers
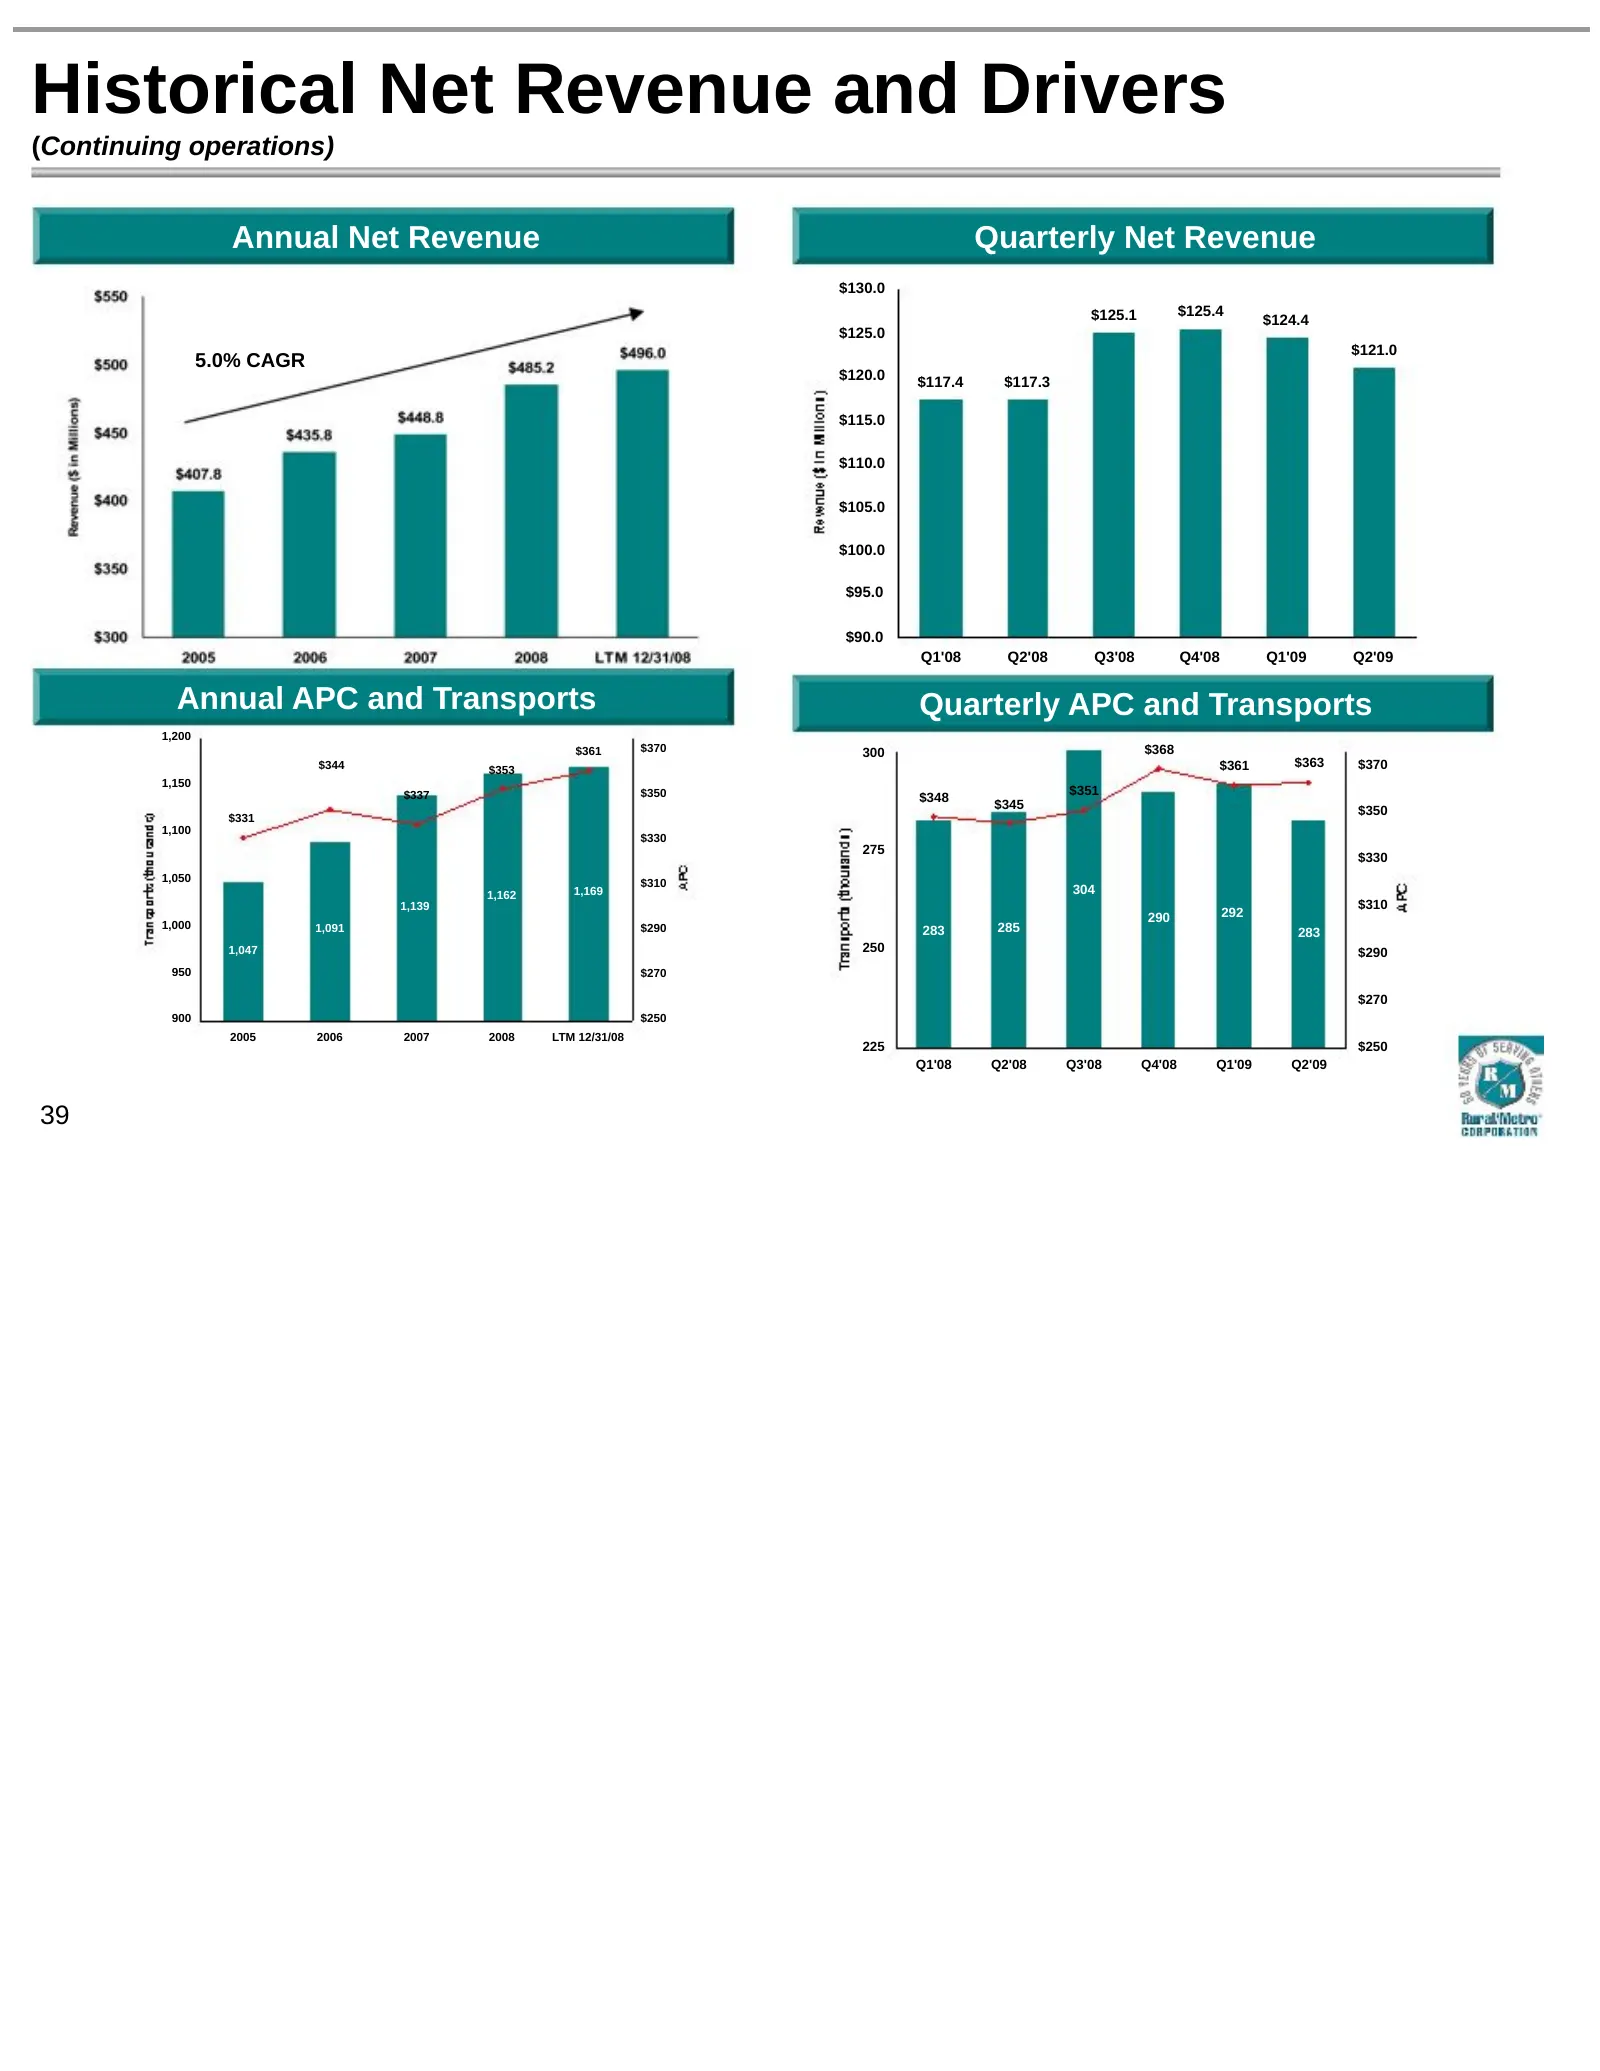
Historical Net Revenue and Drivers (Continuing operations) Annual Net Revenue Quarterly Net Revenue $130.0 $125.1 $125.4 $124.4 $125.0 $121.0 5.0% CAGR $120.0 $117.4 $117.3 $115.0 $110.0 $105.0 $100.0 $95.0 $90.0 Q1'08 Q2'08 Q3'08 Q4'08 Q1'09 Q2'09 Annual APC and Transports Quarterly APC and Transpo
Slide 40: Historical EBITDA and Margins
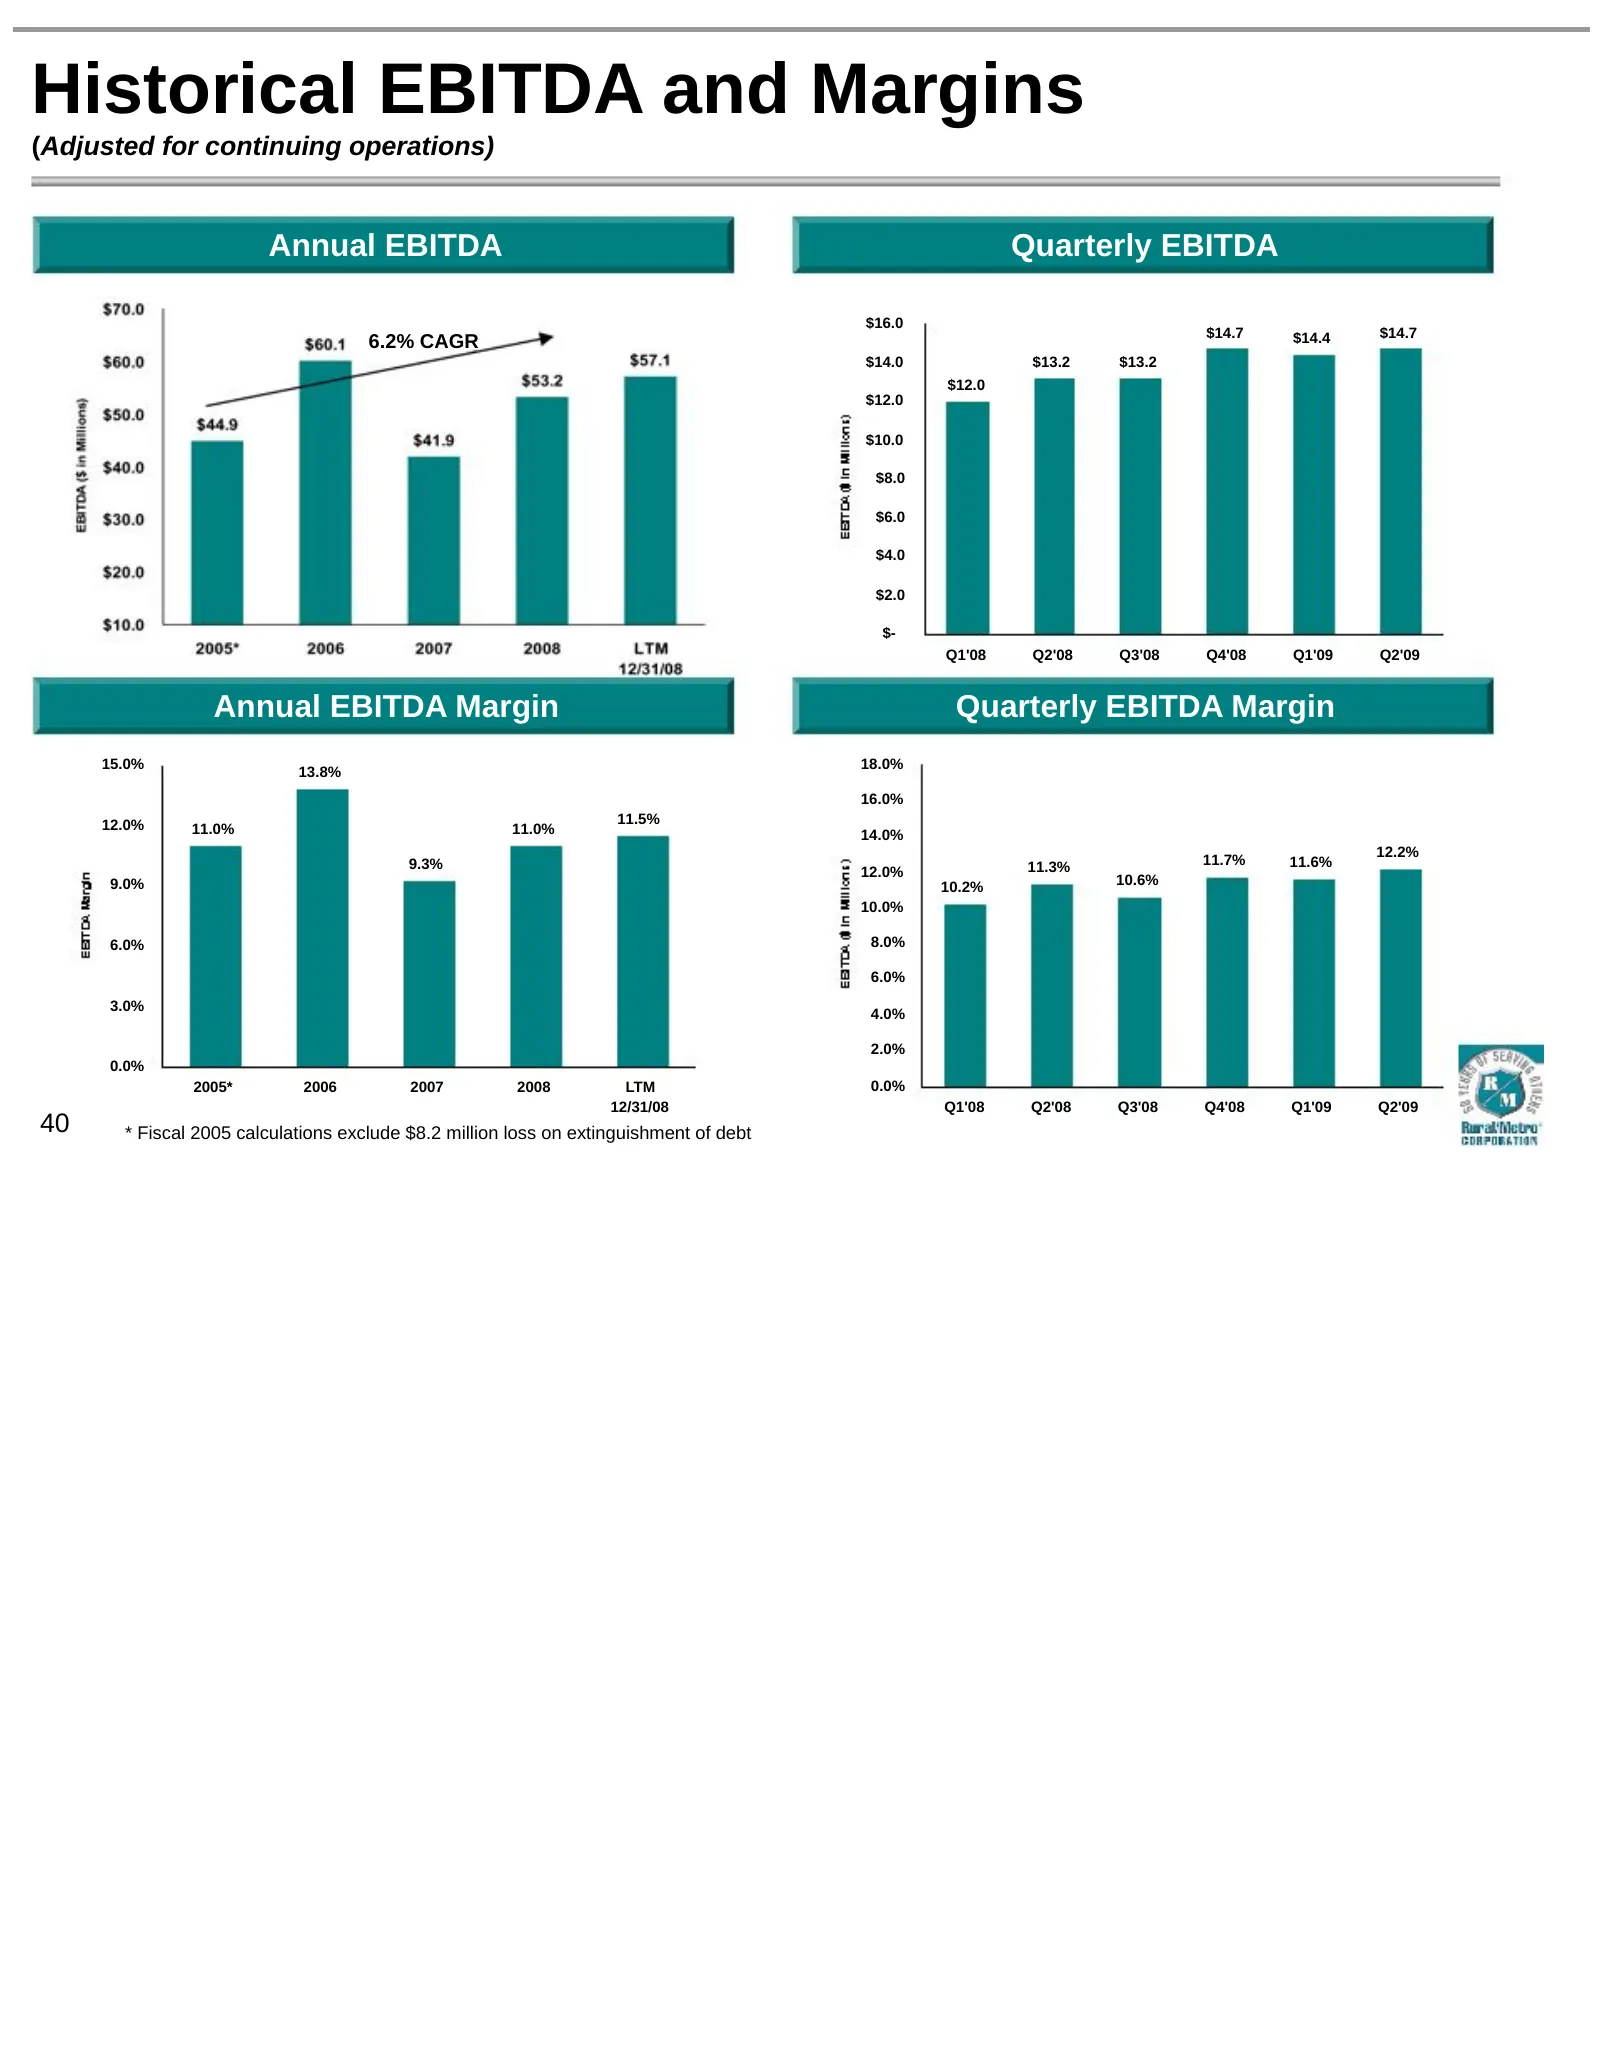
Historical EBITDA and Margins (Adjusted for continuing operations) Annual EBITDA Quarterly EBITDA $16.0 $14.7 $14.4 $14.7 6.2% CAGR $14.0 $13.2 $13.2 $12.0 $12.0 $10.0 $8.0 $6.0 $4.0 $2.0 $- Q1'08 Q2'08 Q3'08 Q4'08 Q1'09 Q2'09 Annual EBITDA Margin Quarterly EBITDA Margin 15.0% 18.0% 13.8% 16.0% 12.0
Slide 41: Continued Year Over Year Growth in 2009
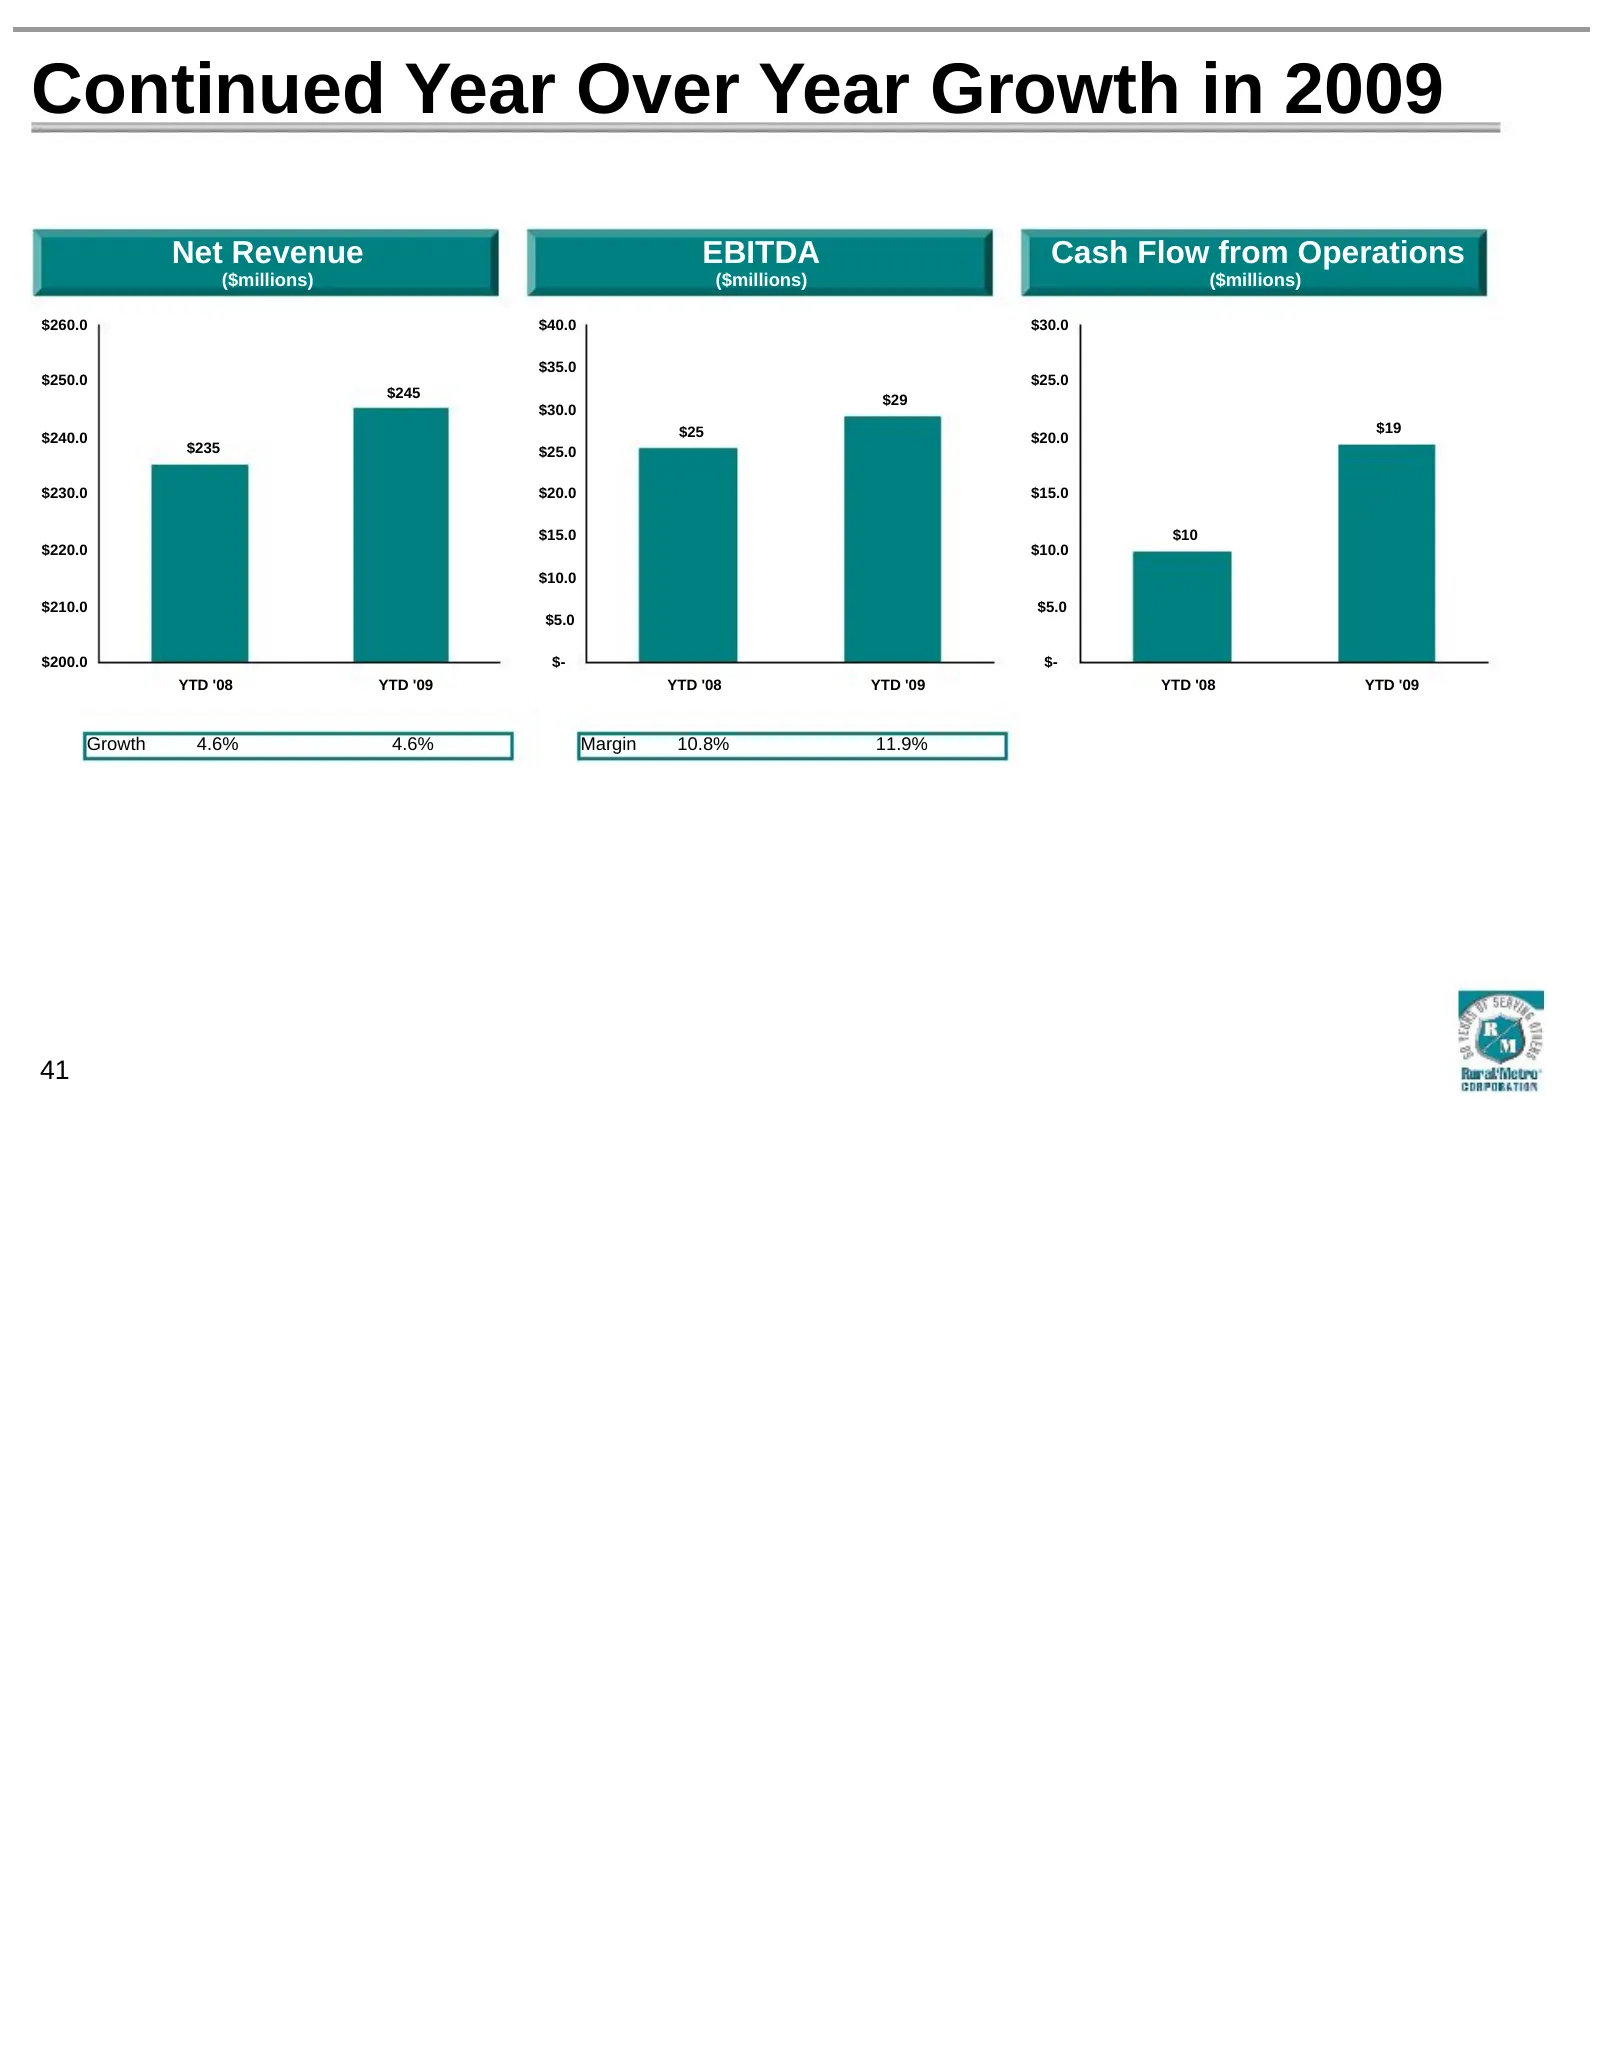
Continued Year Over Year Growth in 2009 Net Revenue EBITDA Cash Flow from Operations ($millions) ($millions) ($millions) $260.0 $40.0 $30.0 $35.0 $250.0 $25.0 $245 $29 $30.0 $25 $19 $240.0 $20.0 $235 $25.0 $230.0 $20.0 $15.0 $15.0 $10 $220.0 $10.0 $10.0 $210.0 $5.0 $5.0 $200.0 $- $- YTD '08 YTD '09
Slide 42: Other Financial Drivers (6 months ended 12/31/08)
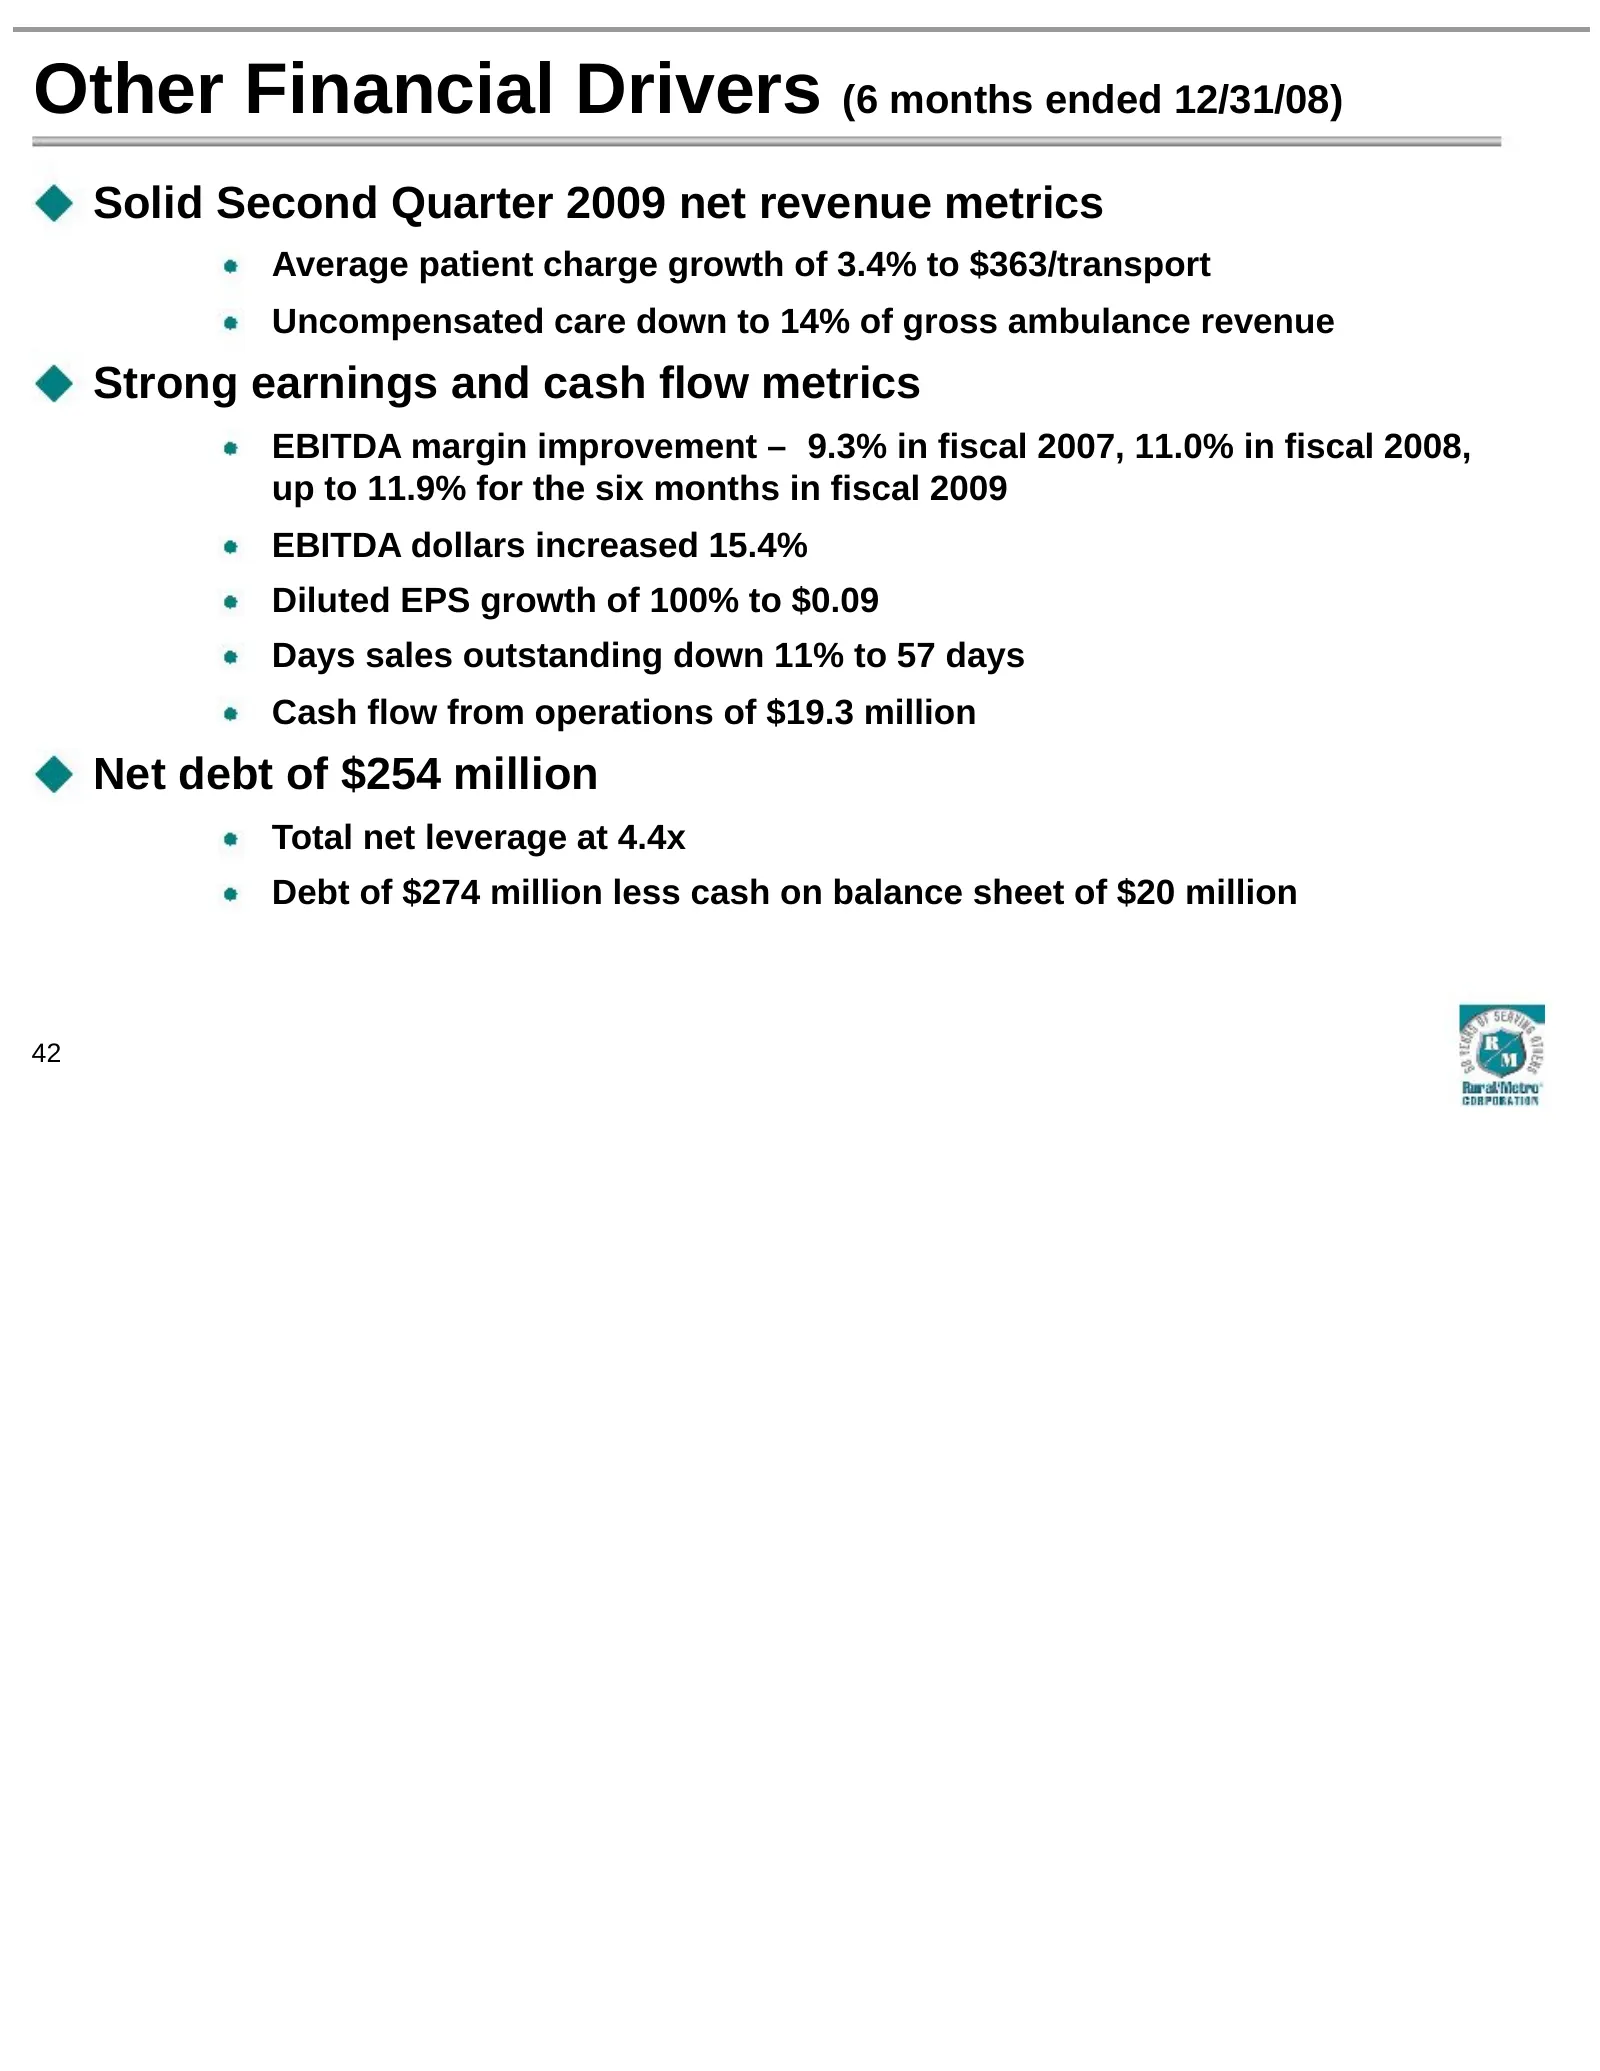
Other Financial Drivers (6 months ended 12/31/08) Solid Second Quarter 2009 net revenue metrics Average patient charge growth of 3.4% to $363/transport Uncompensated care down to 14% of gross ambulance revenue Strong earnings and cash flow metrics EBITDA margin improvement – 9.3% in fiscal 2007, 11.
Slide 43: Uncompensated Care
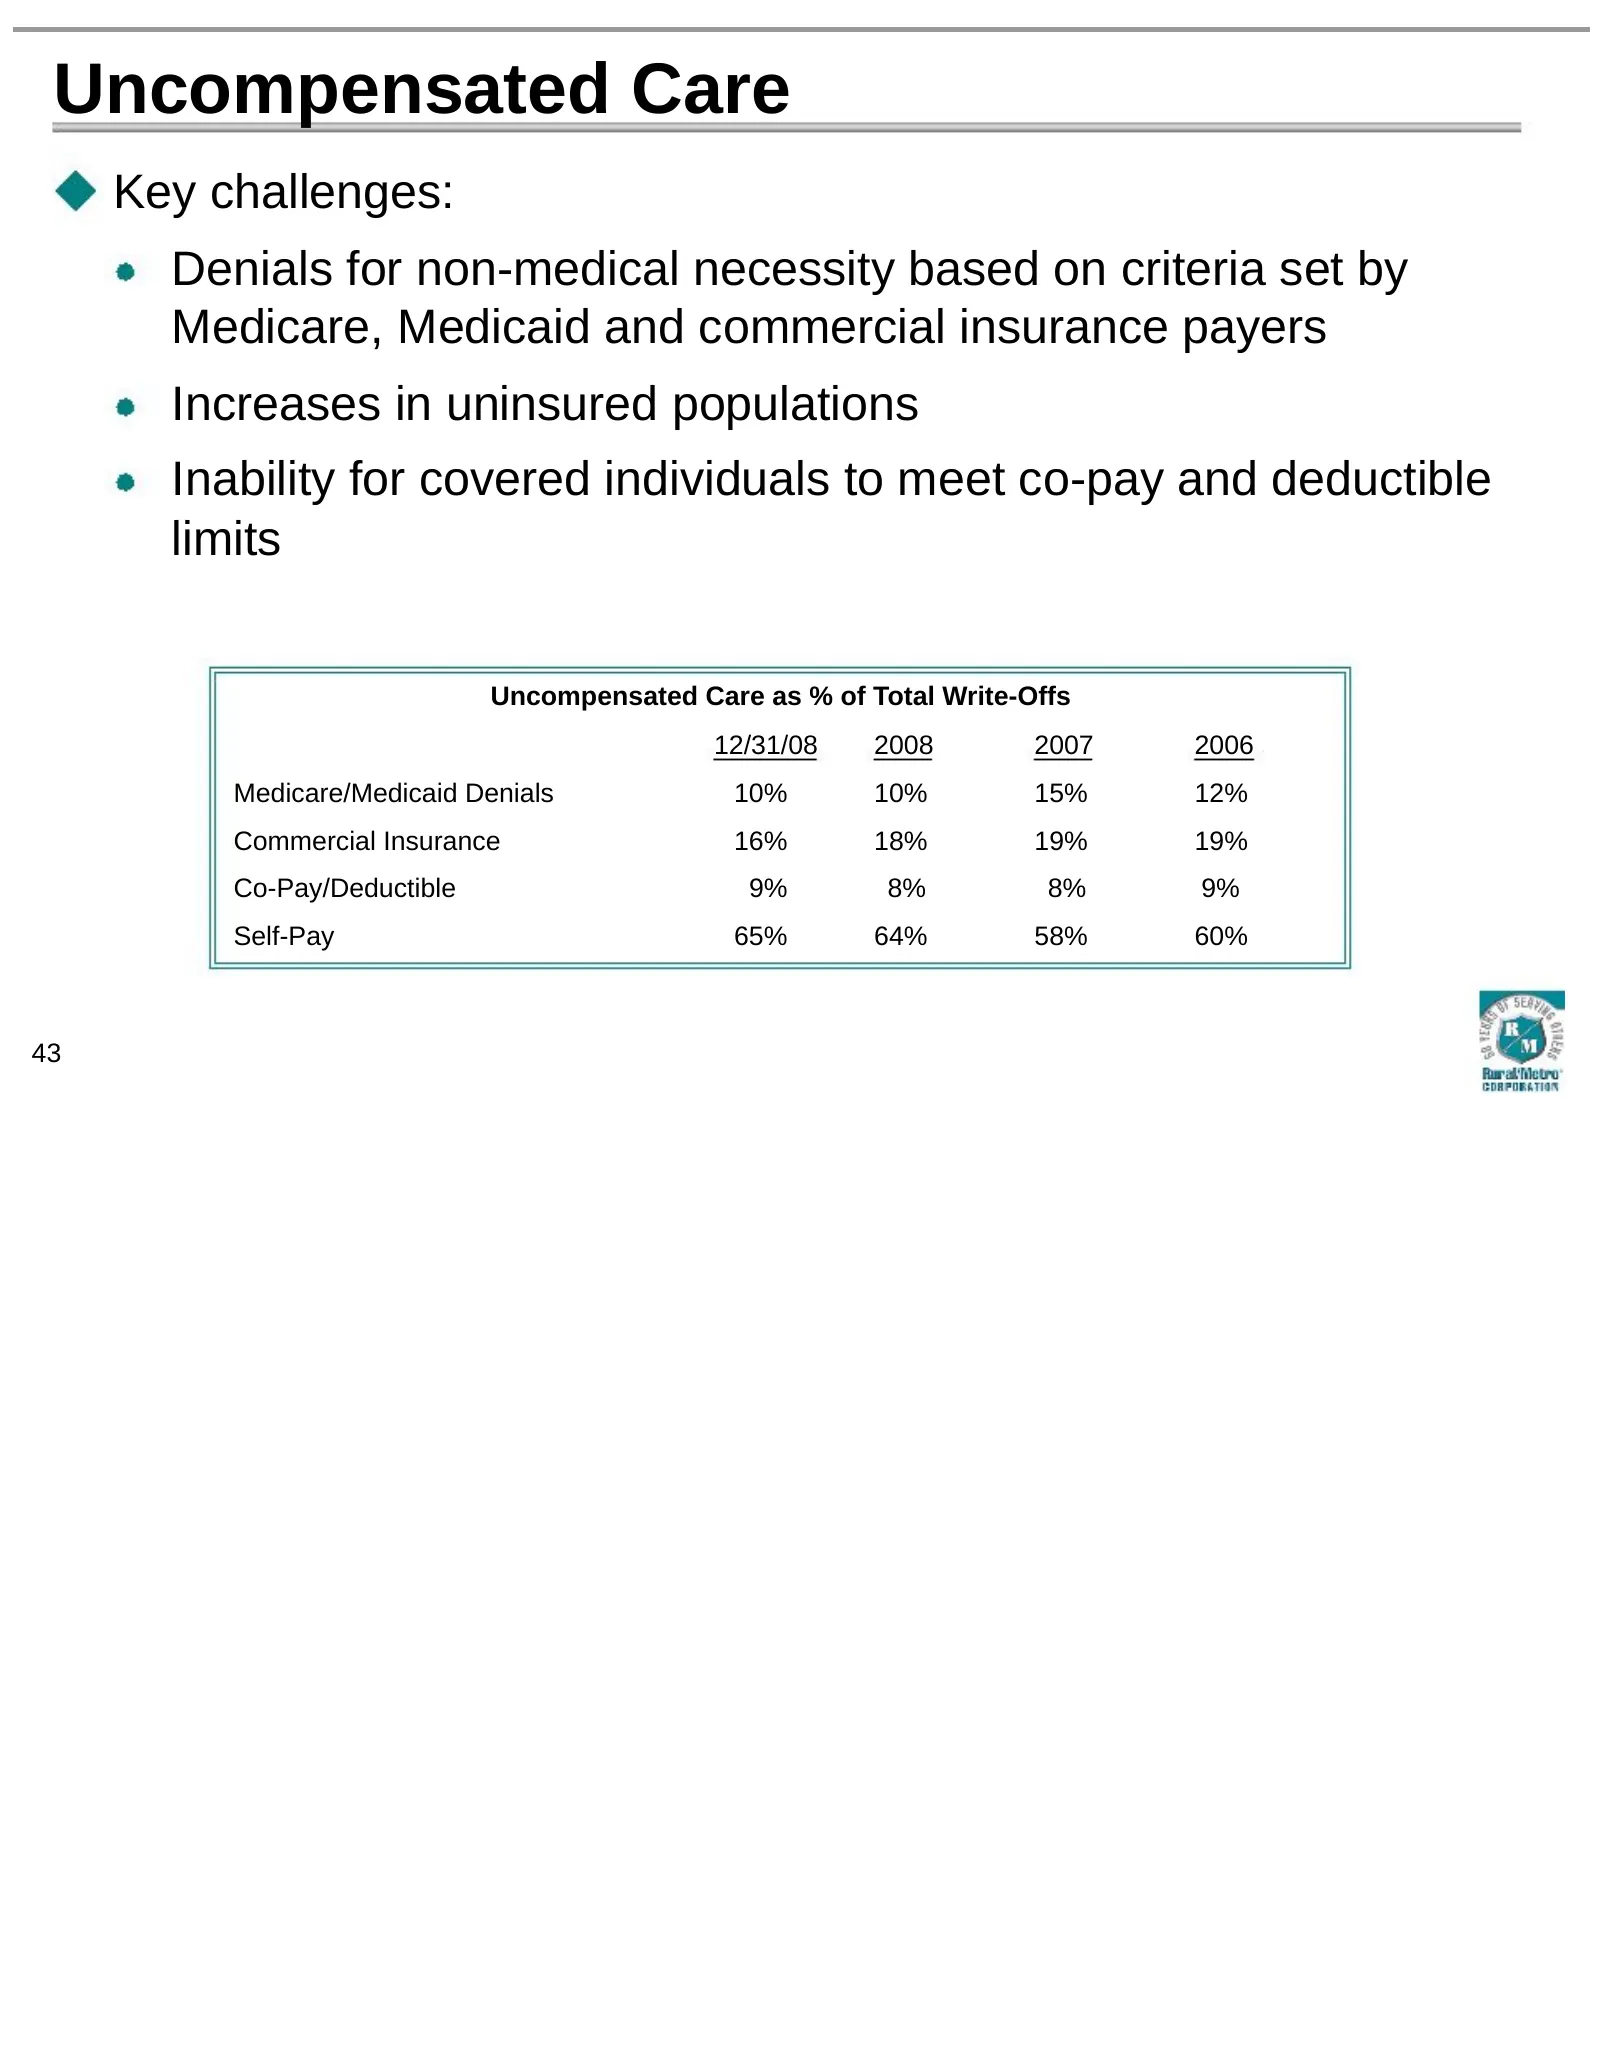
Uncompensated Care Key challenges: Denials for non-medical necessity based on criteria set by Medicare, Medicaid and commercial insurance payers Increases in uninsured populations Inability for covered individuals to meet co-pay and deductible limits Uncompensated Care as % of Total Write-Offs 12/31
Slide 44: Aggressive Management of Uncompensated Care
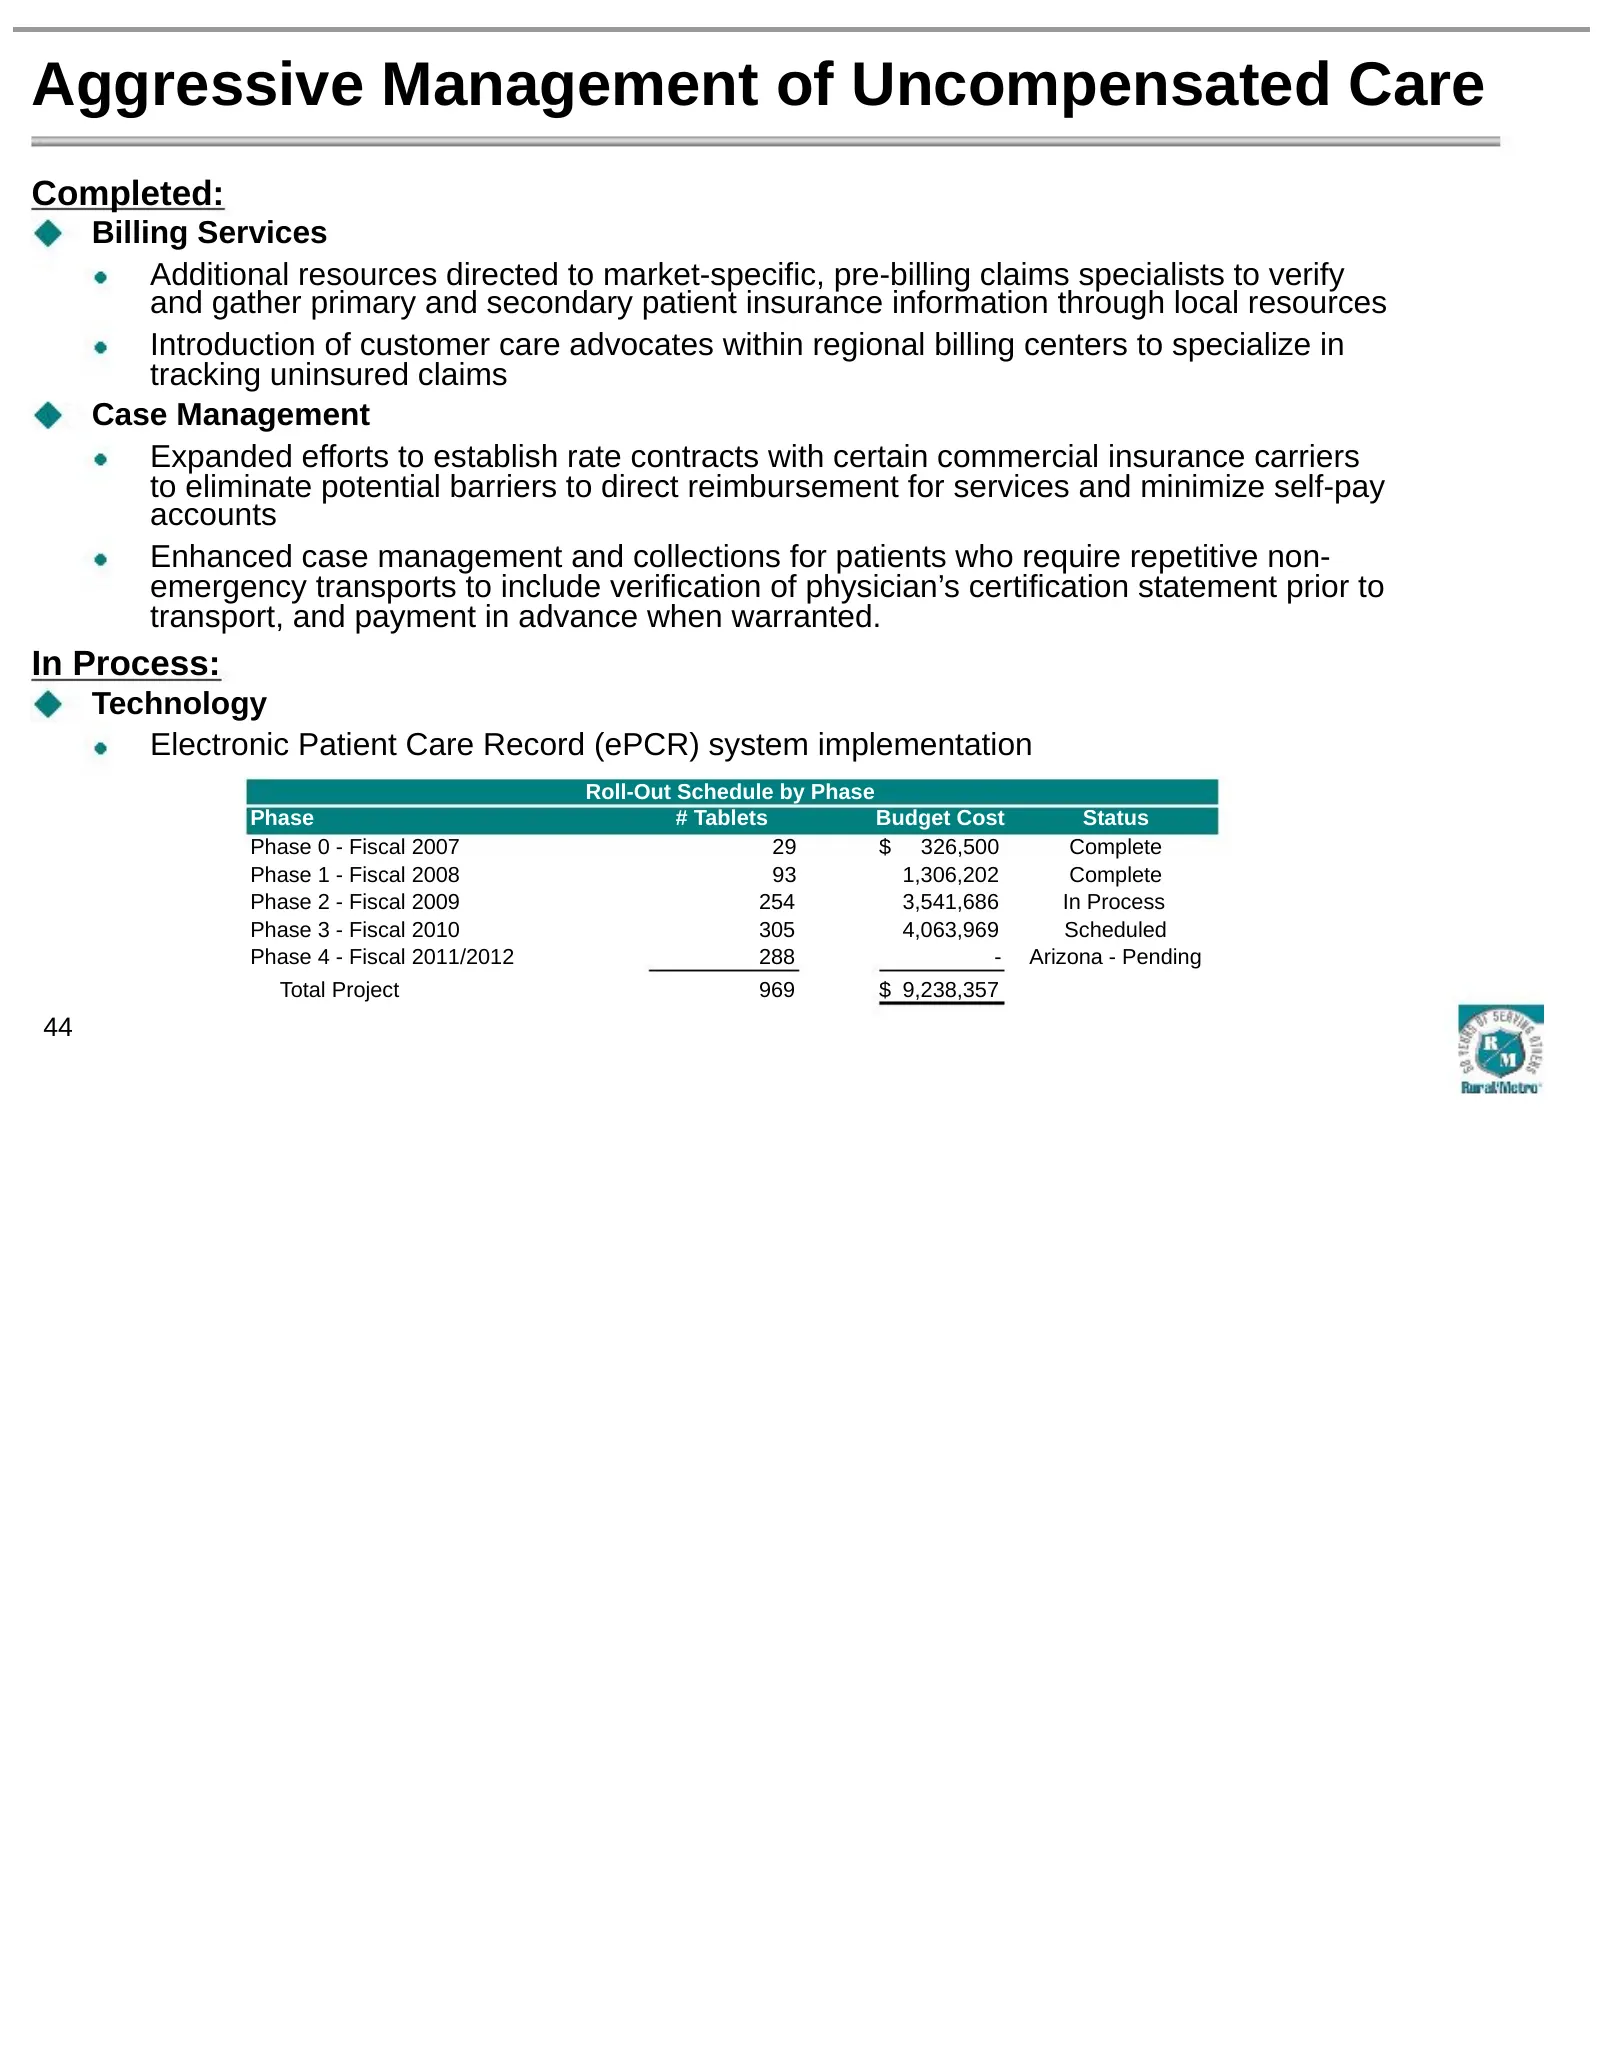
Aggressive Management of Uncompensated Care Completed: Billing Services Additional resources directed to market-specific, pre-billing claims specialists to verify and gather primary and secondary patient insurance information through local resources Introduction of customer care advocates within reg
Slide 45: ePCR Metrics & Documentation Quality
ePCR Metrics & Documentation Quality More than a dozen ePCR metrics being measured, including: Days to bill Service level mix Denied claims Uncompensated care In Western New York/Buffalo (largest ePCR installation to date), days to bill improved 50% in first six months. 5% shift in service level mix
Slide 46: Free Cash Flow & Liquidity
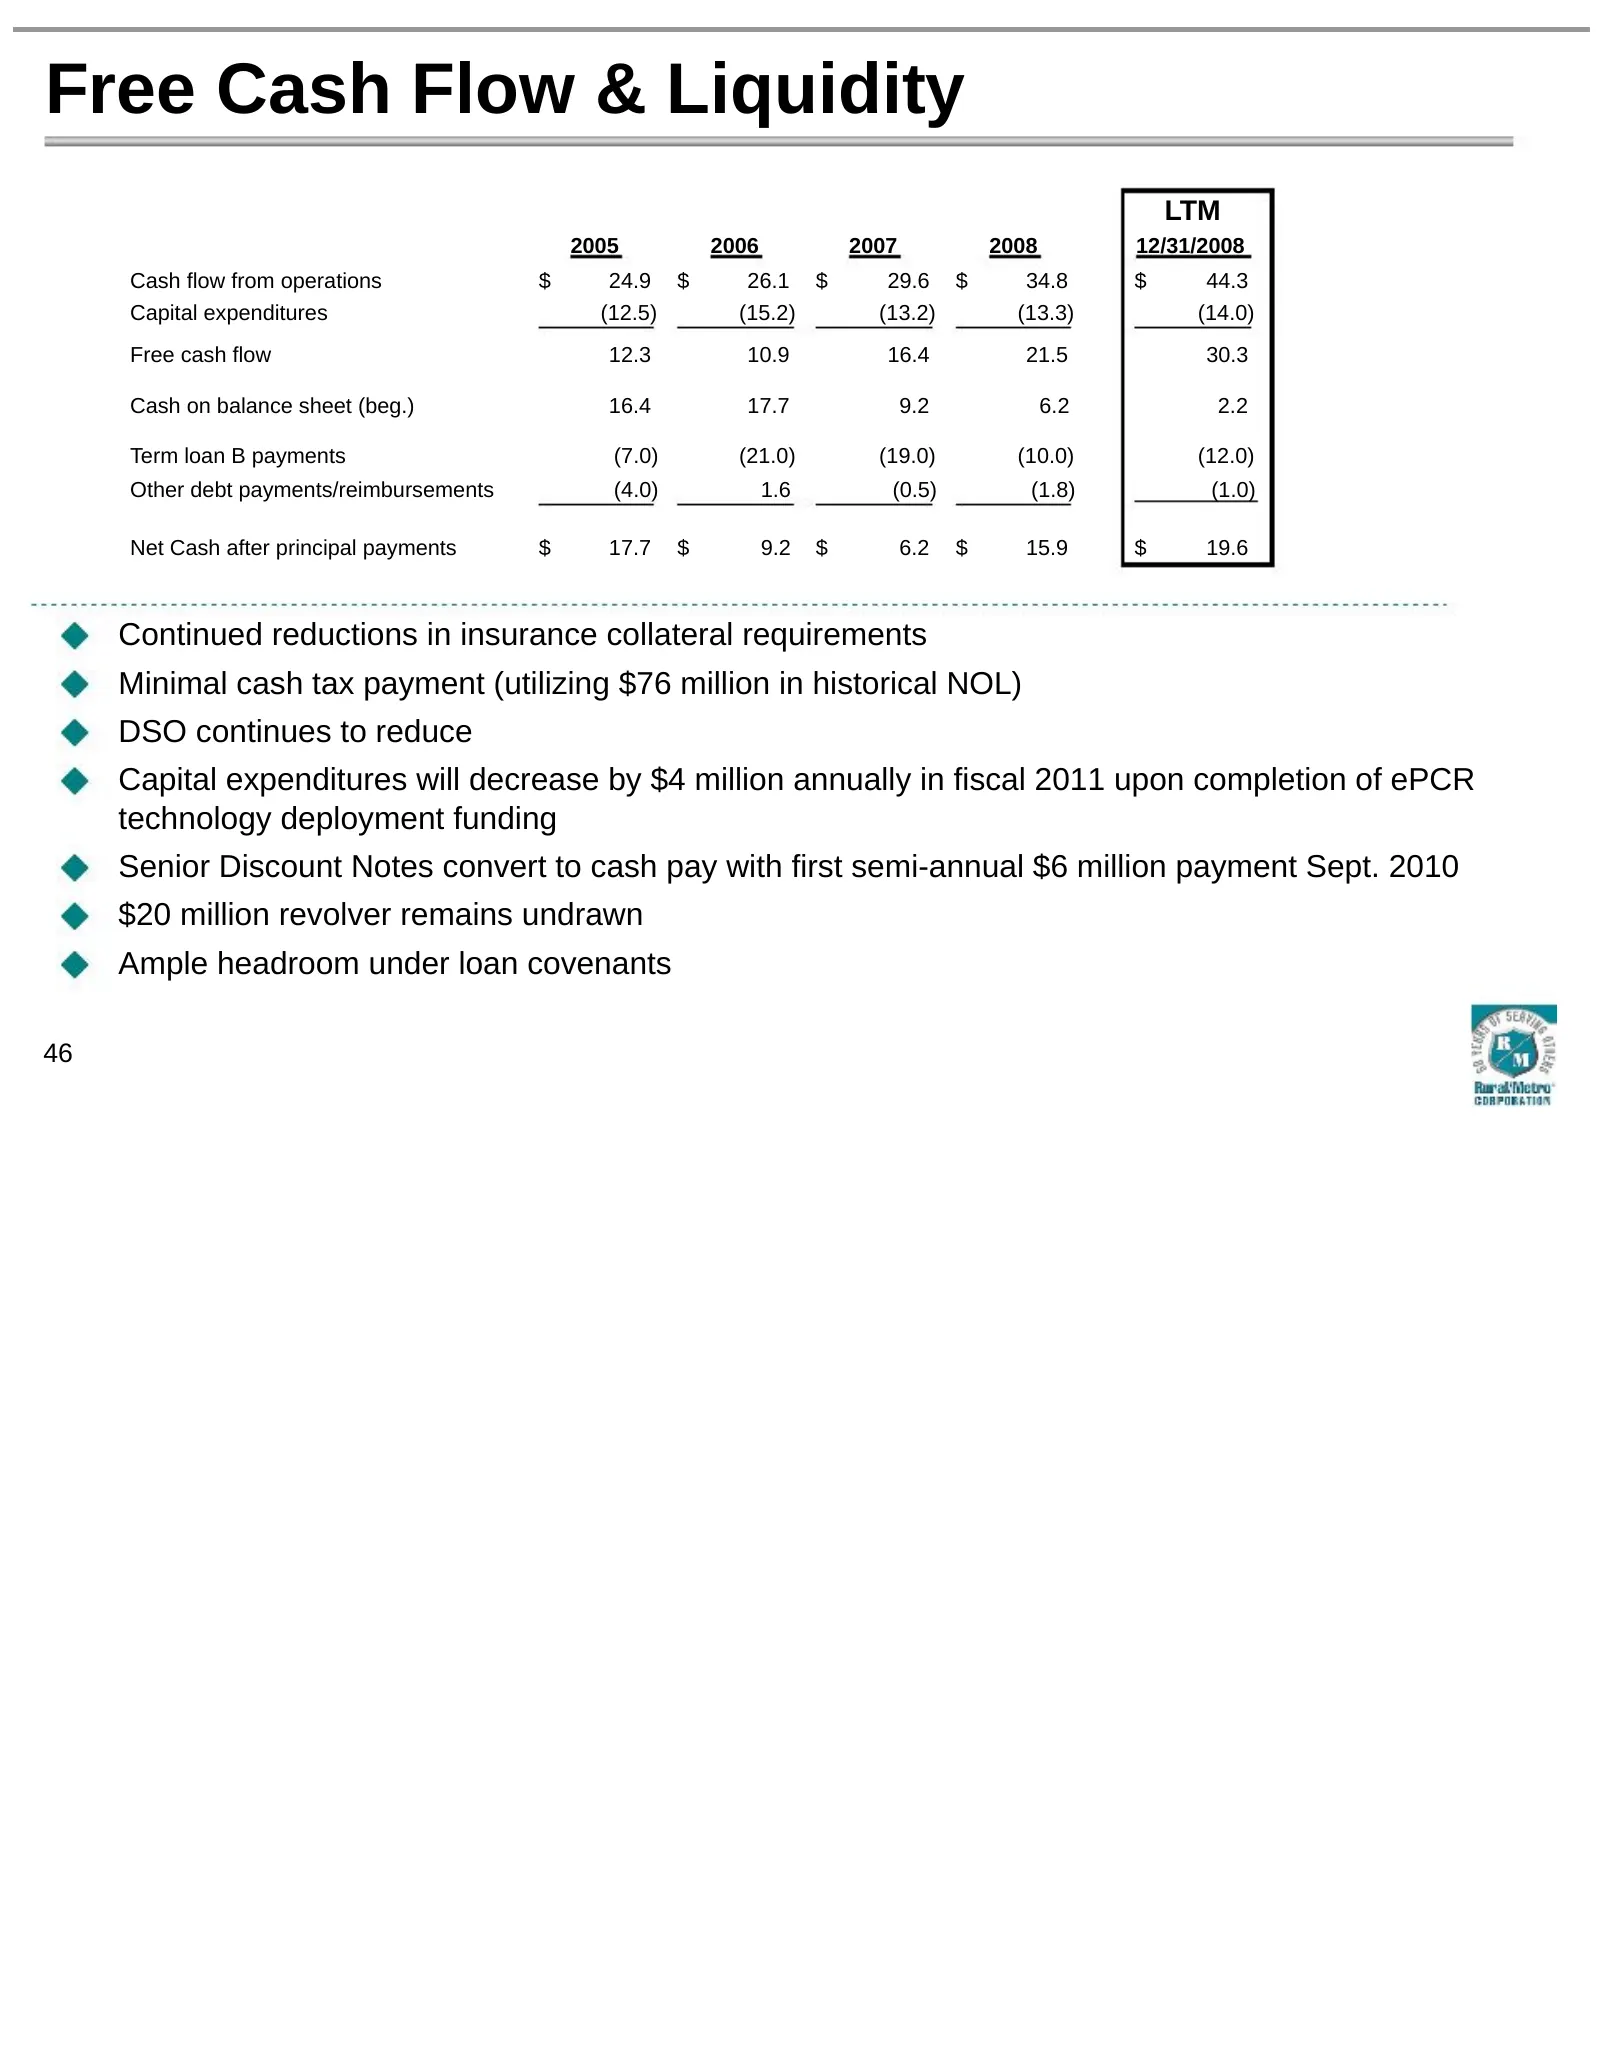
Free Cash Flow & Liquidity LTM 2005 2006 2007 2008 12/31/2008 Cash flow from operations $ 24.9 $ 26.1 $ 29.6 $ 34.8 $ 44.3 Capital expenditures (12.5) (15.2) (13.2) (13.3) (14.0) Free cash flow 12.3 10.9 16.4 21.5 30.3 Cash on balance sheet (beg.) 16.4 17.7 9.2 6.2 2.2 Term loan B payments (7.0) (21
Slide 47: Debt Structure
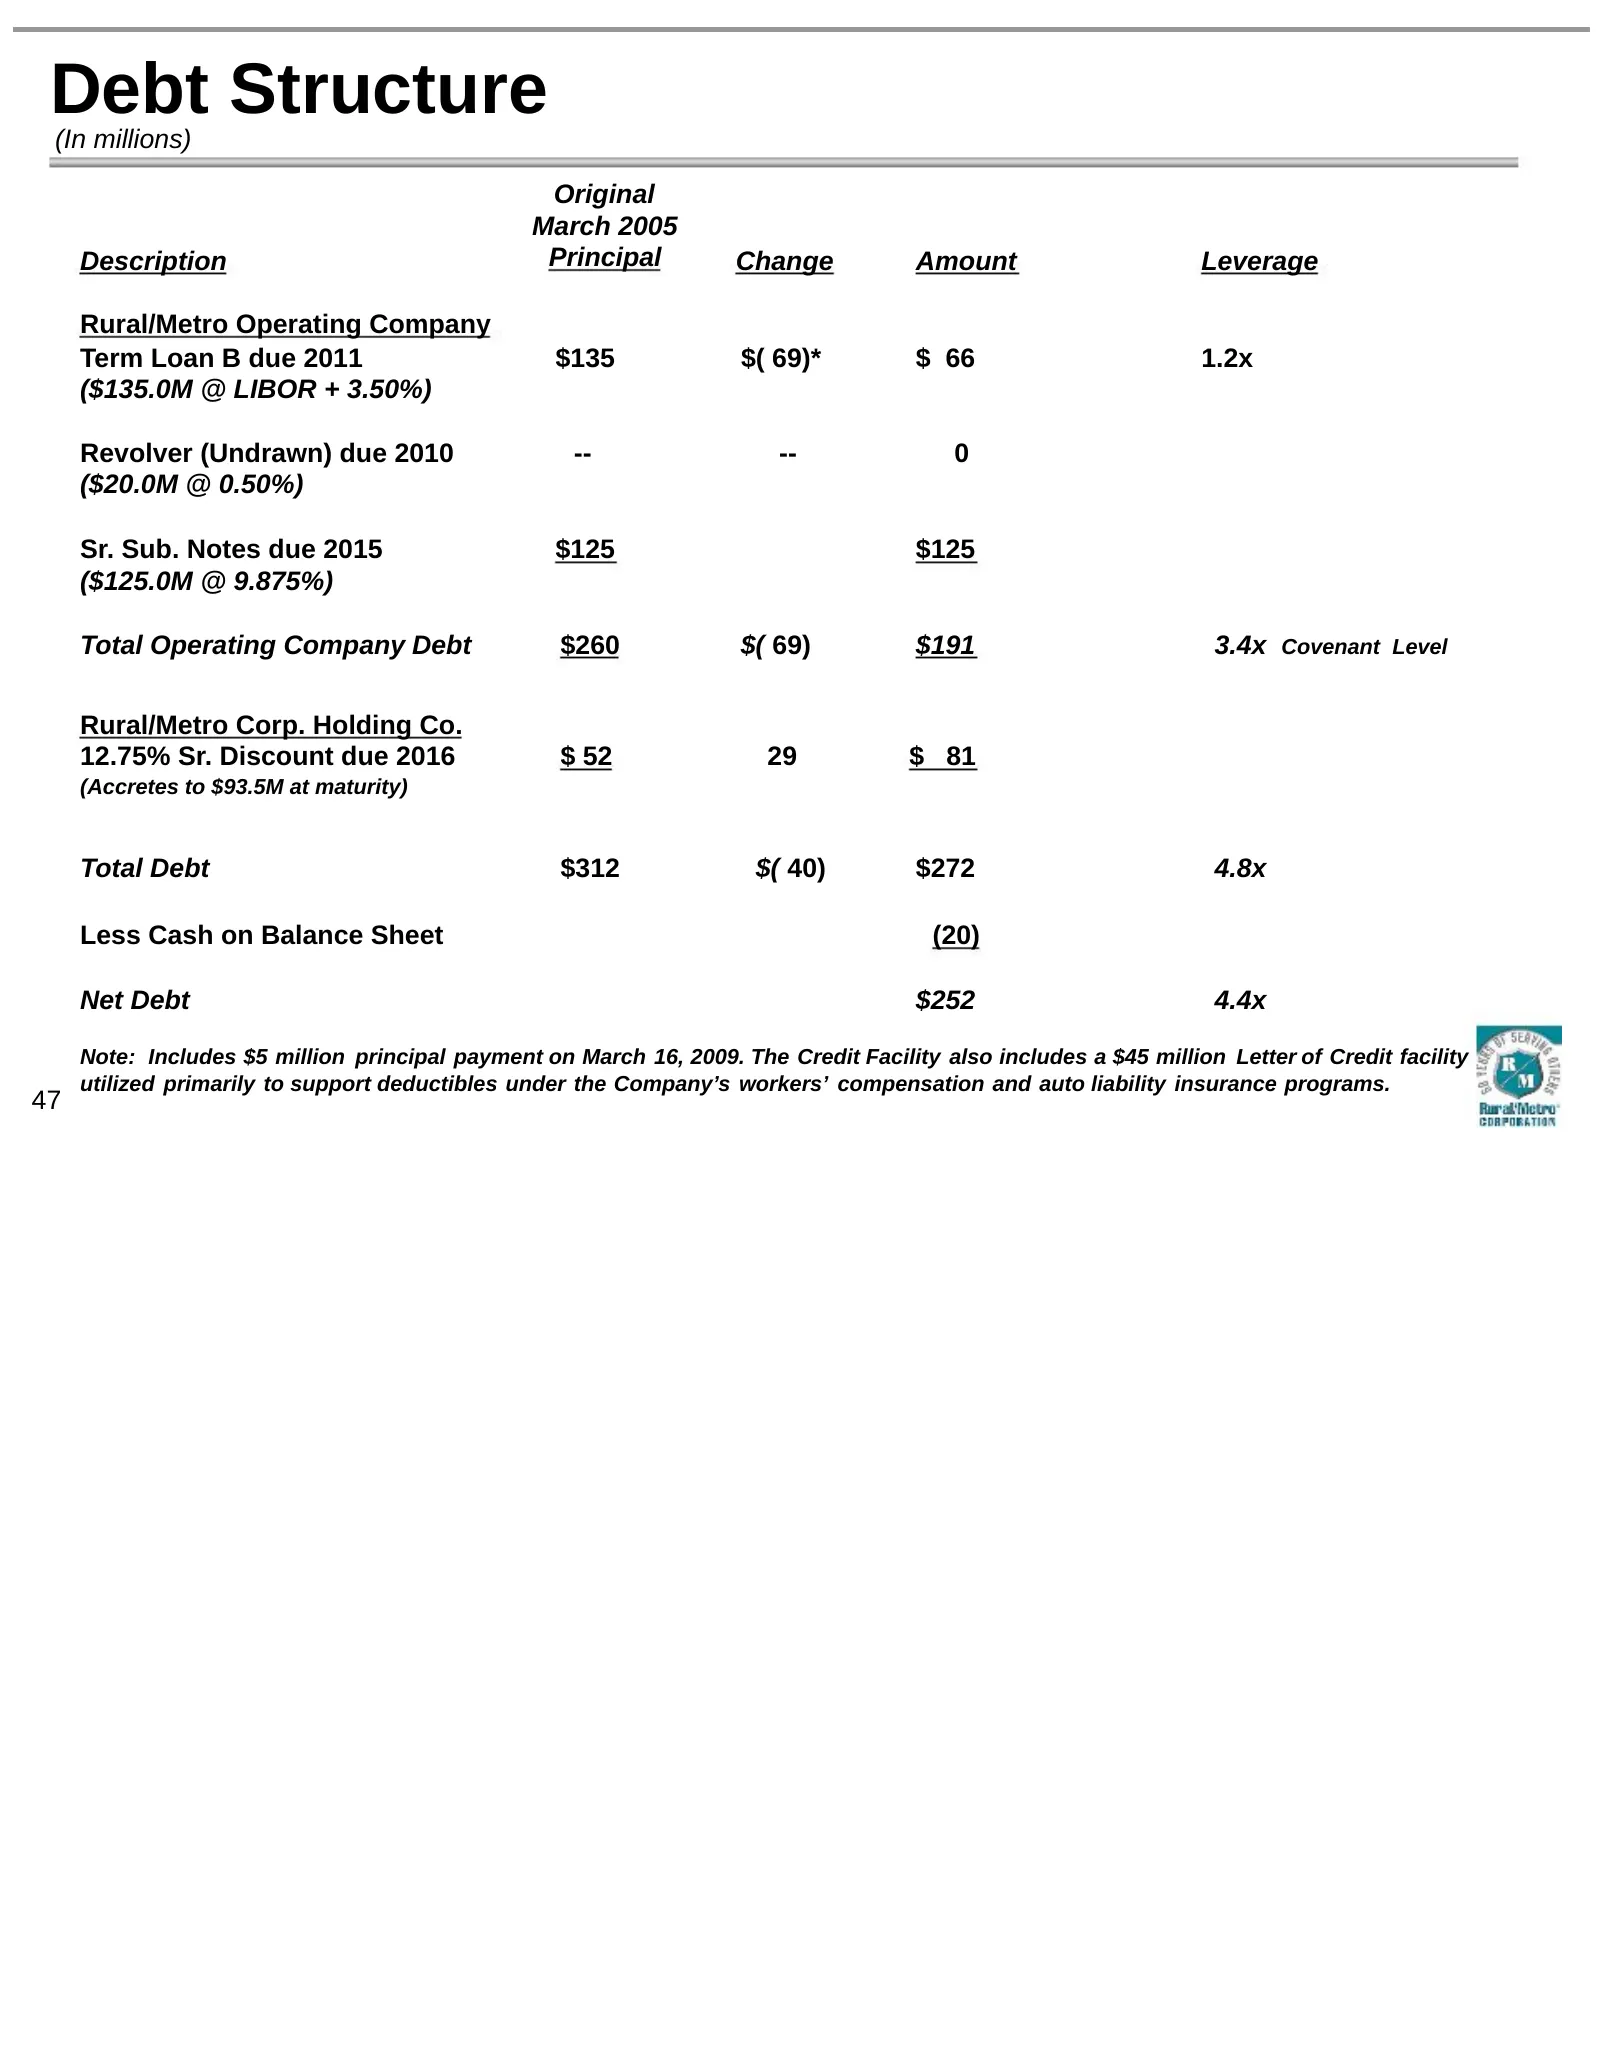
Debt Structure (In millions) Original March 2005 Description Principal Change Amount Leverage Rural/Metro Operating Company Term Loan B due 2011 $135 $( 69)* $ 66 1.2x ($135.0M @ LIBOR + 3.50%) Revolver (Undrawn) due 2010 -- -- 0 ($20.0M @ 0.50%) Sr. Sub. Notes due 2015 $125 $125 ($125.0M @ 9.875%)
Slide 48: Deleveraging History
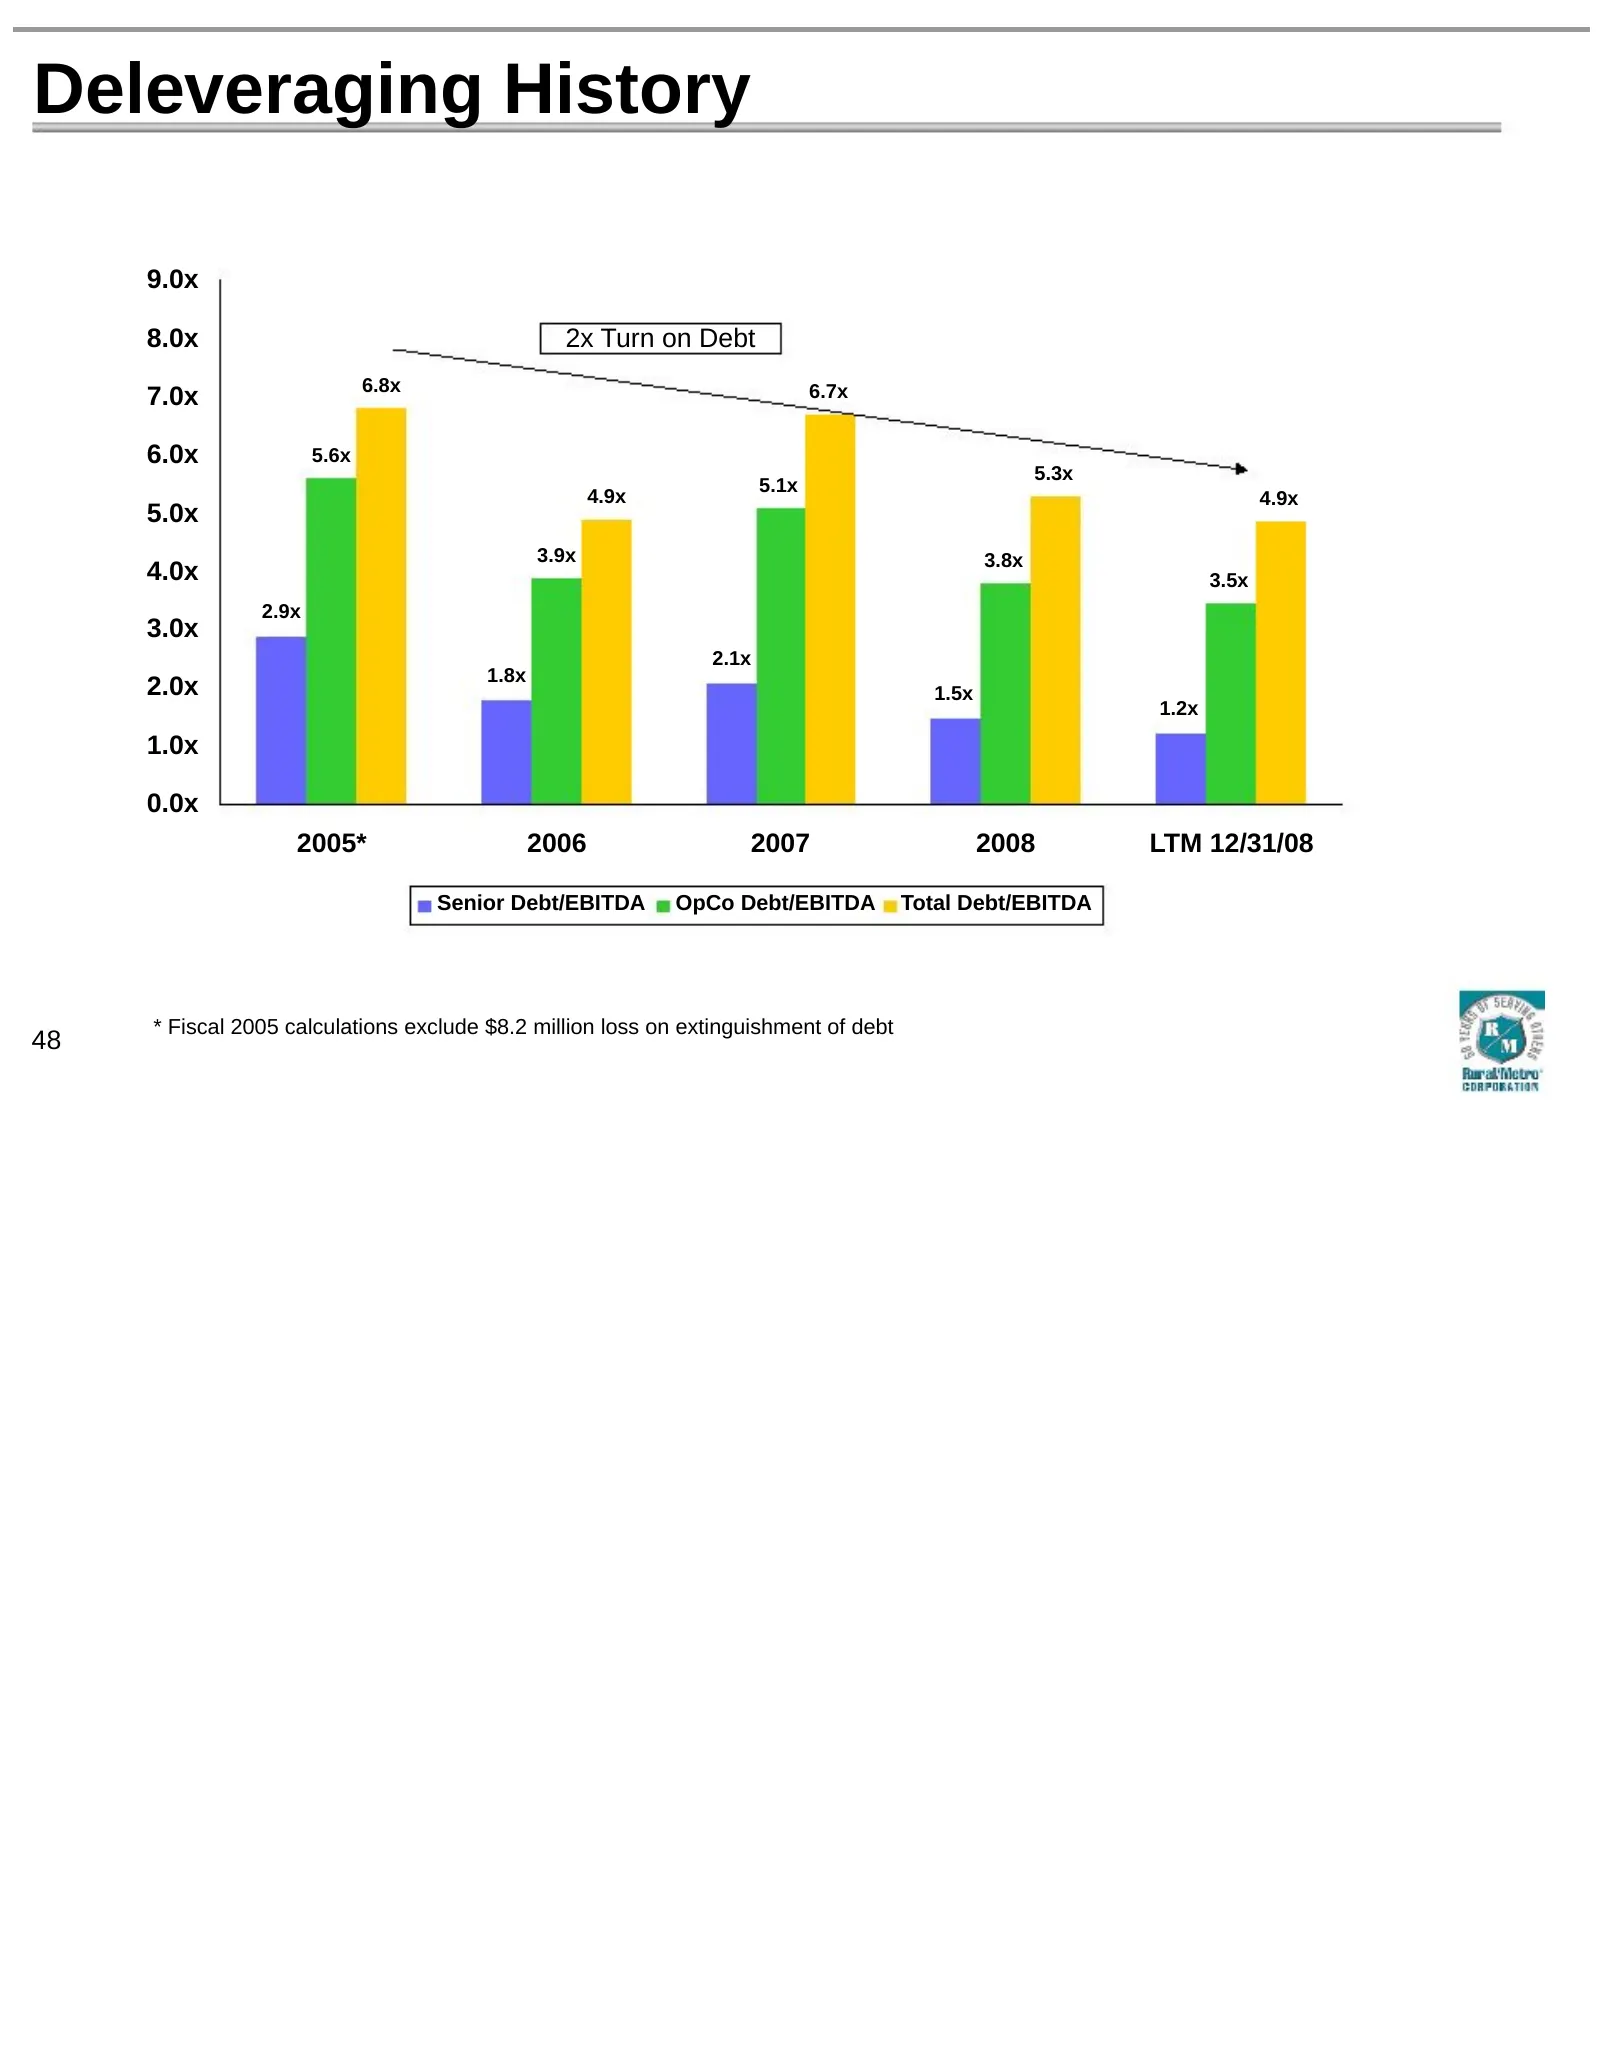
Deleveraging History 9.0x 8.0x 2x Turn on Debt 6.8x 6.7x 7.0x 6.0x 5.6x 5.3x 5.1x 4.9x 4.9x 5.0x 3.9x 3.8x 4.0x 3.5x 2.9x 3.0x 2.1x 1.8x 2.0x 1.5x 1.2x 1.0x 0.0x 2005* 2006 2007 2008 LTM 12/31/08 Senior Debt/EBITDA OpCo Debt/EBITDA Total Debt/EBITDA * Fiscal 2005 calculations exclude $8.2 million lo
Slide 49: Debt Strategies
Debt Strategies Extend maturities on current credit agreement (Letter of Credit Facility, Revolver, Term Loan B) – Continue to prepay principal Exchange offer to capture discount on bonds & note Seek amendment to credit agreement to loosen restriction on stock buybacks and other debt repayments Effe
Slide 50: Financial Summary
Financial Summary Favorable industry and reimbursement trends Preferred provider of choice – national presence Margin expansion opportunities APC growth Leveraging fixed labor base Track record of strong cash flow growth Continued compliance with all covenants – with LTM headroom of 20% Completed bi
Slide 51: Question-and-Answer Session
QUESTION-AND-ANSWER SESSION
Source: SEC EDGAR · 8-K filed Apr 2, 2009