Cbot — Merger or Acquisition (February 2004)
10 slides from Cbot's merger presentation, Feb 27, 2004

Slide 1
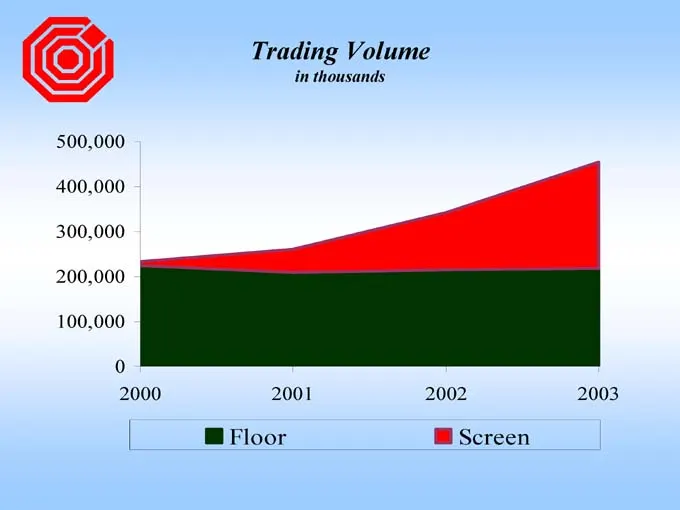
Slide 2: Trading Volume
Trading Volume in thousands 500,000 400,000 300,000 200,000 100,000 2000 2001 2002 2003 @ Floor @ Screen
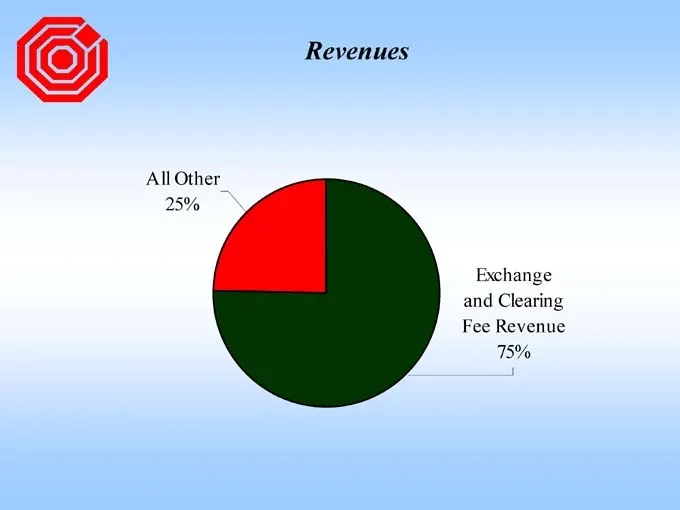
Slide 3: Revenues
Revenues All Other 25% Exchange and Clearing Fee Revenue 75%
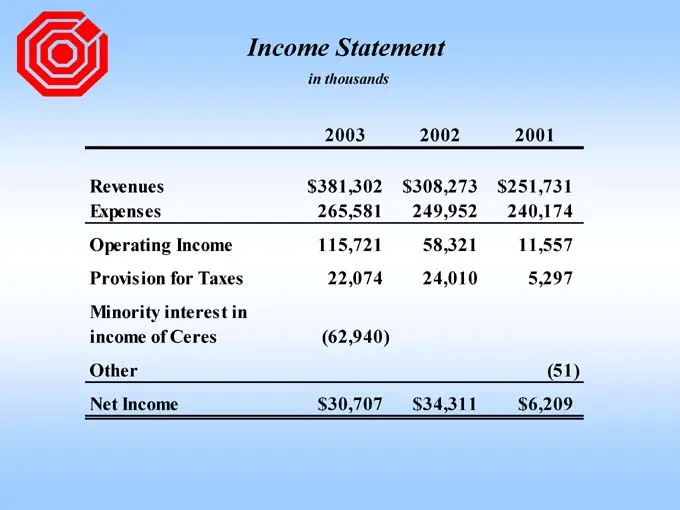
Slide 4: Income Statement
Income Statement 2003 2002 2001 Revenues $ 381,302 $ 308,273 $ 251,731 Expenses 265,581 249,952 240,174 Operating Income 115,721 58,321 11,557 Provision for Taxes 22,074 24,010 5,297 Minority interest in income of Ceres (62,940) Other (51) Net Income $30,707 $34,311 $6,209
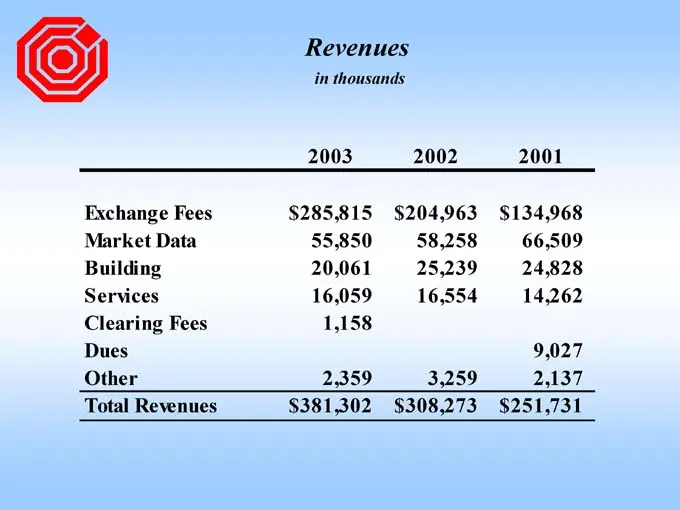
Slide 5: Revenues
Revenues 2003 2002 2001 Exchange Fees $ 285,815 $ 204,963 $ 134,968 Market Data 55,850 58,258 66,509 Building 20,061 25,239 24,828 Services 16,059 16,554 14,262 Clearing Fees 1,158 Dues 9,027 Other 2,359 3,259 2,137 Total Revenues $ 381,302 $ 308,273 $ 251,731
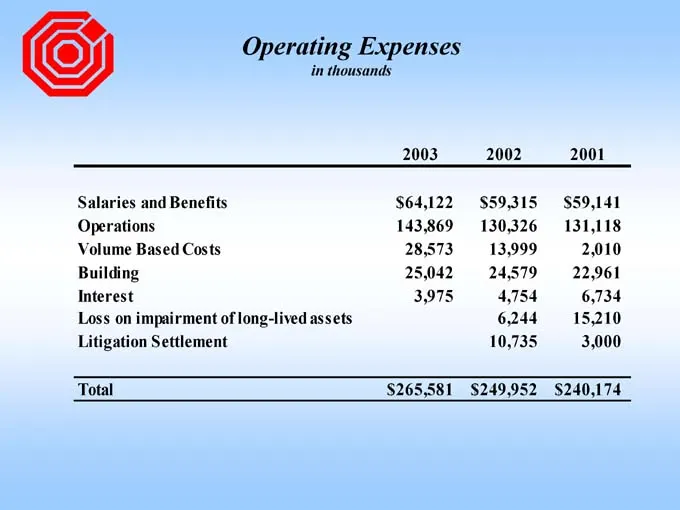
Slide 6: Operating Expenses
Operating Expenses 2003 2002 2001 Salaries and Benefits $ 64,122 $ 59,315 $ 59,141 Operations 143,869 130,326 131,118 Volume Based Costs 28,573 13,999 2,010 Building 25,042 24,579 22,961 Interest 3,975 4,754 6,734 Loss on impairment of long-lived assets 6,244 15,210 Litigation Settlement 10,735 3,00
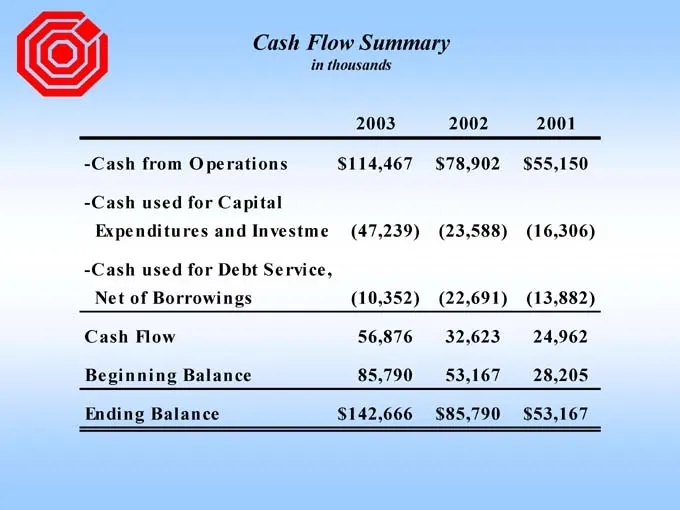
Slide 7: Cash Flow Summary
Cash Flow Summary 2003 2002 2001 -Cash from Operations $ 114,467 $ 78,902 $ 55,150 -Cash used for Capital Expenditures and Investme (47,239) (23,588) (16,306) -Cash used for Debt Service, Net of Borrowings (10,352) (22,691) (13,882) Cash Flow 56,876 32,623 24,962 Beginning Balance 85,790 53,167 28,2
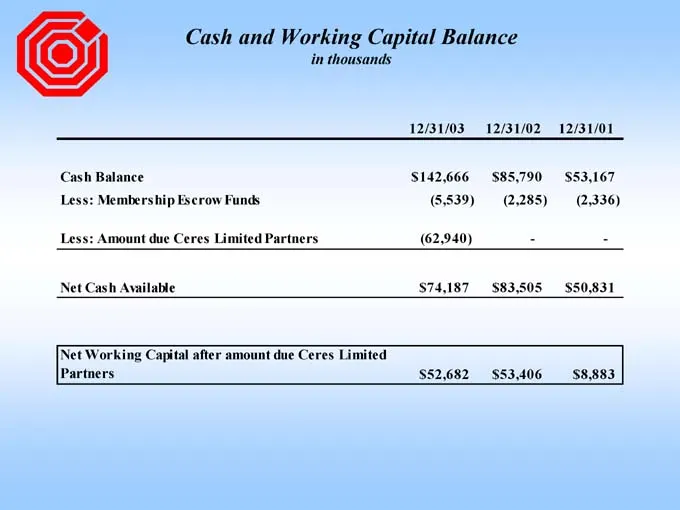
Slide 8: Cash and Working Capital Balance
Cash and Working Capital Balance 12/31/03 12/31/02 12/31/01 Cash Balance $ 142,666 $ 85,790 $ 53,167 Less: Membership Escrow Funds (5,539) (2,285) (2,336) Less: Amount due Ceres Limited Partners (62,940) - - Net Cash Available $ 74,187 $ 83,505 $ 50,831 Net Working Capital after amount due Ceres Lim
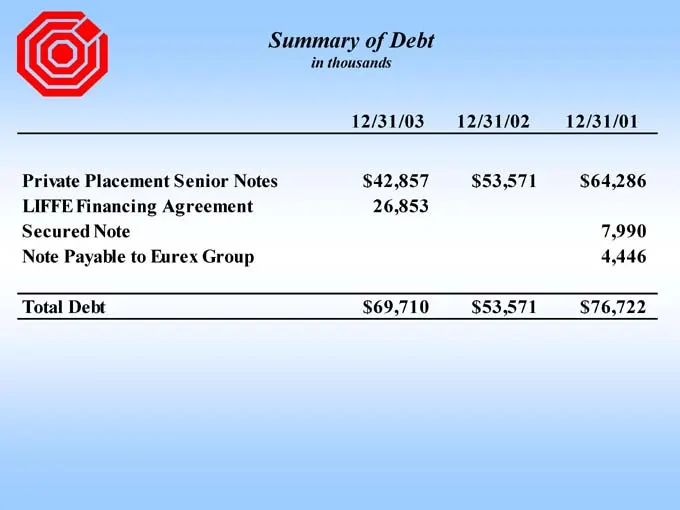
Slide 9: Summary of Debt
Summary of Debt 12/31/03 12/31/02 12/31/01 Private Placement Senior Notes $ 42,857 $ 53,571 $ 64,286 LIFFE Financing Agreement 26,853 Secured Note 7,990 Note Payable to Eurex Group 4,446 Total Debt $ 69,710 $ 53,571 $ 76,722

Slide 10: Consolidated Financial Statements and Independent Auditors' Report
Board of Trade of the City of Chicago, Inc. and Subsidiaries Consolidated Financial Statements for the Years Ended December 31, 2003 and 2002 and Independent Auditors’ Report BOARD OF TRADE OF THE CITY OF CHICAGO, INC. AND SUBSIDIARIES TABLE OF CONTENTS Page INDEPENDENT AUDITORS’ REPORT FINANCIAL ST
Source: SEC EDGAR · 425 filed Feb 27, 2004
More decks from Cbot Holdings Inc
 Cbot Holdings — Merger or Acquisition (June 2007)18 slides · Jun 28, 2007
 Merger or Acquisition (June 2007)30 slides · Jun 26, 2007
 Merger or Acquisition (June 2007)20 slides · Jun 26, 2007
 Cbot Holdings — Merger or Acquisition (June 2007)24 slides · Jun 25, 2007
 Merger or Acquisition (June 2007)29 slides · Jun 22, 2007
 William Blair Annual Growth Stock Conference 200743 slides · Jun 20, 2007