Cbot — William Blair Annual Growth Stock Conference 2007
43 slides from Cbot's conference presentation, Jun 20, 2007
Slide 1: CBOT Holdings, Inc. at William Blair Annual Growth Stock Conference
CBOT Holdings, Inc. William Blair Annual Growth Stock Conference June 20, 2007 Bernard Dan, President and Chief Executive Officer
Slide 2: Forward-looking statements and important merger information
JUNE 20, 2007 Certain statements in this presentation may contain forward-looking statements within the meaning of the Private Securities Litigation Reform Act of 1995 and includes any use of the words “may,” “should,” “could,” “expects,” “plans,” “anticipates,” “believes,” “estimates,” “predicts,”
Slide 3: Market leader: futures and options on futures
Market leader: Futures and options on futures #2 in United States #3 in World
Slide 4: Overview
Overview Industry Trends Growth Strategies Financial Review Merger Update
Slide 5: Intensifying global competition among futures, cash and OTC markets
Intensifying global competition among futures, cash and over-the-counter markets Industry Trends Globalization Rapid international growth Technological advances Increased trading speed Shifts in production and consumption Industry consolidation
Slide 6: Large, Expanding Market, Strong Secular Trends
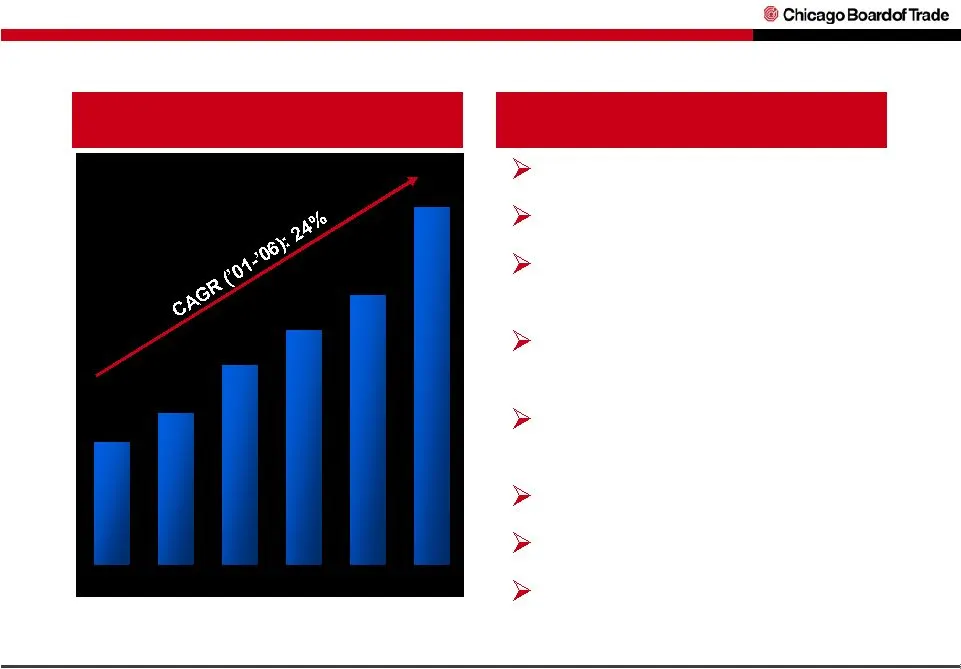
2.1 2.6 3.4 4.0 4.6 6.1 2001 2002 2003 2004 2005 2006 Global Futures & Options on Futures Contract Volume (billions of contracts) Secular Growth Drivers Large, Expanding Market Strong Secular Trends Source: Futures Industry Association Note: Excludes options on individual equities Technological Adva
Slide 7: Strong Operating Leverage: Record volume and earnings
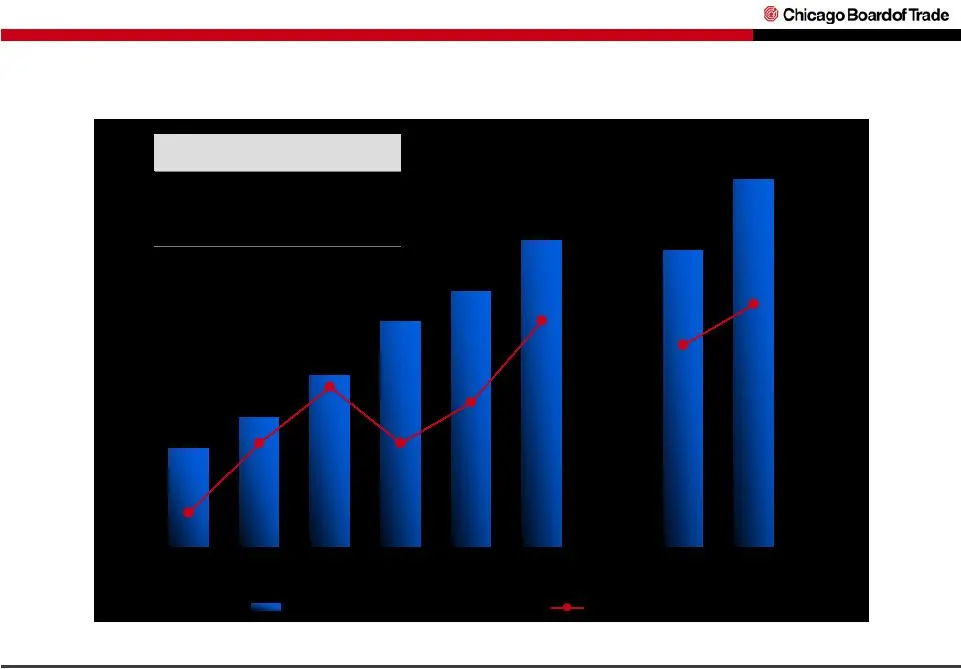
0 500 1,000 1,500 2,000 2,500 3,000 3,500 4,000 2001 2002 2003 2004 2005 2006 1Q06 1Q07 0% 25% 50% 75% Average Daily Volume (000's) Operating Margin (%) Revenues 20% Expenses 8% 1,037 1,365 1,804 2,372 2,677 3,211 3,108 3,866 7% 20% 31% 20% 28% 44% 40% 48% Strong Operating Leverage: Record volume an
Slide 8: 2006 Record Year
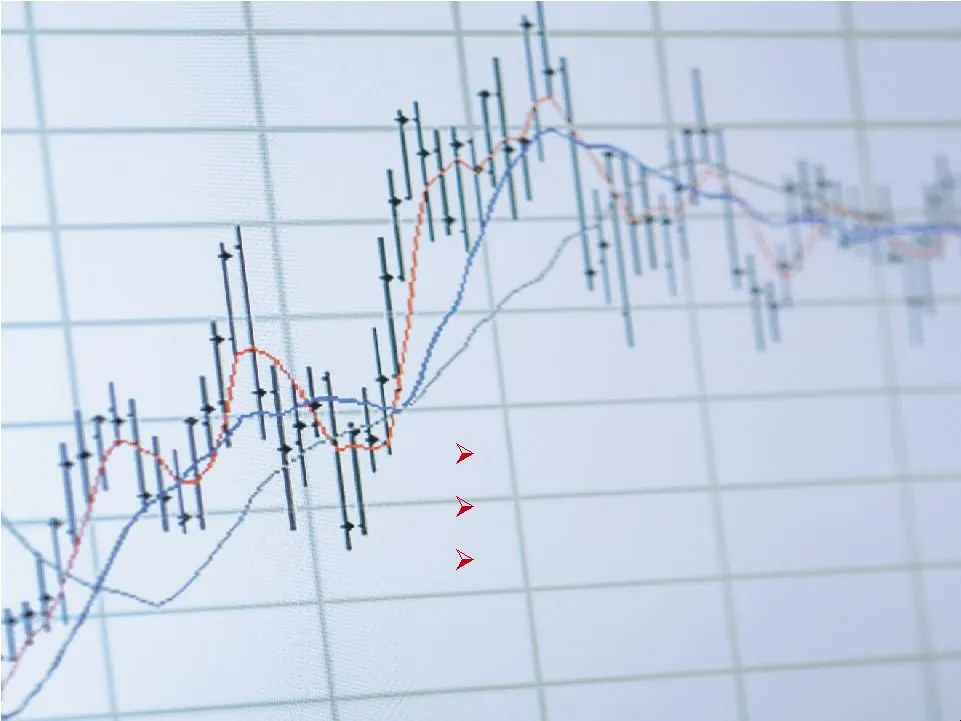
Trading volume up 20% Revenues increased 35% Net income grew 125% 2006 Record Year
Slide 9: CBOT and CME Shareholder Benefits
Well-Positioned in Dynamic Global Industry Stronger Base to Build Core Derivatives Business Accretive Transaction Platform for Product Innovation and Growth Synergy Opportunities Significant User Benefits Substantial Benefits Transaction expected to create value for shareholders of both companies CB
Slide 10: CBOT: Growth Strategies
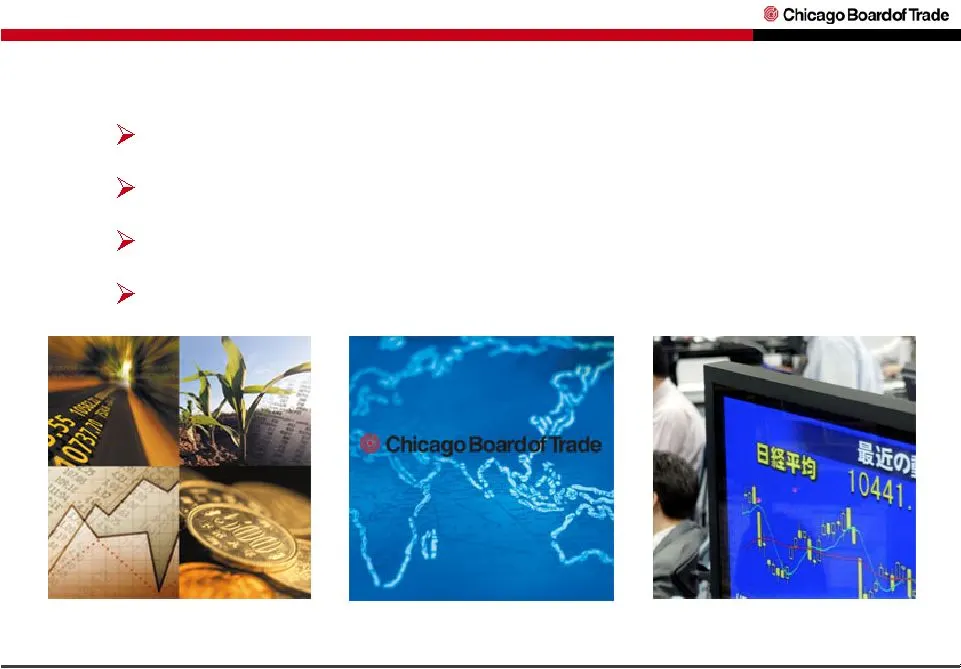
CBOT: Growth Strategies Product enhancements Product innovation Global expansion Leveraging technology
Slide 11: Growth Strategies: Product Enhancements
Growth Strategies: Product Enhancements Growth in 5 and 10-Year Swap Futures Strong growth since Citigroup and Goldman Sachs began providing liquidity July 3, 2006 Through June 15, 2007 ADV up 178 percent Fourth quarter 2006 ADV up 57 percent Third quarter 2006 ADV up 44 percent
Slide 12: Growth Strategies: Product Innovation
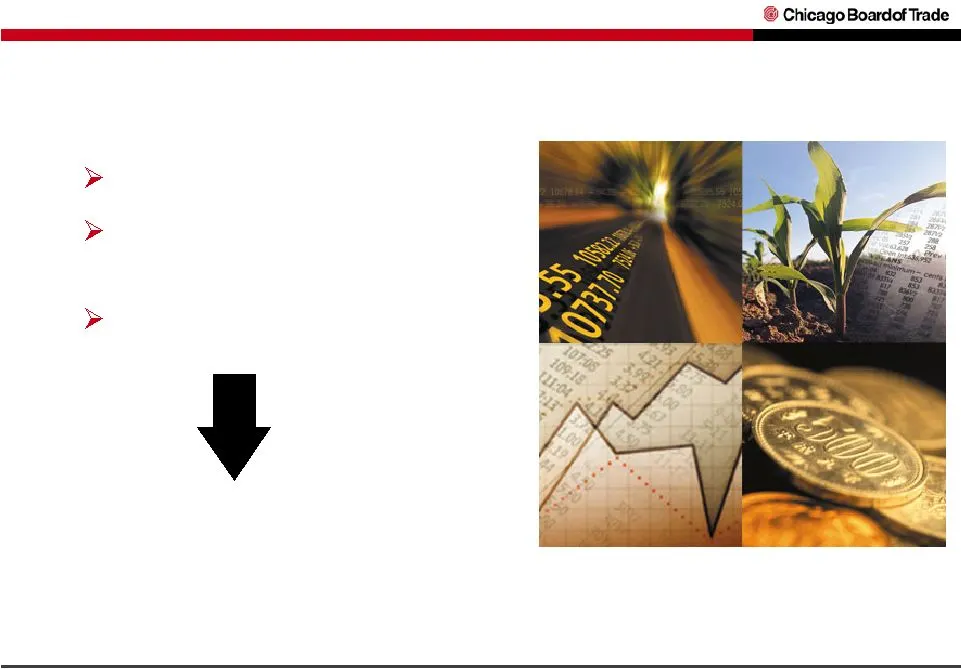
Growth Strategies: Product Innovation Seven new products in 2006 Address customer needs Respond to changing marketplace trends Anticipate a future need
Slide 13: Seven New Products in 2006
Seven New Products in 2006 Full-Sized Gold Options Silver Options $25 Big Dow Futures Soybean Crush Options Binary Options Growth Strategies: Product Innovation Ethanol Dow Jones AIG Excess return Commodity Index
Slide 14: New Products in 2007
New Products in 2007 Dow Jones SM U.S. Real Estate Index SM Futures 30-year Interest Rate Swap Futures CBOT CDR Liquid TM North American Investment Grade Futures (to launch June 25, 2007) Growth Strategies: Product Innovation

Slide 15: Expanding Global Reach
Expanding Global Reach
Slide 16: Agriculture Complex Growth Rate
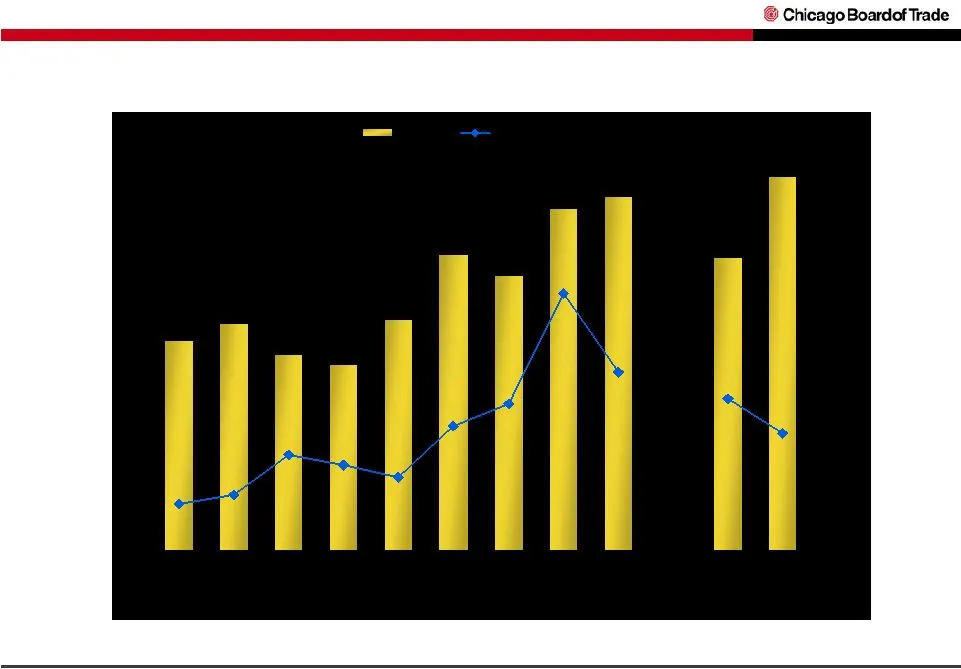
373 404 350 331 412 529 490 611 631 523 668 0 100 200 300 400 500 600 700 1Q05 2Q05 3Q05 4Q05 1Q06 2Q06 3Q06 4Q06 1Q07 Q206 QTD* Q207 QTD* -20 0 20 40 60 80 100 120 140 ADV Growth vs. Pr Yr % Thousands Agriculture Complex Growth Rate *Thru June 15
Slide 17: Agricultural Futures Trading Volume – % Electronic
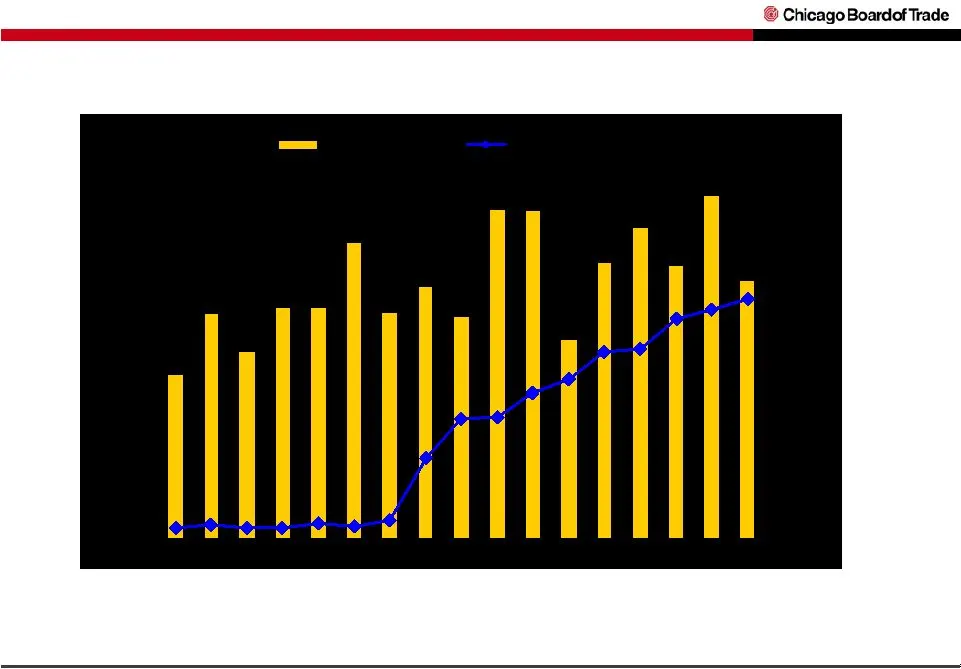
- 2,000 4,000 6,000 8,000 10,000 12,000 14,000 Jan-06 Apr-06 Jul-06 Oct-06 Jan-07 Apr-07 Thousands 0% 20% 40% 60% 80% 100% Total Ag Futures % Electronic Ag Futures Agricultural Futures Trading Volume – % Electronic Side-by-Side Trading of Agricultural Futures Started 08/01/06
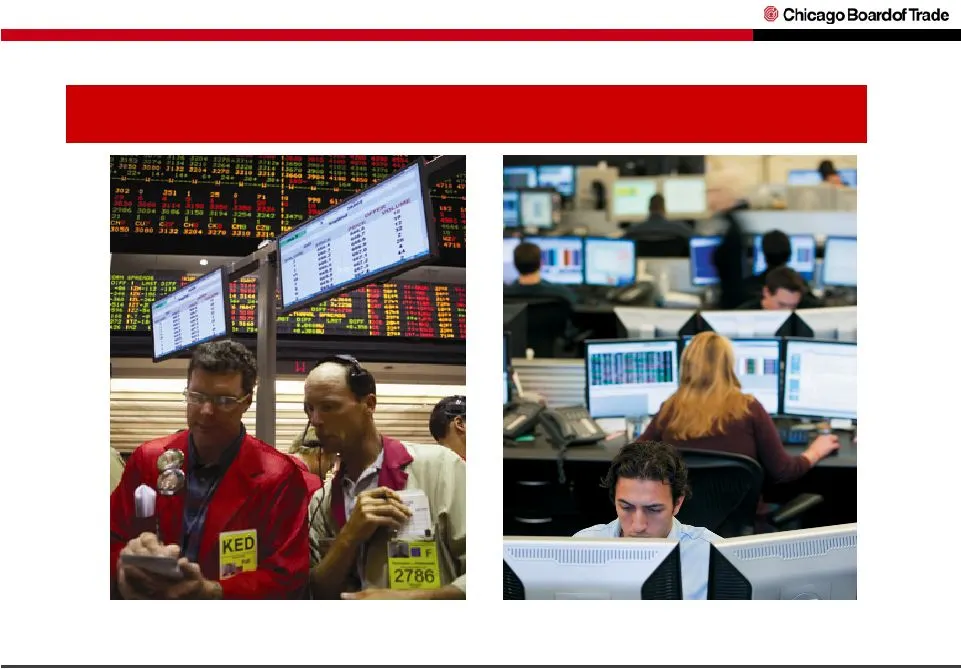
Slide 18: Successful Launch of Side-by-Side Trading of Ags
Greater Global Access to Benchmark Agricultural Products Single Pool of Liquidity Between Trading Venues Successful Launch of Side-by-Side Trading of Ags 40% increase in firms trading Ag contracts
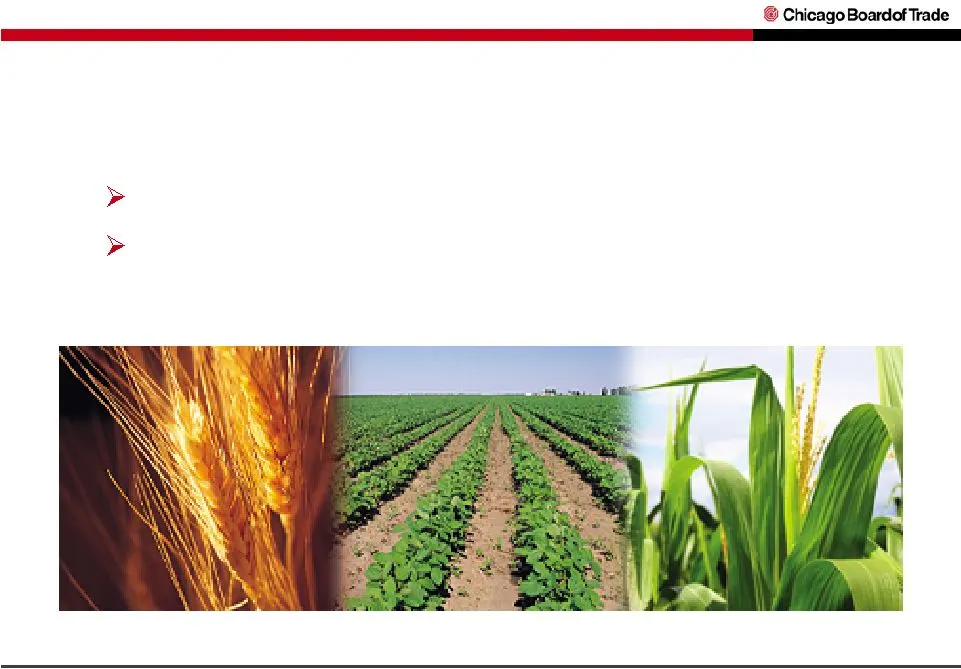
Slide 19: Growth Strategies: Global Expansion – Mini-Ags
Growth Strategies: Global Expansion Mini-Ags Provides enhanced trading opportunities Greater access to CBOT markets globally
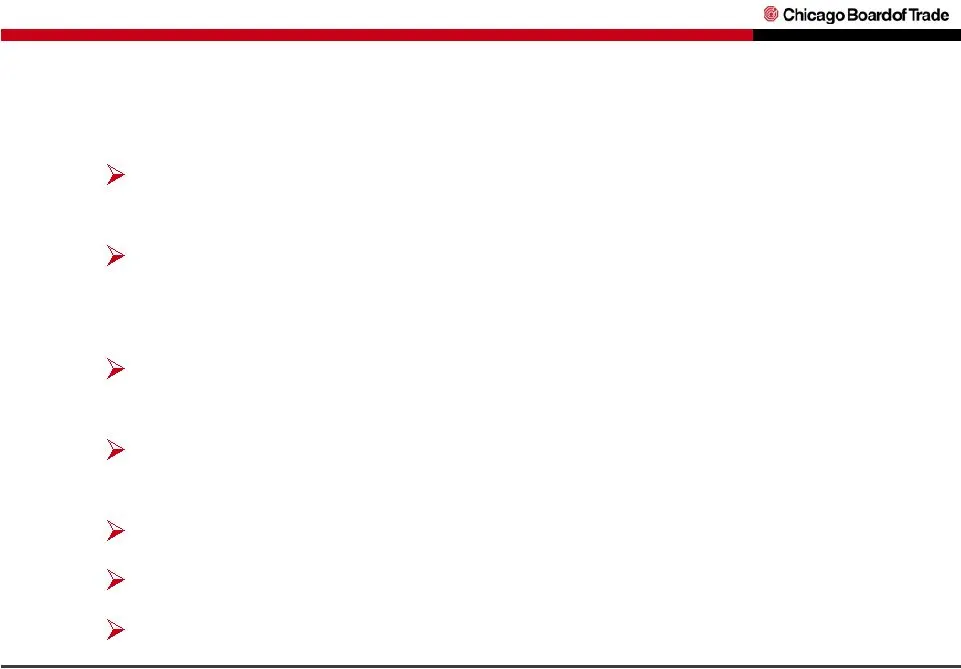
Slide 20: Global Expansion: JADE Benefits and Strengths
Growth Strategies: Global Expansion JADE – Benefits and Strengths Location: Singapore, the Asia-Pacific financial center that has a strong regulatory regime Geography: Asia is the major growth engine for production/consumption of commodities and commodity derivatives JV Partners: Both CBOT and SGX a
Slide 21: Growth Strategies: Leveraging Technology
Growth Strategies: Leveraging Technology Technology upgrades on e-cbot ® Innovative development of trading models
Slide 22: Financial Options Traded Electronically
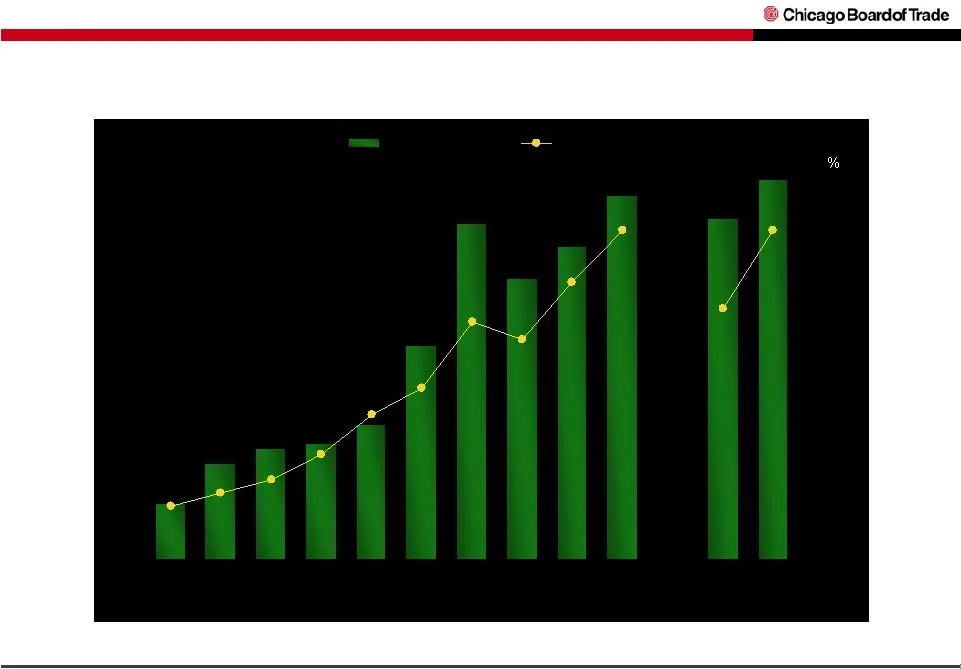
0 25 50 75 100 4Q04 1Q05 2Q05 3Q05 4Q05 1Q06 2Q06 3Q06 4Q06 1Q07 2Q06 QTD* 2Q07 QTD* 0 5 10 15 20 25 30 ADV (000s) e-cbot % Financial Options Traded Electronically - - - % - Electronic *Thru June 15
Slide 23: CBOT: Growth Strategies
CBOT: Growth Strategies Product enhancements Product innovation Global expansion Leveraging technology
Slide 24: Chicago Board of Trade
@ Chicago Boardof Trade
Slide 25: Strong Operating Leverage
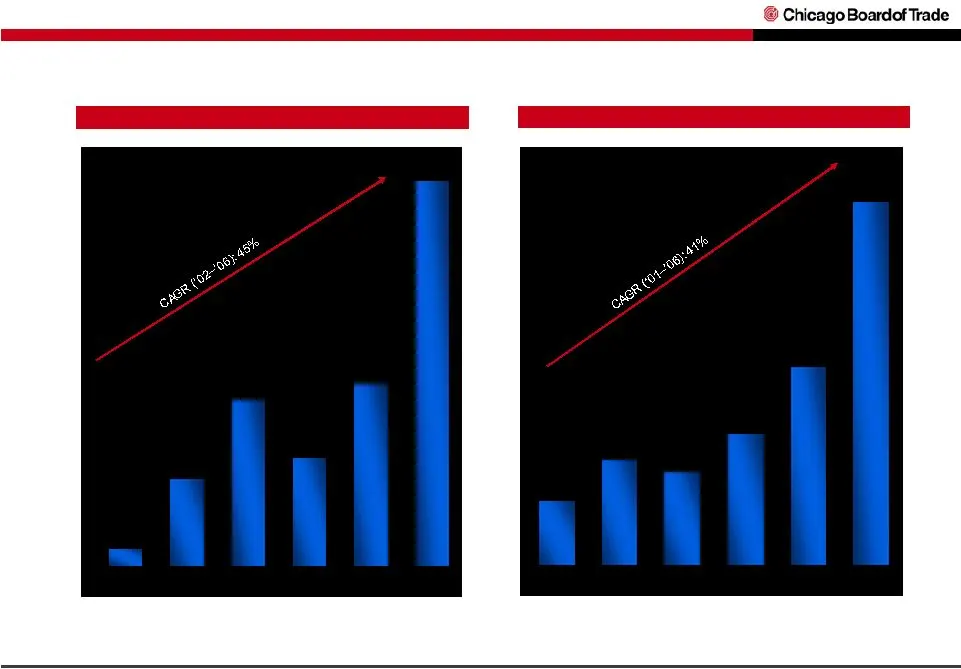
$349 $190 $126 $90 $101 $62 2001 2002 2003 2004 2005 2006 EBITDA ($mm) * Operating Income ($mm) $12 $62 $119 $77 $130 $276 2001 2002 2003 2004 2005 2006 Strong Operating Leverage * EBITDA is a Non-GAAP financial measure. Reconciliation of this to the most comparable GAAP financial measure can be fou
Slide 26: CBOT Average Daily Volume by Trading Platform
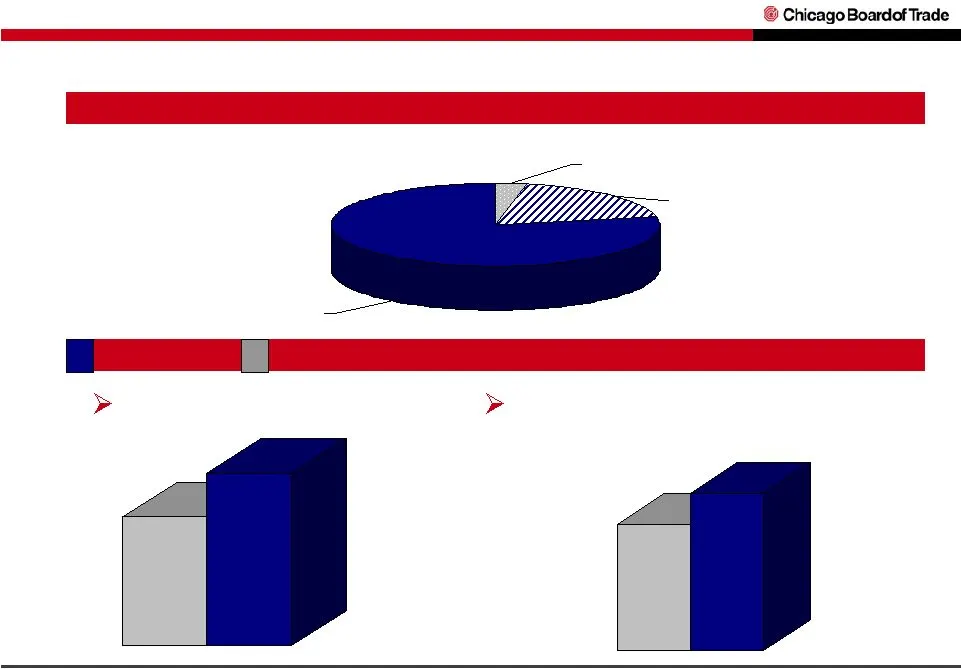
CBOT Average Daily Volume by Trading Platform 2007 versus 2006 (millions of dollars, thousands of contracts) First Quarter 2007 Open Auction 19% Electronic 78% Off Exchange 3% Revenue up 34% $140 $188 3,108 3,866 Average Daily Volume up 24%
Slide 27: Reported Volume Growth Through June 15, 2007
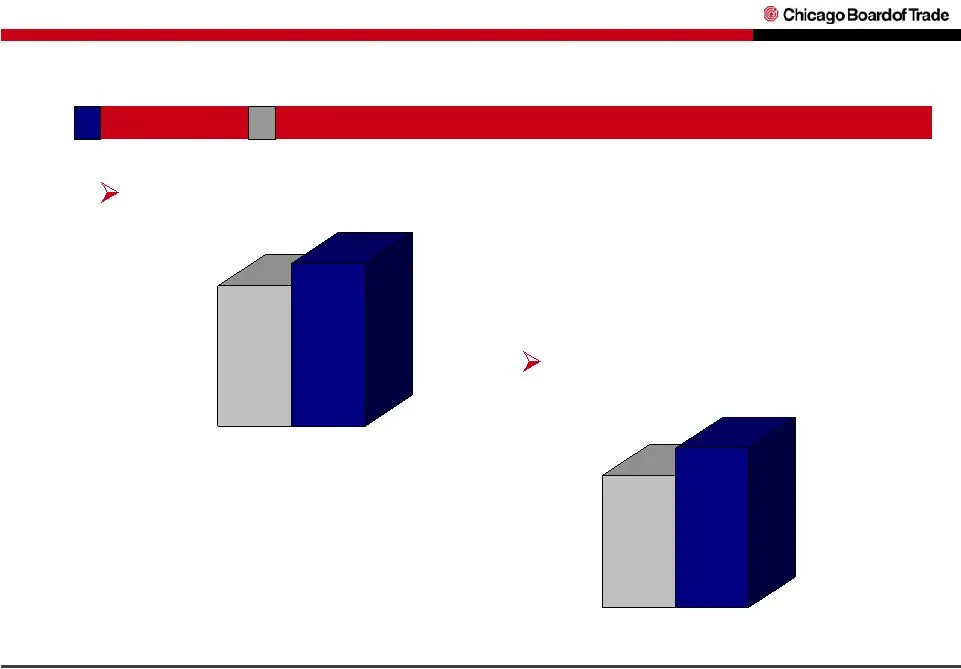
2007 versus 2006 (thousands of contracts) Reported Volume Growth Through June 15, 2007 3,406 3,967 Second quarter to date ADV up 16% 3,253 3,913 Year to date ADV up 20%
Slide 28: Overall Rate per Contract
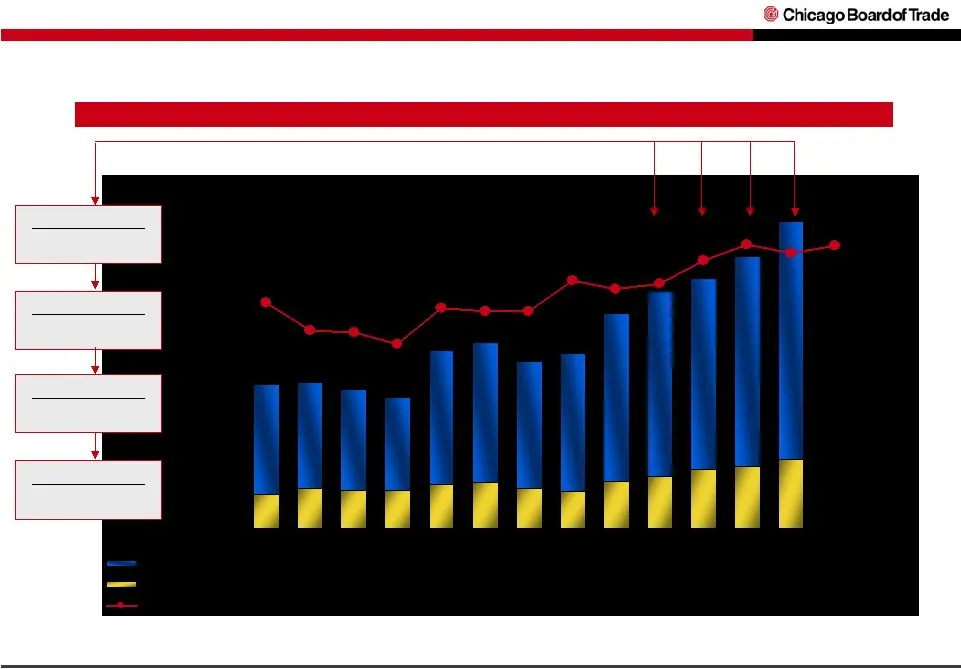
$0 $25,000 $50,000 $75,000 $100,000 $125,000 $150,000 $0.000 $0.100 $0.200 $0.300 $0.400 $0.500 $0.600 $0.700 Exchange Rev ($) 54,351 52,529 49,675 46,326 66,518 69,657 62,696 68,086 83,120 91,855 93,901 104,44 117,68 Clearing Rev ($) 16,589 19,634 18,609 18,724 21,277 22,559 20,027 18,274 23,231 25
Slide 29: First Quarter 2007 results
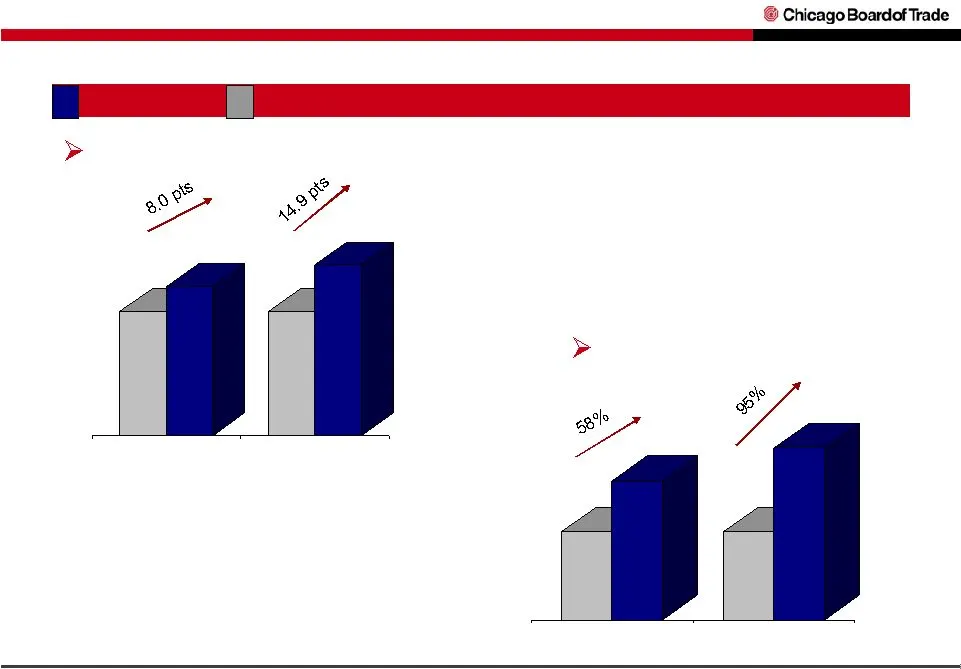
2007 versus 2006 (millions of dollars) First Quarter 2007 39.7% 47.7% 39.7% 54.6% GAAP Non-GAAP* Net Income up 58% *Excludes $13.0 million in merger-related expenses Operating margin of 47.4% versus 39.7% $35.1 $55.4 $35.1 $68.4 GAAP Non-GAAP*
Slide 30: Strong cash flow with high capital efficiency
Strong cash flow with high capital efficiency Efficient and scalable operating platform Strong Operating Leverage New products Enhancing existing products and services Global expansion Leveraging technology efforts Fixed-cost control
Slide 31: Navigating the Future: CBOT / CME Merger – a Superior Combination
Navigating the Future CBOT / CME Merger – a Superior Combination Opportunity to create both short and long- term value for shareholders and members Conducted thorough review of ICE proposal Boards concluded that the CME proposal offered greater benefits overall for shareholders, customers and member
Slide 32: Merger terms: consideration, exercise rights, closing, accretion
Exercise Rights: Anticipated Closing: Expected Accretion: Management: Consideration: Dividend: Board of Directors: Pro Forma Ownership: The right to continue as a class member in the CBOE lawsuit with all of its substantial upside recovery potential and a guarantee, even if the lawsuit is lost, of u
Slide 33: CBOT / CME Merger – Best Strategic Alternative
Delivers Significant Advantages Financially Compelling Access to distinct products and services on a single trading platform Low integration risk – timely and efficient Proven track record Migration to Globex Q1 2008 Trading Floor consolidation Q2 2008 CBOT / CME Merger – Best Strategic Alternative
Slide 34: CBOT / CME Merger: Poised to Create a Premier Global Exchange
Navigating the Future CBOT / CME Merger Poised to Create a Premier Global Exchange Combined CBOT and CME will be well positioned to : Develop innovative products Compete successfully in the international exchange space Participate in the growing OTC marketplace
Slide 35: CBOT/CME Merger – Next Steps
CBOT/CME Merger - Next Steps CBOT shareholder and CBOT member votes scheduled for July 9, 2007 Expect transaction to close in mid-2007 Integration planning ongoing
Slide 36: CBOT: Looking to the Future
CBOT: Looking to the Future Increase access to our markets Deepen pools of liquidity Ensure market integrity
Slide 37: Chicago Board of Trade
© Chicago Boardof Trade
Slide 38: Supplementary Information
Supplementary Information
Slide 39: Reconciliation of GAAP to Non-GAAP Financial Measures, First Quarter 2007
CBOT used non-GAAP financial measures of operating performance to eliminate merger-related expenses incurred in the first quarter of 2007. Non-GAAP measures do not replace and are not a substitute for our GAAP financial results but are provided to improve overall understanding of our current financi
Slide 40: Reconciliation of EBITDA to Net Income
Supplementary Information 2000 2001 2002 2003 2004 2005 2006 Non-GAAP Financial Measure - EBITDA $37 $62 $101 $90 $126 $190 $349 Deduct: Interest Expense (7) (7) (5) (4) (5) (3) (2) Income Tax Expense (1) (5) (24) (22) (33) (55) (120) Depreciation and Amortization Expense (41) (44) (38) (33) (46) (5
Slide 41: Historical Volume
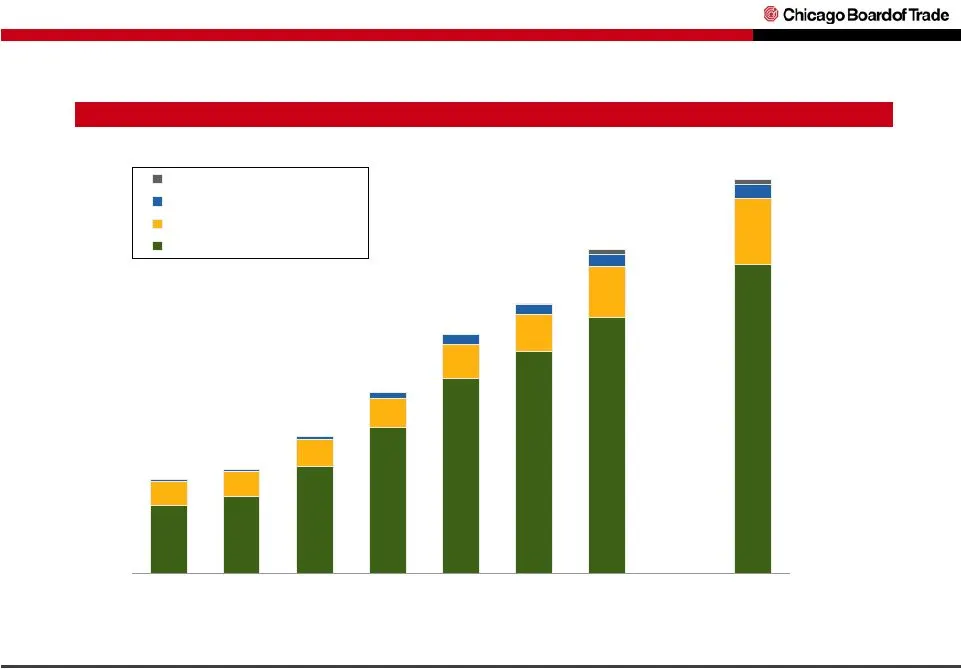
672 771 1,064 1,452 1,937 2,199 2,534 3,071 Average Daily Volume (in thousands) Historical Volume 3,913 1,037 1,365 1,804 2,372 2,677 3,211 2000 2001 2002 2003 2004 2005 2006 2007 YTD** Metals, energy, and other Equity index Agricultural Interest rate *May not add due to rounding **2007 YTD thru Jun
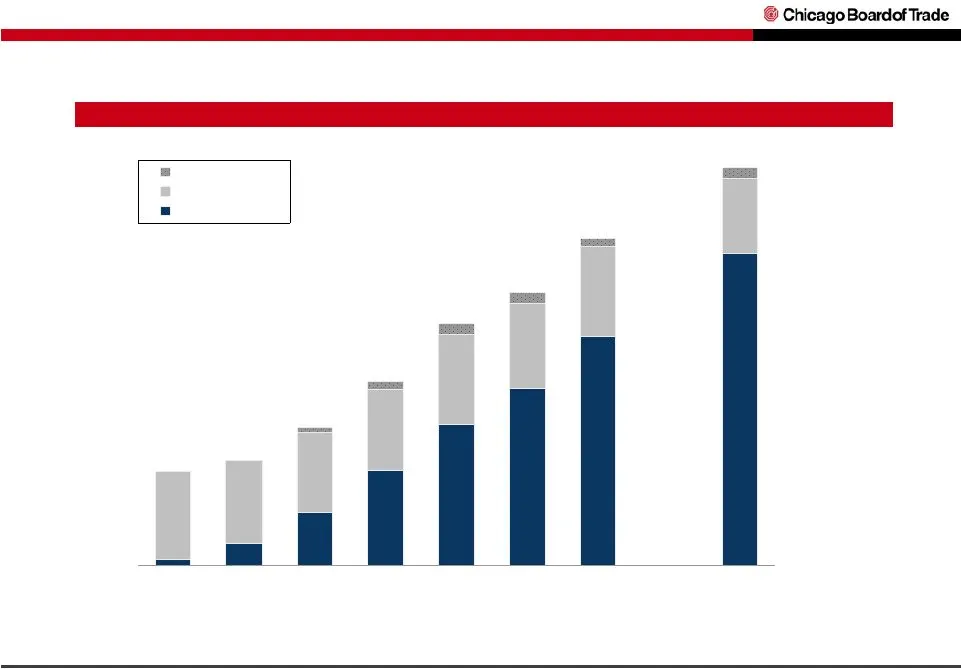
Slide 42: CBOT's Volume Growth
Average Daily Volume by Venue (in thousands) 62 209 513 935 1,382 1,739 2,240 3,067 CBOT’s Volume Growth 3,913 3,211 2,677 2,372 1,804 1,365 1,037 2000 2001 2002 2003 2004 2005 2006 2007 YTD** Off-exchange Open-auction Electronic *May not add due to rounding **2007 YTD thru June 15, 2007
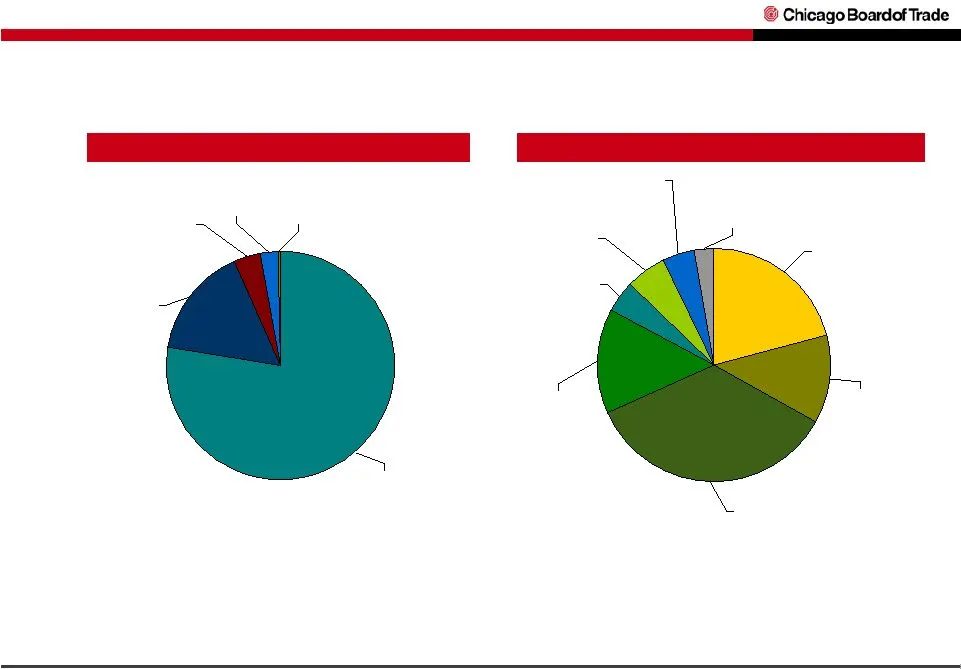
Slide 43: Sources of Revenue for 2006
Year 2006 Revenue Components ($ in millions) Year 2006 Exchange & Clearing Fees ($ in millions) Services $16 3% Interest Income & Other $2 0% Building $23 4% Market Data $99 16% Exchange Fees & Clearing $481 77% Sources of Revenue for 2006 Total Exchange & Clearing Fees = $481 mm Metals $13 3% 30 yr
Source: SEC EDGAR · 425 filed Jun 20, 2007
More decks from Cbot Holdings Inc
 Cbot Holdings — Merger or Acquisition (June 2007)18 slides · Jun 28, 2007
 Merger or Acquisition (June 2007)30 slides · Jun 26, 2007
 Merger or Acquisition (June 2007)20 slides · Jun 26, 2007
 Cbot Holdings — Merger or Acquisition (June 2007)24 slides · Jun 25, 2007
 Merger or Acquisition (June 2007)29 slides · Jun 22, 2007
 William Blair & Company Annual Growth Stock Conference (June 2007)20 slides · Jun 20, 2007