ADT Inc. · NYSE:ADT
ADT — Corporate Update (January 2024)
11 slides from ADT's corporate update, Jan 24, 2024
Slide 1: ADT Provides Solar Business Update and Advances Capital Allocation Strategy
ADT Provides Solar Business Update and Advances Capital Allocation Strategy January 24, 2024
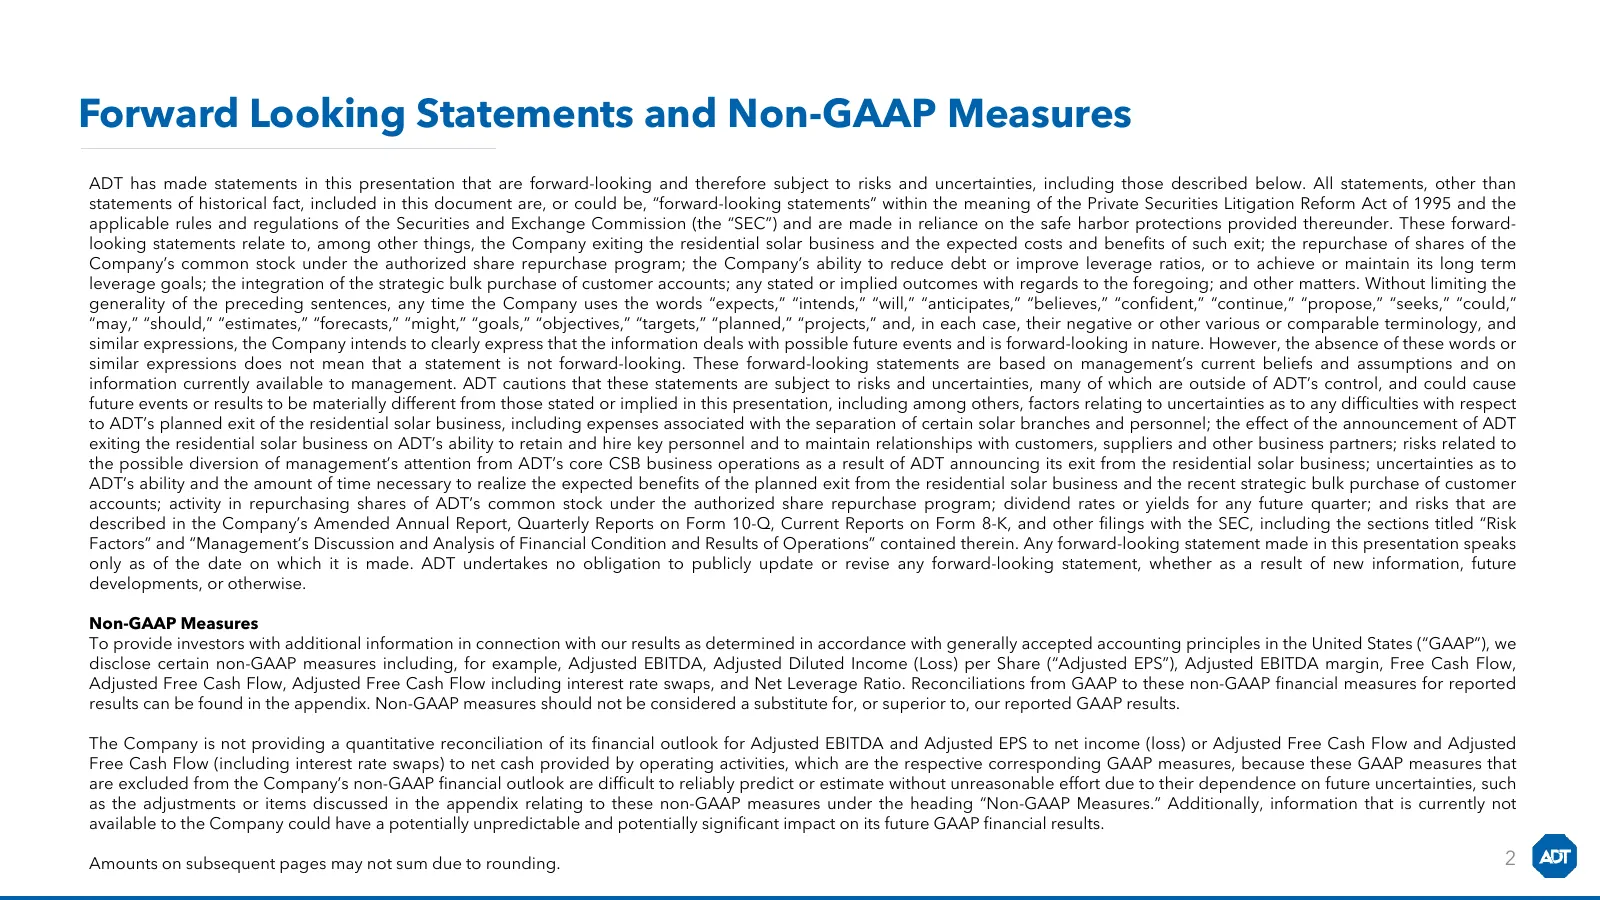
Slide 2: Forward Looking Statements and Non-GAAP Measures
Forward Looking Statements and Non-GAAP Measures ADT has made statements in this presentation that are forward-looking and therefore subject to risks and uncertainties, including those described below. All statements, other than statements of historical fact, included in this document are, or could
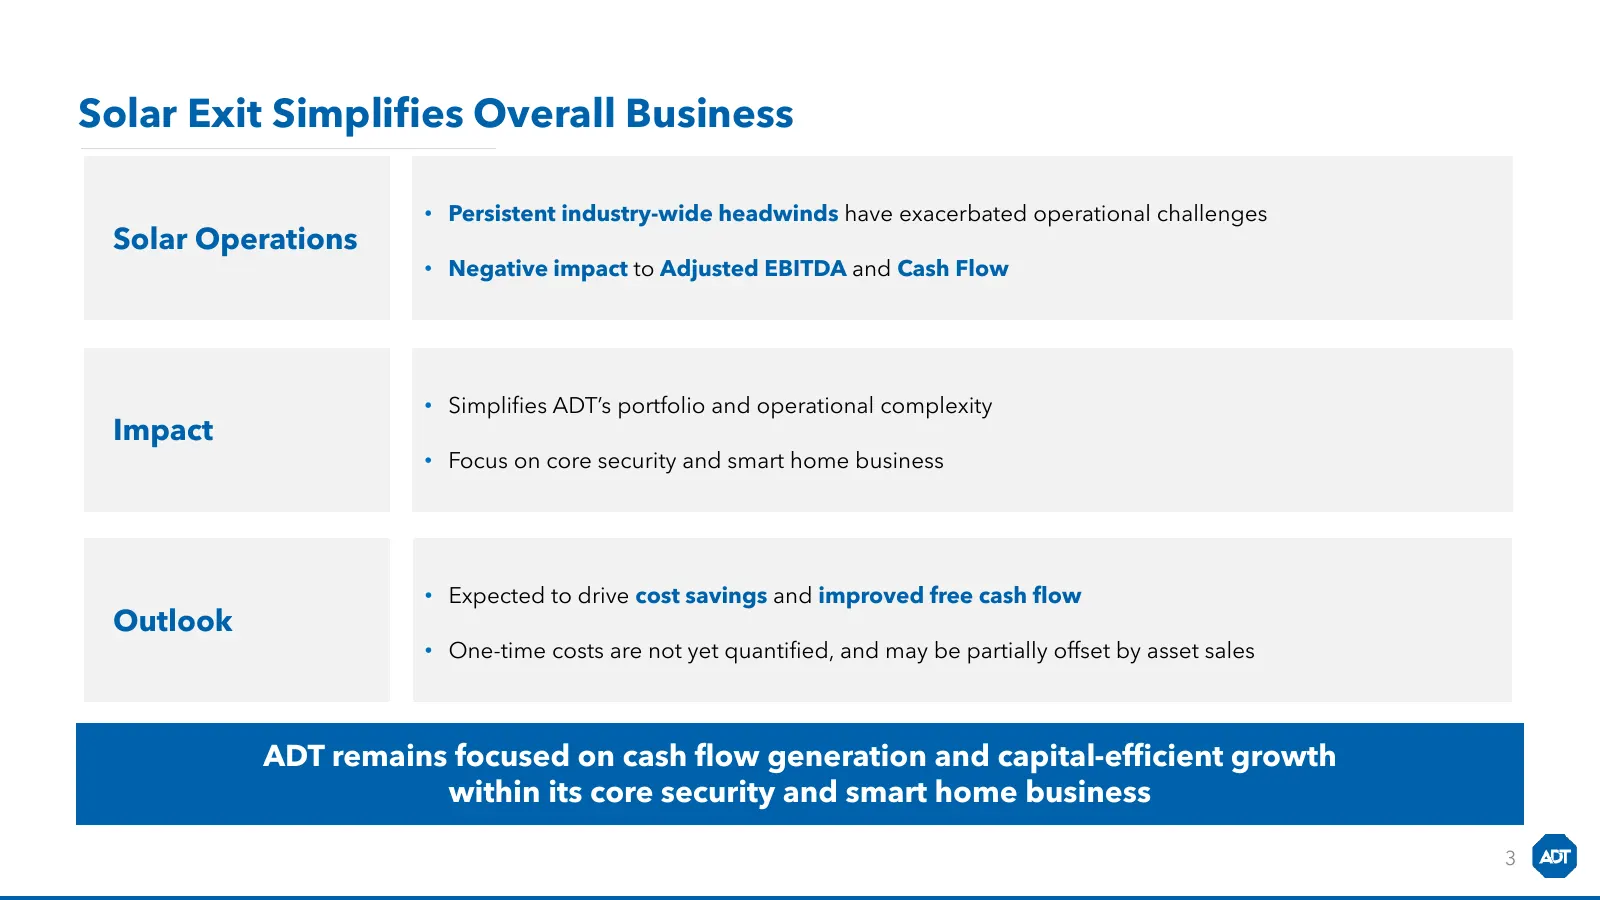
Slide 3: Solar Exit Simplifies Overall Business
Solar Exit Simplifies Overall Business • Persistent industry-wide headwinds have exacerbated operational challenges Solar Operations • Negative impact to Adjusted EBITDA and Cash Flow • Simplifies ADT’s portfolio and operational complexity Impact • Focus on core security and smart home business • Ex
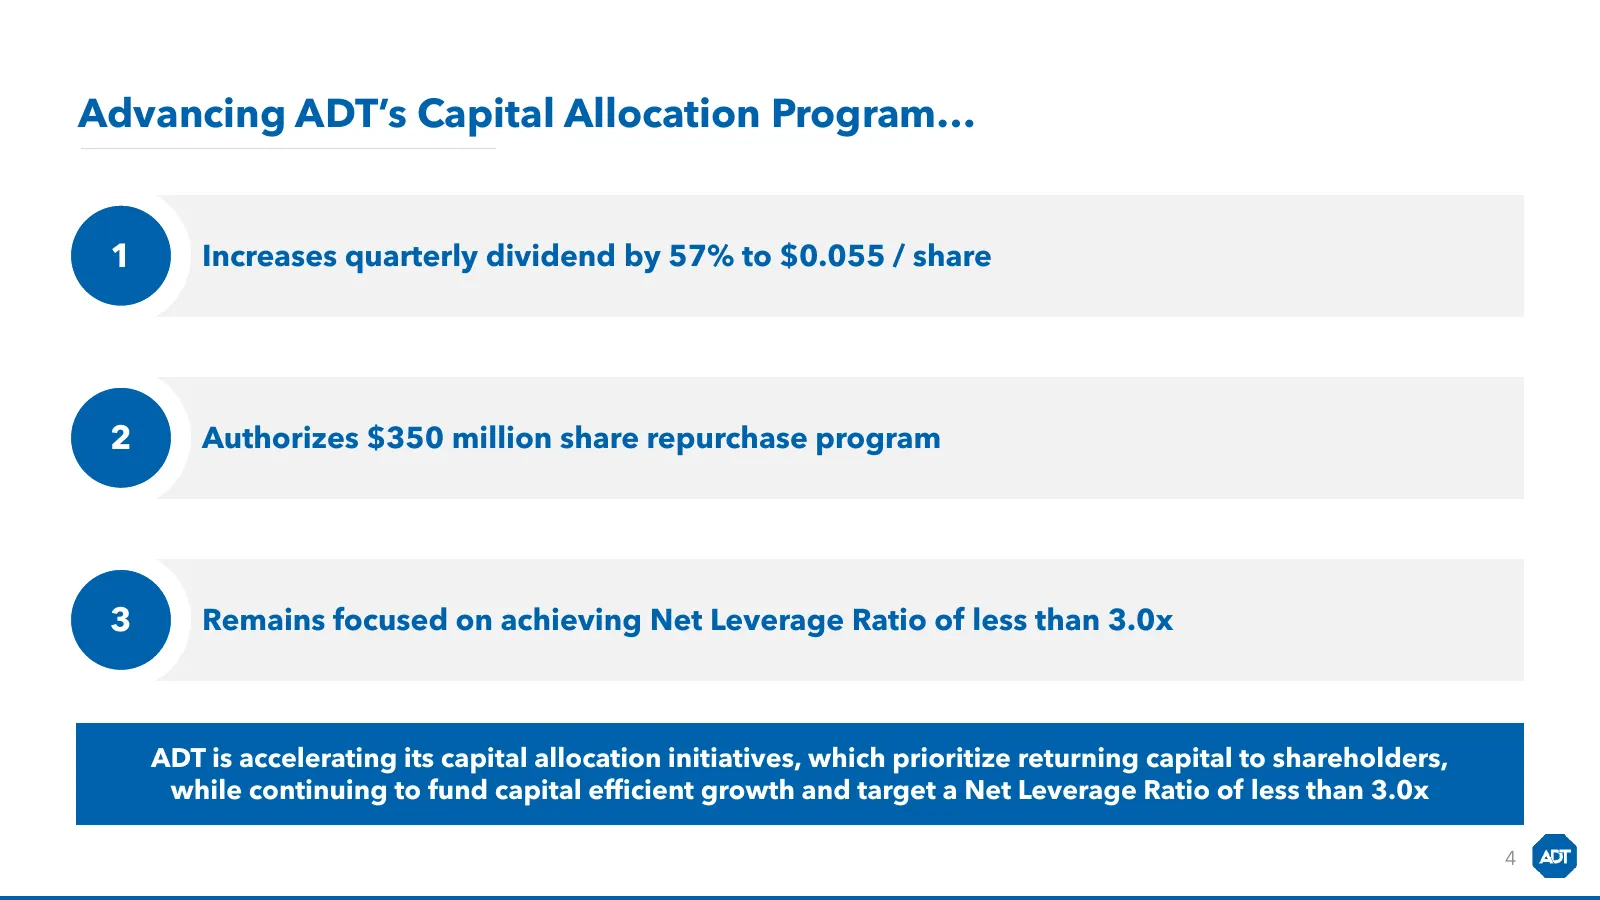
Slide 4: Advancing ADT's Capital Allocation Program…
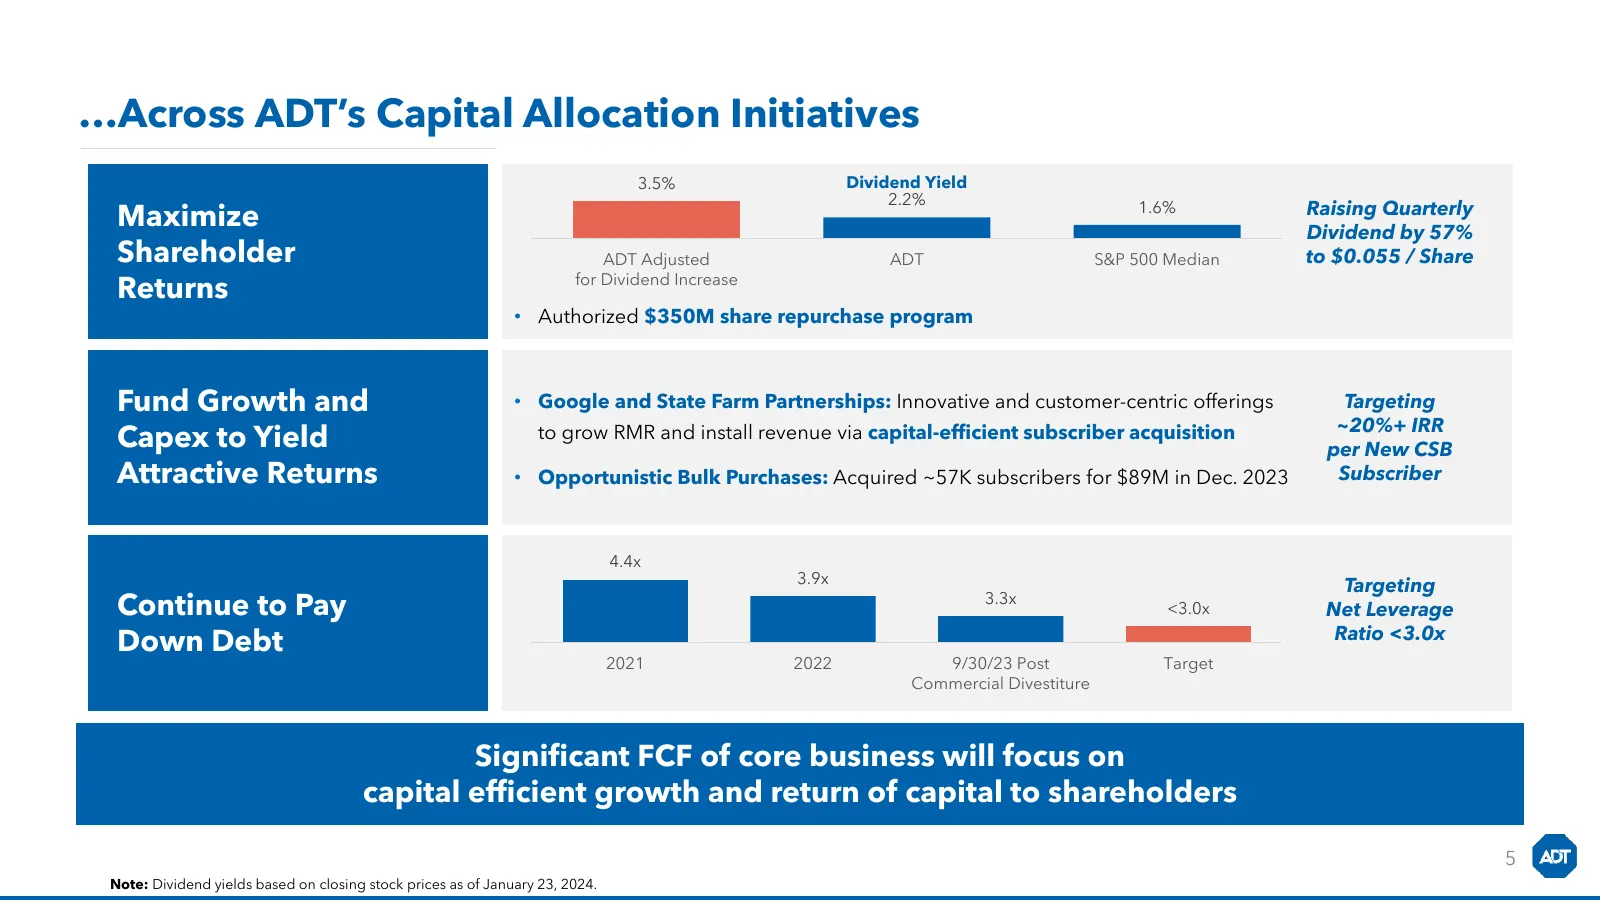
Advancing ADT’s Capital Allocation Program… 1 Increases quarterly dividend by 57% to $0.055 / share 2 Authorizes $350 million share repurchase program 3 Remains focused on achieving Net Leverage Ratio of less than 3.0x ADT is accelerating its capital allocation initiatives, which prioritize returnin
Slide 5: …Across ADT's Capital Allocation Initiatives
…Across ADT’s Capital Allocation Initiatives 3.5% Dividend Yield 2.2% 1.6% Raising Quarterly Maximize Dividend by 57% Shareholder ADT Adjusted ADT S&P 500 Median to $0.055 / Share Returns for Dividend Increase • Authorized $350M share repurchase program Fund Growth and • Google and State Farm Partne
Slide 6: Investment Thesis for ADT Remains Strong with an Attractive Financial Profile
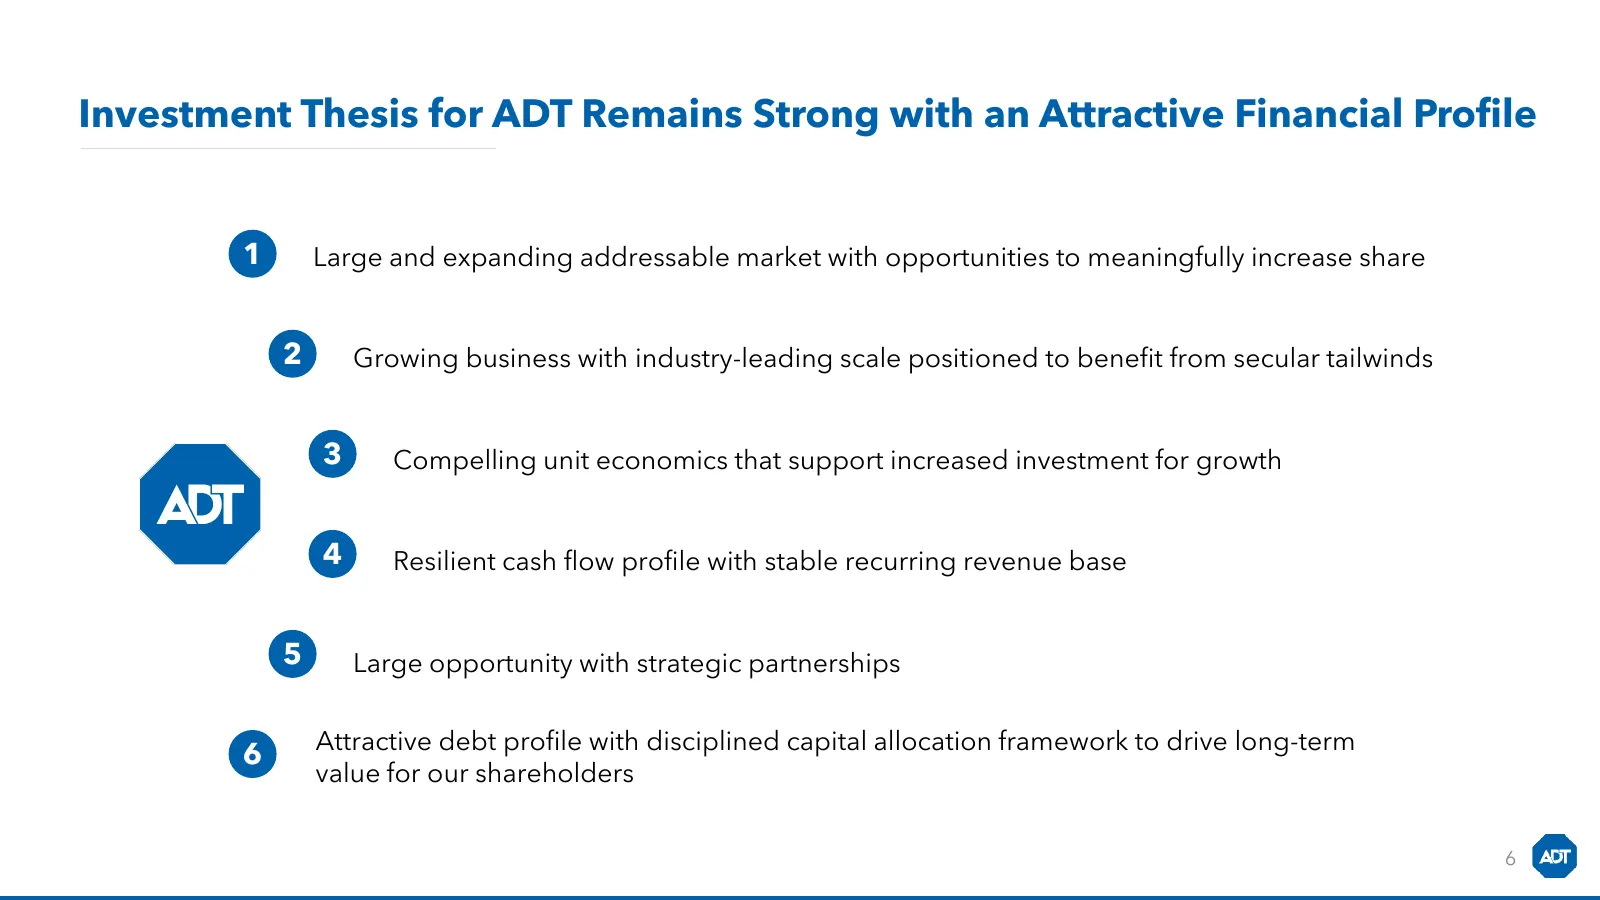
Investment Thesis for ADT Remains Strong with an Attractive Financial Profile 1 Large and expanding addressable market with opportunities to meaningfully increase share 2 Growing business with industry-leading scale positioned to benefit from secular tailwinds 3 Compelling unit economics that suppor
Slide 7: Non-GAAP Measures
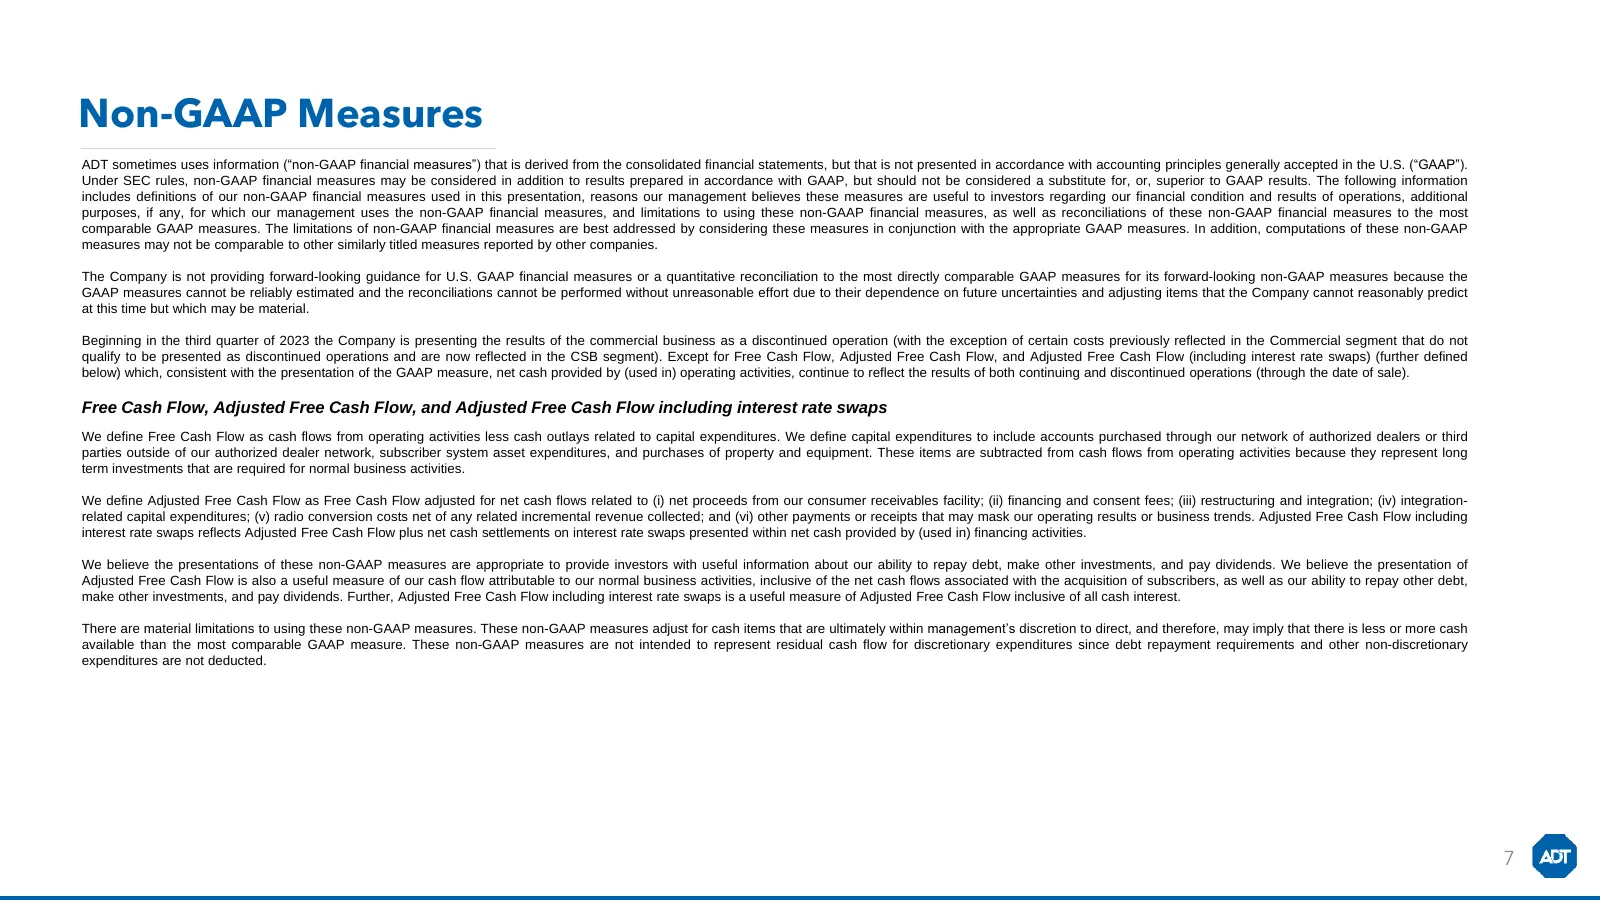
Non-GAAP Measures ADT sometimes uses information (“non-GAAP financial measures”) that is derived from the consolidated financial statements, but that is not presented in accordance with accounting principles generally accepted in the U.S. (“GAAP”). Under SEC rules, non-GAAP financial measures may be
Slide 8: GAAP to Non-GAAP Reconciliations
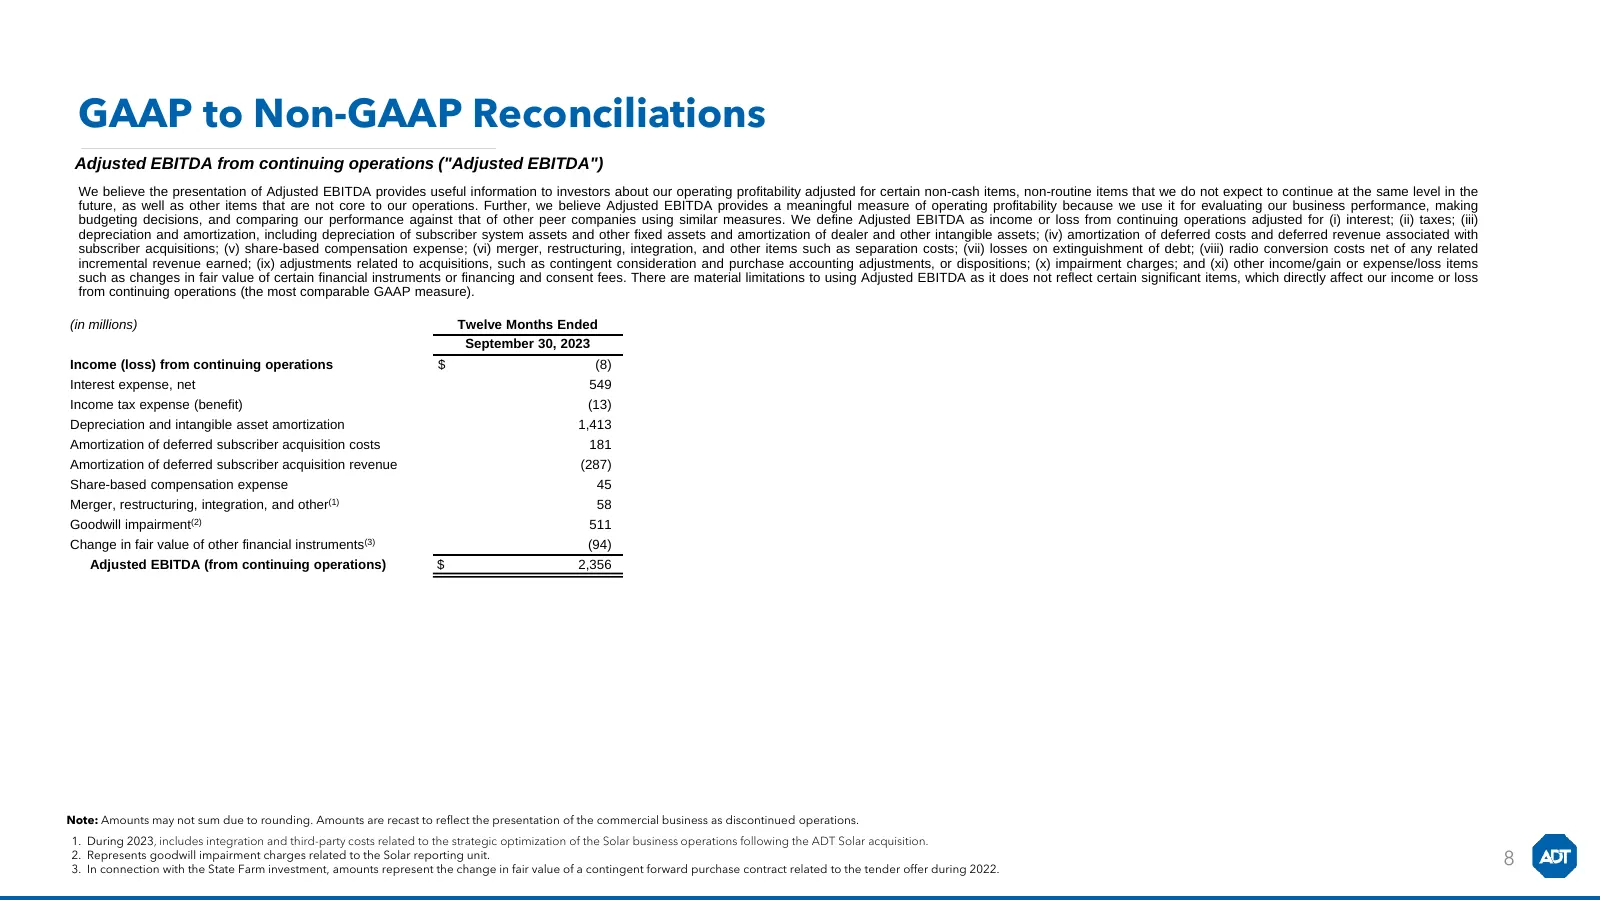
GAAP to Non-GAAP Reconciliations Adjusted EBITDA from continuing operations ("Adjusted EBITDA") We believe the presentation of Adjusted EBITDA provides useful information to investors about our operating profitability adjusted for certain non-cash items, non-routine items that we do not expect to co
Slide 9: GAAP to Non-GAAP Reconciliations
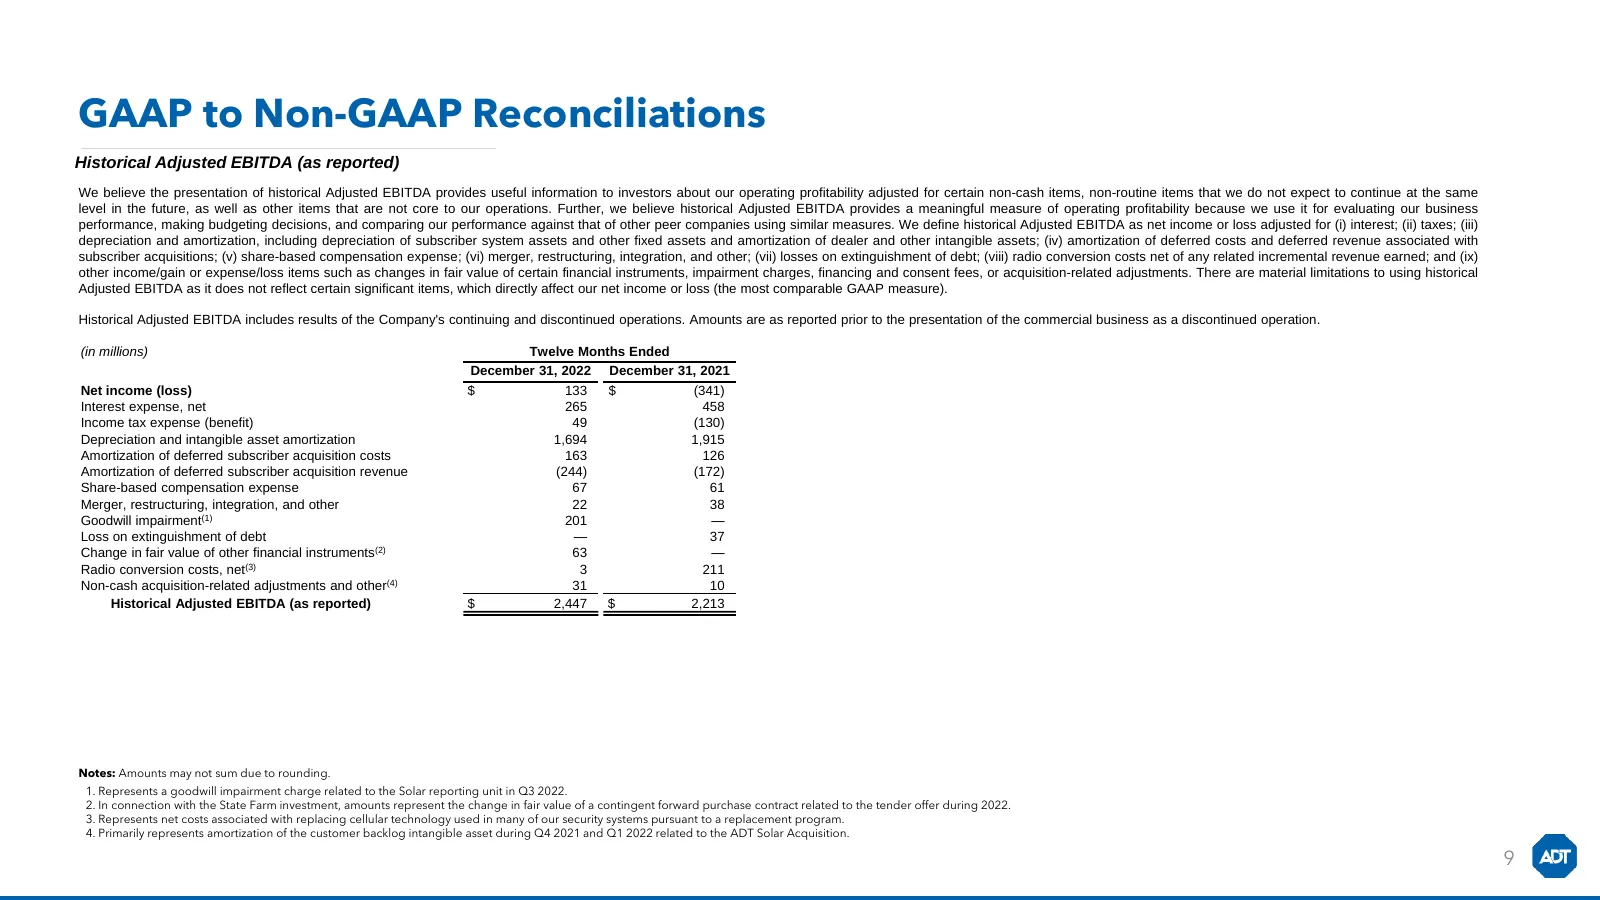
GAAP to Non-GAAP Reconciliations Historical Adjusted EBITDA (as reported) We believe the presentation of historical Adjusted EBITDA provides useful information to investors about our operating profitability adjusted for certain non-cash items, non-routine items that we do not expect to continue at t
Slide 10: GAAP to Non-GAAP Reconciliations
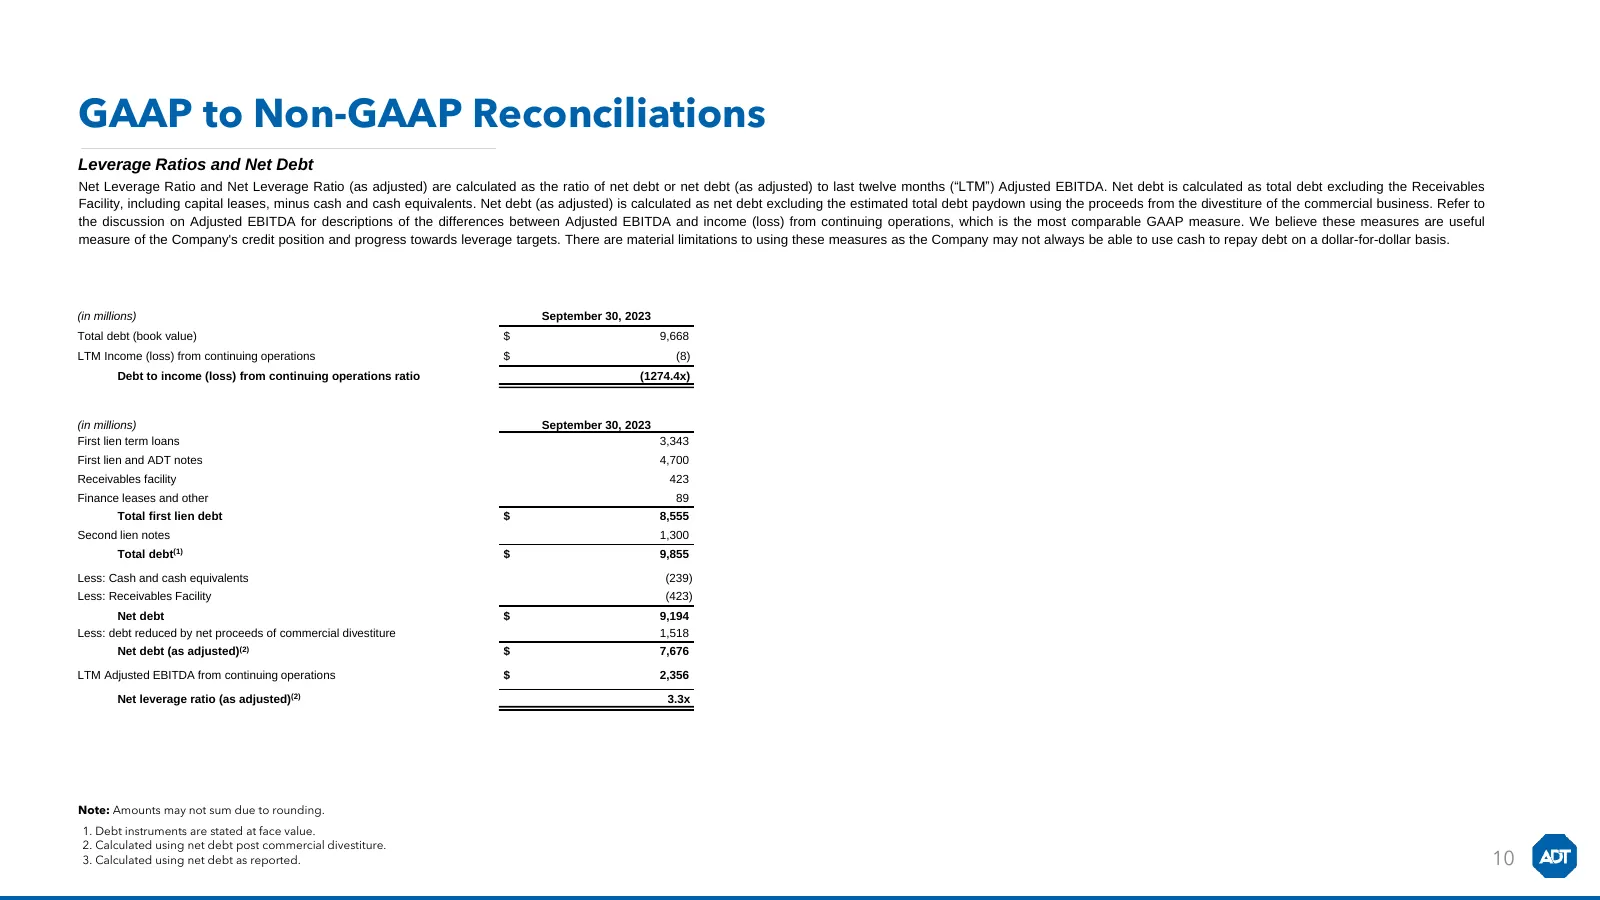
GAAP to Non-GAAP Reconciliations Leverage Ratios and Net Debt Net Leverage Ratio and Net Leverage Ratio (as adjusted) are calculated as the ratio of net debt or net debt (as adjusted) to last twelve months (“LTM”) Adjusted EBITDA. Net debt is calculated as total debt excluding the Receivables Facili
Slide 11: GAAP to Non-GAAP Reconciliations
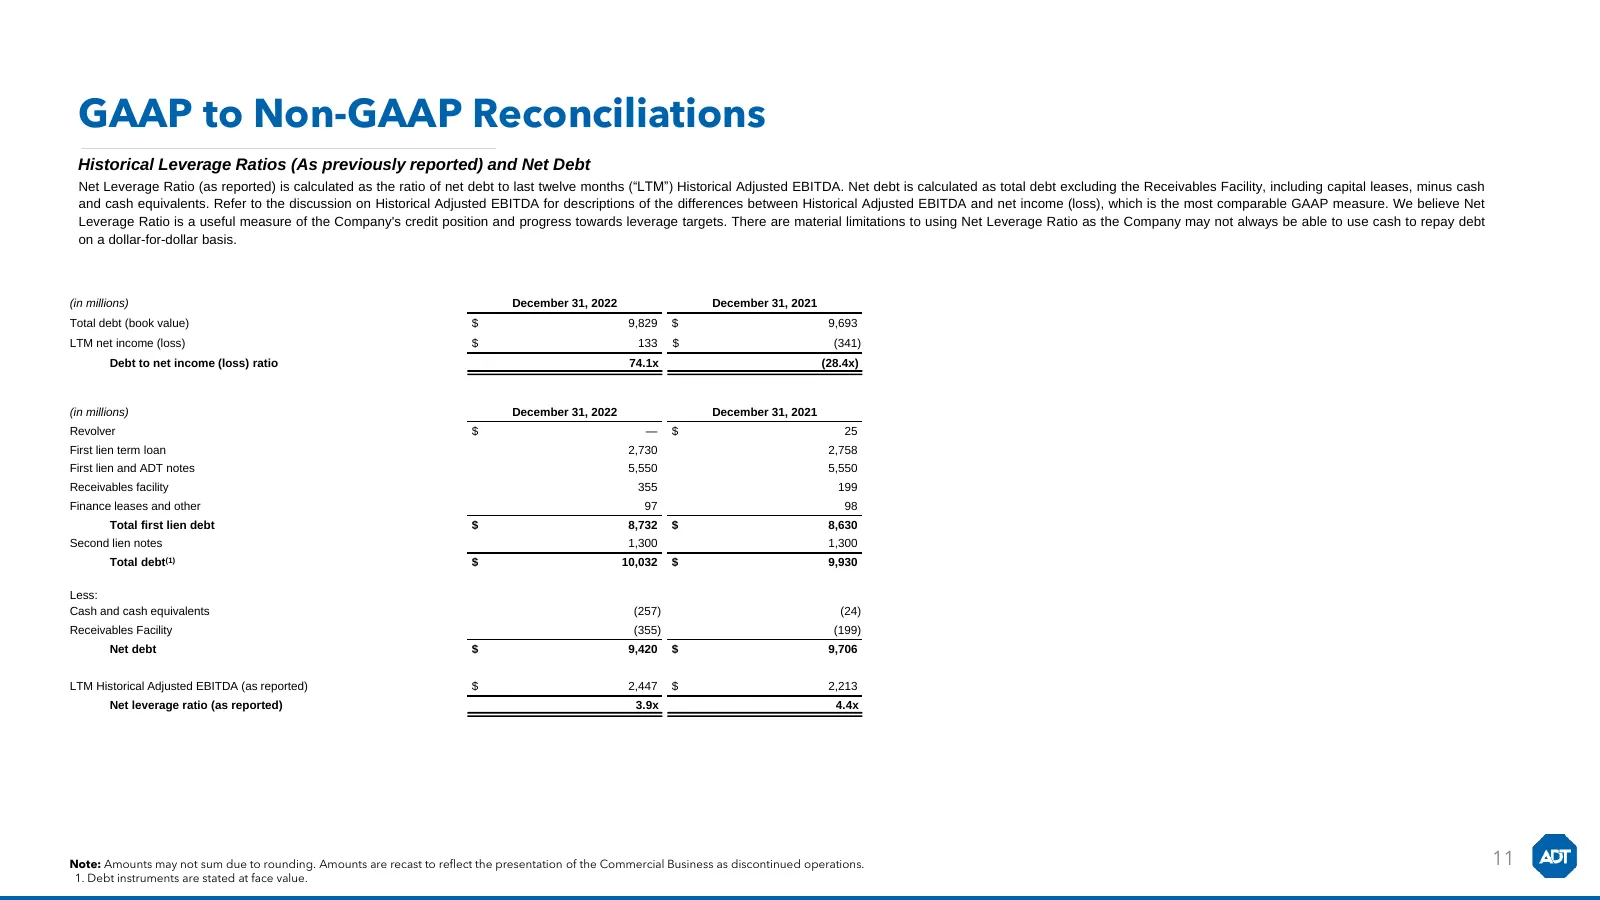
GAAP to Non-GAAP Reconciliations Historical Leverage Ratios (As previously reported) and Net Debt Net Leverage Ratio (as reported) is calculated as the ratio of net debt to last twelve months (“LTM”) Historical Adjusted EBITDA. Net debt is calculated as total debt excluding the Receivables Facility,
Source: Internet Archive copy of s201.q4cdn.com
More decks from ADT Inc.
 Q3 2026 Earnings Presentation21 slides · Nov 3, 2026
 Q2 2026 Earnings Presentation26 slides · Jul 30, 2026
 Q1 2026 Earnings Presentation24 slides · Apr 30, 2026
 Q4 2025 Earnings Presentation53 slides · Mar 2, 2026
 Q3 2025 Earnings Presentation38 slides · Nov 4, 2025
 Q2 2025 Earnings Presentation38 slides · Jul 24, 2025