ADT Inc. · NYSE:ADT
ADT — Q3 2026 Earnings Presentation
21 slides from ADT's earnings presentation, Nov 3, 2026

Slide 1: Third Quarter 2026 Earnings Presentation
Third Quarter 2026 Earnings Presentation November 3, 2026
Slide 2: Forward-Looking Statements and Non-GAAP Measures
Forward-Looking Statements and Non-GAAP Measures ADT has made statements in this presentation that are forward-looking and therefore subject to risks and uncertainties, including those described below. All statements, other than statements of historical fact, included in this document are, or could
Slide 3: 3Q26 financial highlights
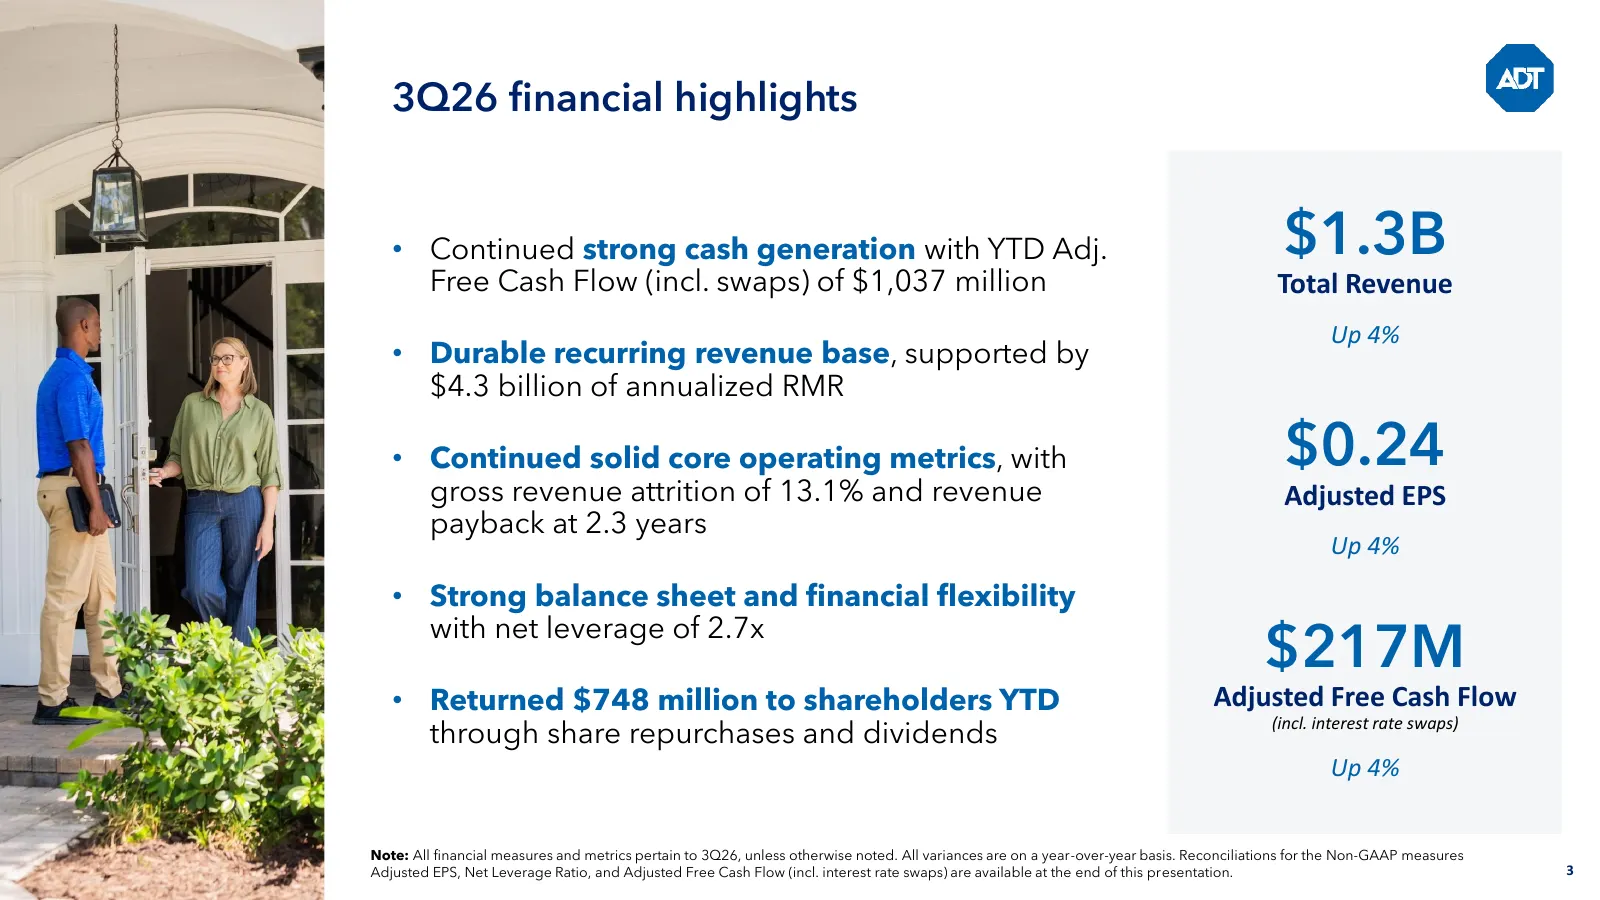
3Q26 financial highlights • Continued strong cash generation with YTD Adj. $1.3B Free Cash Flow (incl. swaps) of $1,037 million Total Revenue Up 4% • Durable recurring revenue base, supported by $4.3 billion of annualized RMR • Continued solid core operating metrics, with $0.24 gross revenue attriti
Slide 4: Key quarterly financials
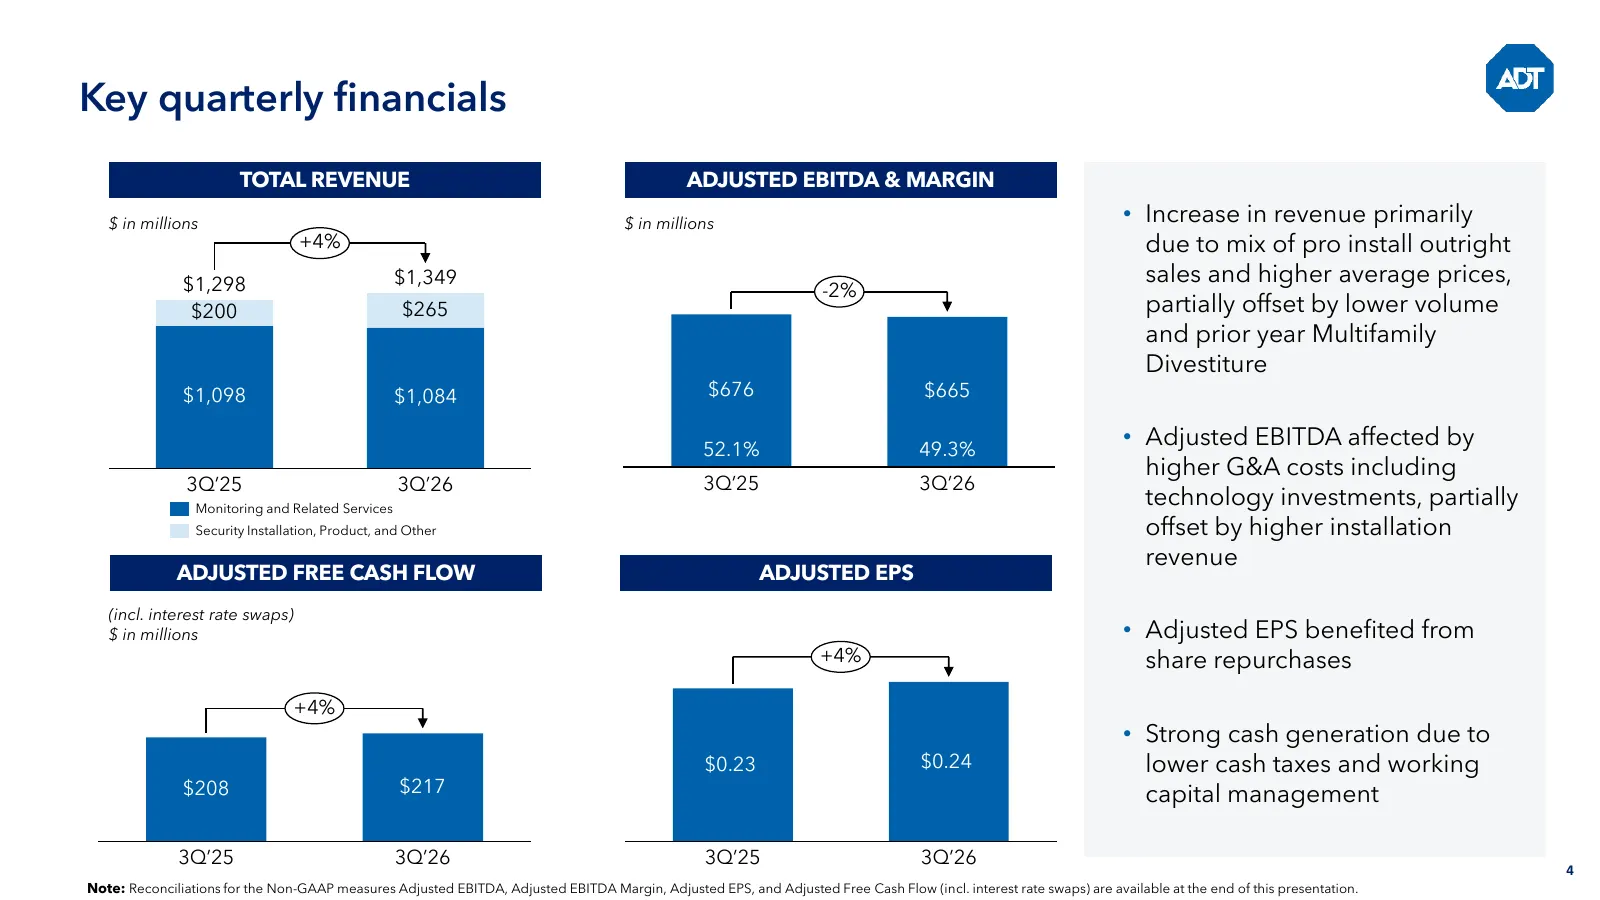
Key quarterly financials TOTAL REVENUE ADJUSTED EBITDA & MARGIN $ in millions $ in millions • Increase in revenue primarily +4% due to mix of pro install outright $1,298 $1,349 sales and higher average prices, -2% $200 $265 partially offset by lower volume and prior year Multifamily $2,578 $2,680 Di
Slide 5: Key year to date financials
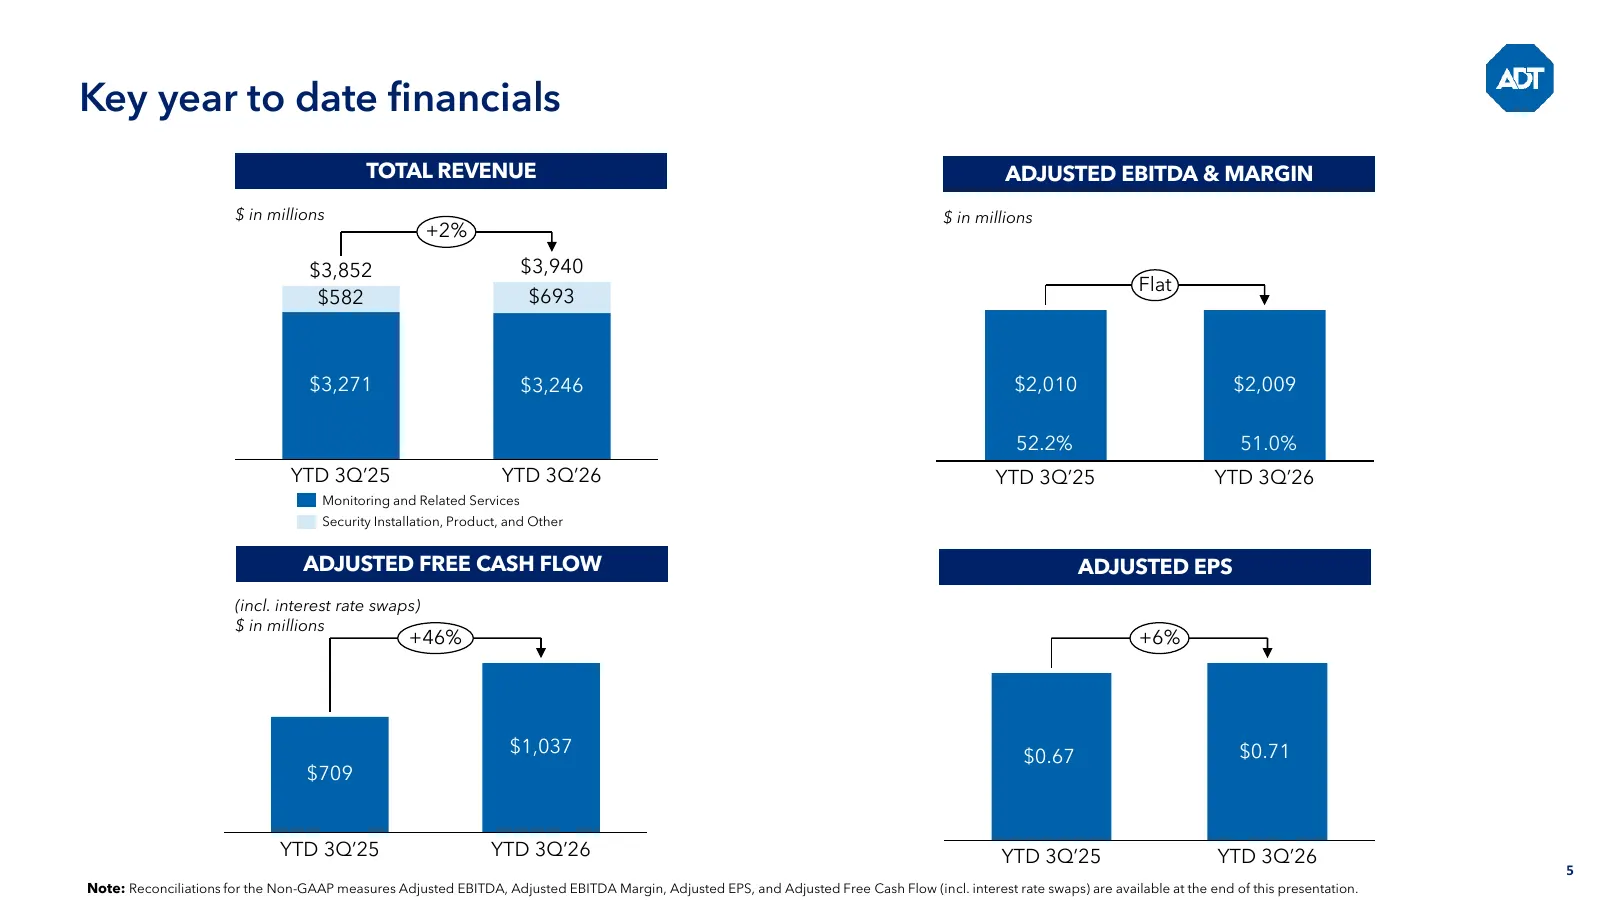
Key year to date financials TOTAL REVENUE ADJUSTED EBITDA & MARGIN $ in millions $ in millions +2% $3,852 $3,940 Flat $582 $693 $2,578 $2,680 $3,271 $1,083 $3,246 $1,080 $2,010 $2,009 52.1% 52.2% 54.9% 51.0% YTD 3Q’25 YTD 3Q’26 YTD 3Q’25 YTD 3Q’26 Monitoring and Related Services Security Installatio
Slide 6: Additional key metrics
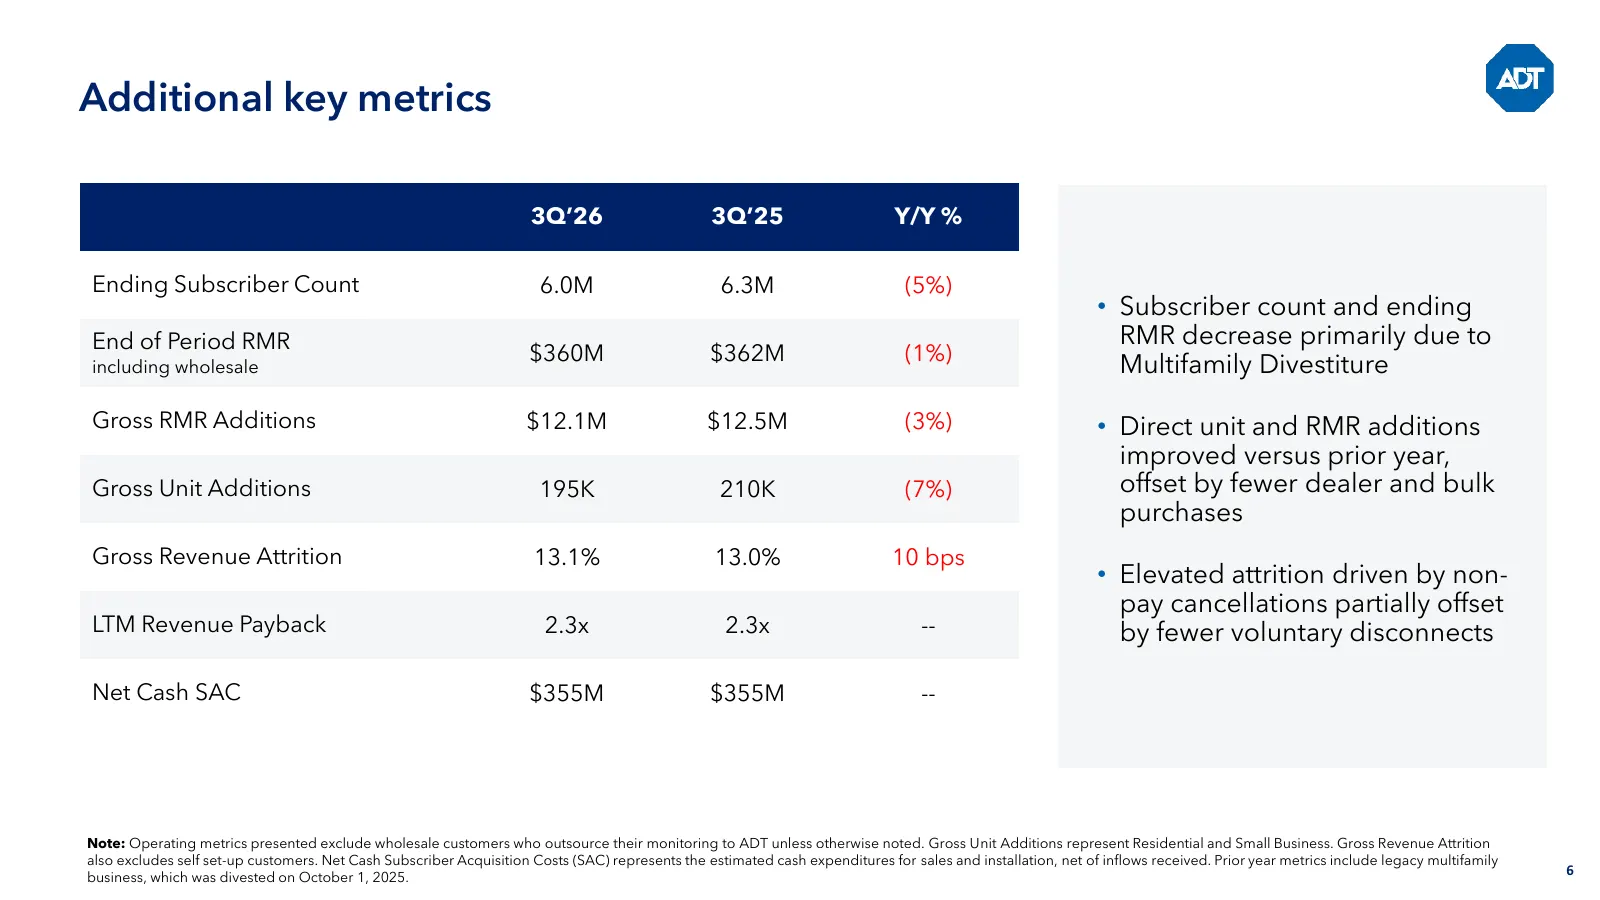
Additional key metrics 3Q’26 3Q’25 Y/Y % Ending Subscriber Count 6.0M 6.3M (5%) • Subscriber count and ending End of Period RMR RMR decrease primarily due to $360M $362M (1%) including wholesale Multifamily Divestiture Gross RMR Additions $12.1M $12.5M (3%) • Direct unit and RMR additions improved v
Slide 7: ADT is well-positioned for future innovation
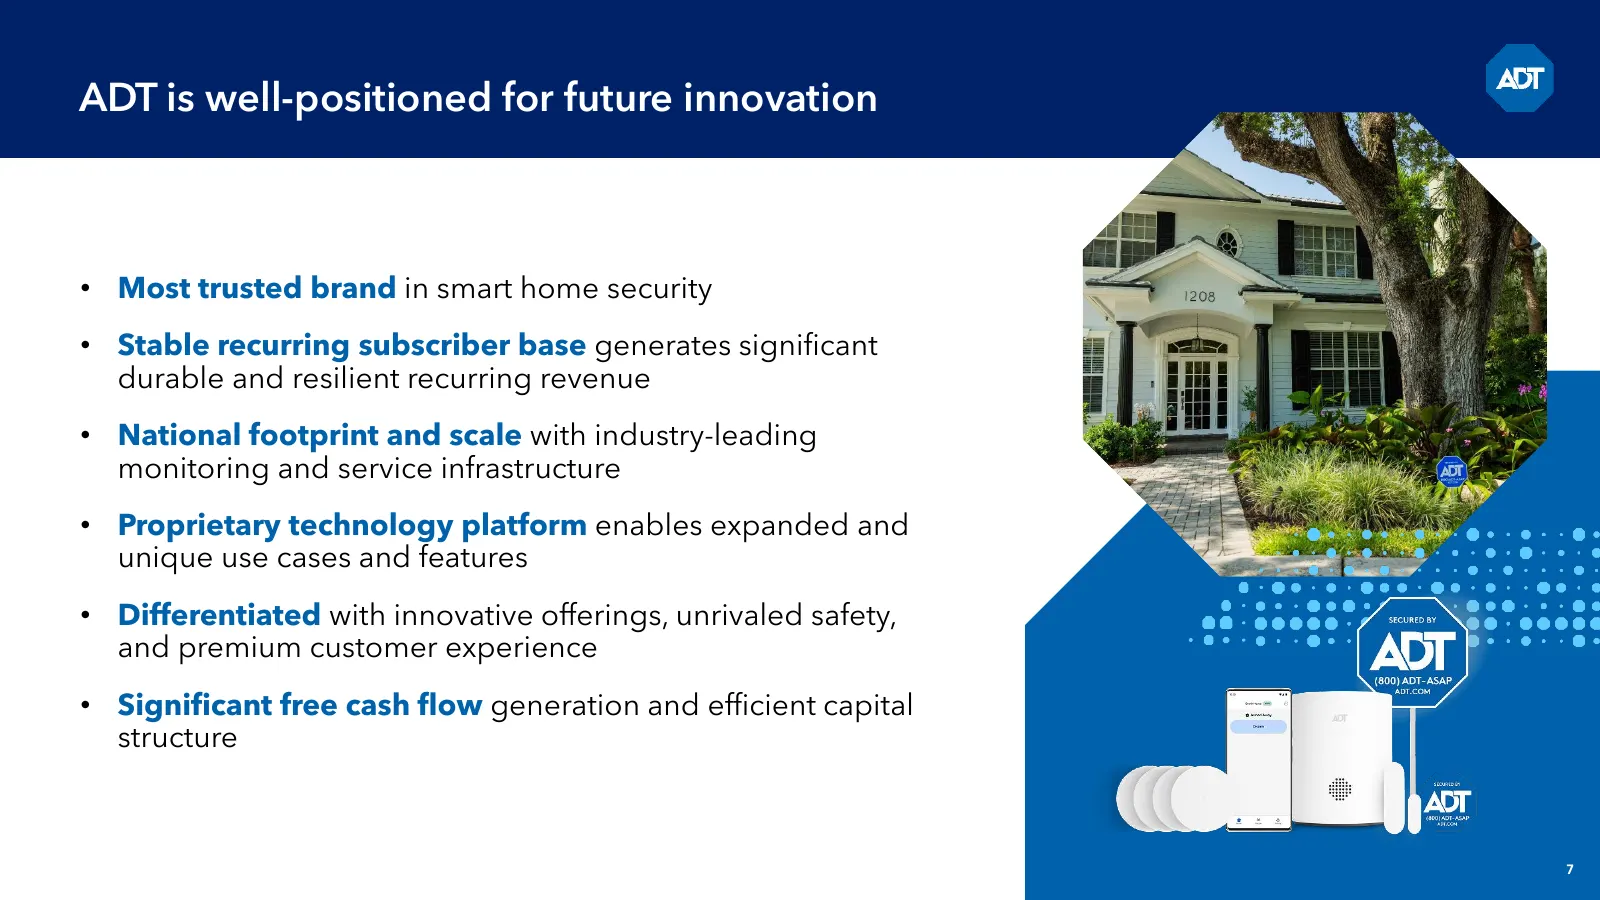
ADT is well-positioned for future innovation • Most trusted brand in smart home security • Stable recurring subscriber base generates significant durable and resilient recurring revenue • National footprint and scale with industry-leading monitoring and service infrastructure • Proprietary technolog

Slide 8: Appendix
Appendix Additional Financial Information & Non-GAAP Reconciliations
Slide 9: Financial & Operating Measures
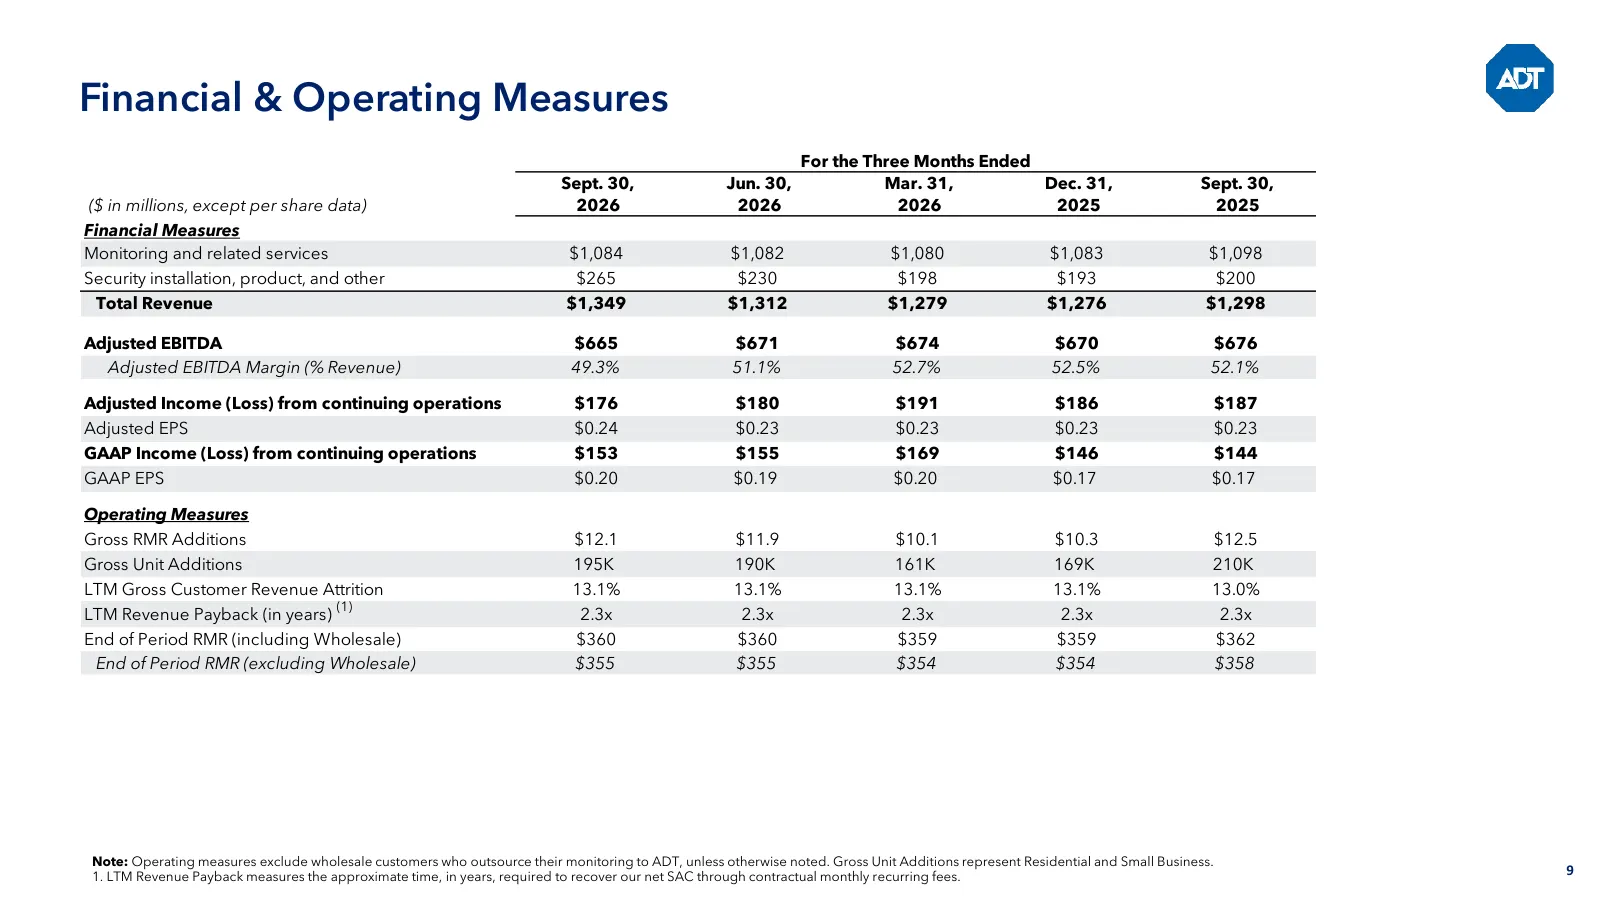
Financial & Operating Measures For the Three Months Ended Sept. 30, Jun. 30, Mar. 31, Dec. 31, Sept. 30, ($ in millions, except per share data) 2026 2026 2026 2025 2025 Financial Measures Monitoring and related services $1,084 $1,082 $1,080 $1,083 $1,098 Security installation, product, and other $26
Slide 10: Adjusted Free Cash Flow Detail
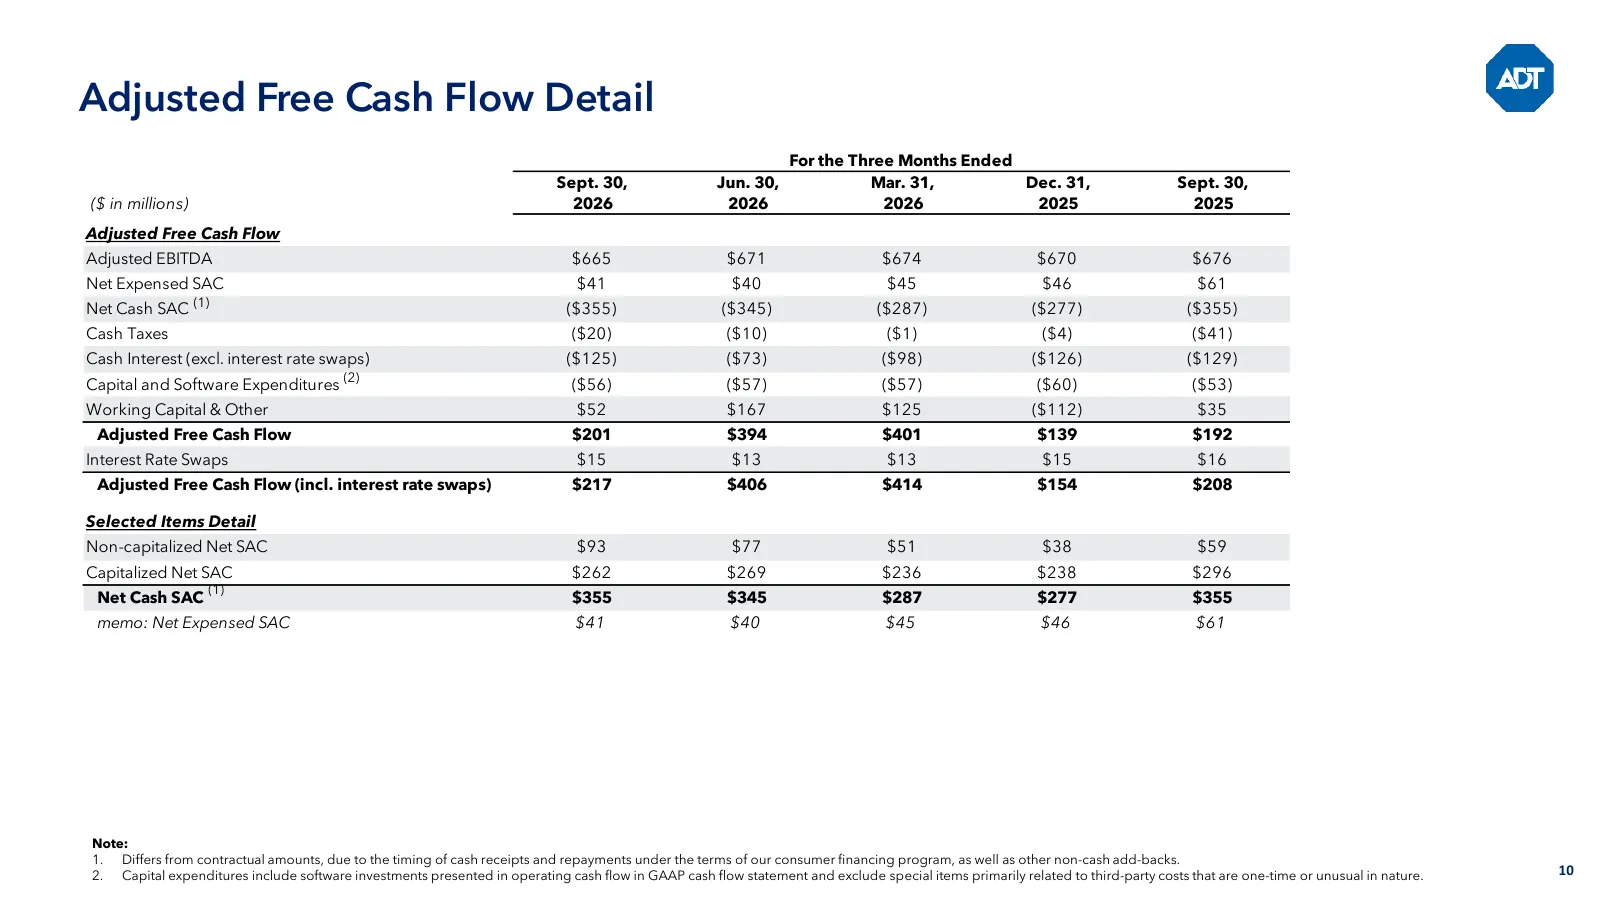
Adjusted Free Cash Flow Detail For the Three Months Ended Sept. 30, Jun. 30, Mar. 31, Dec. 31, Sept. 30, ($ in millions) 2026 2026 2026 2025 2025 Adjusted Free Cash Flow Adjusted EBITDA $665 $671 $674 $670 $676 Net Expensed SAC $41 $40 $45 $46 $61 (1) Net Cash SAC ($355) ($345) ($287) ($277) ($355)
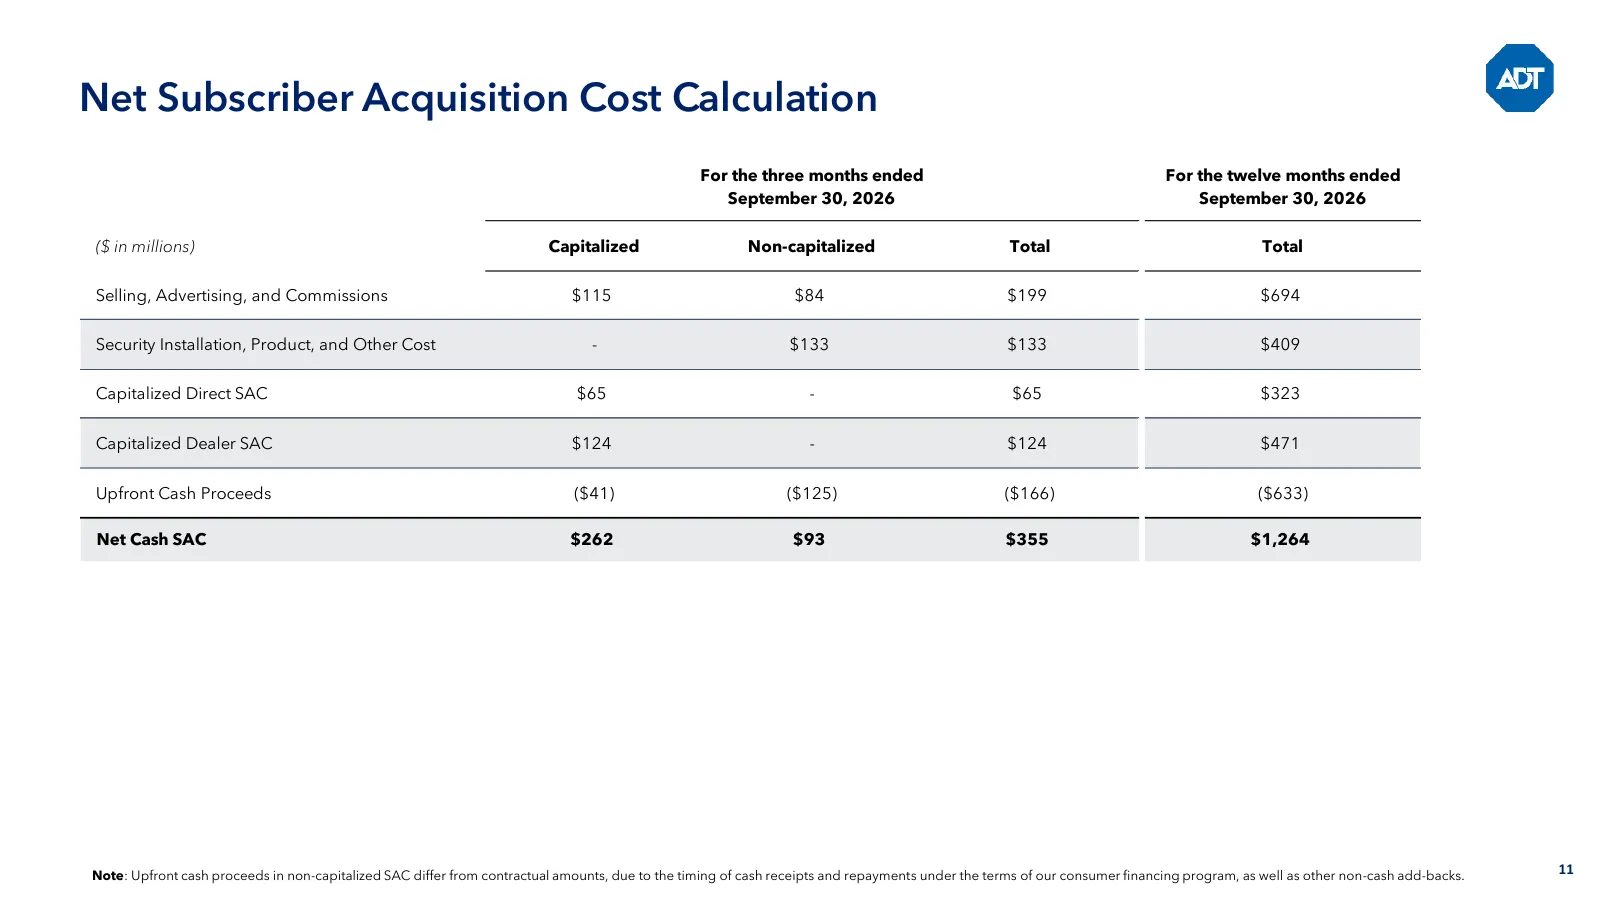
Slide 11: Net Subscriber Acquisition Cost Calculation
Net Subscriber Acquisition Cost Calculation For the three months ended For the twelve months ended September 30, 2026 September 30, 2026 ($ in millions) Capitalized Non-capitalized Total Total Selling, Advertising, and Commissions $115 $84 $199 $694 Security Installation, Product, and Other Cost - $
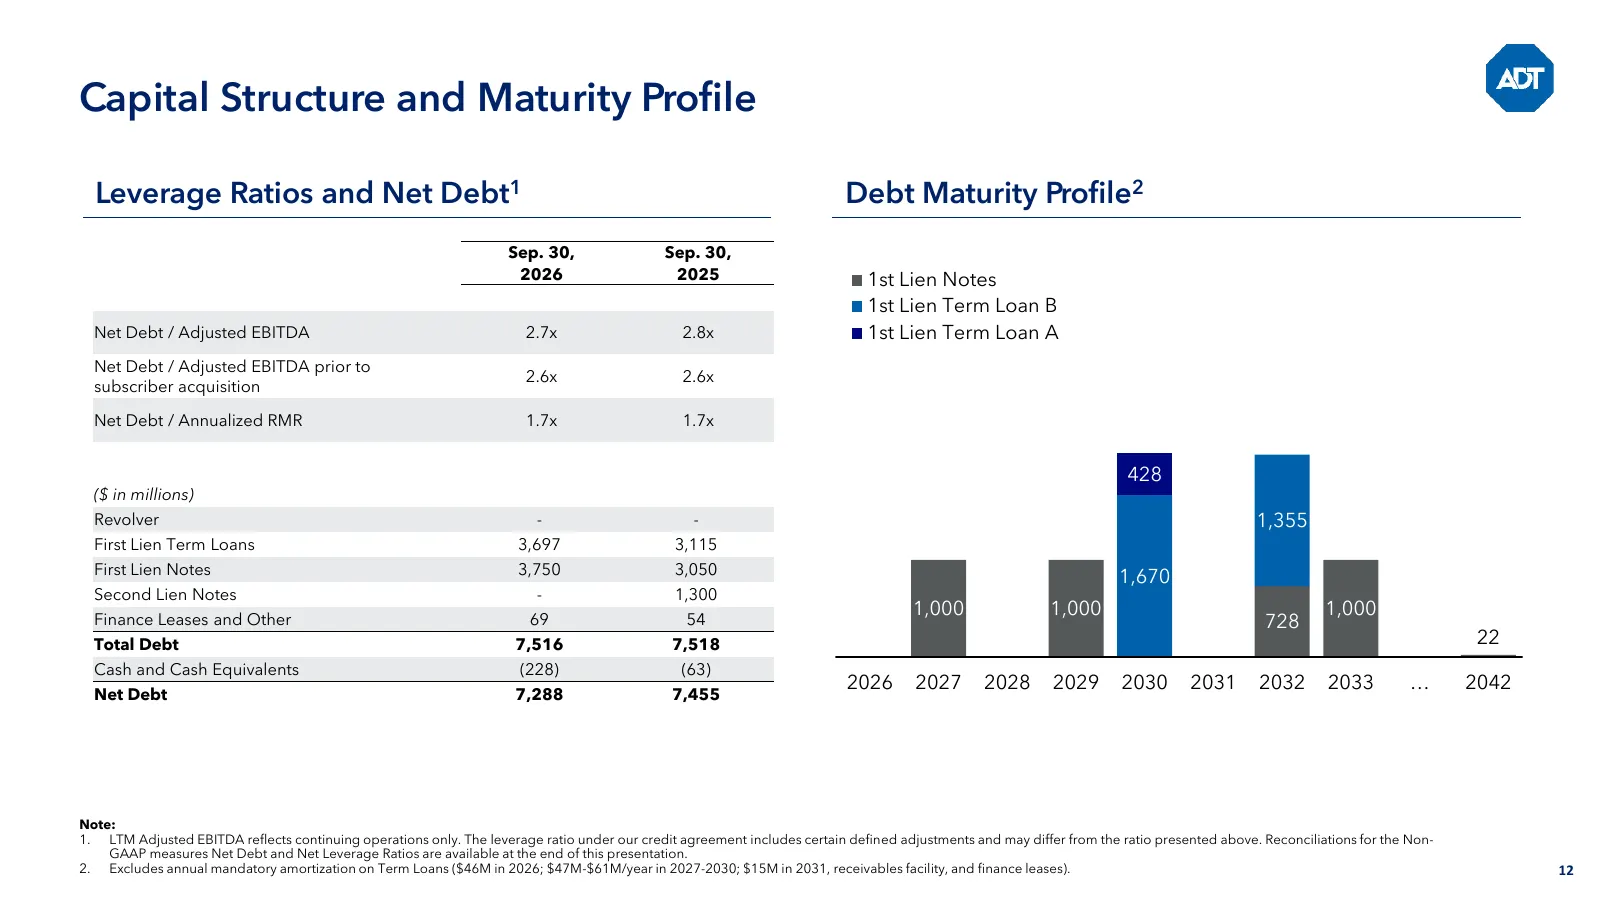
Slide 12: Capital Structure and Maturity Profile
Capital Structure and Maturity Profile Leverage Ratios and Net Debt1 Debt Maturity Profile2 Sep. 30, Sep. 30, 2026 2025 1st Lien Notes 1st Lien Term Loan B Net Debt / Adjusted EBITDA 2.7x 2.8x 1st Lien Term Loan A Net Debt / Adjusted EBITDA prior to 2.6x 2.6x subscriber acquisition Net Debt / Annual
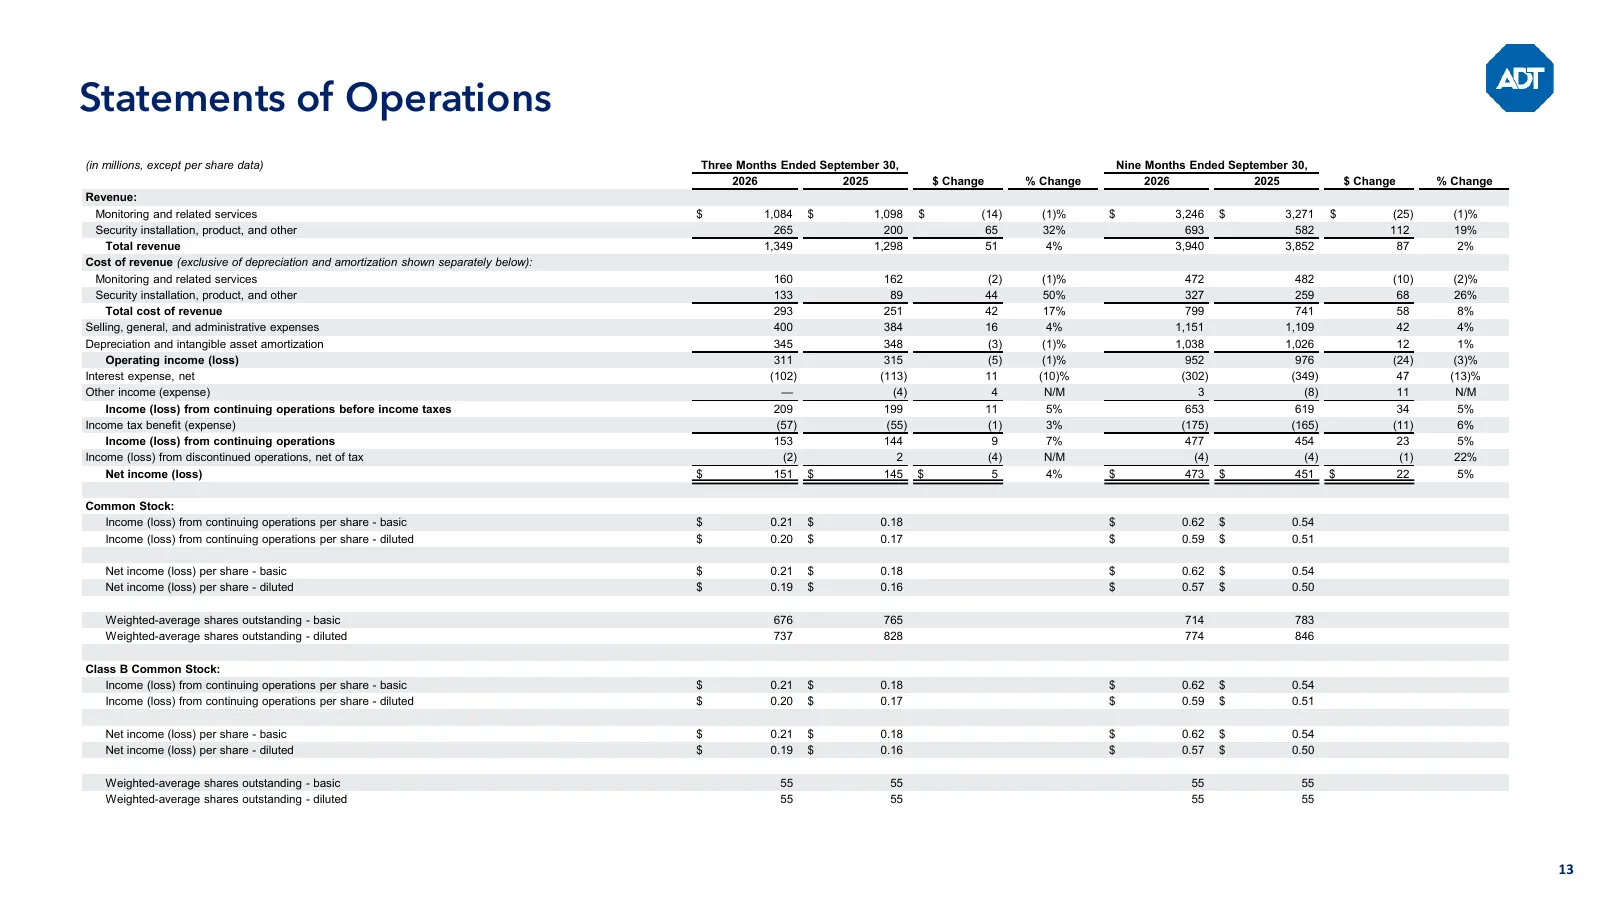
Slide 13: Statements of Operations
Statements of Operations (in millions, except per share data) Three Months Ended September 30, Nine Months Ended September 30, 2026 2025 $ Change % Change 2026 2025 $ Change % Change Revenue: Monitoring and related services $ 1,084 $ 1,098 $ (14) (1)% $ 3,246 $ 3,271 $ (25) (1)% Security installatio
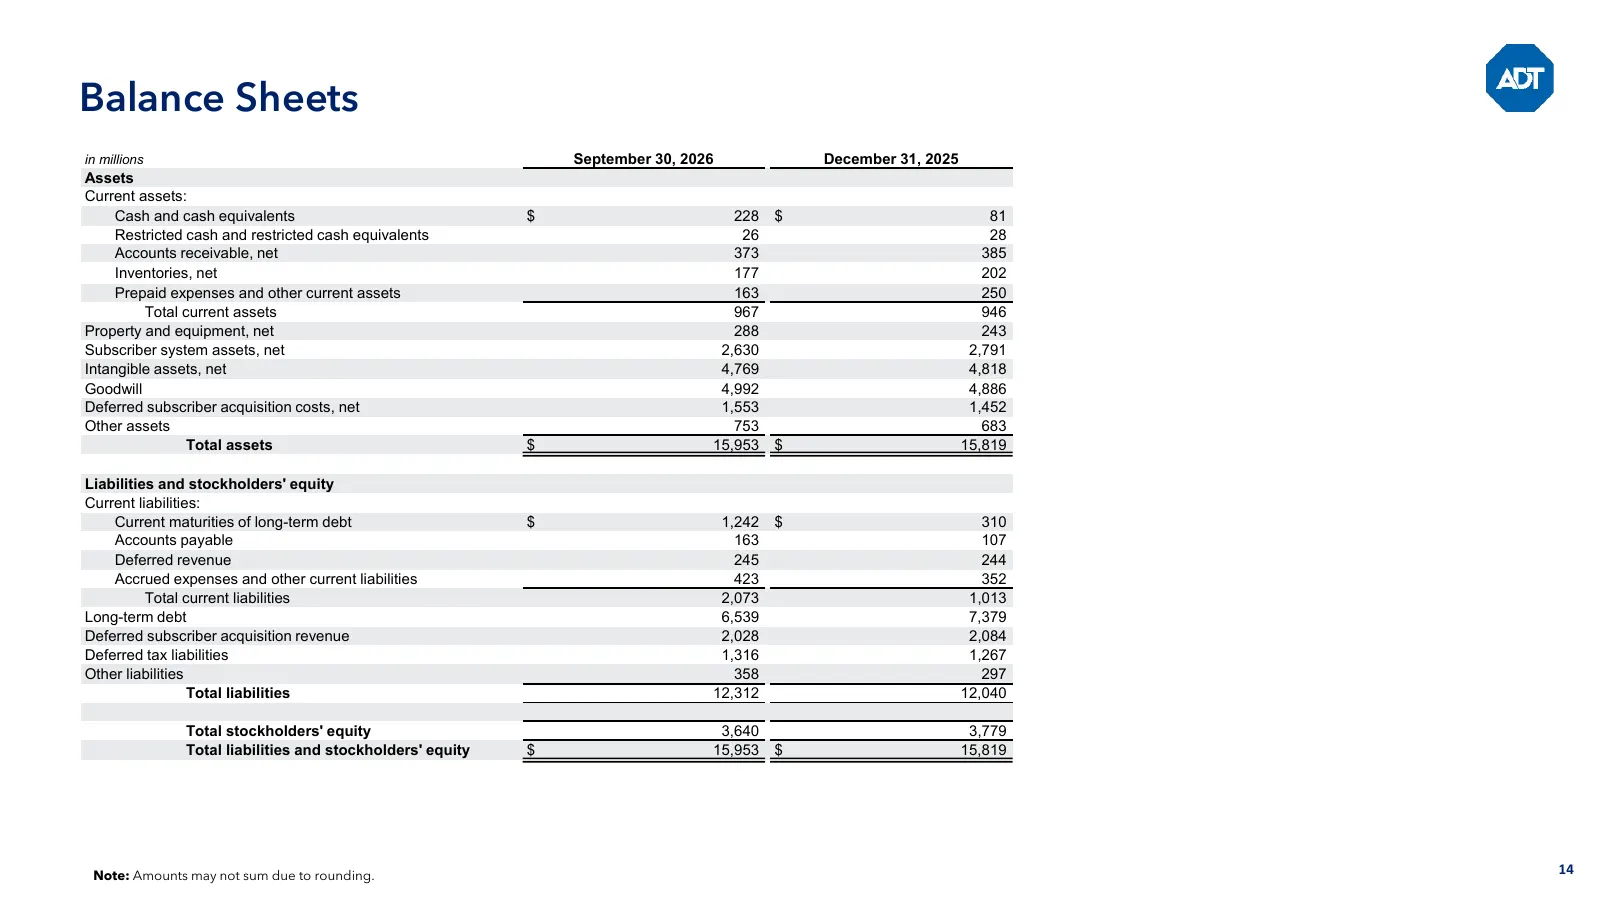
Slide 14: Balance Sheets
Balance Sheets in millions September 30, 2026 December 31, 2025 Assets Current assets: Cash and cash equivalents $ 228 $ 81 Restricted cash and restricted cash equivalents 26 28 Accounts receivable, net 373 385 Inventories, net 177 202 Prepaid expenses and other current assets 163 250 Total current
Slide 15: Statements of Cash Flows
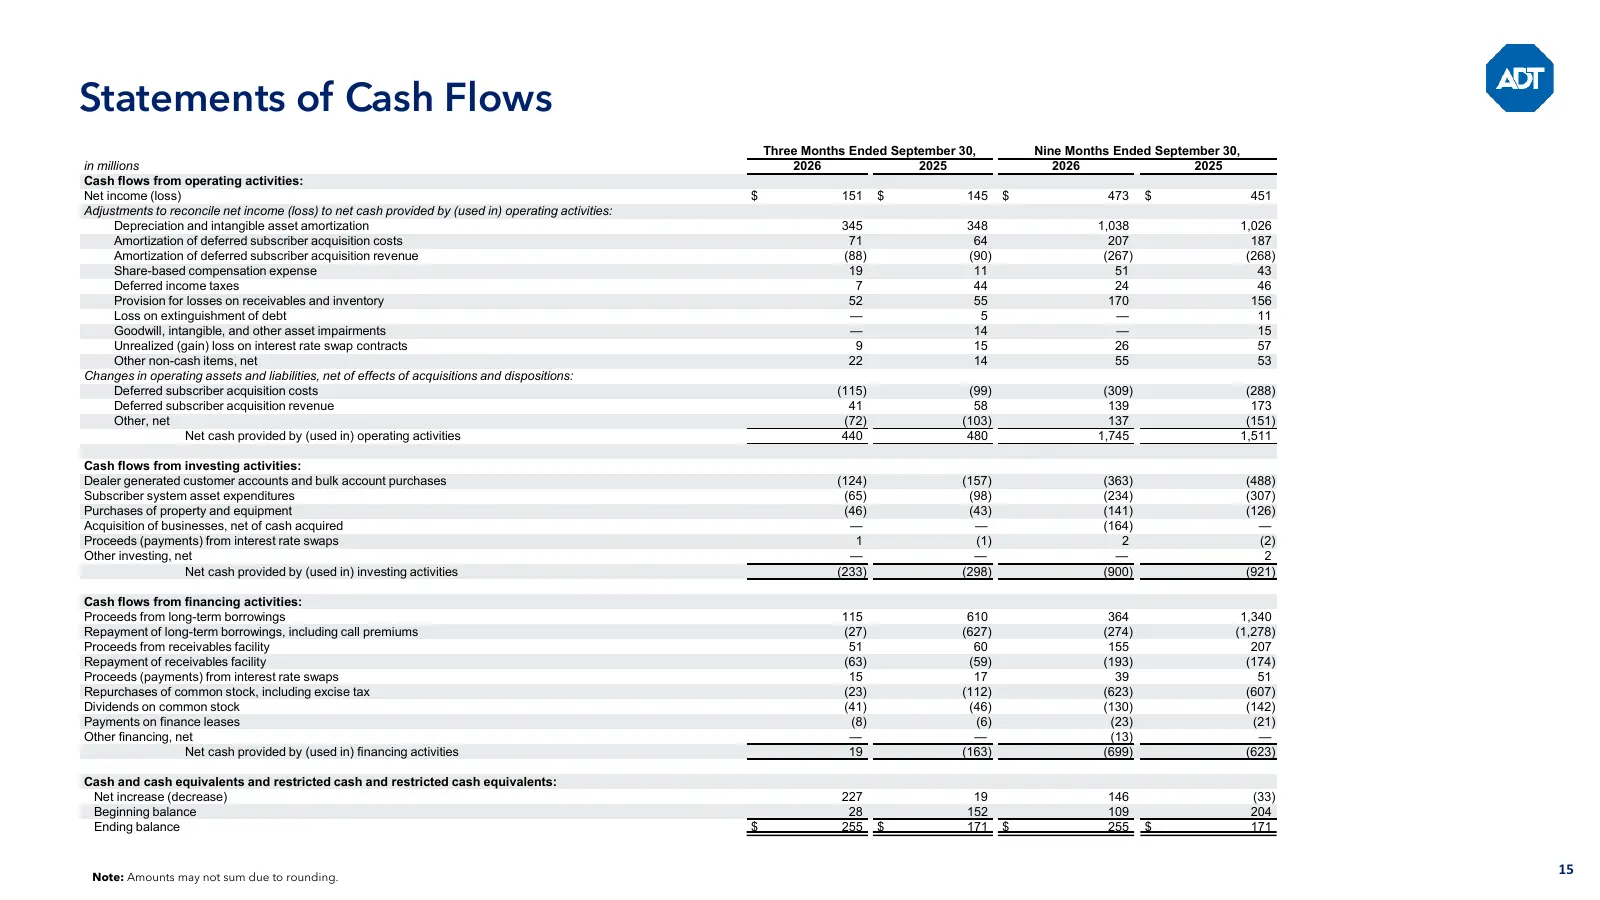
Statements of Cash Flows Three Months Ended September 30, Nine Months Ended September 30, in millions 2026 2025 2026 2025 Cash flows from operating activities: Net income (loss) $ 151 $ 145 $ 473 $ 451 Adjustments to reconcile net income (loss) to net cash provided by (used in) operating activities:
Slide 16: GAAP to Non-GAAP Reconciliations
GAAP to Non-GAAP Reconciliations ADT sometimes uses information (“non-GAAP financial measures”) that is derived from the consolidated financial statements, but that is not presented in accordance with accounting principles generally accepted in the U.S. (“GAAP”). Under SEC rules, non-GAAP financial
Slide 17: GAAP to Non-GAAP Reconciliations
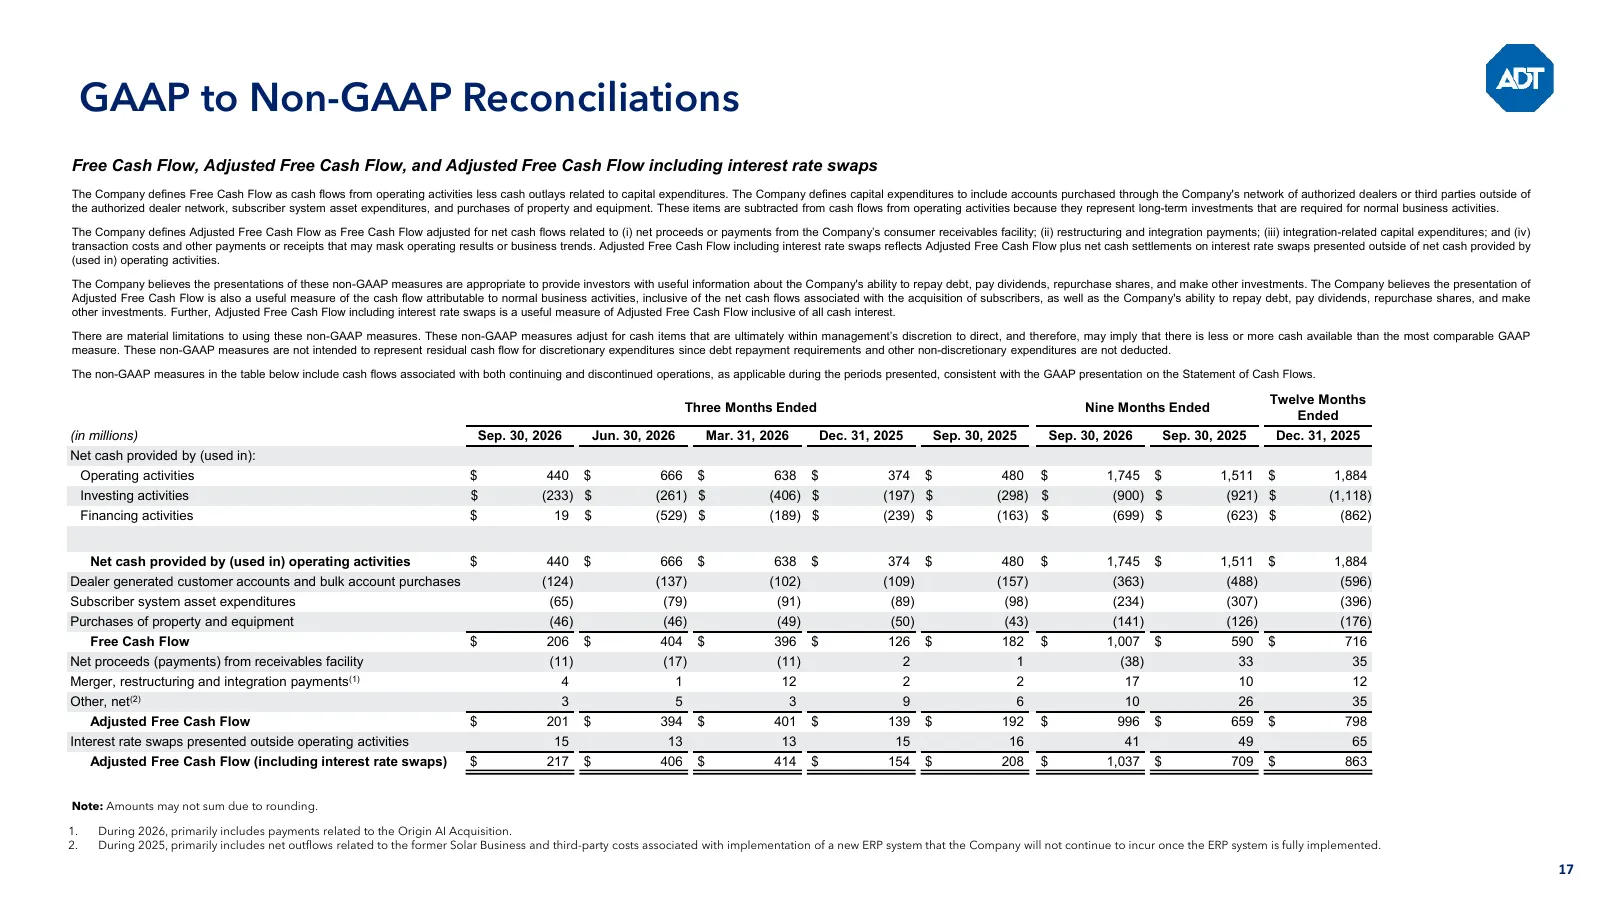
GAAP to Non-GAAP Reconciliations Free Cash Flow, Adjusted Free Cash Flow, and Adjusted Free Cash Flow including interest rate swaps The Company defines Free Cash Flow as cash flows from operating activities less cash outlays related to capital expenditures. The Company defines capital expenditures t
Slide 18: GAAP to Non-GAAP Reconciliations
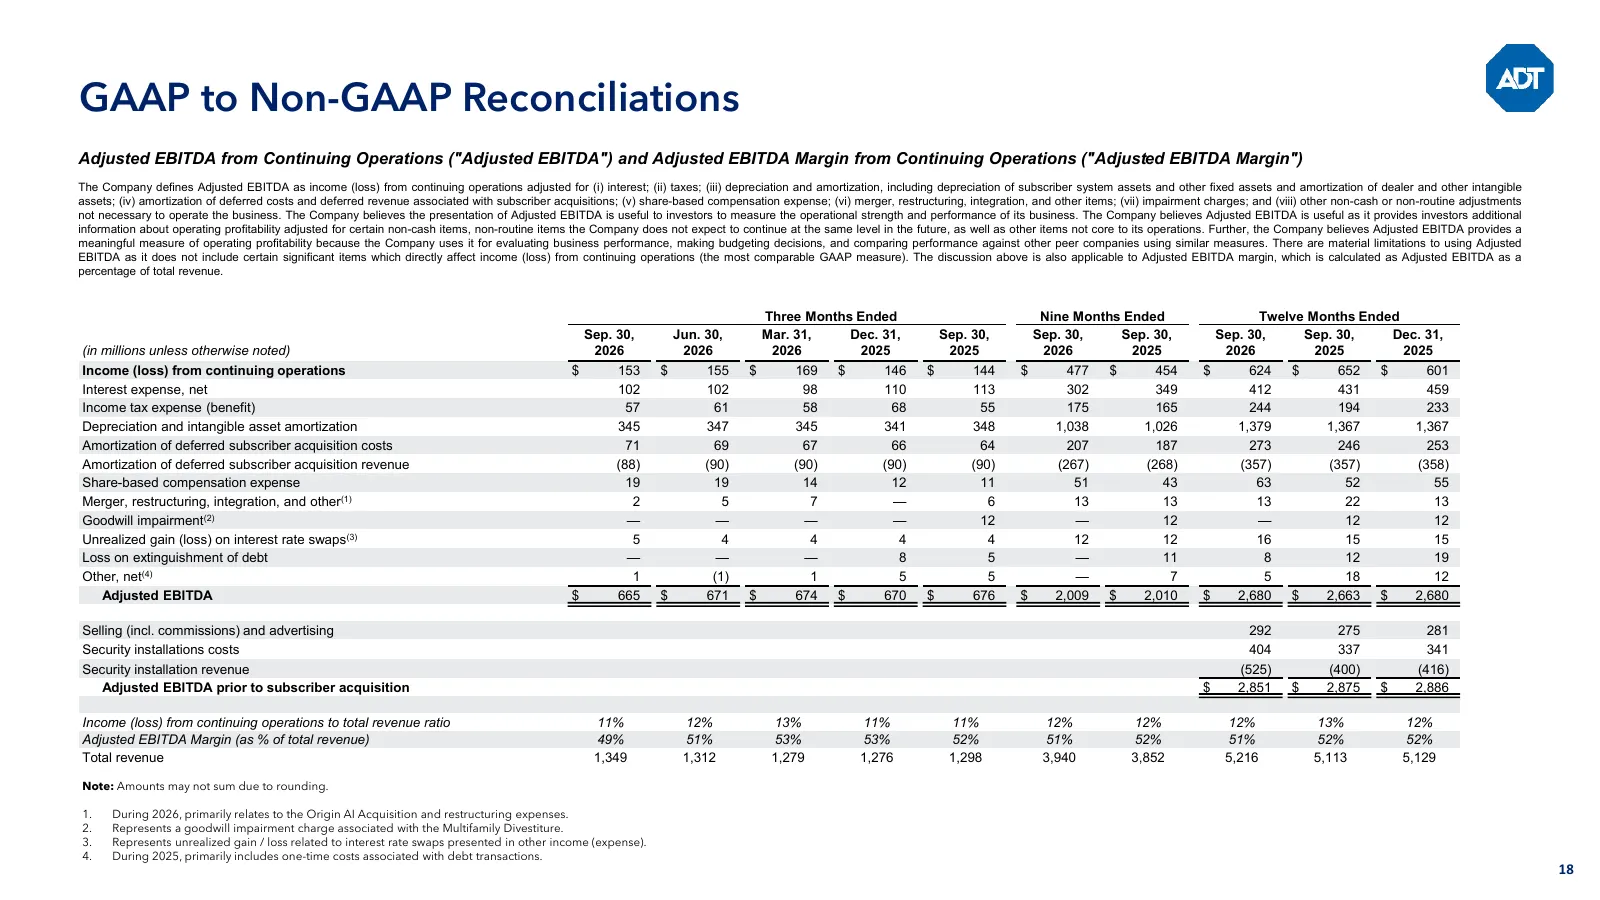
GAAP to Non-GAAP Reconciliations Adjusted EBITDA from Continuing Operations ("Adjusted EBITDA") and Adjusted EBITDA Margin from Continuing Operations ("Adjusted EBITDA Margin") The Company defines Adjusted EBITDA as income (loss) from continuing operations adjusted for (i) interest; (ii) taxes; (iii
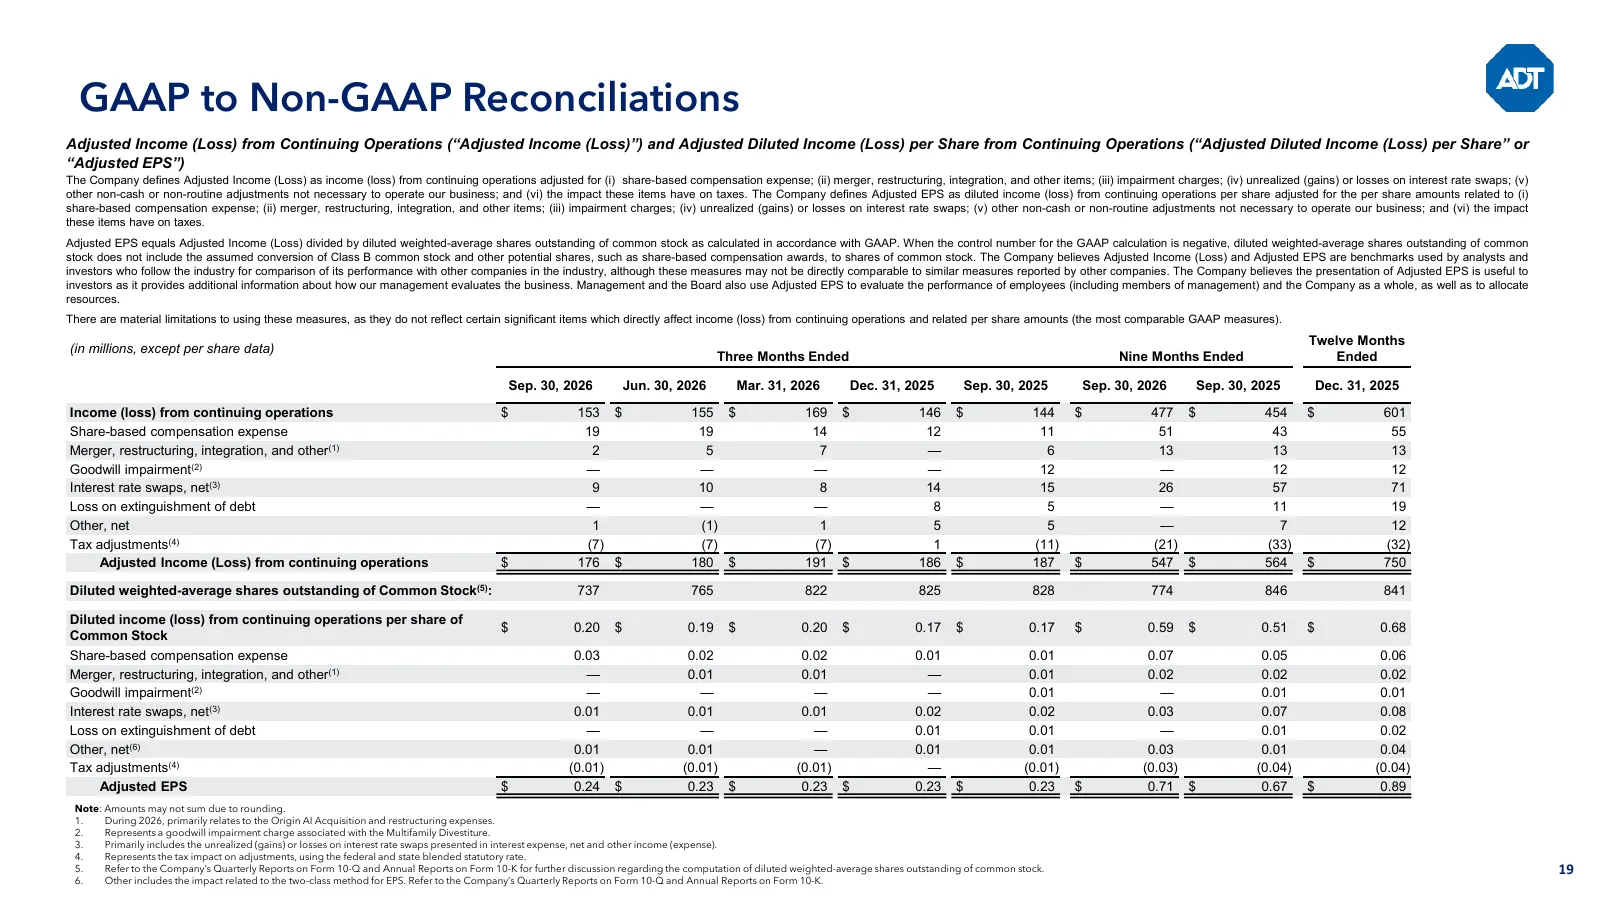
Slide 19: GAAP to Non-GAAP Reconciliations
GAAP to Non-GAAP Reconciliations Adjusted Income (Loss) from Continuing Operations (“Adjusted Income (Loss)”) and Adjusted Diluted Income (Loss) per Share from Continuing Operations (“Adjusted Diluted Income (Loss) per Share” or “Adjusted EPS”) The Company defines Adjusted Income (Loss) as income (l
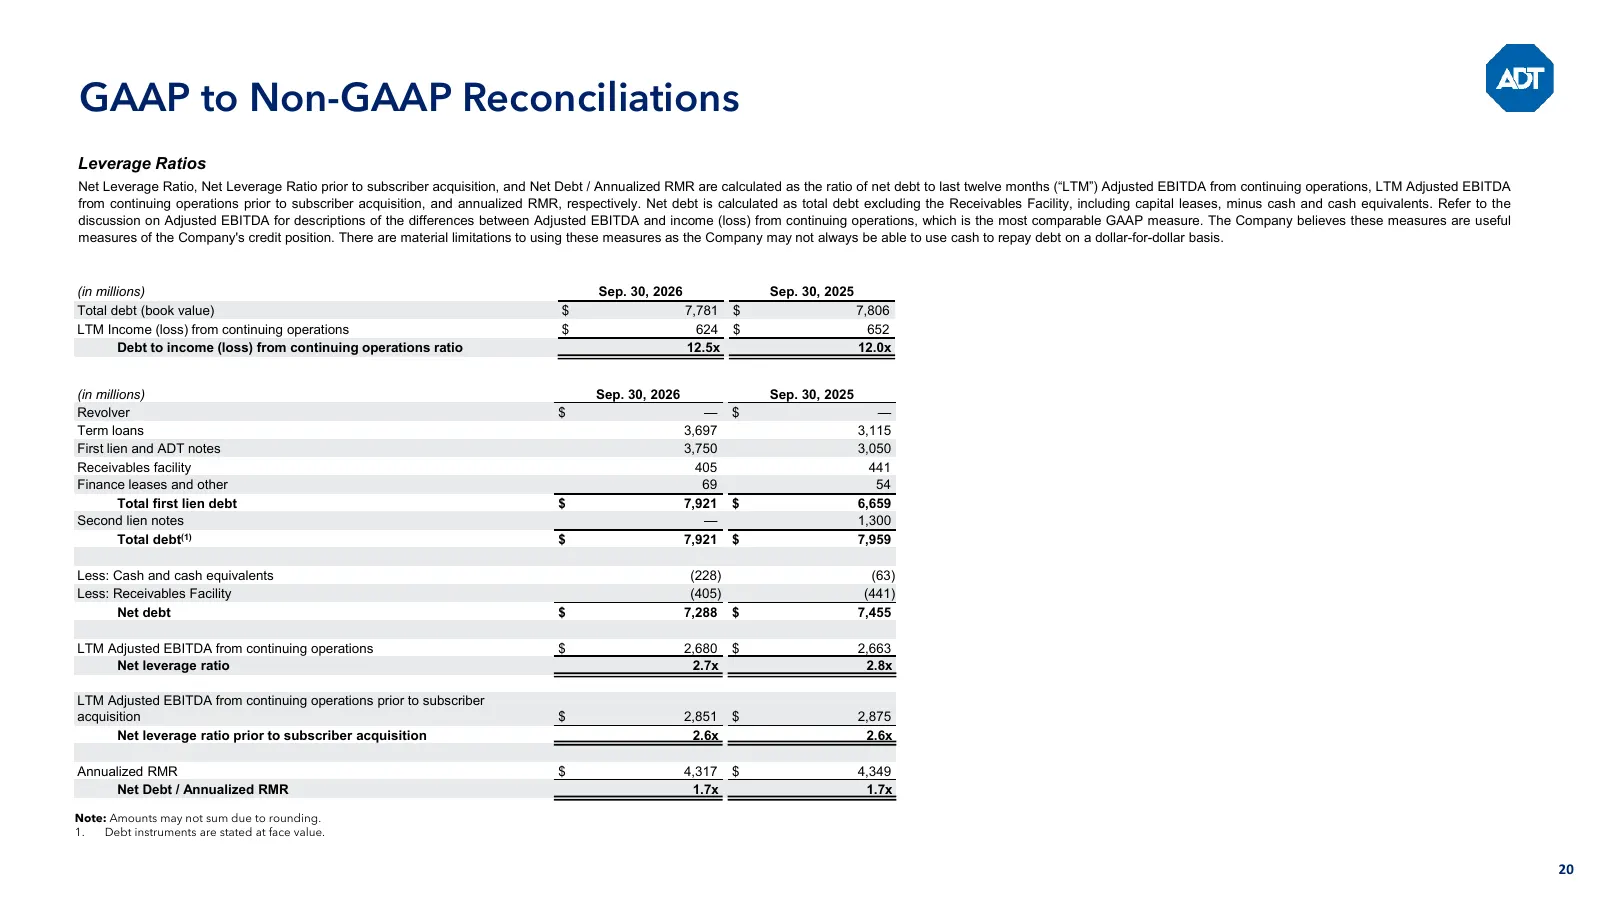
Slide 20: GAAP to Non-GAAP Reconciliations
GAAP to Non-GAAP Reconciliations Leverage Ratios Net Leverage Ratio, Net Leverage Ratio prior to subscriber acquisition, and Net Debt / Annualized RMR are calculated as the ratio of net debt to last twelve months (“LTM”) Adjusted EBITDA from continuing operations, LTM Adjusted EBITDA from continuing

Slide 21: For More Information
For More Information +1 (888) 238-8525 investorrelations@adt.com 1501 Yamato Road Boca Raton, FL 33431 United States
Source: 6ix earnings call
More decks from ADT Inc.
 Q2 2026 Earnings Presentation26 slides · Jul 30, 2026
 Q1 2026 Earnings Presentation24 slides · Apr 30, 2026
 Q4 2025 Earnings Presentation53 slides · Mar 2, 2026
 Q3 2025 Earnings Presentation38 slides · Nov 4, 2025
 Q2 2025 Earnings Presentation38 slides · Jul 24, 2025
 Q1 2025 Earnings Presentation37 slides · Apr 24, 2025