Ideal Holdings S.A. · ATHEX:INTEK
Ideal — Investor Presentation (January 2024)
27 slides from Ideal's investor presentation, January 2024

Slide 1: Ideal Holdings Corporate Presentation January 2024
IDEAL HOLDINGS CORPORATE PRESENTATION JANUARY 2024
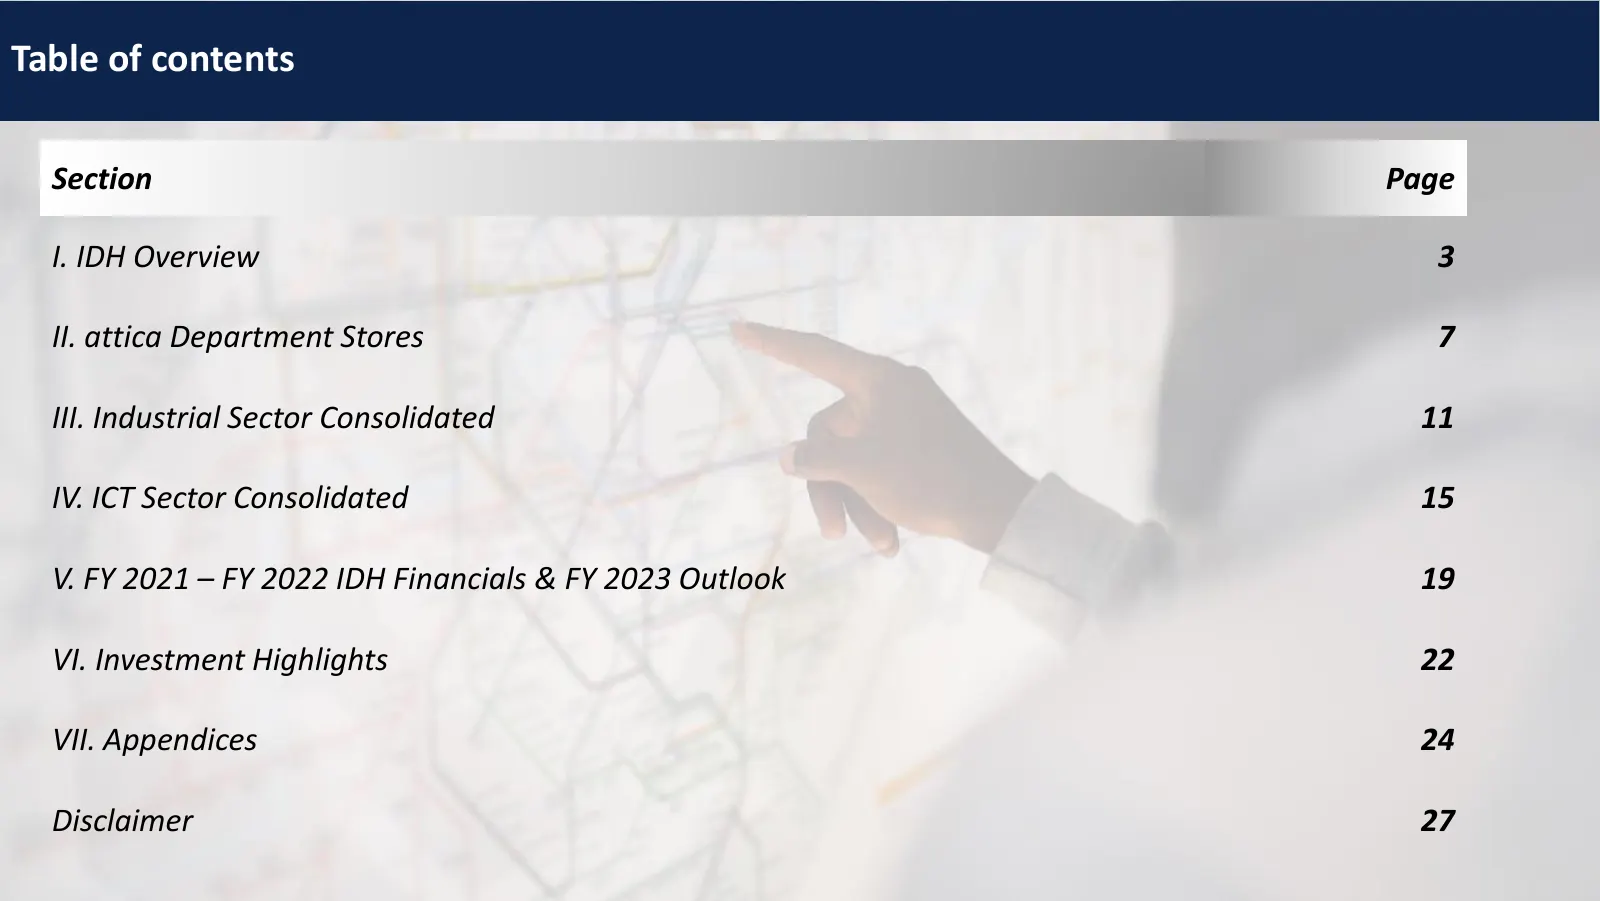
Slide 2: Table of contents
Table of contents Section Page I. IDH Overview 3 II. attica Department Stores 7 III. Industrial Sector Consolidated 11 IV. ICT Sector Consolidated 15 V. FY 2021 – FY 2022 IDH Financials & FY 2023 Outlook 19 VI. Investment Highlights 22 VII. Appendices 24 Disclaimer 27

Slide 3: I. IDH Overview
I. IDH Overview
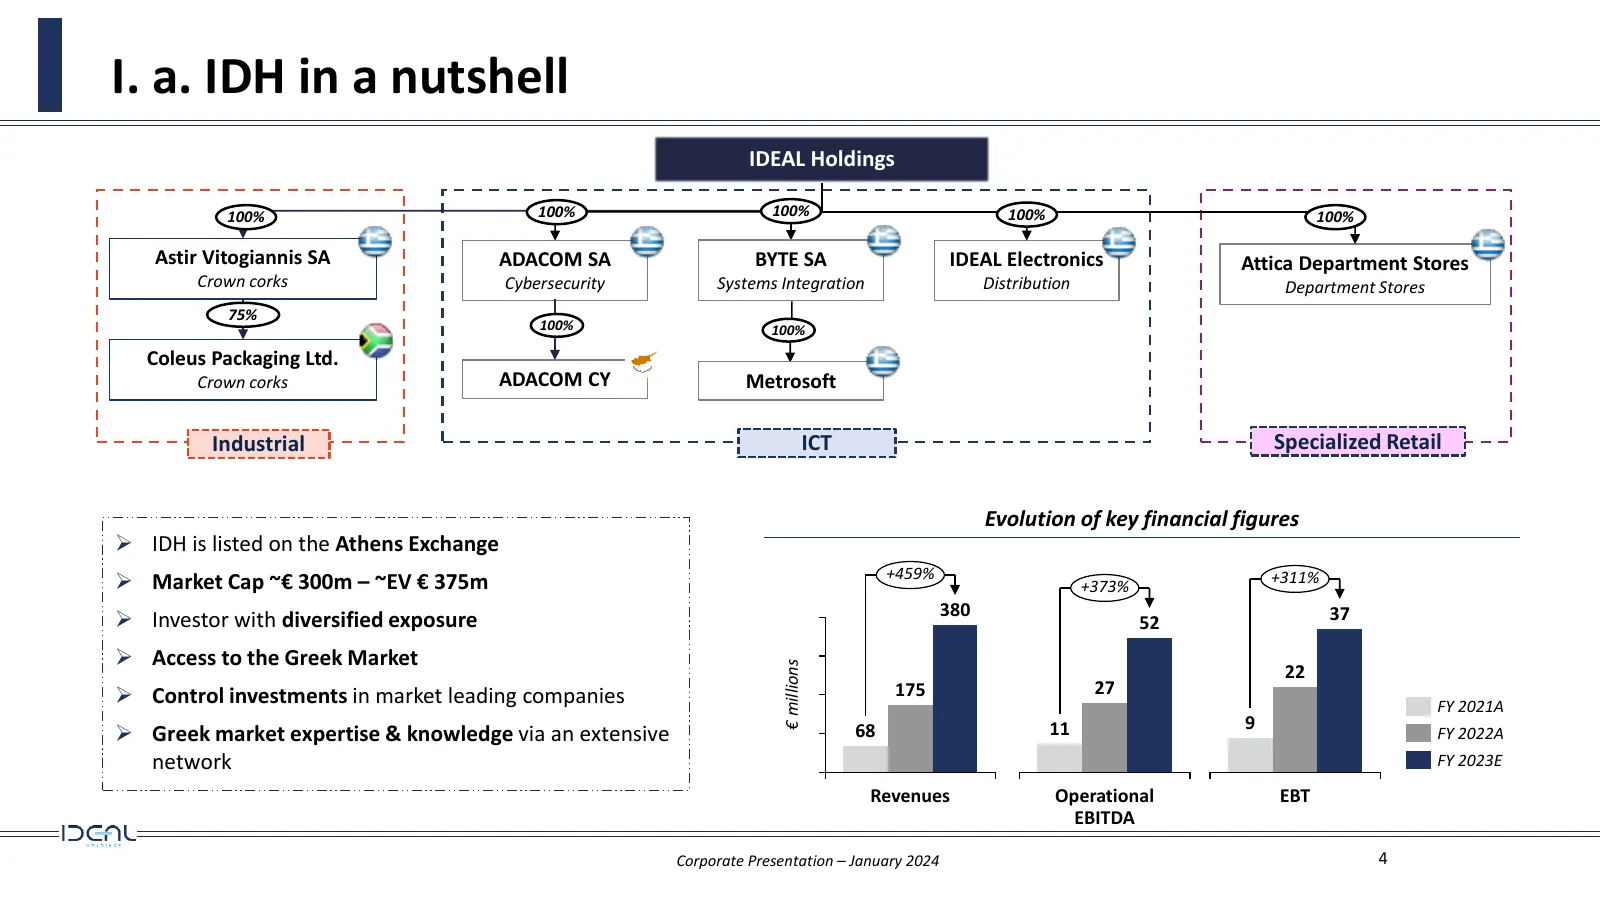
Slide 4: I. a. IDH in a nutshell
I. a. IDH in a nutshell IDEAL Holdings 100% 100% 100% 100% 100% Astir Vitogiannis SA ADACOM SA BYTE SA IDEAL Electronics Attica Department Stores Crown corks Cybersecurity Systems Integration Distribution Department Stores 75% 100% 100% Coleus Packaging Ltd. Crown corks ADACOM CY Metrosoft Industria
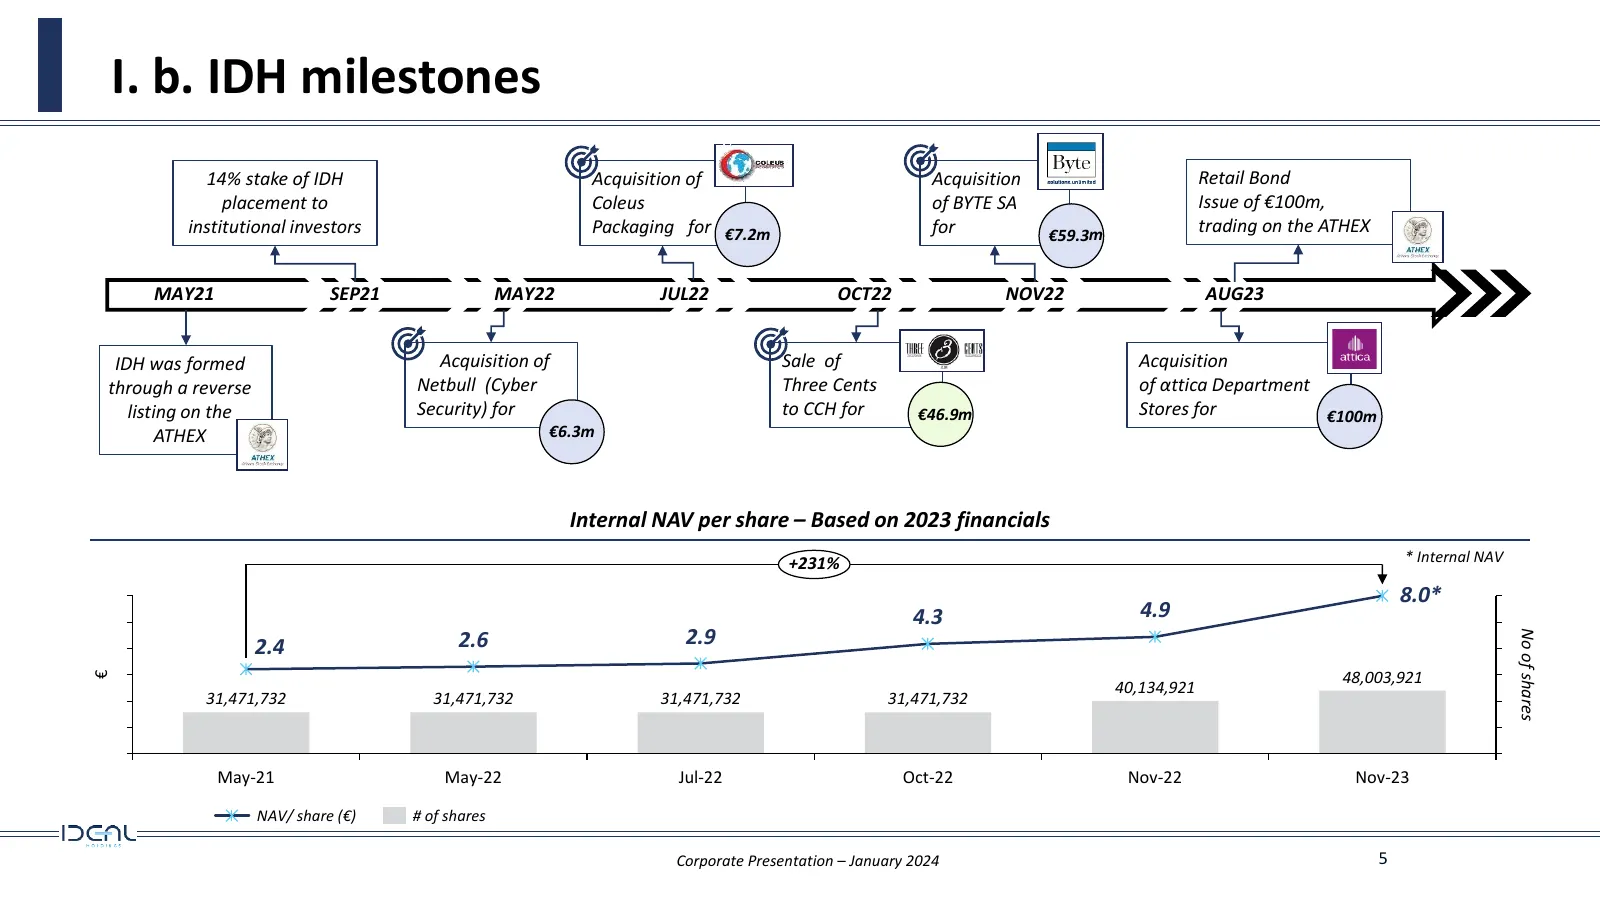
Slide 5: I. b. IDH milestones
I. b. IDH milestones 14% stake of IDH Acquisition of Acquisition Retail Bond placement to Coleus of BYTE SA Issue of €100m, institutional investors Packaging for €7.2m for €59.3m trading on the ATHEX MAY21 SEP21 MAY22 JUL22 OCT22 NOV22 AUG23 IDH was formed Acquisition of Sale of Acquisition through
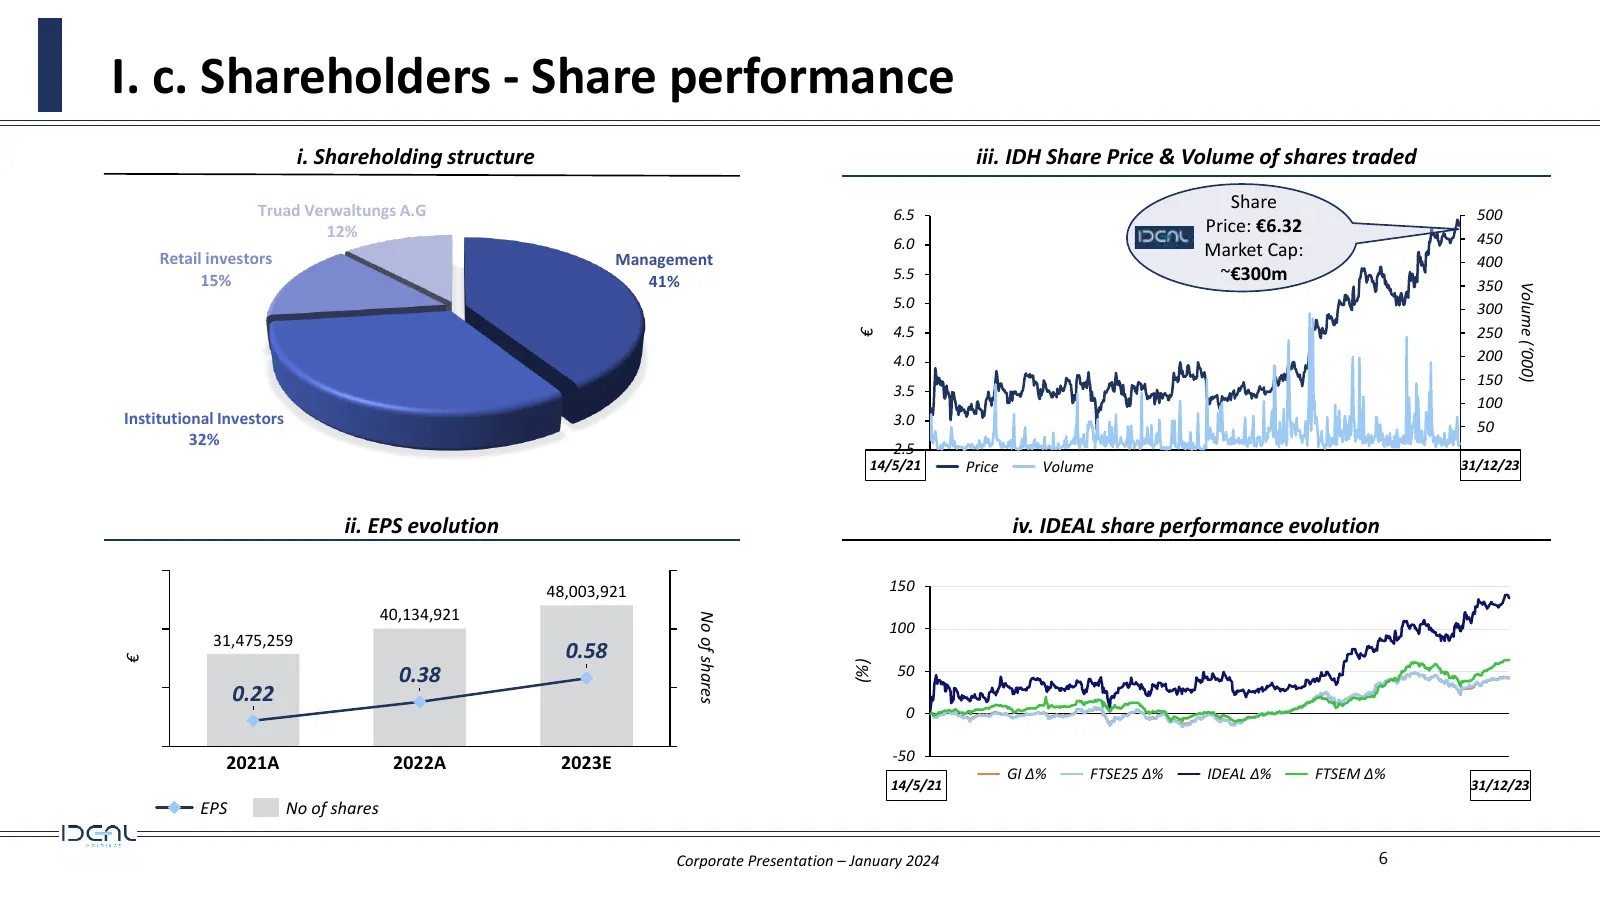
Slide 6: I. c. Shareholders - Share performance
I. c. Shareholders - Share performance i. Shareholding structure iii. IDH Share Price & Volume of shares traded Truad Verwaltungs A.G Share 6.5 500 12% Price: €6.32 6.0 450 Retail investors Management Market Cap: 400 15% 41% 5.5 ~€300m 350 Volume (‘000) 5.0 300 4.5 250 € 4.0 200 150 3.5 100 Institut

Slide 7: II. attica Department Stores
II. attica Department Stores
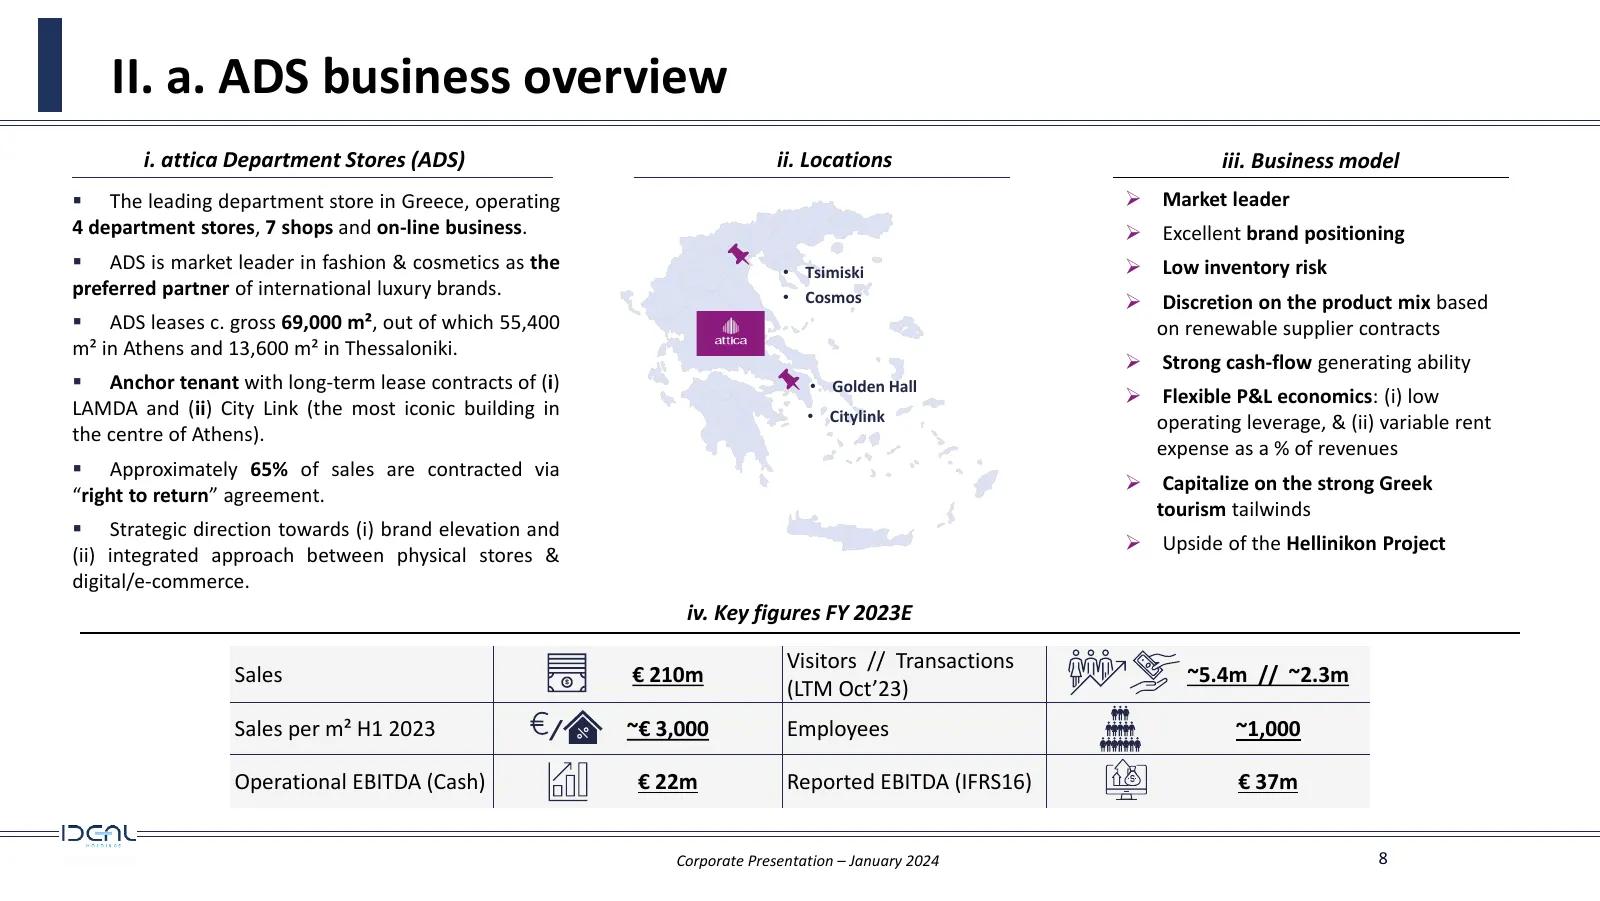
Slide 8: II. a. ADS business overview
II. a. ADS business overview i. attica Department Stores (ADS) ii. Locations iii. Business model ▪ The leading department store in Greece, operating ➢ Market leader 4 department stores, 7 shops and on-line business. ➢ Excellent brand positioning ▪ ADS is market leader in fashion & cosmetics as the •
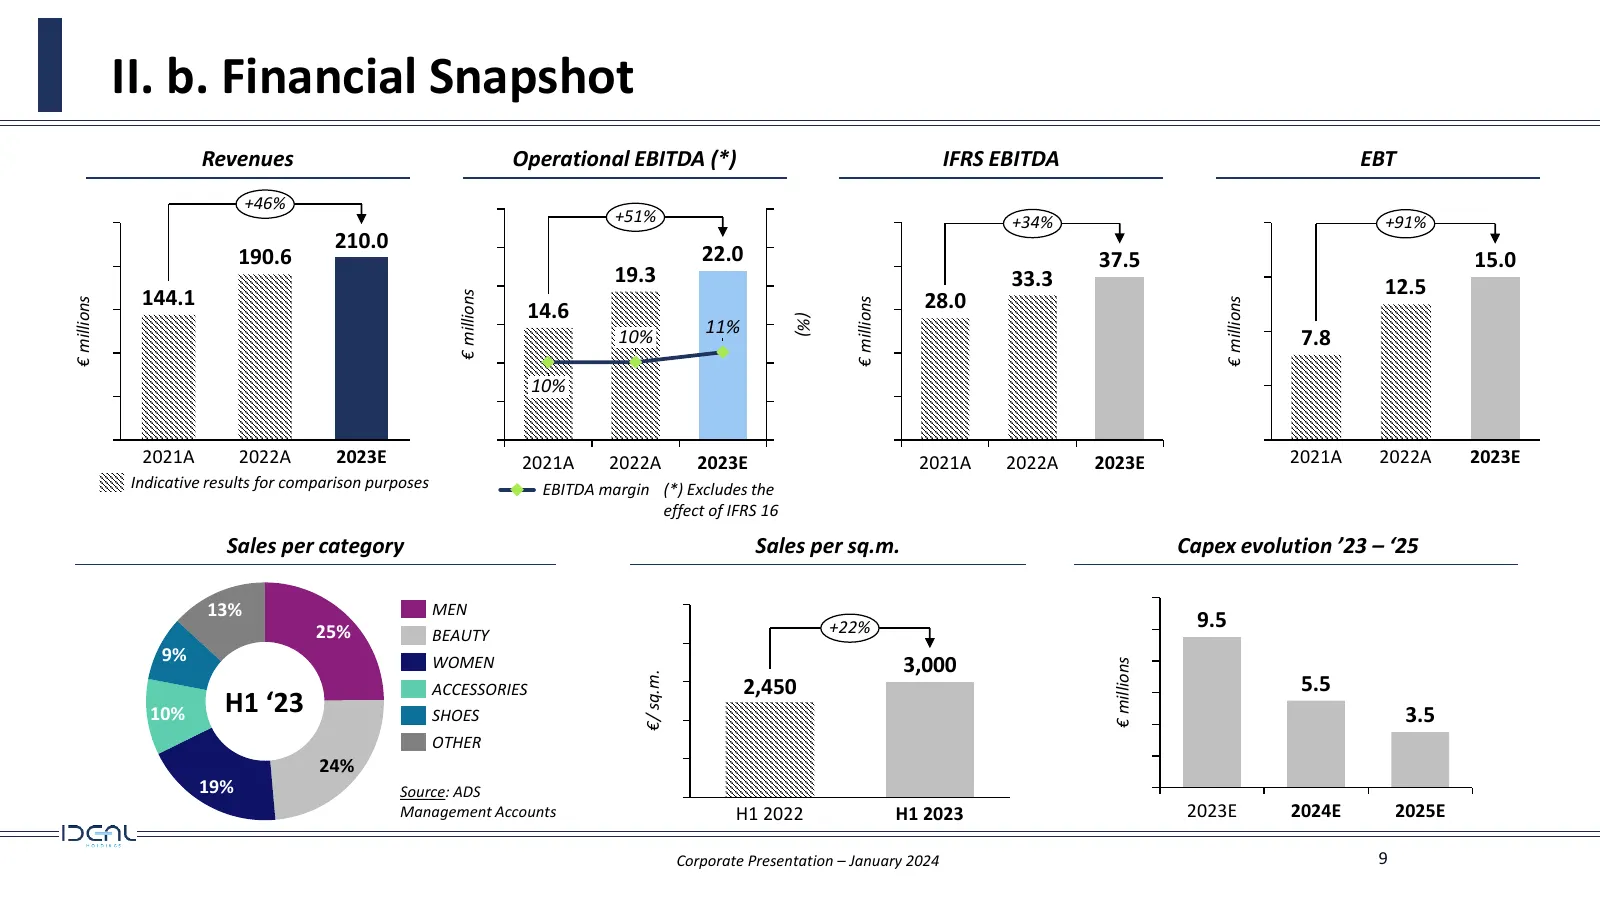
Slide 9: II. b. Financial Snapshot
II. b. Financial Snapshot Revenues Operational EBITDA (*) IFRS EBITDA EBT +46% +51% +34% +91% 210.0 190.6 22.0 37.5 15.0 19.3 33.3 144.1 12.5 € millions 28.0 € millions € millions € millions 14.6 (%) 11% 10% 7.8 10% 2021A 2022A 2023E 2021A 2022A 2023E 2021A 2022A 2023E 2021A 2022A 2023E Indicative r
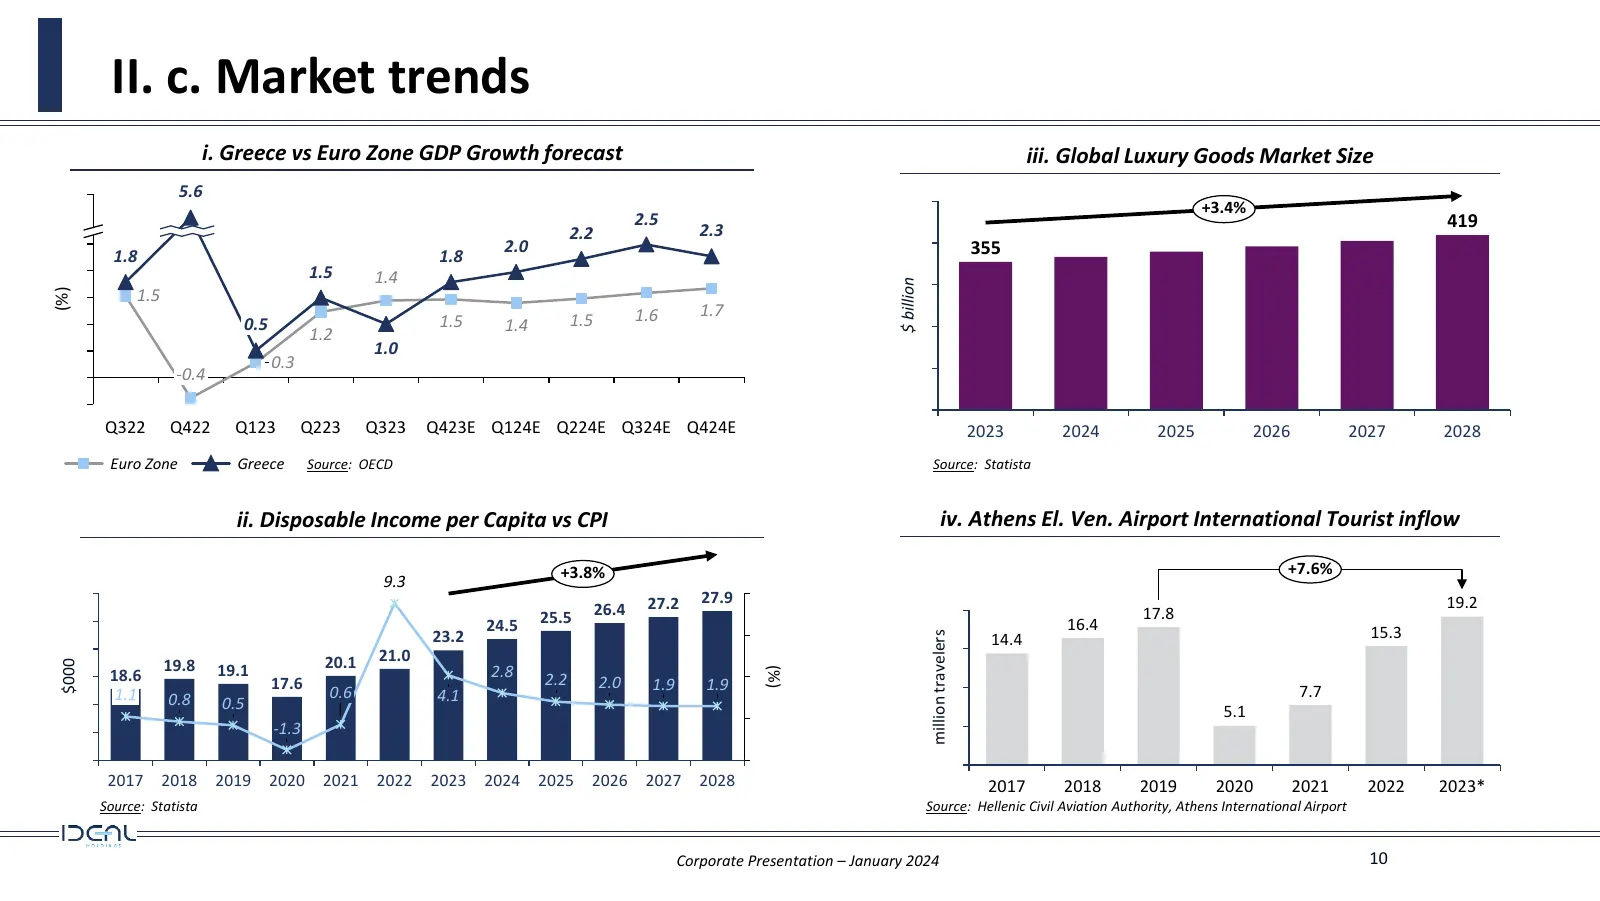
Slide 10: II. c. Market trends
II. c. Market trends i. Greece vs Euro Zone GDP Growth forecast iii. Global Luxury Goods Market Size 5.6 +3.4% 2.5 419 2.2 2.3 2.0 355 1.8 1.8 1.5 1.4 $ billion (%) 1.5 1.6 1.7 0.5 1.5 1.4 1.5 1.2 1.0 0.3 -0.4 Q322 Q422 Q123 Q223 Q323 Q423E Q124E Q224E Q324E Q424E 2023 2024 2025 2026 2027 2028 Euro

Slide 11: III. Industrial Sector Consolidated
III. Industrial Sector Consolidated
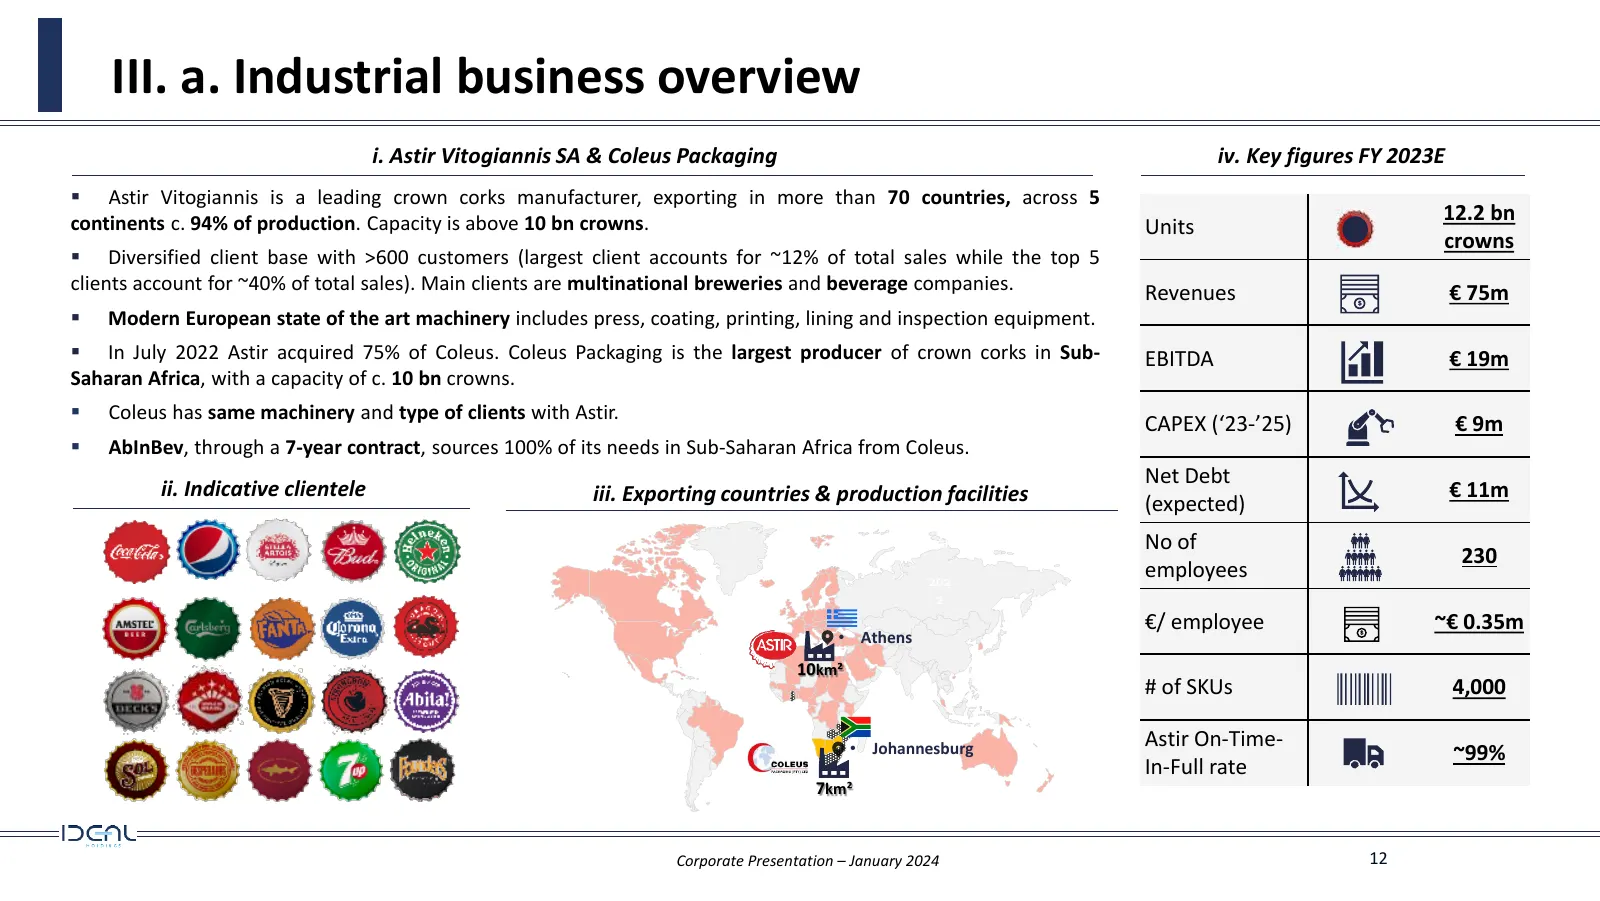
Slide 12: III. a. Industrial business overview
III. a. Industrial business overview i. Astir Vitogiannis SA & Coleus Packaging iv. Key figures FY 2023E ▪ Astir Vitogiannis is a leading crown corks manufacturer, exporting in more than 70 countries, across 5 continents c. 94% of production. Capacity is above 10 bn crowns. 12.2 bn Units crowns ▪ Di
Slide 13: III. b. Financial Snapshot
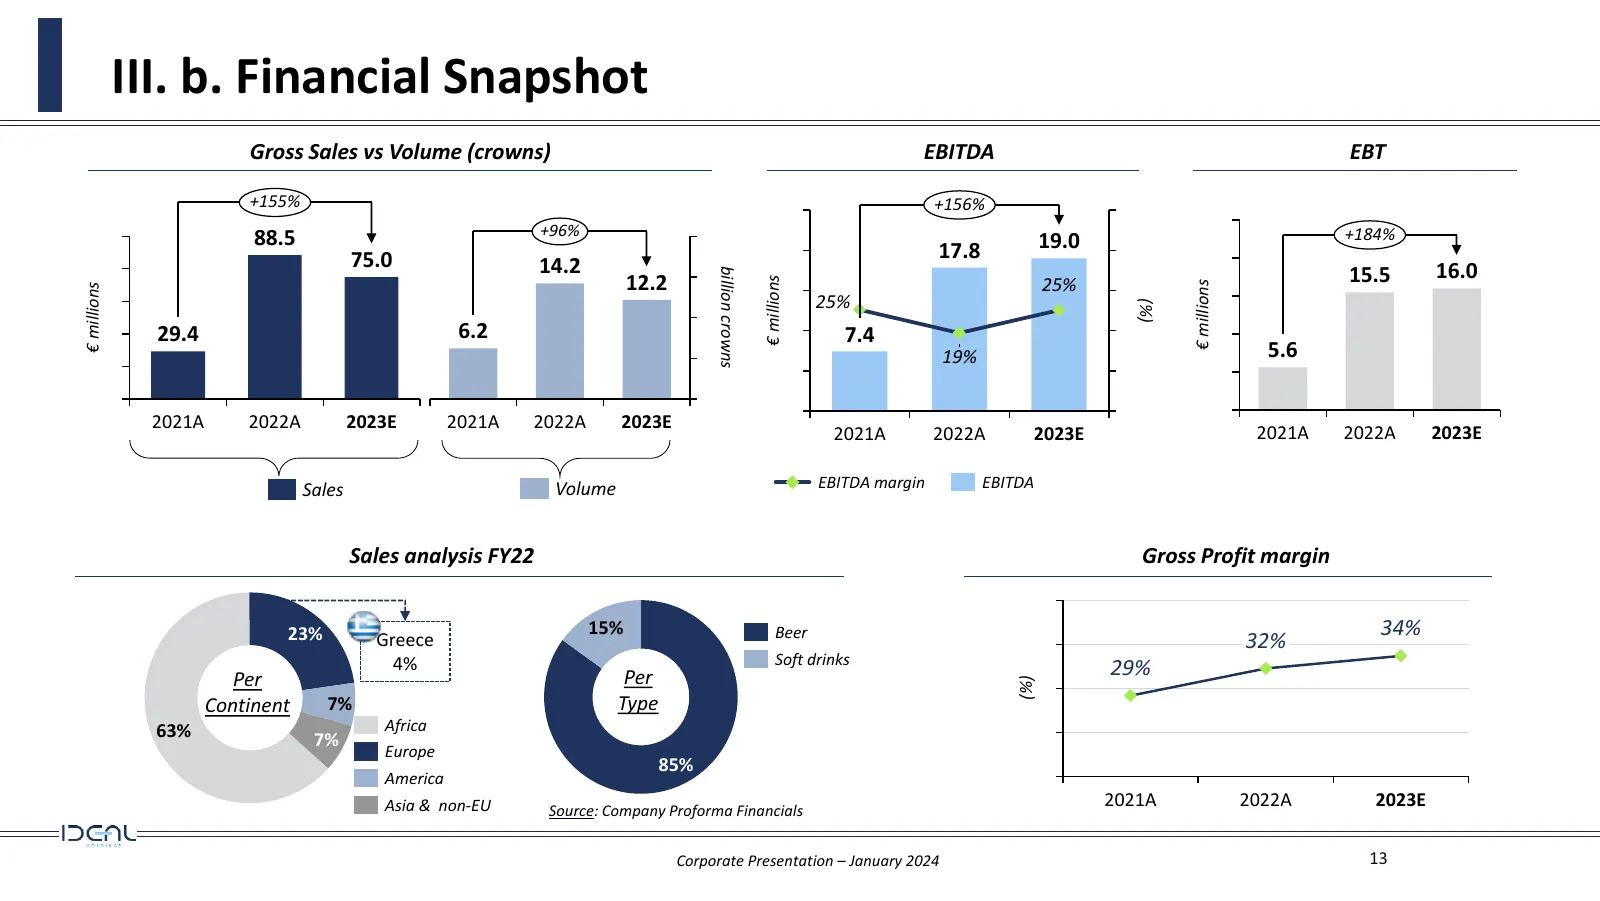
III. b. Financial Snapshot Gross Sales vs Volume (crowns) EBITDA EBT +155% +156% +96% +184% 88.5 19.0 75.0 17.8 14.2 15.5 16.0 billion crowns 12.2 € millions 25% € millions € millions 25% (%) 29.4 6.2 7.4 19% 5.6 2021Α 2022Α 2023Ε 2021A 2022A 2023E 2021A 2022A 2023E 2021A 2022A 2023E Sales Volume EB
Slide 14: III. c. Market trends
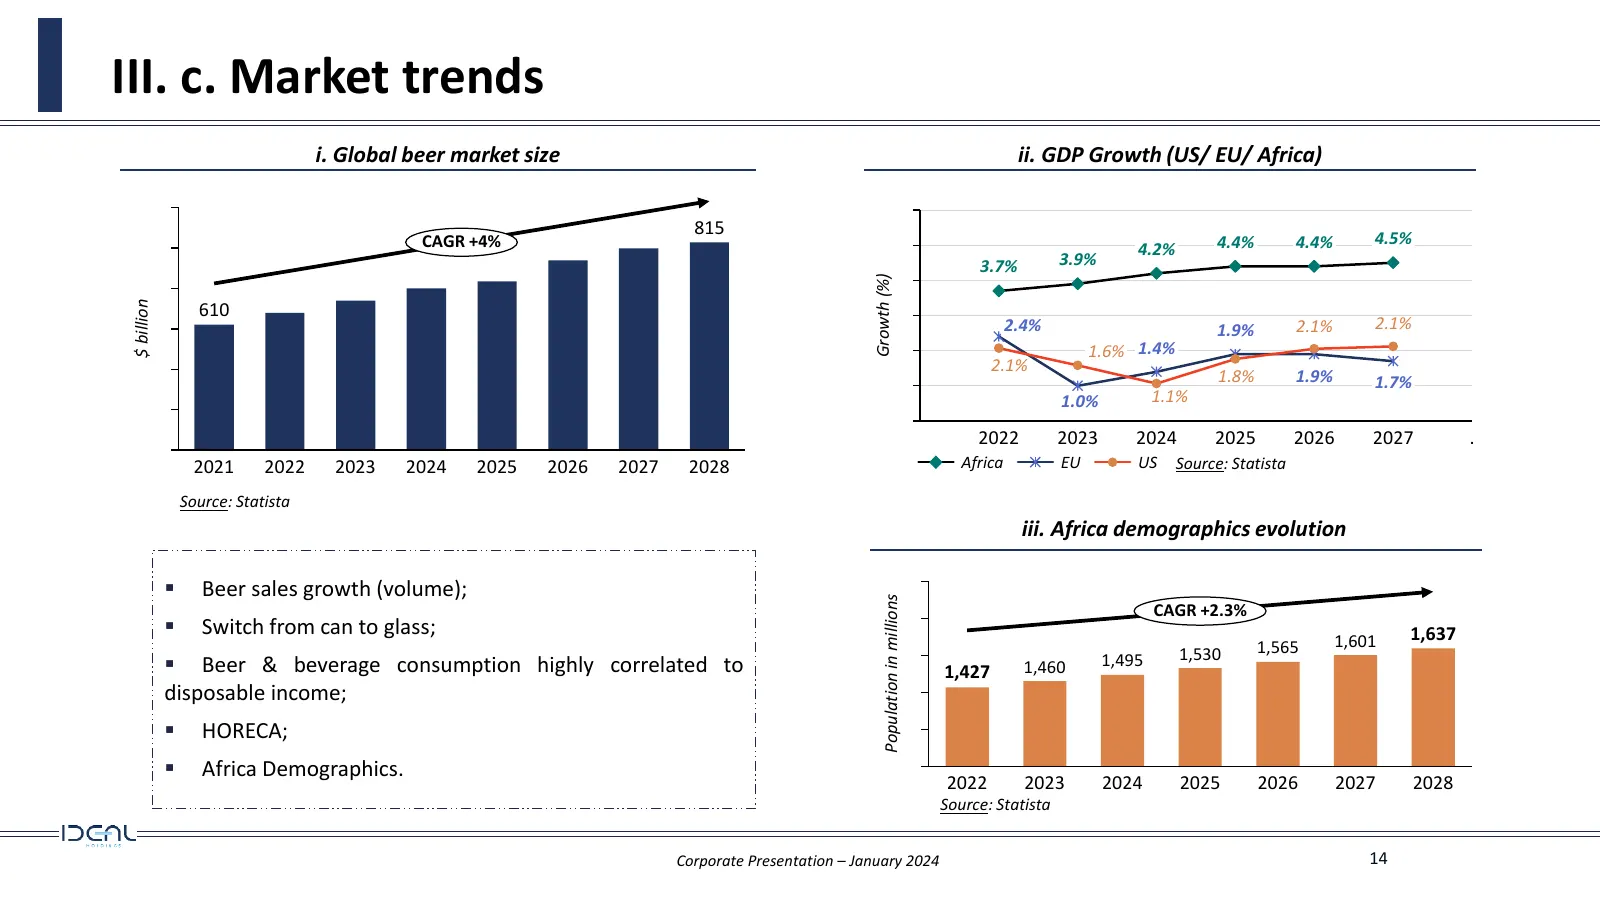
III. c. Market trends i. Global beer market size ii. GDP Growth (US/ EU/ Africa) 815 CAGR +4% 4.4% 4.4% 4.5% 4.2% 3.7% 3.9% Growth (%) $ billion 610 2.4% 1.9% 2.1% 2.1% 1.6% 1.4% 2.1% 1.8% 1.9% 1.7% 1.0% 1.1% 2022 2023 2024 2025 2026 2027 . 2021 2022 2023 2024 2025 2026 2027 2028 Africa EU US Source

Slide 15: IV. ICT Sector Consolidated
IV. ICT Sector Consolidated
Slide 16: IV. a. ICT business overview
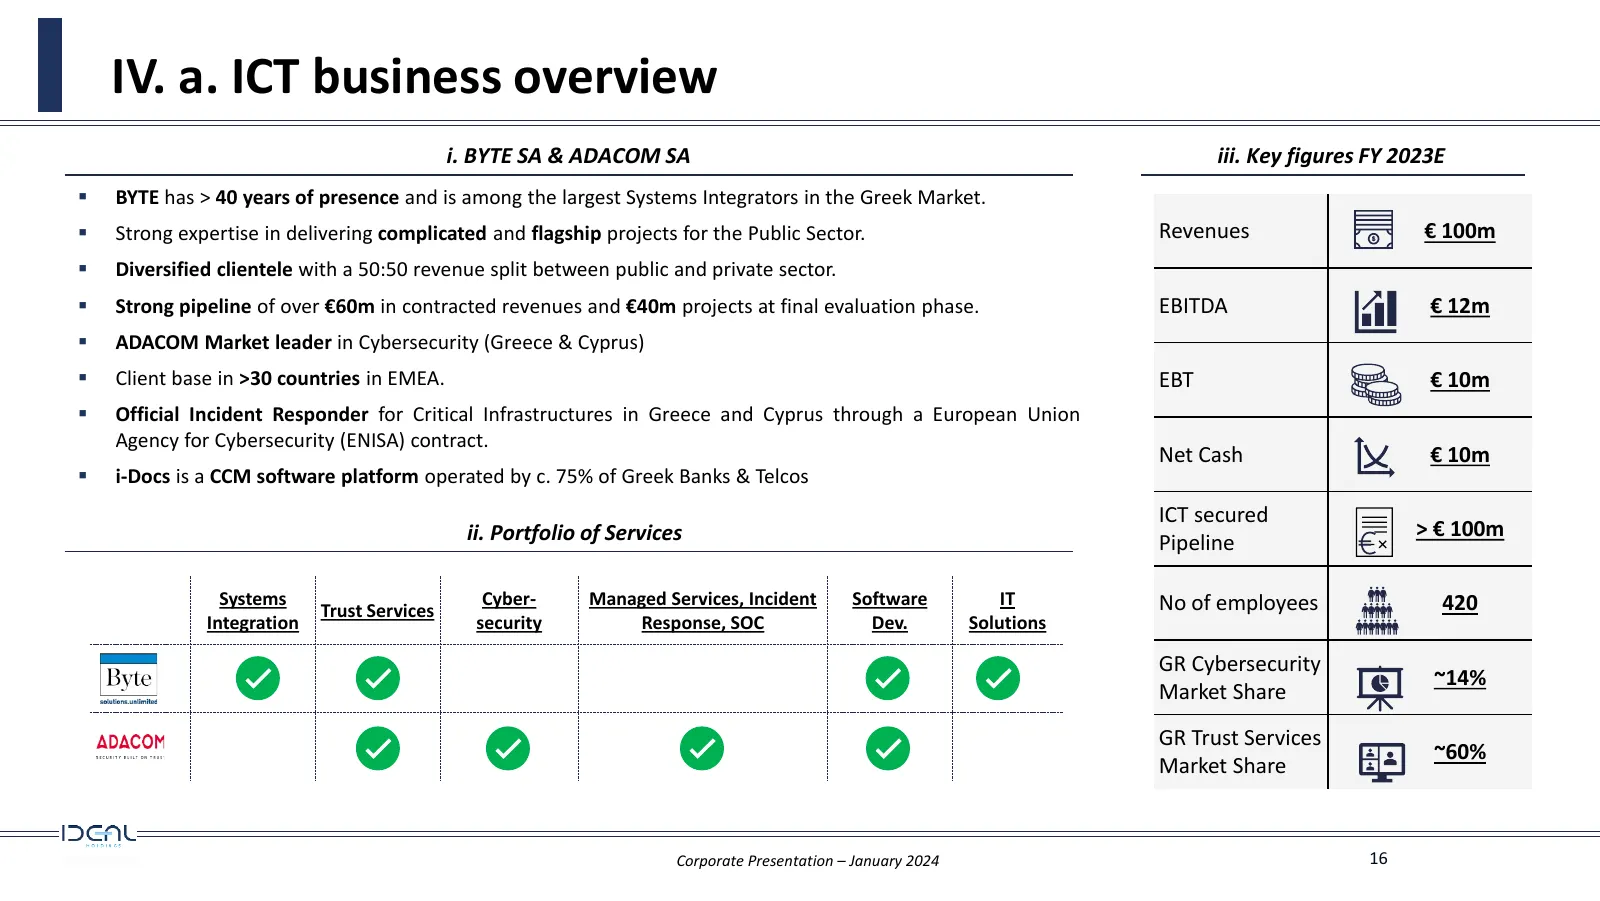
IV. a. ICT business overview i. BYTE SA & ADACOM SA iii. Key figures FY 2023E ▪ BYTE has > 40 years of presence and is among the largest Systems Integrators in the Greek Market. ▪ Strong expertise in delivering complicated and flagship projects for the Public Sector. Revenues € 100m ▪ Diversified cl
Slide 17: IV. b. Financial Snapshot
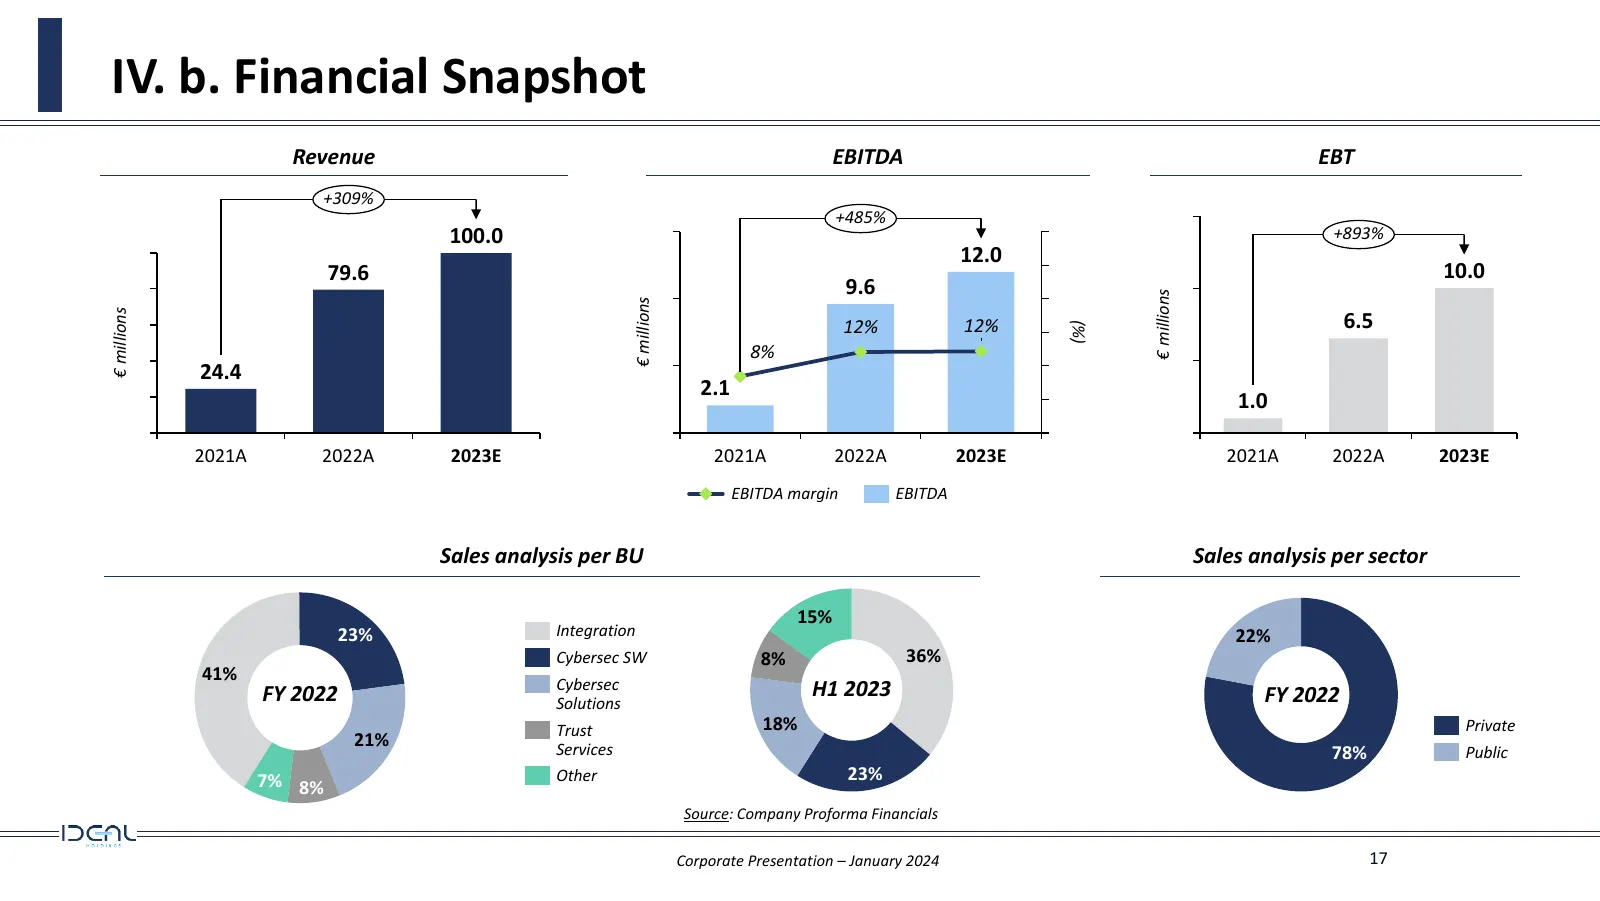
IV. b. Financial Snapshot Revenue EBITDA EBT +309% +485% 100.0 +893% 12.0 79.6 10.0 9.6 € millions € millions € millions 12% 12% 6.5 (%) 8% 24.4 2.1 1.0 2021Α 2022Α 2023Ε 2021A 2022A 2023E 2021A 2022A 2023E EBITDA margin EBITDA Sales analysis per BU Sales analysis per sector 15% 23% Integration 22%
Slide 18: IV. c. Market trends
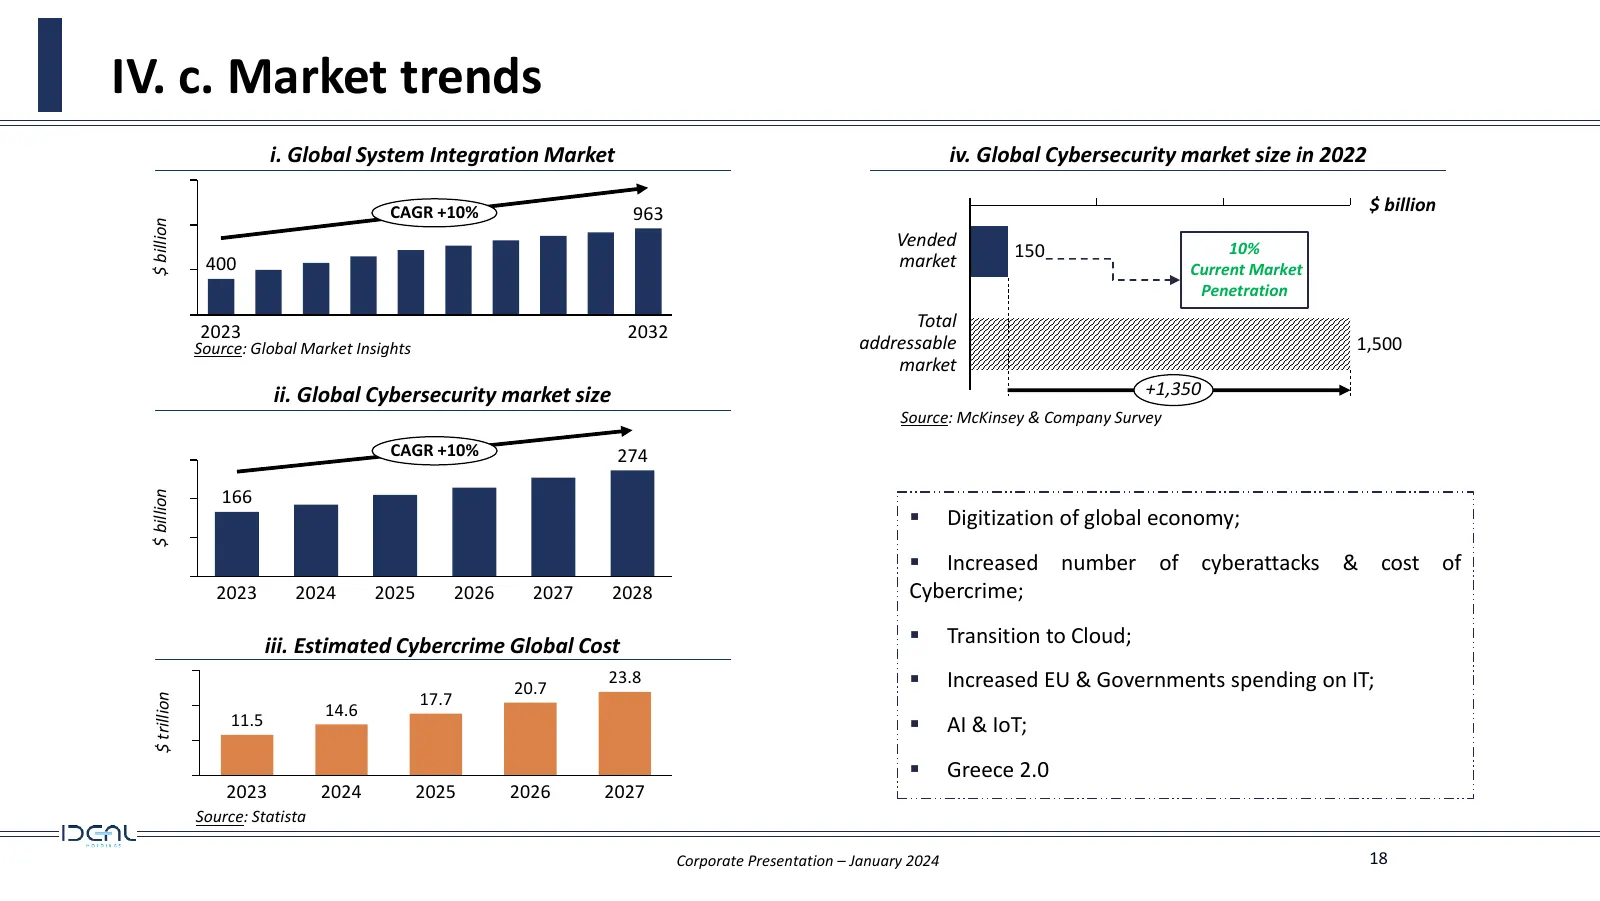
IV. c. Market trends i. Global System Integration Market iv. Global Cybersecurity market size in 2022 CAGR +10% 963 $ billion $ billion Vended 10% 150 400 market Current Market Penetration Total 2023 2032 Source: Global Market Insights addressable 1,500 market ii. Global Cybersecurity market size +1
Slide 19: V. FY 2021, 2022 & 2023E / Retail Bond Issue
V. FY 2021, 2022 & 2023E - Retail Bond Issue
Slide 20: V. a. IDH proforma
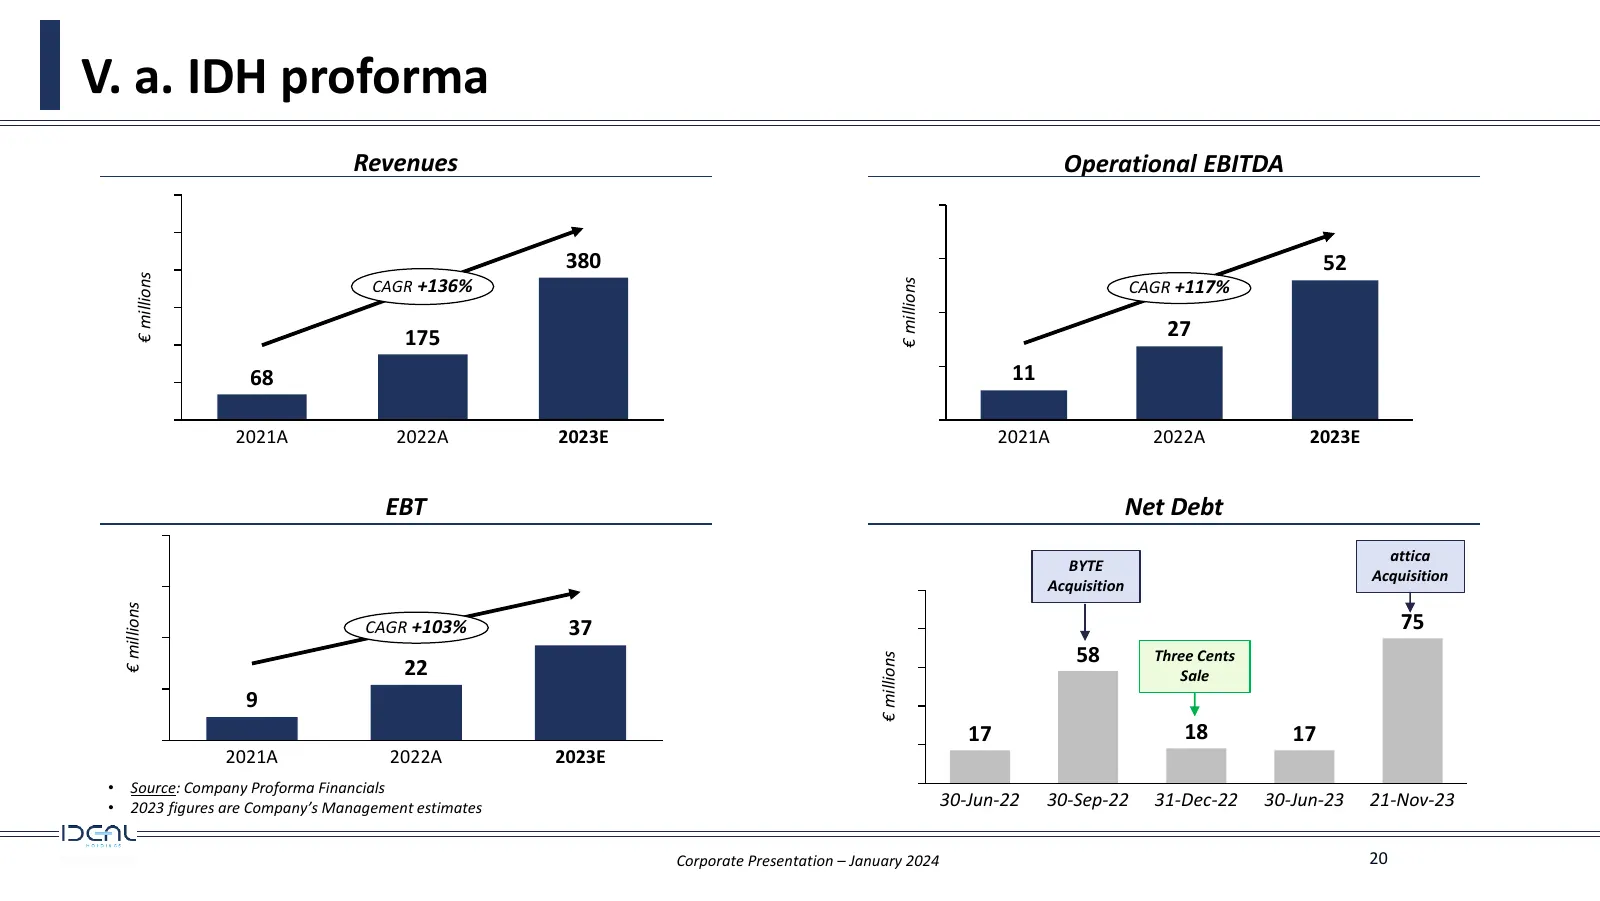
V. a. IDH proforma Revenues Operational EBITDA 380 52 € millions € millions CAGR +136% CAGR +117% 175 27 68 11 2021A 2022A 2023E 2021A 2022A 2023E EBT Net Debt attica BYTE Acquisition Acquisition € millions CAGR +103% 37 75 58 Three Cents € millions 22 Sale 9 17 18 17 2021A 2022A 2023E • Source: Com
Slide 21: V. b. Retail Bond Issue
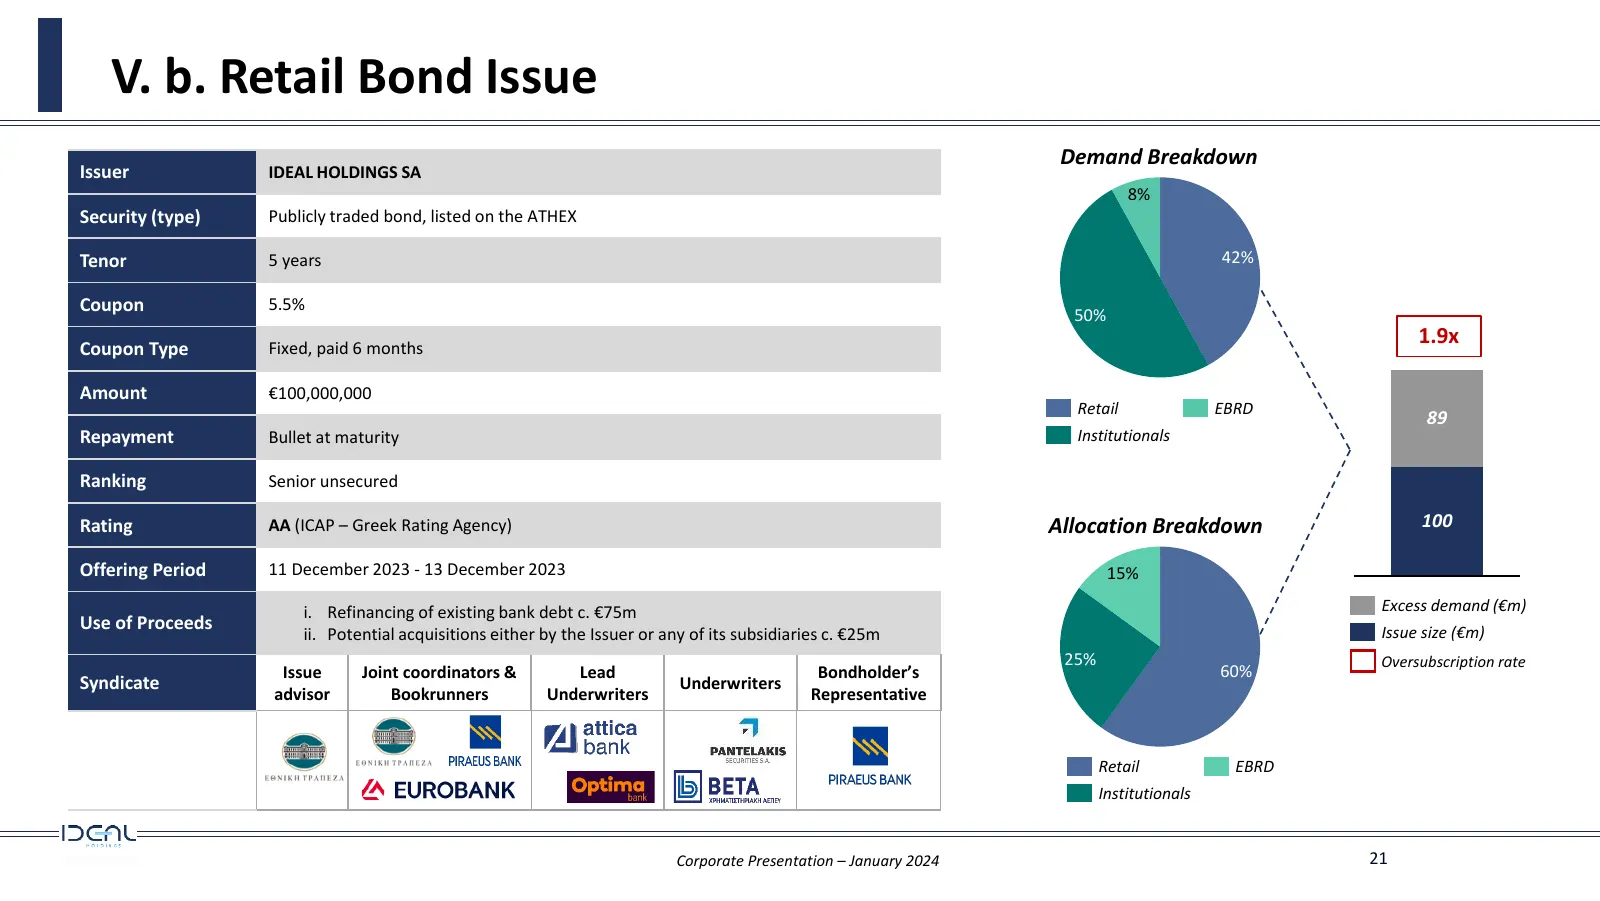
V. b. Retail Bond Issue Demand Breakdown Issuer IDEAL HOLDINGS SA 8% Security (type) Publicly traded bond, listed on the ATHEX Tenor 5 years 42% Coupon 5.5% 50% Coupon Type Fixed, paid 6 months 1.9x Amount €100,000,000 Retail EBRD 89 Repayment Bullet at maturity Institutionals Ranking Senior unsecur

Slide 22: VI. Investment highlights
VI. Investment highlights
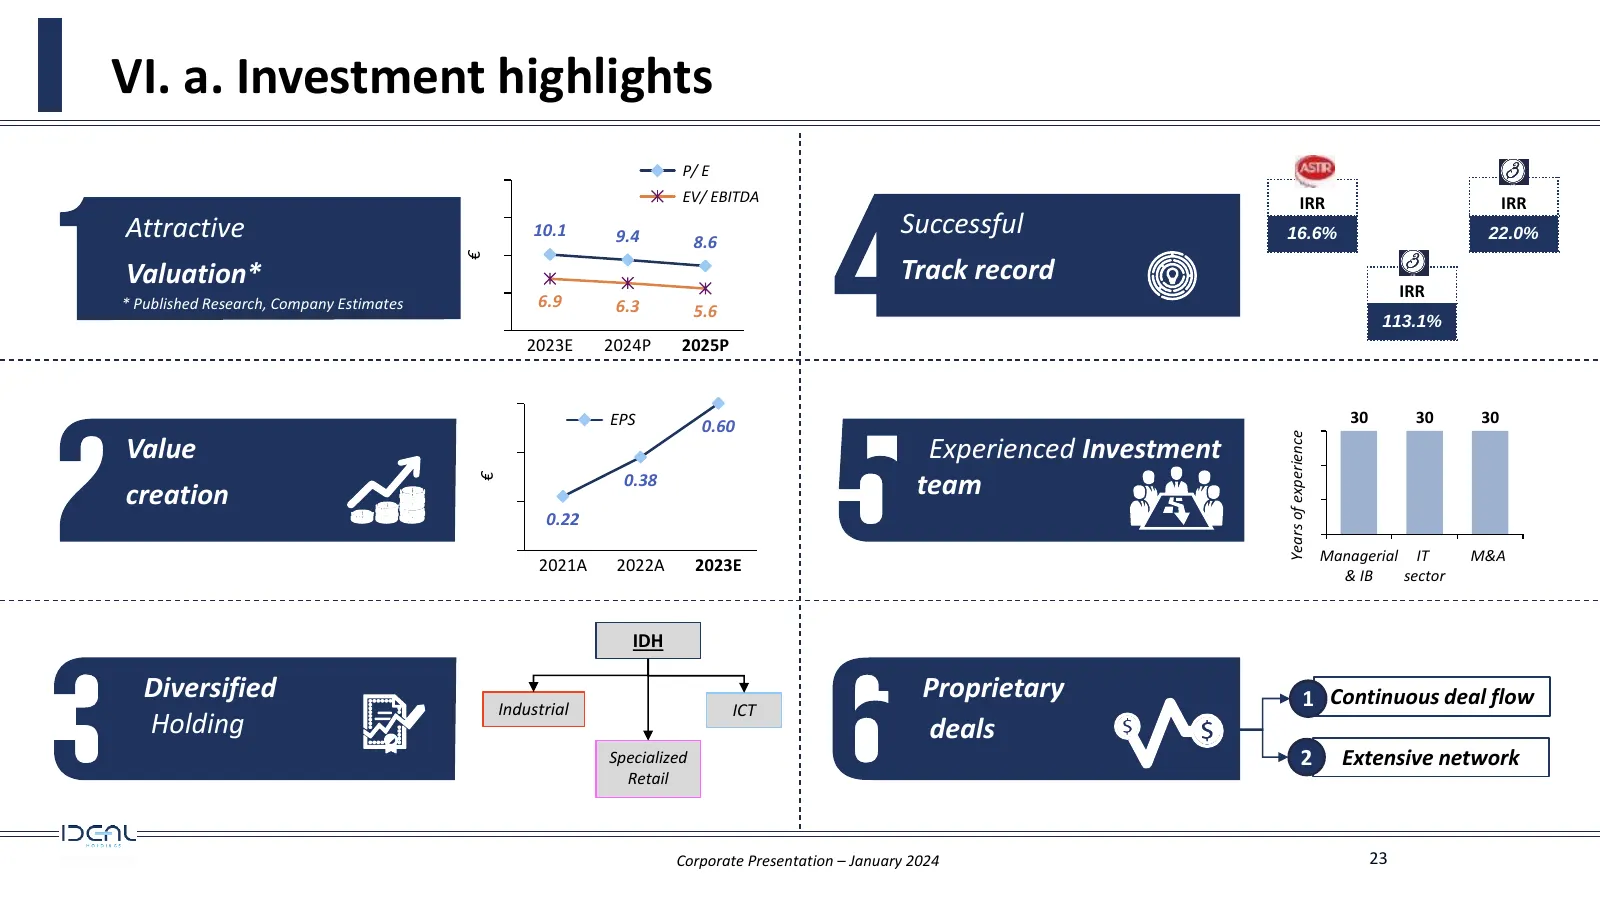
Slide 23: VI. a. Investment highlights
VI. a. Investment highlights P/ E EV/ EBITDA IRR IRR Attractive 10.1 9.4 8.6 Successful 16.6% 22.0% € Valuation* Track record IRR * Published Research, Company Estimates 6.9 6.3 5.6 113.1% 2023E 2024P 2025P EPS 30 30 30 0.60 Years of experience Value ➢Experienced Investment creation € 0.38 team 0.22

Slide 24: VII. Appendices
VII. Appendices
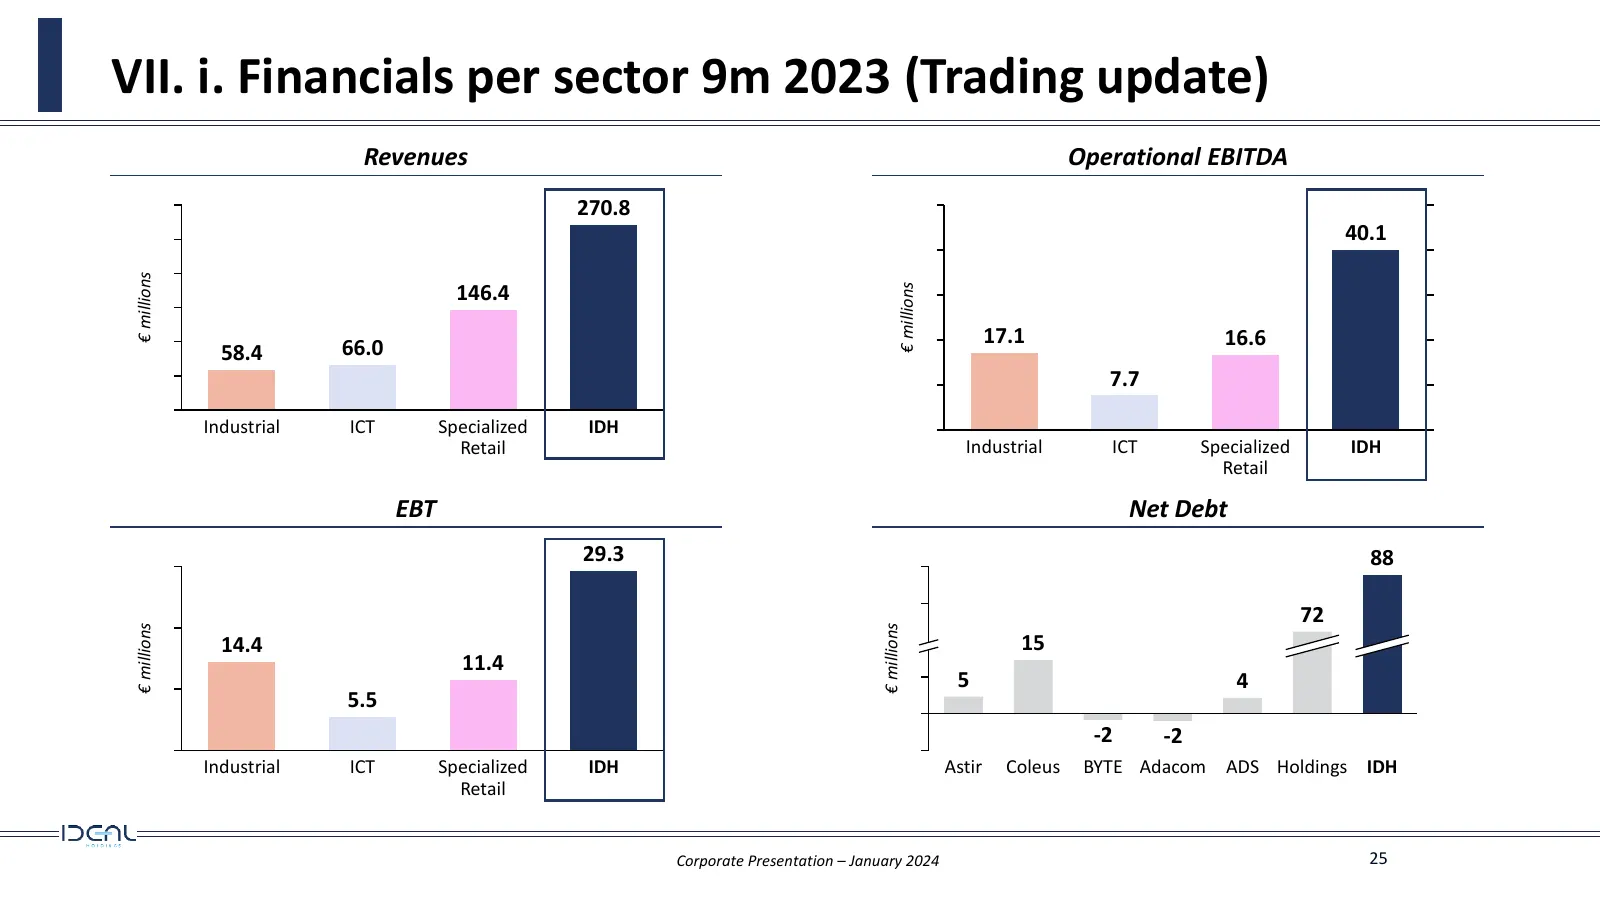
Slide 25: VII. i. Financials per sector 9m 2023 (Trading update)
VII. i. Financials per sector 9m 2023 (Trading update) Revenues Operational EBITDA 270.8 40.1 € millions € millions 146.4 17.1 16.6 58.4 66.0 7.7 Industrial ICT Specialized IDH Retail Industrial ICT Specialized IDH Retail ΕΒΤ Net Debt 29.3 88 72 € millions € millions 14.4 15 11.4 5 4 5.5 -2 -2 Indus
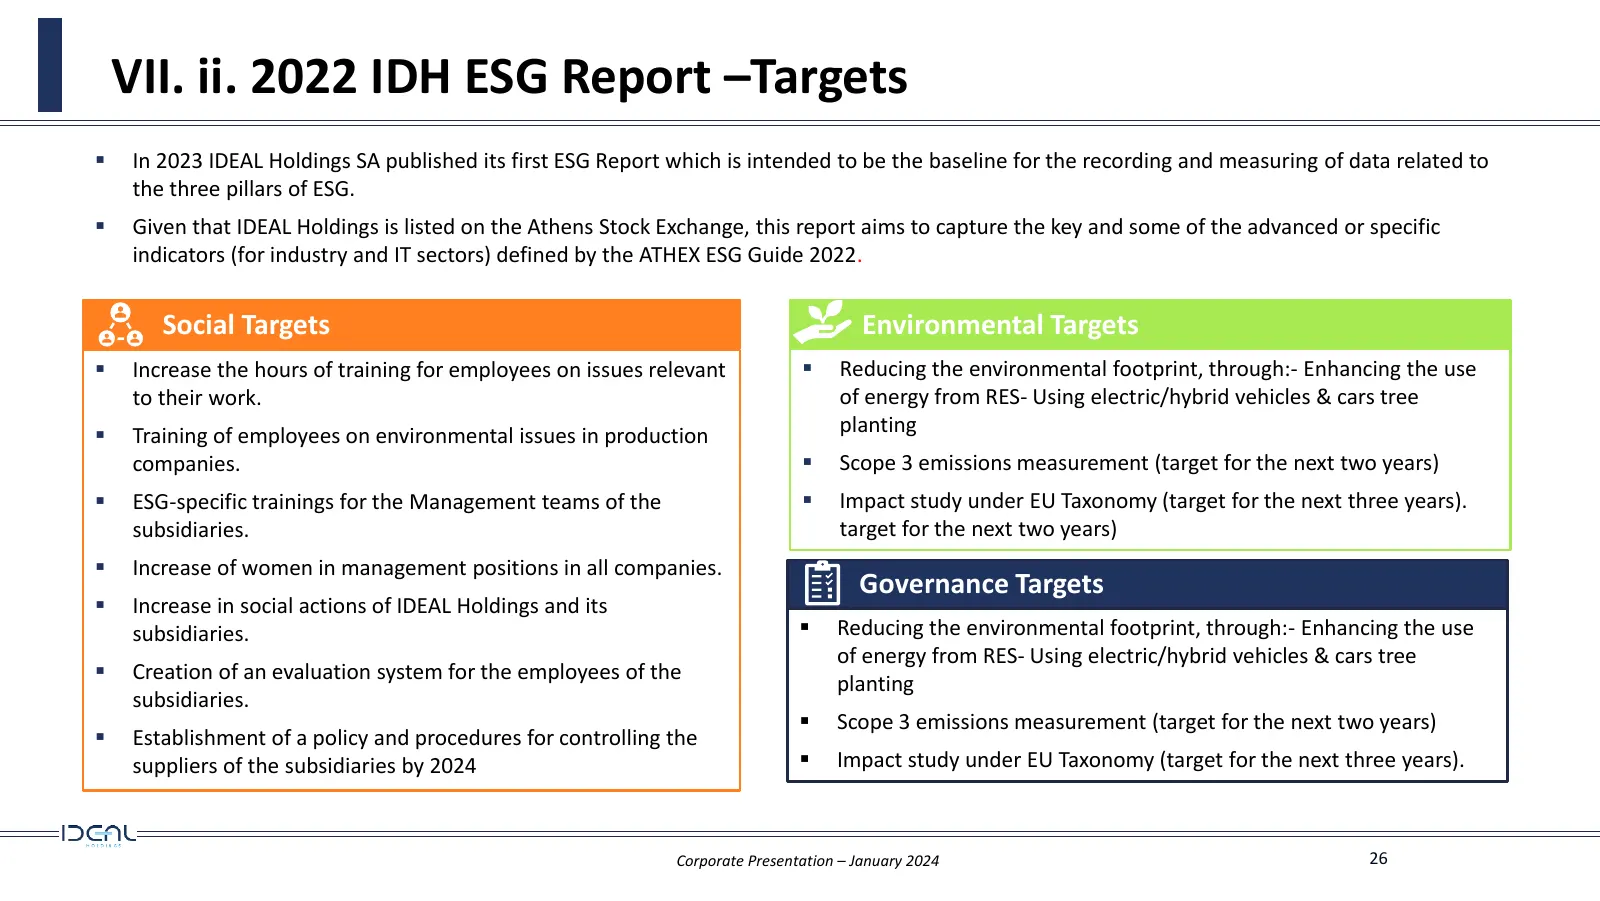
Slide 26: VII. ii. 2022 IDH ESG Report – Targets
VII. ii. 2022 IDH ESG Report –Targets ▪ In 2023 IDEAL Holdings SA published its first ESG Report which is intended to be the baseline for the recording and measuring of data related to the three pillars of ESG. ▪ Given that IDEAL Holdings is listed on the Athens Stock Exchange, this report aims to c
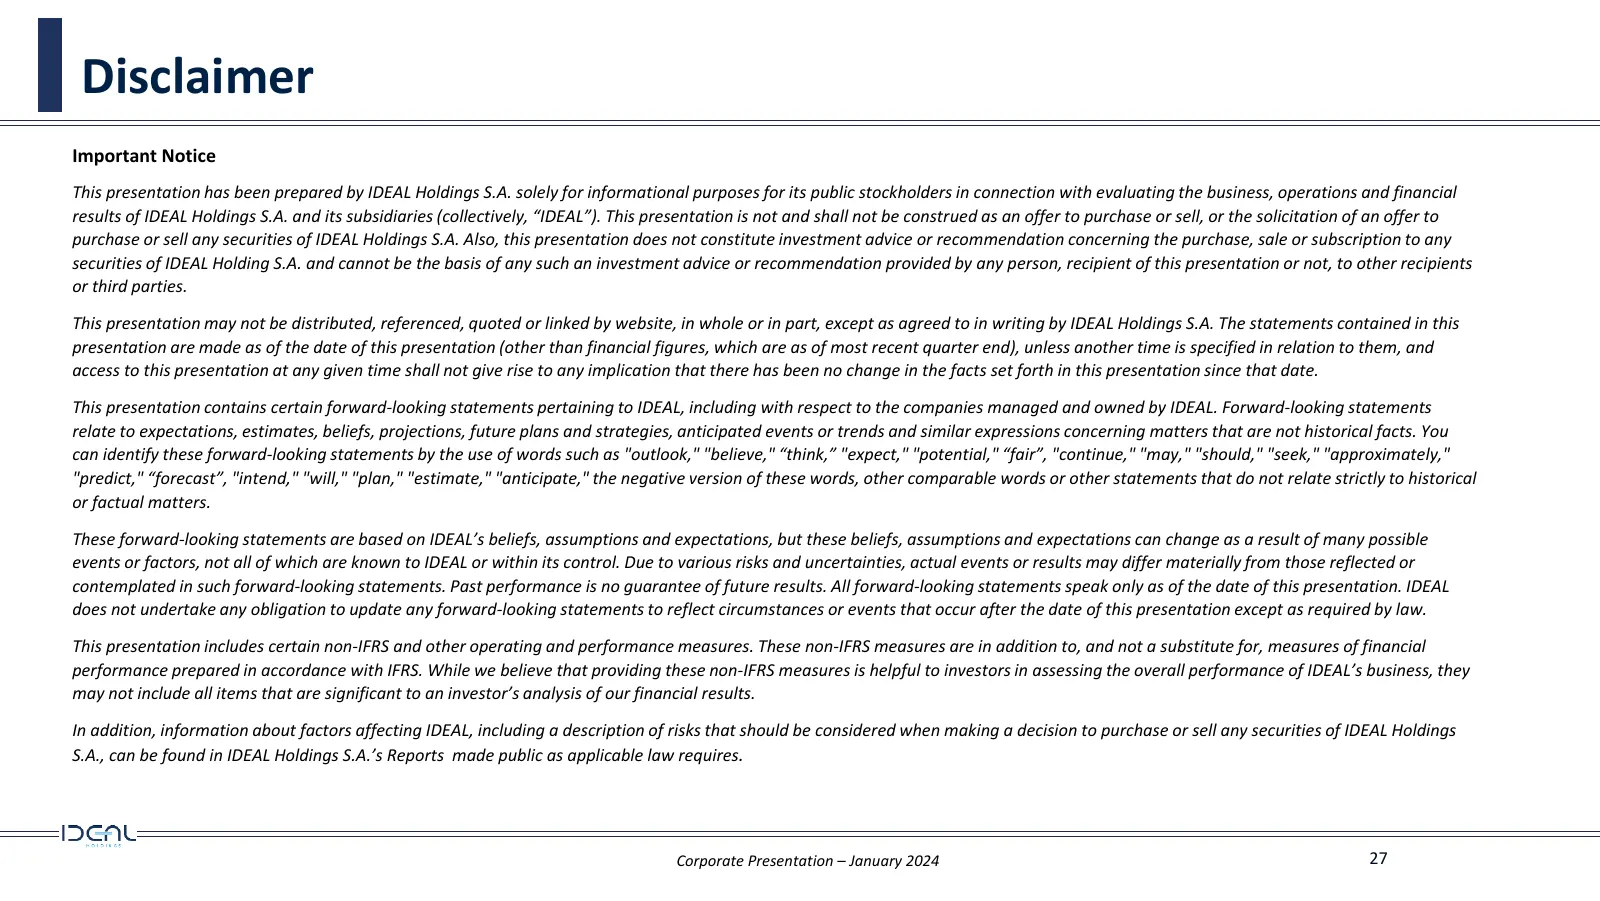
Slide 27: Disclaimer
Disclaimer Important Notice This presentation has been prepared by IDEAL Holdings S.A. solely for informational purposes for its public stockholders in connection with evaluating the business, operations and financial results of IDEAL Holdings S.A. and its subsidiaries (collectively, “IDEAL”). This
Source: Internet Archive copy of idealholdings.gr
More decks from Ideal Holdings S.A.
 FY2025 Earnings Presentation20 slides · February 2026
 Investor Day (October 2025)76 slides · Oct 13, 2025
 Investor Day (October 2025)67 slides · Oct 13, 2025
 Investor Presentation (June 2025)20 slides · Jun 4, 2025
 Merger or Acquisition (January 2025)16 slides · January 2025
 Investor Presentation (August 2024)32 slides · August 2024