Snap Inc. · NYSE:SNAP
Snap — Q4 2017 Earnings Presentation
14 slides from Snap's earnings presentation, Feb 6, 2018

Slide 1: Q4 and Full Year 2017 Earnings Report
Q4 and Full Year 2017 Earnings Report February 6, 2018
Slide 2: Forward-Looking Statements & Non-GAAP Financial Measures
Forward-Looking Statements & Non-GAAP Financial Measures This presentation contains forward-looking statements about us and our industry that involve substantial risks and uncertainties. All statements other than statements of historical facts contained in this presentation, including statements reg
Slide 3: Quarterly Average Daily Active Users
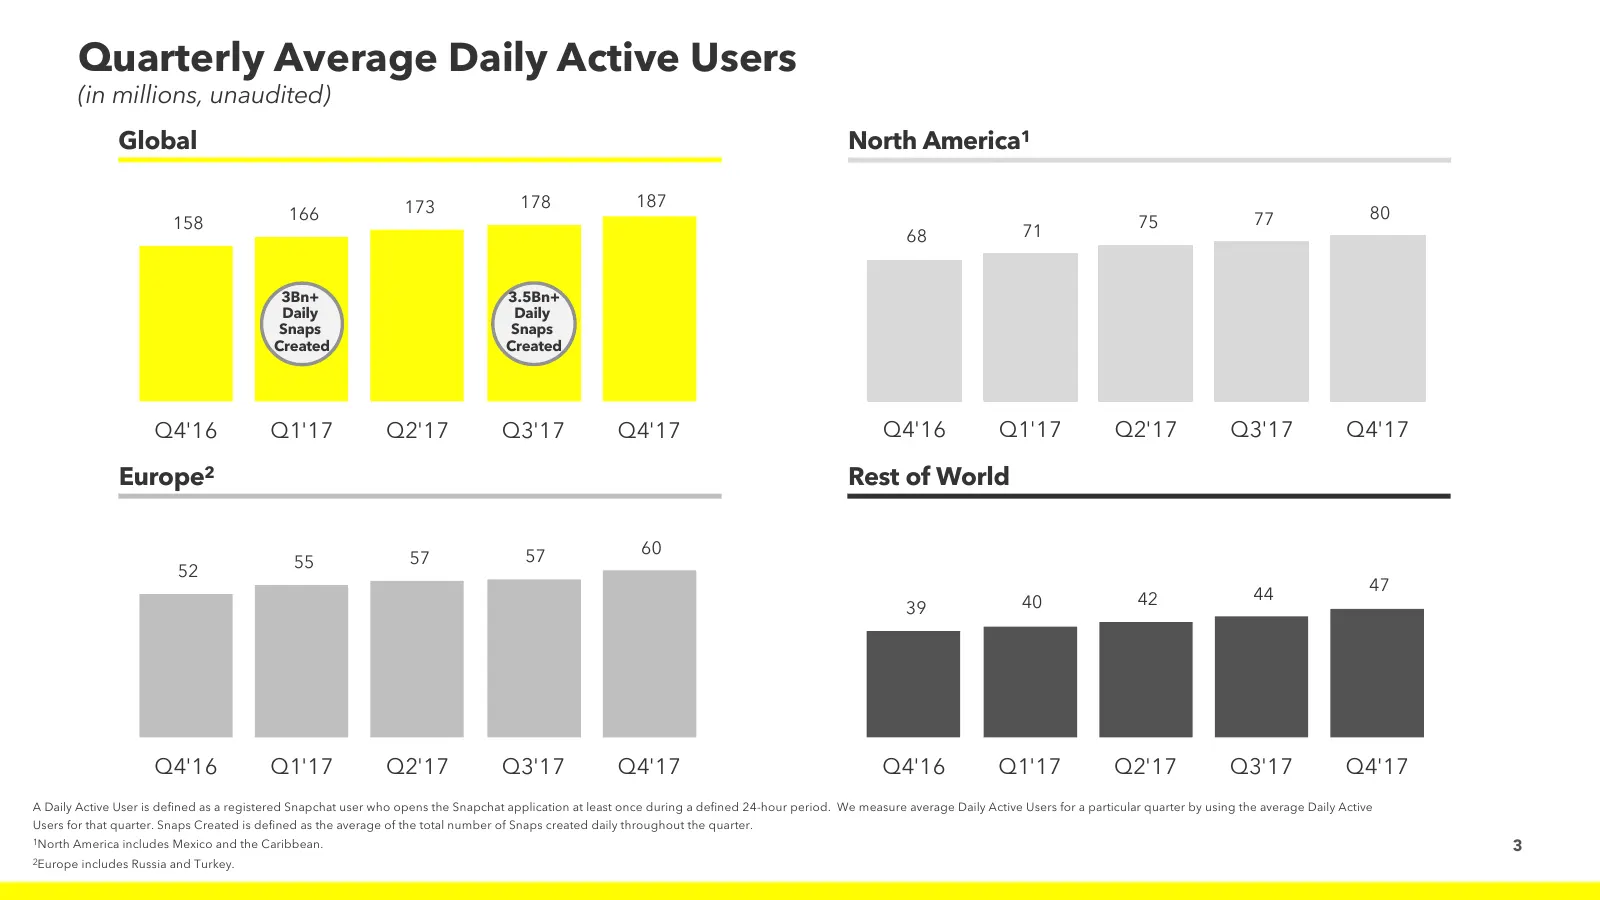
Quarterly Average Daily Active Users (in millions, unaudited) Global North America1 173 178 187 166 75 77 80 158 71 68 3Bn+ 3.5Bn+ Daily Daily Snaps Snaps Created Created Q4'16 Q1'17 Q2'17 Q3'17 Q4'17 Q4'16 Q1'17 Q2'17 Q3'17 Q4'17 Europe2 Rest of World 57 60 55 57 52 44 47 39 40 42 Q4'16 Q1'17 Q2'17
Slide 4: Quarterly Revenue by Geography
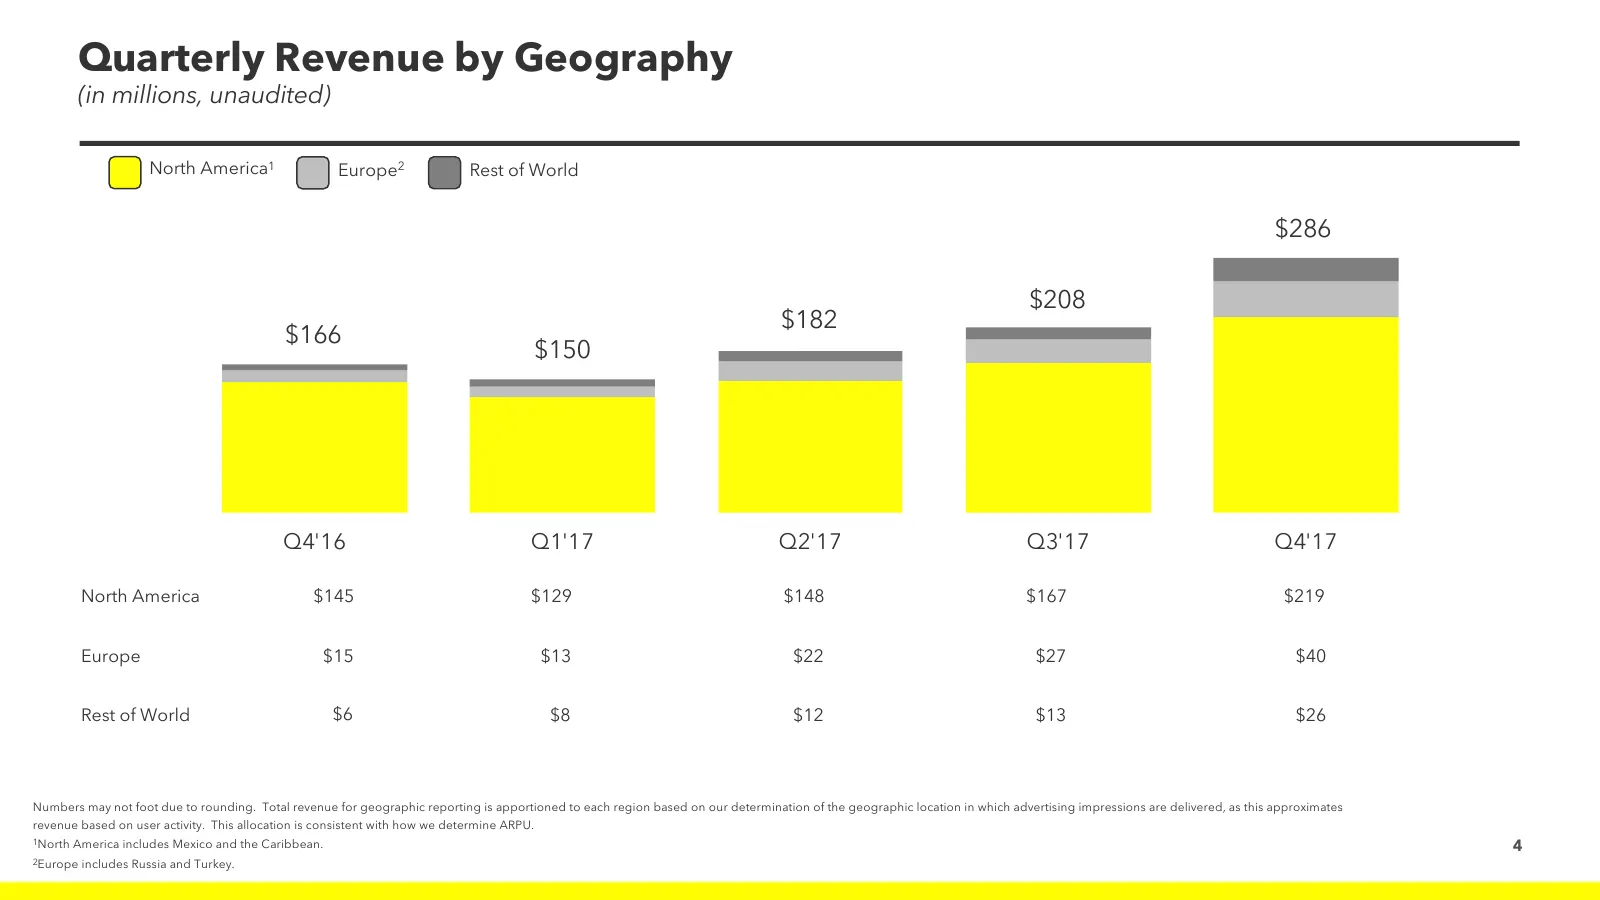
Quarterly Revenue by Geography (in millions, unaudited) North America1 Europe2 Rest of World $286 $208 $182 $166 $150 Q4'16 Q1'17 Q2'17 Q3'17 Q4'17 North America $145 $129 $148 $167 $219 Europe $15 $13 $22 $27 $40 Rest of World $6 $8 $12 $13 $26 Numbers may not foot due to rounding. Total revenue fo
Slide 5: Quarterly Average Revenue Per User (ARPU)
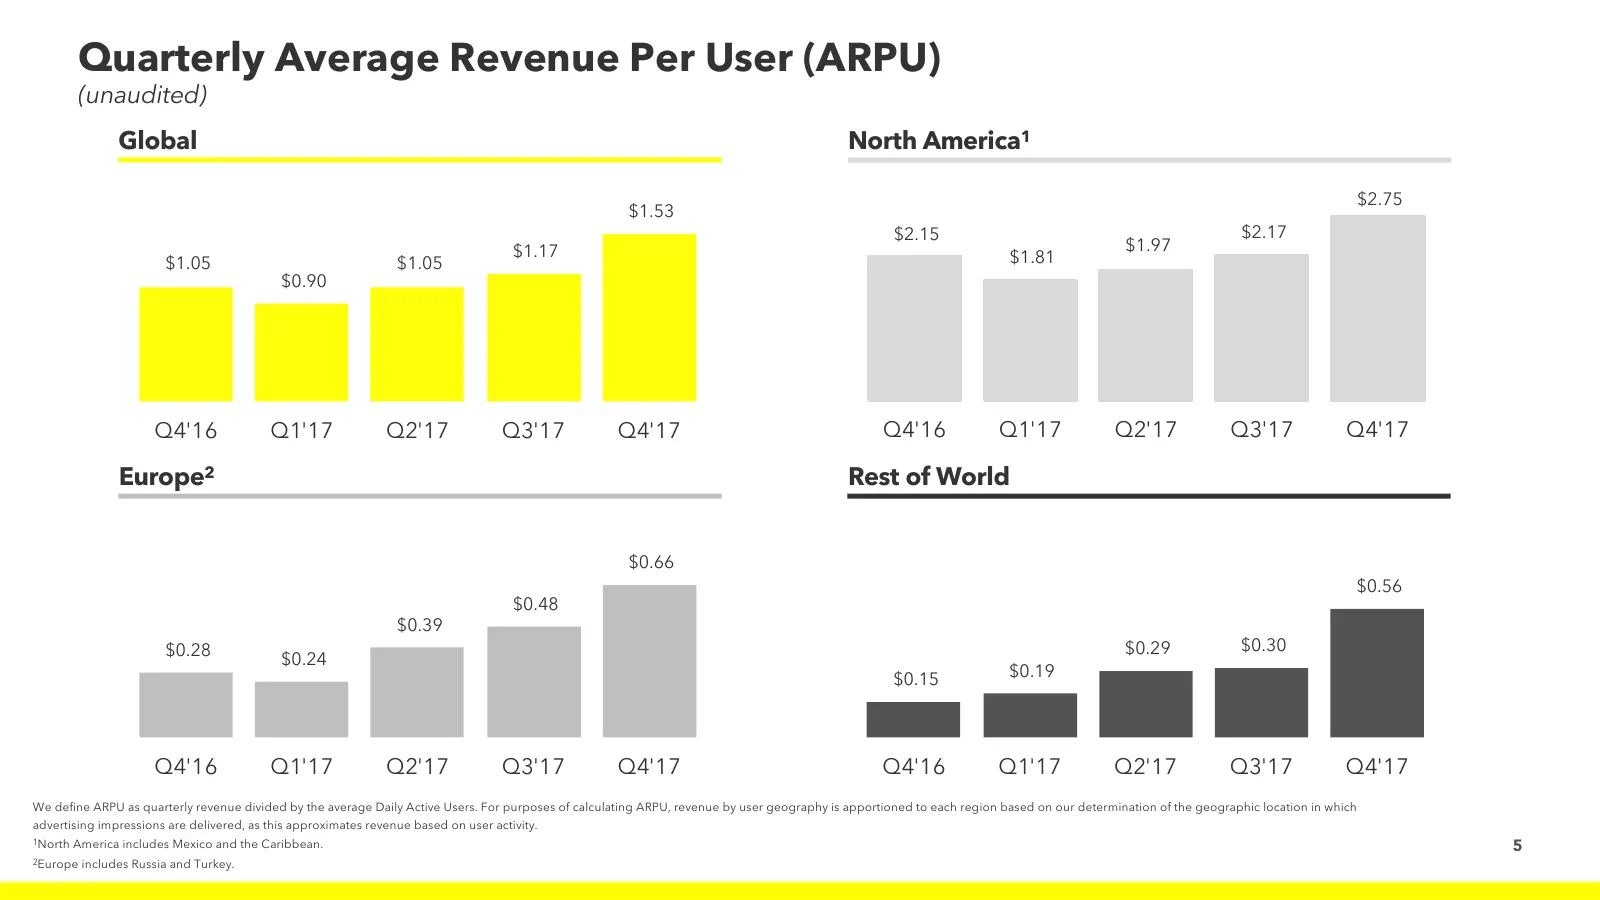
Quarterly Average Revenue Per User (ARPU) (unaudited) Global North America1 $2.75 $1.53 $2.15 $2.17 $1.17 $1.97 $1.05 $1.05 $1.81 $0.90 Q4'16 Q1'17 Q2'17 Q3'17 Q4'17 Q4'16 Q1'17 Q2'17 Q3'17 Q4'17 Europe2 Rest of World $0.66 $0.56 $0.48 $0.39 $0.28 $0.29 $0.30 $0.24 $0.15 $0.19 Q4'16 Q1'17 Q2'17 Q3'1
Slide 6: Cost of Revenue
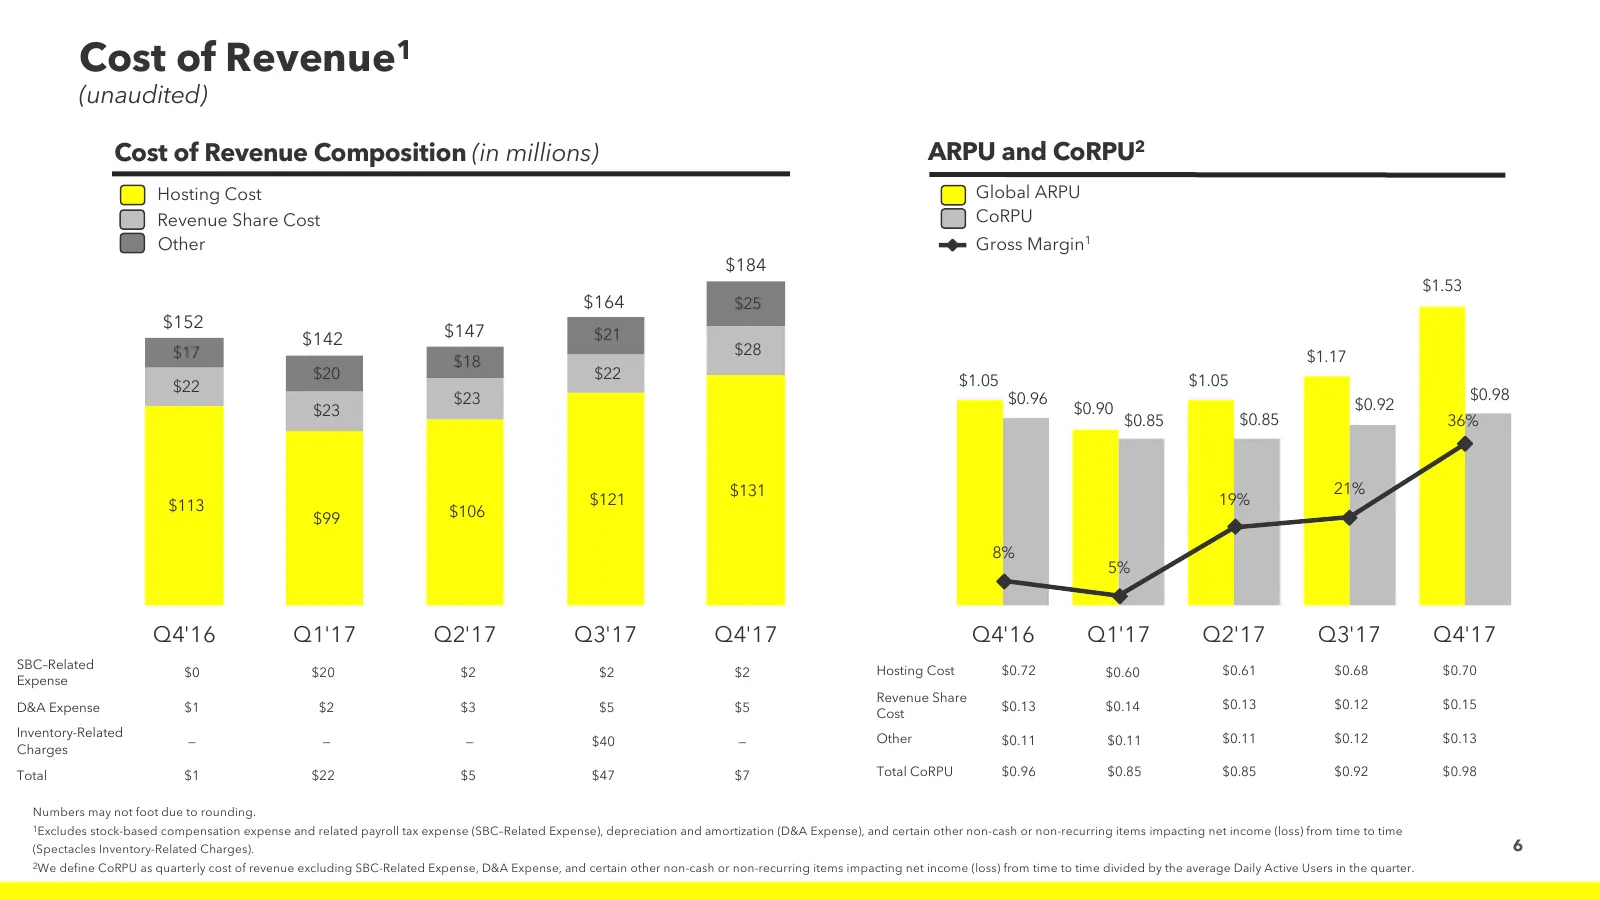
Cost of Revenue1 (unaudited) Cost of Revenue Composition (in millions) ARPU and CoRPU2 Hosting Cost Global ARPU Revenue Share Cost CoRPU Other Gross Margin1 $184 $1.53 $164 $25 $152 $147 $142 $21 $17 $28 $1.17 $18 $20 $22 $1.05 $1.05 $22 $0.98 $23 $0.96 $0.92 $23 $0.90 $0.85 $0.85 36% $131 21% $113
Slide 7: Capital Expenditures
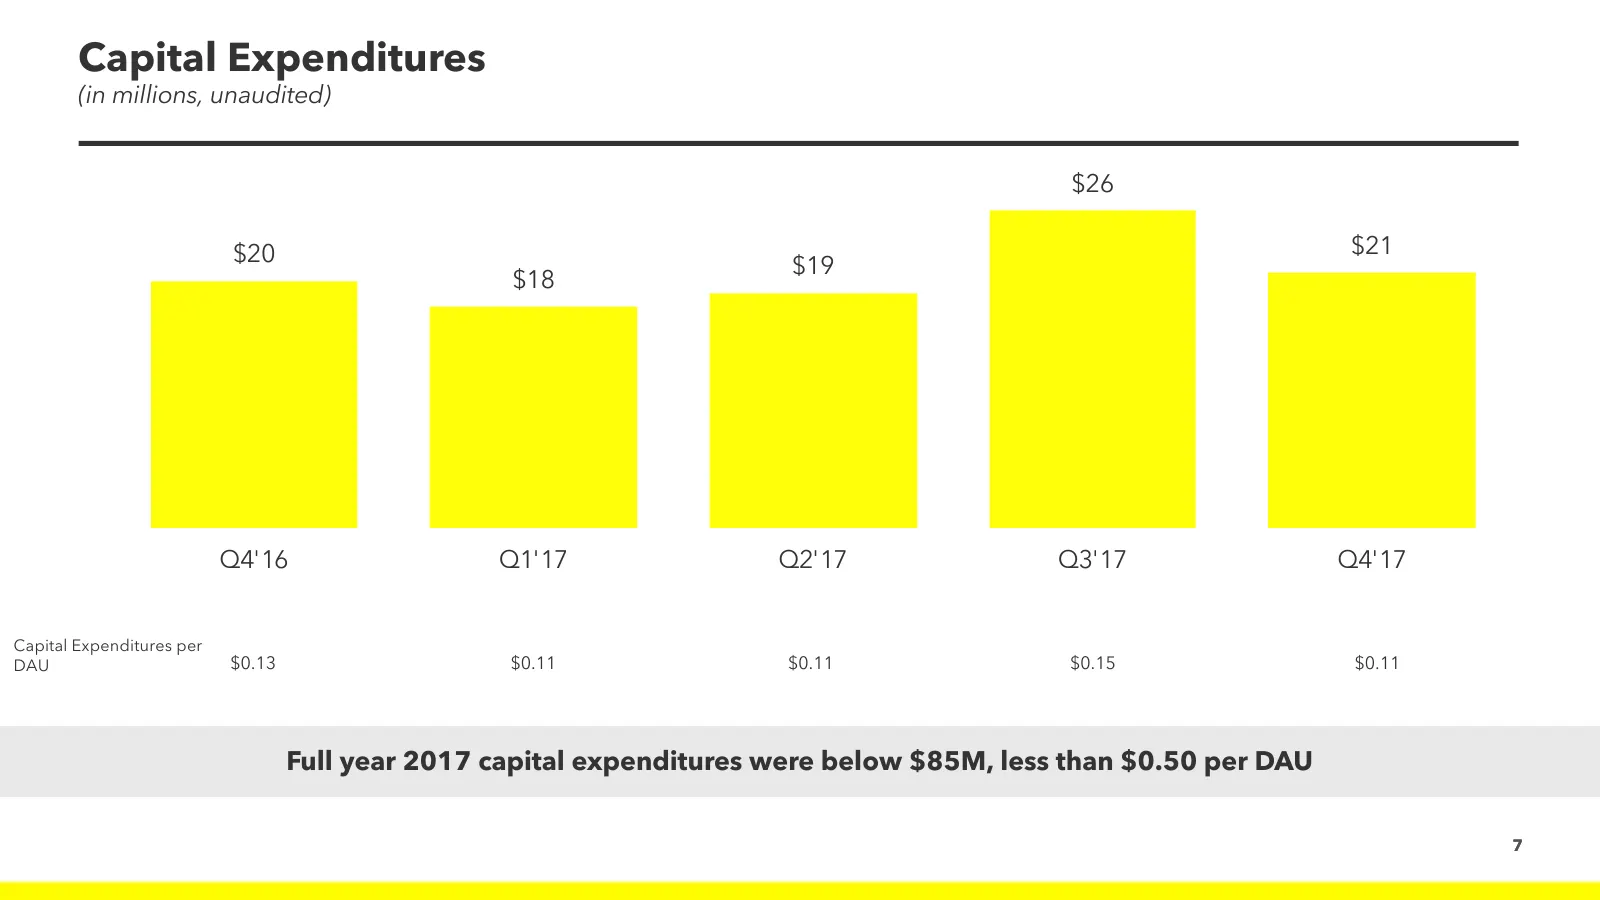
Capital Expenditures (in millions, unaudited) $30.50 $26 $25.50 $20 $21 $19 $20.50 $18 $15.50 $10.50 $5. 5 0 $0. 5 0 Q4'16 Q1'17 Q2'17 Q3'17 Q4'17 Capital Expenditures per DAU $0.13 $0.11 $0.11 $0.15 $0.11 Capital Expenditures Full year 2017 capital expenditures were below $85M, less than $0.50 per
Slide 8: Operating Expense
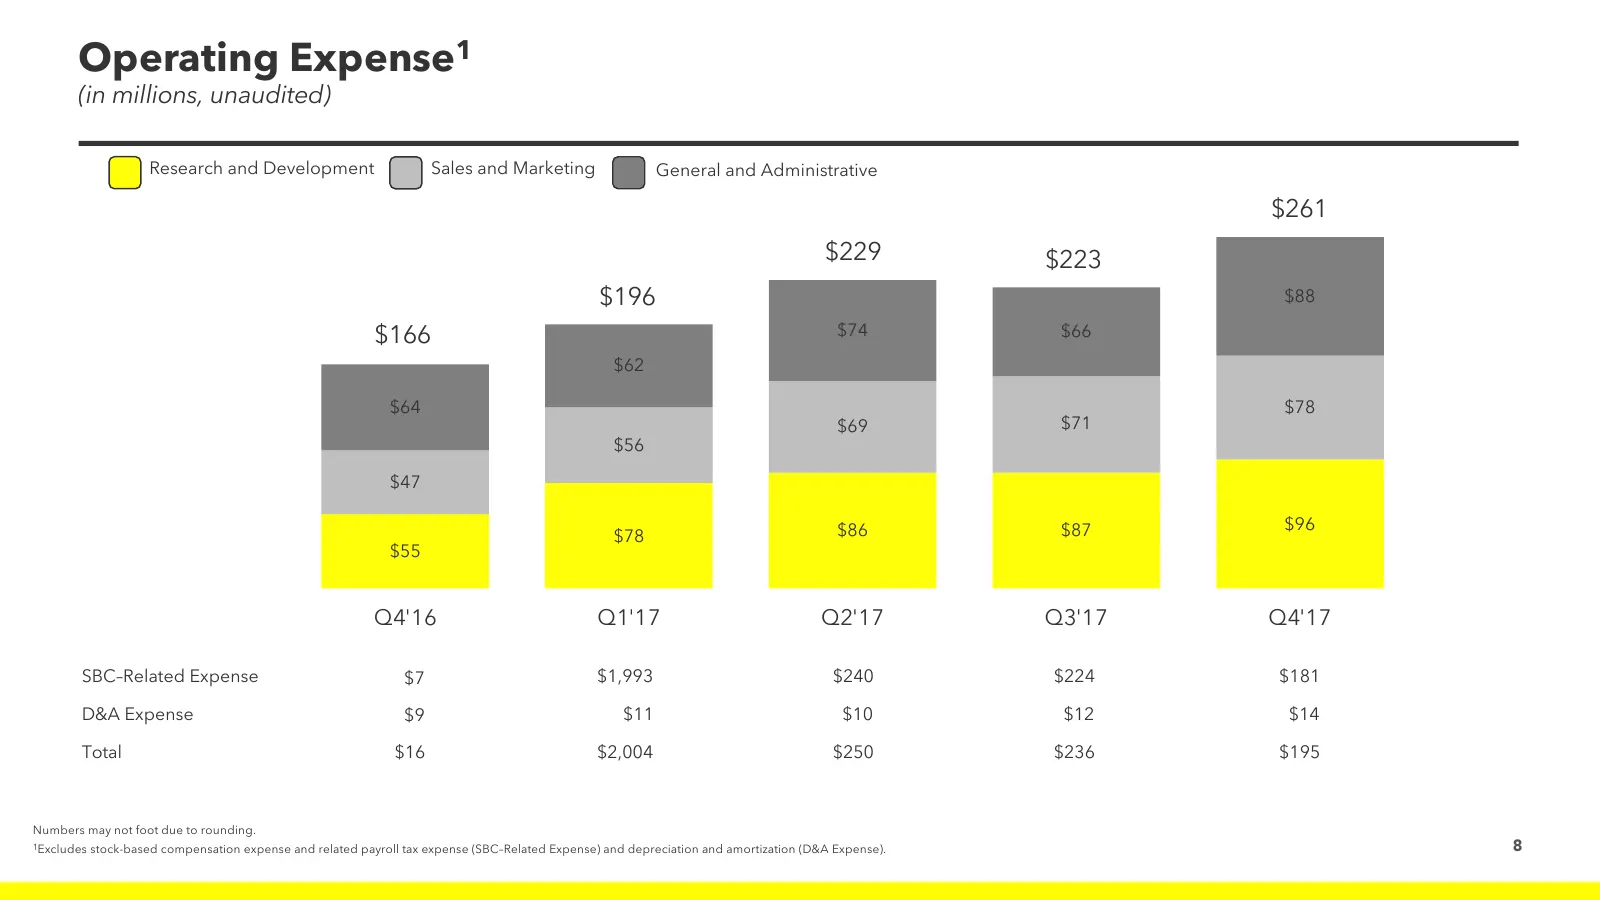
Operating Expense1 (in millions, unaudited) Research and Development Sales and Marketing General and Administrative $261 $229 $223 $196 $88 $166 $74 $66 $62 $64 $78 $69 $71 $56 $47 $86 $87 $96 $78 $55 Q4'16 Q1'17 Q2'17 Q3'17 Q4'17 SBC–Related Expense $7 $1,993 $240 $224 $181 D&A Expense $9 $11 $10 $
Slide 9: Adjusted EBITDA and Free Cash Flow
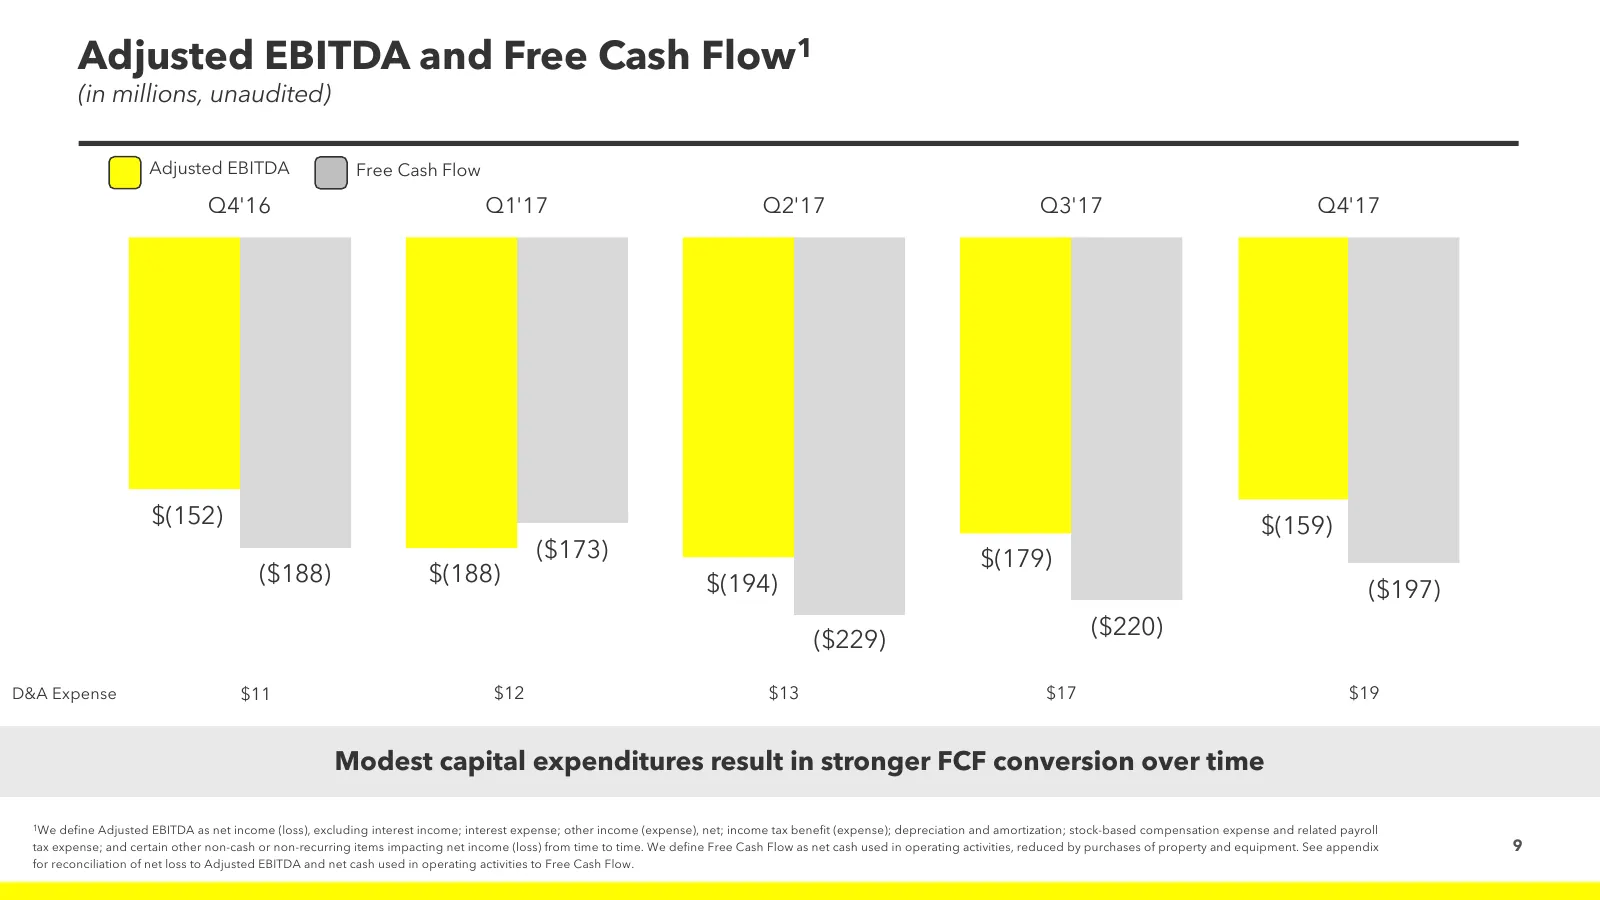
Adjusted EBITDA and Free Cash Flow1 (in millions, unaudited) Adjusted EBITDA Free Cash Flow Q4'16 Q1'17 Q2'17 Q3'17 Q4'17 $0 ($50) ($100) ($150) $(152) $(159) ($173) $(179) ($188) $(188) ($200) $(194) ($197) ($220) ($250) ($229) D&A Expense $11 $12 $13 $17 $19 Modest capital expenditures result in s

Slide 10: Appendix
Appendix
Slide 11: Non-GAAP Financial Measures Reconciliation
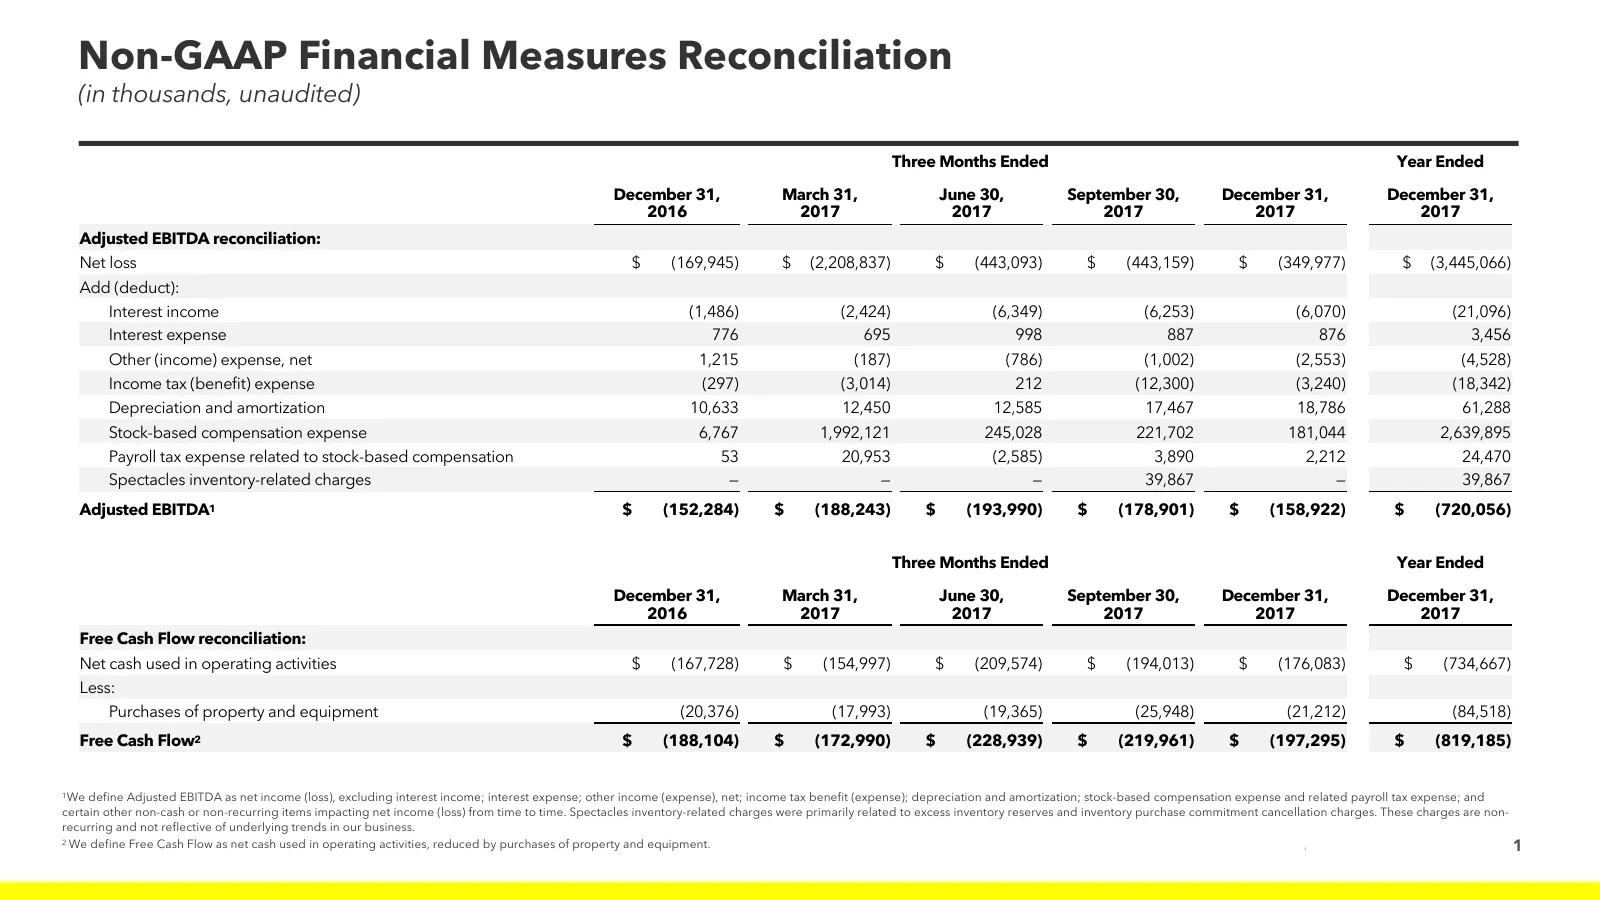
Non-GAAP Financial Measures Reconciliation (in thousands, unaudited) Three Months Ended Year Ended December 31, March 31, June 30, September 30, December 31, December 31, 2016 2017 2017 2017 2017 2017 Adjusted EBITDA reconciliation: Net loss $ (169,945) $ (2,208,837) $ (443,093) $ (443,159) $ (349,9
Slide 12: Non-GAAP Financial Measures Reconciliation (continued)
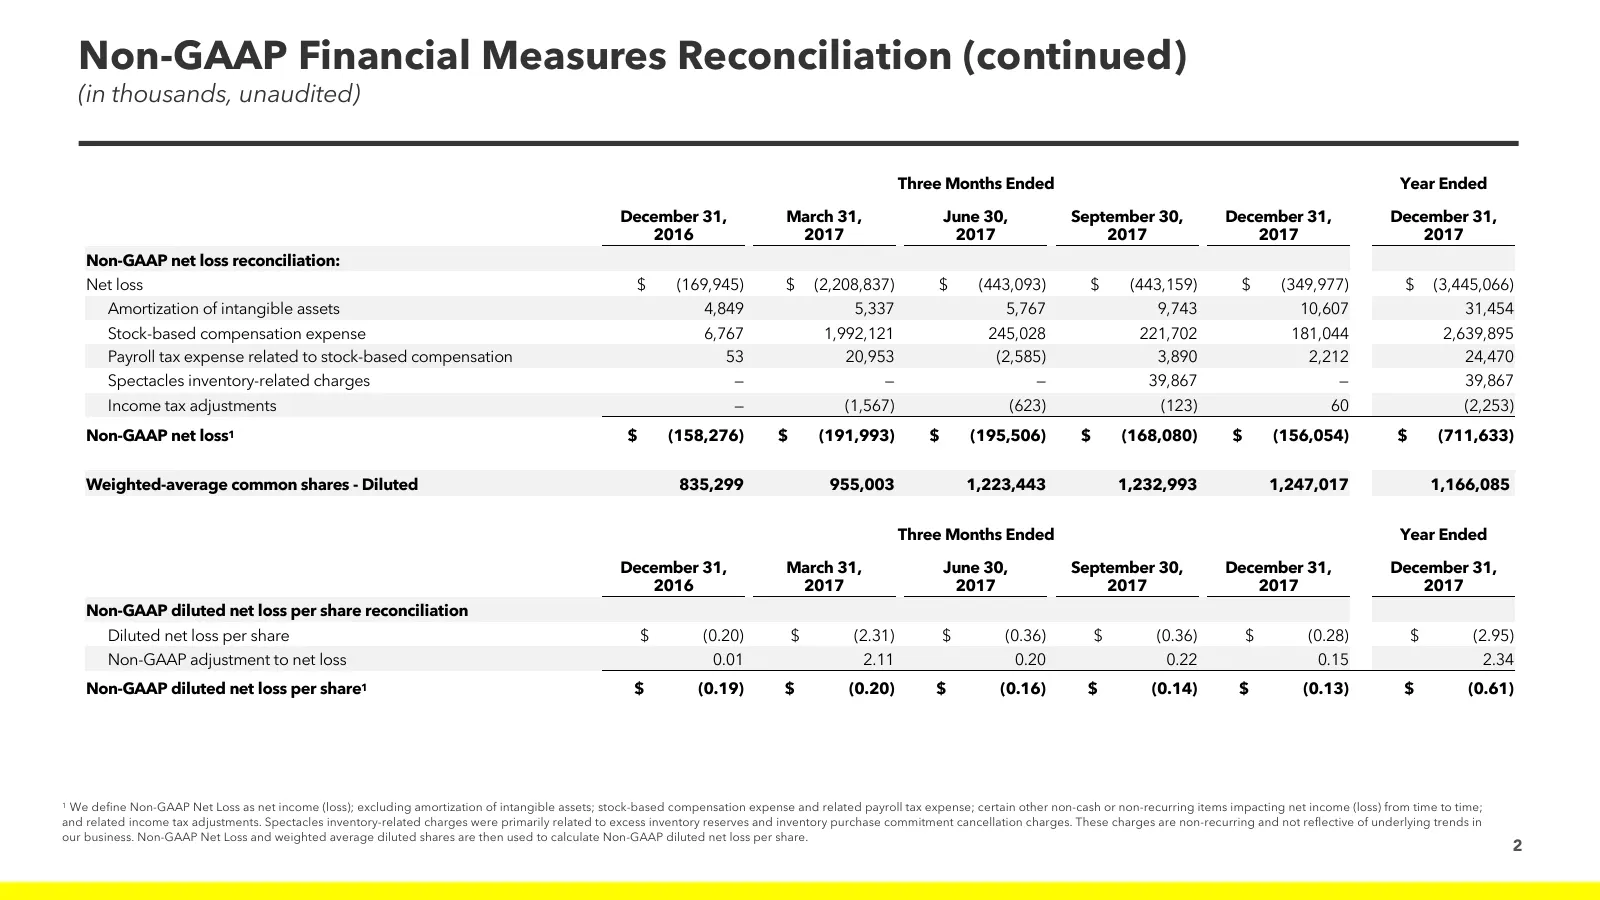
Non-GAAP Financial Measures Reconciliation (continued) (in thousands, unaudited) Three Months Ended Year Ended December 31, March 31, June 30, September 30, December 31, December 31, 2016 2017 2017 2017 2017 2017 Non-GAAP net loss reconciliation: Net loss $ (169,945) $ (2,208,837) $ (443,093) $ (443
Slide 13: Note Regarding User Metrics And Other Data
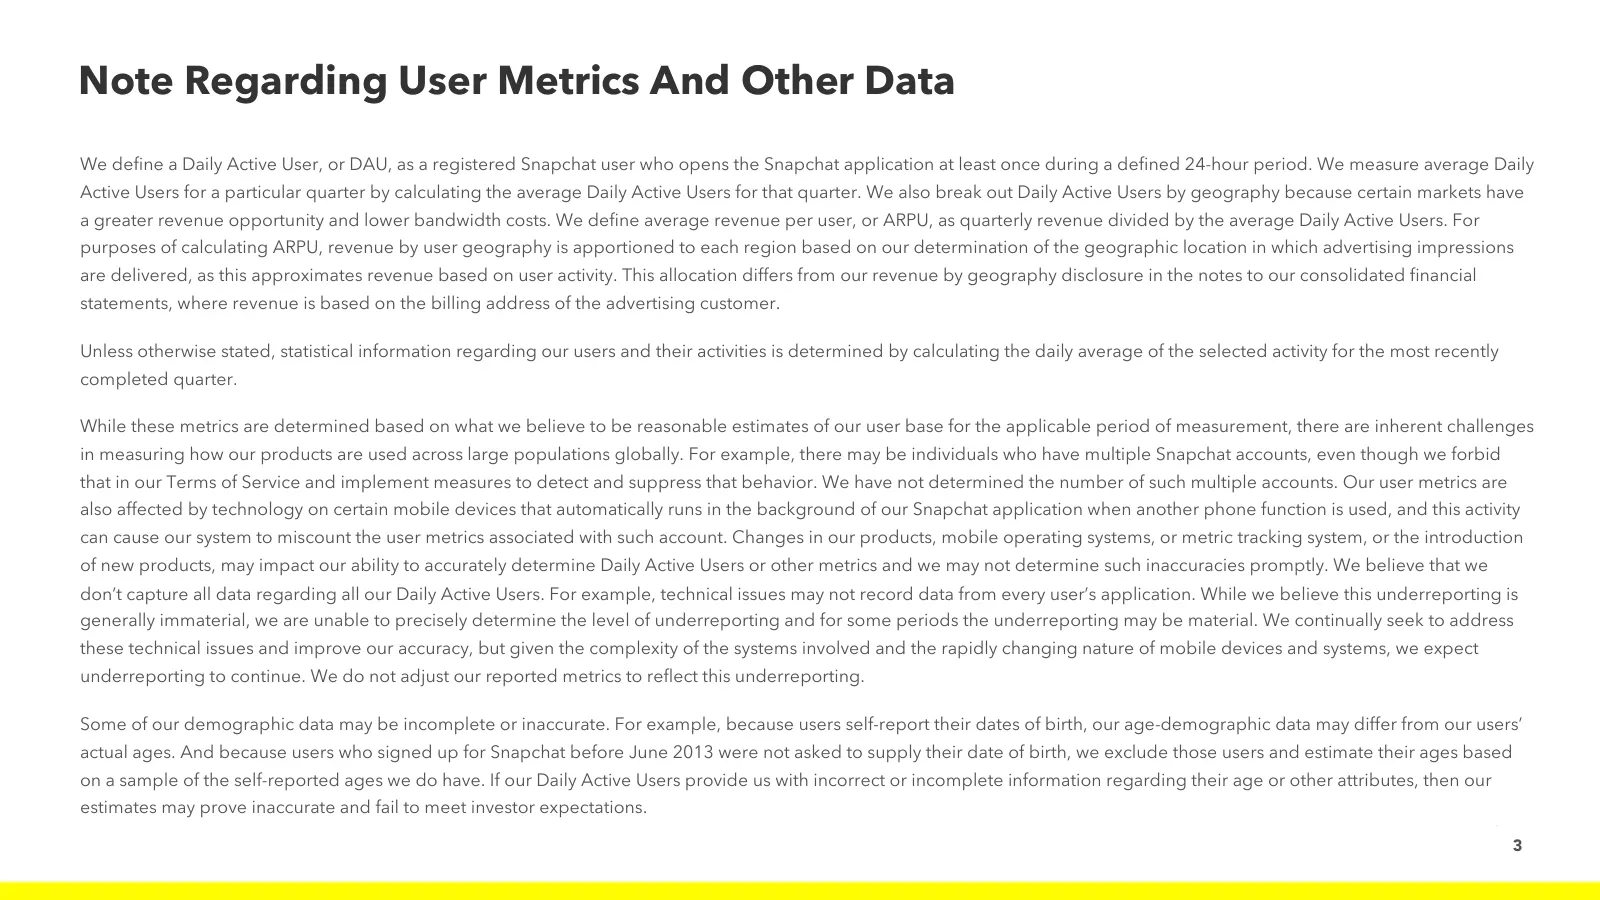
Note Regarding User Metrics And Other Data We define a Daily Active User, or DAU, as a registered Snapchat user who opens the Snapchat application at least once during a defined 24-hour period. We measure average Daily Active Users for a particular quarter by calculating the average Daily Active Use
Slide 14: Note Regarding User Metrics And Other Data (continued)
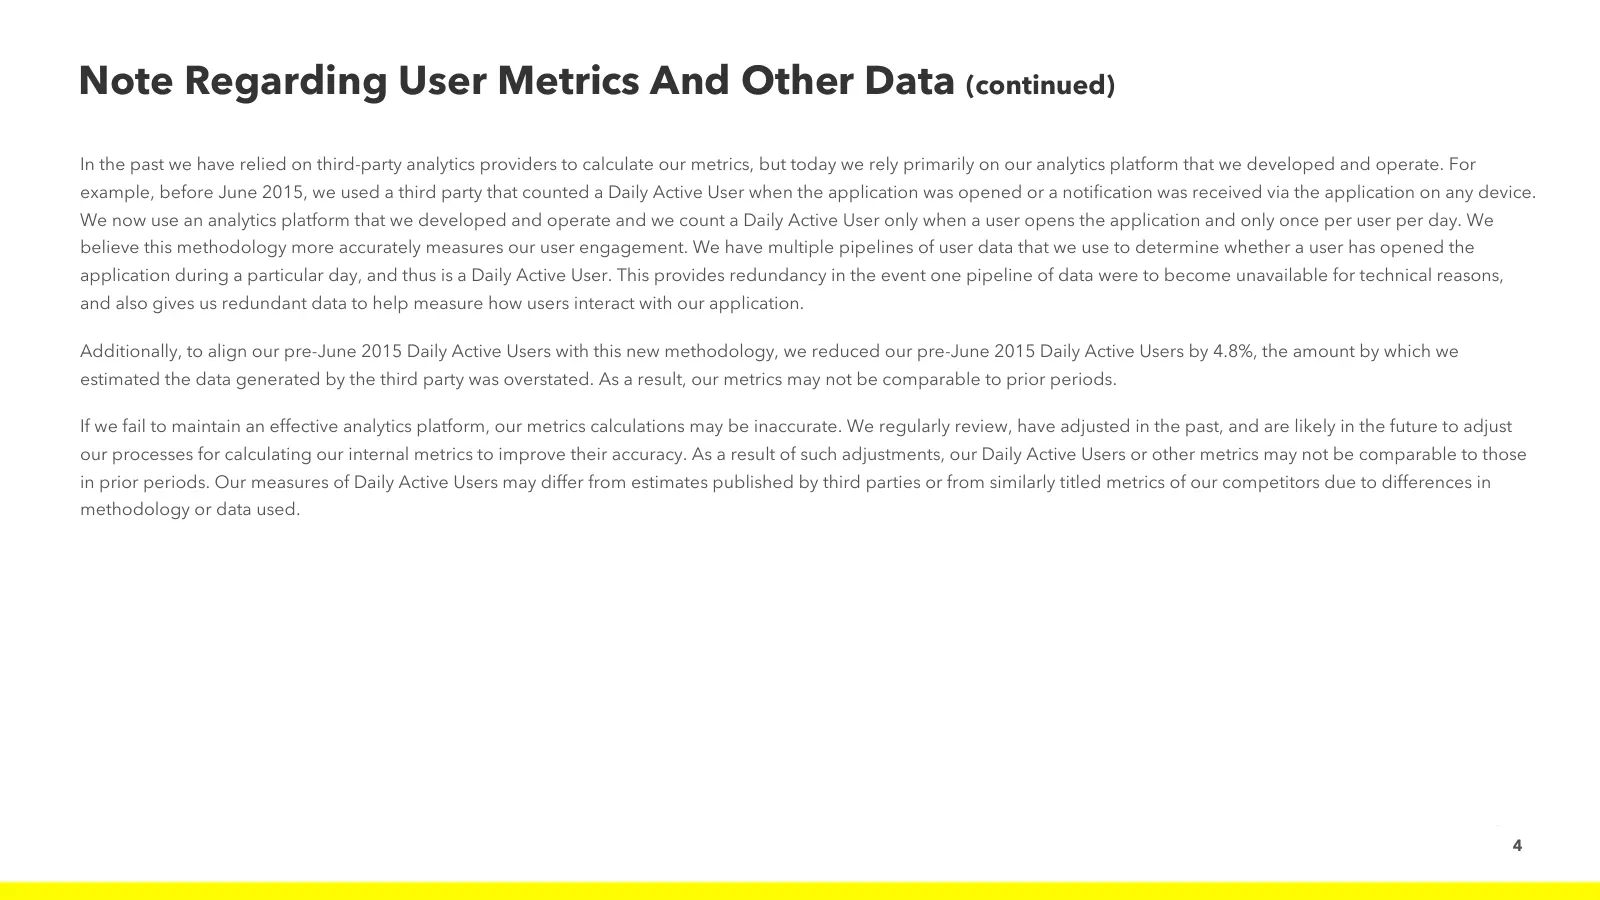
Note Regarding User Metrics And Other Data (continued) In the past we have relied on third-party analytics providers to calculate our metrics, but today we rely primarily on our analytics platform that we developed and operate. For example, before June 2015, we used a third party that counted a Dail
Source: Internet Archive copy of s25.q4cdn.com
More decks from Snap Inc.
 Q2 2026 Earnings Presentation21 slides · Aug 3, 2026
 Q1 2026 Earnings Presentation22 slides · May 6, 2026
 Corporate Update (April 2026)10 slides · April 2026
 Q4 2025 Earnings Presentation32 slides · Feb 4, 2026
 Q3 2025 Earnings Presentation24 slides · Nov 5, 2025
 Q2 2025 Earnings Presentation24 slides · Aug 5, 2025