Vincom Retail JSC · HOSE:VRE
Vincom Retail JSC — Vincom Retail Joint Stock Company — Investor Presentation (September 2019)
32 slides from Vincom Retail JSC's investor presentation, September 2019

Slide 1: Corporate Presentation
Corporate Presentation September 2019
Slide 2: Disclaimer
Disclaimer IMPORTANT: The information contained herein is preliminary and subject to change without notice, its accuracy is not guaranteed, has not been independently verified and may not contain all material information concerning Vincom Retail Joint Stock Company (the “Company”) and its subsidiari
Slide 3: Executive Summary
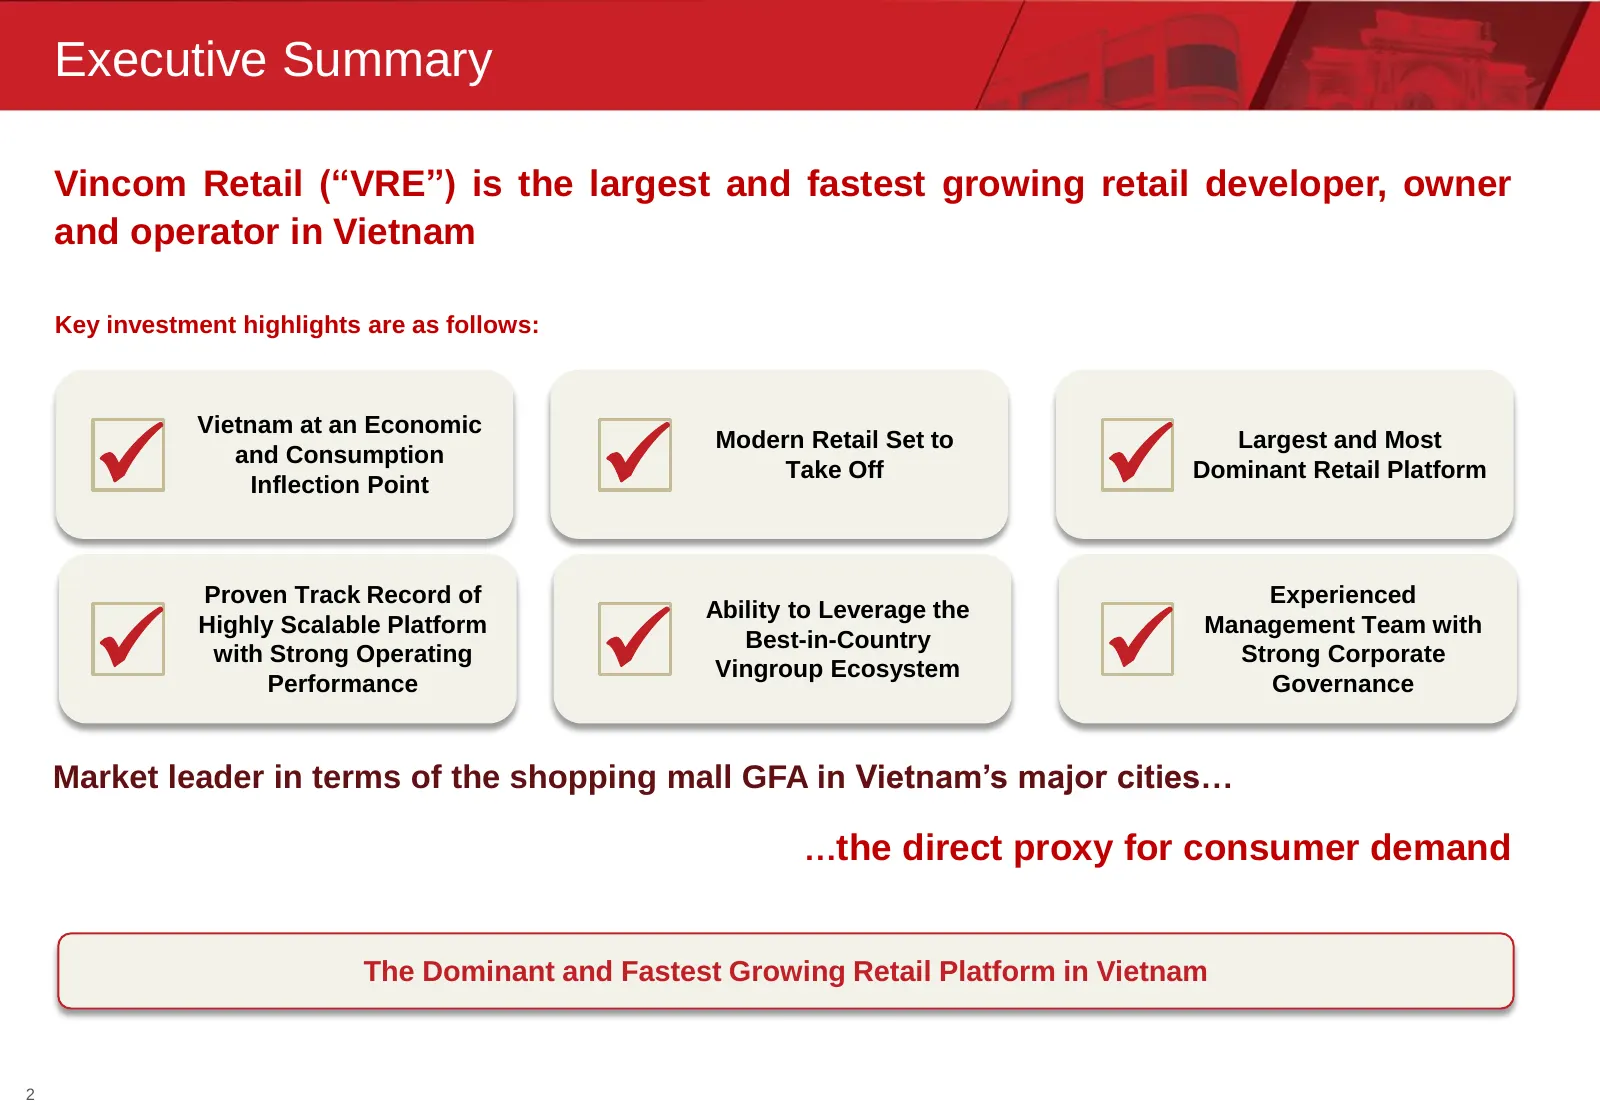
Executive Summary Vincom Retail (“VRE”) is the largest and fastest growing retail developer, owner and operator in Vietnam Key investment highlights are as follows: Vietnam at an Economic Modern Retail Set to Largest and Most and Consumption Take Off Dominant Retail Platform Inflection Point P
Slide 4: Vingroup & Vincom Retail: Market Leaders in Vietnam
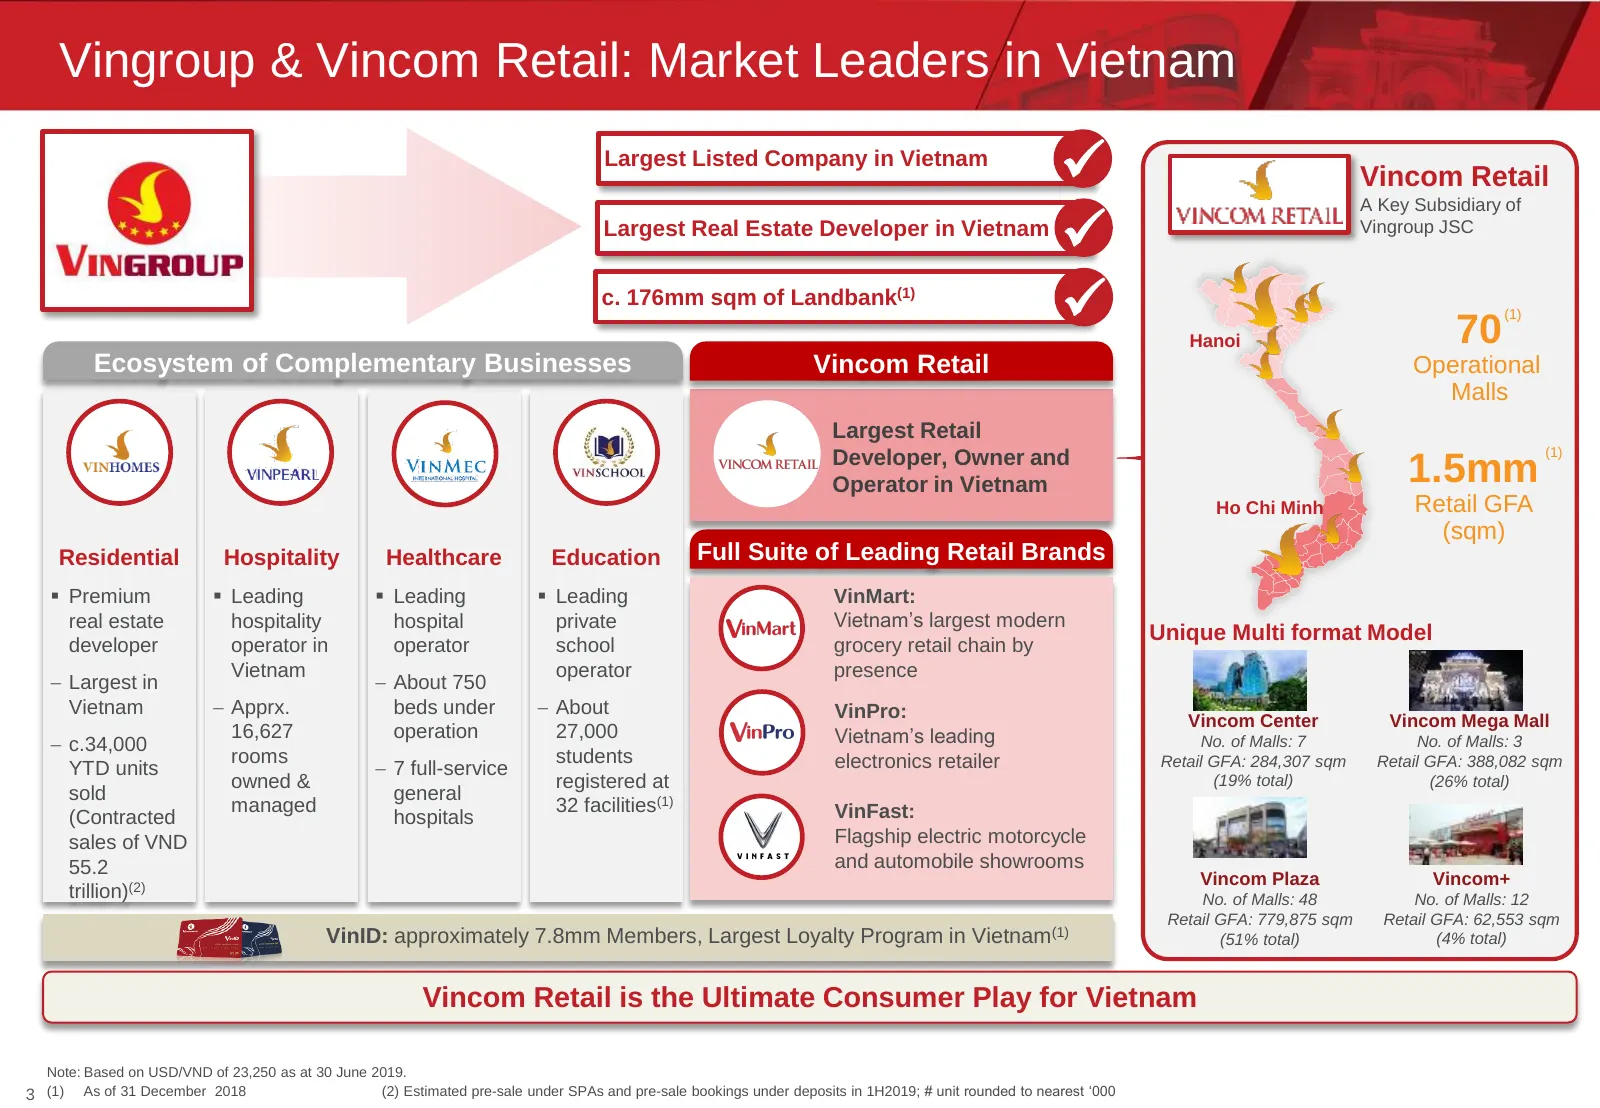
Vingroup & Vincom Retail: Market Leaders in Vietnam Largest Listed Company in Vietnam Vincom Retail A Key Subsidiary of Largest Real Estate Developer in Vietnam Vingroup JSC c. 176mm sqm of Landbank(1) Hanoi 70 (1) Ecosystem of Complementary Businesses Vincom Retail Operational Malls Largest R
Slide 5: Emergence of Vincom Retail as a Clear Market Leader
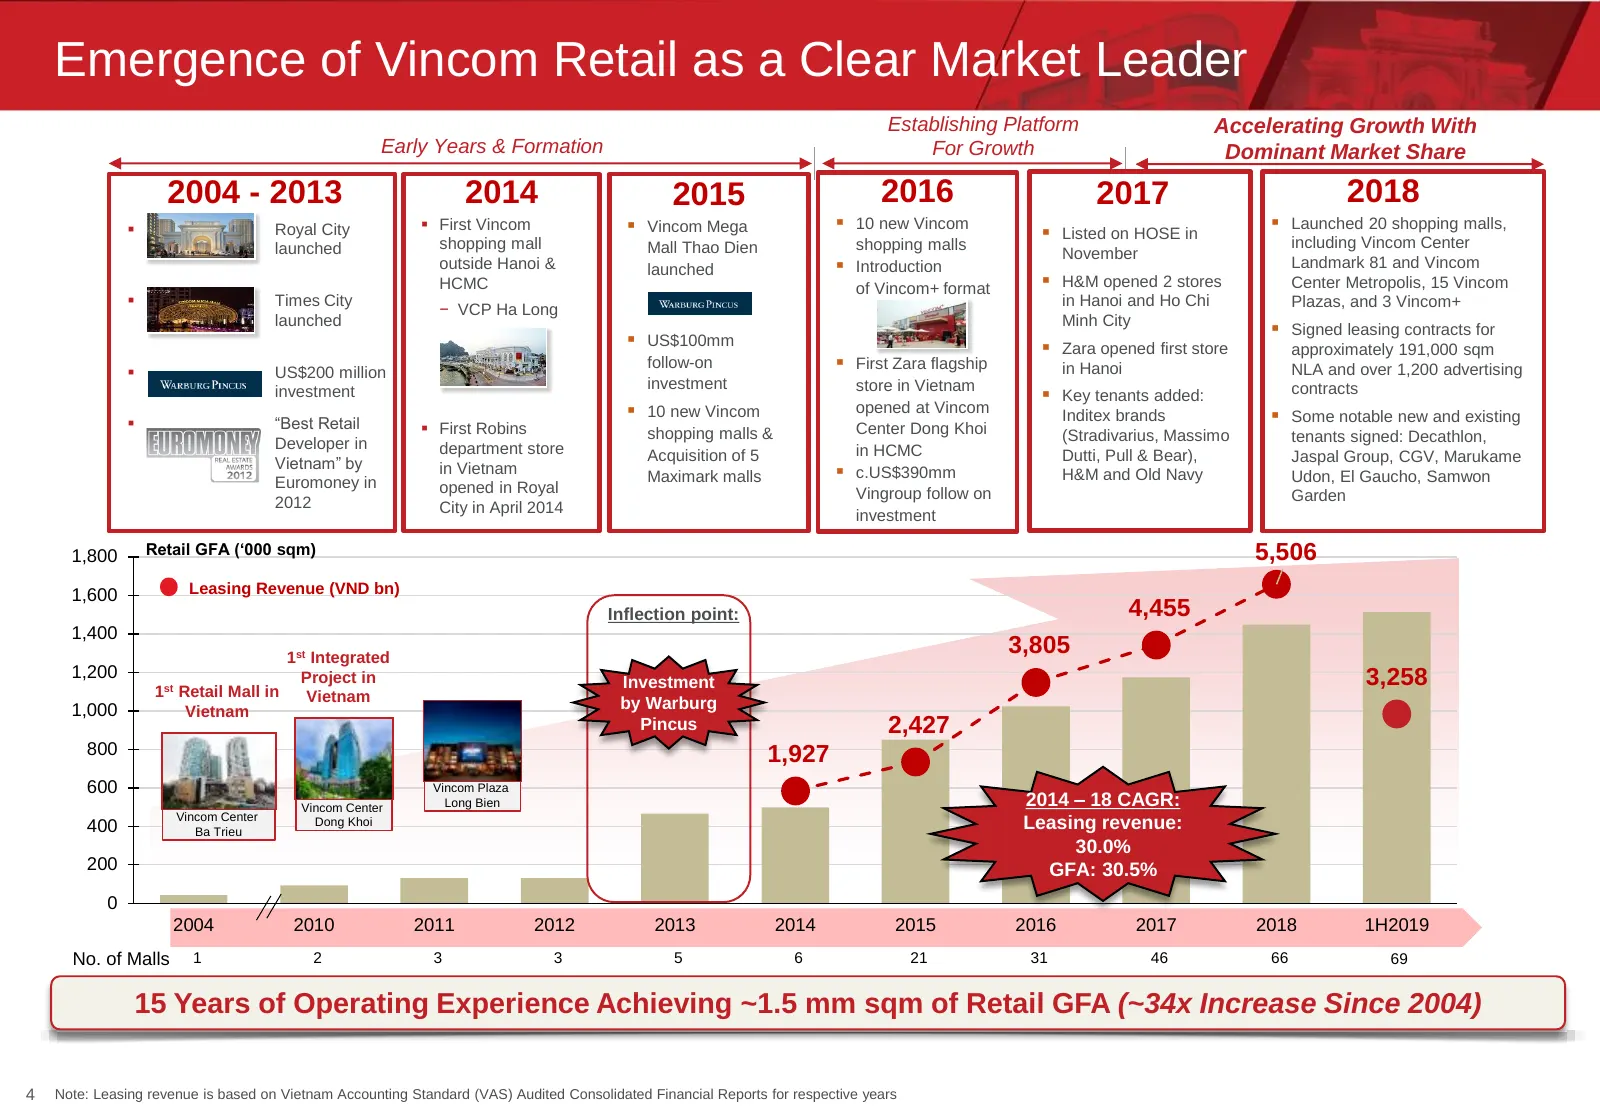
Emergence of Vincom Retail as a Clear Market Leader Establishing Platform Accelerating Growth With Early Years & Formation For Growth Dominant Market Share 2004 - 2013 2014 2015 2016 2017 2018 First Vincom Vincom Mega 10 new Vincom Launched 20 shopping malls, Royal City Listed on HOSE in
Slide 6: Retail Consolidates Around the Dominant Local Landlord
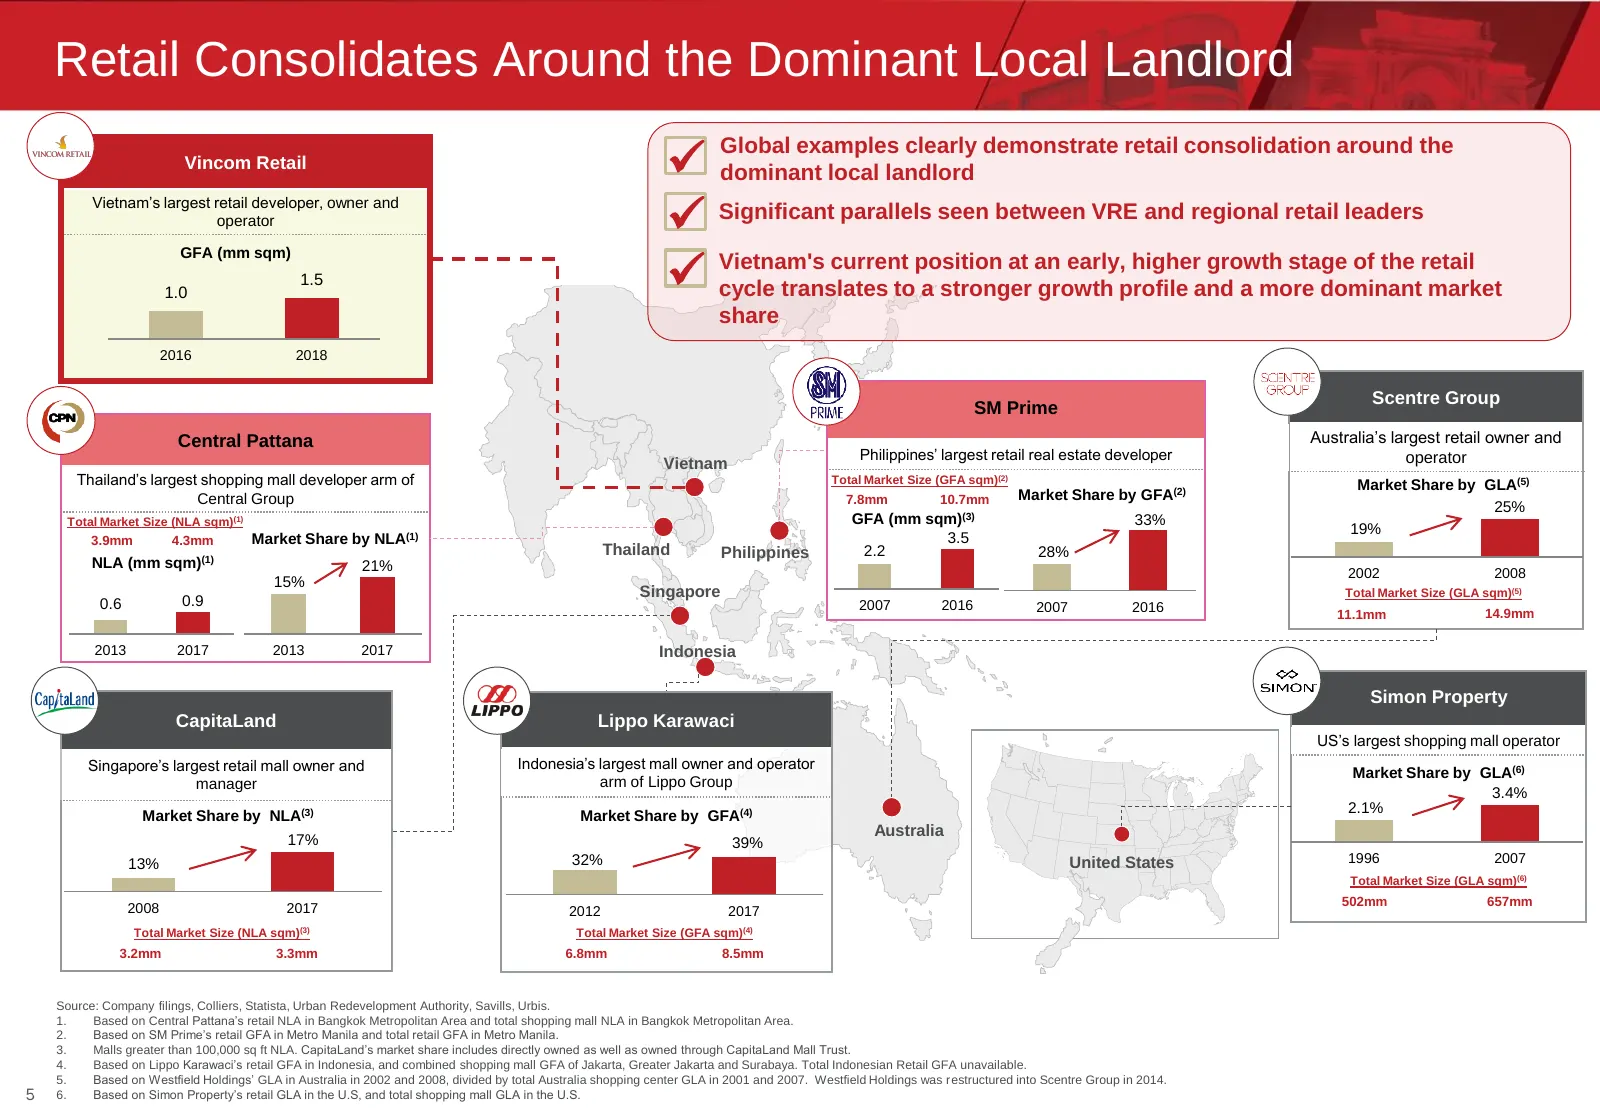
Retail Consolidates Around the Dominant Local Landlord dominant local landlord Global examples clearly demonstrate retail consolidation around the Vincom Retail Significant parallels seen between VRE and regional retail leaders Vietnam’s largest retail developer, owner and operator Vietnam's G

Slide 7: Key Investment Highlights
Key Investment Highlights
Slide 8: Key Investment Highlights
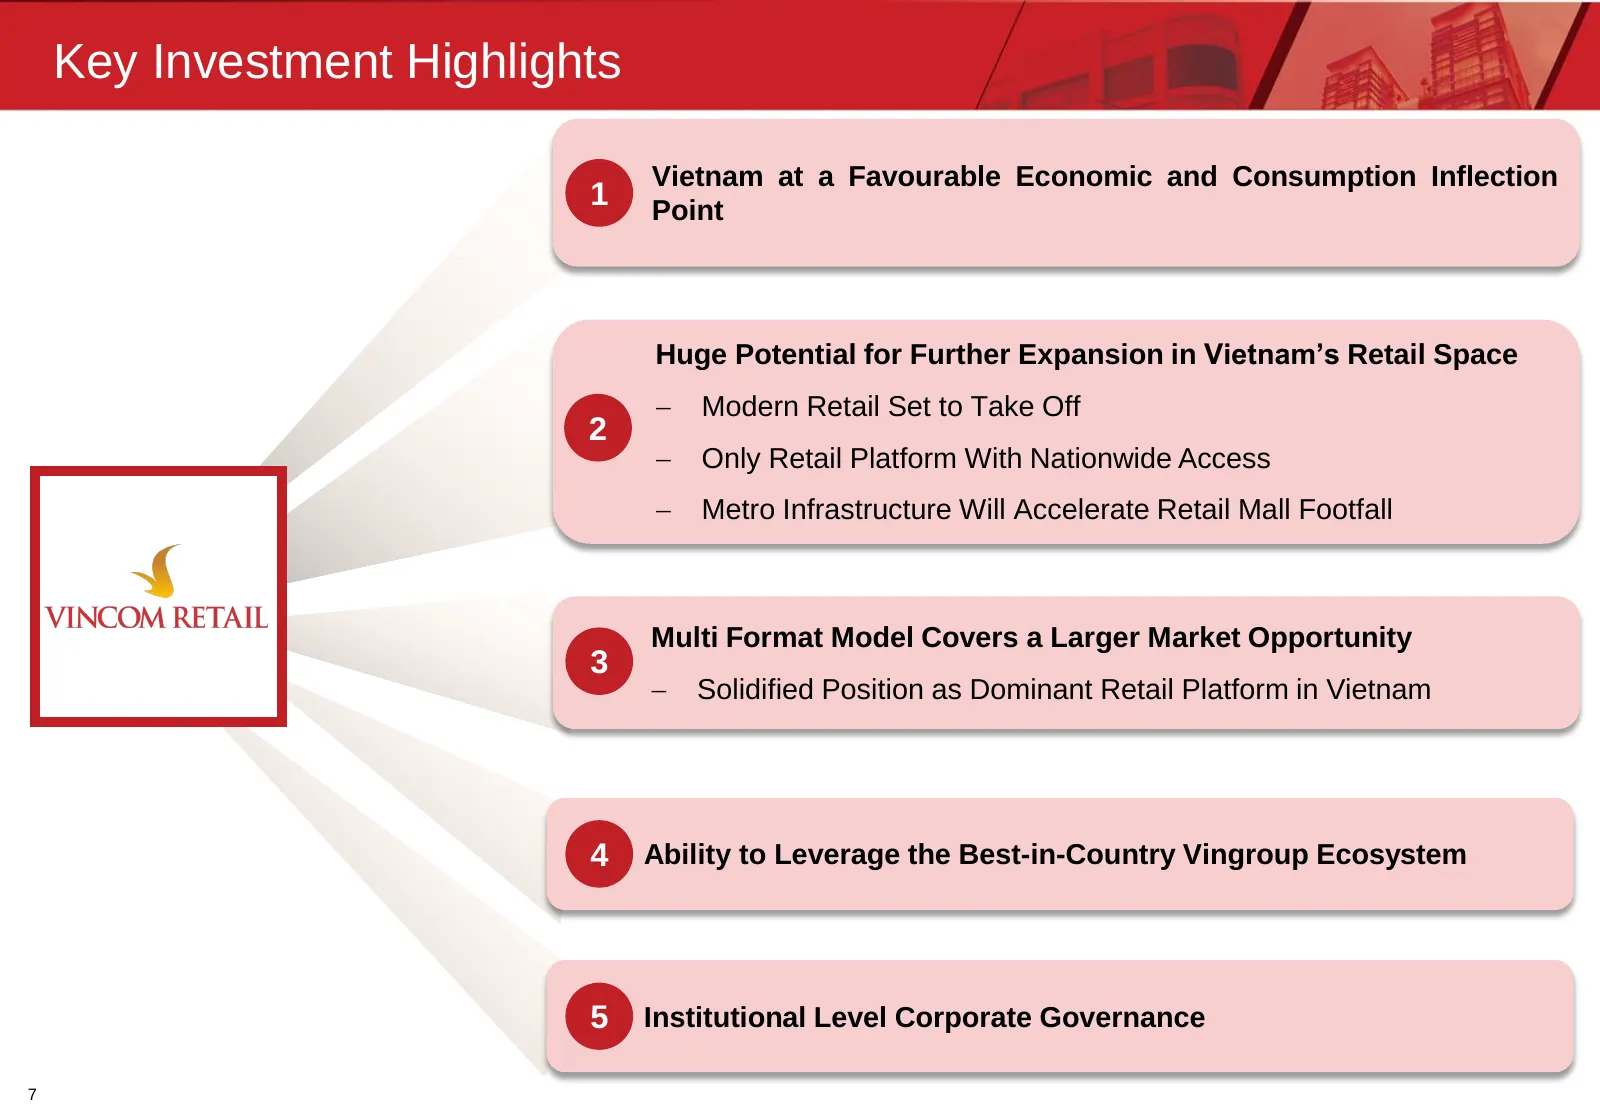
Key Investment Highlights Vietnam at a Favourable Economic and Consumption Inflection 1 Point Huge Potential for Further Expansion in Vietnam’s Retail Space Modern Retail Set to Take Off 2 Only Retail Platform With Nationwide Access Metro Infrastructure Will Accelerate Retail Mall Footfall Mul
Slide 9: Vietnam at a Favourable Economic and Consumption Inflection Point
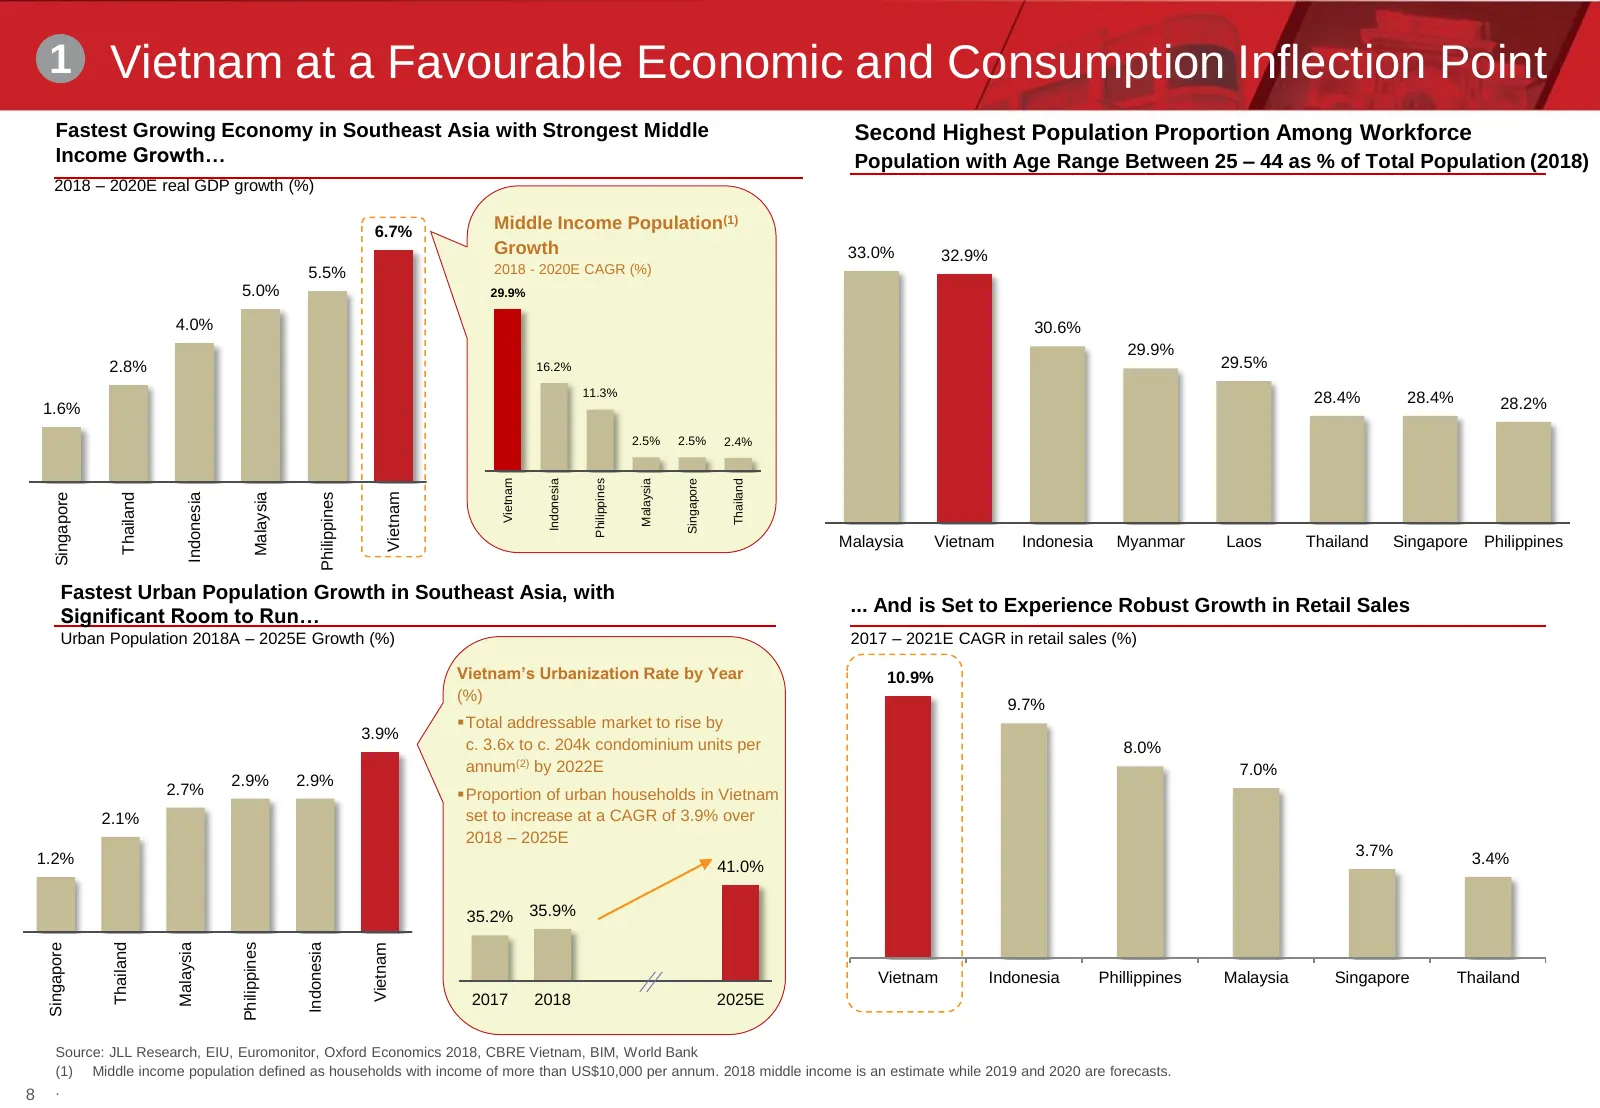
1 Vietnam at a Favourable Economic and Consumption Inflection Point Fastest Growing Economy in Southeast Asia with Strongest Middle Second Highest Population Proportion Among Workforce Income Growth… Population with Age Range Between 25 – 44 as % of Total Population (2018) 2018 – 2020E real GDP grow
Slide 10: Huge Potential for Further Expansion in Vietnam's Retail Space
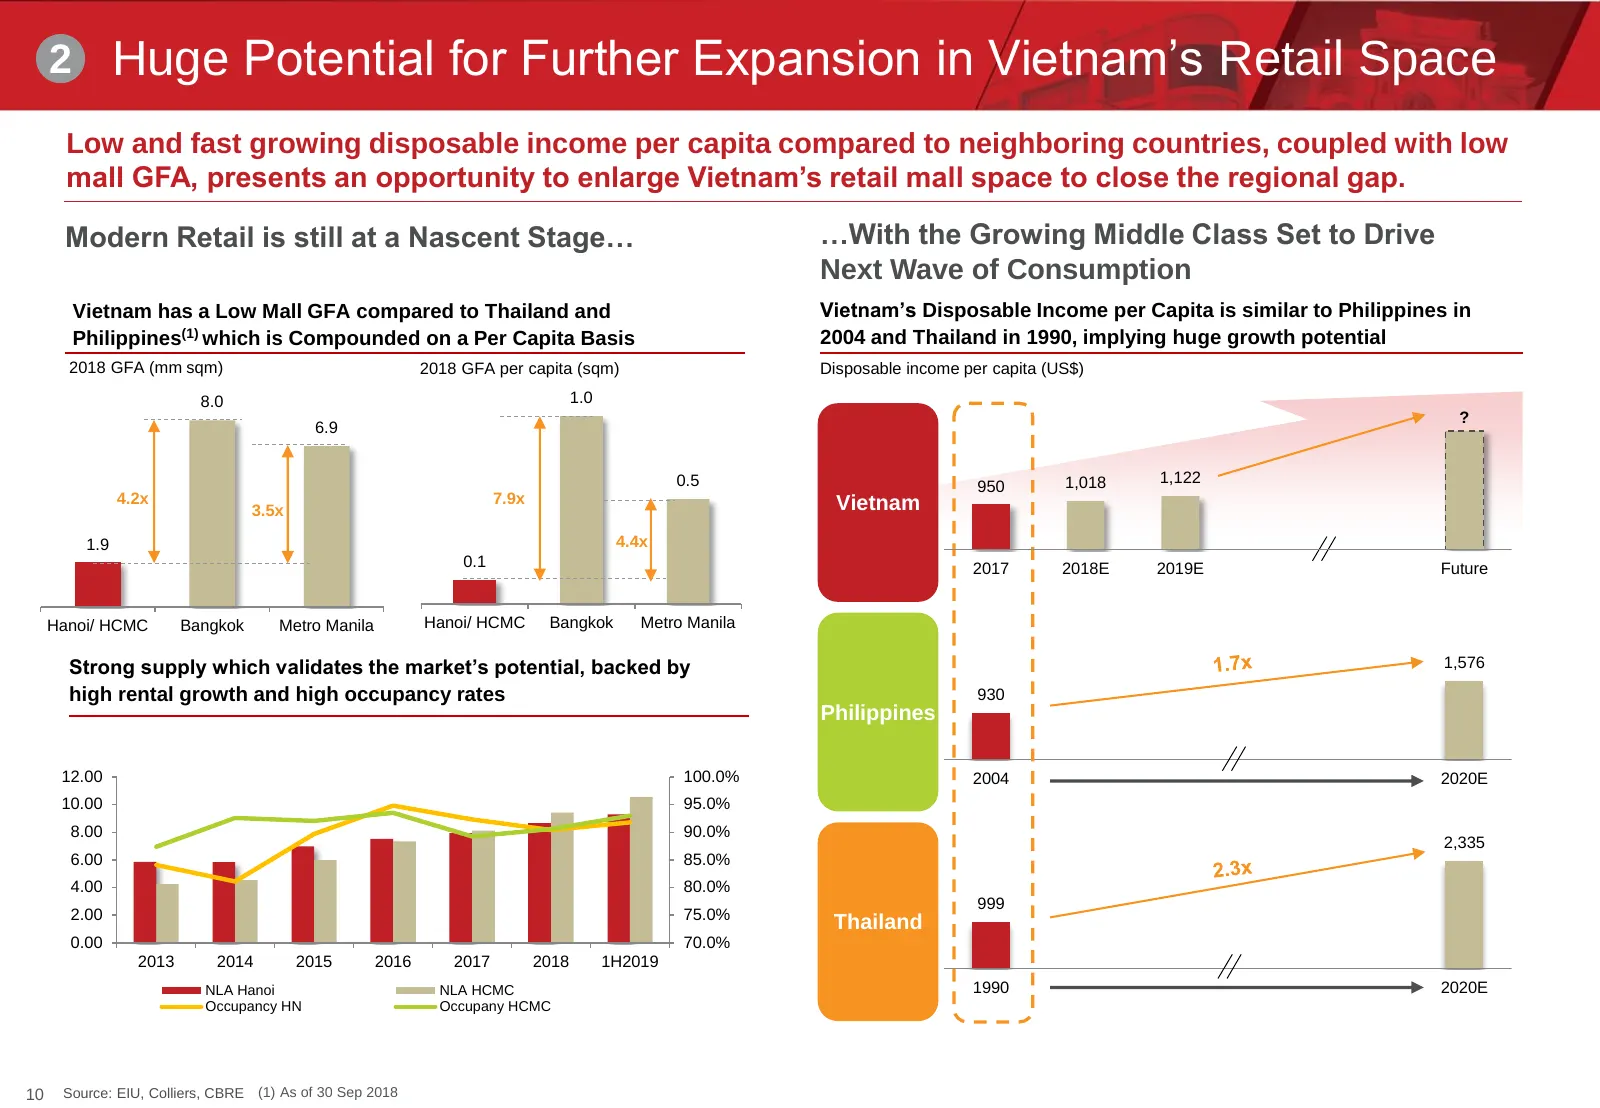
2 Huge Potential for Further Expansion in Vietnam’s Retail Space Low and fast growing disposable income per capita compared to neighboring countries, coupled with low mall GFA, presents an opportunity to enlarge Vietnam’s retail mall space to close the regional gap. Modern Retail is still at a Nasce
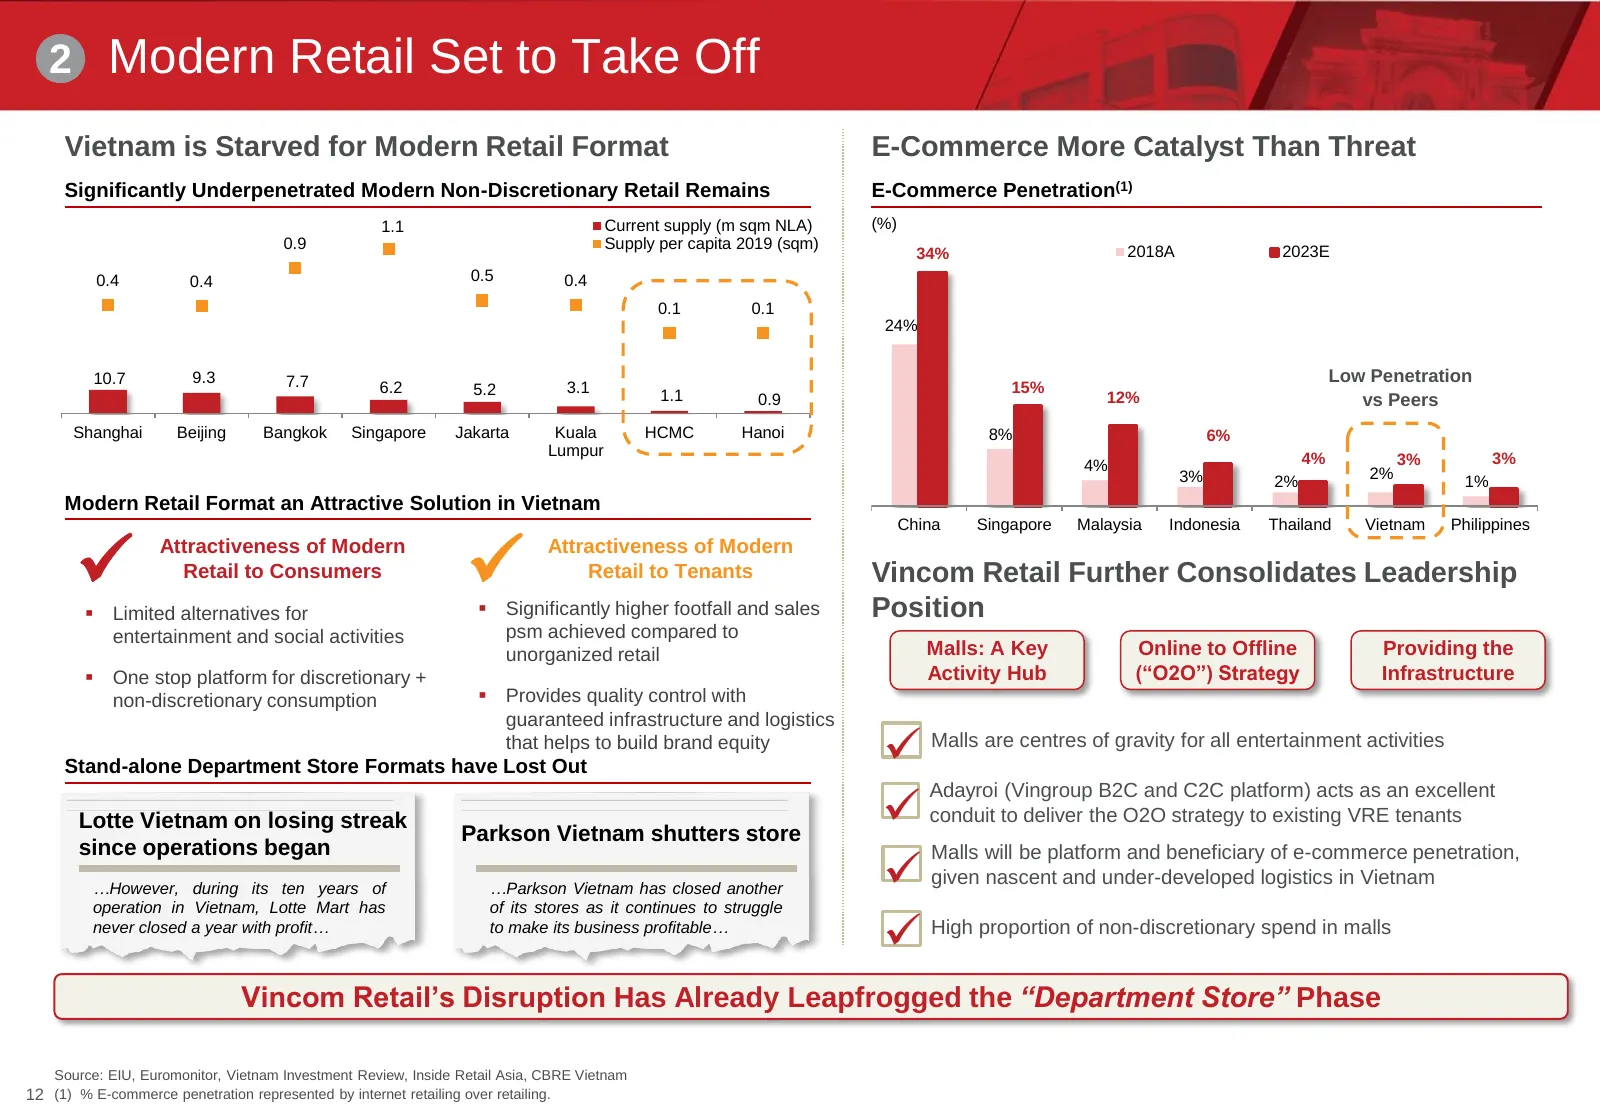
Slide 11: Modern Retail Set to Take Off
2 Modern Retail Set to Take Off Vietnam is Starved for Modern Retail Format E-Commerce More Catalyst Than Threat Significantly Underpenetrated Modern Non-Discretionary Retail Remains E-Commerce Penetration(1) 1.1 Current supply (m sqm NLA) (%) 0.9 Supply per capita 2019 (sqm) 2018A 2023E 34% 0.4 0.4
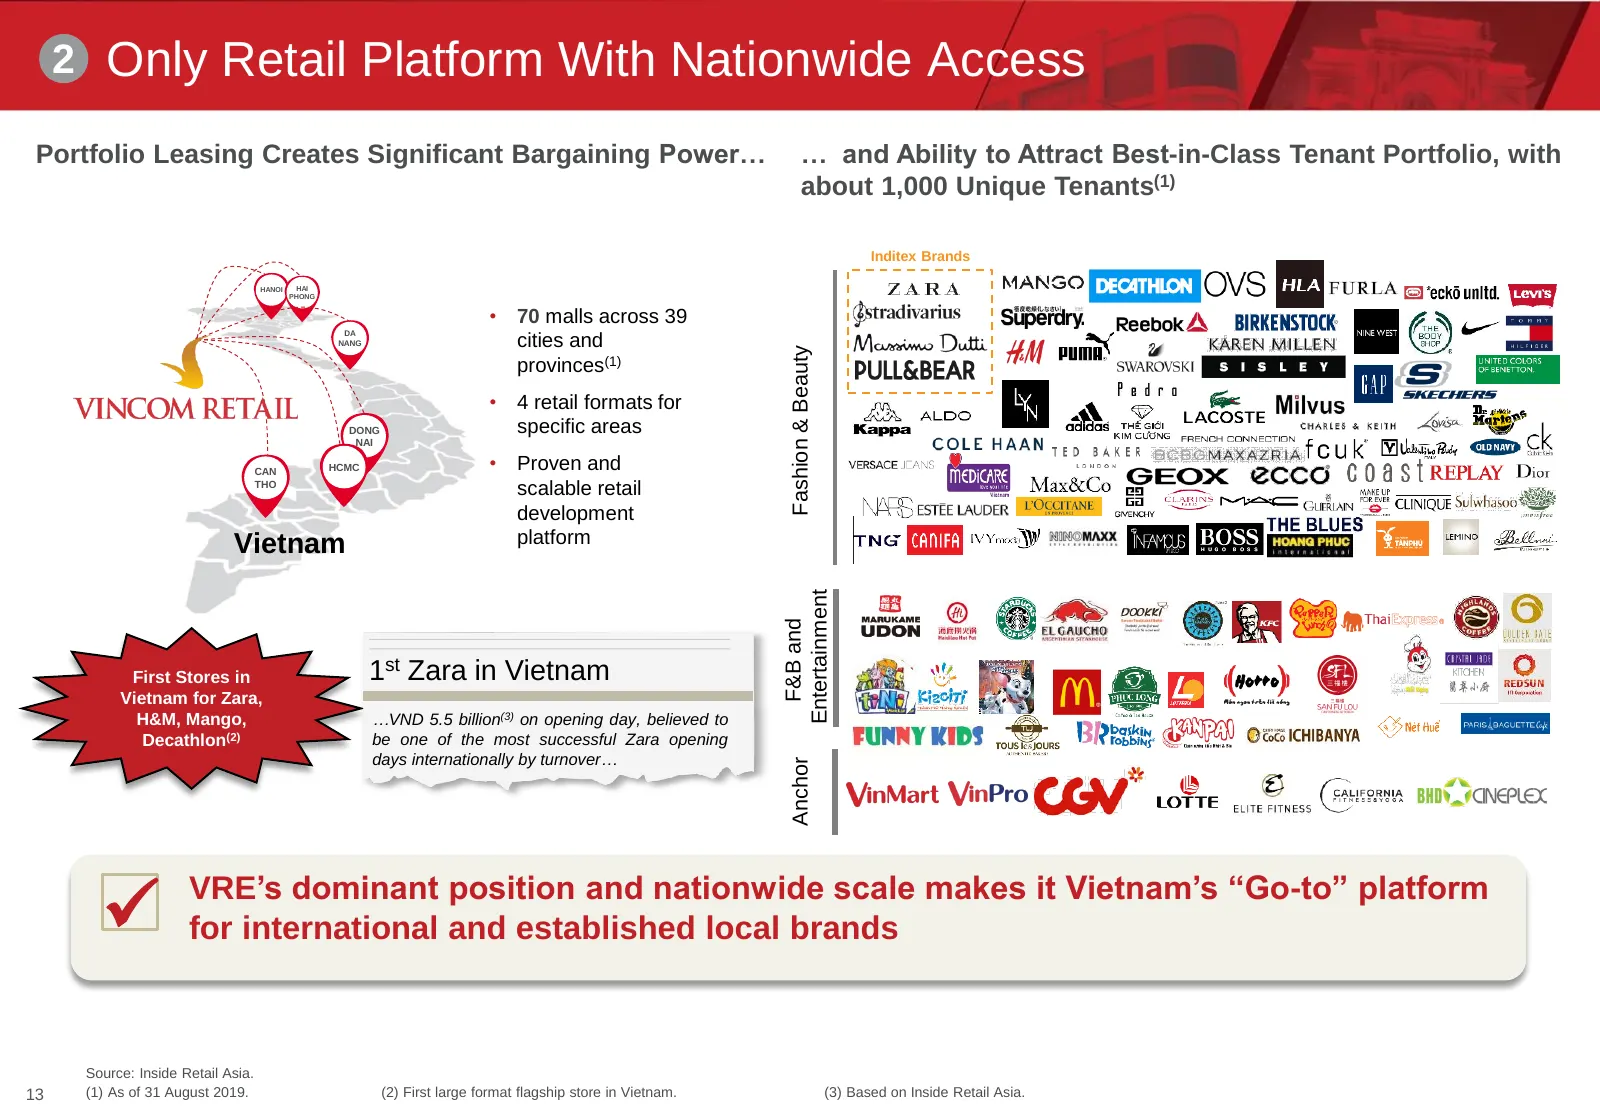
Slide 12: Only Retail Platform With Nationwide Access
2 Only Retail Platform With Nationwide Access Portfolio Leasing Creates Significant Bargaining Power… … and Ability to Attract Best-in-Class Tenant Portfolio, with about 1,000 Unique Tenants(1) Inditex Brands HANOI HAI PHONG • 70 malls across 39 DA NANG cities and Fashion & Beauty provinces(1) • 4 r
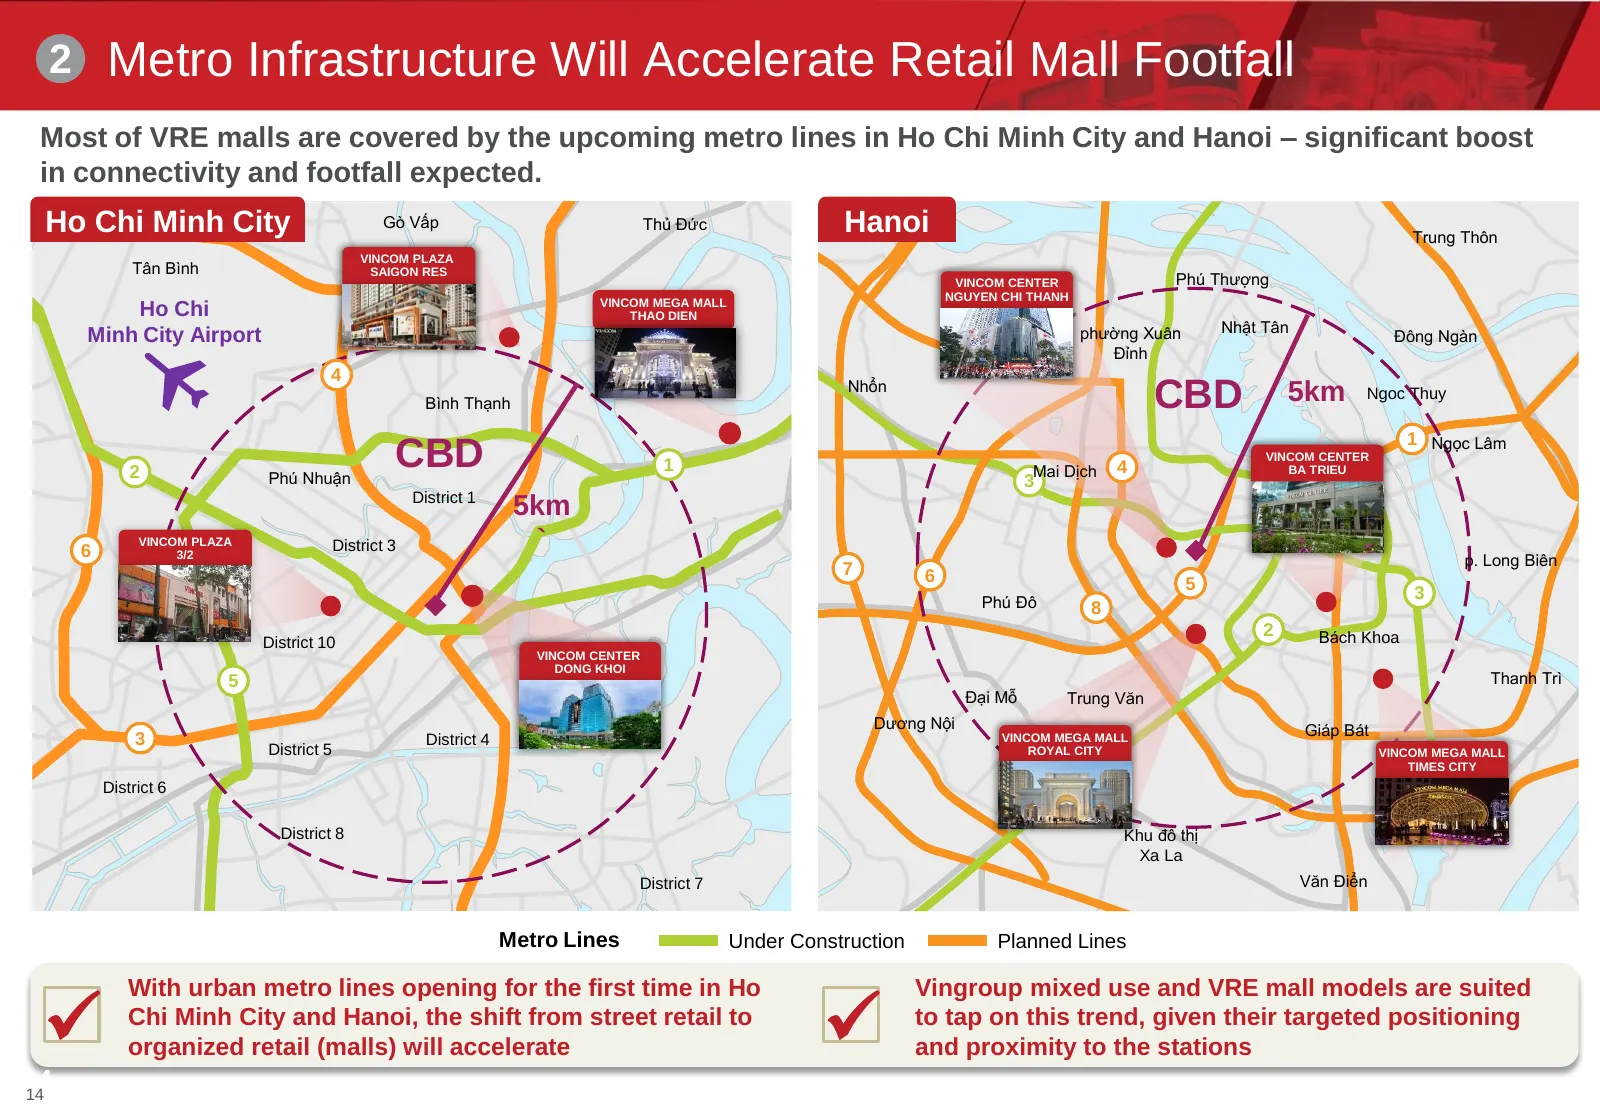
Slide 13: Metro Infrastructure Will Accelerate Retail Mall Footfall
2 Metro Infrastructure Will Accelerate Retail Mall Footfall Most of VRE malls are covered by the upcoming metro lines in Ho Chi Minh City and Hanoi – significant boost in connectivity and footfall expected. Ho Chi Minh City Gò Vấp Thủ Đức Hanoi Trung Thôn VINCOM PLAZA Tân Bình SAIGON RES VINCOM CENT
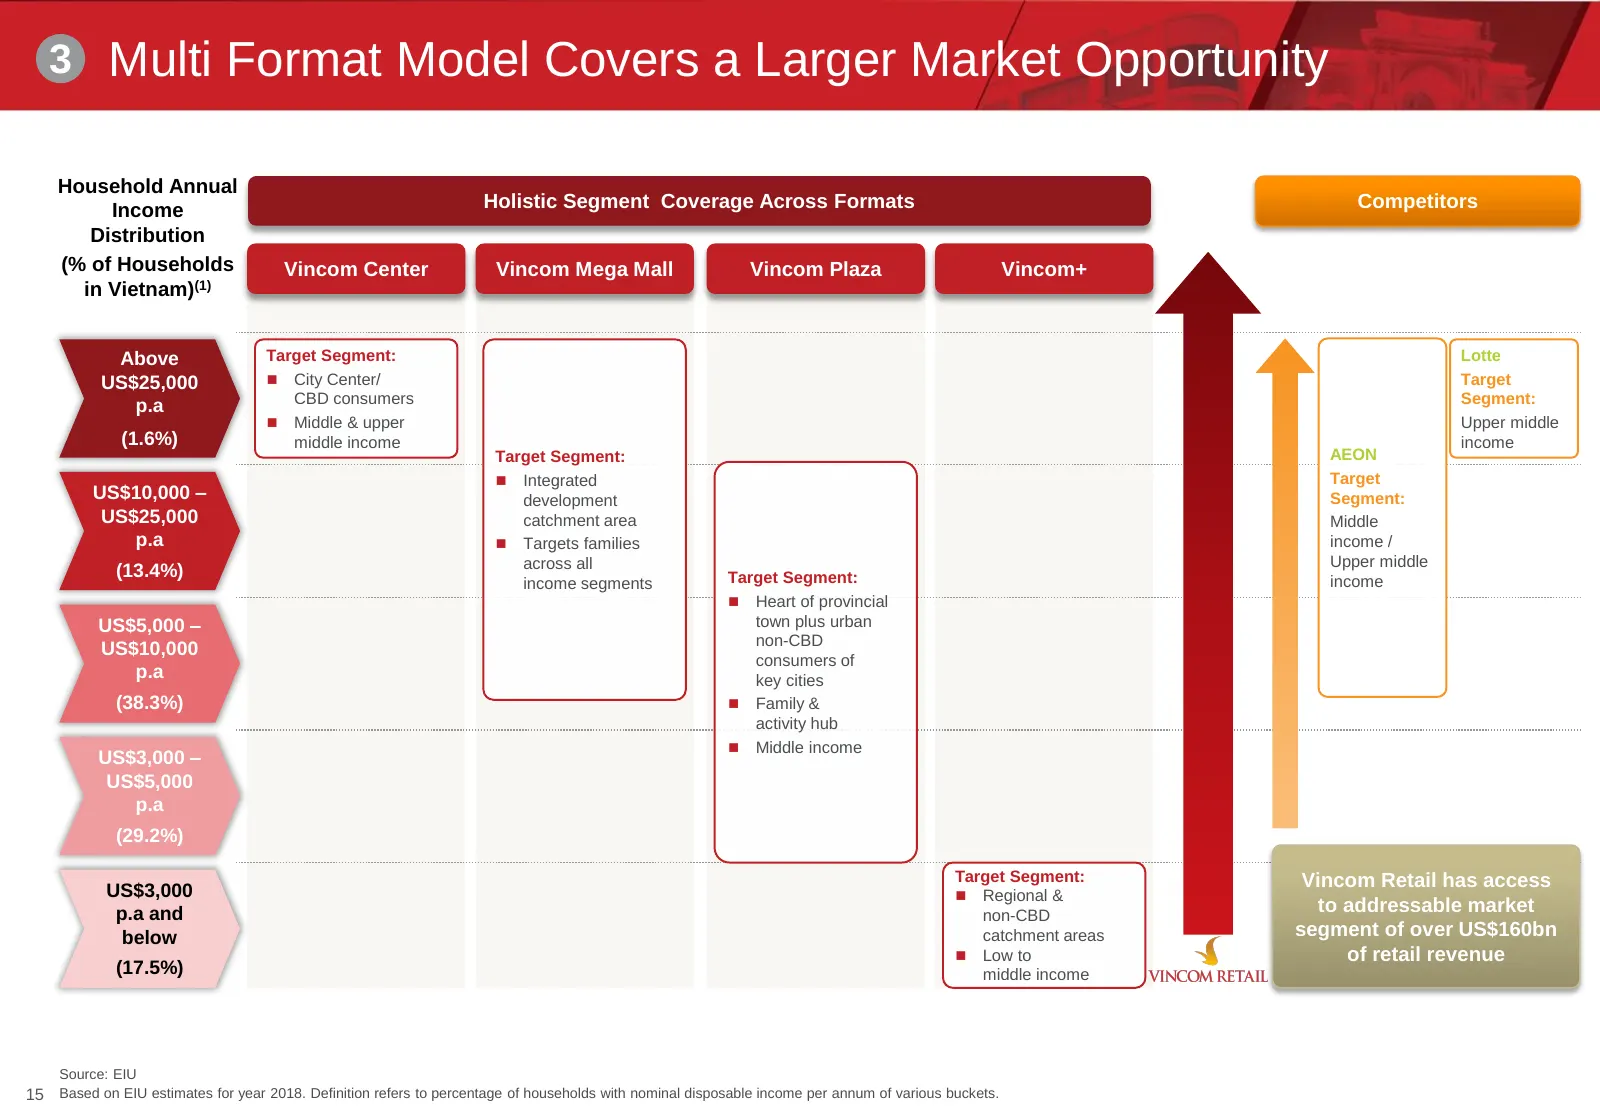
Slide 14: Multi Format Model Covers a Larger Market Opportunity
3 Multi Format Model Covers a Larger Market Opportunity Household Annual Income Holistic Segment Coverage Across Formats Competitors Distribution (% of Households Vincom Center Vincom Mega Mall Vincom Plaza Vincom+ in Vietnam)(1) Above Target Segment: Lotte US$25,000 City Center/ Target p.a CBD co
Slide 15: Solidified Position as Dominant Retail Platform in Vietnam
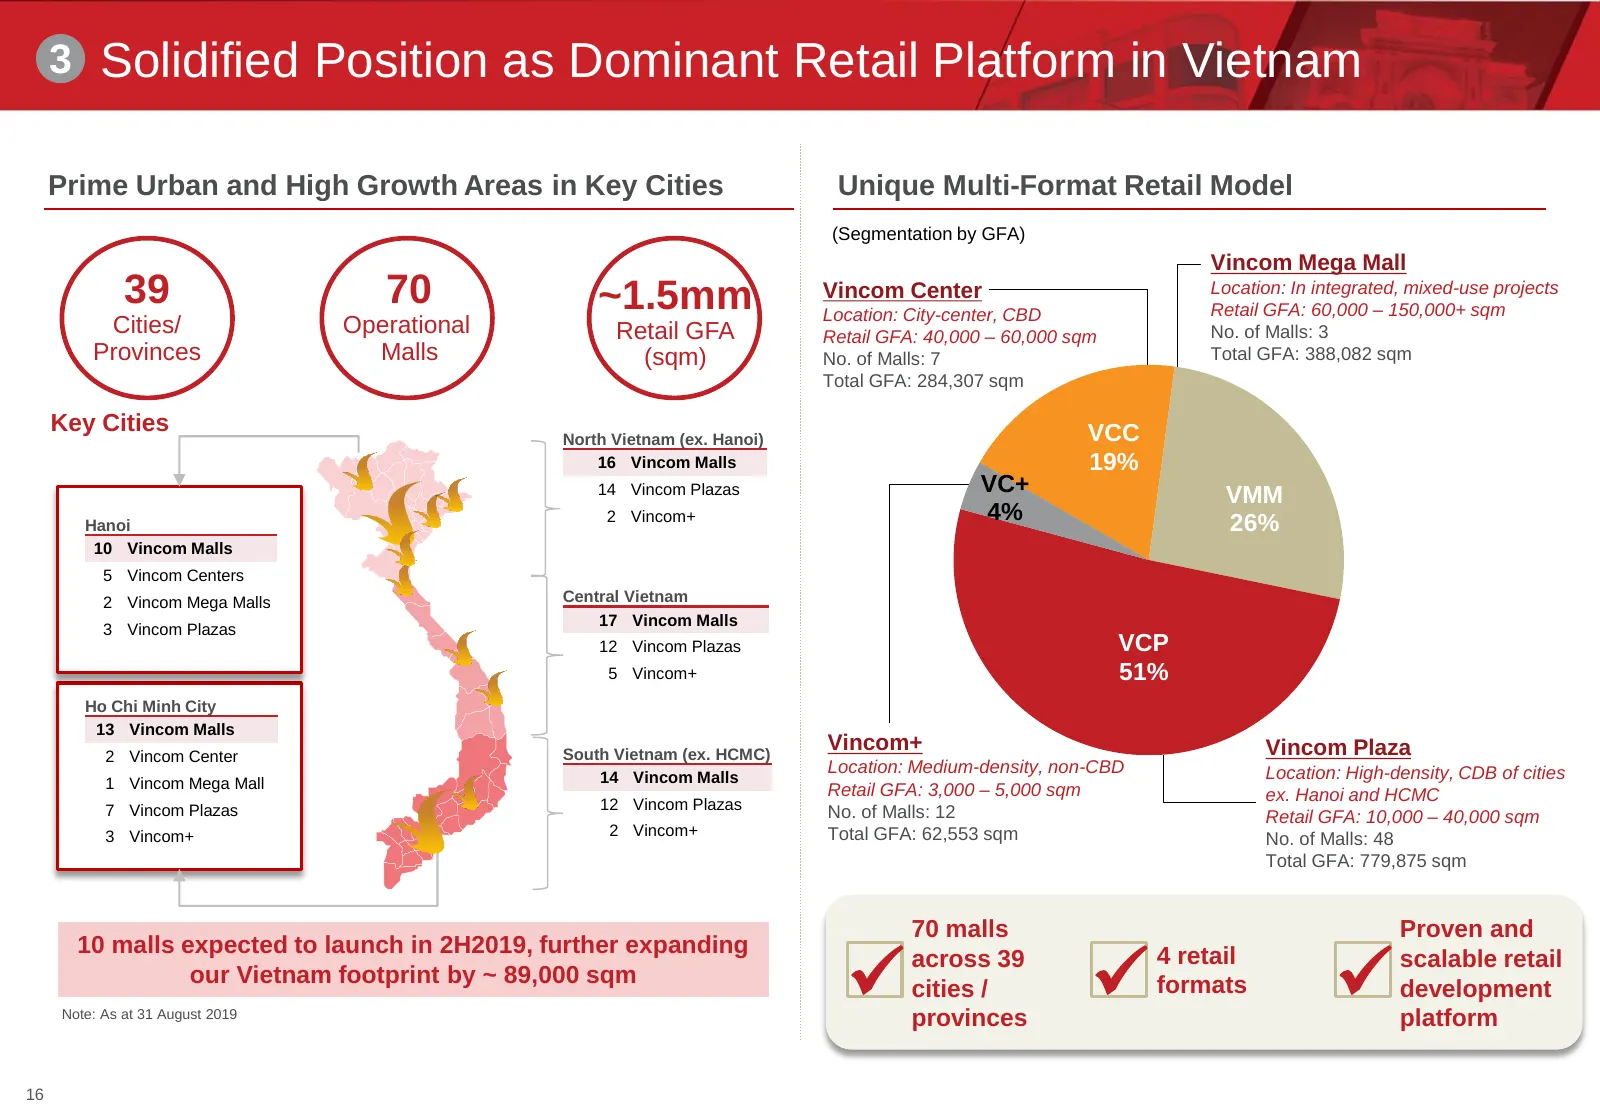
3 Solidified Position as Dominant Retail Platform in Vietnam Prime Urban and High Growth Areas in Key Cities Unique Multi-Format Retail Model (Segmentation by GFA) Vincom Mega Mall 39 70 ~1.5mm Vincom Center Location: City-center, CBD Location: In integrated, mixed-use projects Retail GFA: 60,000 –
Slide 16: Ability to Leverage the Best-in-Country Vingroup Ecosystem
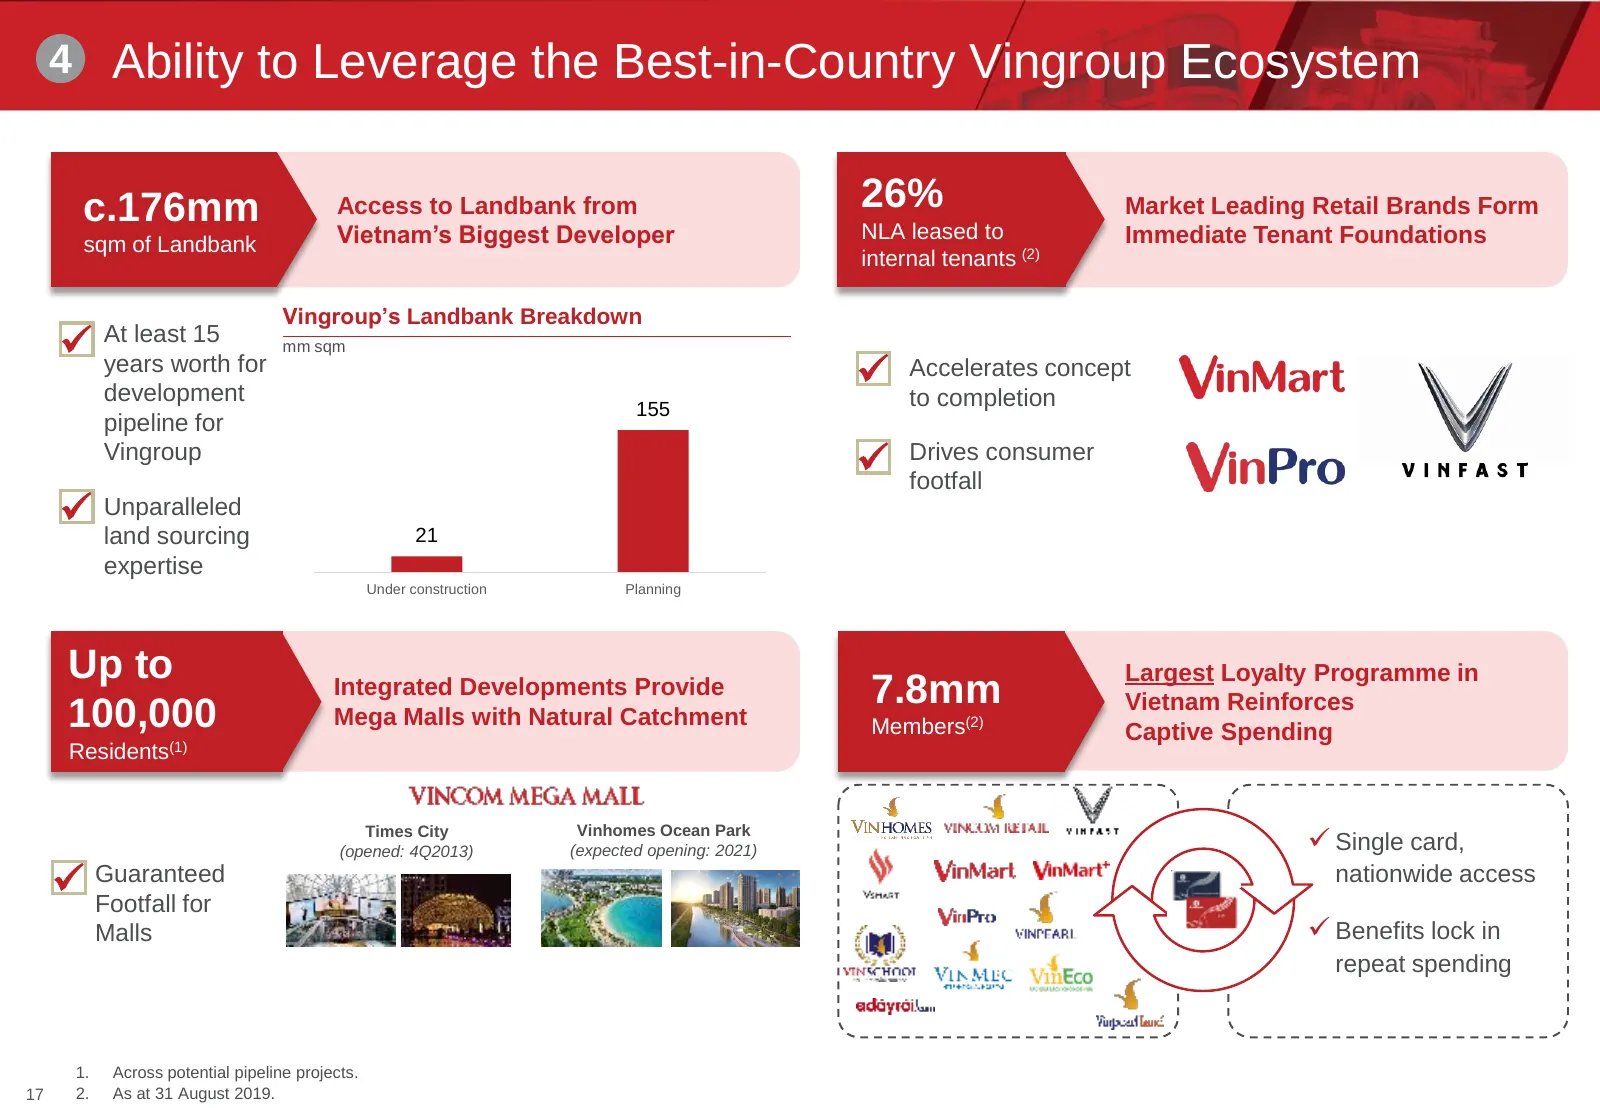
4 Ability to Leverage the Best-in-Country Vingroup Ecosystem c.176mm Access to Landbank from 26% Market Leading Retail Brands Form sqm of Landbank Vietnam’s Biggest Developer NLA leased to Immediate Tenant Foundations internal tenants (2) Vingroup’s Landbank Breakdown At least 15 mm sqm years wo
Slide 17: Institutional Level Corporate Governance
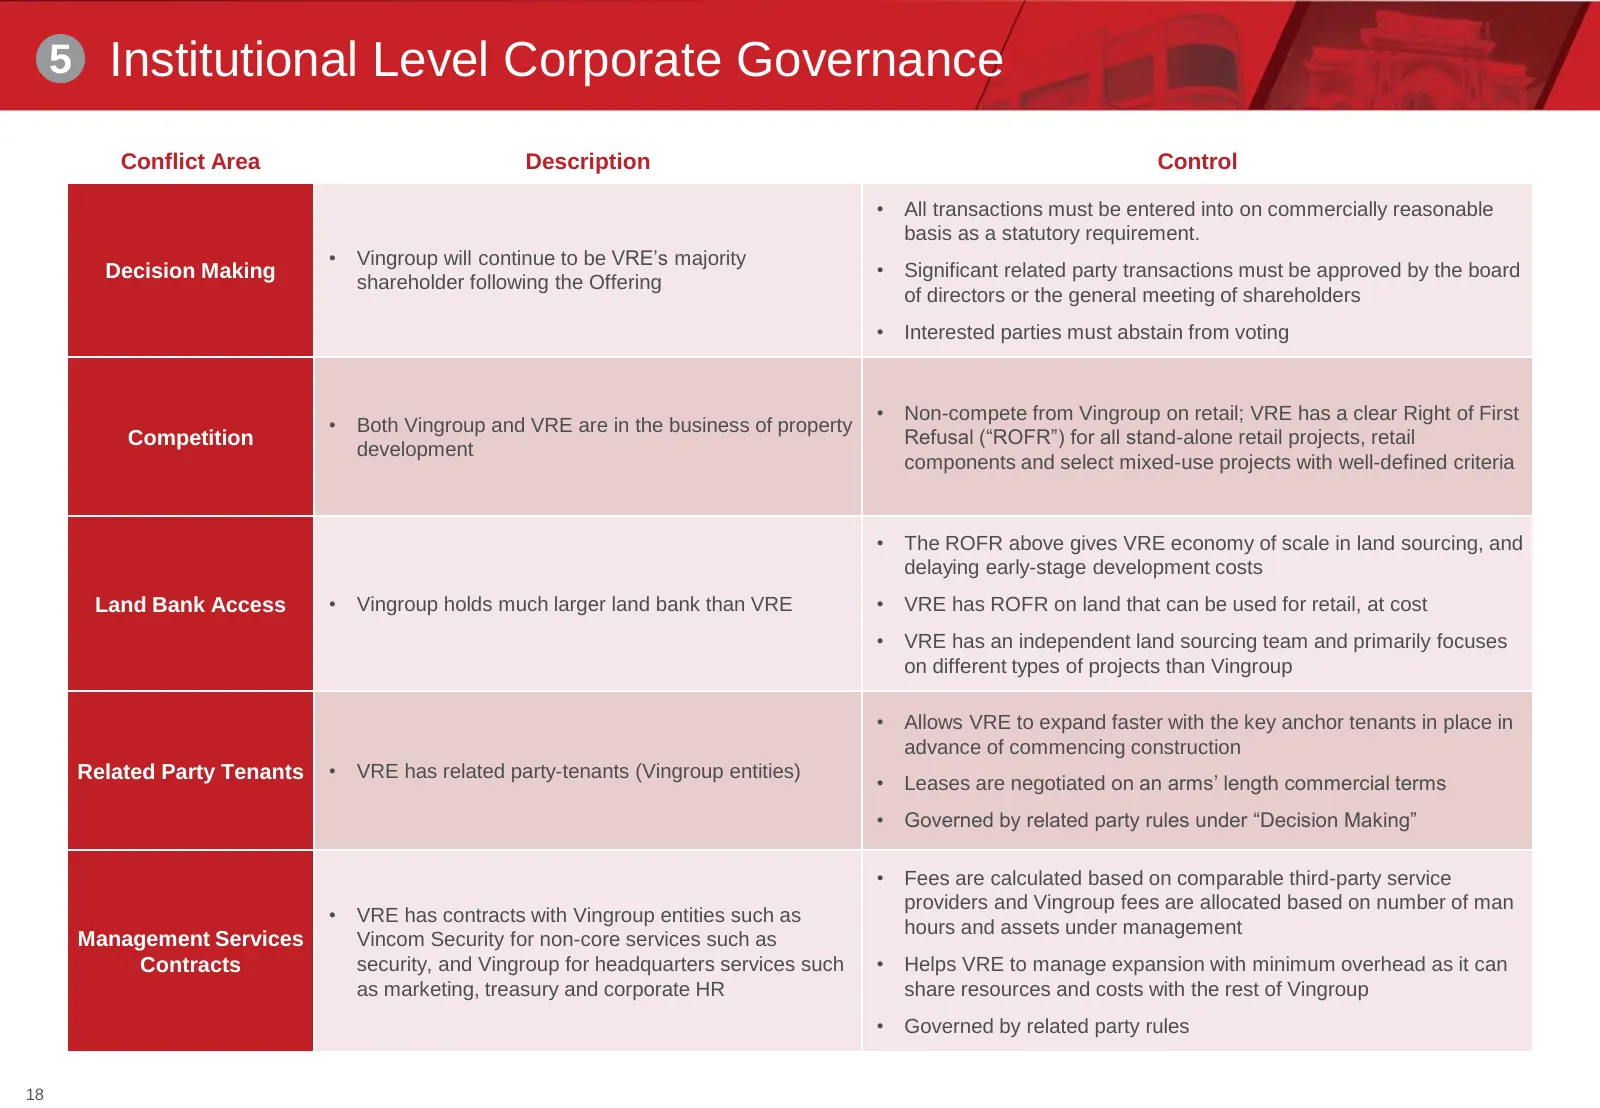
5 Institutional Level Corporate Governance Conflict Area Description Control • All transactions must be entered into on commercially reasonable basis as a statutory requirement. • Vingroup will continue to be VRE’s majority Decision Making • Significant related party transactions must be approved by
Slide 18: Operational Update
Operational Update
Slide 19: 2Q2019 Operational Highlights and Updates
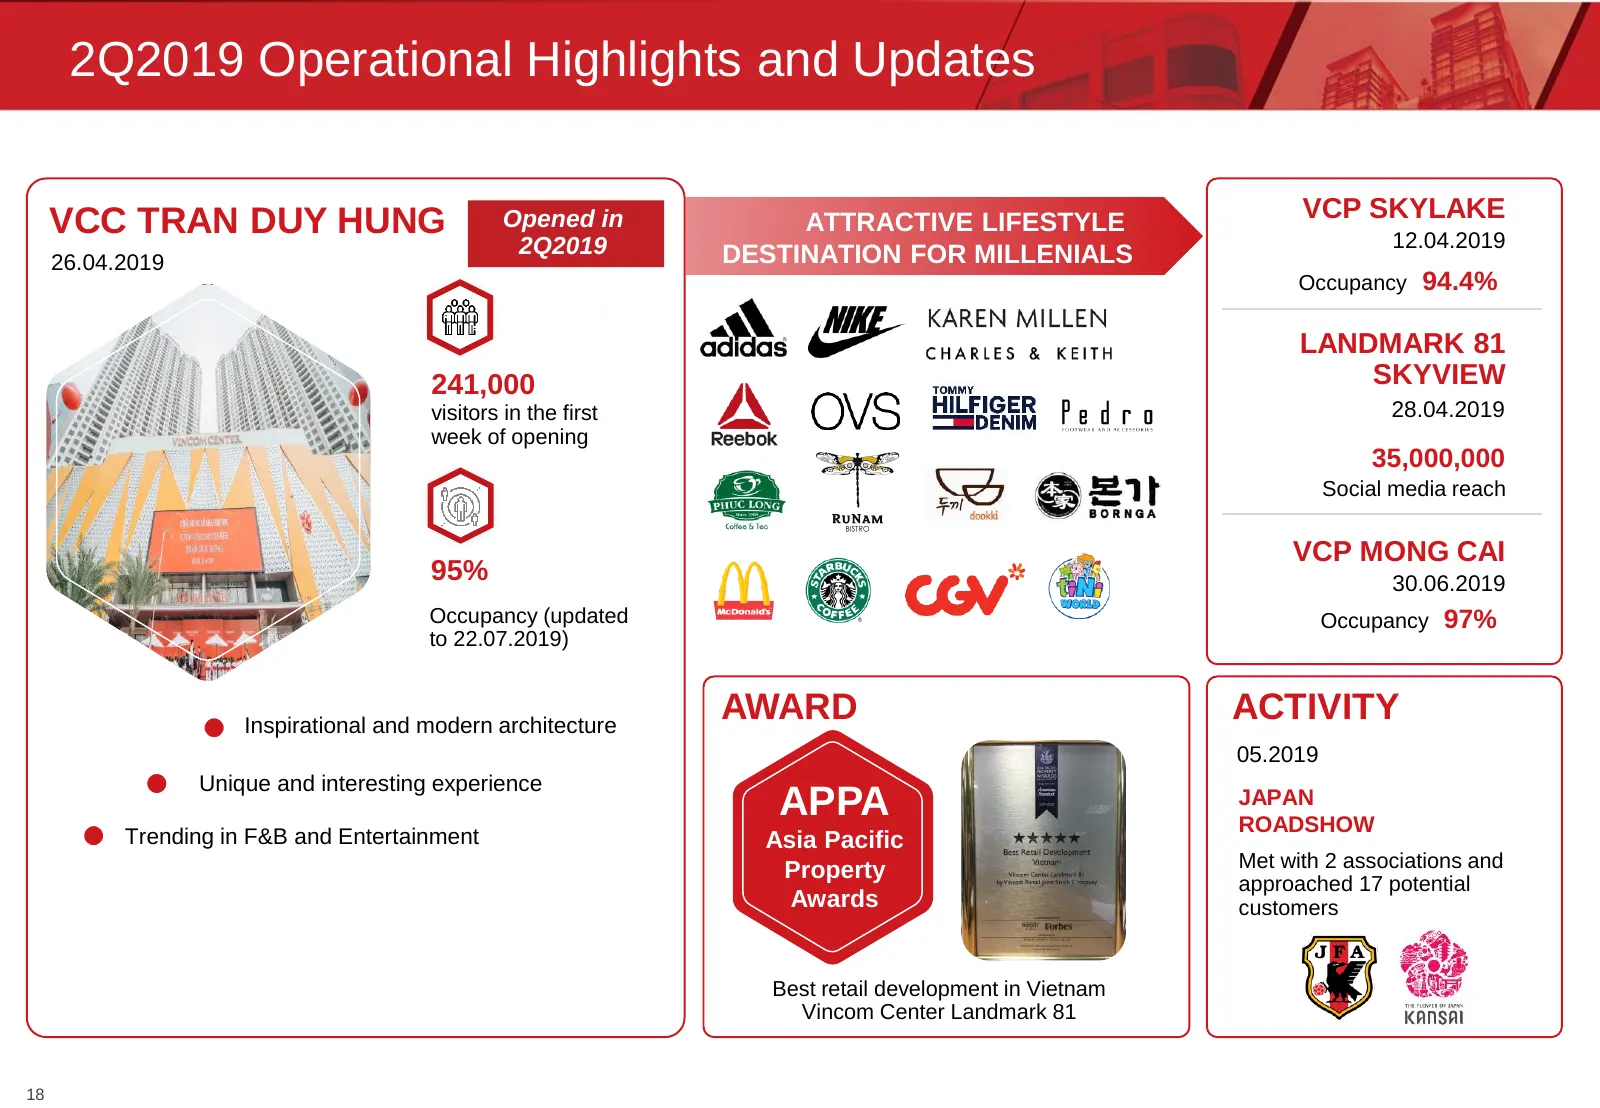
2Q2019 Operational Highlights and Updates VCP SKYLAKE VCC TRAN DUY HUNG Opened in ATTRACTIVE LIFESTYLE 12.04.2019 2Q2019 DESTINATION FOR MILLENIALS 26.04.2019 Occupancy 94.4% LANDMARK 81 241,000 SKYVIEW visitors in the first 28.04.2019 week of opening 35,000,000 Social media reach VCP MONG CAI 95% 3
Slide 20: Sales Activities – Result in 2Q2019
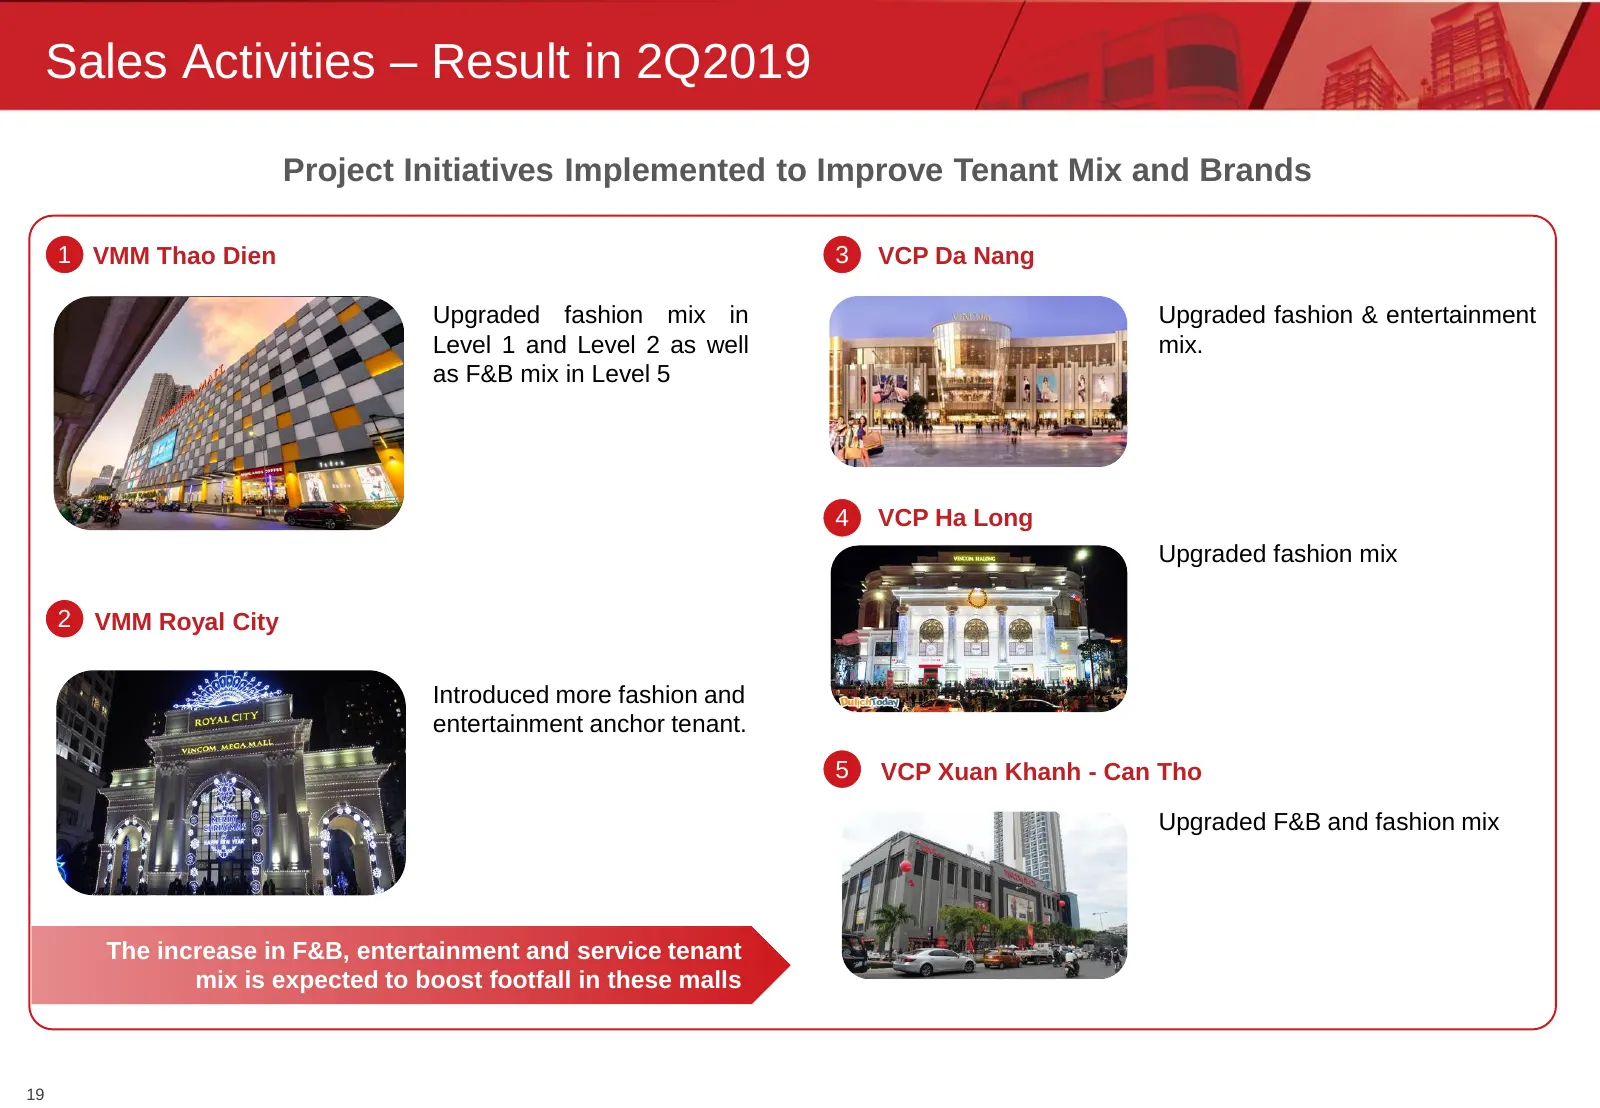
Sales Activities – Result in 2Q2019 Project Initiatives Implemented to Improve Tenant Mix and Brands 1 VMM Thao Dien 3 VCP Da Nang Upgraded fashion mix in Upgraded fashion & entertainment Level 1 and Level 2 as well mix. as F&B mix in Level 5 4 VCP Ha Long Upgraded fashion mix 2 VMM Royal City Intro
Slide 21: Sales Activities – Tenant Expansion
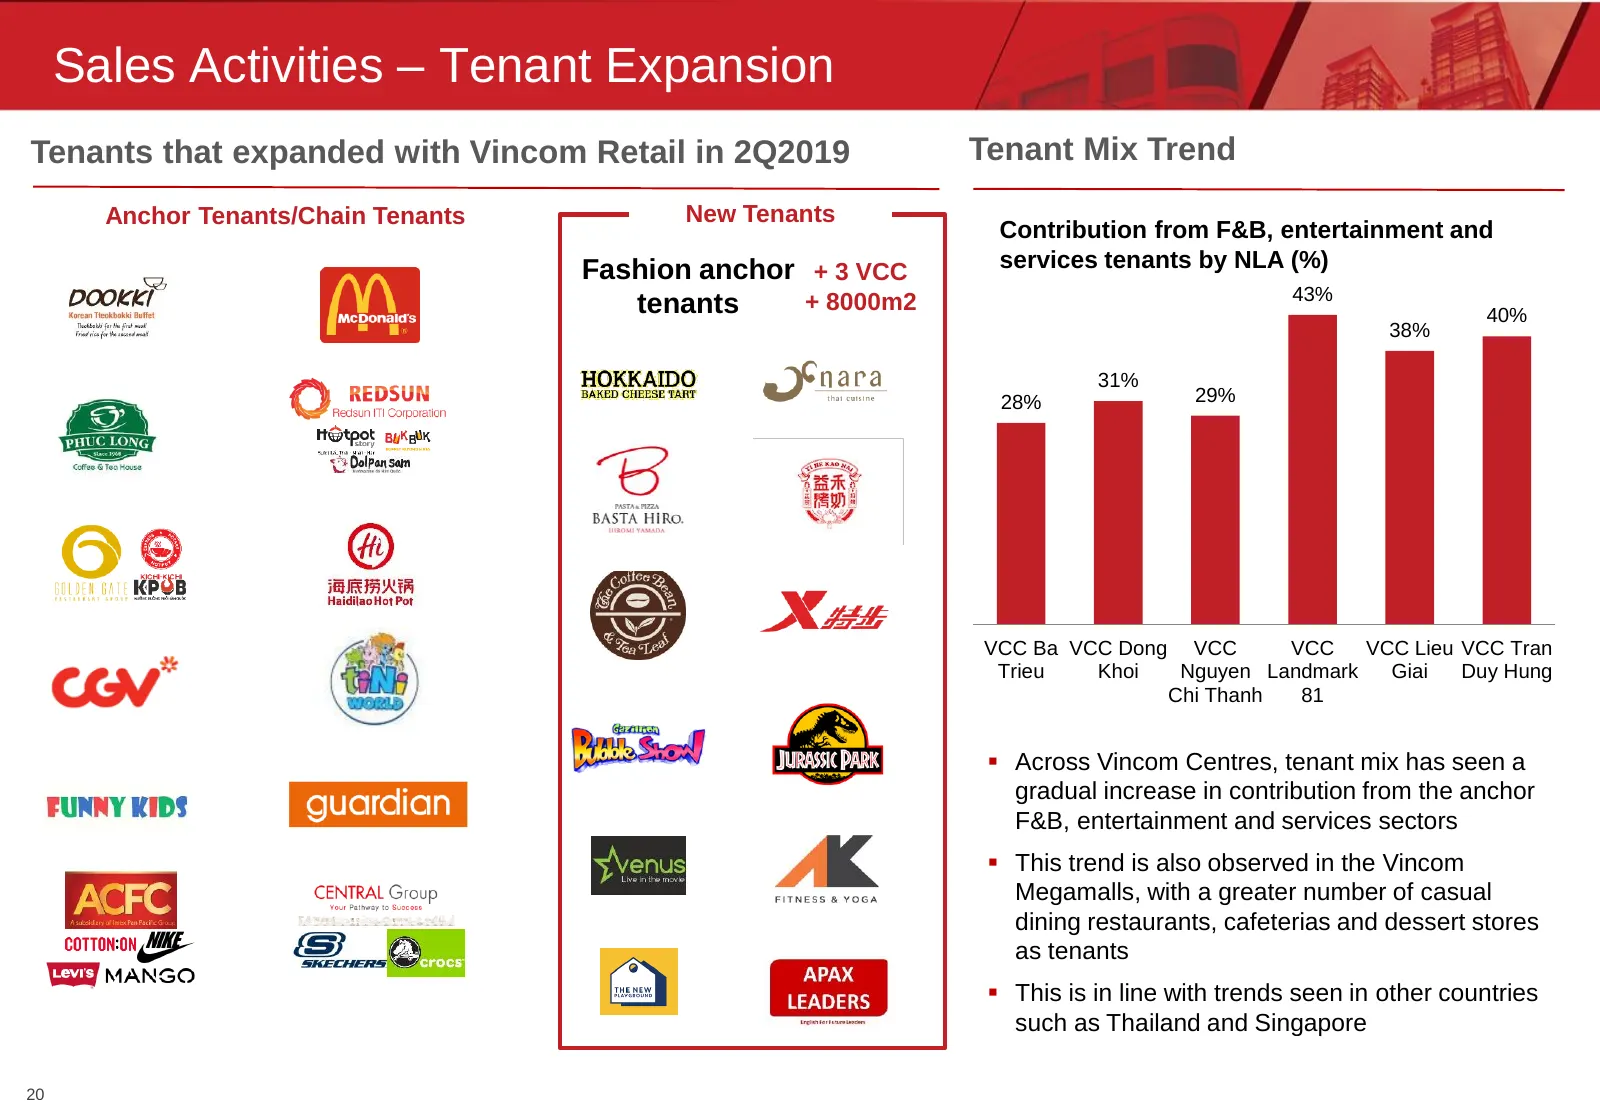
Sales Activities – Tenant Expansion Tenants that expanded with Vincom Retail in 2Q2019 Tenant Mix Trend Anchor Tenants/Chain Tenants New Tenants Contribution from F&B, entertainment and Fashion anchor + 3 VCC services tenants by NLA (%) + 8000m2 43% tenants 40% 38% 31% 28% 29% VCC Ba VCC Dong VCC VC
Slide 22: Key Operational Metrics
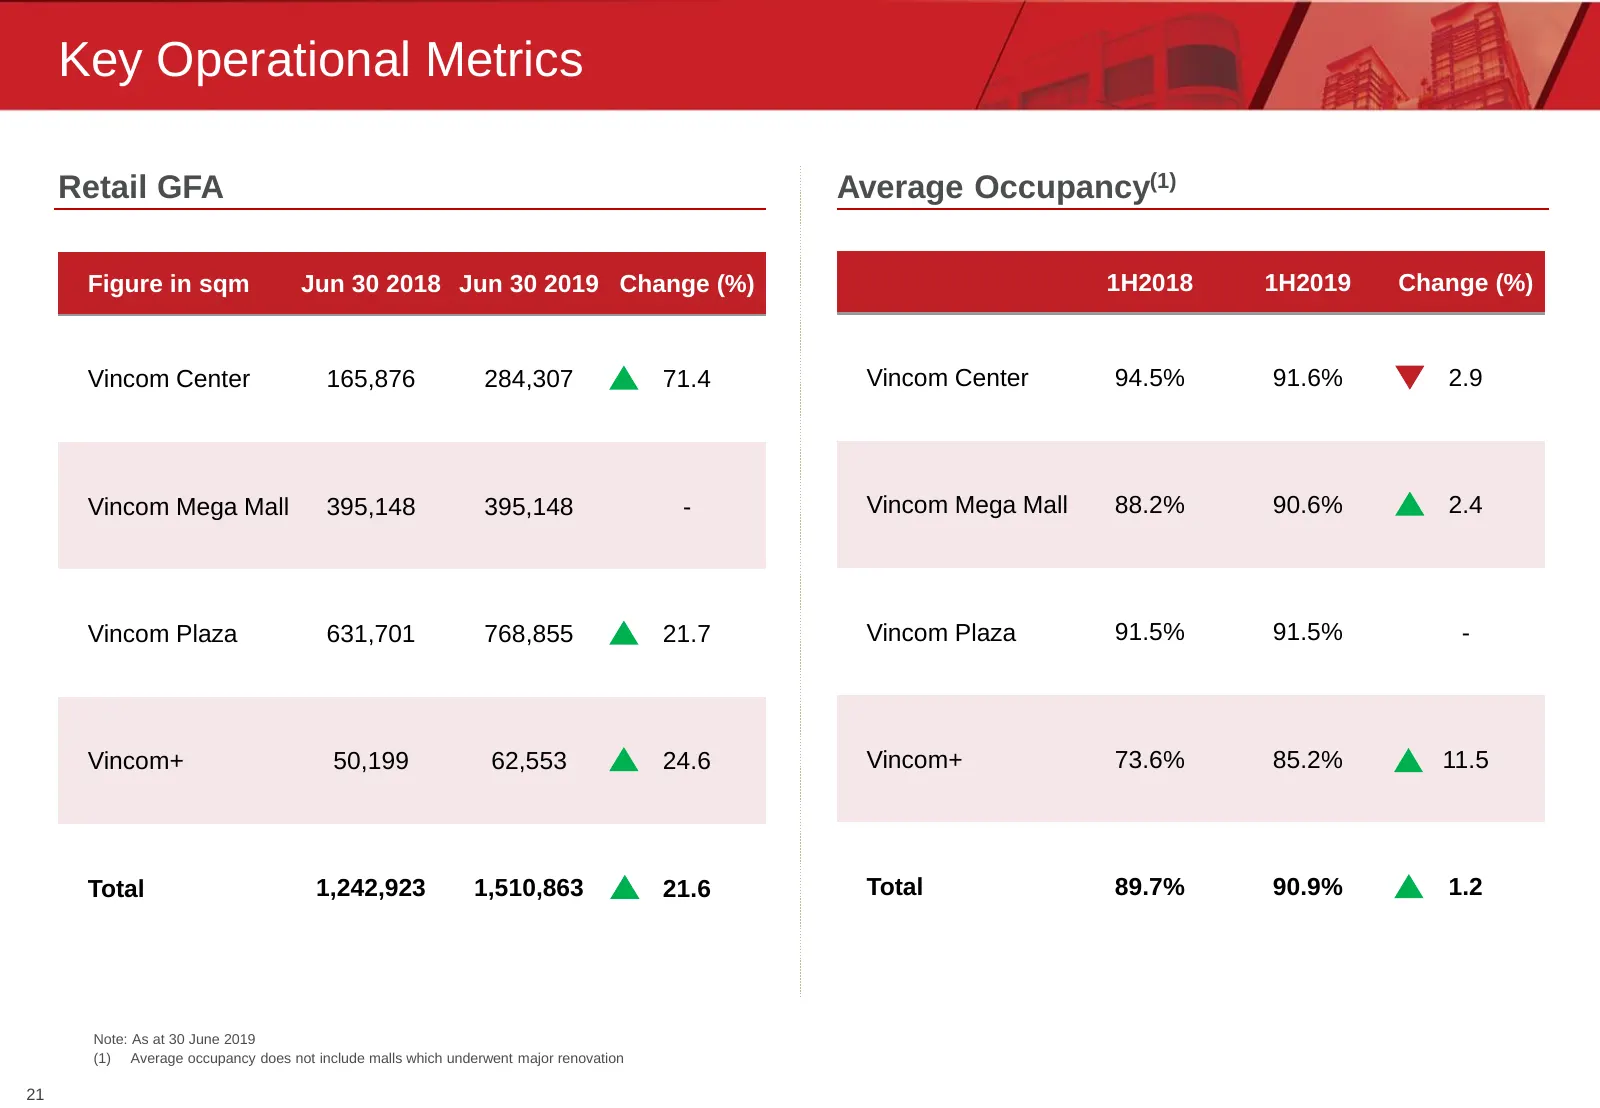
Key Operational Metrics Retail GFA Average Occupancy(1) Figure in sqm Jun 30 2018 Jun 30 2019 Change (%) 1H2018 1H2019 Change (%) Vincom Center 165,876 284,307 71.4 Vincom Center 94.5% 91.6% 2.9 Vincom Mega Mall 395,148 395,148 - Vincom Mega Mall 88.2% 90.6% 2.4 Vincom Plaza 631,701 768,855 21.7 Vin
Slide 23: 3Q2019 Plan
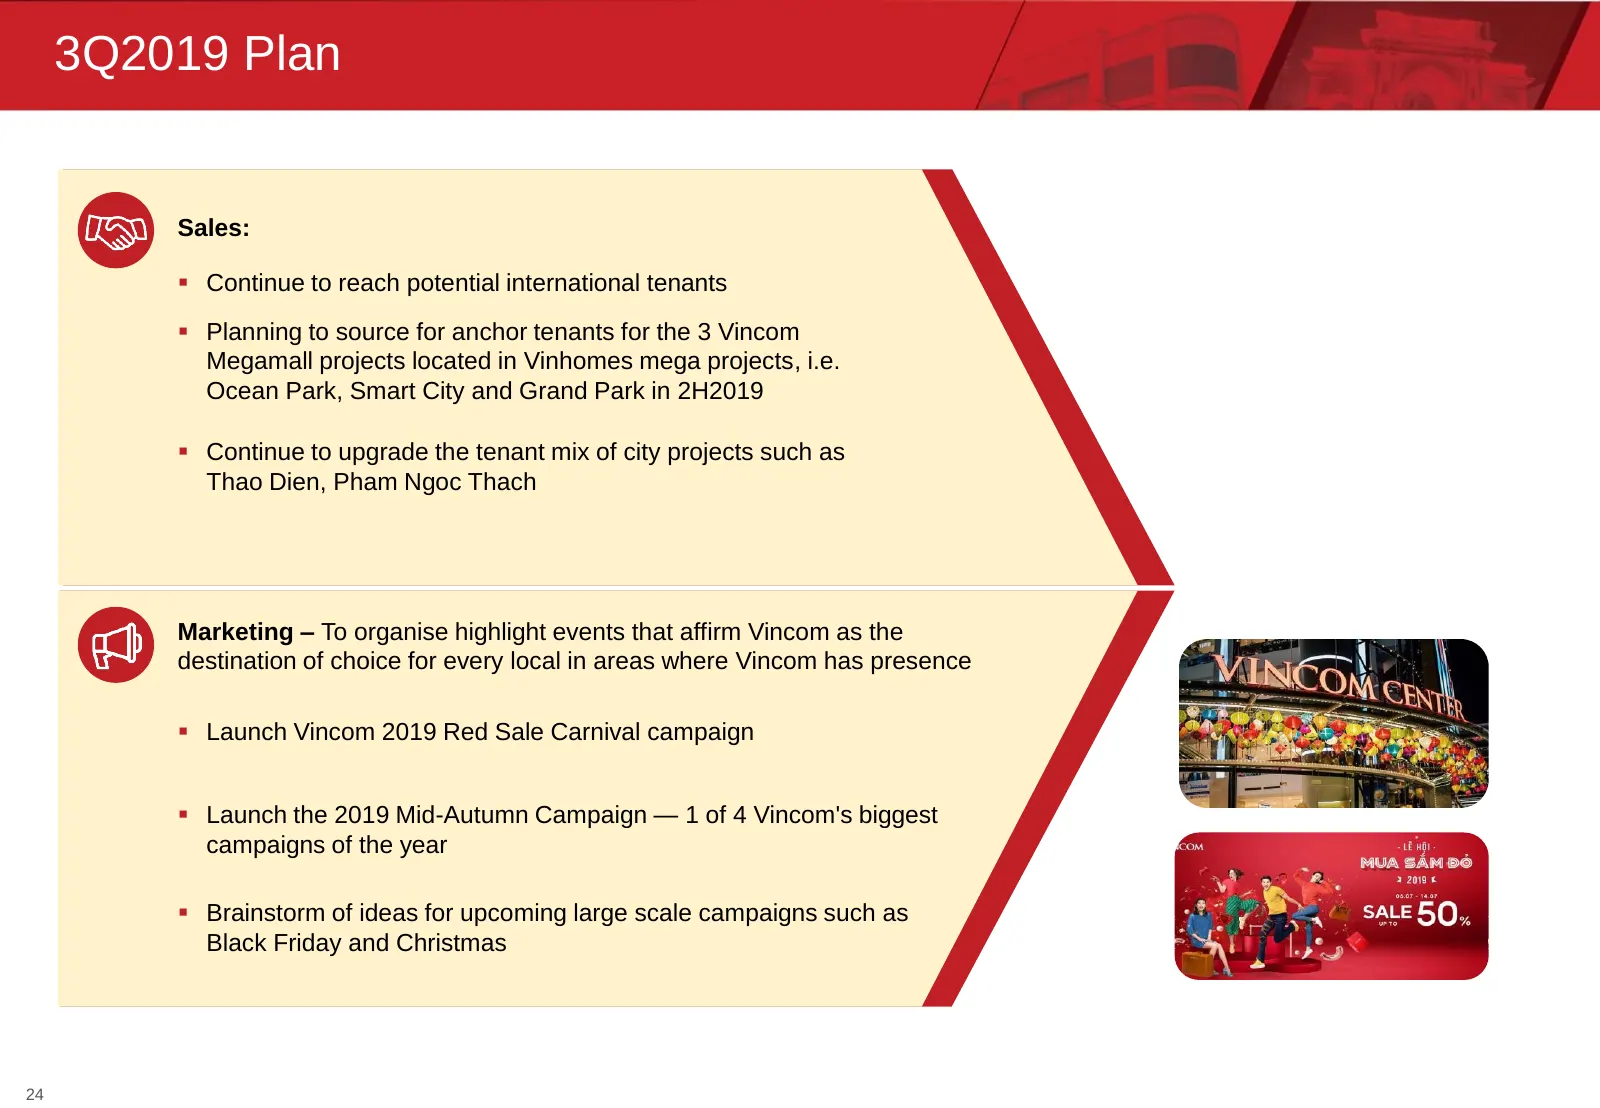
3Q2019 Plan Sales: Continue to reach potential international tenants Planning to source for anchor tenants for the 3 Vincom Megamall projects located in Vinhomes mega projects, i.e. Ocean Park, Smart City and Grand Park in 2H2019 Continue to upgrade the tenant mix of city projects such as Thao

Slide 24: Financial Highlights
Financial Highlights
Slide 25: 2Q2019 and 1H2019 Financial Performance
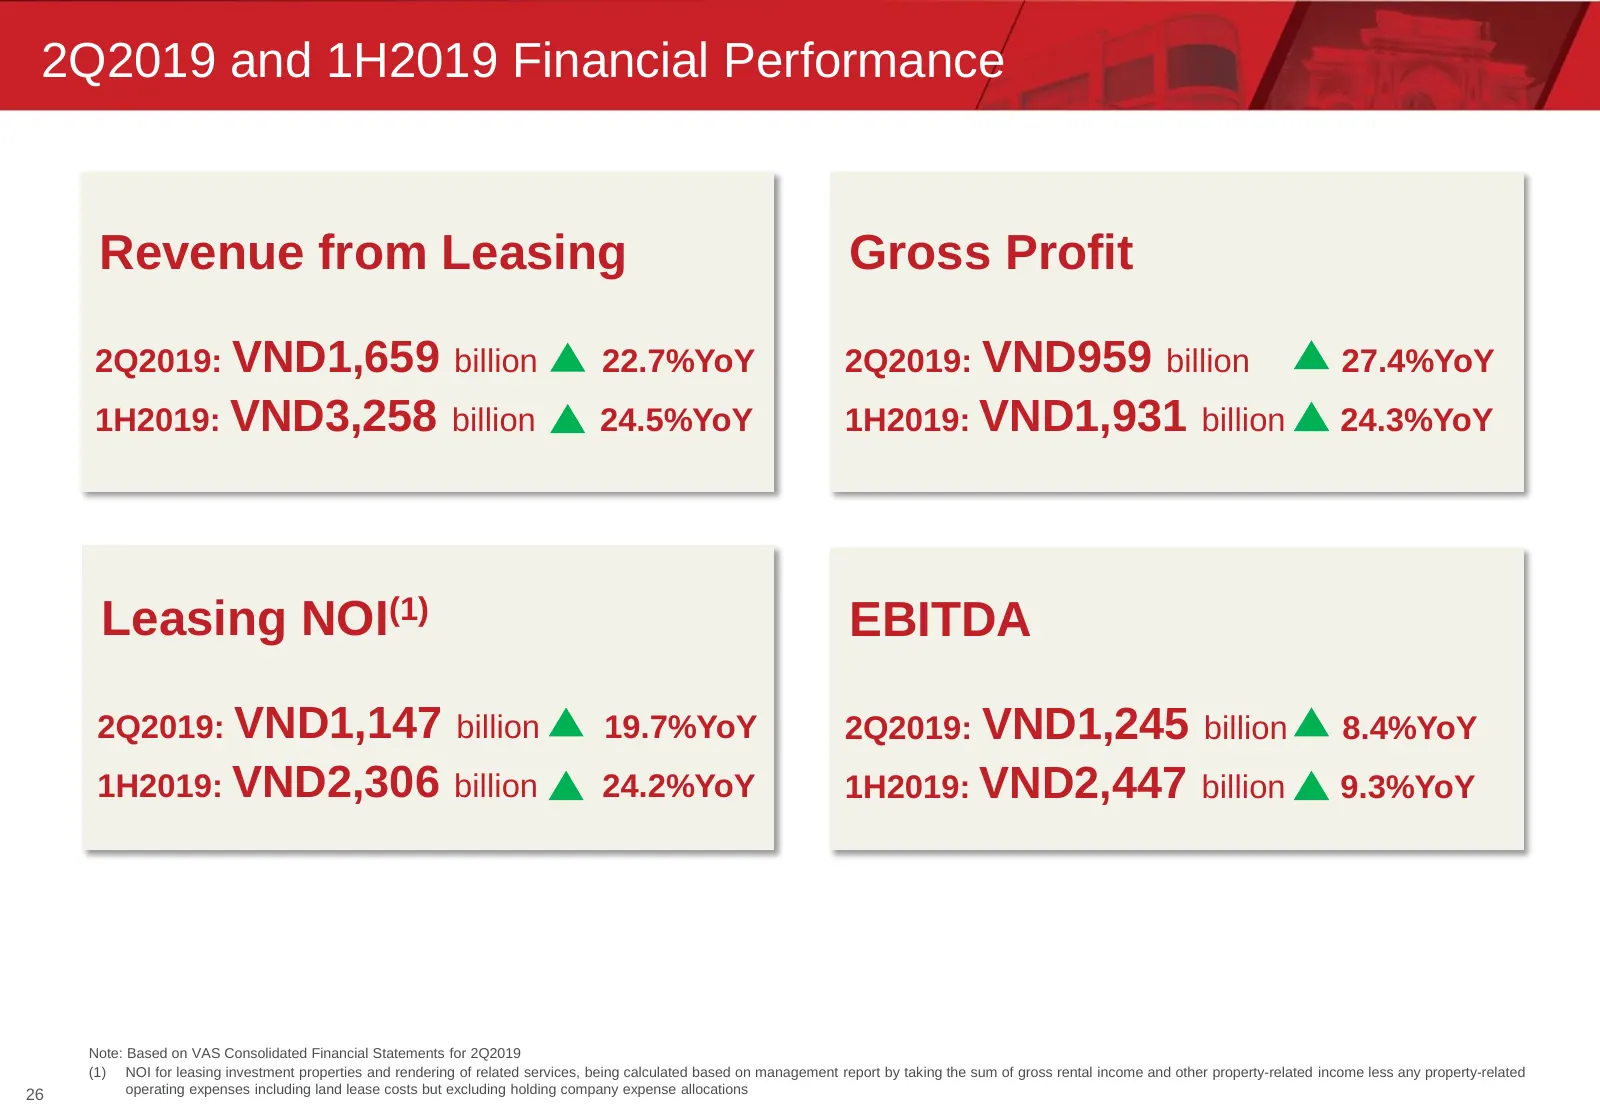
2Q2019 and 1H2019 Financial Performance Revenue from Leasing Gross Profit 2Q2019: VND1,659 billion 22.7%YoY 2Q2019: VND959 billion 27.4%YoY 1H2019: VND3,258 billion 24.5%YoY 1H2019: VND1,931 billion 24.3%YoY Leasing NOI(1) EBITDA 2Q2019: VND1,147 billion 19.7%YoY 2Q2019: VND1,245 billion 8.4%YoY 1H2
Slide 26: Financial Performance
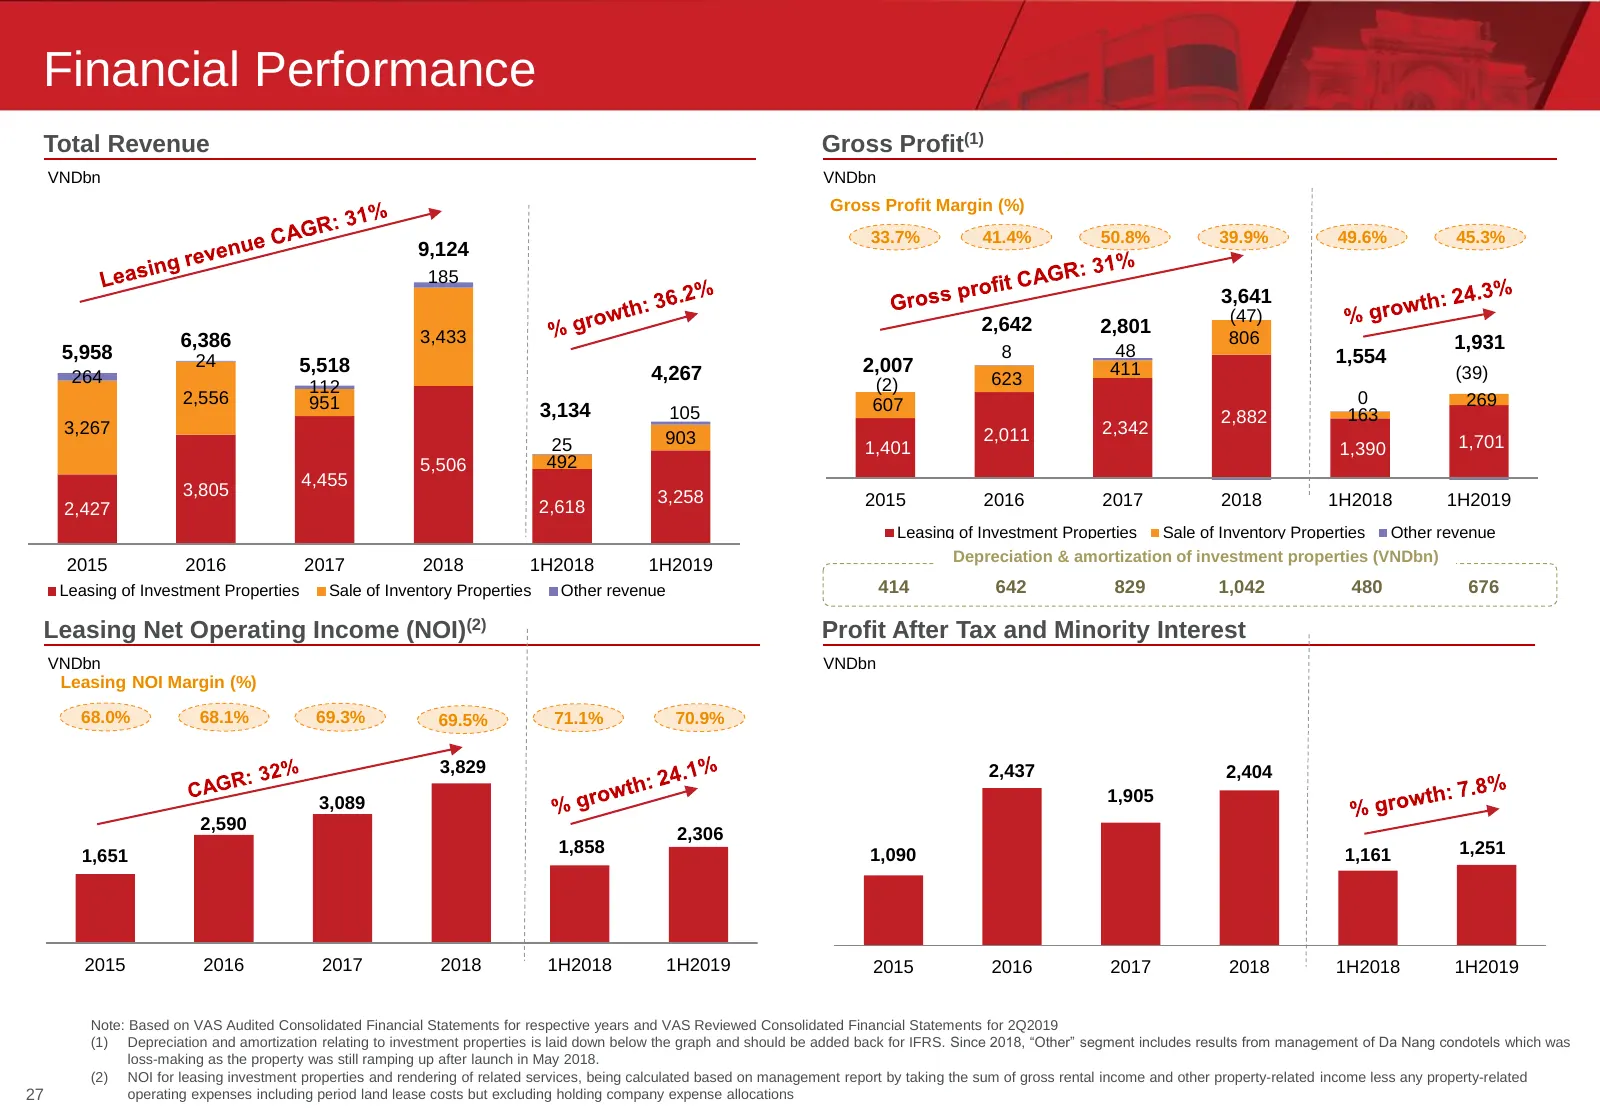
Financial Performance Total Revenue Gross Profit(1) VNDbn VNDbn Gross Profit Margin (%) 33.7% 41.4% 50.8% 39.9% 49.6% 45.3% 9,124 185 3,641 (47) 2,642 2,801 6,386 3,433 806 1,931 5,958 8 48 1,554 24 5,518 2,007 411 264 4,267 623 (39) 112 (2) 2,556 951 607 0 269 3,134 105 2,882 163 3,267 2,011 2,342
Slide 27: Balance Sheet
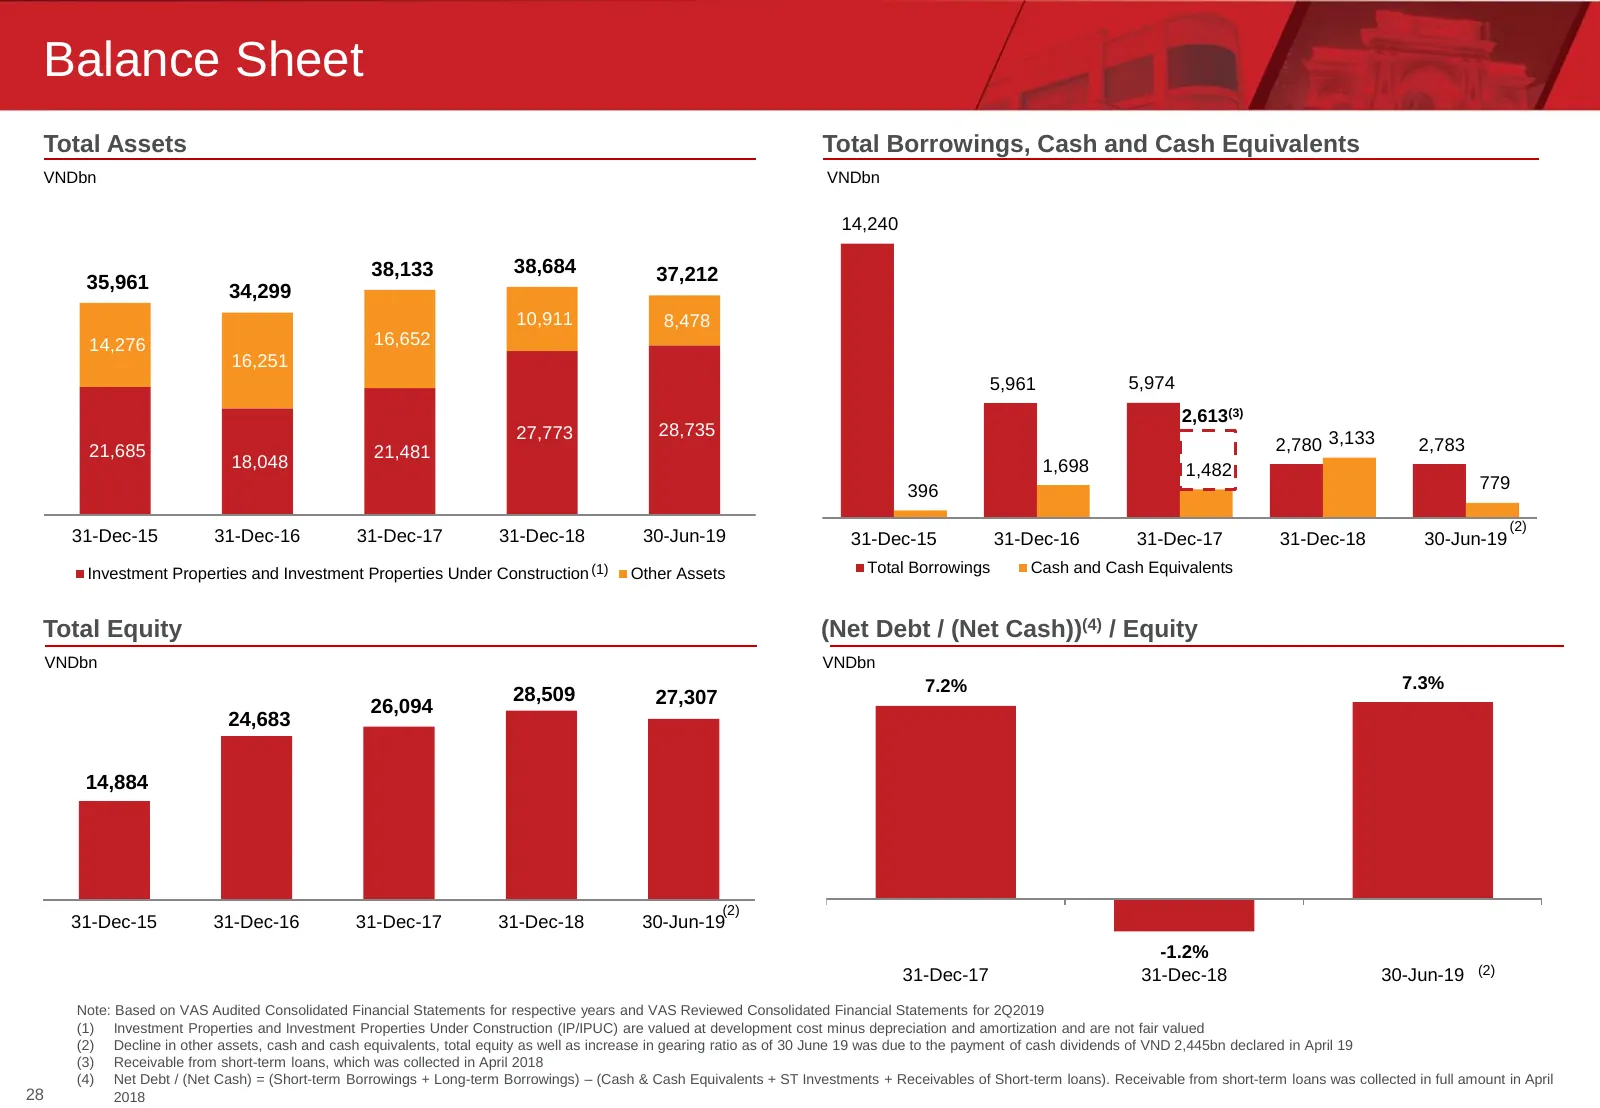
Balance Sheet Total Assets Total Borrowings, Cash and Cash Equivalents VNDbn VNDbn 14,240 38,133 38,684 37,212 35,961 34,299 10,911 8,478 14,276 16,652 16,251 5,961 5,974 2,613(3) 27,773 28,735 21,685 21,481 2,780 3,133 2,783 18,048 1,698 1,482 396 779 (2) 31-Dec-15 31-Dec-16 31-Dec-17 31-Dec-18 30-
Slide 28: Financial Performance in 2Q 2019 vs. 2Q 2018
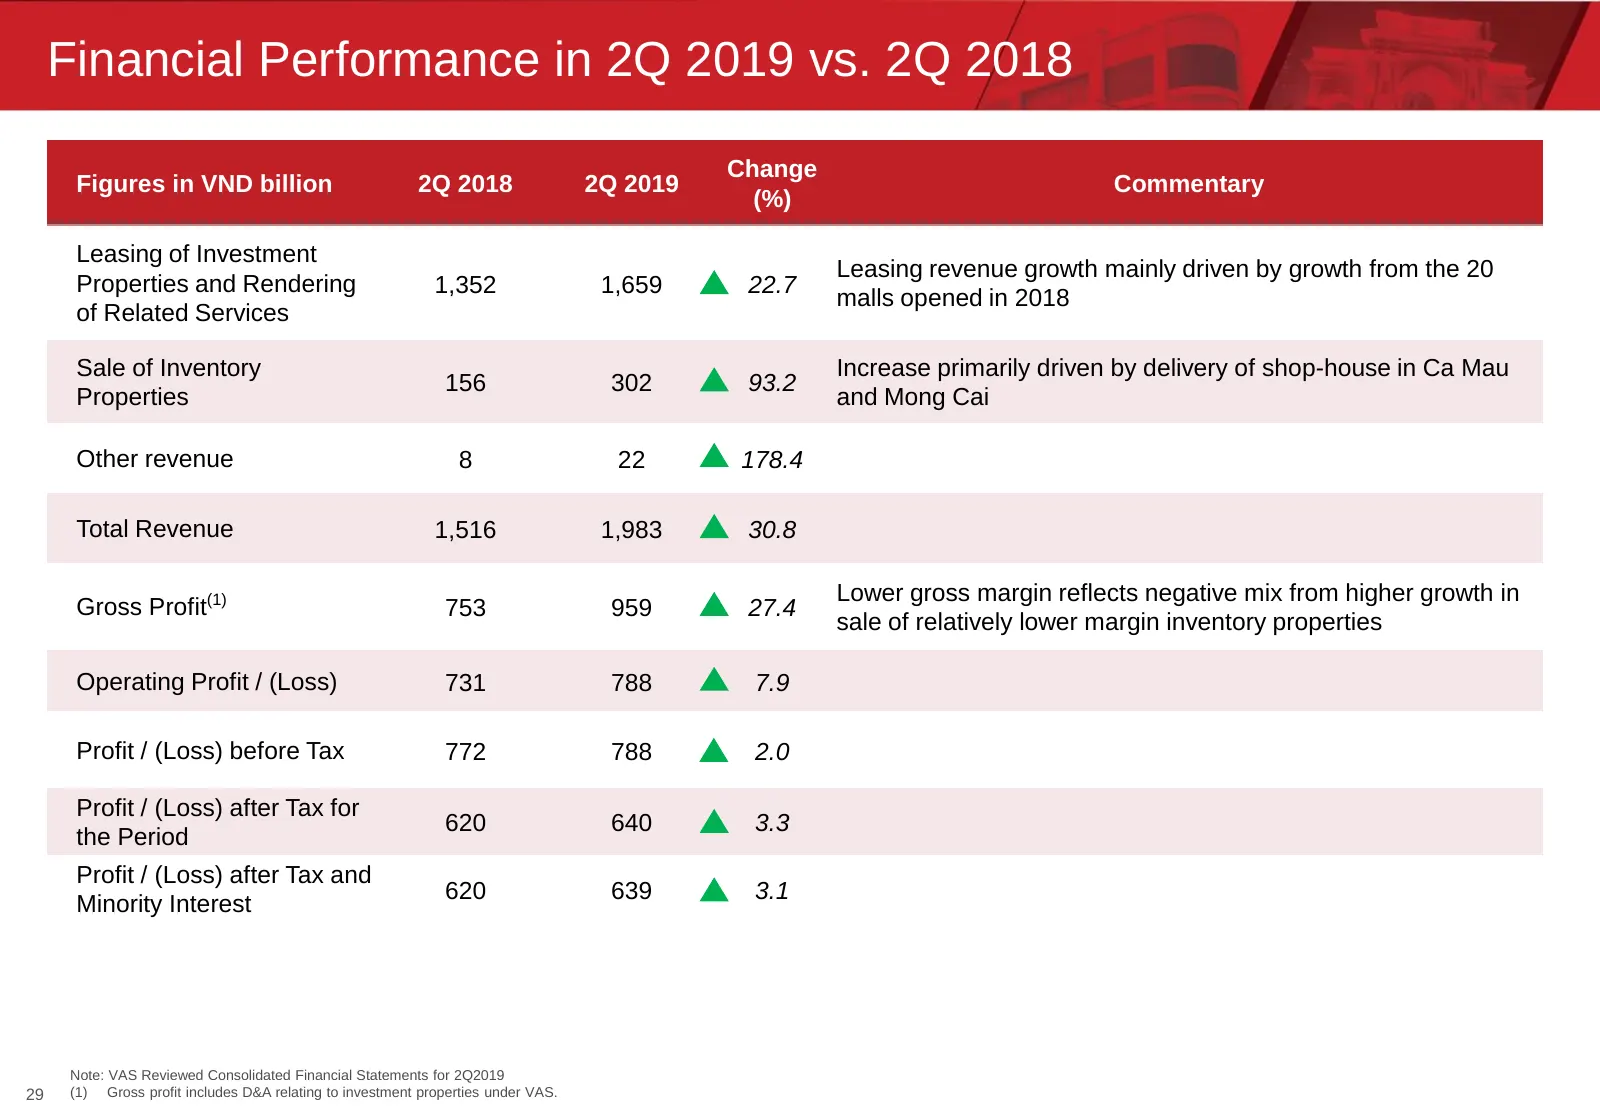
Financial Performance in 2Q 2019 vs. 2Q 2018 Change Figures in VND billion 2Q 2018 2Q 2019 Commentary (%) Leasing of Investment Leasing revenue growth mainly driven by growth from the 20 Properties and Rendering 1,352 1,659 22.7 malls opened in 2018 of Related Services Sale of Inventory Increase pri
Slide 29: Financial Performance in 1H 2019 vs. 1H 2018
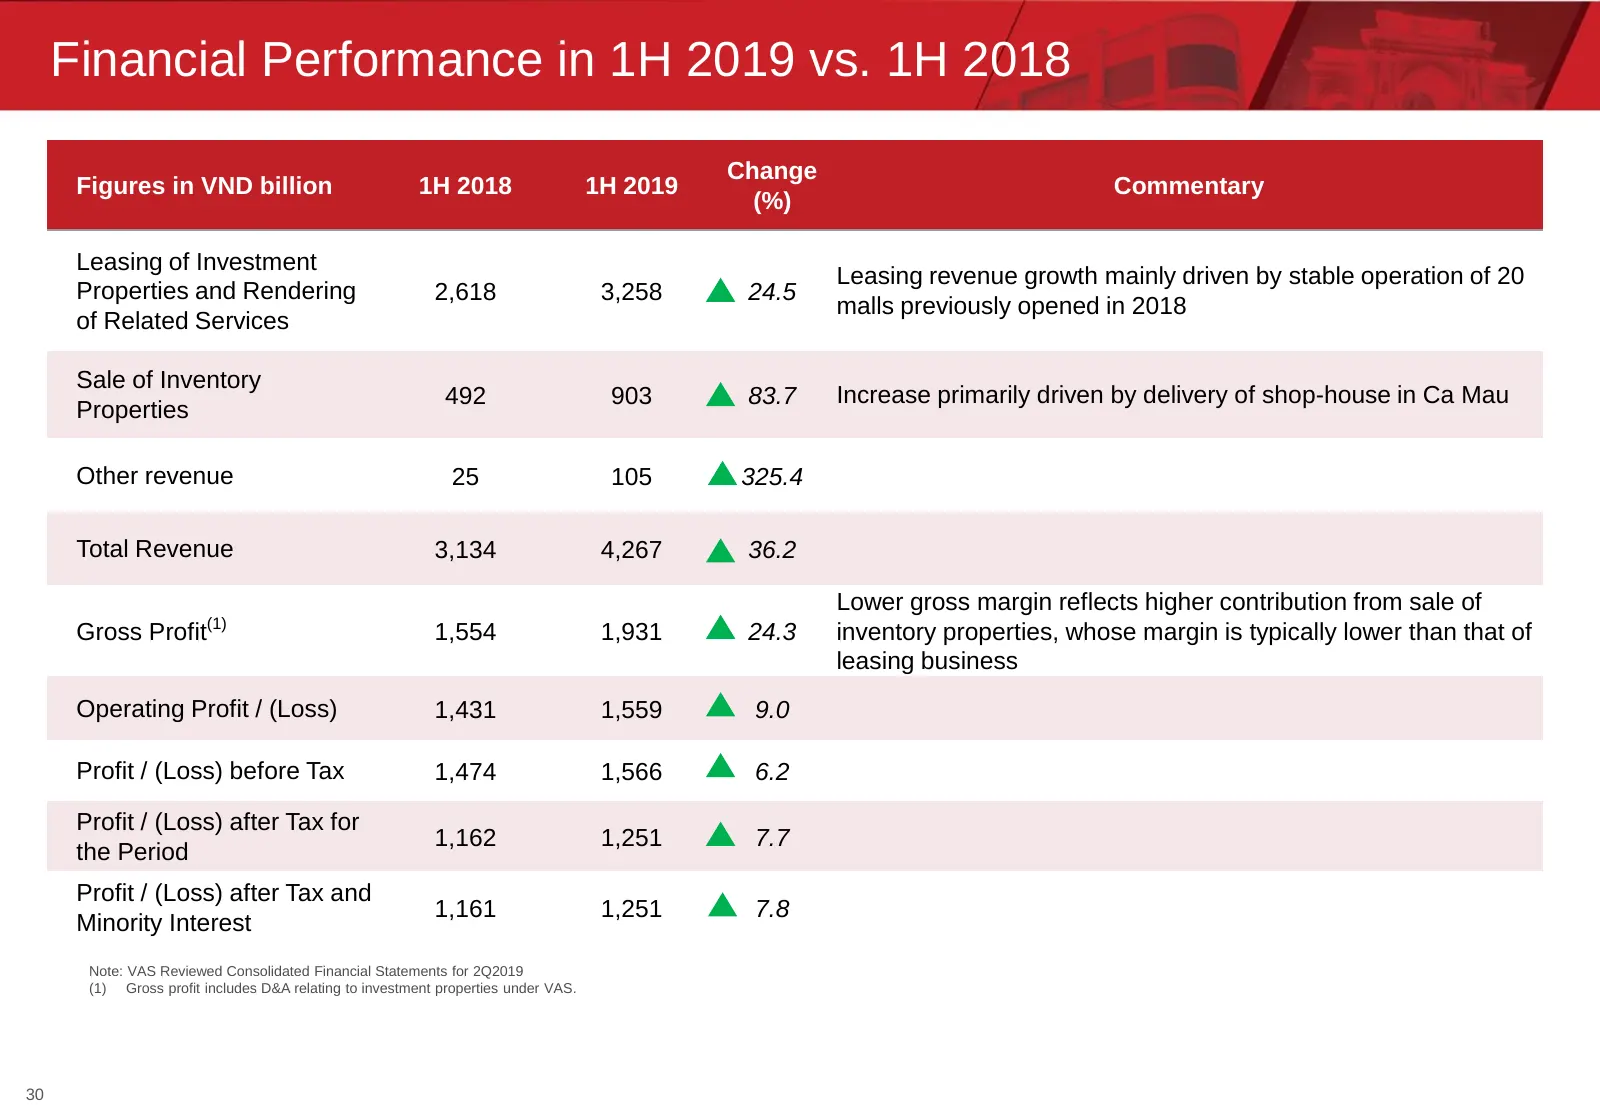
Financial Performance in 1H 2019 vs. 1H 2018 Change Figures in VND billion 1H 2018 1H 2019 Commentary (%) Leasing of Investment Leasing revenue growth mainly driven by stable operation of 20 Properties and Rendering 2,618 3,258 24.5 malls previously opened in 2018 of Related Services Sale of Invento
Slide 30: Appendix
Appendix
Slide 31: Bridging VAS to IFRS – 1H2019
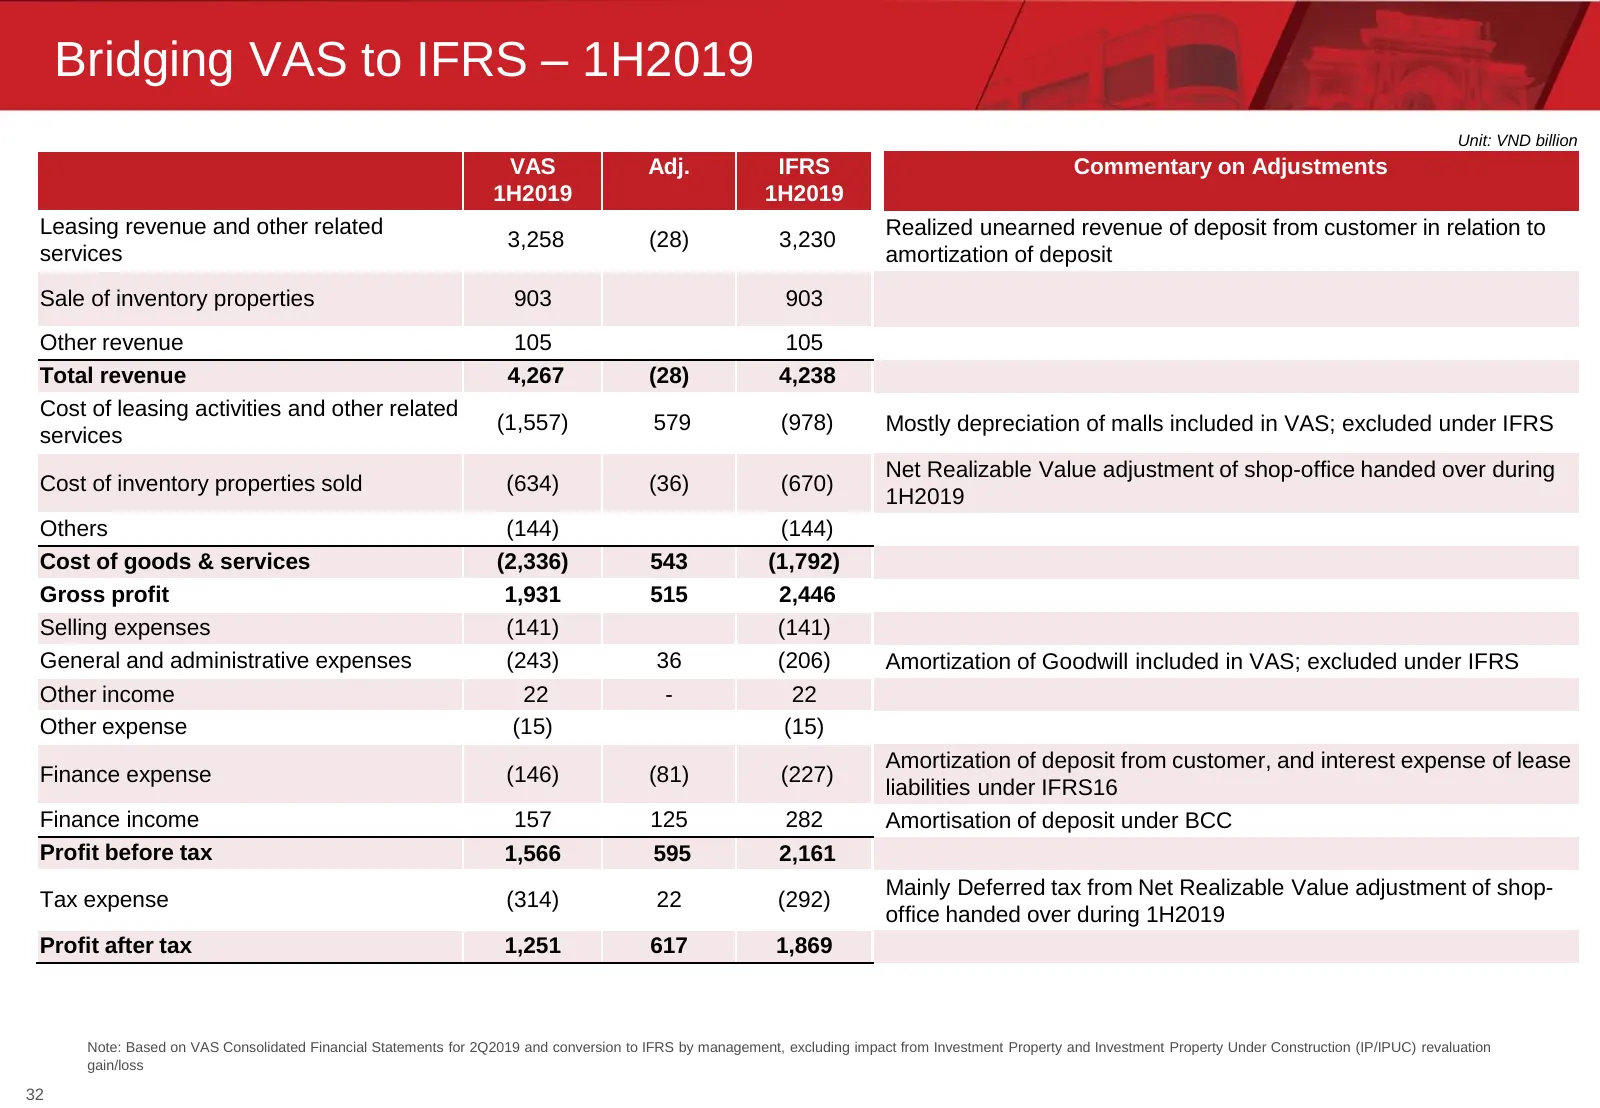
Bridging VAS to IFRS – 1H2019 Unit: VND billion VAS Adj. IFRS Commentary on Adjustments 1H2019 1H2019 Leasing revenue and other related Realized unearned revenue of deposit from customer in relation to 3,258 (28) 3,230 services amortization of deposit Sale of inventory properties 903 903 Other reven
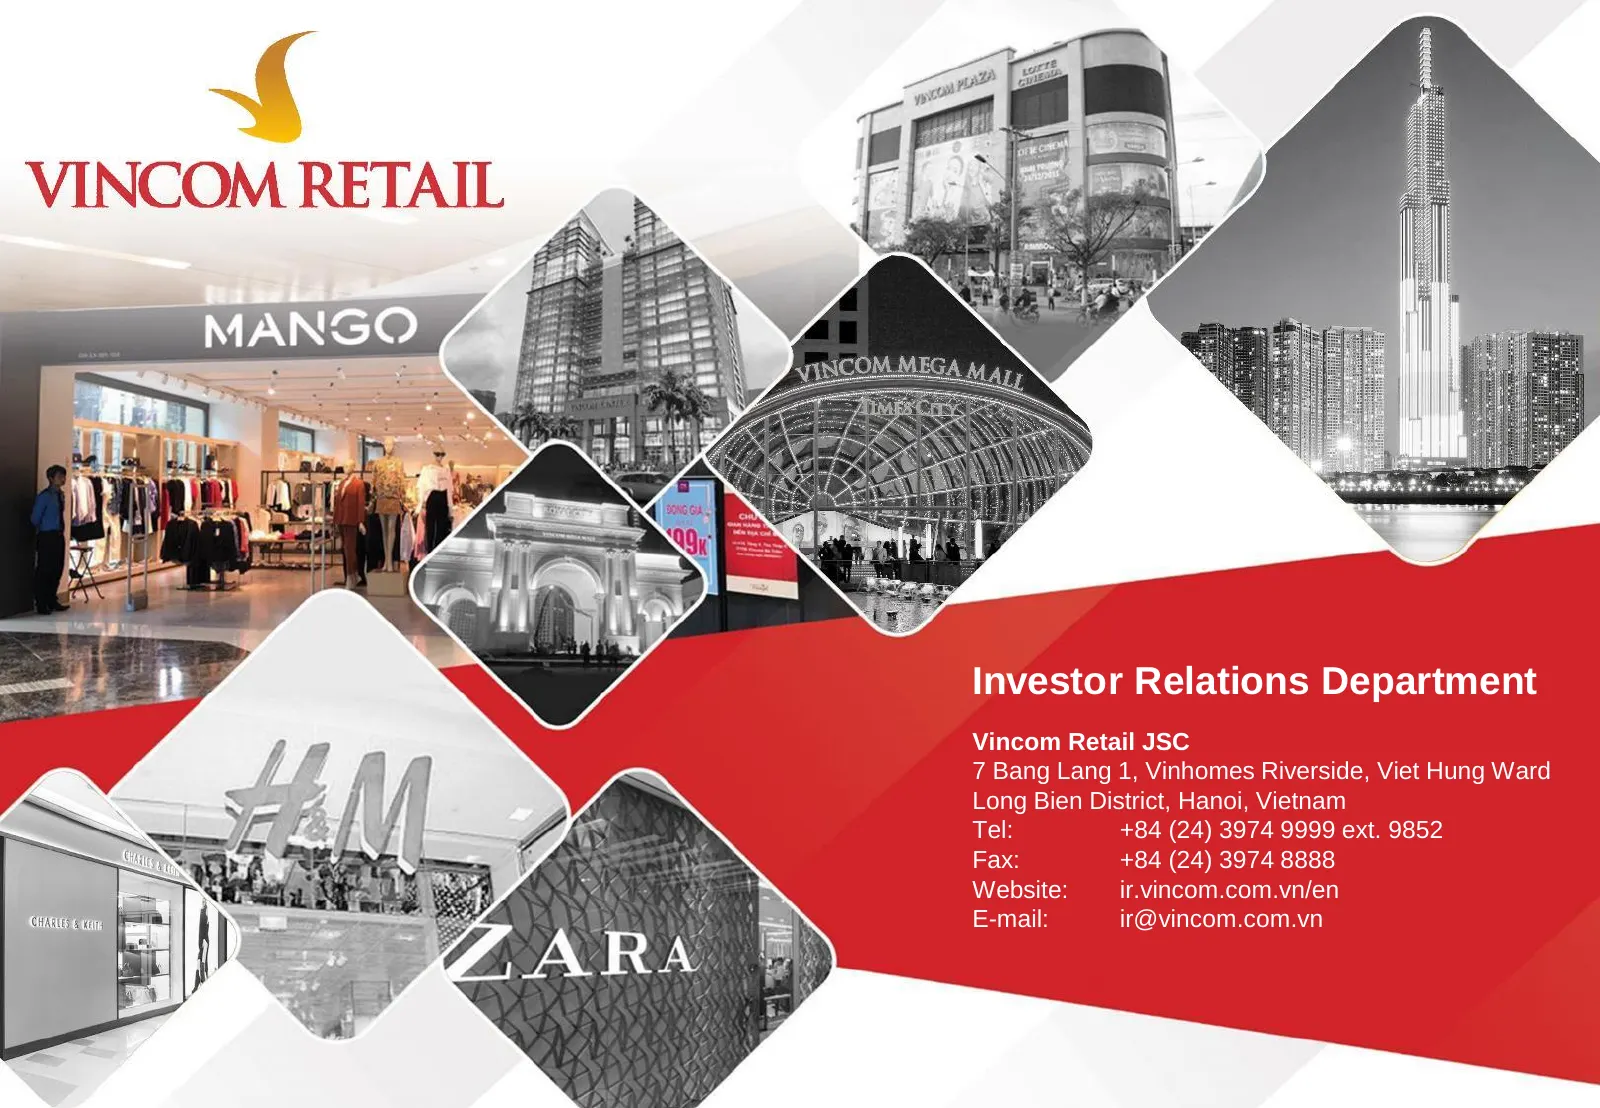
Slide 32: Investor Relations Department
Investor Relations Department Vincom Retail JSC 7 Bang Lang 1, Vinhomes Riverside, Viet Hung Ward Long Bien District, Hanoi, Vietnam Tel: +84 (24) 3974 9999 ext. 9852 Fax: +84 (24) 3974 8888 Website: ir.vincom.com.vn/en E-mail: ir@vincom.com.vn
Source: Internet Archive copy of ir.vincom.com.vn
More decks from Vincom Retail JSC
 Q3 2026 Earnings Presentation17 slides · Oct 29, 2026
 Investor Presentation (June 2026)25 slides · June 2026
 Q3 2025 Earnings Presentation16 slides · Oct 29, 2025
 Q2 2025 Earnings Presentation19 slides · Jul 29, 2025
 Investor Presentation (June 2025)22 slides · June 2025
 Q1 2025 Earnings Presentation20 slides · Apr 28, 2025