Vertex Energy — Q4 2020 Earnings Presentation
15 slides from Vertex Energy's earnings presentation, Mar 9, 2021
Slide 1: Fourth Quarter and Full-Year 2020 Results Conference Call
March 2021 Fourth Quarter and Full - Year 2020 Results Conference Call
Slide 2: Disclaimer
Disclaimer This document may contain forward - looking statements including words such as “may,” “can,” “could,” “should,” “predict,” “aim,” “potential,” “continue,” “opportunity,” “intend,” “goal,” “estimate,” “expect,” “expectations,” “project,” “projections,” “plans,” “anticipates,” “believe,” “t
Slide 3: Business Update
VERTEX. ENERGY Business Update
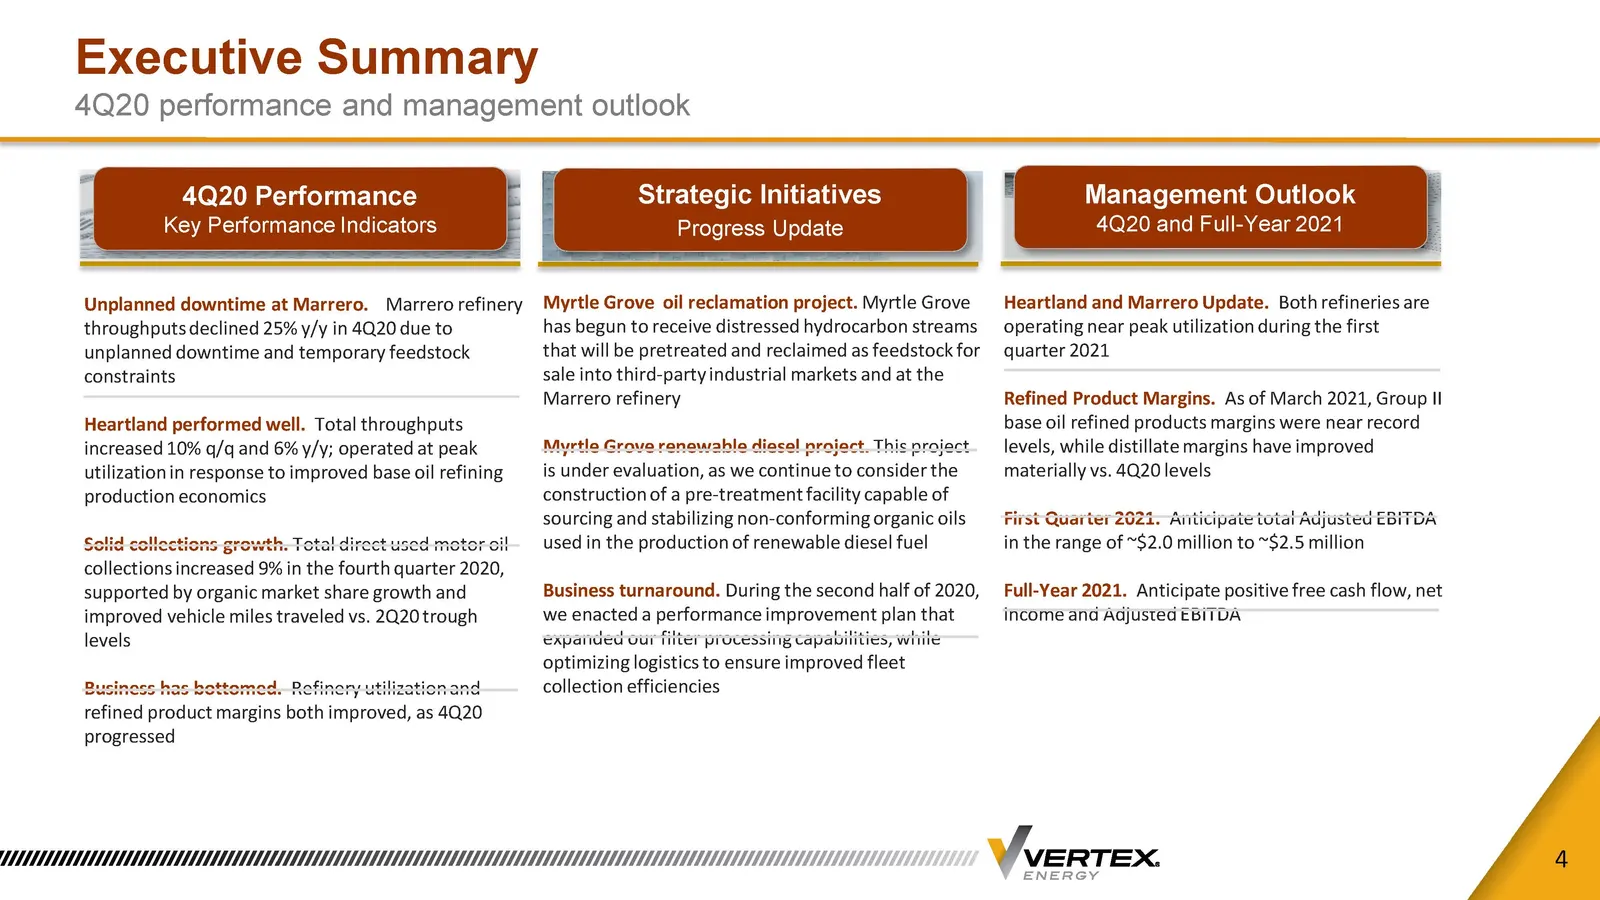
Slide 4: Executive Summary: 4Q20 performance and management outlook
Executive Summary 4Q20 performance and management outlook 4 4Q20 Performance Key Performance Indicators Strategic Initiatives Progress Update Management Outlook 4Q20 and Full - Year 2021 Heartland and Marrero Update. Both refineries are operating near peak utilization during the first quarter 2021 R
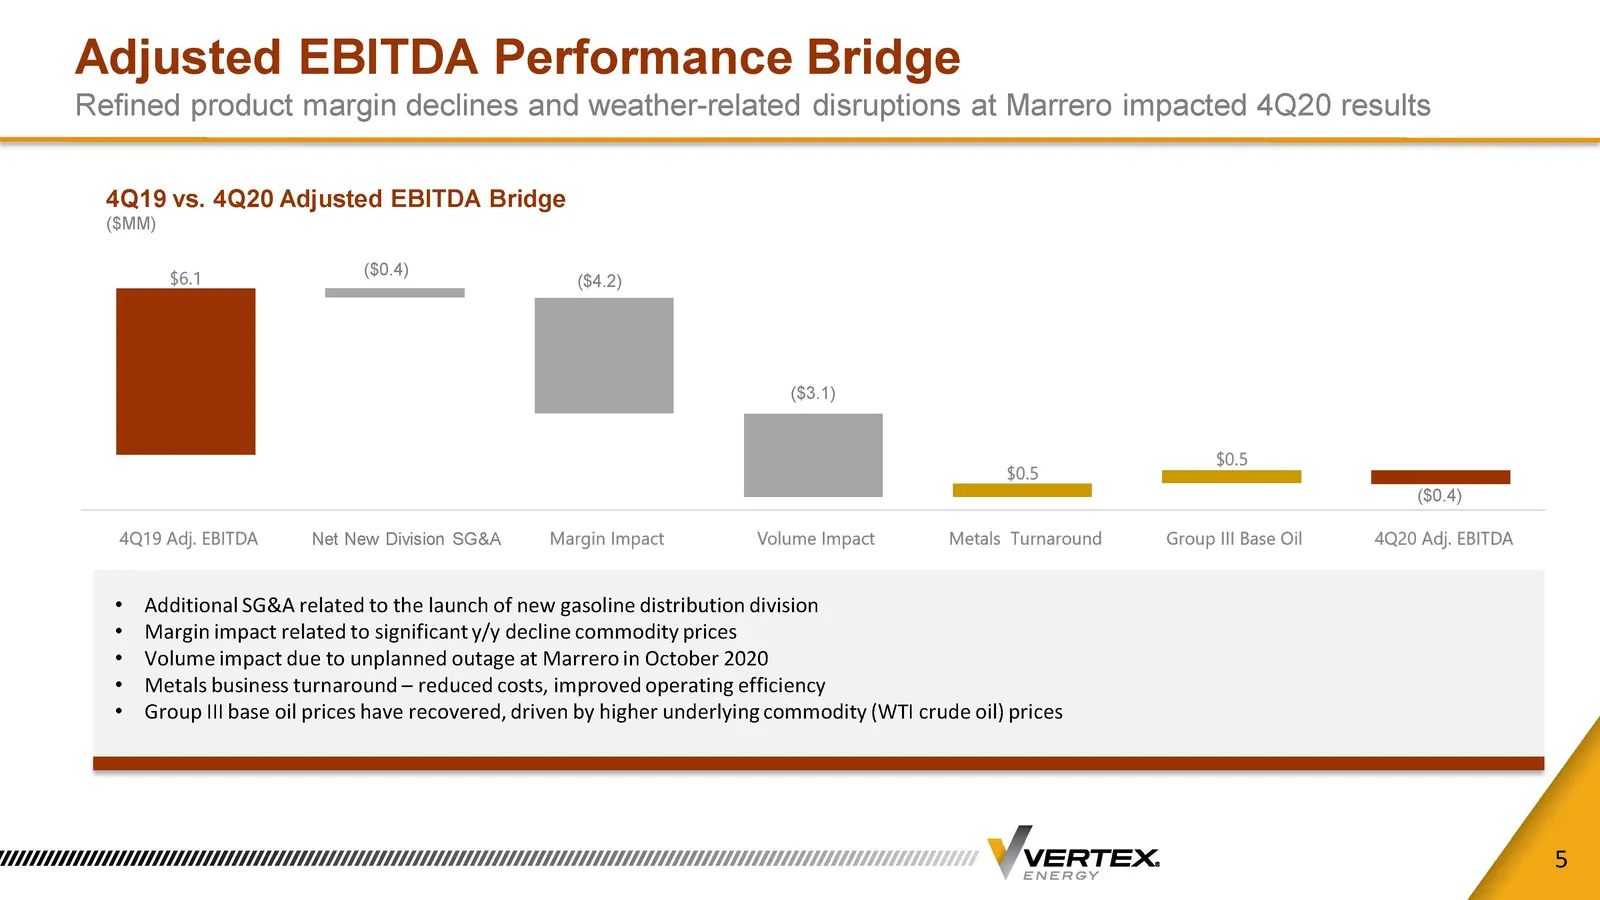
Slide 5: Adjusted EBITDA Performance Bridge
Adjusted EBITDA Performance Bridge Refined product margin declines and weather - related disruptions at Marrero impacted 4Q20 results 5 4Q19 vs. 4Q20 Adjusted EBITDA Bridge ($MM) • Additional SG&A related to the launch of new gasoline distribution division • Margin impact related to significant y/y
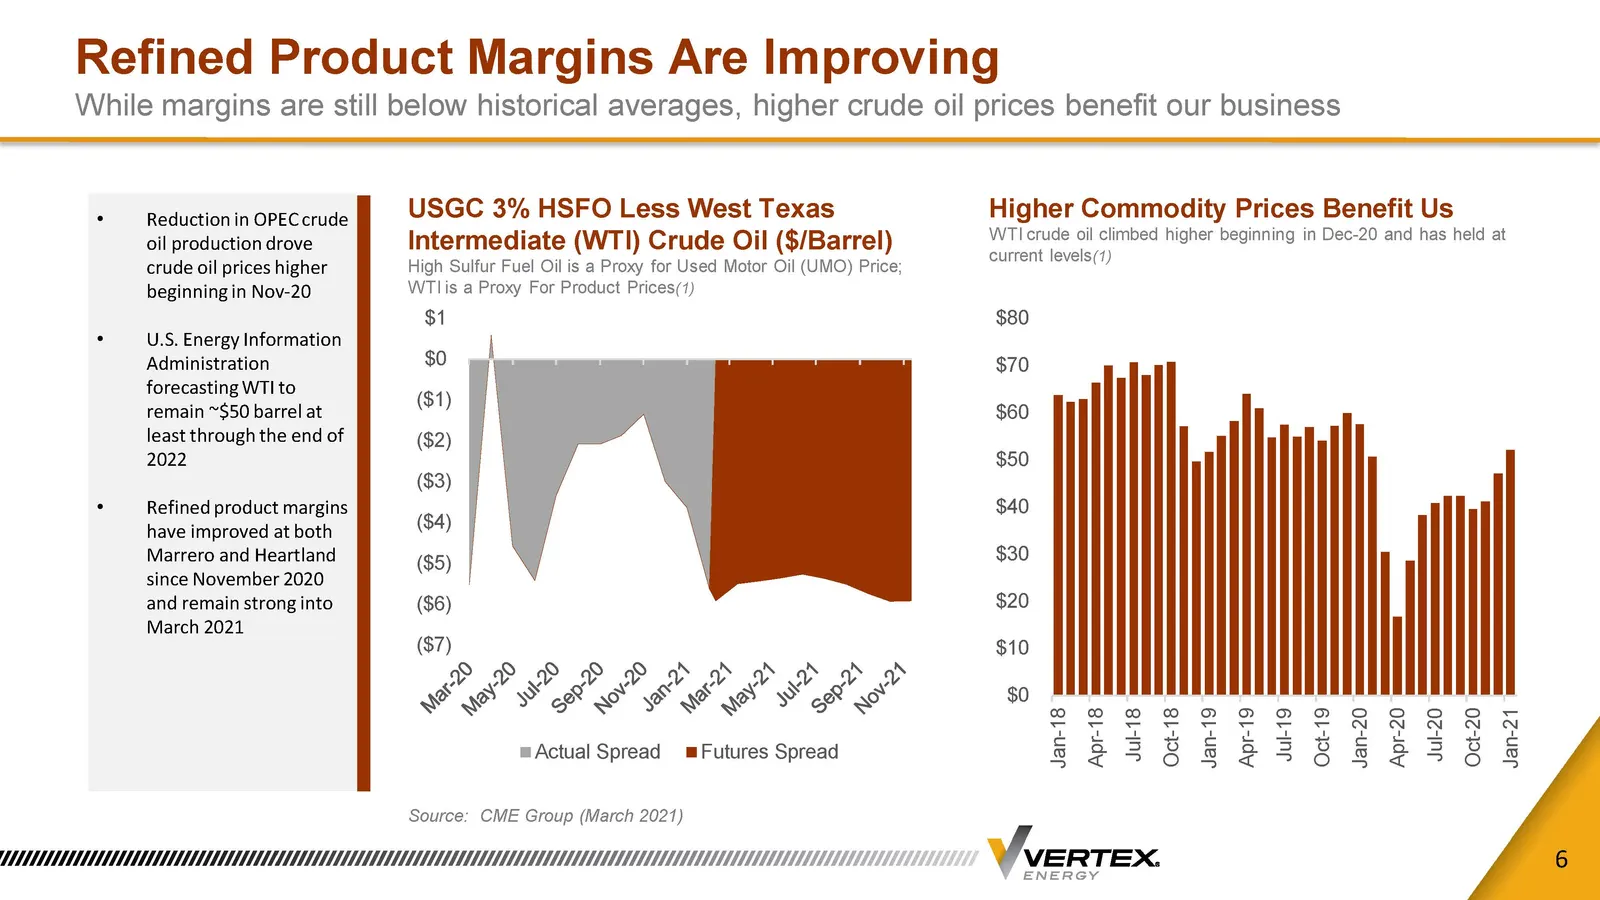
Slide 6: Refined Product Margins Are Improving
Refined Product Margins Are Improving While margins are still below historical averages, higher crude oil prices benefit our business 6 USGC 3% HSFO Less West Texas Intermediate (WTI) Crude Oil ($/Barrel) High Sulfur Fuel Oil is a Proxy for Used Motor Oil (UMO) Price; WTI is a Proxy For Product Pric
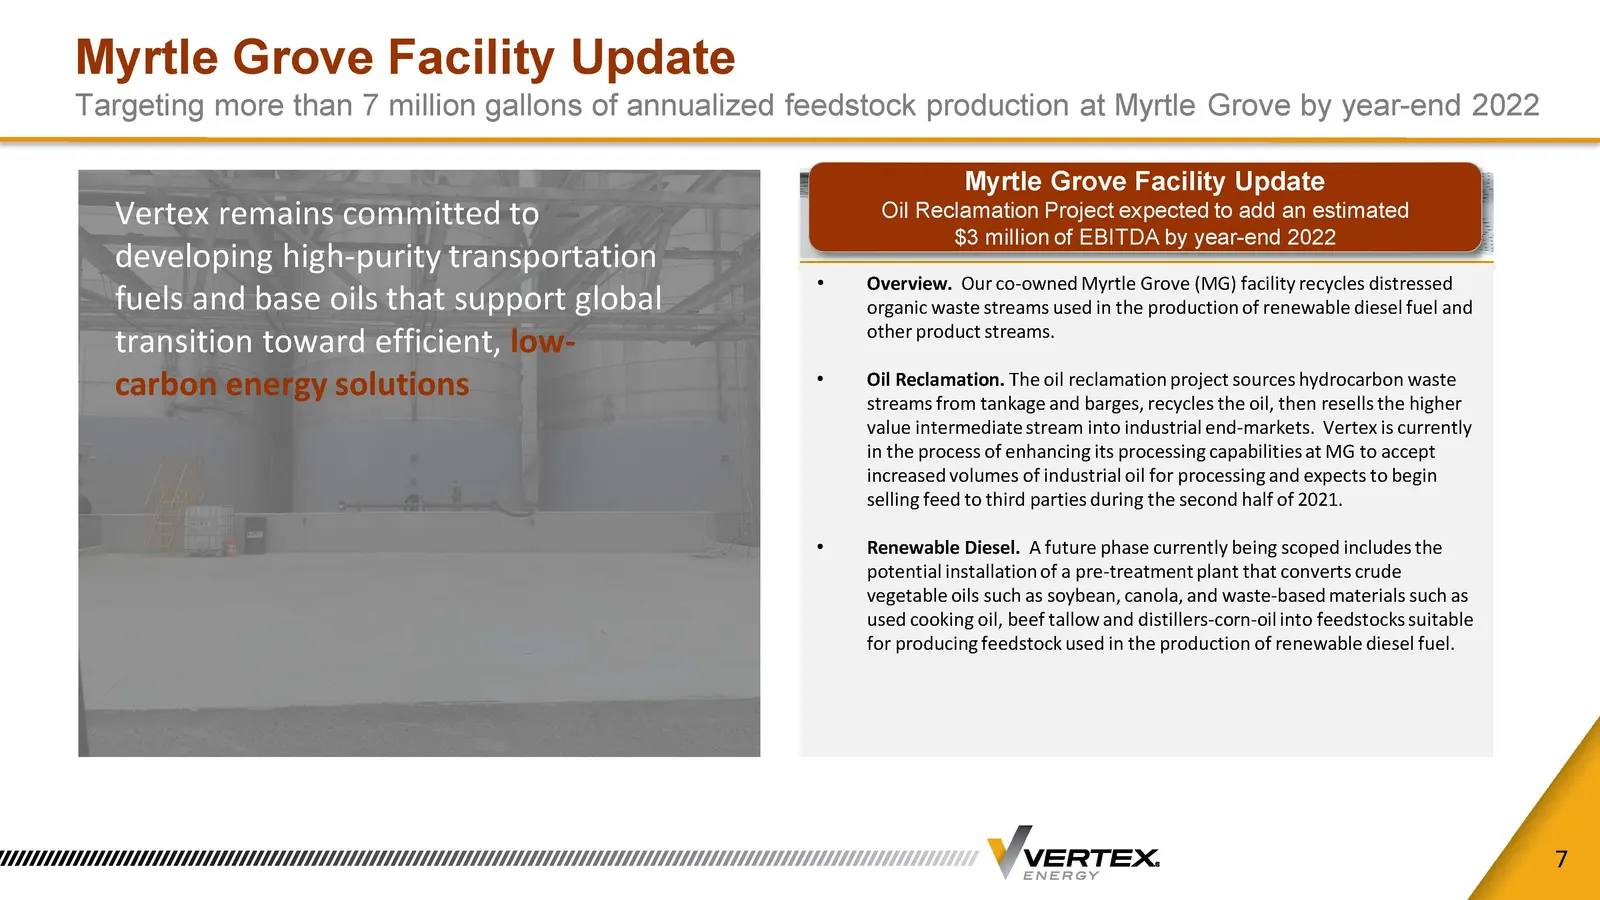
Slide 7: Myrtle Grove Facility Update
Myrtle Grove Facility Update Targeting more than 7 million gallons of annualized feedstock production at Myrtle Grove by year - end 2022 7 Vertex remains committed to developing high - purity transportation fuels and base oils that support global transition toward efficient, low - carbon energy solu
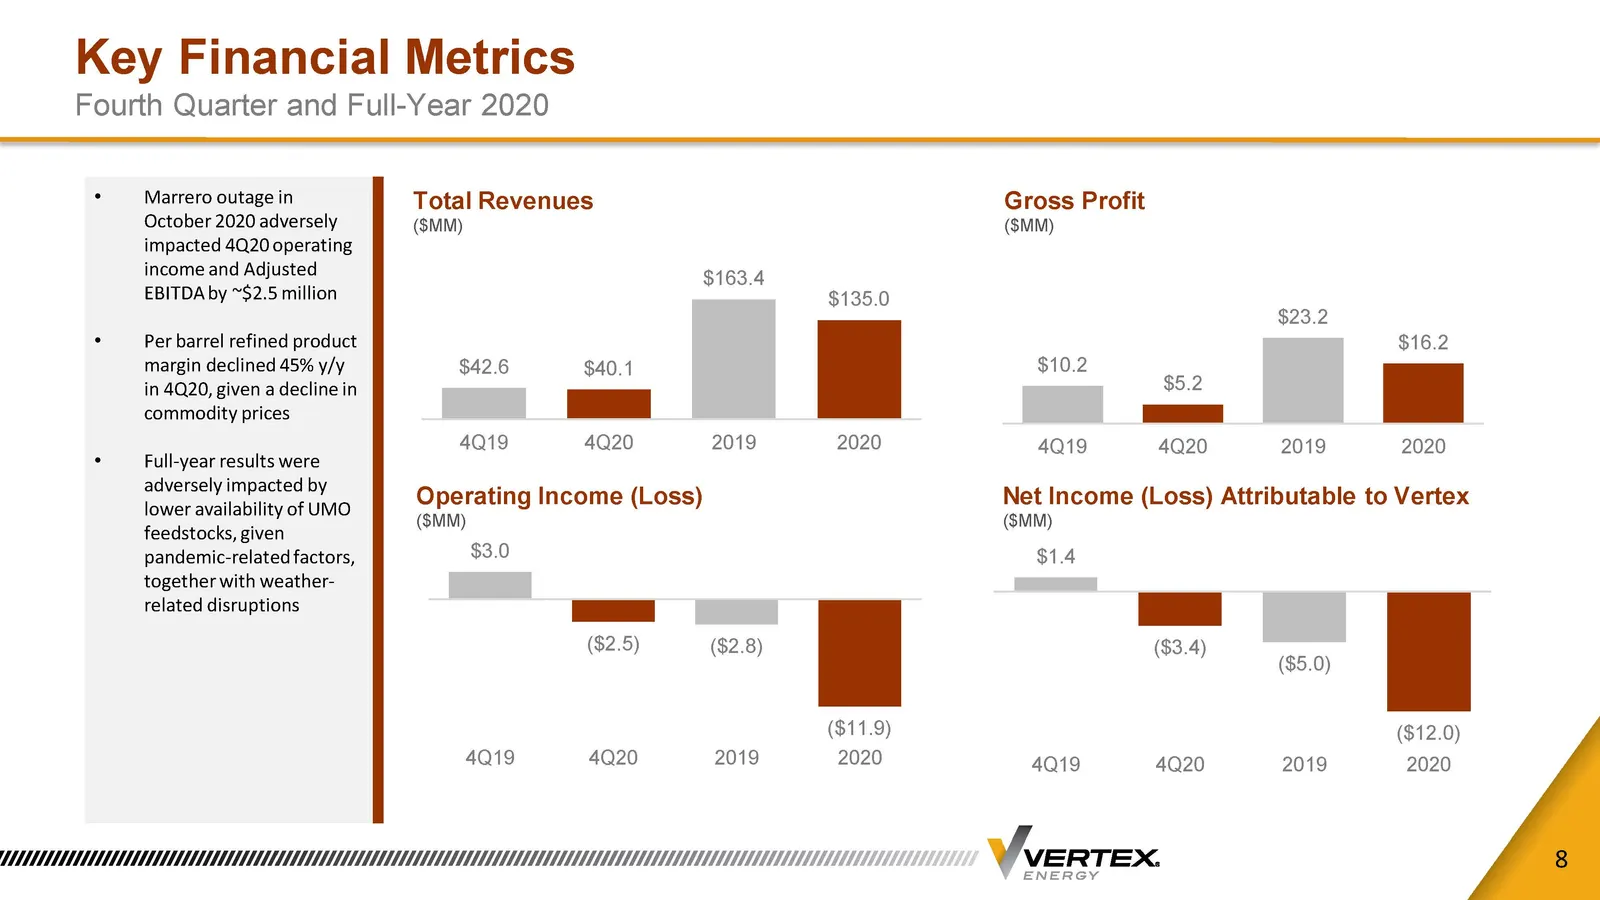
Slide 8: Key Financial Metrics Fourth Quarter and Full-Year 2020
Key Financial Metrics Fourth Quarter and Full - Year 2020 8 Total Revenues ($MM) Gross Profit ($MM) Operating Income (Loss) ($MM) Net Income (Loss) Attributable to Vertex ($MM) • Marrero outage in October 2020 adversely impacted 4Q20 operating income and Adjusted EBITDA by ~$2.5 million • Per barrel
Slide 9: UMO Collections Have Improved From 2Q20 Lows
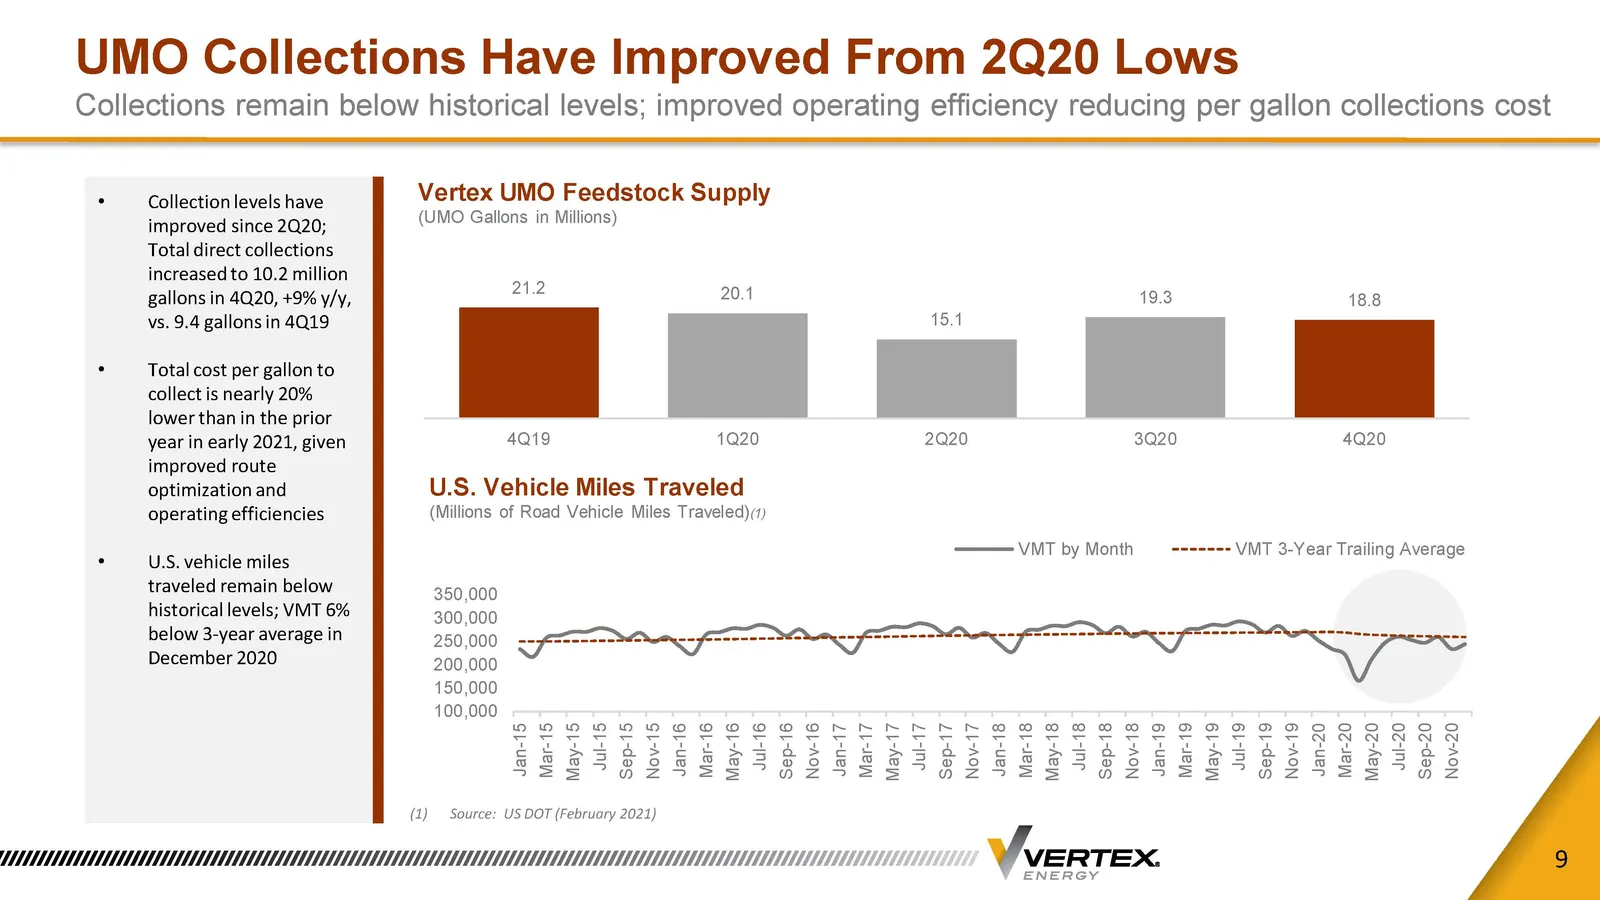
UMO Collections Have Improved From 2Q20 Lows Collections remain below historical levels; improved operating efficiency reducing per gallon collections cost 9 Vertex UMO Feedstock Supply (UMO Gallons in Millions) U.S. Vehicle Miles Traveled (Millions of Road Vehicle Miles Traveled) (1) (1) Source: US
Slide 10: Refinery Utilization Update
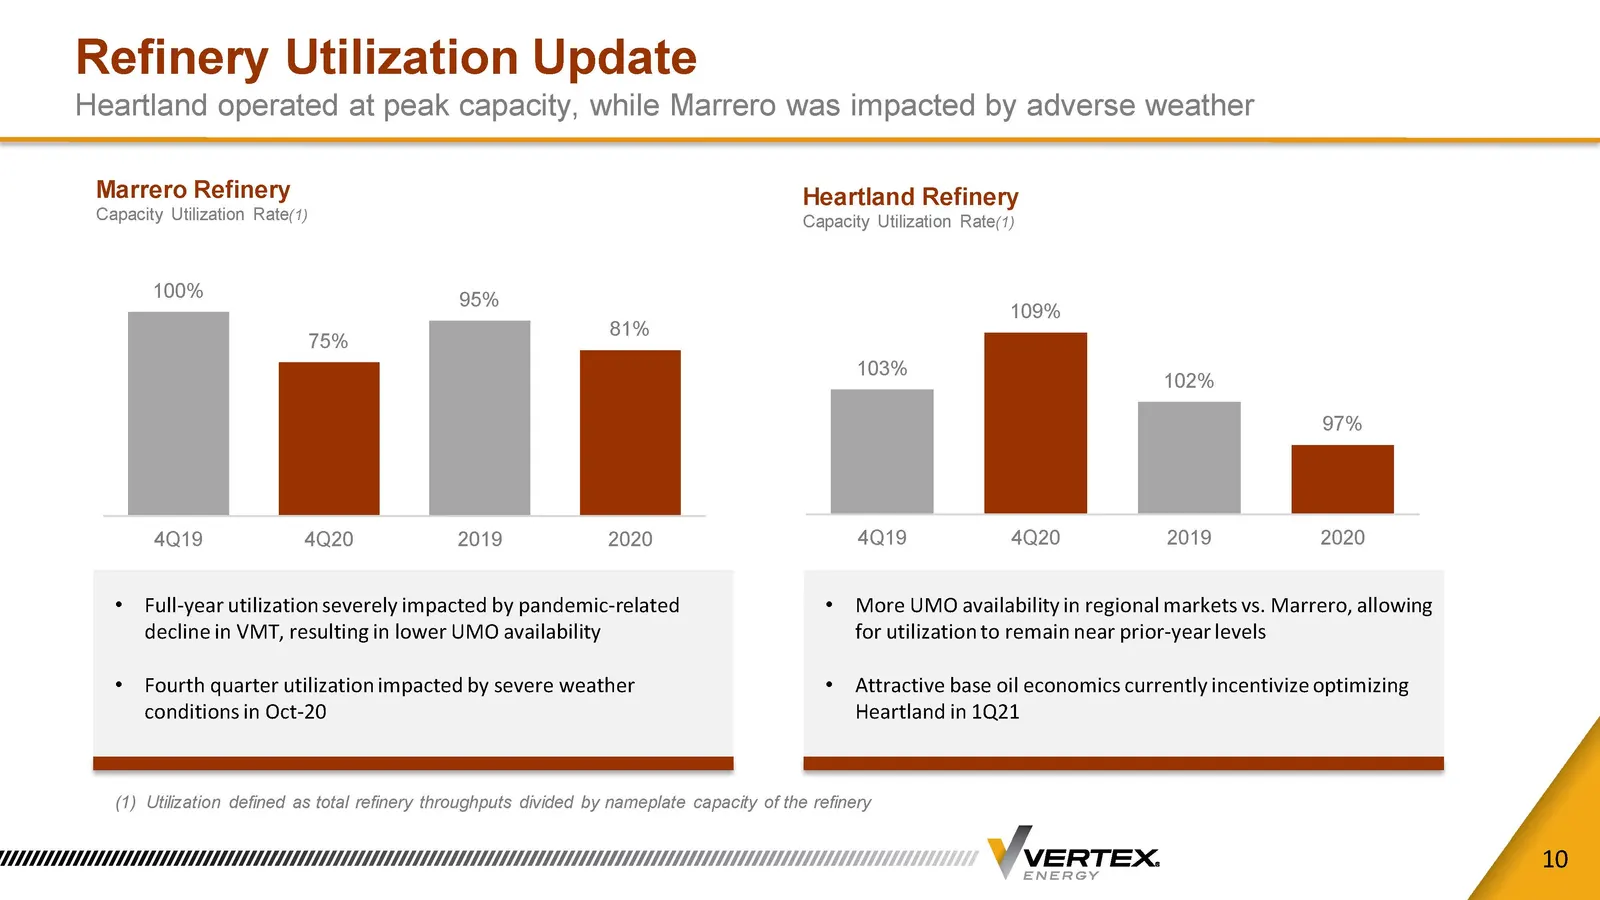
Refinery Utilization Update Heartland operated at peak capacity, while Marrero was impacted by adverse weather 10 (1) Utilization defined as total refinery throughputs divided by nameplate capacity of the refinery Marrero Refinery Capacity Utilization Rate (1) Heartland Refinery Capacity Utilization
Slide 11: Balance Sheet Update
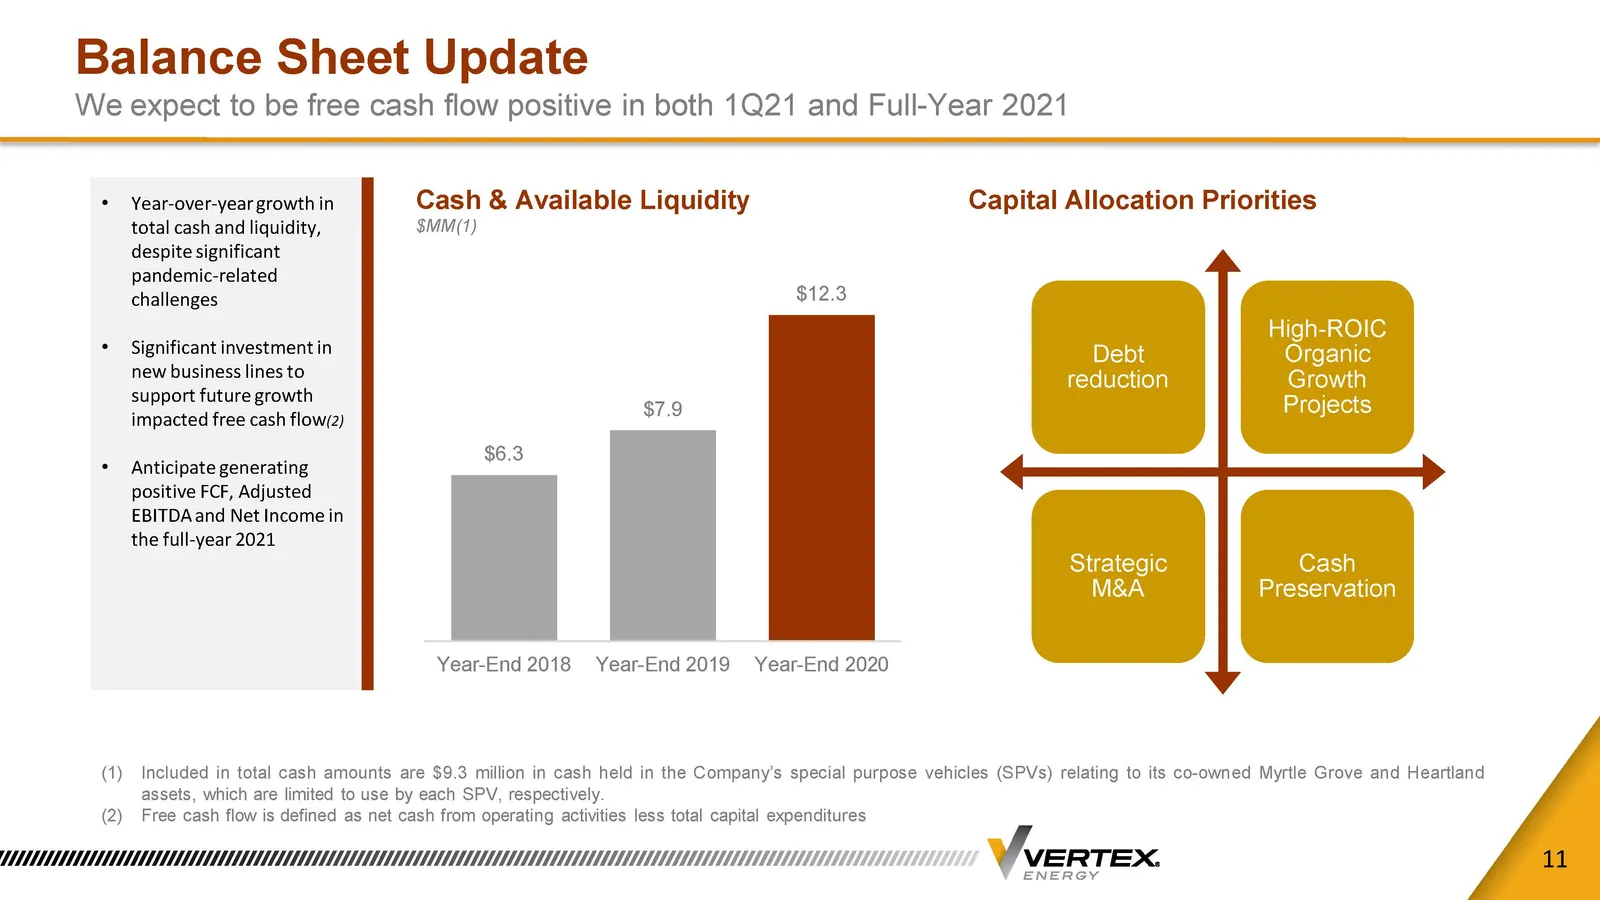
Balance Sheet Update We expect to be free cash flow positive in both 1Q21 and Full - Year 2021 11 (1) Included in total cash amounts are $ 9 . 3 million in cash held in the Company’s special purpose vehicles (SPVs) relating to its co - owned Myrtle Grove and Heartland assets, which are limited to us
Slide 12: Appendix
WverTex ENERGY APPENDIX
Slide 13: Our Strategic Focus
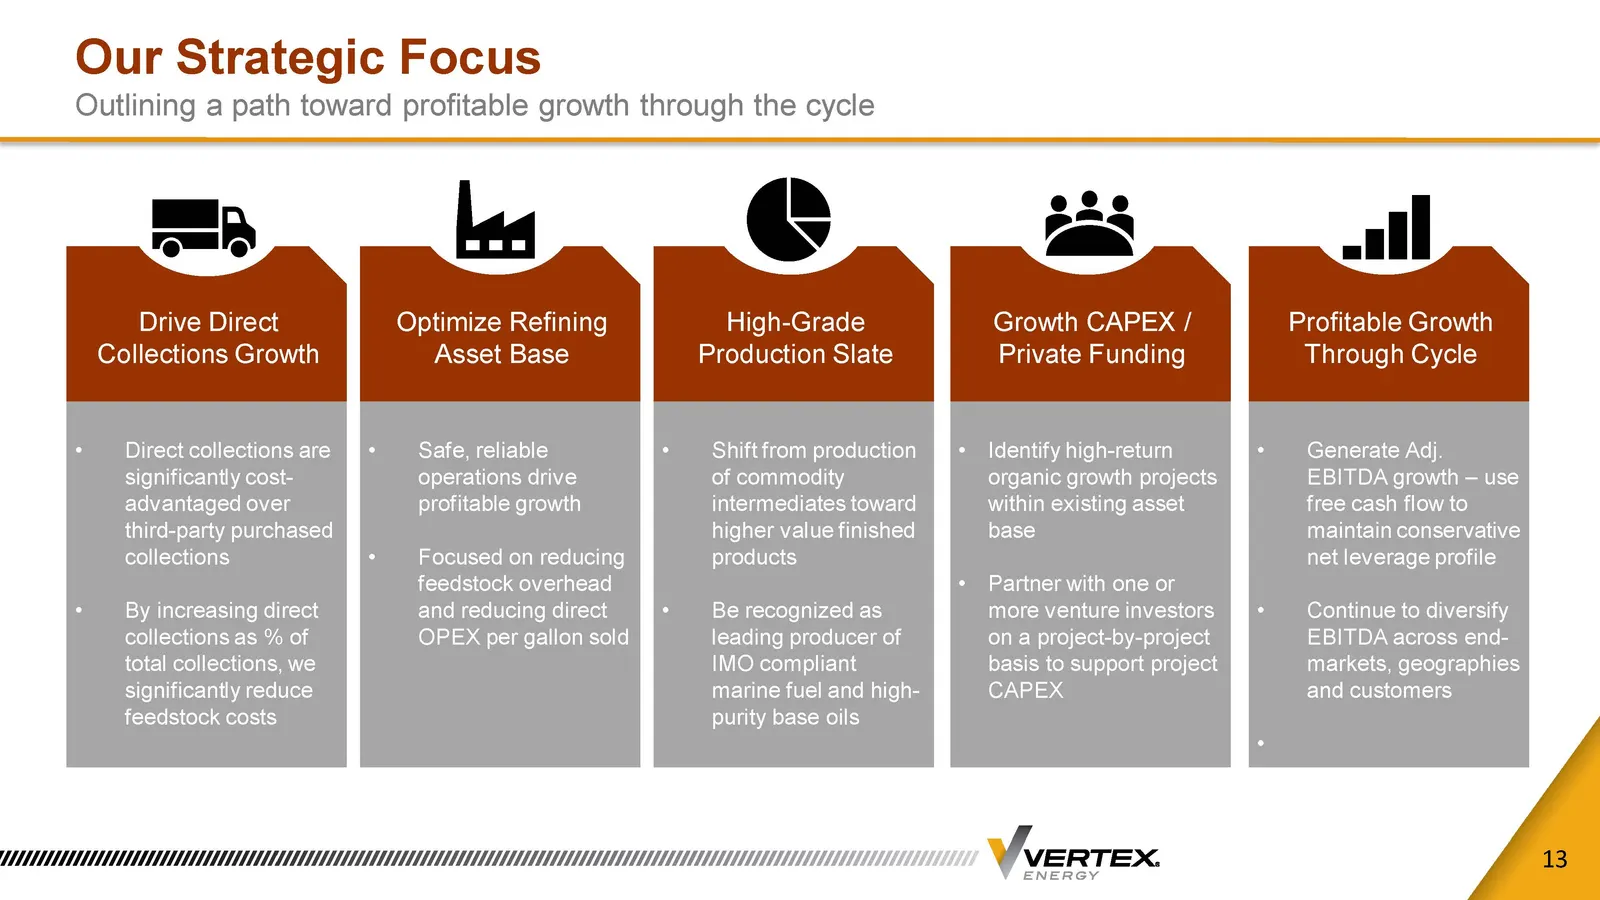
Our Strategic Focus Outlining a path toward profitable growth through the cycle 13 • Direct collections are significantly cost - advantaged over third - party purchased collections • By increasing direct collections as % of total collections, we significantly reduce feedstock costs Drive Direct Coll
Slide 14: We Are Focused On High-Grading Our Production Slate
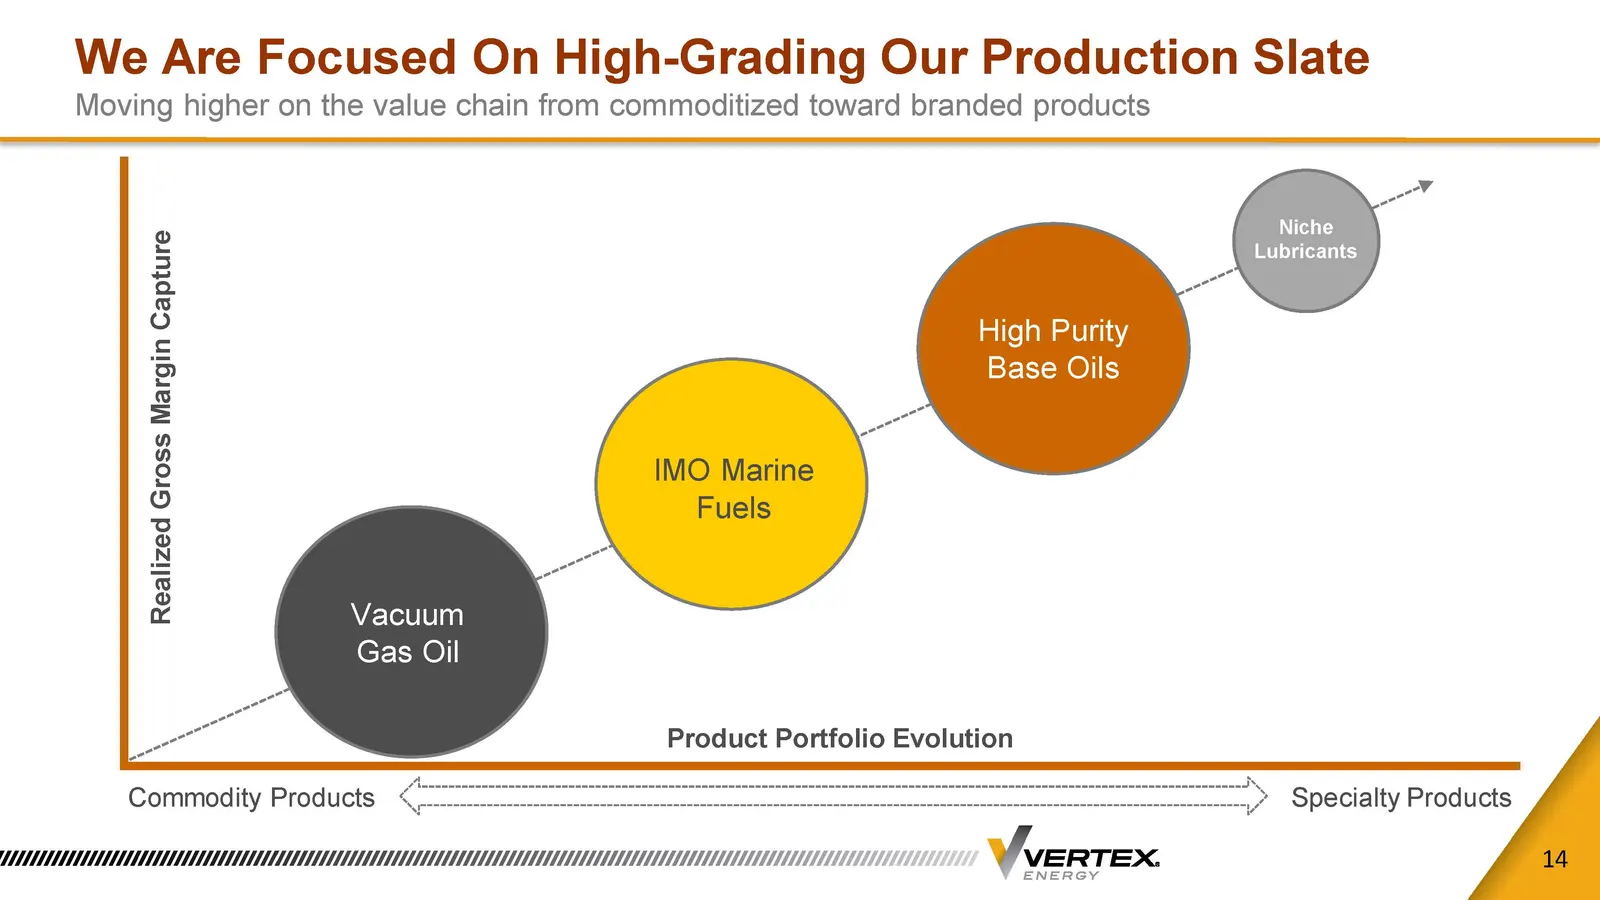
We Are Focused On High - Grading Our Production Slate Moving higher on the value chain from commoditized toward branded products 14 Realized Gross Margin Capture Product Portfolio Evolution Commodity Products Specialty Products Vacuum Gas Oil IMO Marine Fuels High Purity Base Oils Niche Lubricants
Slide 15: Non-GAAP Reconciliation
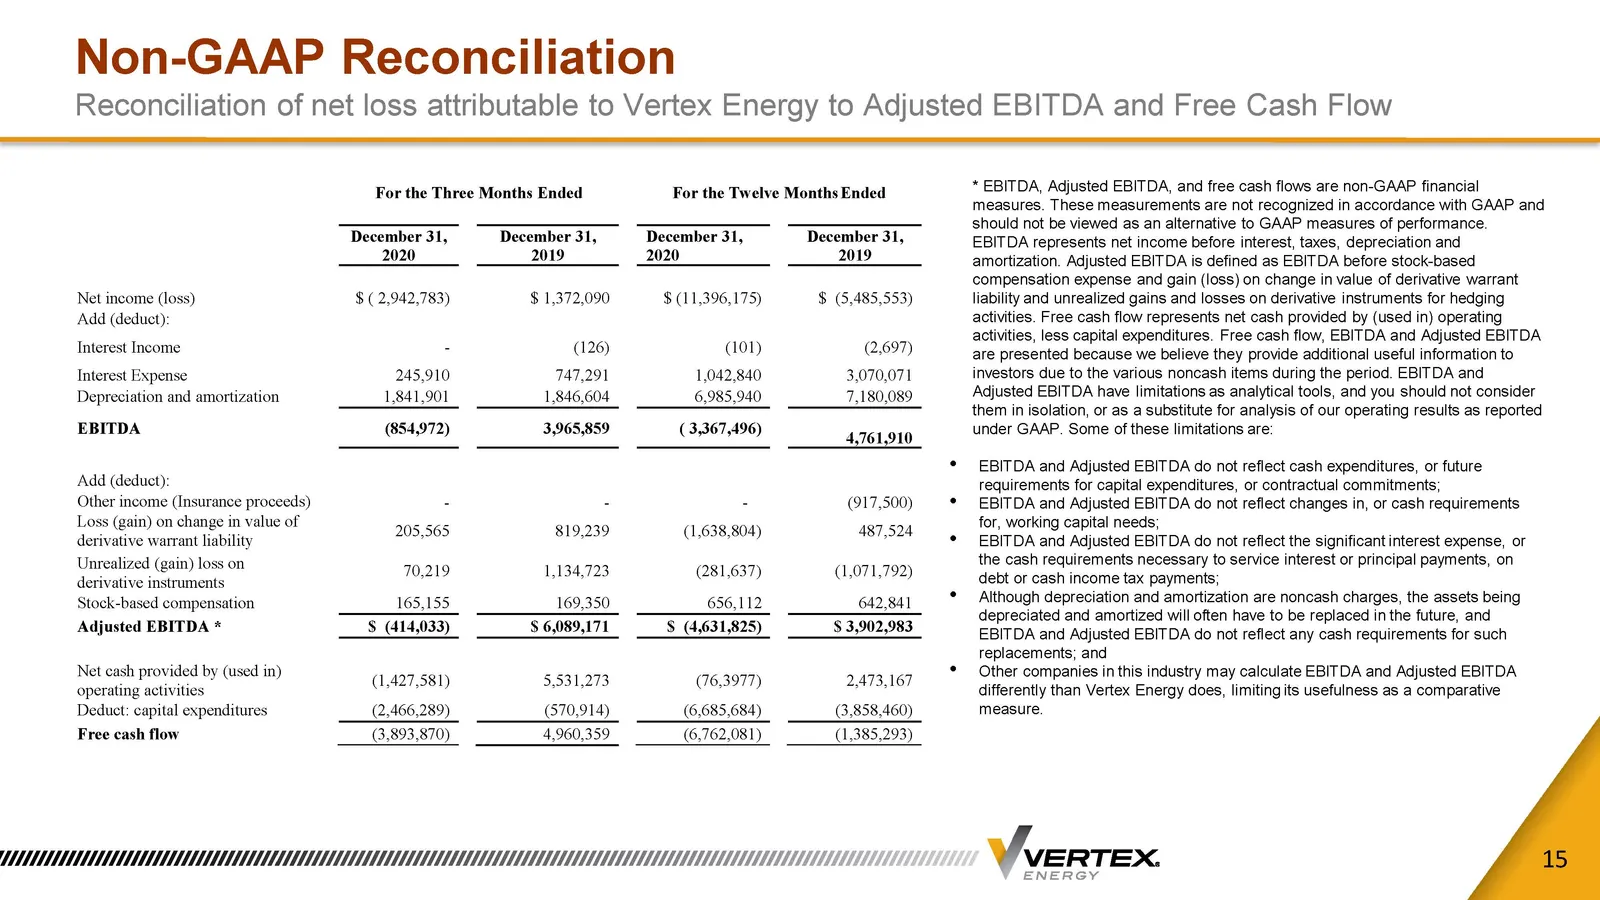
Non - GAAP Reconciliation Reconciliation of net loss attributable to Vertex Energy to Adjusted EBITDA and Free Cash Flow 15 * EBITDA, Adjusted EBITDA, and free cash flows are non - GAAP financial measures. These measurements are not recognized in accordance with GAAP and should not be viewed as an a
Source: SEC EDGAR · 8-K filed Mar 9, 2021
More decks from Vertex Energy Inc
 Q2 2024 Earnings Presentation21 slides · Aug 8, 2024
 Q1 2024 Earnings Presentation20 slides · May 9, 2024
 Q4 2023 Earnings Presentation29 slides · Feb 28, 2024
 Q3 2023 Earnings Presentation27 slides · Nov 7, 2023
 Q2 2023 Earnings Presentation26 slides · Aug 9, 2023
 Q1 2023 Earnings Presentation26 slides · May 9, 2023