Rexel SA · EURONEXT:RXL
Rexel SA — Q3 2013 Earnings Presentation
59 slides from Rexel SA's earnings presentation, 2013
Slide 1: Post-Q3 & 9-month 2013 Results Roadshow Presentation
POST-Q3 & 9-month 2013 RESULTS Roadshow presentation
Slide 2: 1. Company Overview
1 » COMPANY OVERVIEW Rexeu. as a world of energy ENERG) IN MOTION
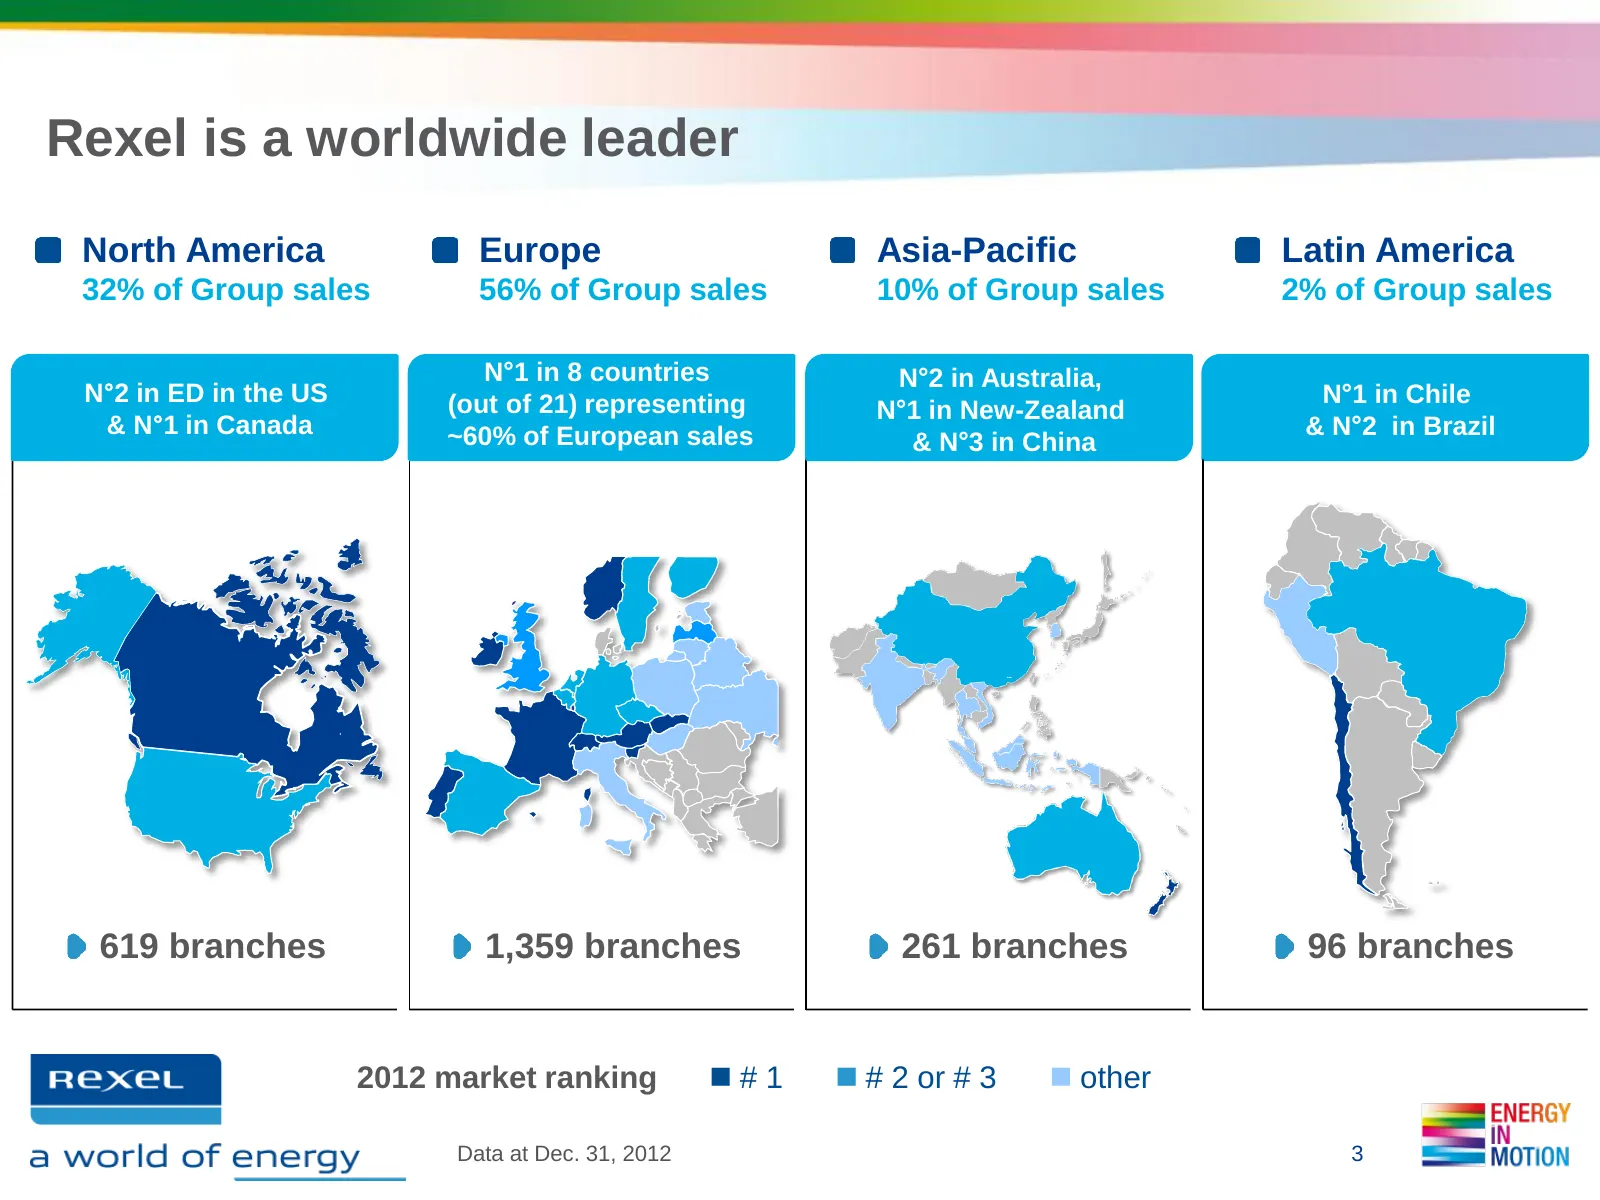
Slide 3: Rexel is a worldwide leader
Rexel is a worldwide leader North America Europe Asia-Pacific Latin America 32% of Group sales 56% of Group sales 10% of Group sales 2% of Group sales N°1 in 8 countries N°2 in Australia, N°2 in ED in the US (out of 21) representing N°1 in Chile N°1 in New-Zealand & N°1 in Canada ~60% of European sa
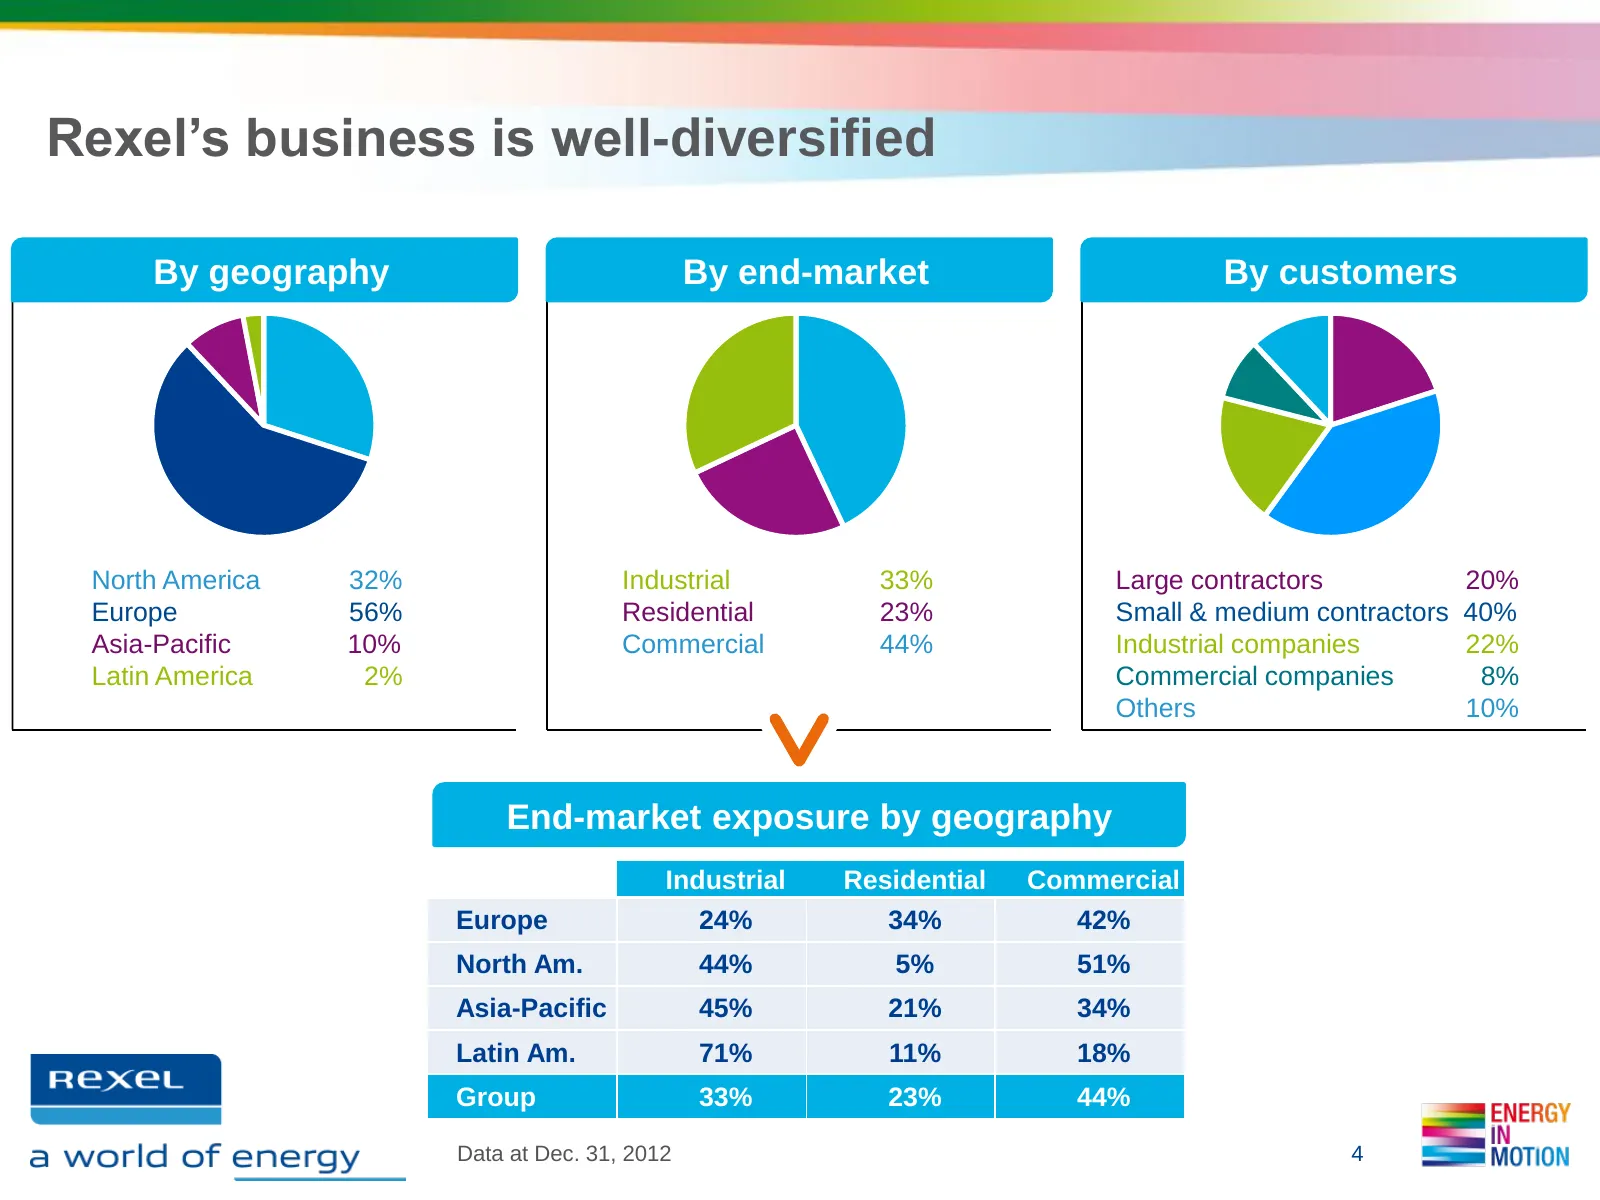
Slide 4: Rexel's business is well-diversified
Rexel’s business is well-diversified By geography By end-market By customers North America 32% Industrial 33% Large contractors 20% Europe 56% Residential 23% Small & medium contractors 40% Asia-Pacific 10% Commercial 44% Industrial companies 22% Latin America 2% Commercial companies 8% Others 10% E
Slide 5: A customer-centric approach through a multi-channel model
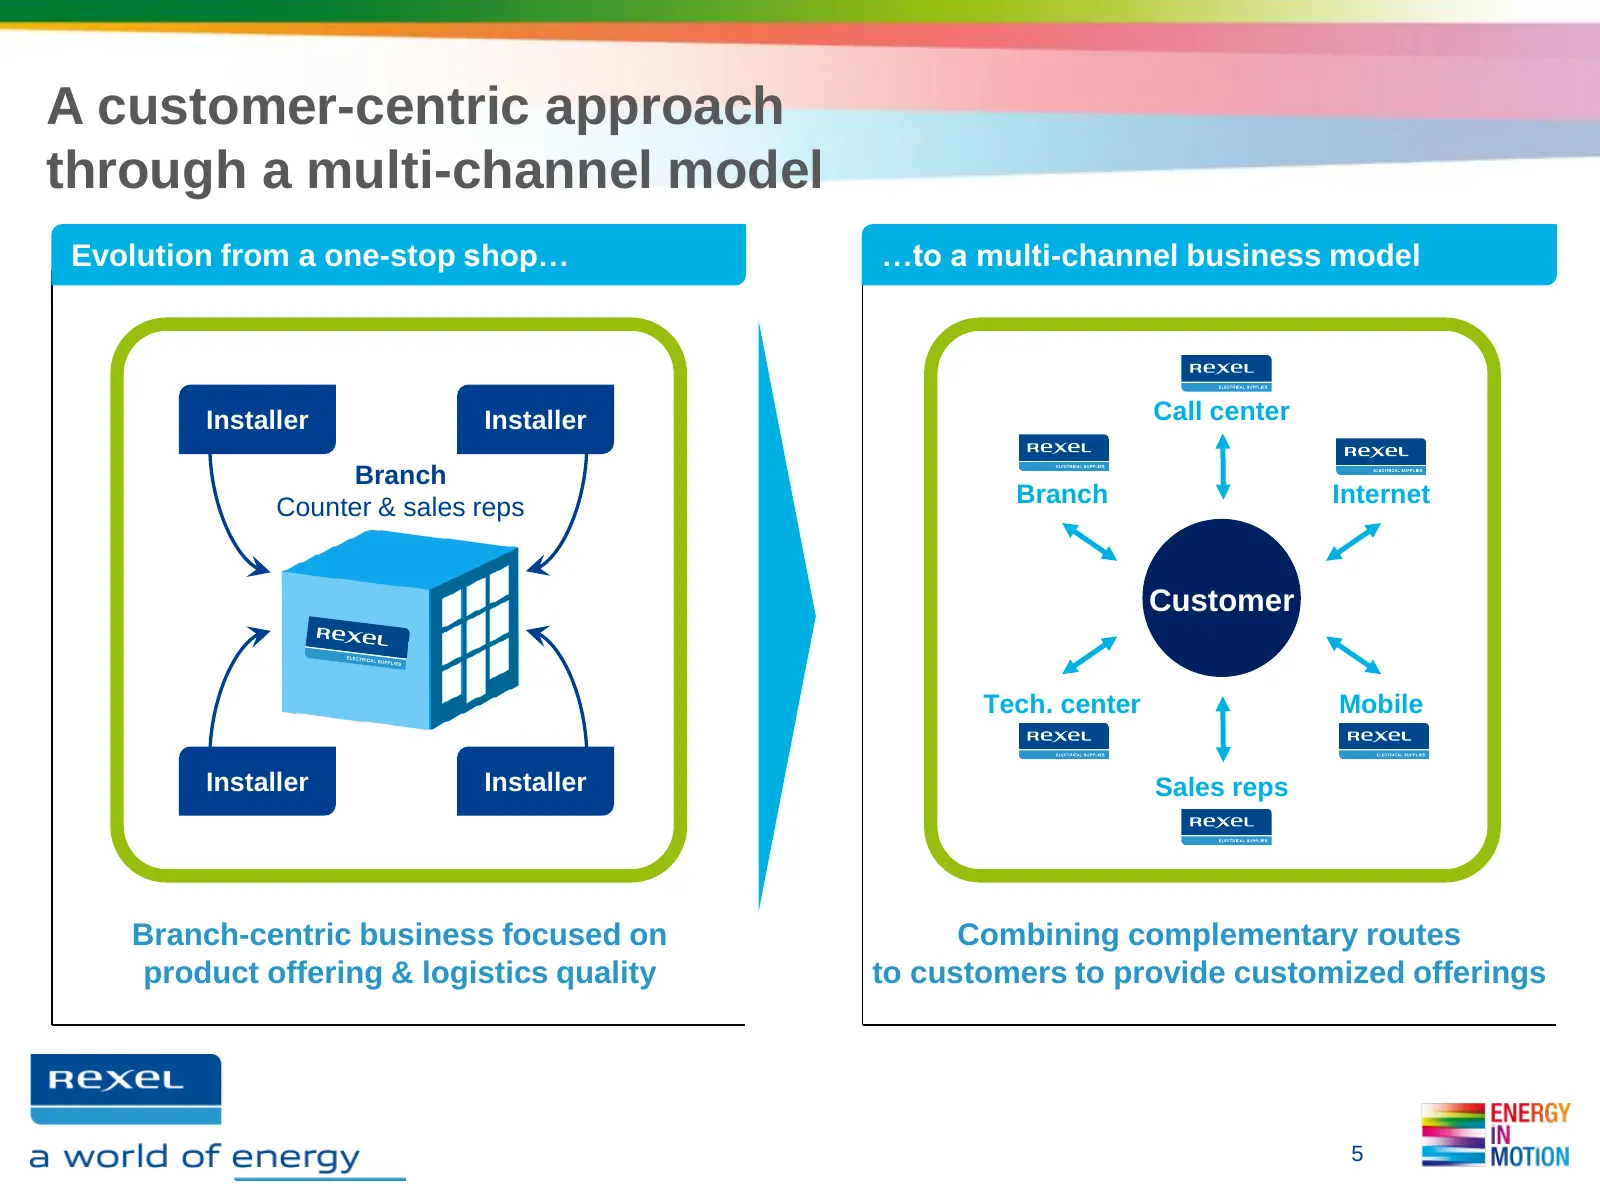
A customer-centric approach through a multi-channel model Evolution from a one-stop shop… …to a multi-channel business model Installer Installer Call center Branch Counter & sales reps Branch Internet Customer Tech. center Mobile Installer Installer Sales reps Branch-centric business focused on Comb
Slide 6: Rexel has strong relationships with its suppliers
Rexel has strong relationships with its suppliers Rexel has organized its supplier relationships around: A limited number of strategic suppliers that are global players A number of national or regional suppliers The 25 top suppliers represent 53% of Rexel’s purchases, with no risk of interdependence
Slide 7: A market consolidator with a proven capacity to extract synergies
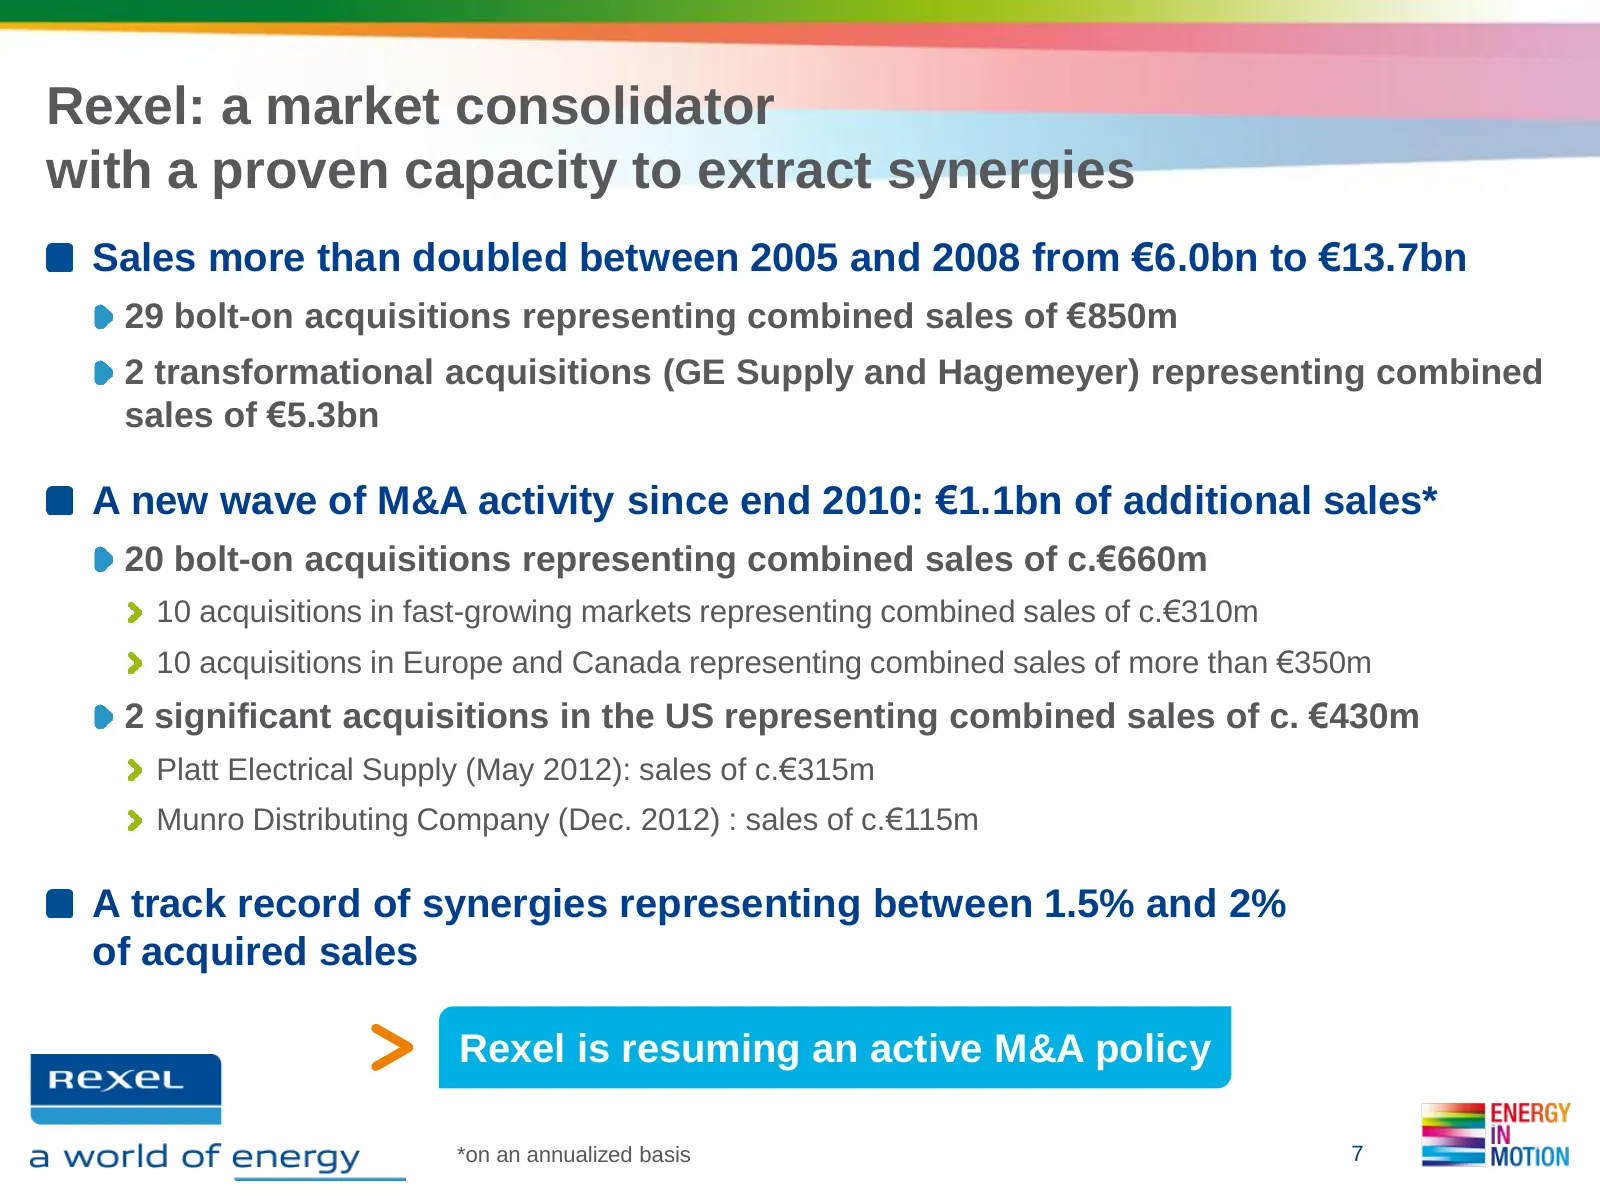
Rexel: a market consolidator with a proven capacity to extract synergies Sales more than doubled between 2005 and 2008 from €6.0bn to €13.7bn 29 bolt-on acquisitions representing combined sales of €850m 2 transformational acquisitions (GE Supply and Hagemeyer) representing combined sales of €5.3bn A
Slide 8: Resilience across cycles thanks to margin discipline
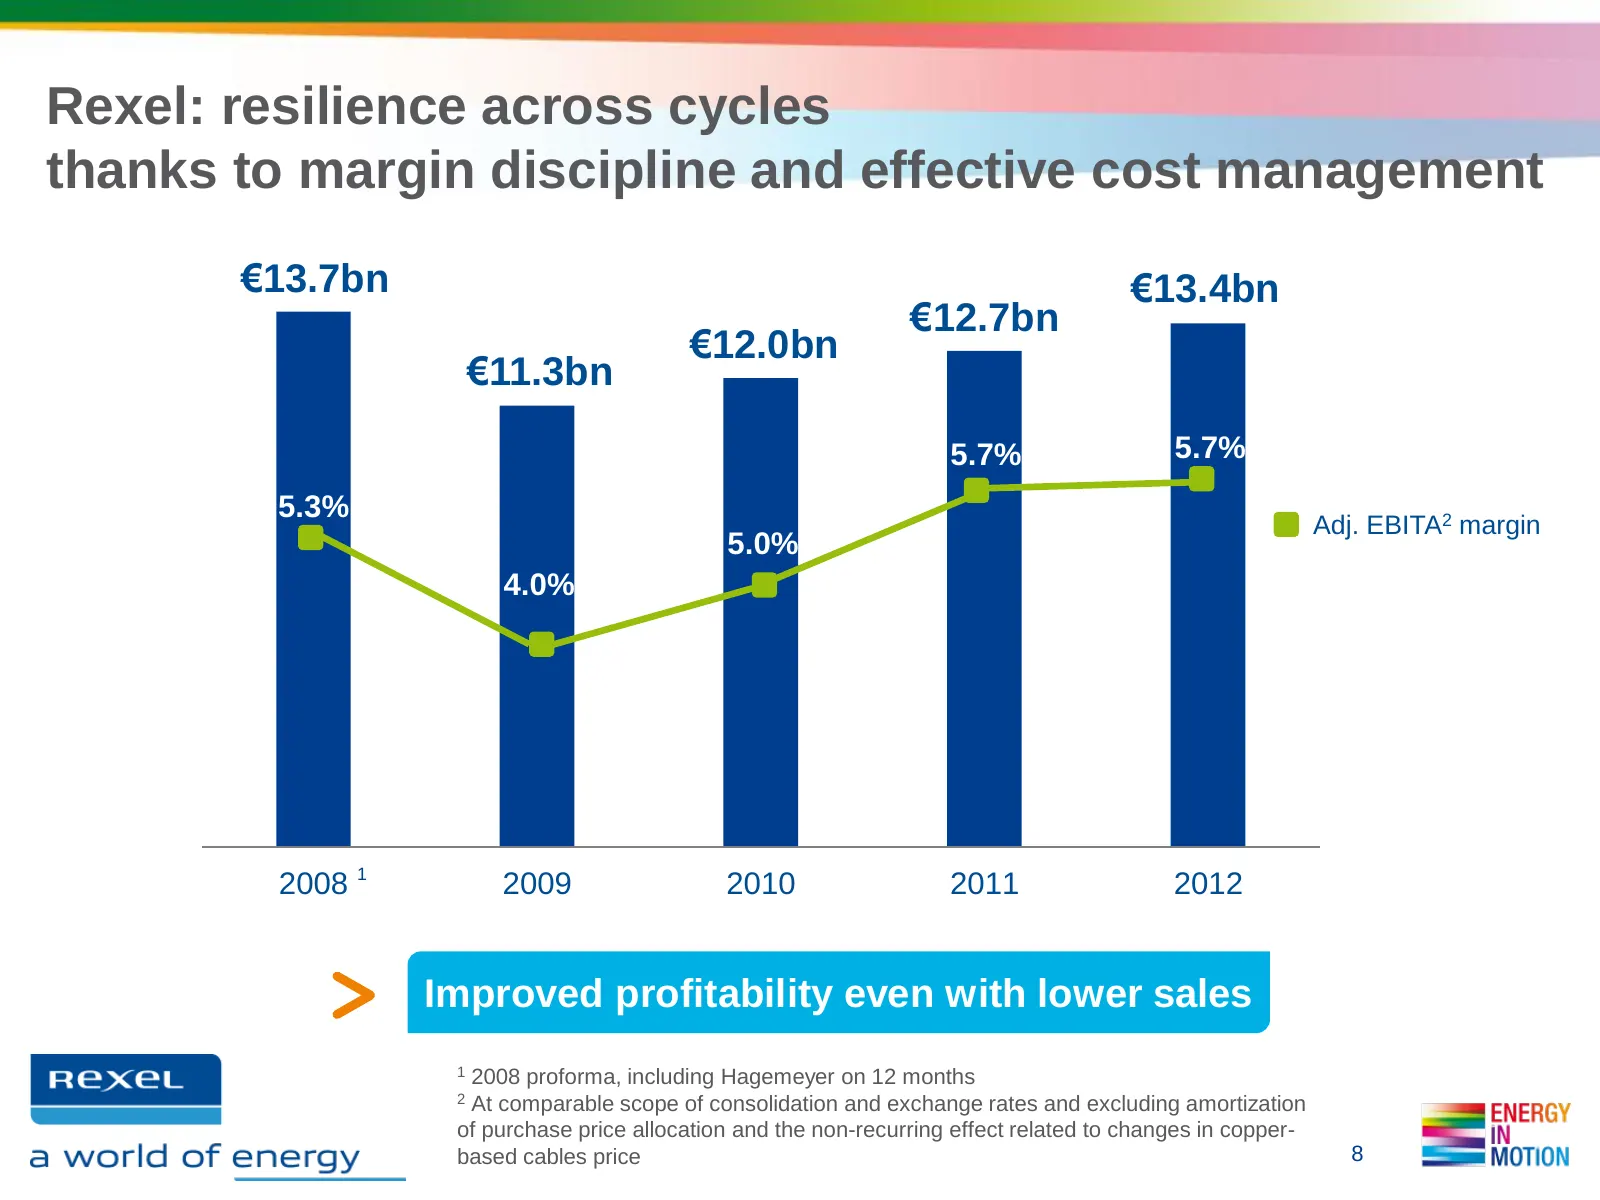
Rexel: resilience across cycles thanks to margin discipline and effective cost management €13.7bn €13.4bn €12.7bn €12.0bn €11.3bn 5.7% 5.7% 5.3% Adj. EBITA2 margin 5.0% 4.0% 2008 1 2009 2010 2011 2012 Improved profitability even with lower sales 1 2008 proforma, including Hagemeyer on 12 months 2 At
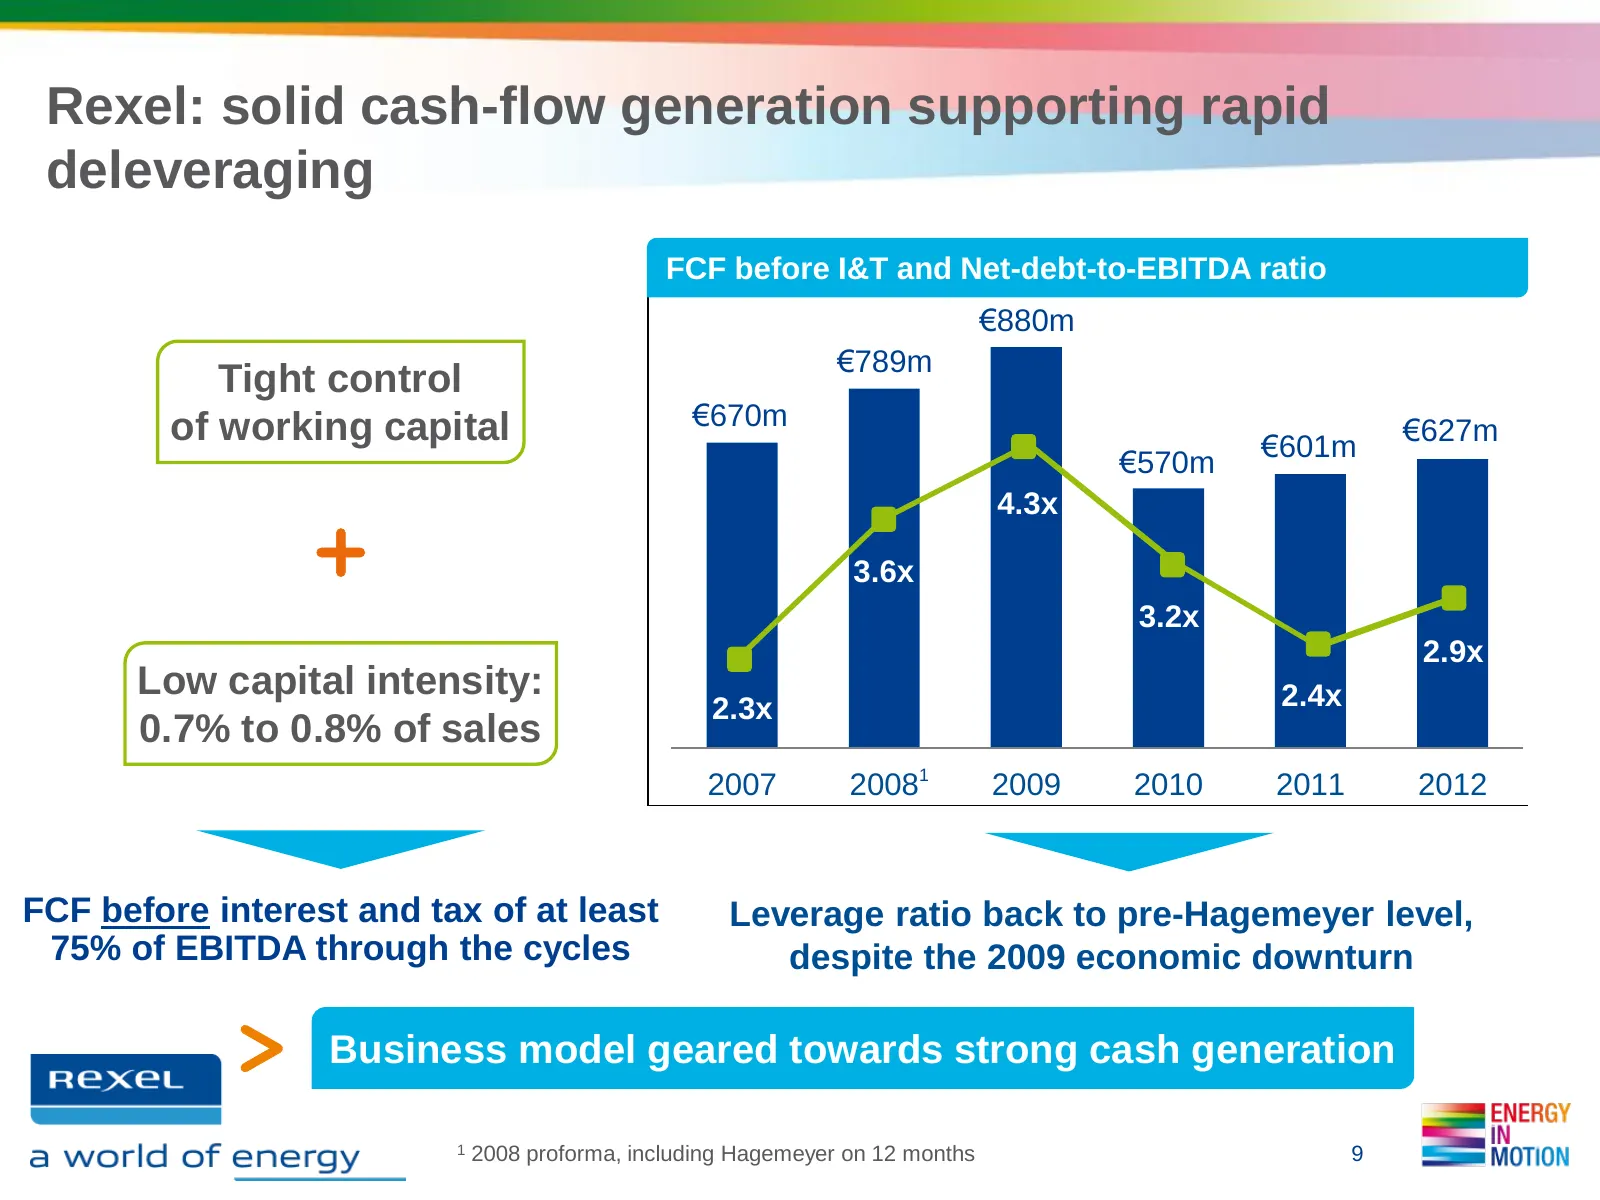
Slide 9: Solid cash-flow generation supporting rapid deleveraging
Rexel: solid cash-flow generation supporting rapid deleveraging FCF before I&T and Net-debt-to-EBITDA ratio €880m €789m Tight control of working capital €670m €627m €601m €570m 4.3x 3.6x 3.2x 2.9x Low capital intensity: 2.4x 2.3x 0.7% to 0.8% of sales 2007 20081 2009 2010 2011 2012 FCF before intere
Slide 10: 2. Third Quarter & 9-Month Results
2. THIRD QUARTER & 9-MONTH RESULTS
Slide 11: Q3 2013 Highlights
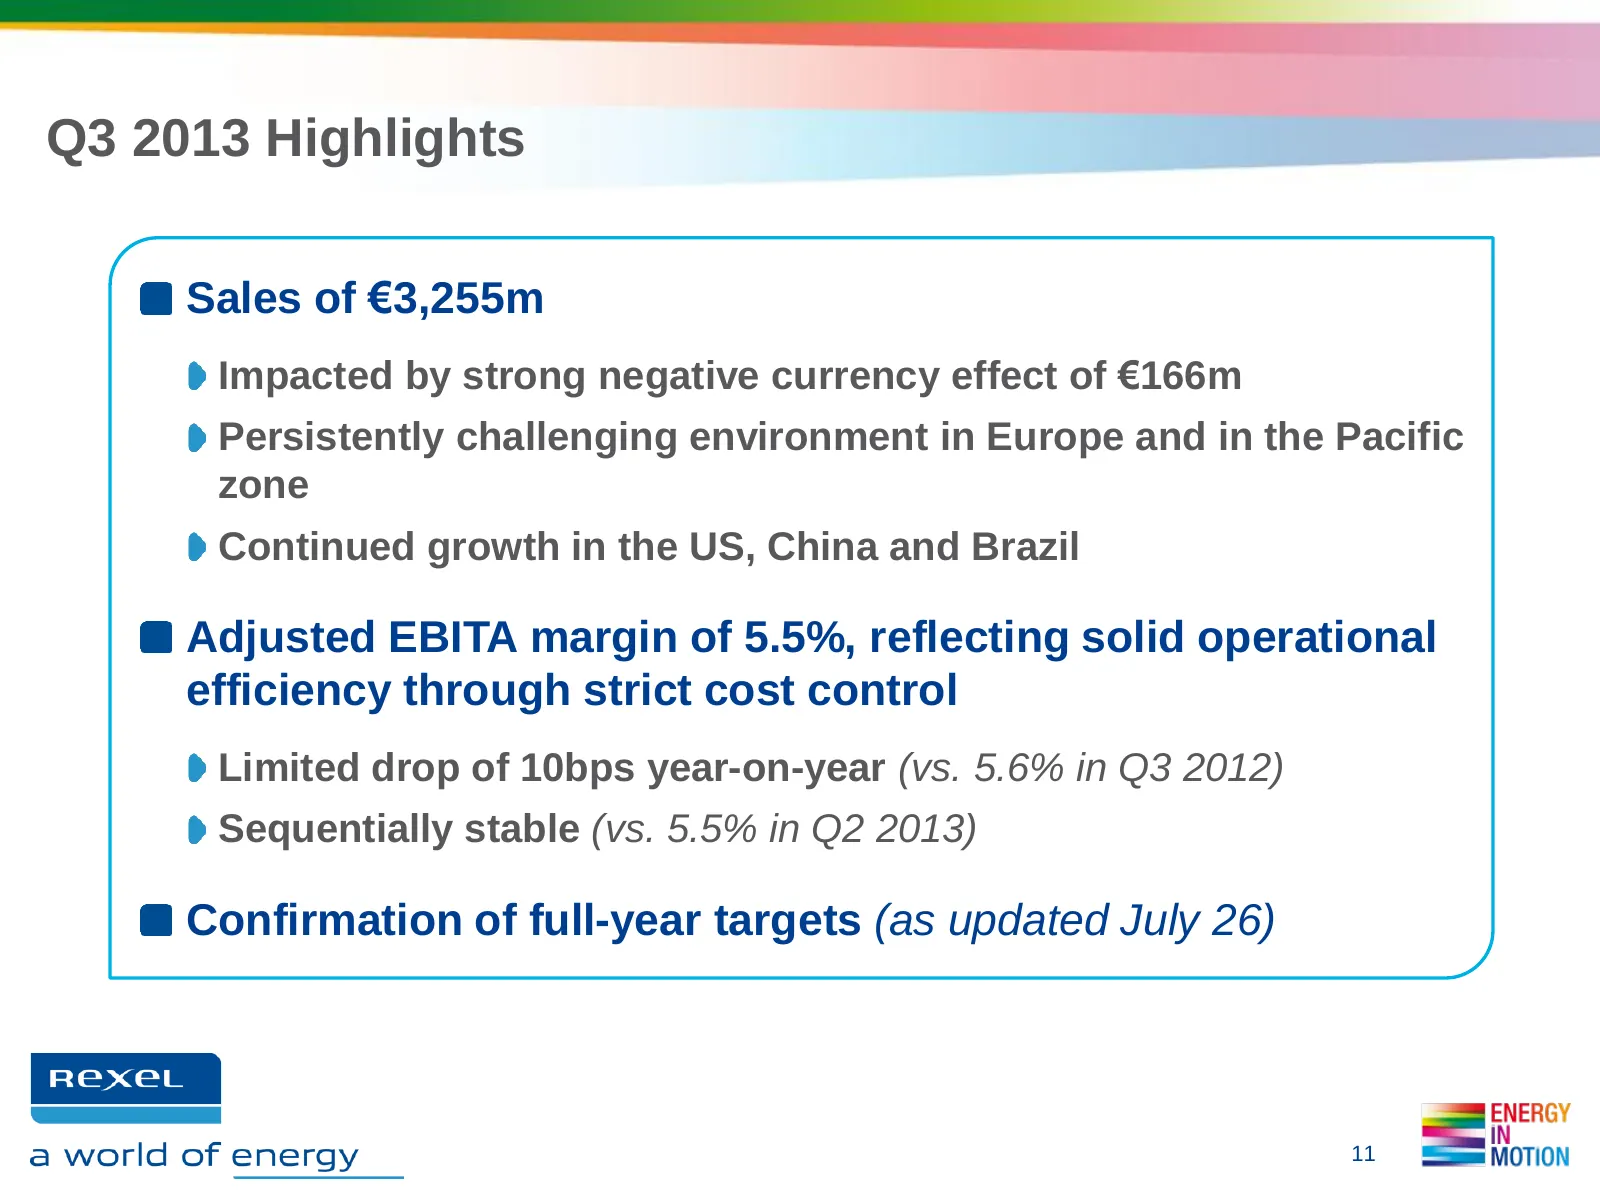
Q3 2013 Highlights Sales of €3,255m Impacted by strong negative currency effect of €166m Persistently challenging environment in Europe and in the Pacific zone Continued growth in the US, China and Brazil Adjusted EBITA margin of 5.5%, reflecting solid operational efficiency through strict cost cont
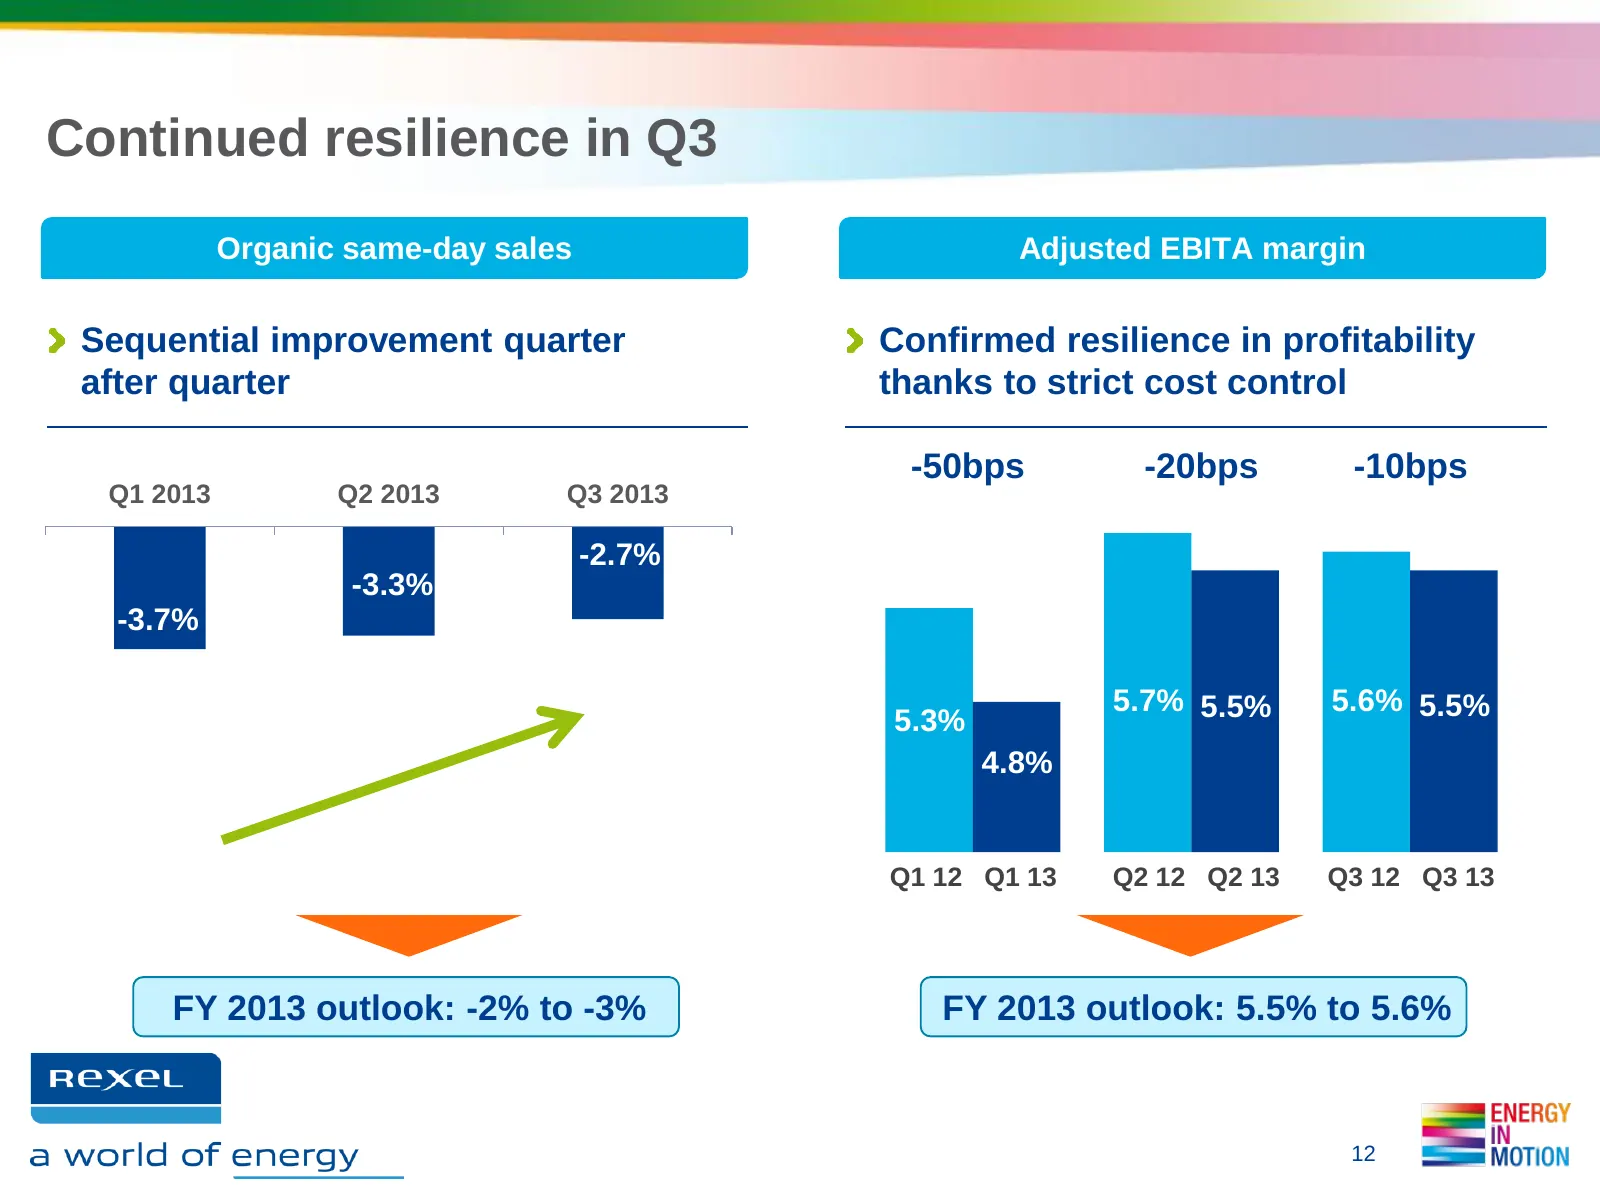
Slide 12: Continued resilience in Q3
Continued resilience in Q3 Organic same-day sales Adjusted EBITA margin Sequential improvement quarter Confirmed resilience in profitability after quarter thanks to strict cost control -50bps -20bps -10bps Q1 2013 Q2 2013 Q3 2013 -2.7% -3.3% -3.7% 5.7% 5.5% 5.6% 5.5% 5.3% 4.8% Q1 12 Q1 13 Q2 12 Q2 1
Slide 13: Europe: continued pressure on sales
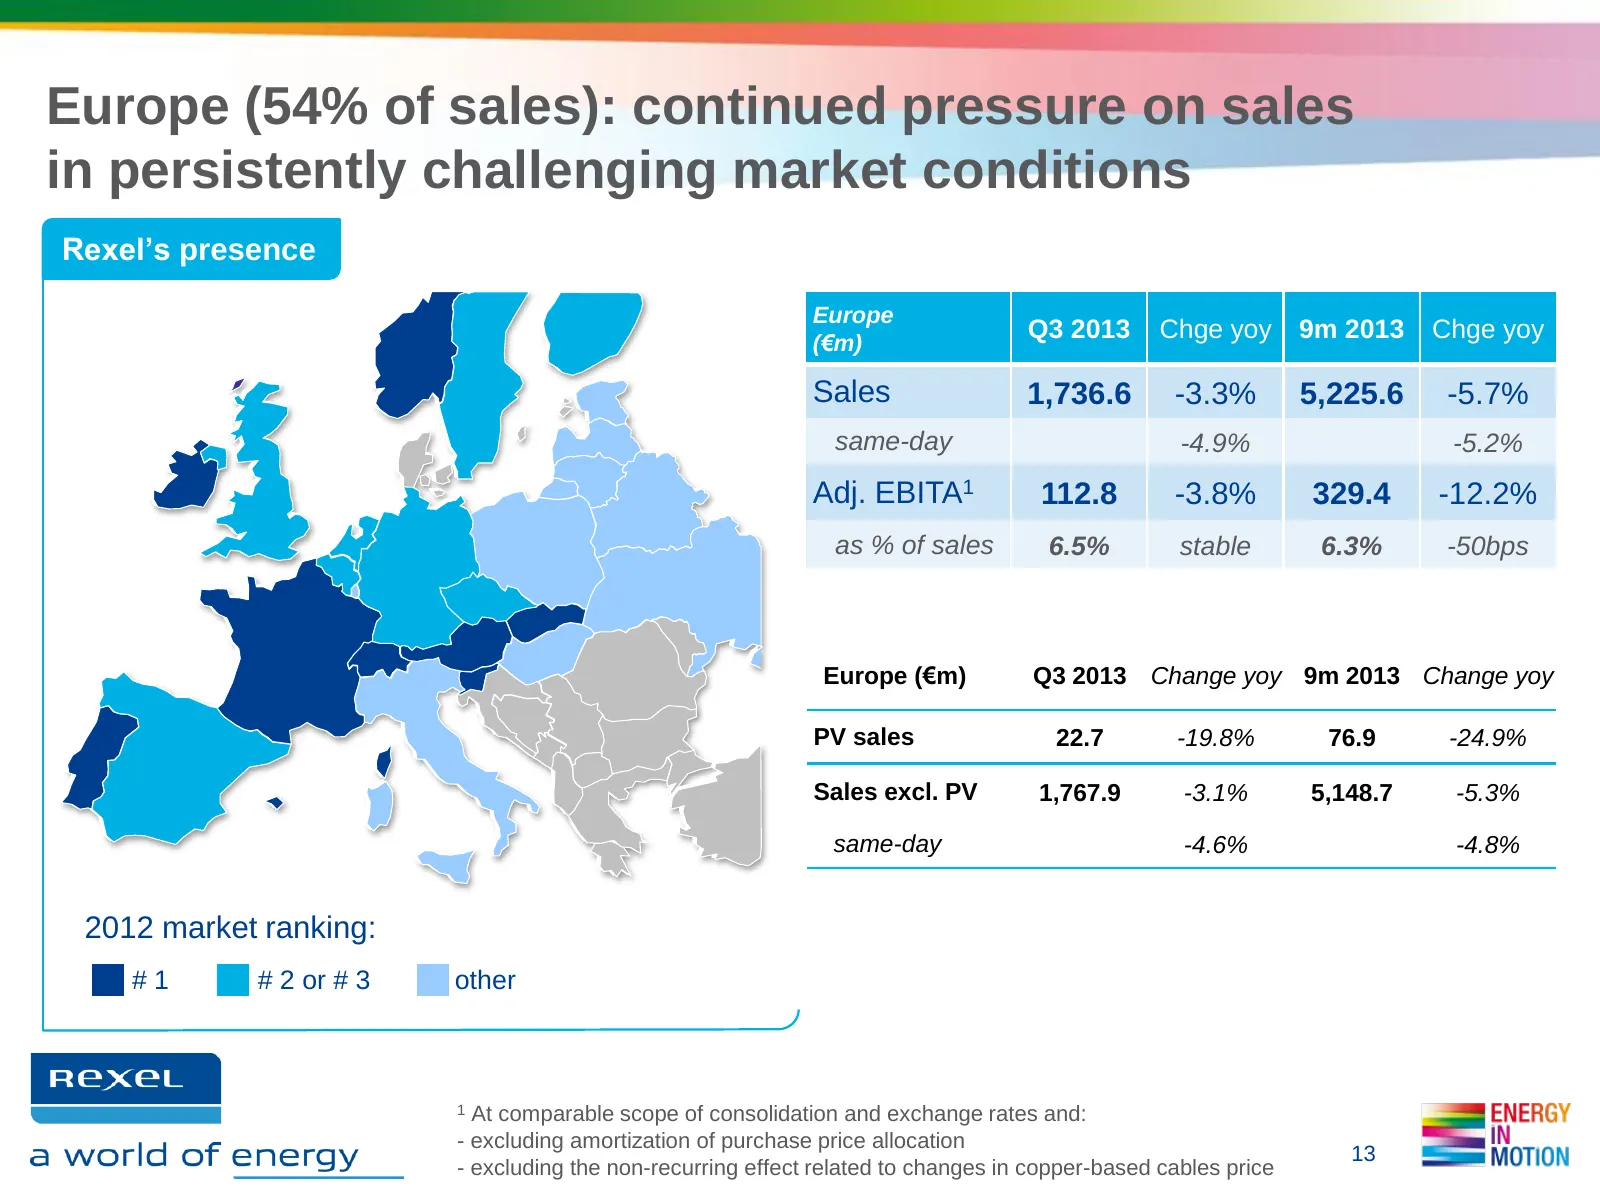
Europe (54% of sales): continued pressure on sales in persistently challenging market conditions Rexel’s presence Europe (€m) Q3 2013 Chge yoy 9m 2013 Chge yoy Sales 1,736.6 -3.3% 5,225.6 -5.7% same-day -4.9% -5.2% Adj. EBITA1 112.8 -3.8% 329.4 -12.2% as % of sales 6.5% stable 6.3% -50bps Europe (€m
Slide 14: Europe: Q3 2013 business highlights
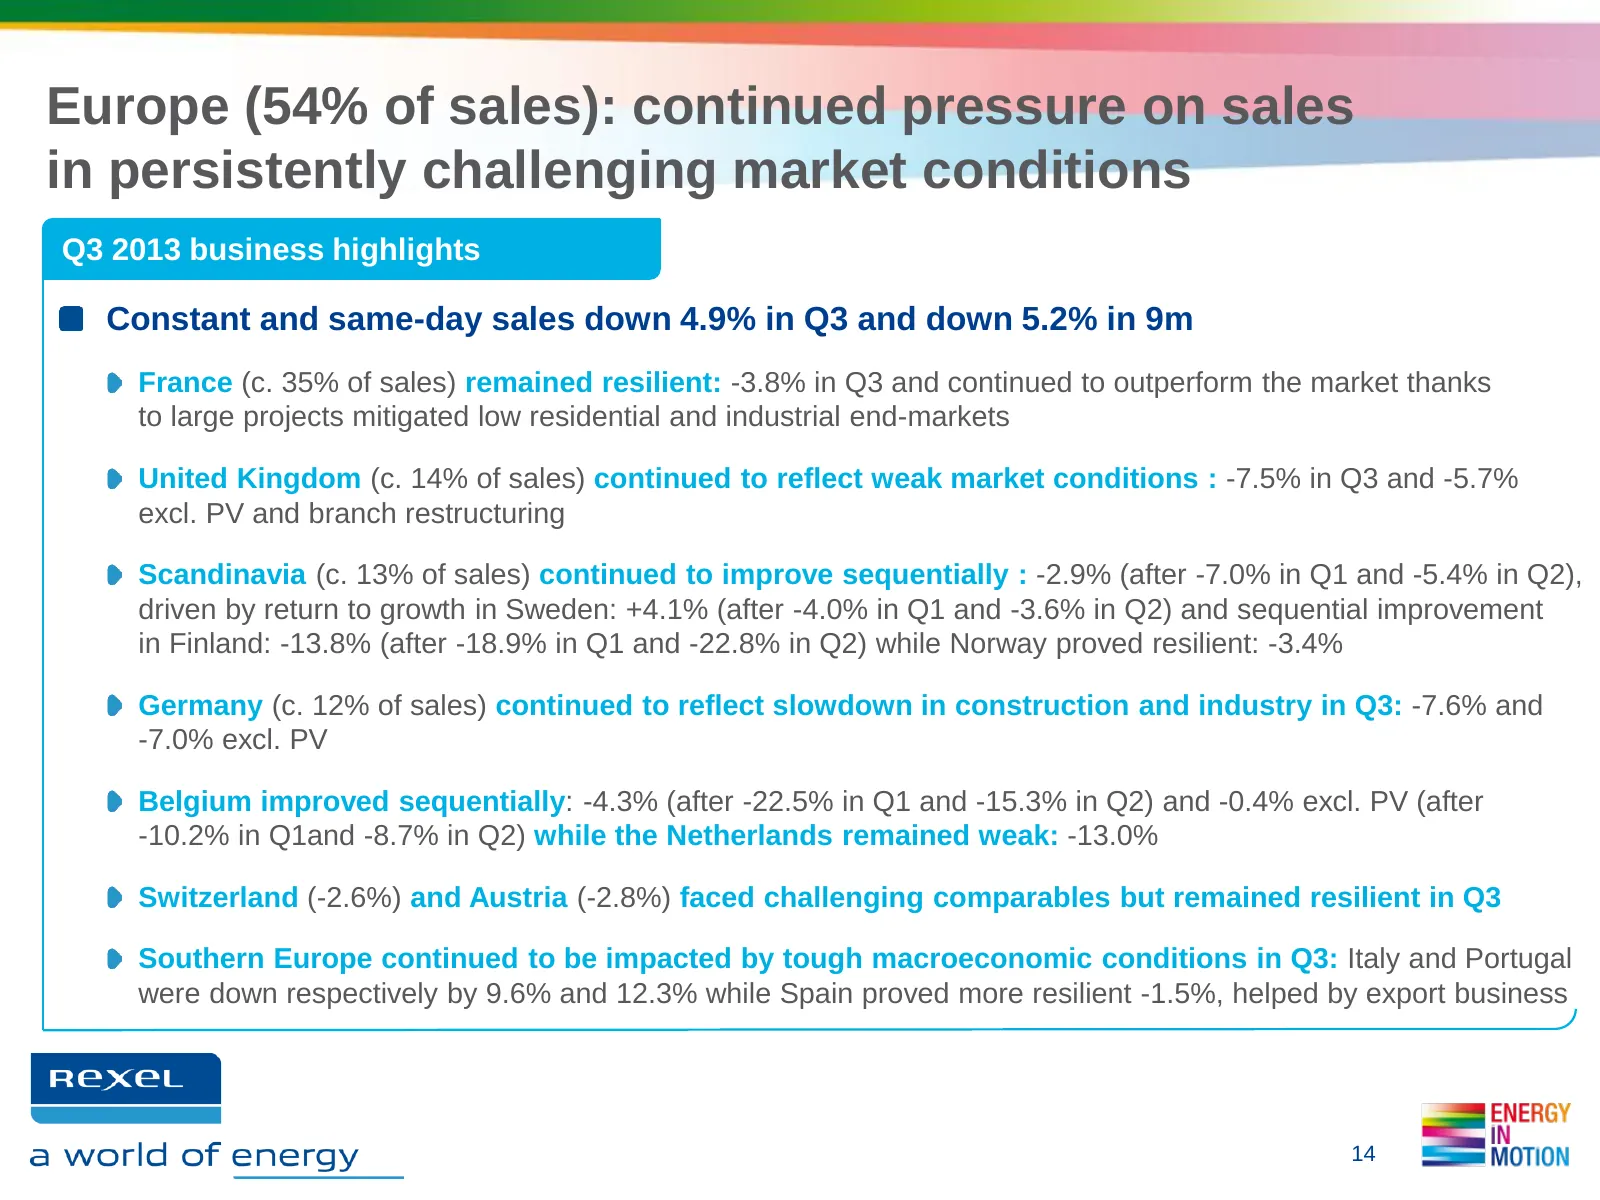
Europe (54% of sales): continued pressure on sales in persistently challenging market conditions Q3 2013 business highlights Constant and same-day sales down 4.9% in Q3 and down 5.2% in 9m France (c. 35% of sales) remained resilient: -3.8% in Q3 and continued to outperform the market thanks to large
Slide 15: North America: continued growth in the US
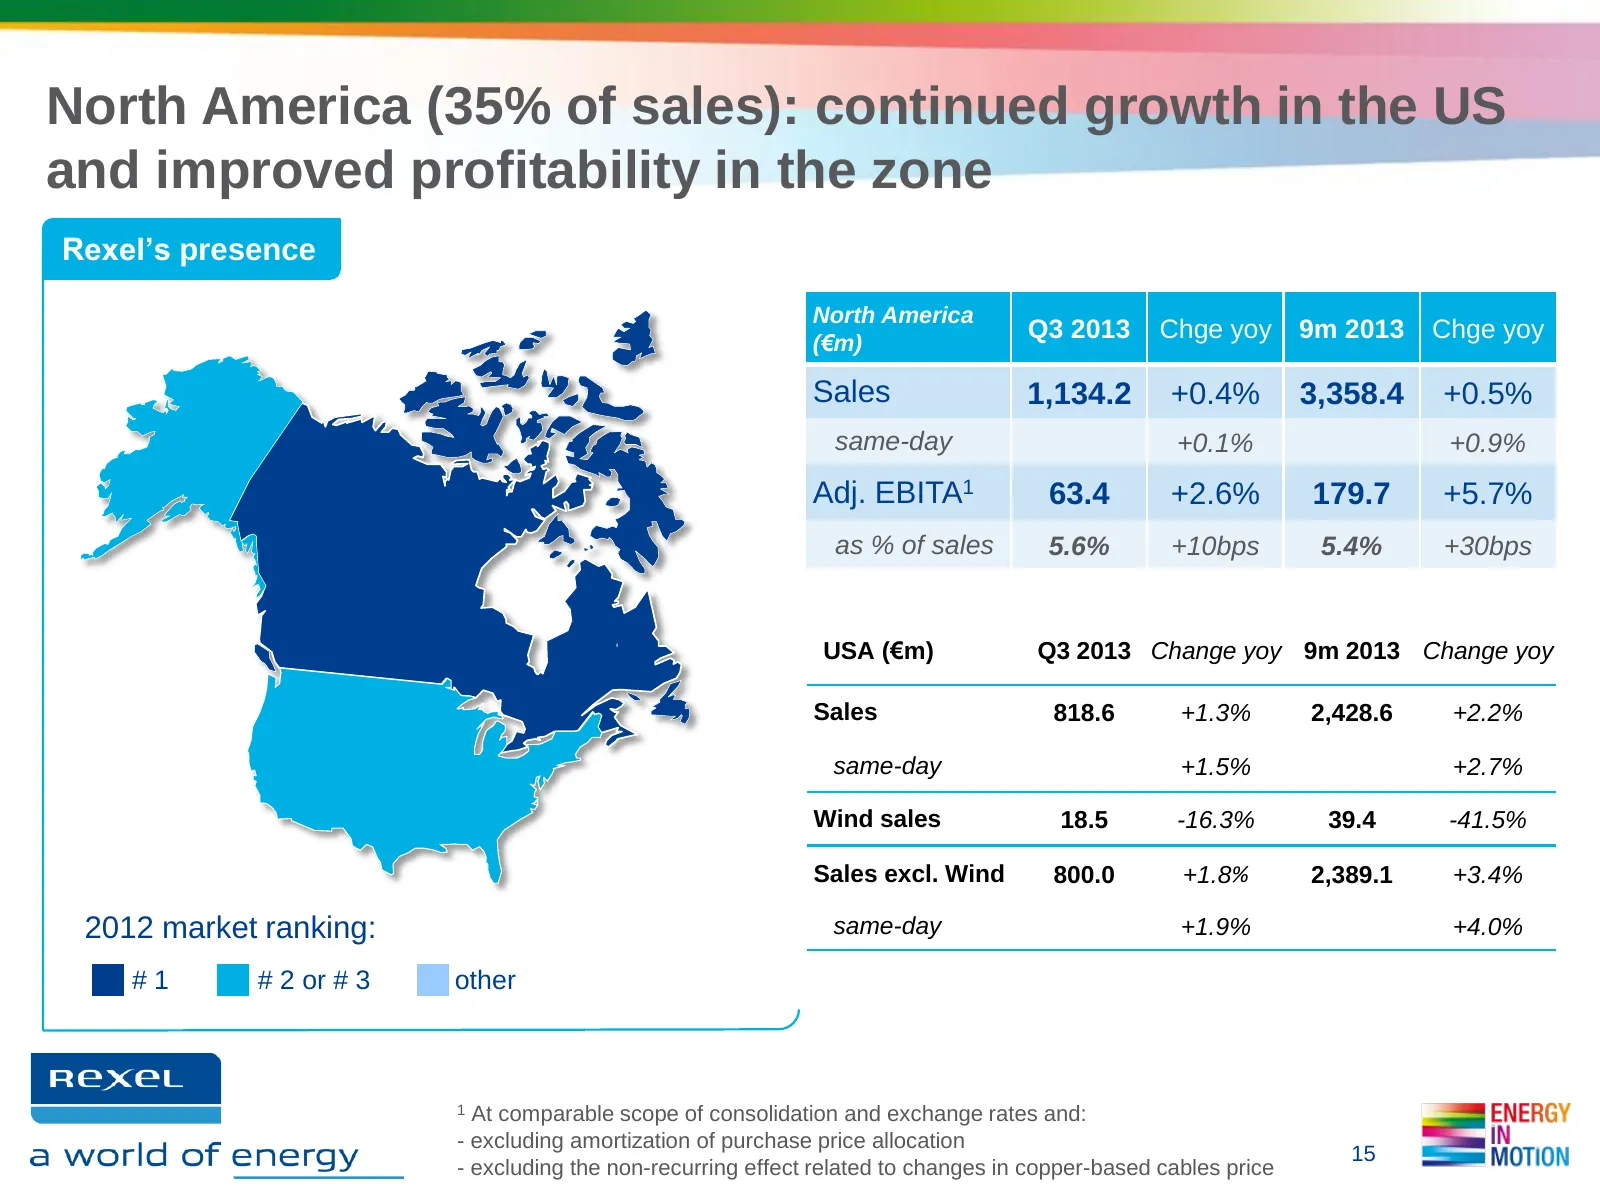
North America (35% of sales): continued growth in the US and improved profitability in the zone Rexel’s presence North America (€m) Q3 2013 Chge yoy 9m 2013 Chge yoy Sales 1,134.2 +0.4% 3,358.4 +0.5% same-day +0.1% +0.9% Adj. EBITA1 63.4 +2.6% 179.7 +5.7% as % of sales 5.6% +10bps 5.4% +30bps USA (€
Slide 16: North America: Q3 2013 business highlights
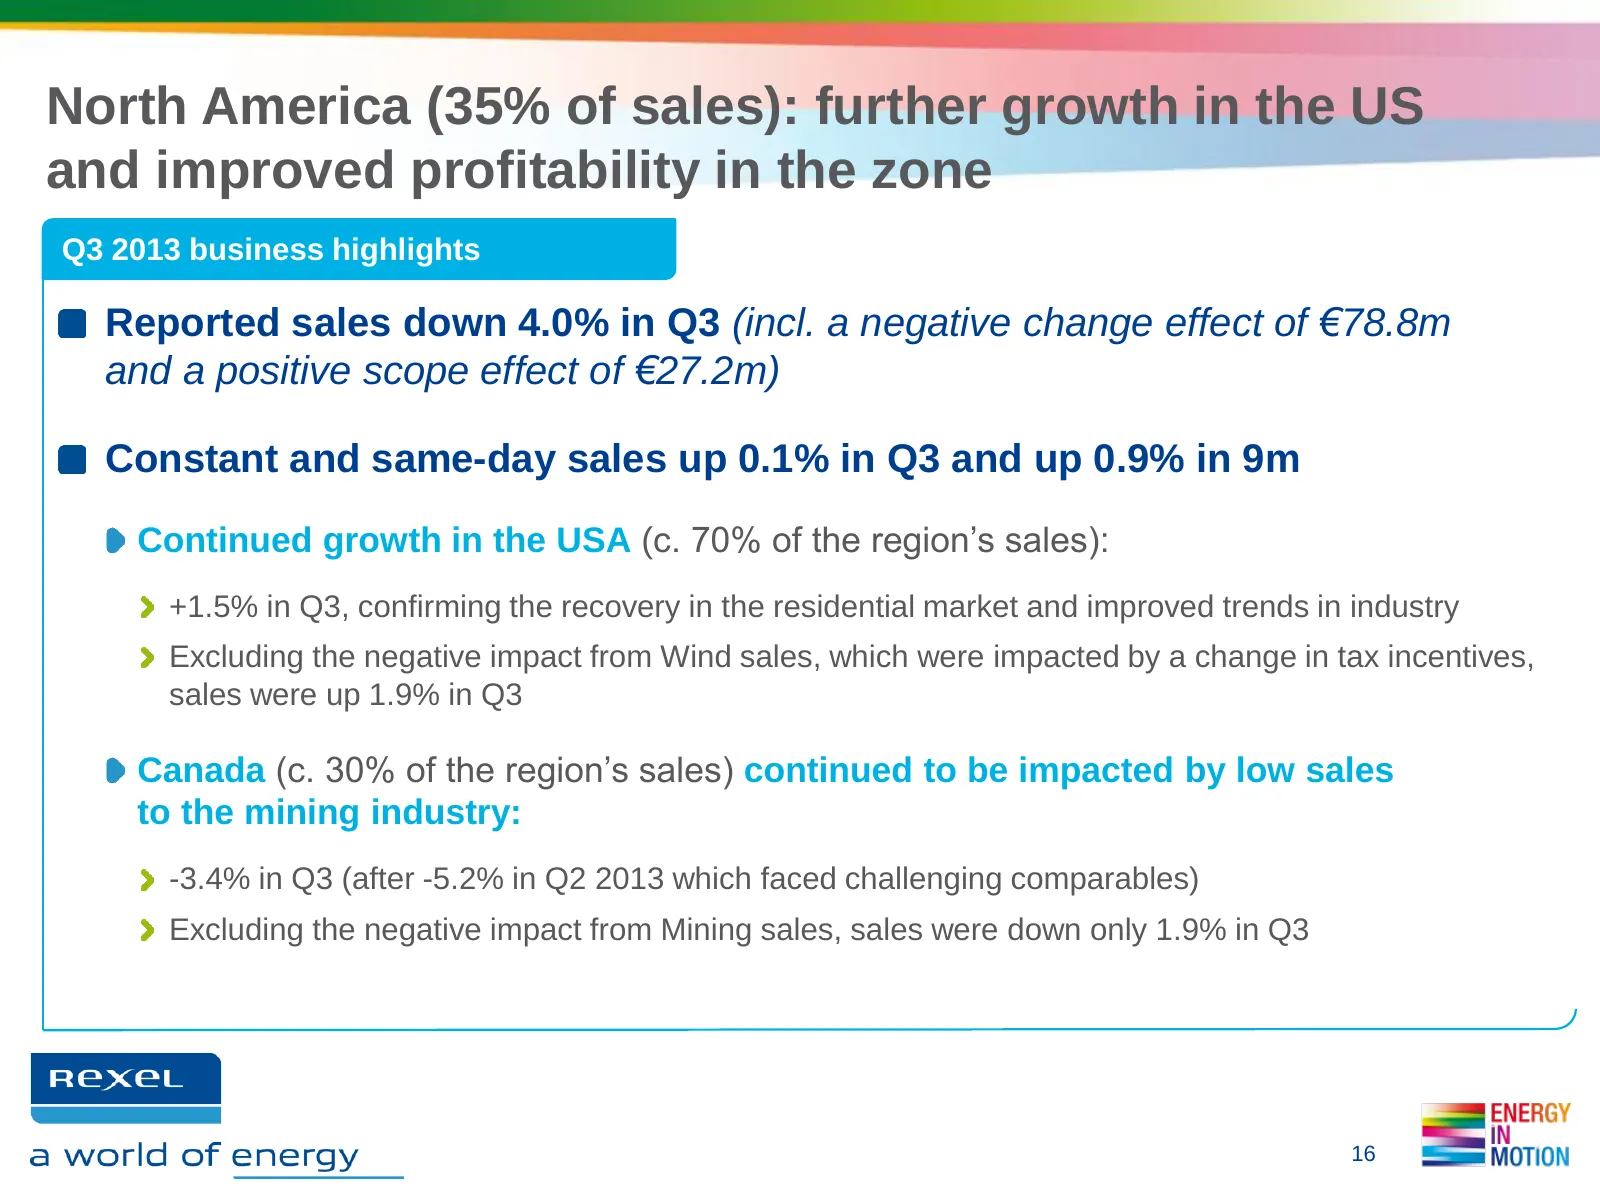
North America (35% of sales): further growth in the US and improved profitability in the zone Q3 2013 business highlights Reported sales down 4.0% in Q3 (incl. a negative change effect of €78.8m and a positive scope effect of €27.2m) Constant and same-day sales up 0.1% in Q3 and up 0.9% in 9m Contin
Slide 17: Asia-Pacific: growth in China and SE Asia
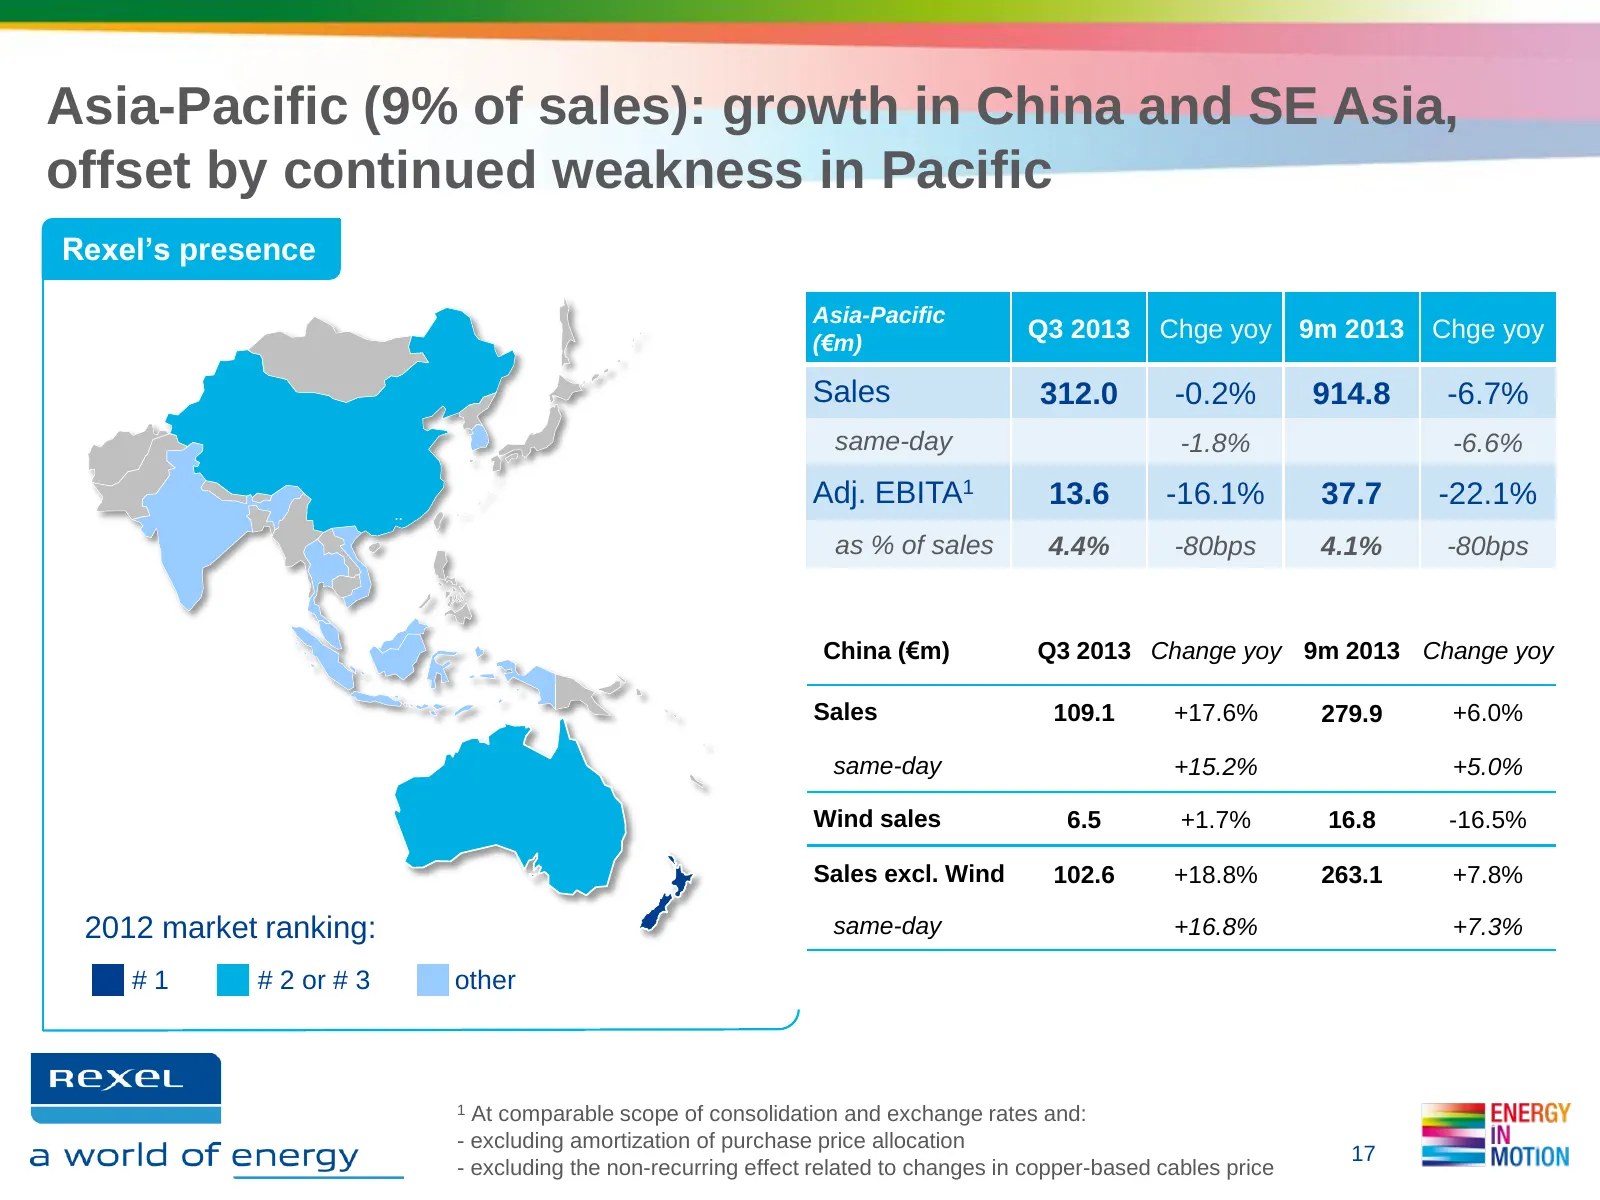
Asia-Pacific (9% of sales): growth in China and SE Asia, offset by continued weakness in Pacific Rexel’s presence Asia-Pacific (€m) Q3 2013 Chge yoy 9m 2013 Chge yoy Sales 312.0 -0.2% 914.8 -6.7% same-day -1.8% -6.6% Adj. EBITA1 13.6 -16.1% 37.7 -22.1% as % of sales 4.4% -80bps 4.1% -80bps China (€m
Slide 18: Asia-Pacific: Q3 2013 business highlights
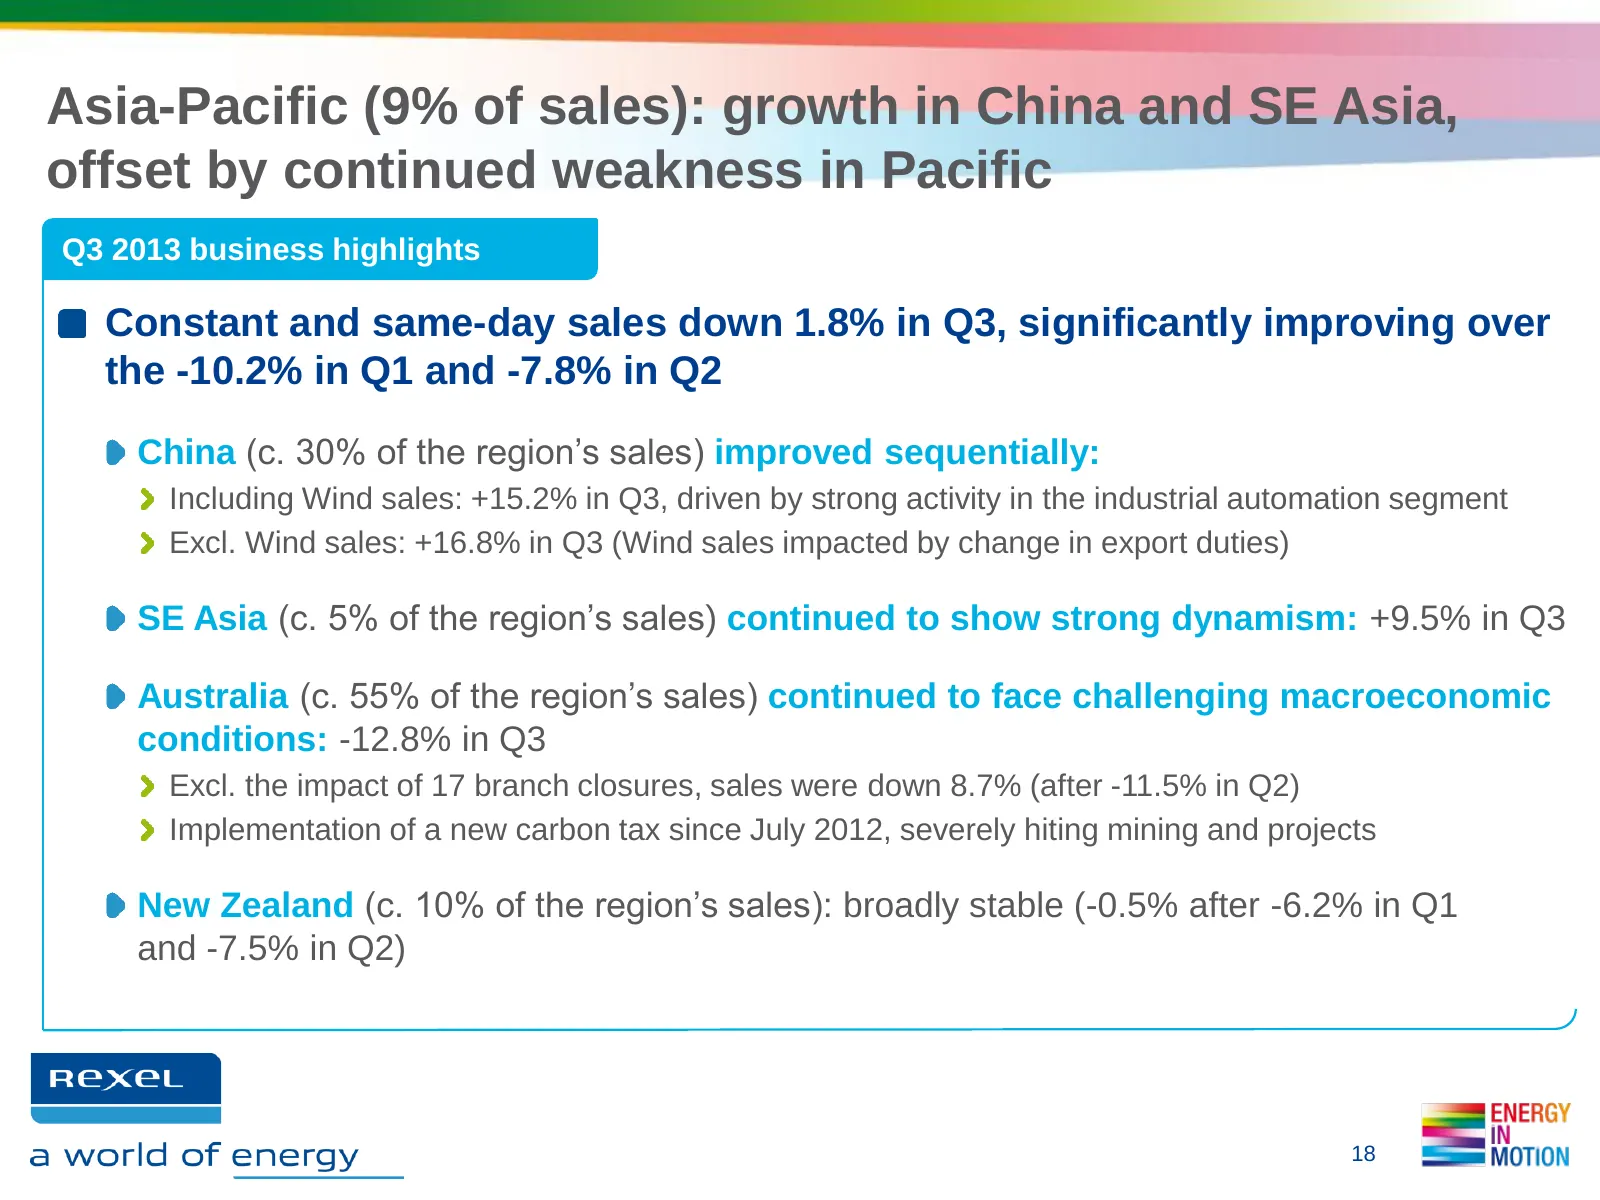
Asia-Pacific (9% of sales): growth in China and SE Asia, offset by continued weakness in Pacific Q3 2013 business highlights Constant and same-day sales down 1.8% in Q3, significantly improving over the -10.2% in Q1 and -7.8% in Q2 China (c. 30% of the region’s sales) improved sequentially: Includin
Slide 19: Latin America: growth in Brazil and Peru
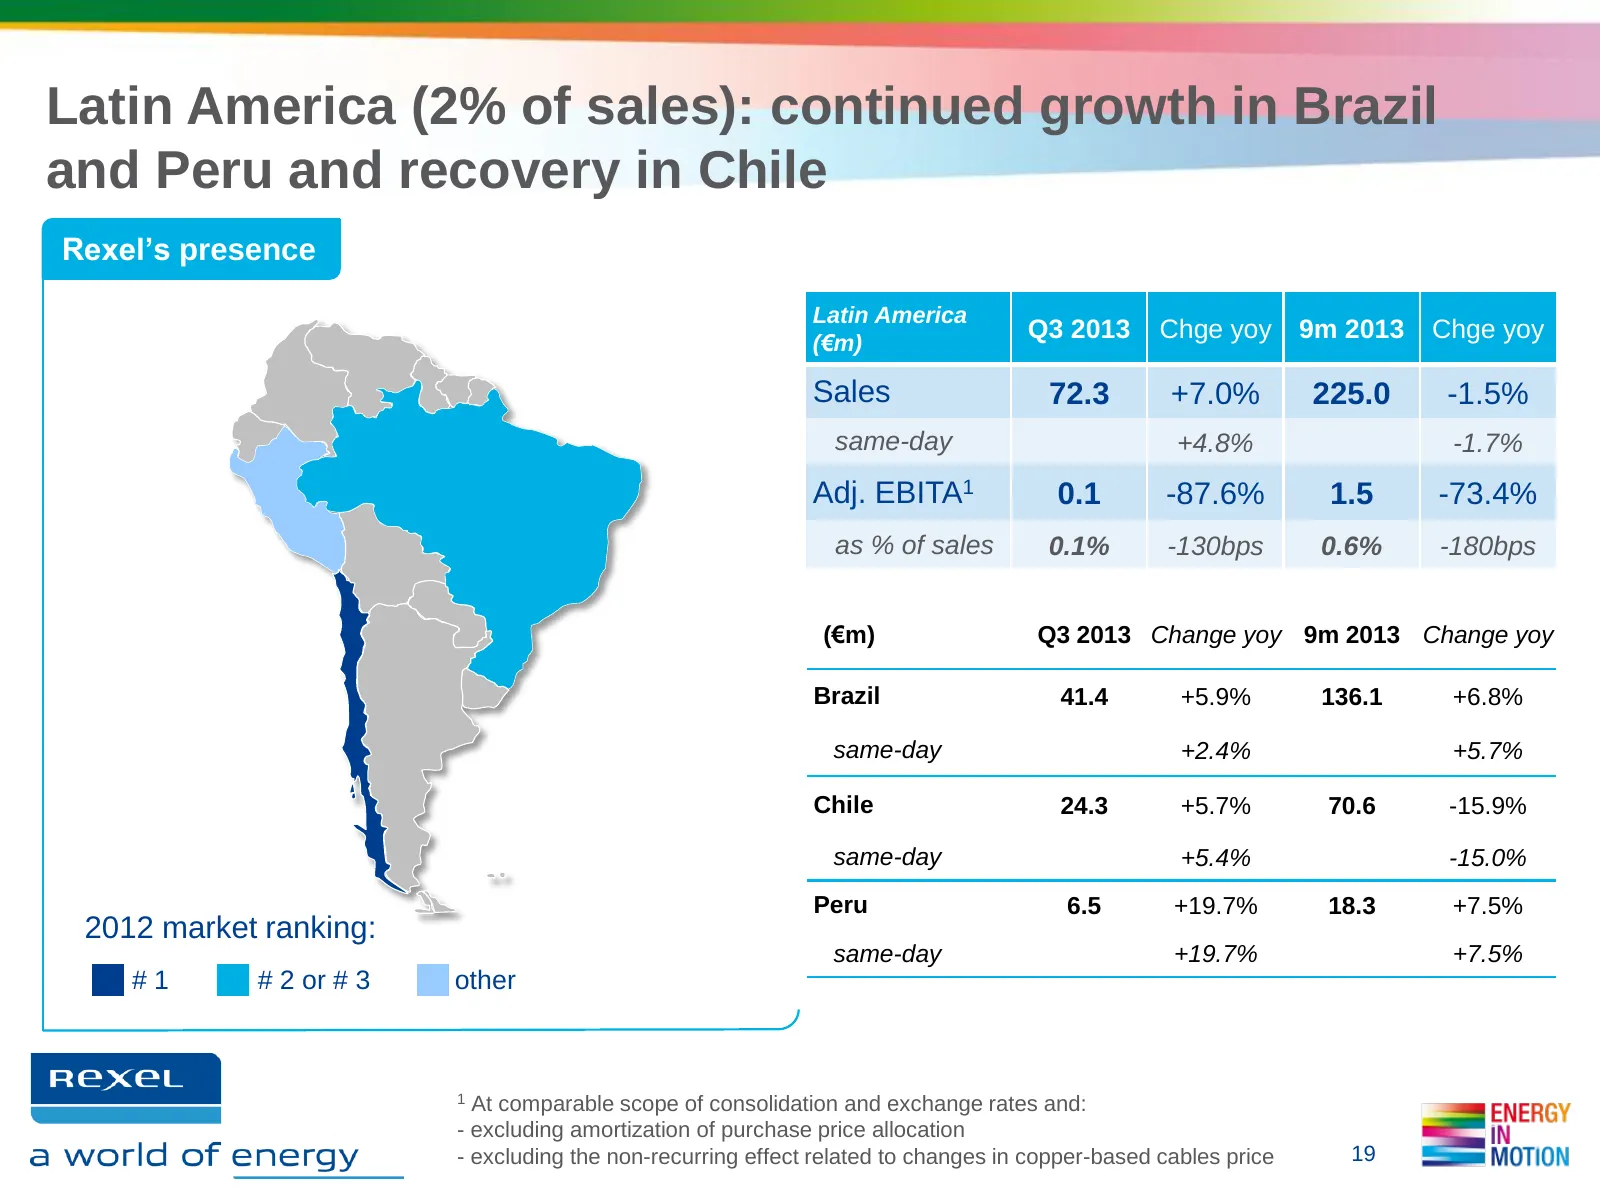
Latin America (2% of sales): continued growth in Brazil and Peru and recovery in Chile Rexel’s presence Latin America (€m) Q3 2013 Chge yoy 9m 2013 Chge yoy Sales 72.3 +7.0% 225.0 -1.5% same-day +4.8% -1.7% Adj. EBITA1 0.1 -87.6% 1.5 -73.4% as % of sales 0.1% -130bps 0.6% -180bps (€m) Q3 2013 Change
Slide 20: Latin America: Q3 2013 business highlights
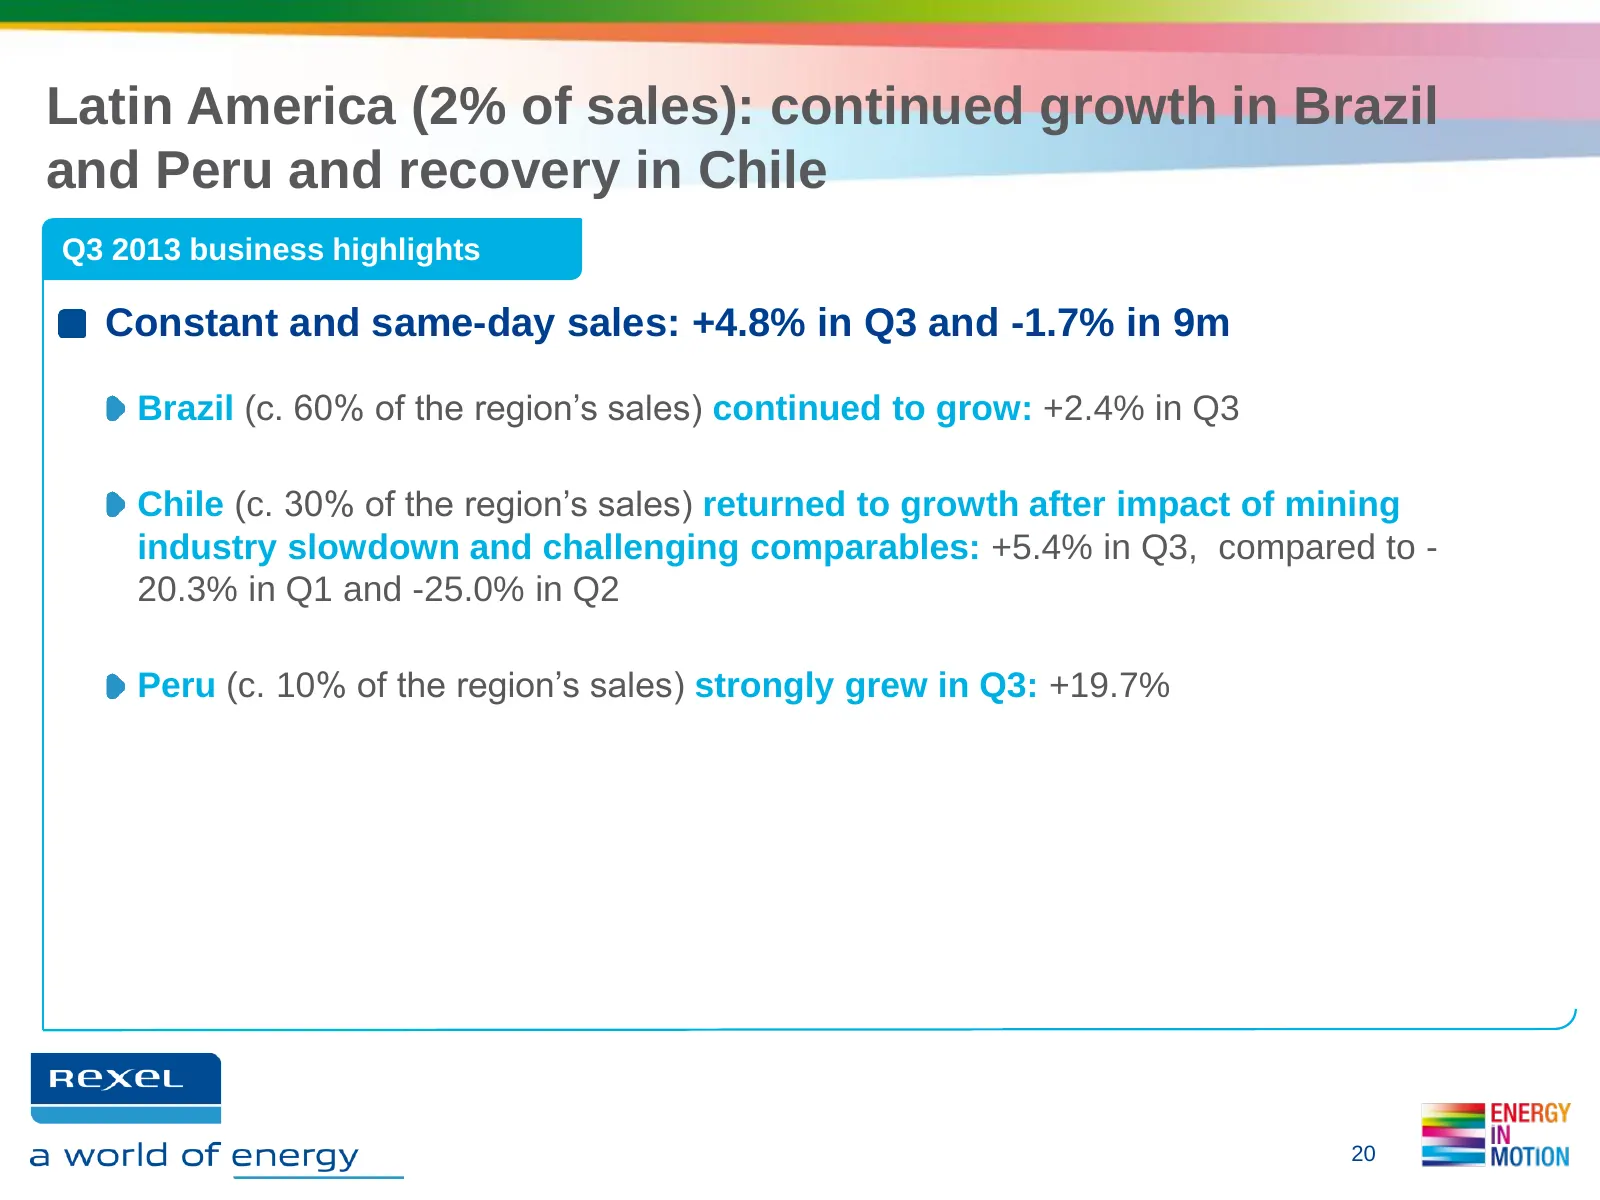
Latin America (2% of sales): continued growth in Brazil and Peru and recovery in Chile Q3 2013 business highlights Constant and same-day sales: +4.8% in Q3 and -1.7% in 9m Brazil (c. 60% of the region’s sales) continued to grow: +2.4% in Q3 Chile (c. 30% of the region’s sales) returned to growth aft
Slide 21: Q3 reported sales impacted by negative currency effect
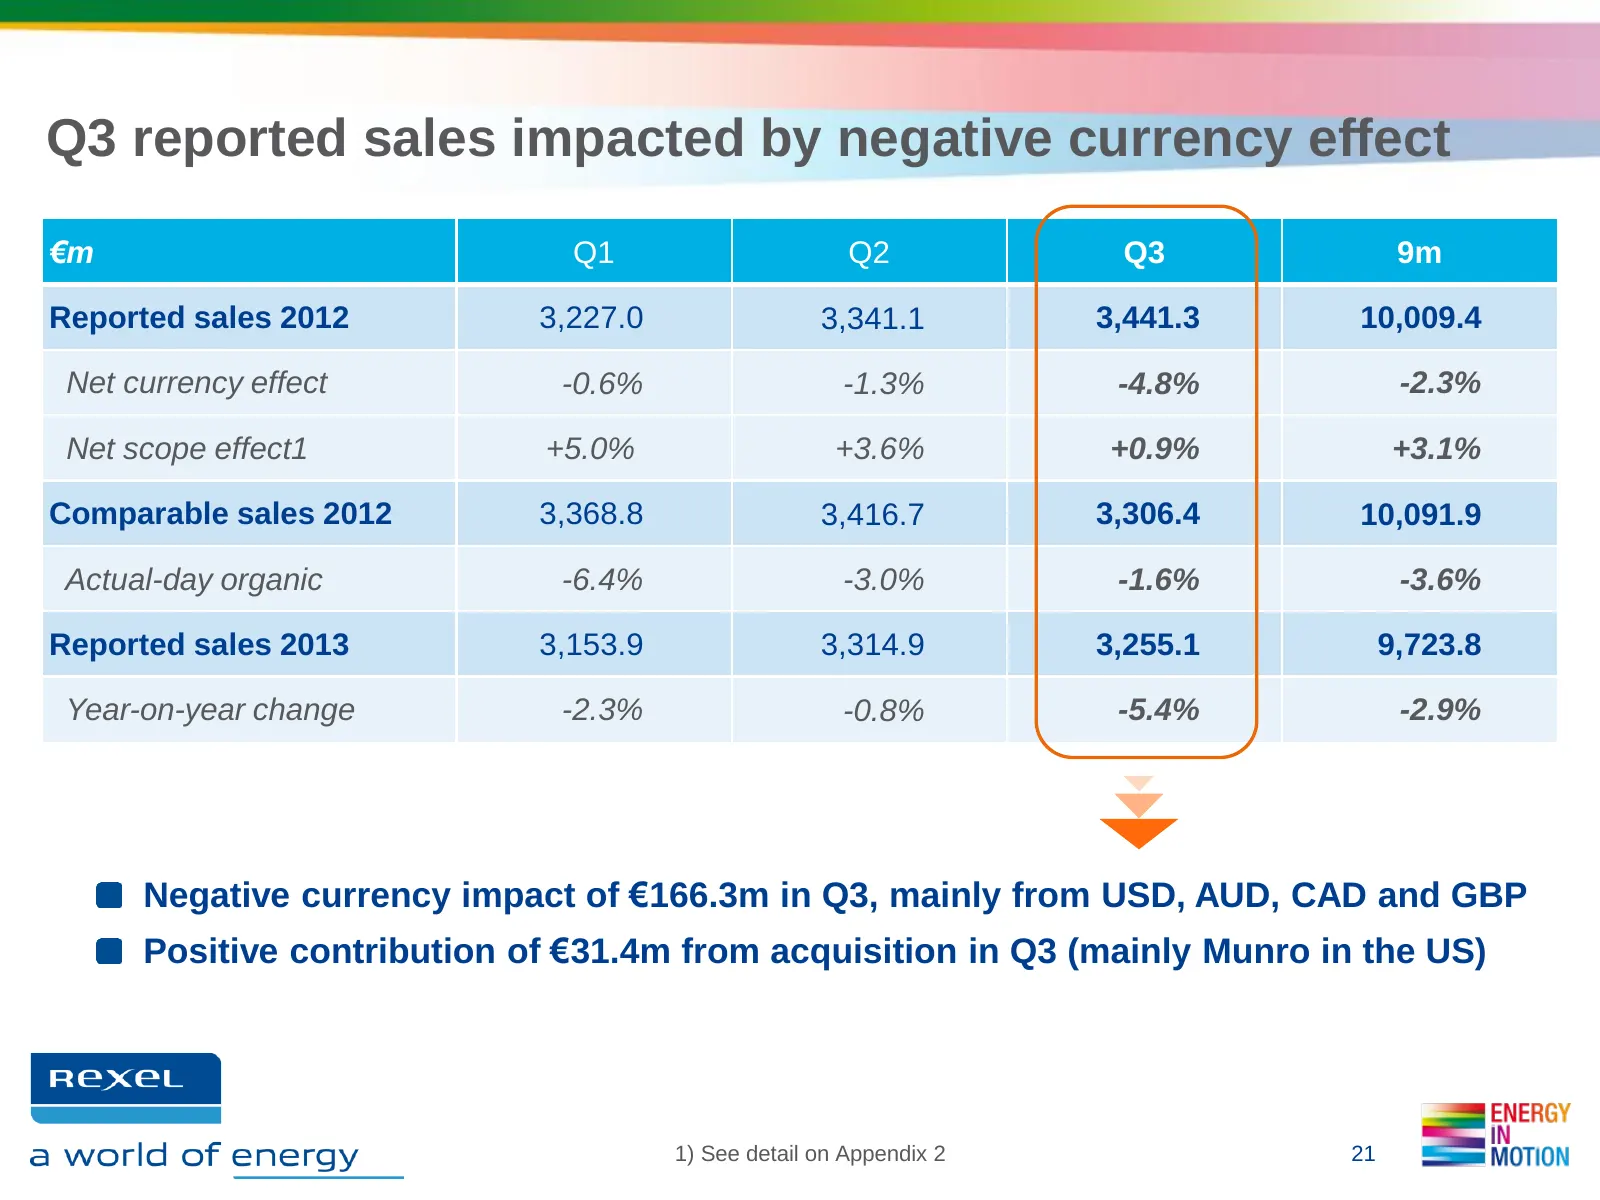
Q3 reported sales impacted by negative currency effect €m Q1 Q2 Q3 9m Reported sales 2012 3,227.0 3,341.1 3,441.3 10,009.4 Net currency effect -0.6% -1.3% -4.8% -2.3% Net scope effect1 +5.0% +3.6% +0.9% +3.1% Comparable sales 2012 3,368.8 3,416.7 3,306.4 10,091.9 Actual-day organic -6.4% -3.0% -1.6%
Slide 22: Continued sequential improvement in sales trends in Q3
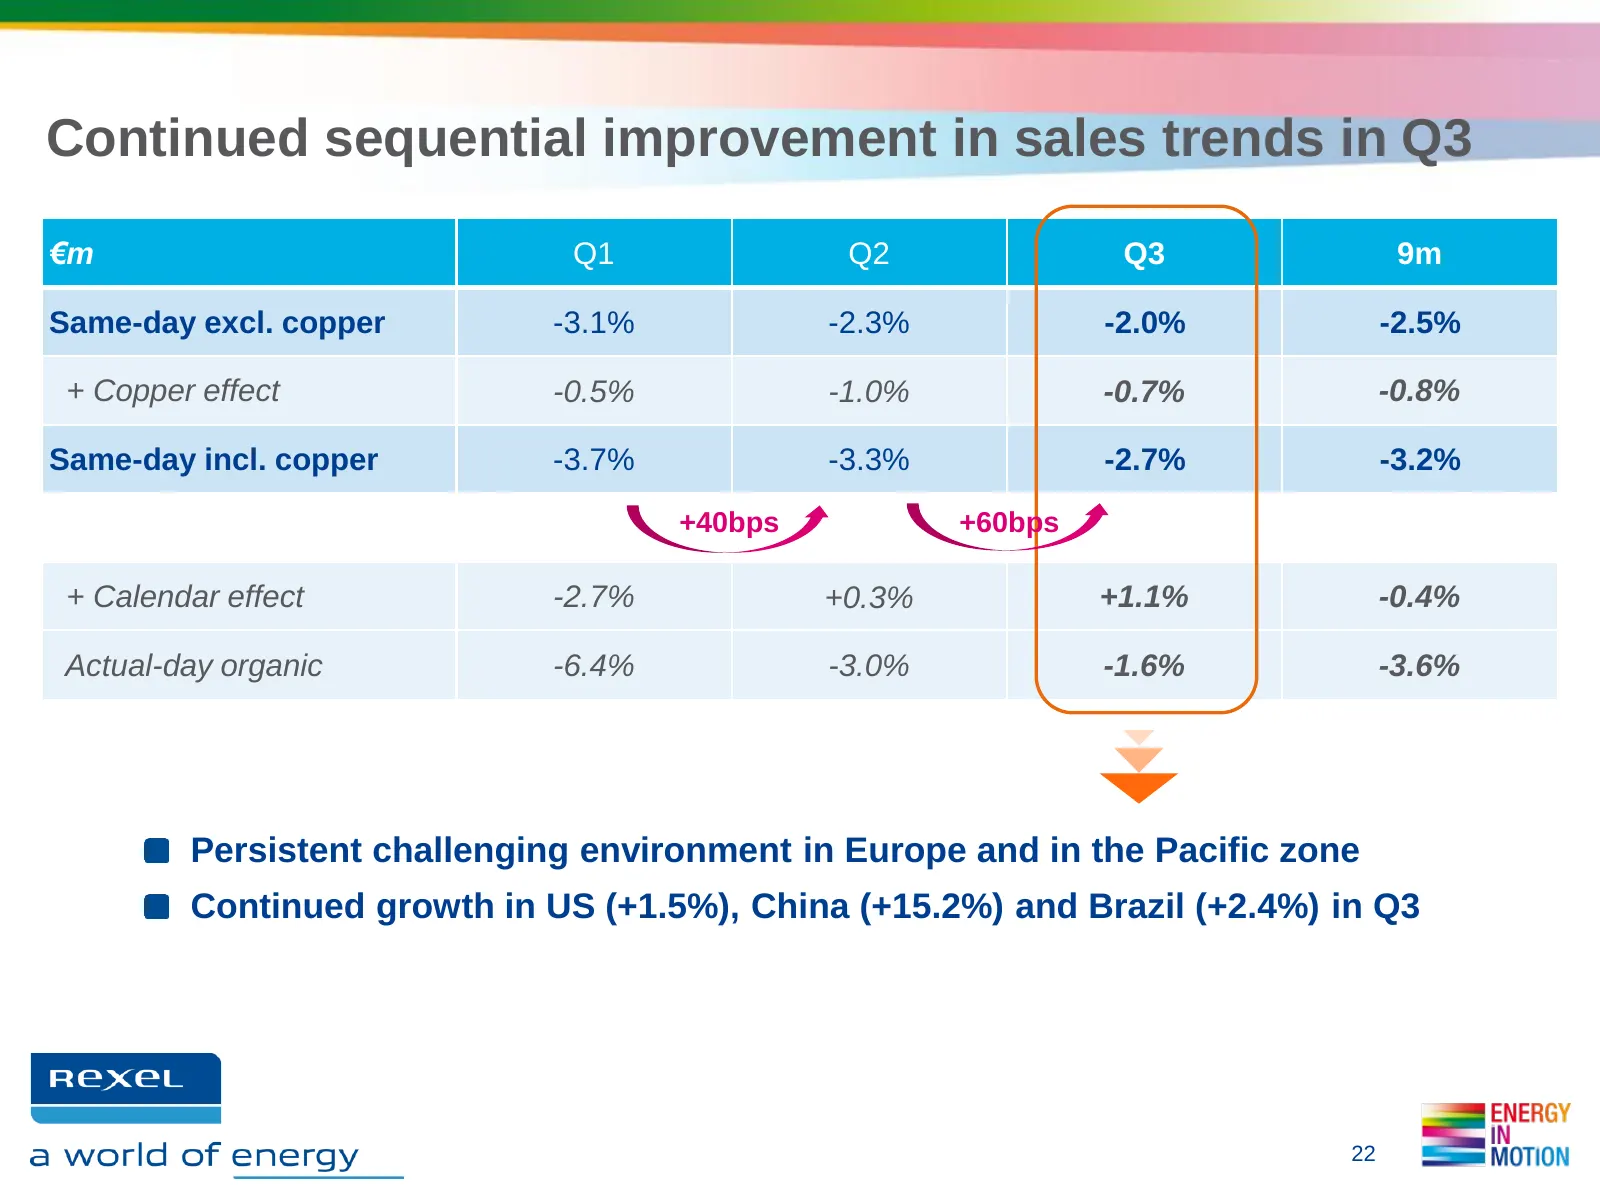
Continued sequential improvement in sales trends in Q3 €m Q1 Q2 Q3 9m Same-day excl. copper -3.1% -2.3% -2.0% -2.5% + Copper effect -0.5% -1.0% -0.7% -0.8% Same-day incl. copper -3.7% -3.3% -2.7% -3.2% +40bps +60bps + Calendar effect -2.7% +0.3% +1.1% -0.4% Actual-day organic -6.4% -3.0% -1.6% -3.6%
Slide 23: Ongoing gross margin discipline
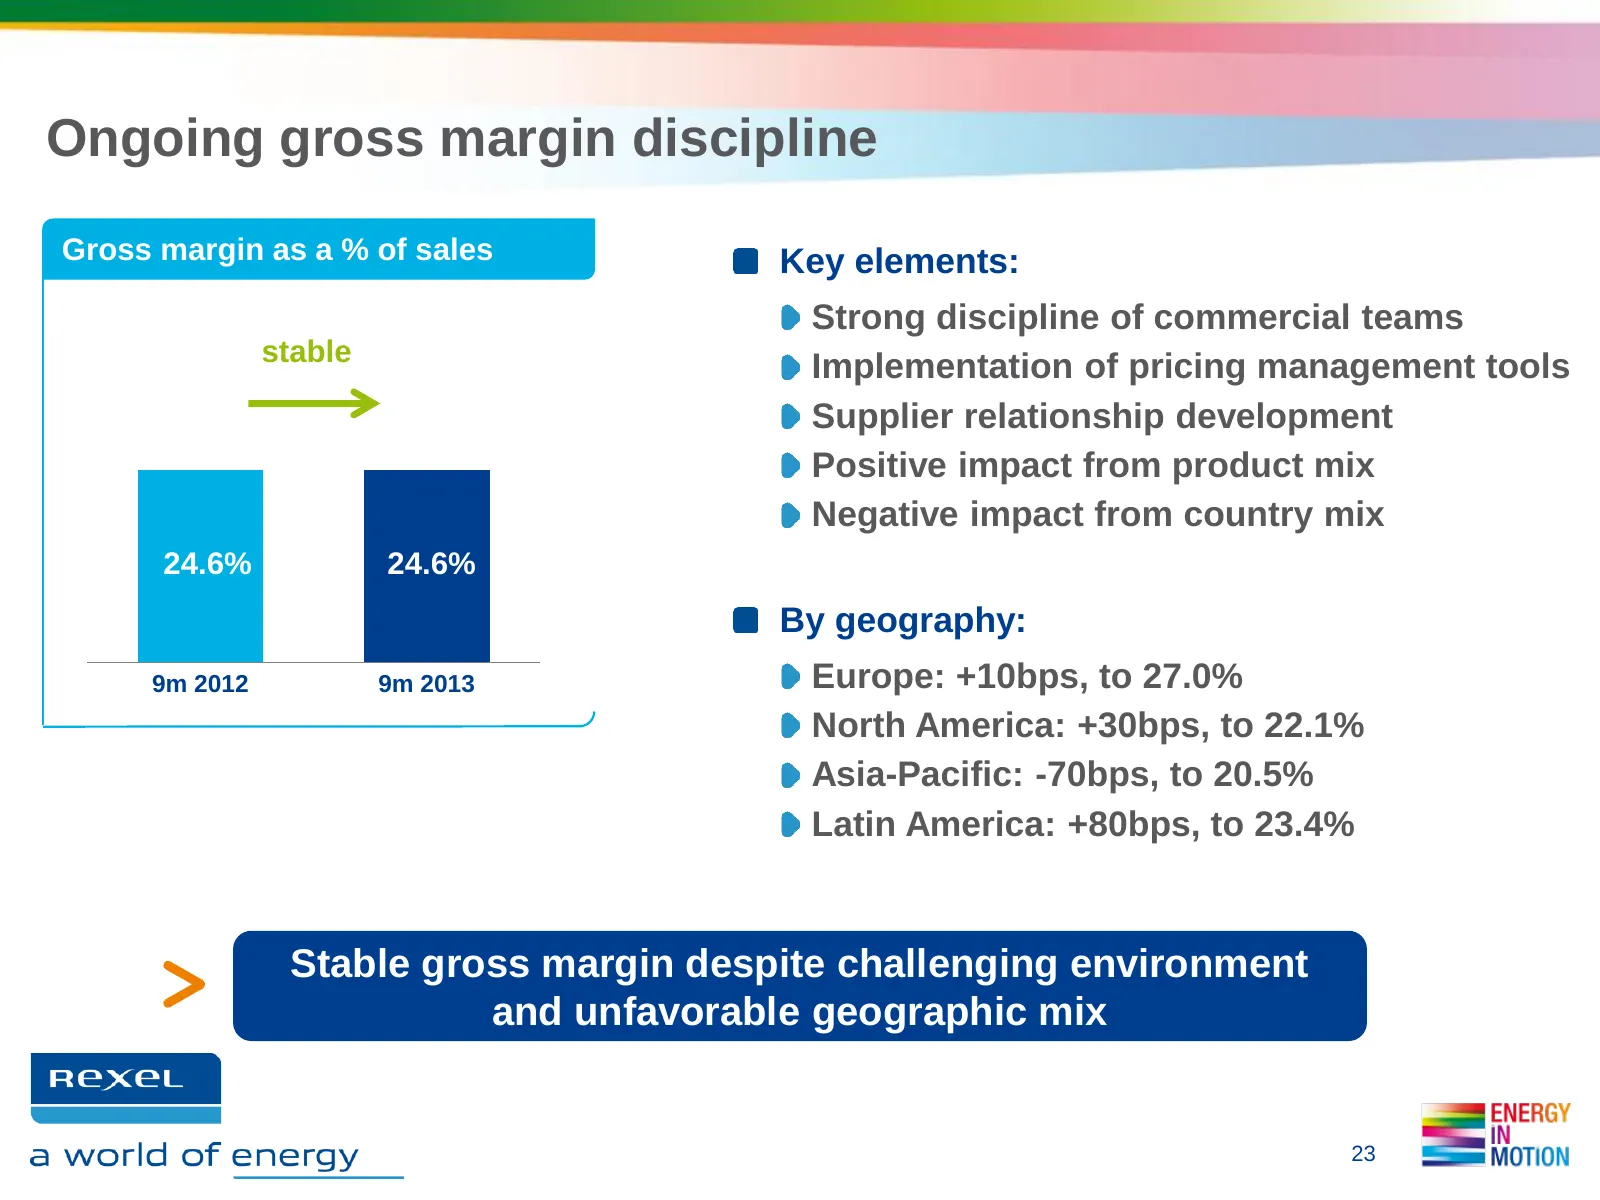
Ongoing gross margin discipline Gross margin as a % of sales Key elements: Strong discipline of commercial teams stable Implementation of pricing management tools Supplier relationship development Positive impact from product mix Negative impact from country mix 24.6% 24.6% By geography: 9m 2012 9m
Slide 24: Solid profitability in Q3
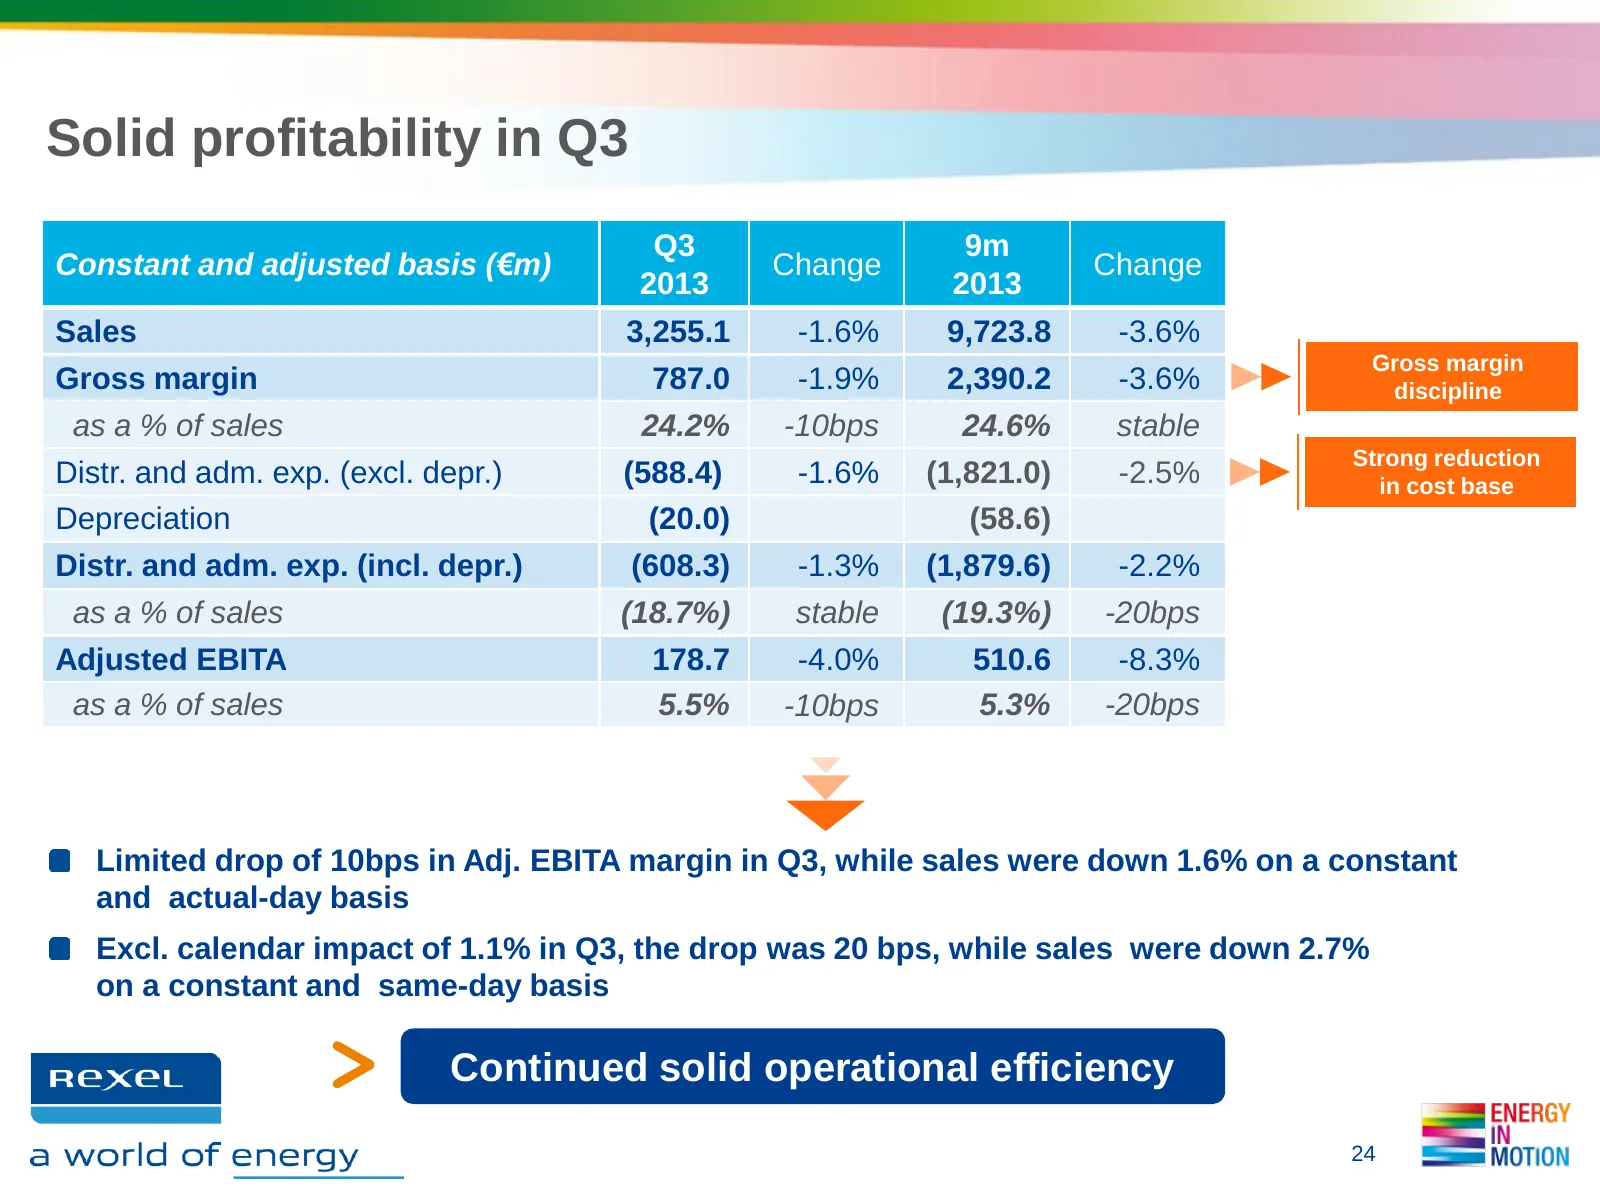
Solid profitability in Q3 Q3 9m Constant and adjusted basis (€m) Change Change 2013 2013 Sales 3,255.1 -1.6% 9,723.8 -3.6% Gross margin Gross margin 787.0 -1.9% 2,390.2 -3.6% discipline as a % of sales 24.2% -10bps 24.6% stable Strong reduction Distr. and adm. exp. (excl. depr.) (588.4) -1.6% (1,821
Slide 25: Net income impacted by refinancing cost and impairment
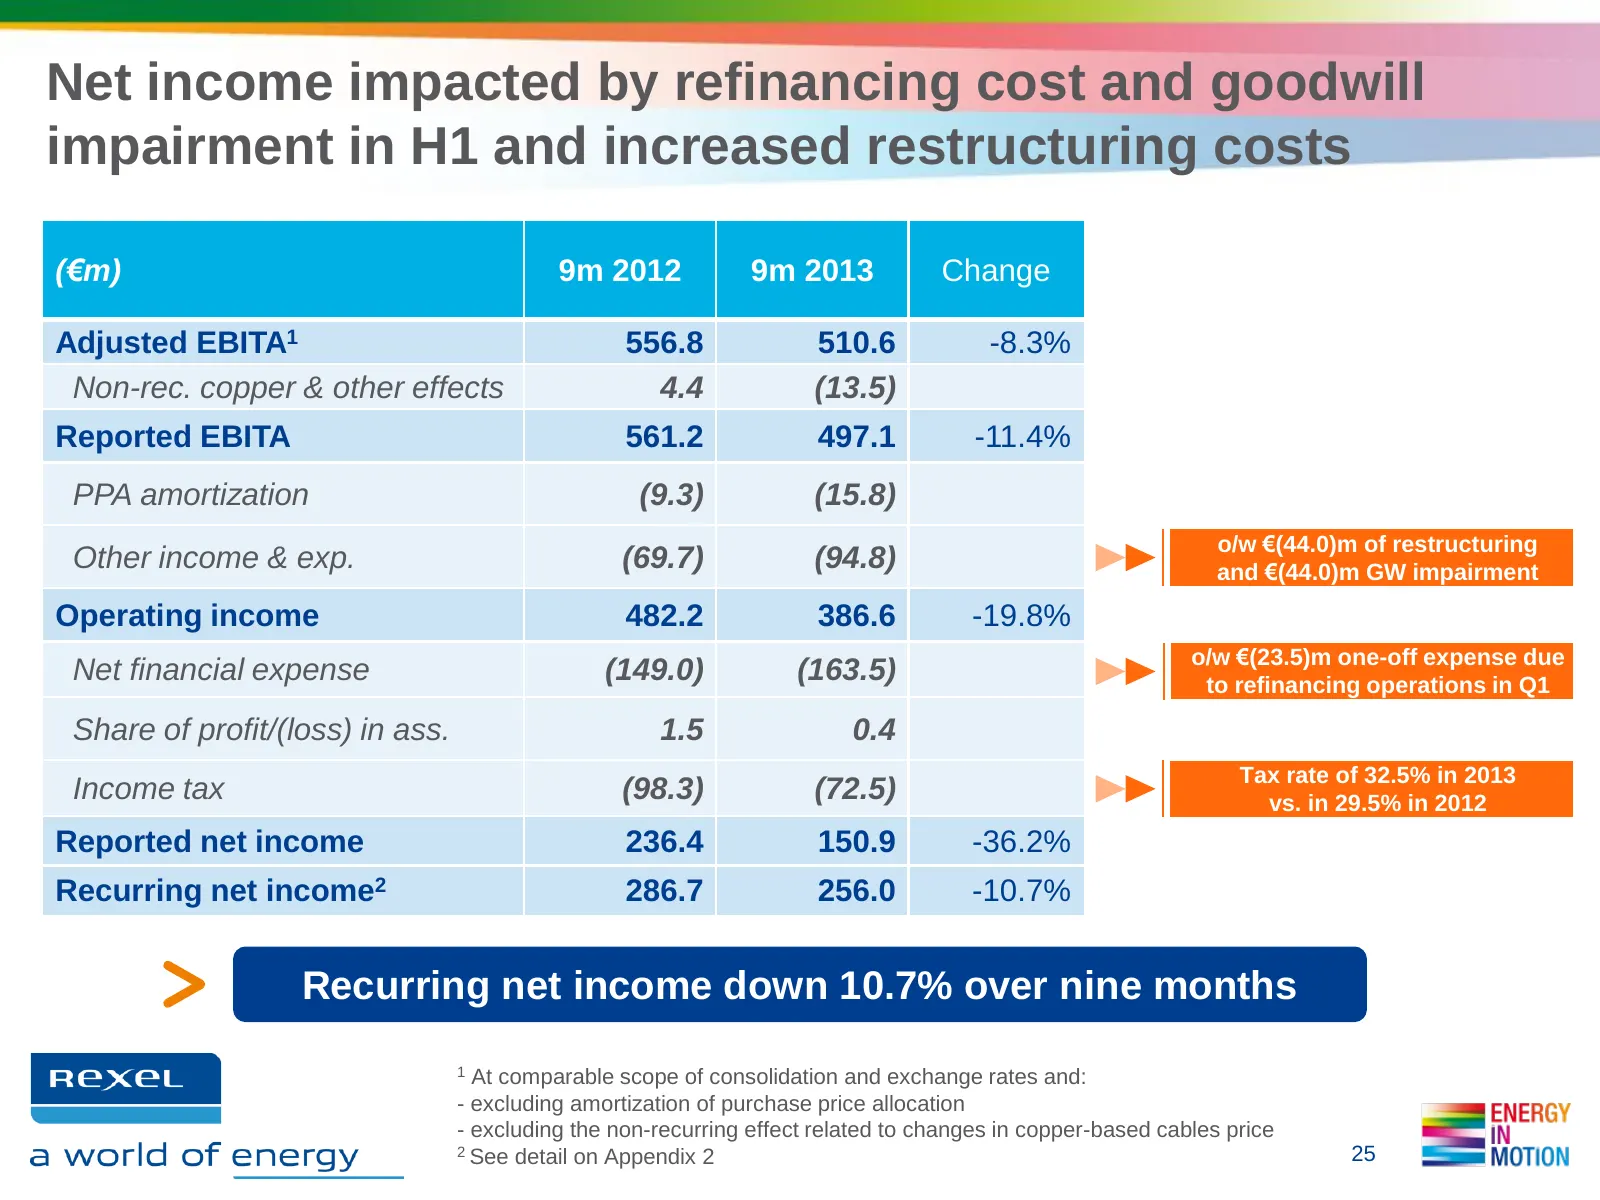
Net income impacted by refinancing cost and goodwill impairment in H1 and increased restructuring costs (€m) 9m 2012 9m 2013 Change Adjusted EBITA1 556.8 510.6 -8.3% Non-rec. copper & other effects 4.4 (13.5) Reported EBITA 561.2 497.1 -11.4% PPA amortization (9.3) (15.8) o/w €(44.0)m of restructuri
Slide 26: Solid generation of FCF before interest and tax
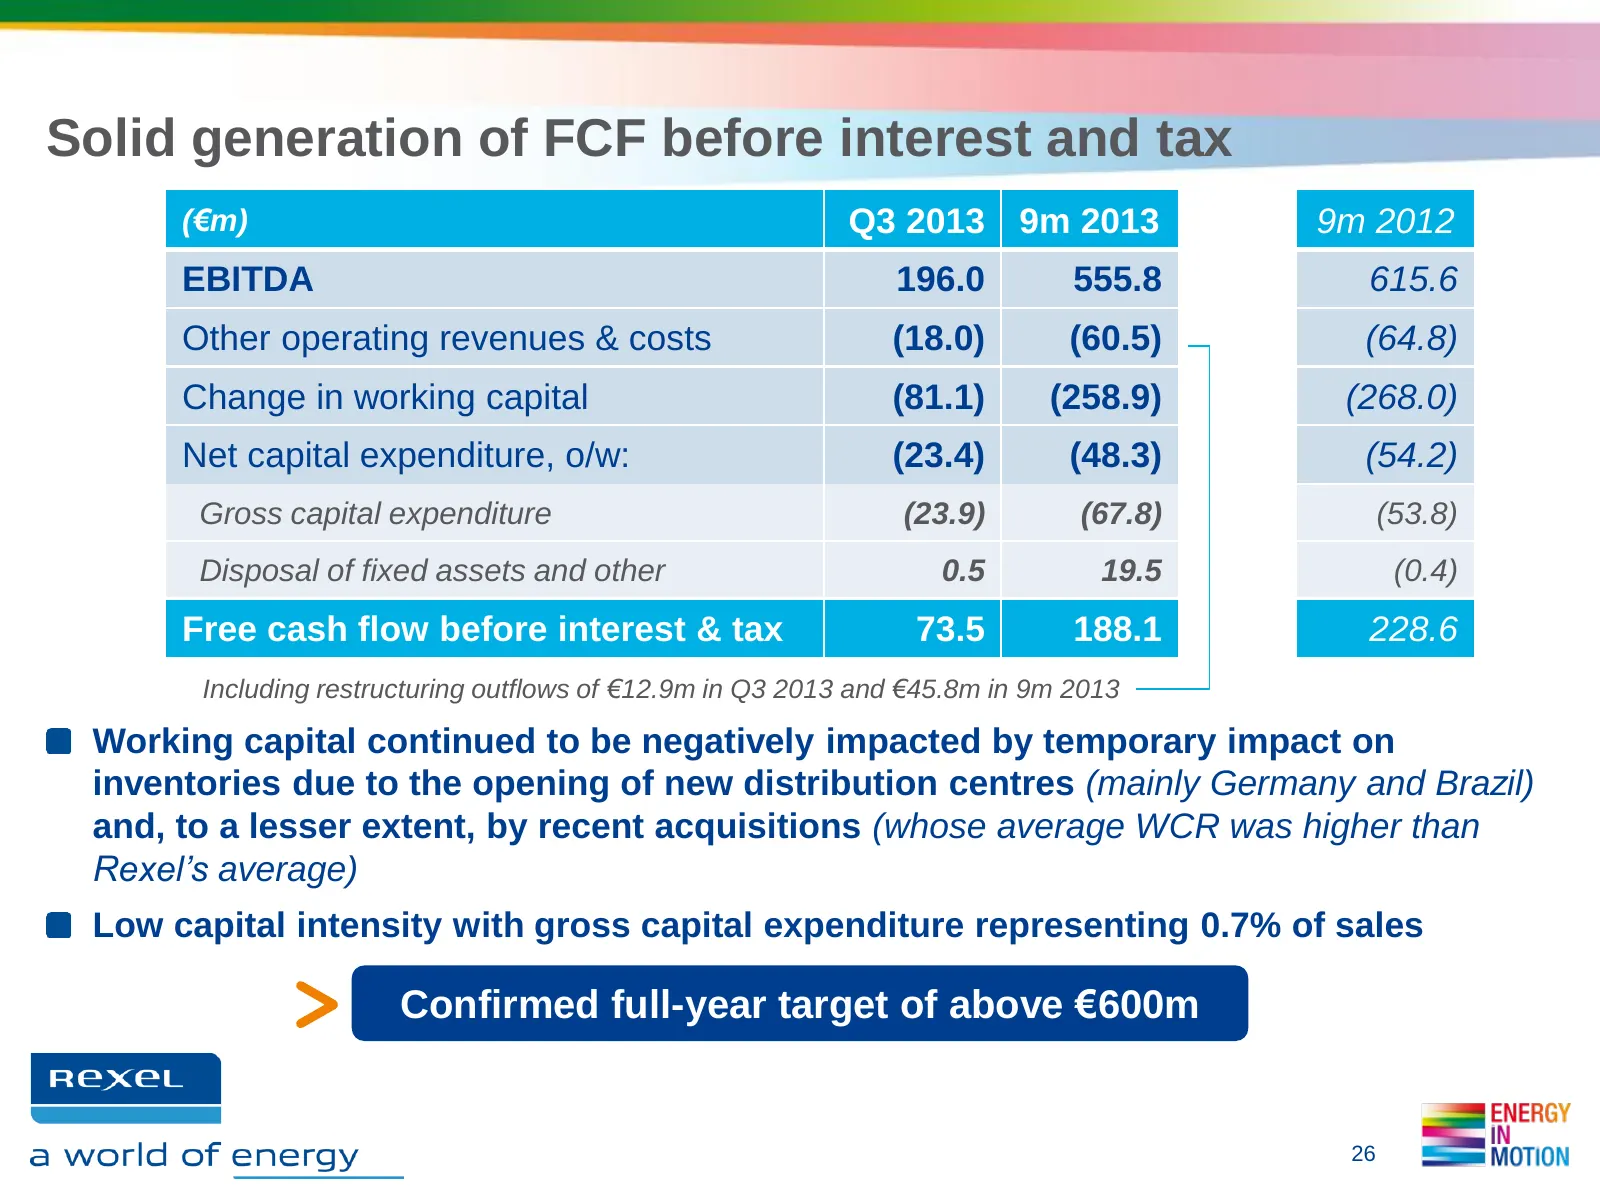
Solid generation of FCF before interest and tax (€m) Q3 2013 9m 2013 9m 2012 EBITDA 196.0 555.8 615.6 Other operating revenues & costs (18.0) (60.5) (64.8) Change in working capital (81.1) (258.9) (268.0) Net capital expenditure, o/w: (23.4) (48.3) (54.2) Gross capital expenditure (23.9) (67.8) (53.
Slide 27: Net debt reduced by €130m over the last 12 months
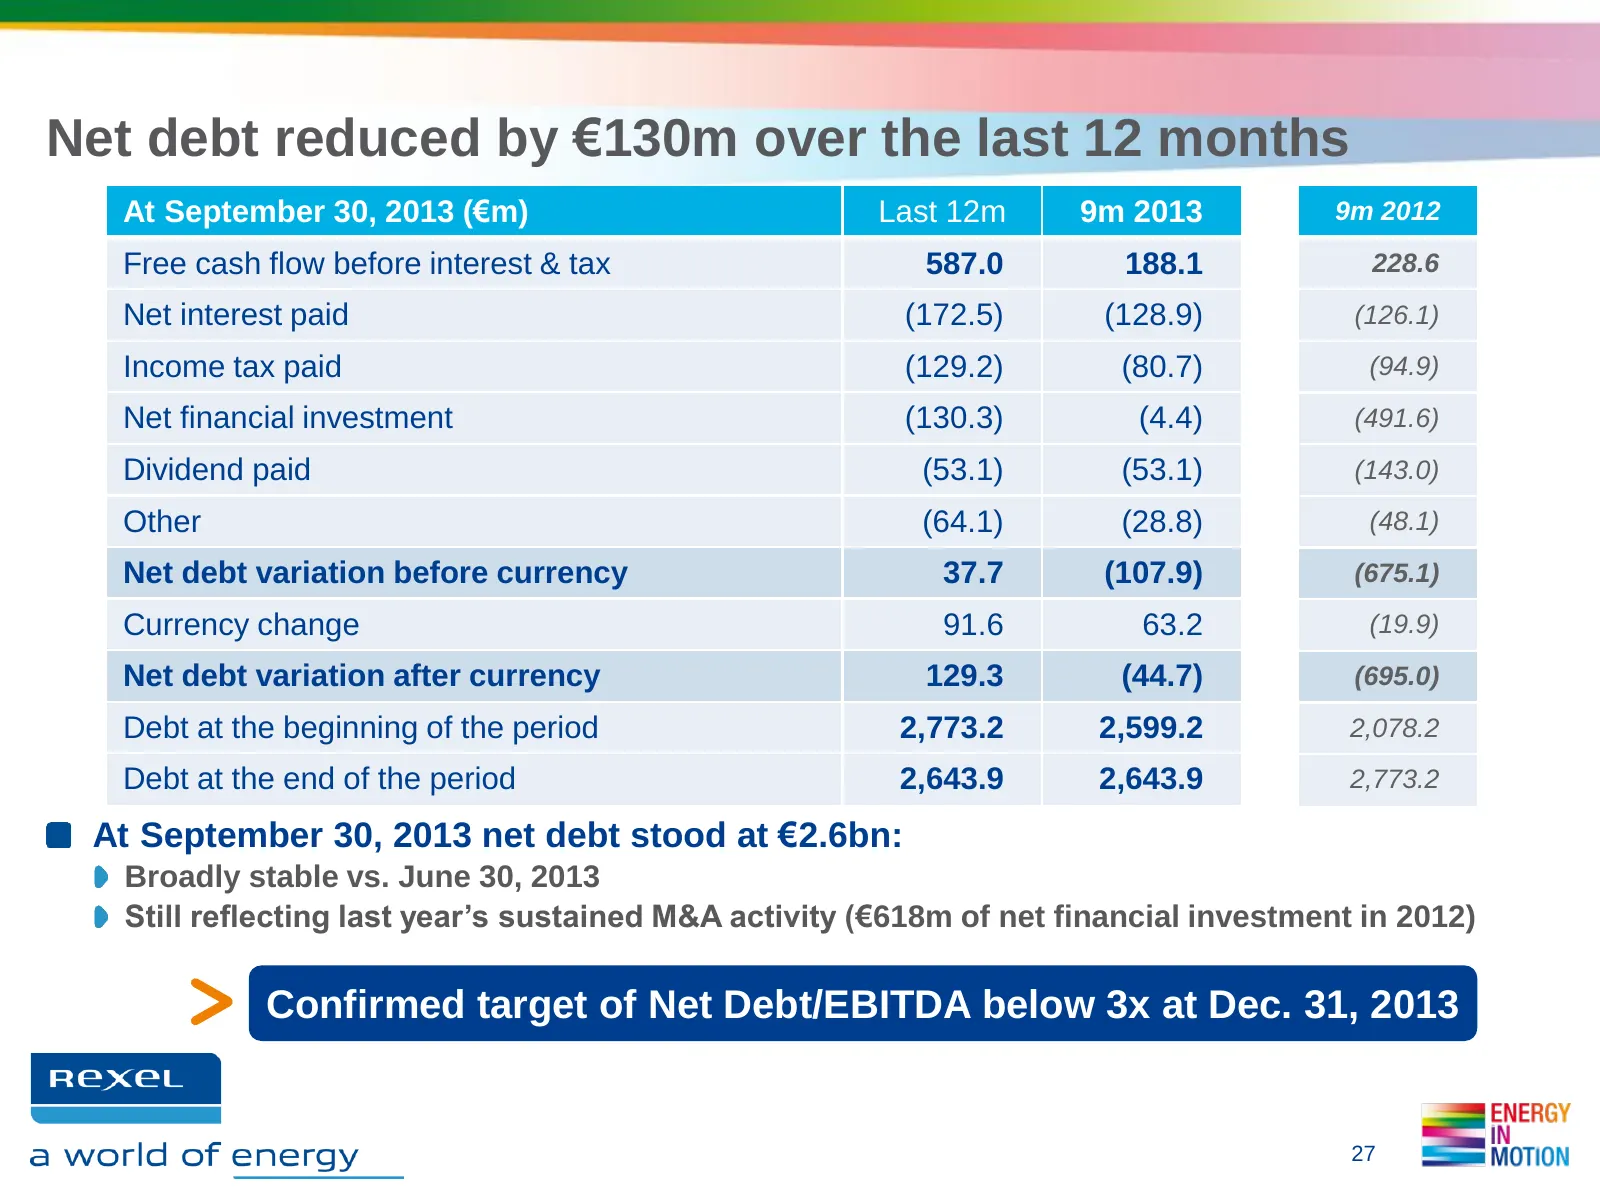
Net debt reduced by €130m over the last 12 months At September 30, 2013 (€m) Last 12m 9m 2013 9m 2012 Free cash flow before interest & tax 587.0 188.1 228.6 Net interest paid (172.5) (128.9) (126.1) Income tax paid (129.2) (80.7) (94.9) Net financial investment (130.3) (4.4) (491.6) Dividend paid (5
Slide 28: Sound financial structure
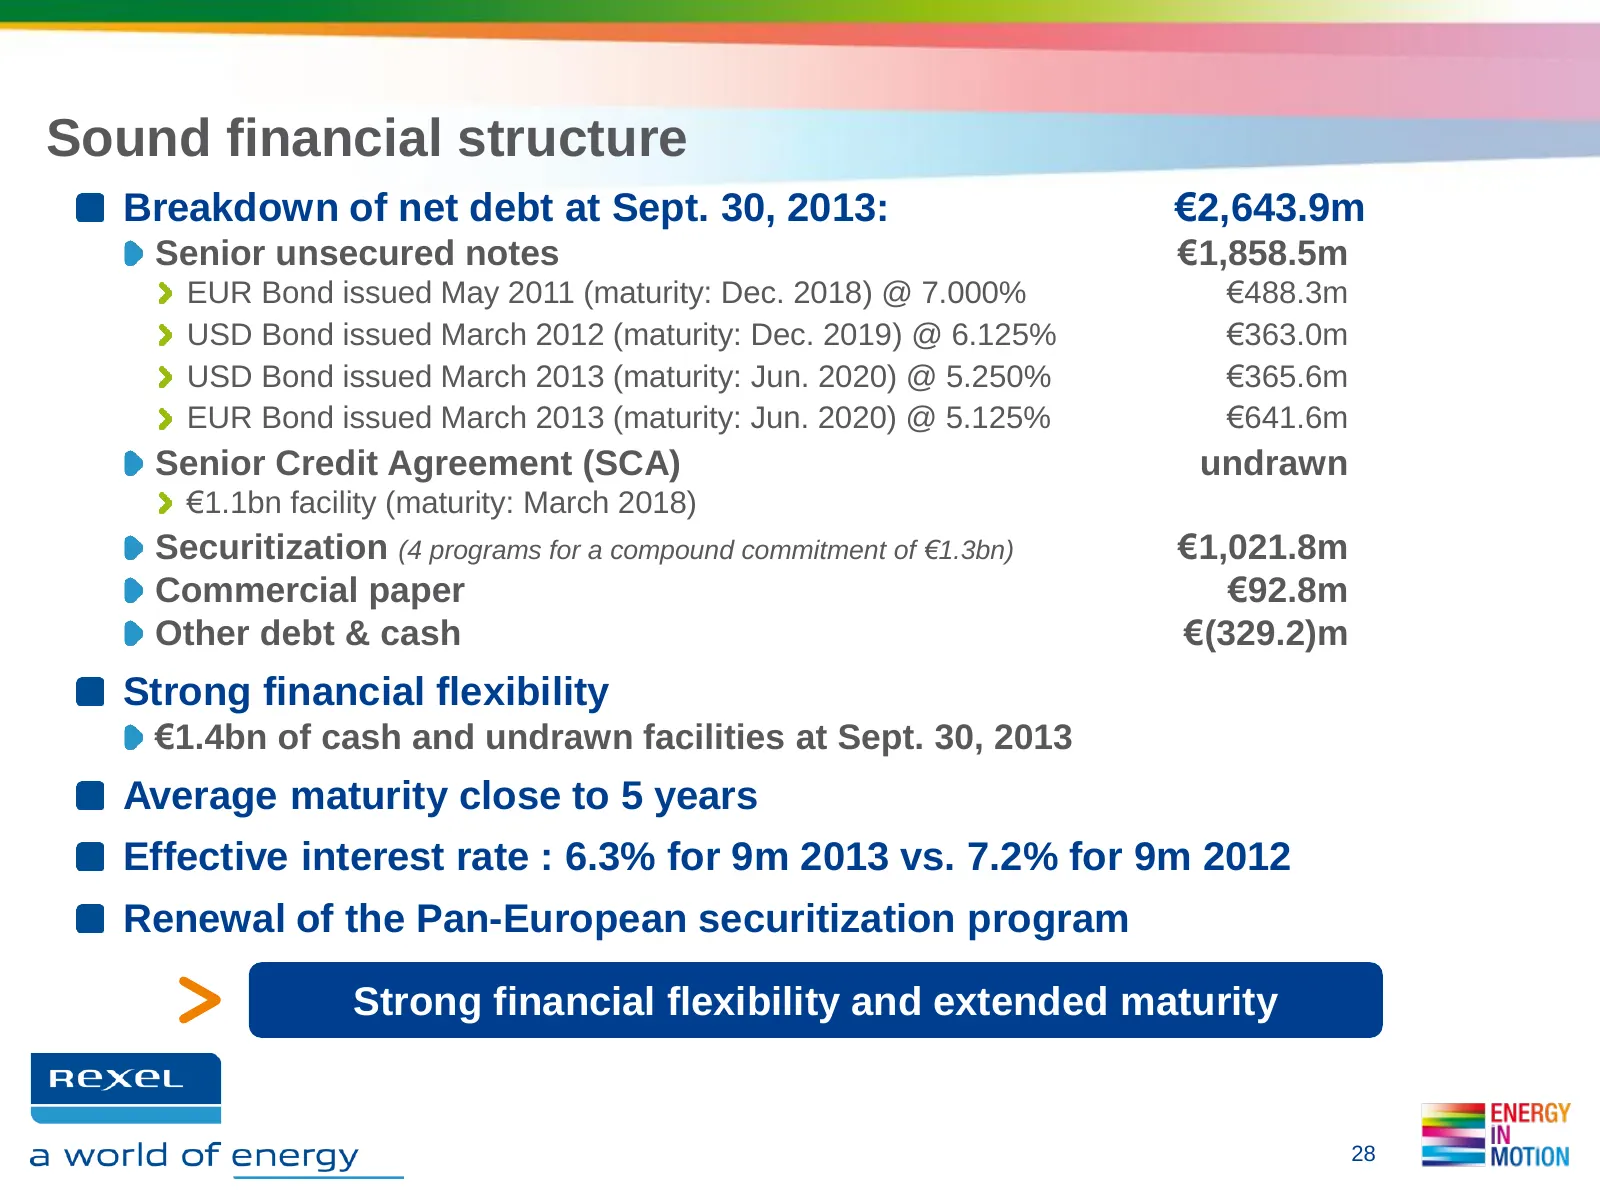
Sound financial structure Breakdown of net debt at Sept. 30, 2013: €2,643.9m Senior unsecured notes €1,858.5m EUR Bond issued May 2011 (maturity: Dec. 2018) @ 7.000% €488.3m USD Bond issued March 2012 (maturity: Dec. 2019) @ 6.125% €363.0m USD Bond issued March 2013 (maturity: Jun. 2020) @ 5.250% €3
Slide 29: Full-year 2013 outlook confirmed
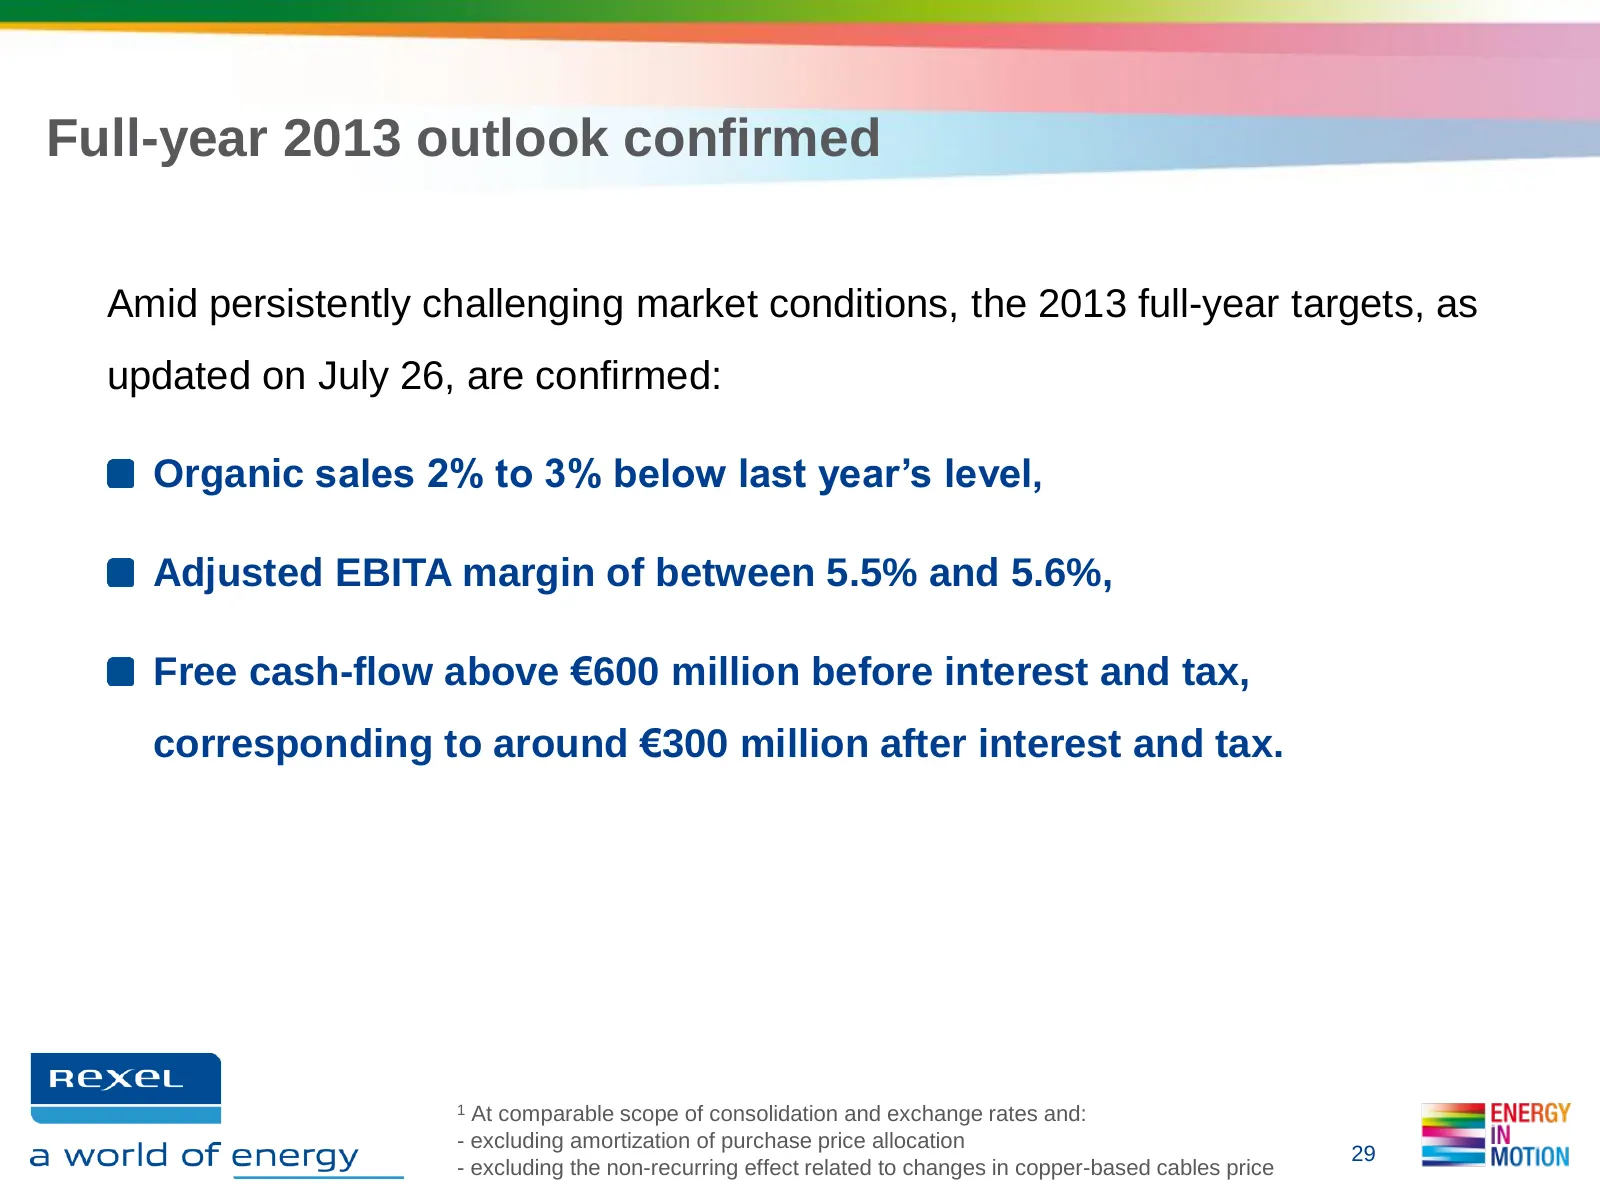
Full-year 2013 outlook confirmed Amid persistently challenging market conditions, the 2013 full-year targets, as updated on July 26, are confirmed: Organic sales 2% to 3% below last year’s level, Adjusted EBITA margin of between 5.5% and 5.6%, Free cash-flow above €600 million before interest and ta
Slide 30: 4. Appendices to the Q3 & 9M Results
4. APPENDICES TO THE Q3 & 9M RESULTS
Slide 31: Segment reporting - Group
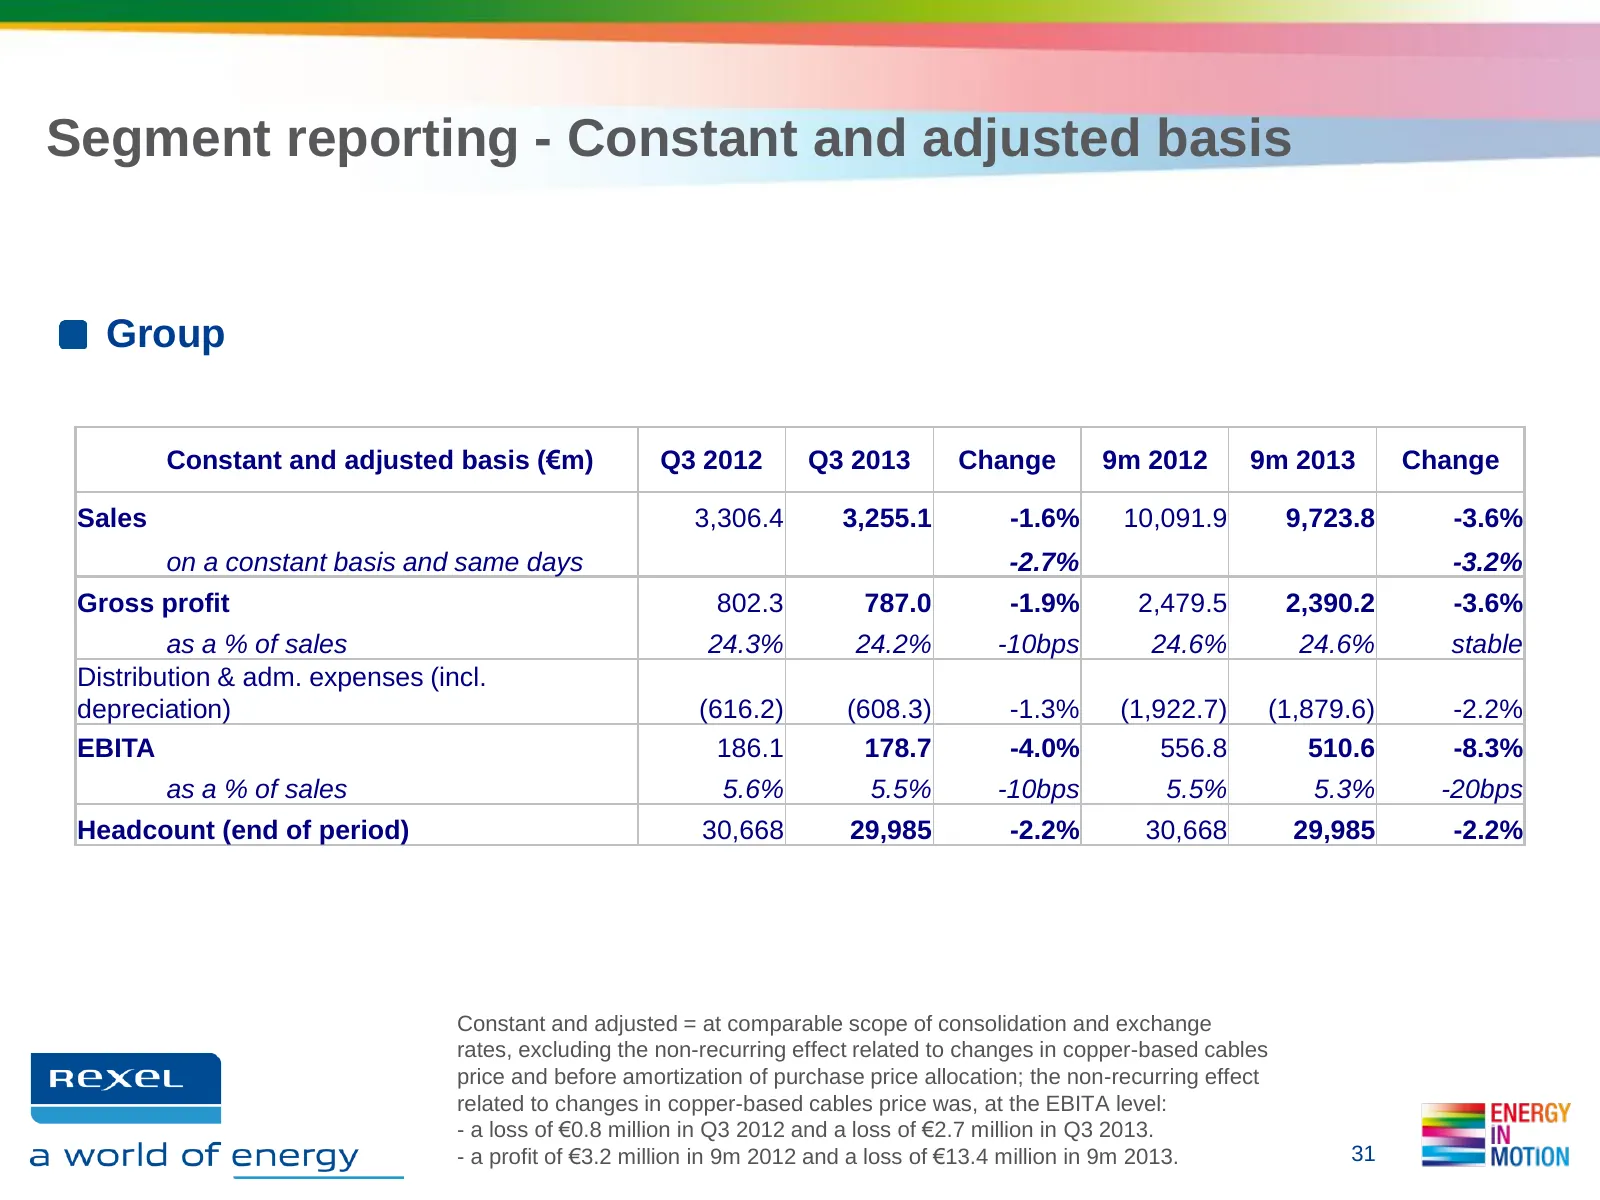
Segment reporting - Constant and adjusted basis Group Constant and adjusted basis (€m) Q3 2012 Q3 2013 Change 9m 2012 9m 2013 Change Sales 3,306.4 3,255.1 -1.6% 10,091.9 9,723.8 -3.6% on a constant basis and same days -2.7% -3.2% Gross profit 802.3 787.0 -1.9% 2,479.5 2,390.2 -3.6% as a % of sales 2
Slide 32: Segment reporting - Europe
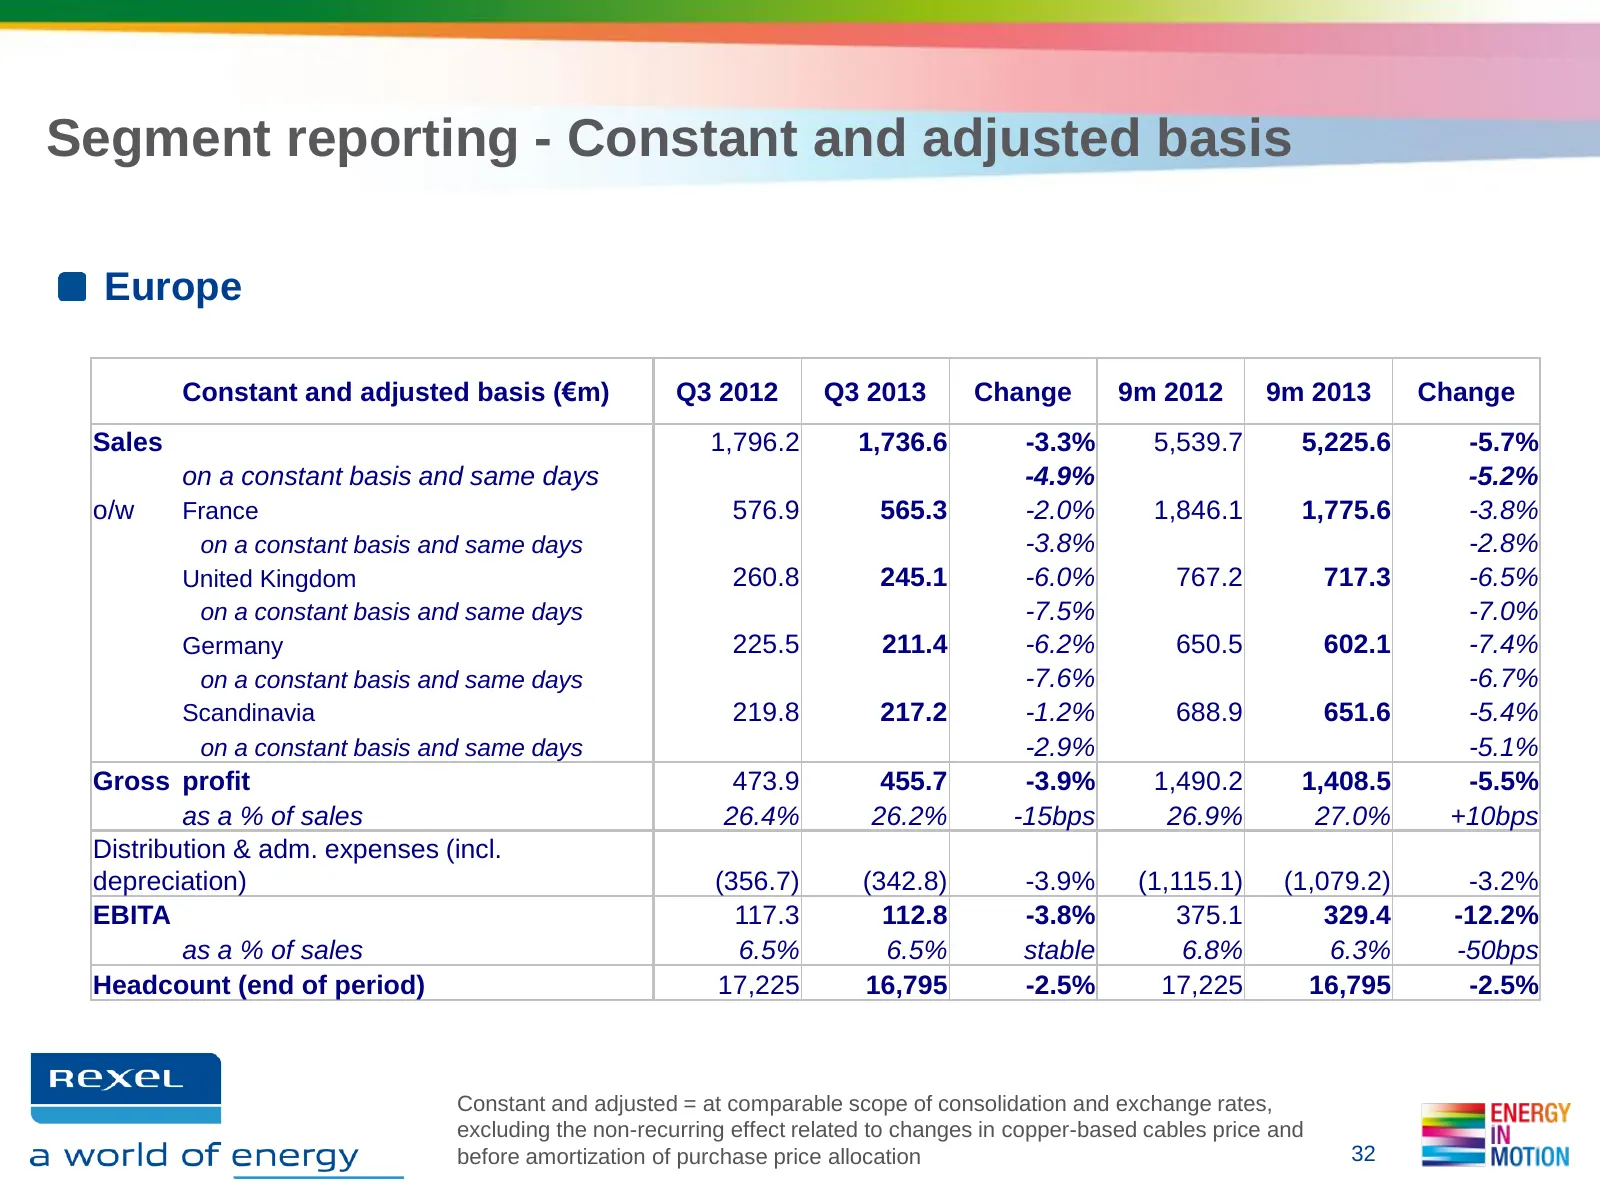
Segment reporting - Constant and adjusted basis Europe Constant and adjusted basis (€m) Q3 2012 Q3 2013 Change 9m 2012 9m 2013 Change Sales 1,796.2 1,736.6 -3.3% 5,539.7 5,225.6 -5.7% on a constant basis and same days -4.9% -5.2% o/w France 576.9 565.3 -2.0% 1,846.1 1,775.6 -3.8% on a constant basis
Slide 33: Segment reporting - North America
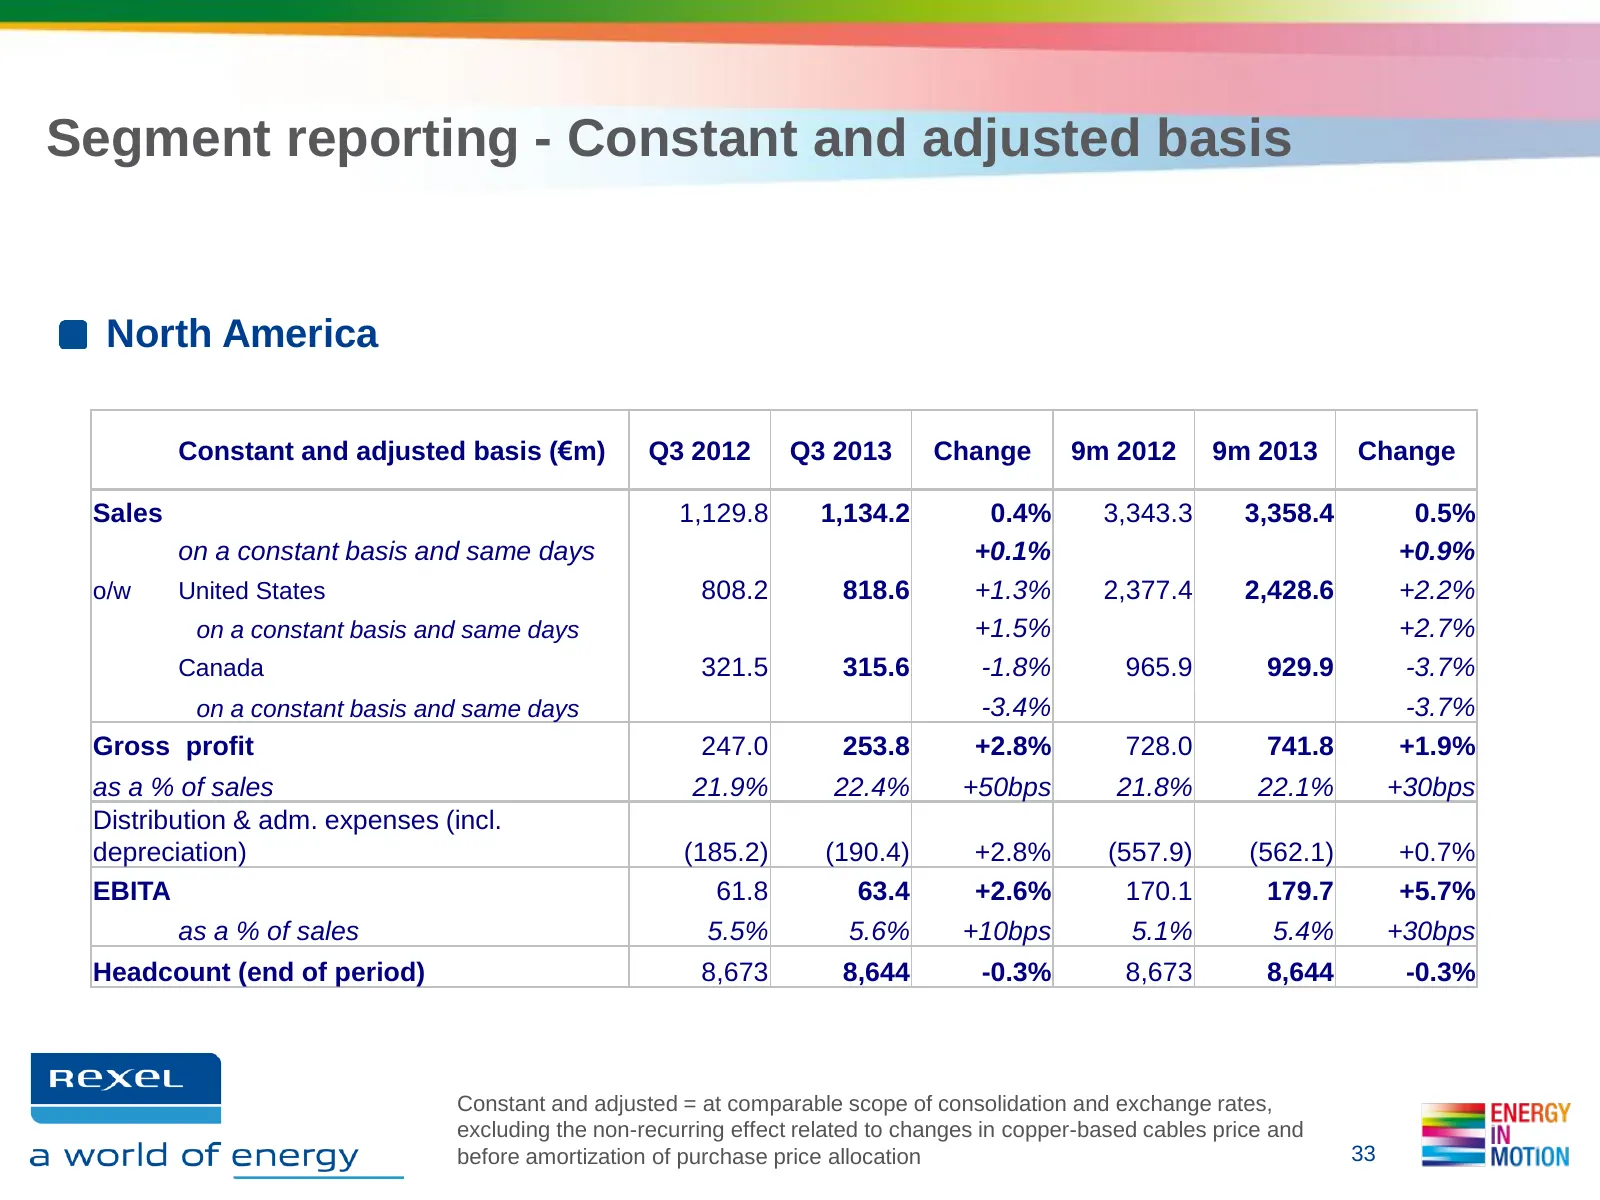
Segment reporting - Constant and adjusted basis North America Constant and adjusted basis (€m) Q3 2012 Q3 2013 Change 9m 2012 9m 2013 Change Sales 1,129.8 1,134.2 0.4% 3,343.3 3,358.4 0.5% on a constant basis and same days +0.1% +0.9% o/w United States 808.2 818.6 +1.3% 2,377.4 2,428.6 +2.2% on a co
Slide 34: Segment reporting - Asia-Pacific
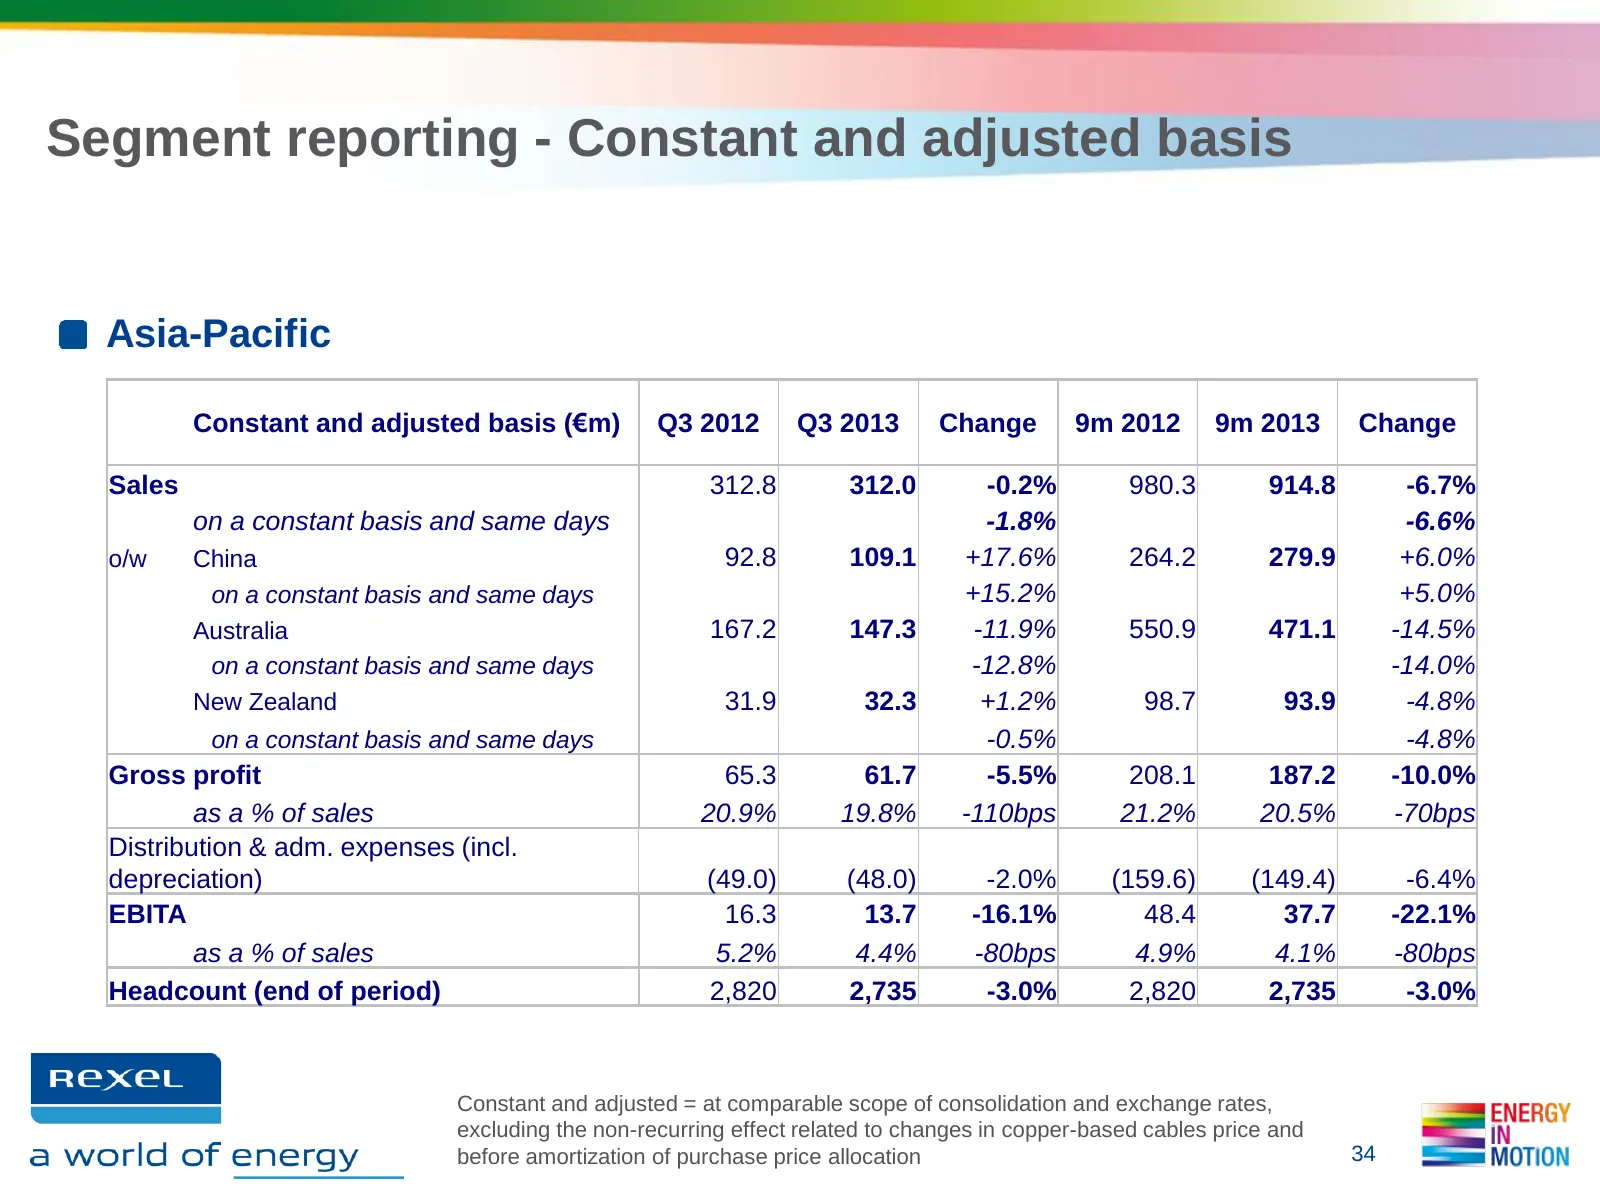
Segment reporting - Constant and adjusted basis Asia-Pacific Constant and adjusted basis (€m) Q3 2012 Q3 2013 Change 9m 2012 9m 2013 Change Sales 312.8 312.0 -0.2% 980.3 914.8 -6.7% on a constant basis and same days -1.8% -6.6% o/w China 92.8 109.1 +17.6% 264.2 279.9 +6.0% on a constant basis and sa
Slide 35: Segment reporting - Latin America
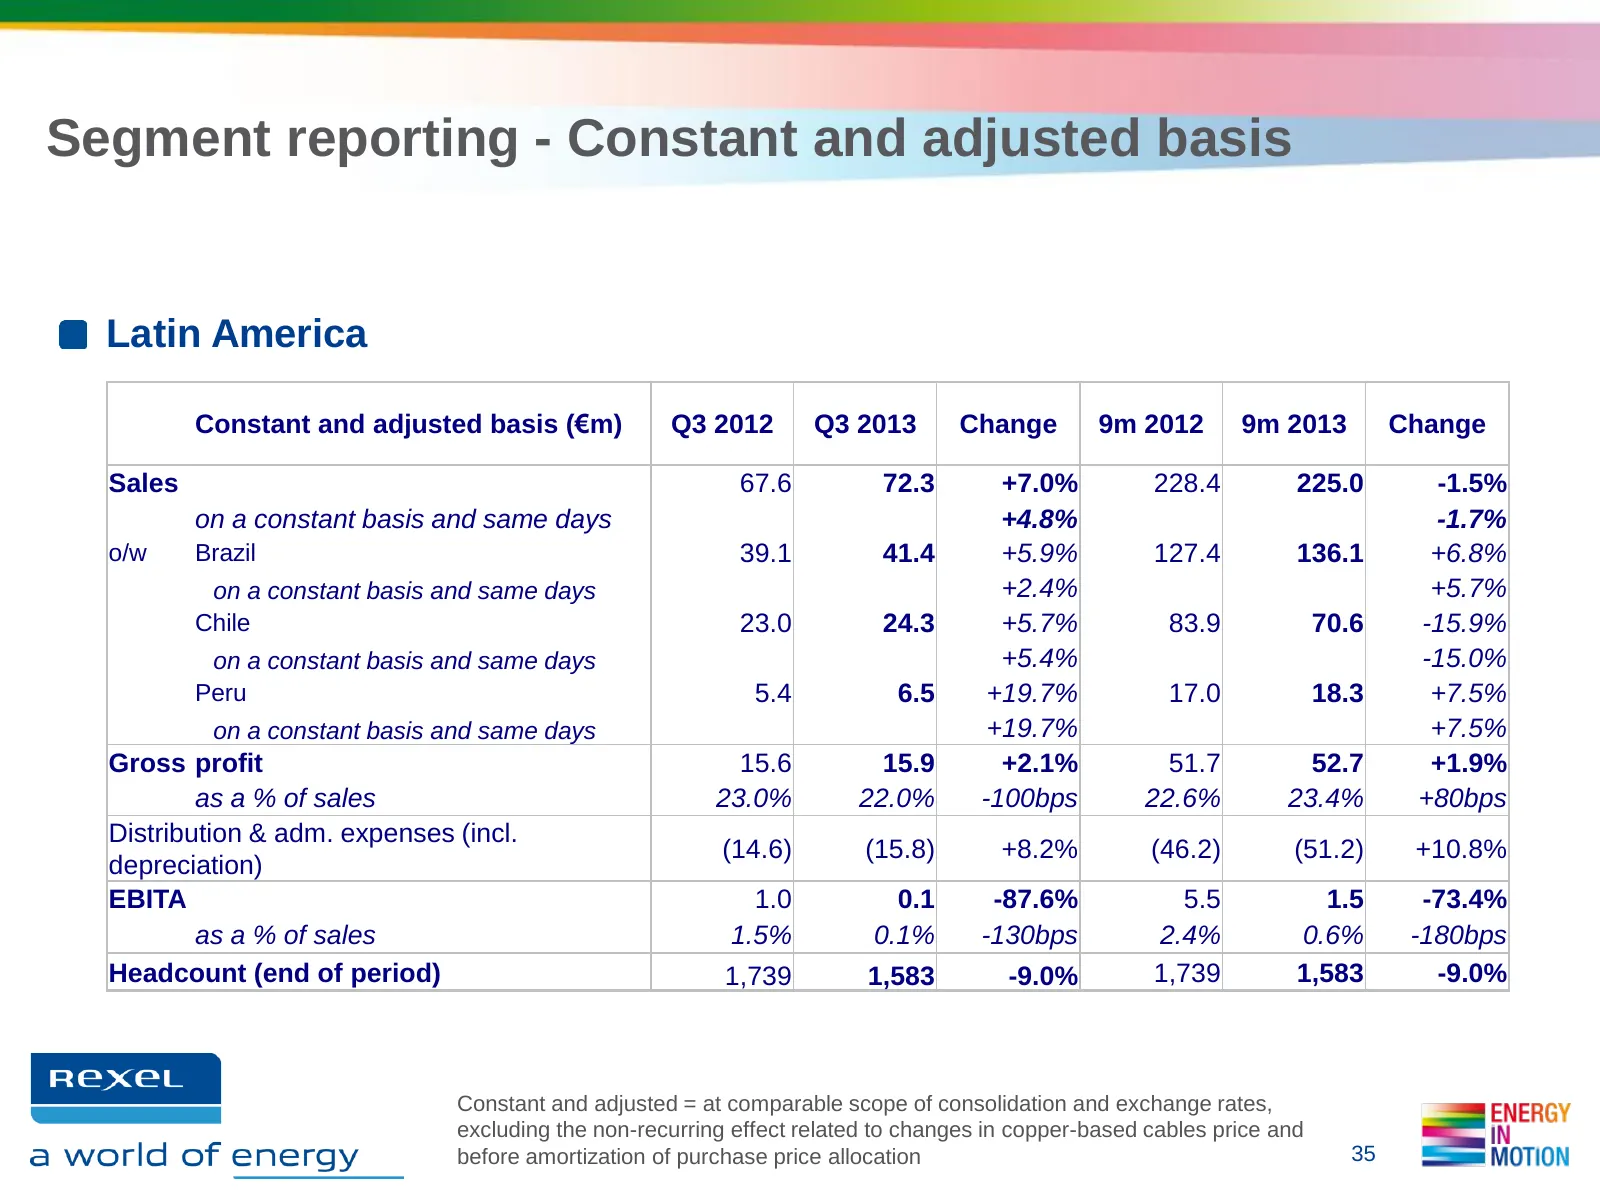
Segment reporting - Constant and adjusted basis Latin America Constant and adjusted basis (€m) Q3 2012 Q3 2013 Change 9m 2012 9m 2013 Change Sales 67.6 72.3 +7.0% 228.4 225.0 -1.5% on a constant basis and same days +4.8% -1.7% o/w Brazil 39.1 41.4 +5.9% 127.4 136.1 +6.8% on a constant basis and same
Slide 36: Consolidated Income Statement
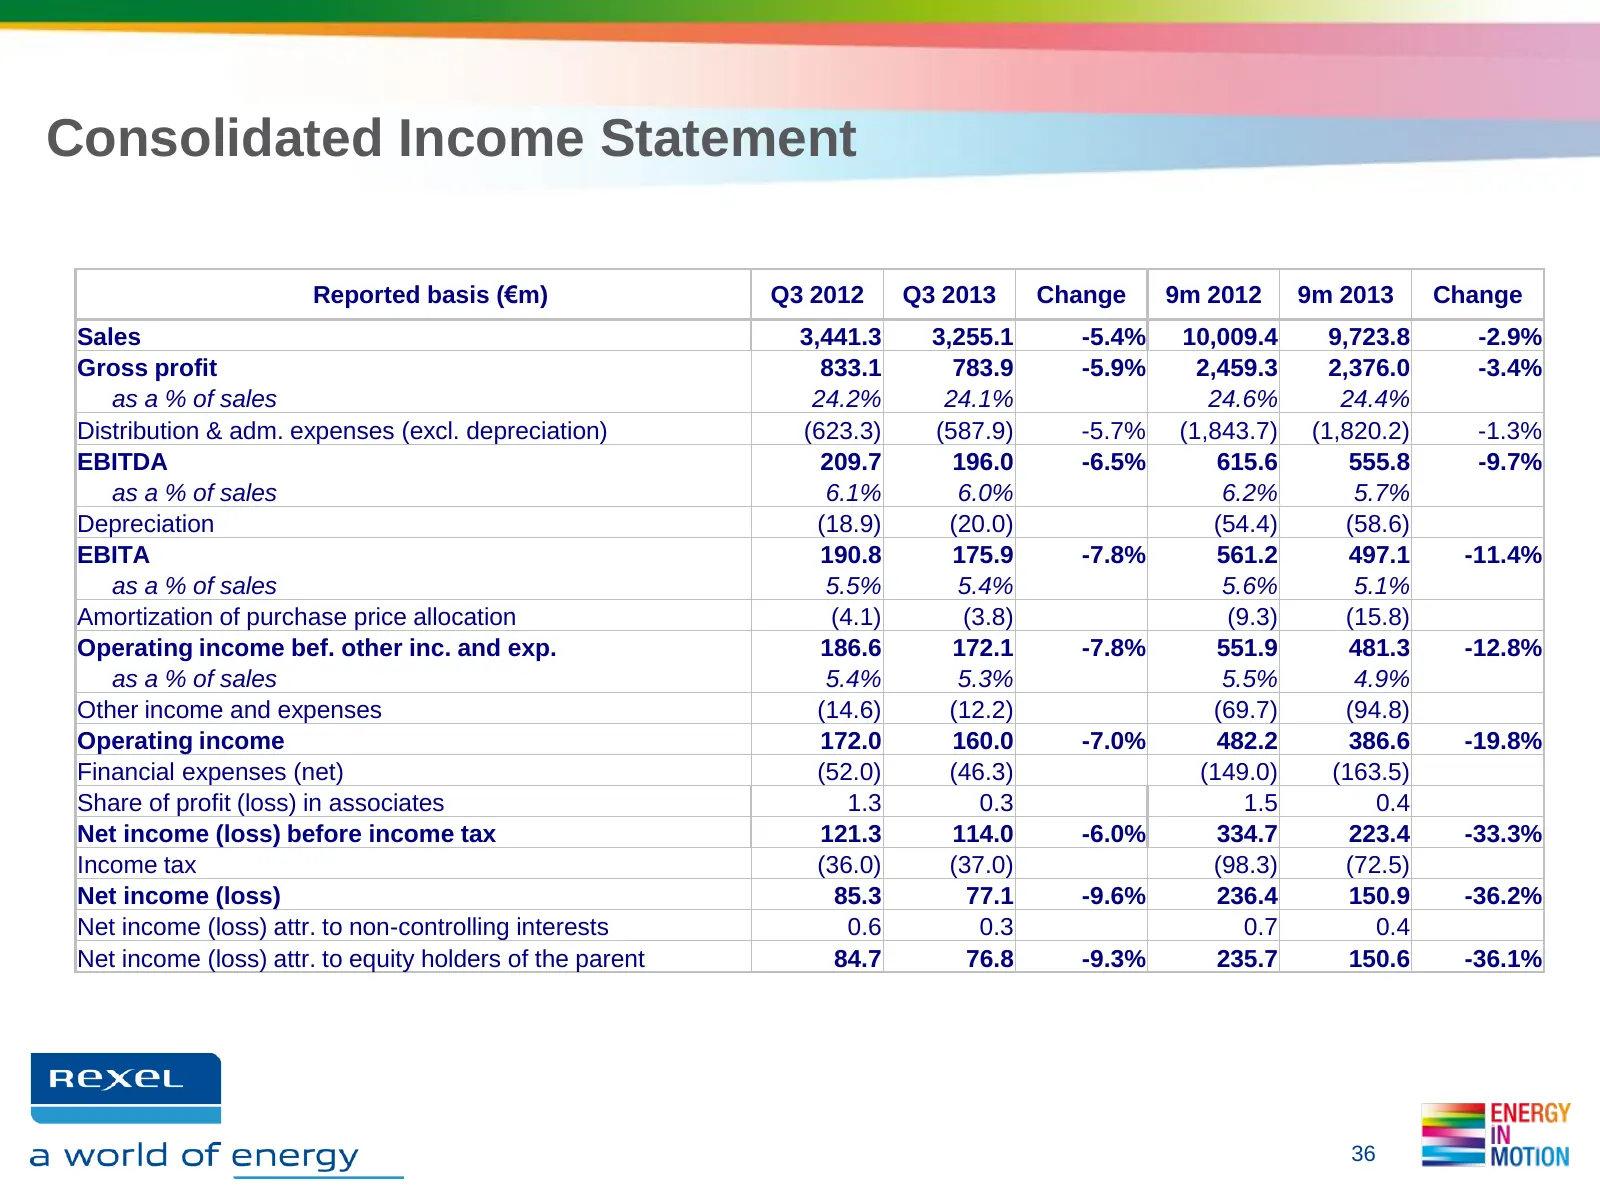
Consolidated Income Statement Reported basis (€m) Q3 2012 Q3 2013 Change 9m 2012 9m 2013 Change Sales 3,441.3 3,255.1 -5.4% 10,009.4 9,723.8 -2.9% Gross profit 833.1 783.9 -5.9% 2,459.3 2,376.0 -3.4% as a % of sales 24.2% 24.1% 24.6% 24.4% Distribution & adm. expenses (excl. depreciation) (623.3) (5
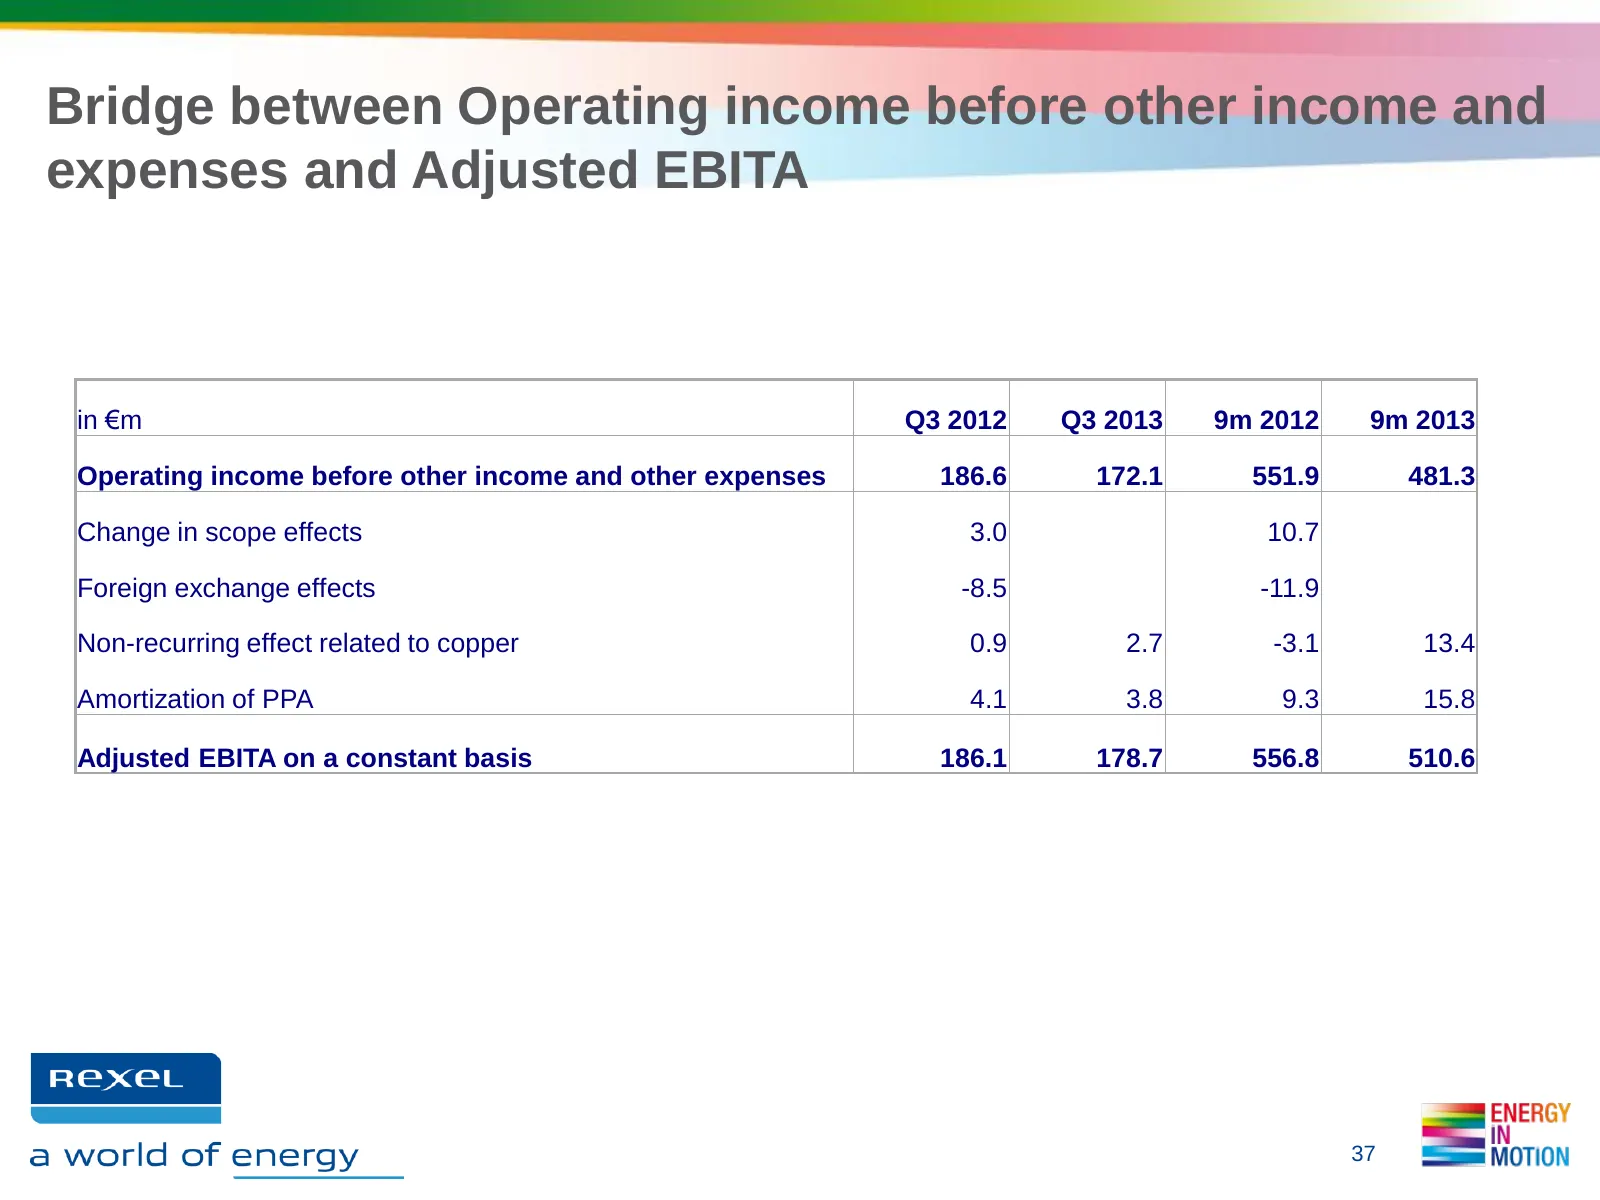
Slide 37: Bridge between Operating income and Adjusted EBITA
Bridge between Operating income before other income and expenses and Adjusted EBITA in €m Q3 2012 Q3 2013 9m 2012 9m 2013 Operating income before other income and other expenses 186.6 172.1 551.9 481.3 Change in scope effects 3.0 10.7 Foreign exchange effects -8.5 -11.9 Non-recurring effect related
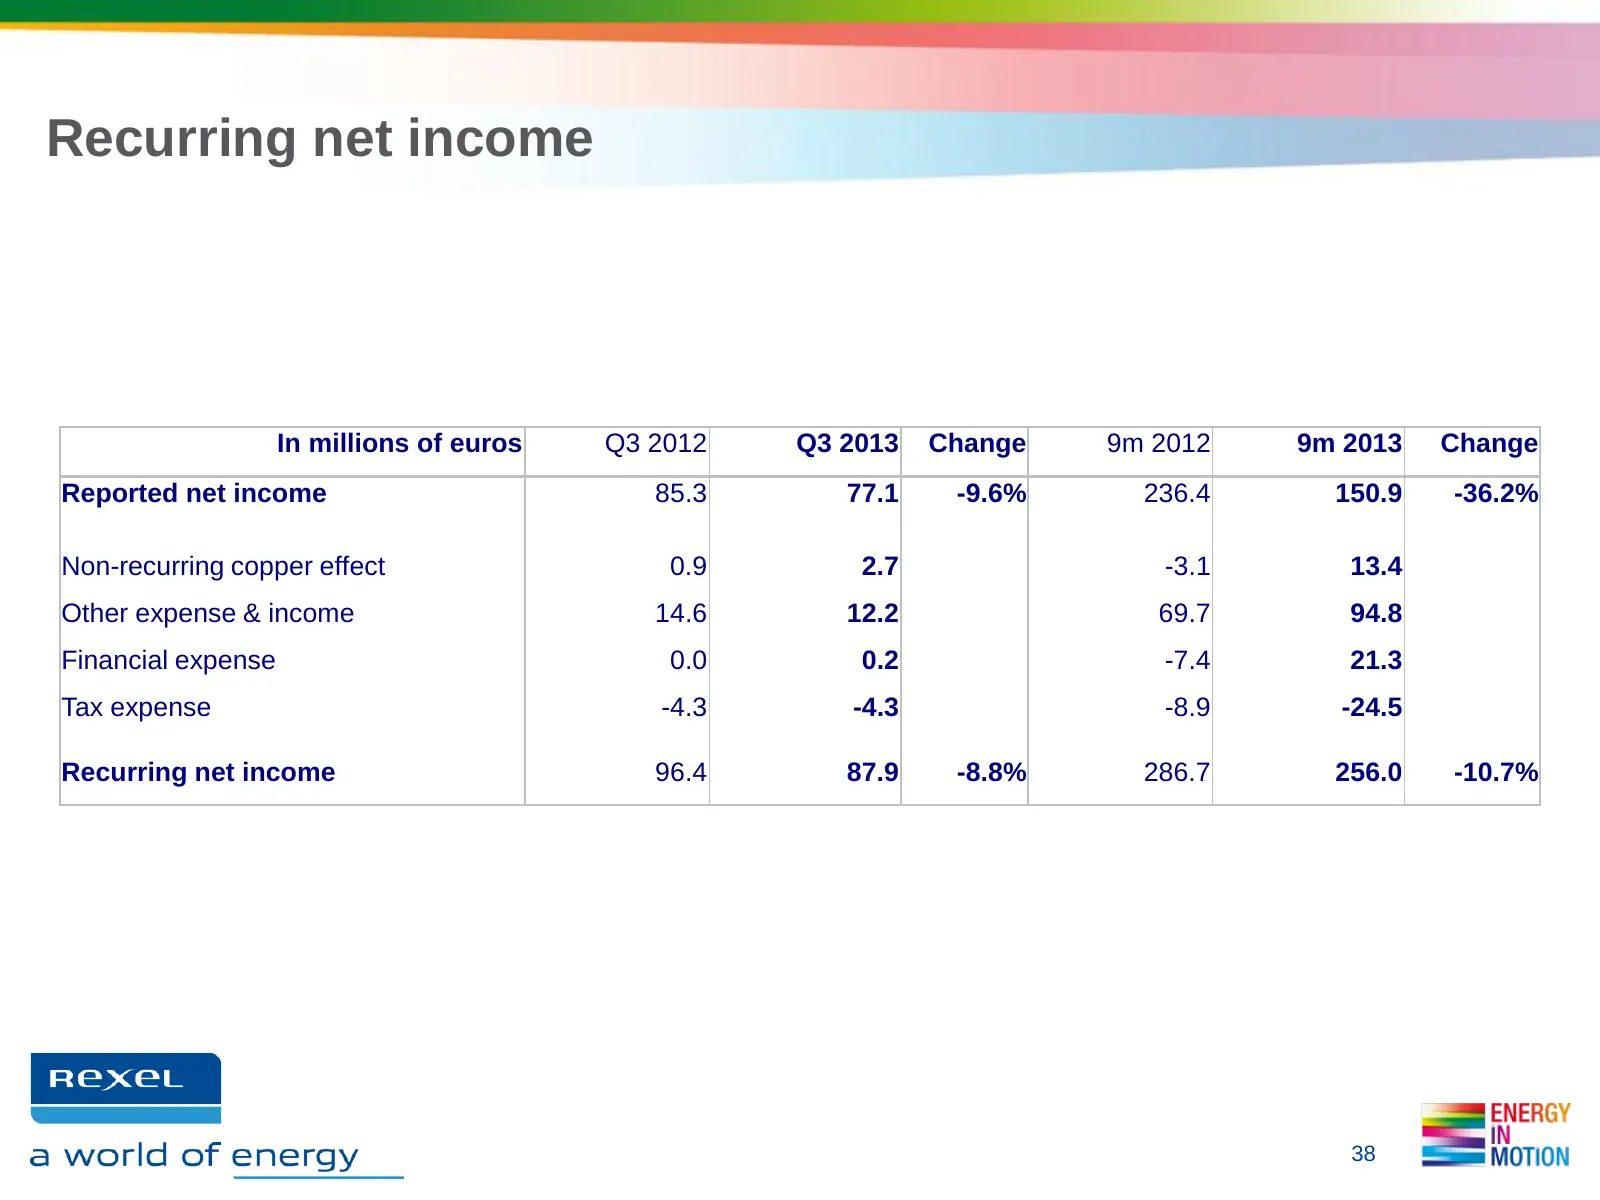
Slide 38: Recurring net income
Recurring net income In millions of euros Q3 2012 Q3 2013 Change 9m 2012 9m 2013 Change Reported net income 85.3 77.1 -9.6% 236.4 150.9 -36.2% Non-recurring copper effect 0.9 2.7 -3.1 13.4 Other expense & income 14.6 12.2 69.7 94.8 Financial expense 0.0 0.2 -7.4 21.3 Tax expense -4.3 -4.3 -8.9 -24.5
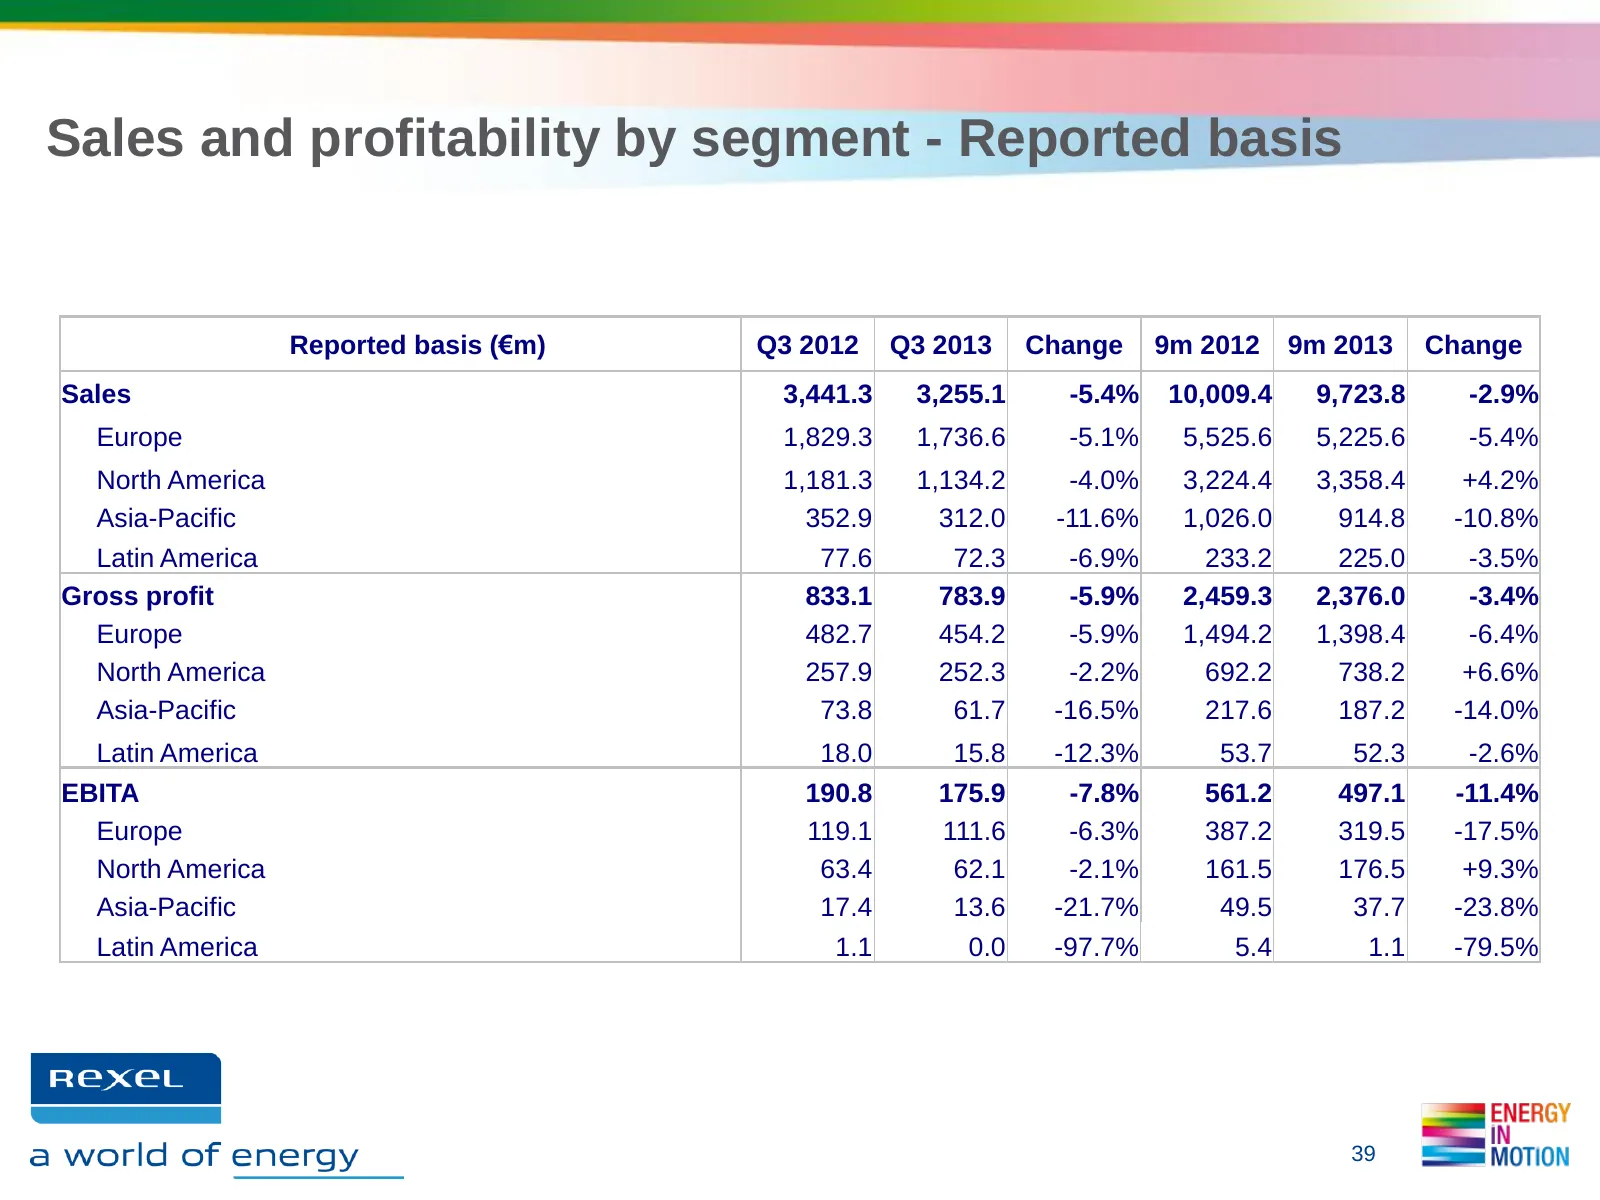
Slide 39: Sales and profitability by segment - Reported basis
Sales and profitability by segment - Reported basis Reported basis (€m) Q3 2012 Q3 2013 Change 9m 2012 9m 2013 Change Sales 3,441.3 3,255.1 -5.4% 10,009.4 9,723.8 -2.9% Europe 1,829.3 1,736.6 -5.1% 5,525.6 5,225.6 -5.4% North America 1,181.3 1,134.2 -4.0% 3,224.4 3,358.4 +4.2% Asia-Pacific 352.9 312
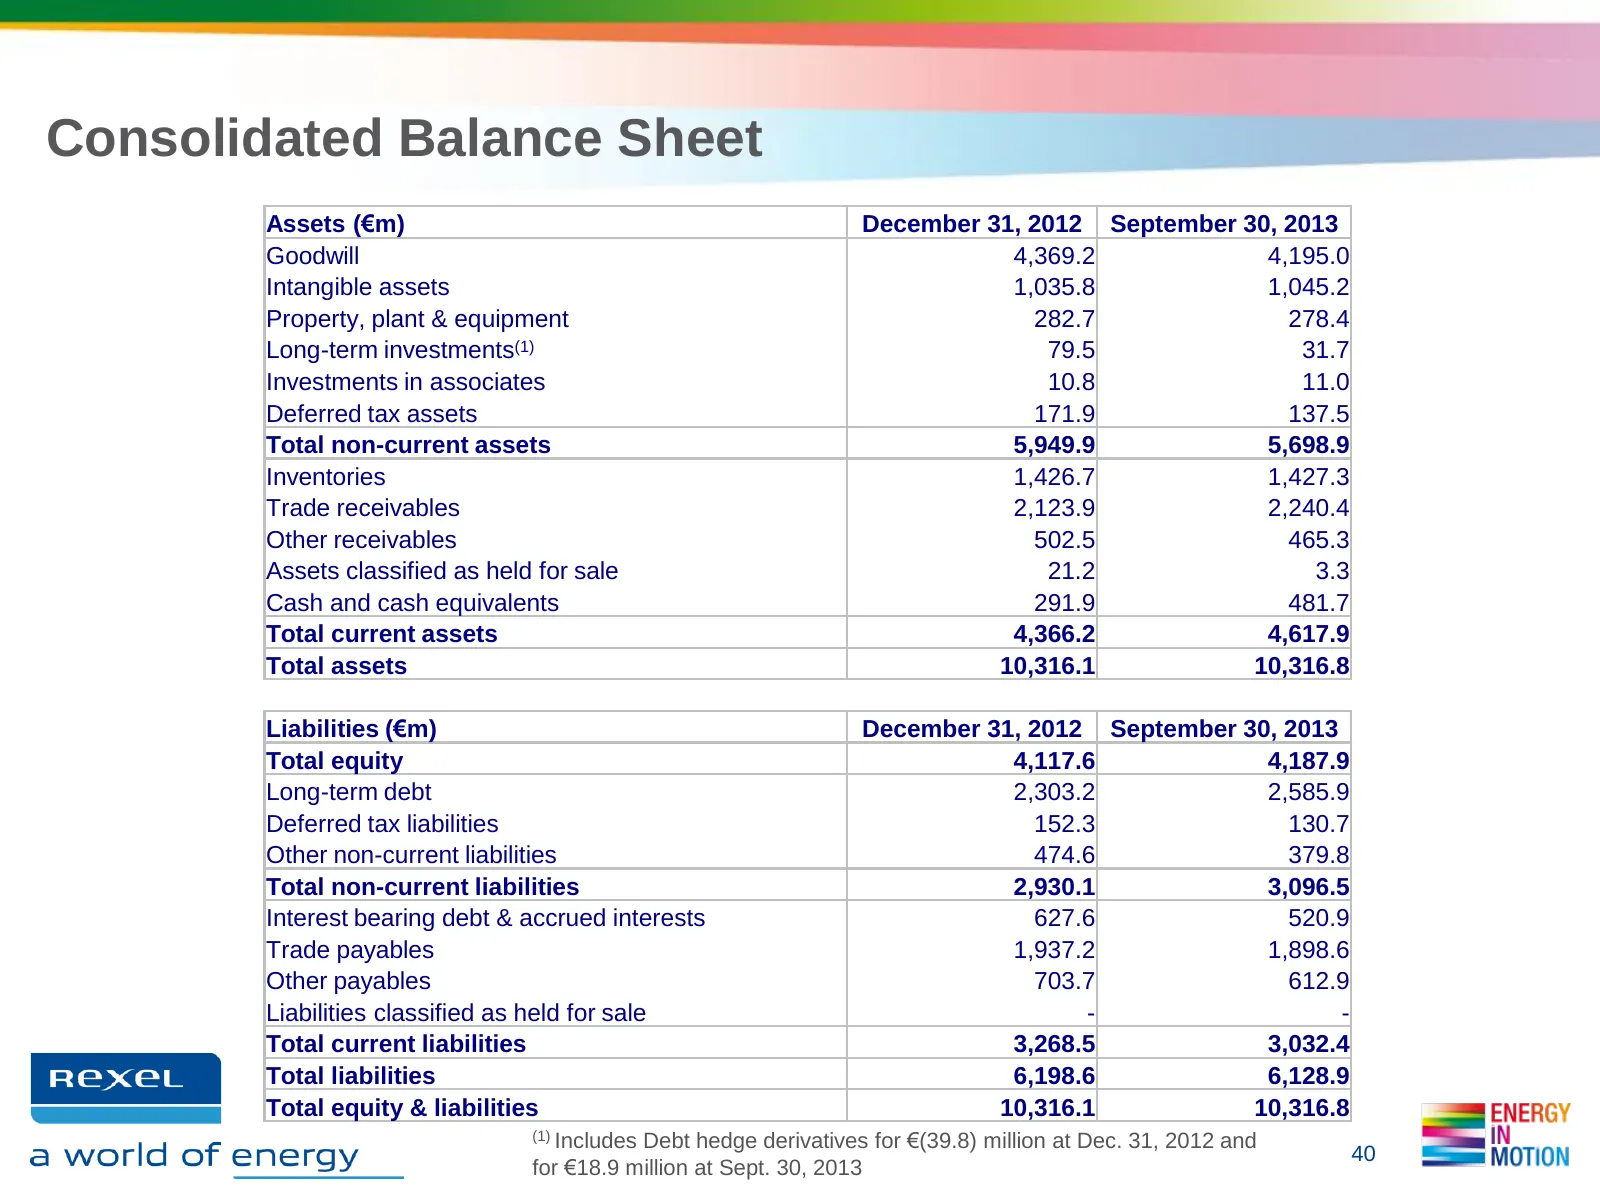
Slide 40: Consolidated Balance Sheet
Consolidated Balance Sheet Assets (€m) December 31, 2012 September 30, 2013 Goodwill 4,369.2 4,195.0 Intangible assets 1,035.8 1,045.2 Property, plant & equipment 282.7 278.4 Long-term investments(1) 79.5 31.7 Investments in associates 10.8 11.0 Deferred tax assets 171.9 137.5 Total non-current asse
Slide 41: Change in Net Debt
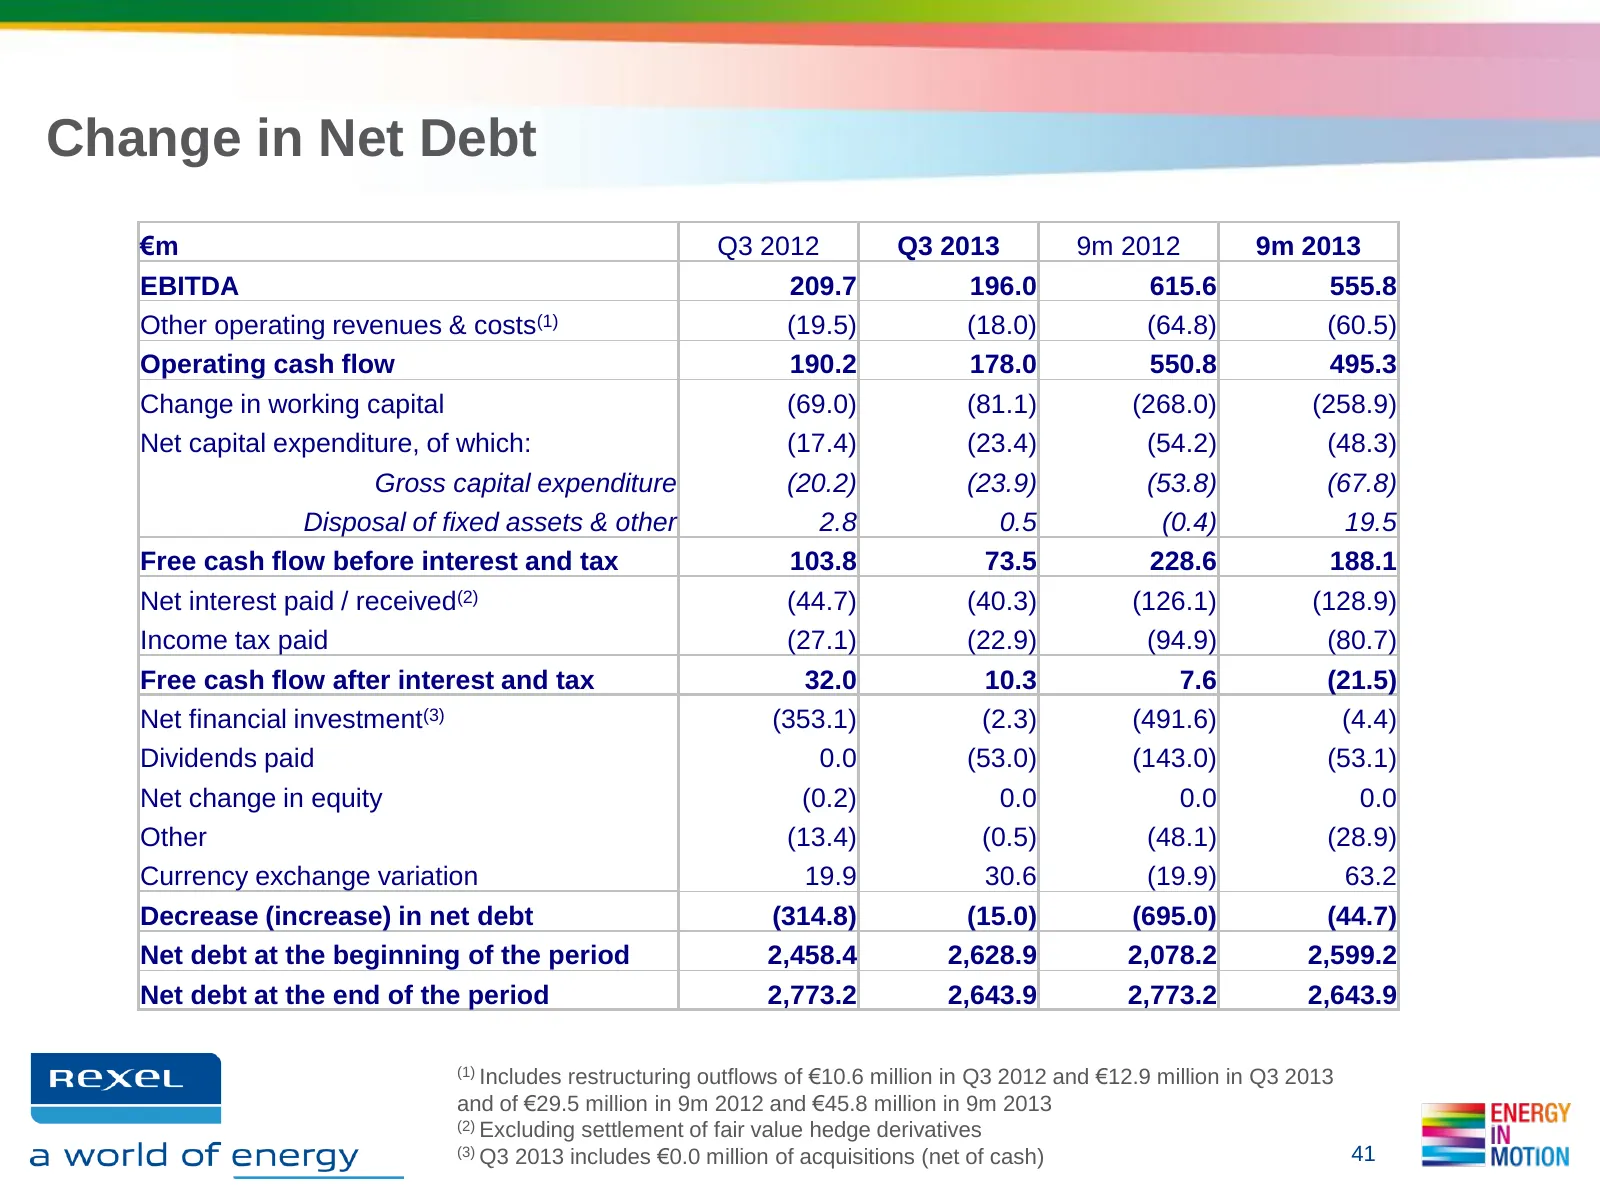
Change in Net Debt €m Q3 2012 Q3 2013 9m 2012 9m 2013 EBITDA 209.7 196.0 615.6 555.8 Other operating revenues & costs(1) (19.5) (18.0) (64.8) (60.5) Operating cash flow 190.2 178.0 550.8 495.3 Change in working capital (69.0) (81.1) (268.0) (258.9) Net capital expenditure, of which: (17.4) (23.4) (5
Slide 42: Working Capital
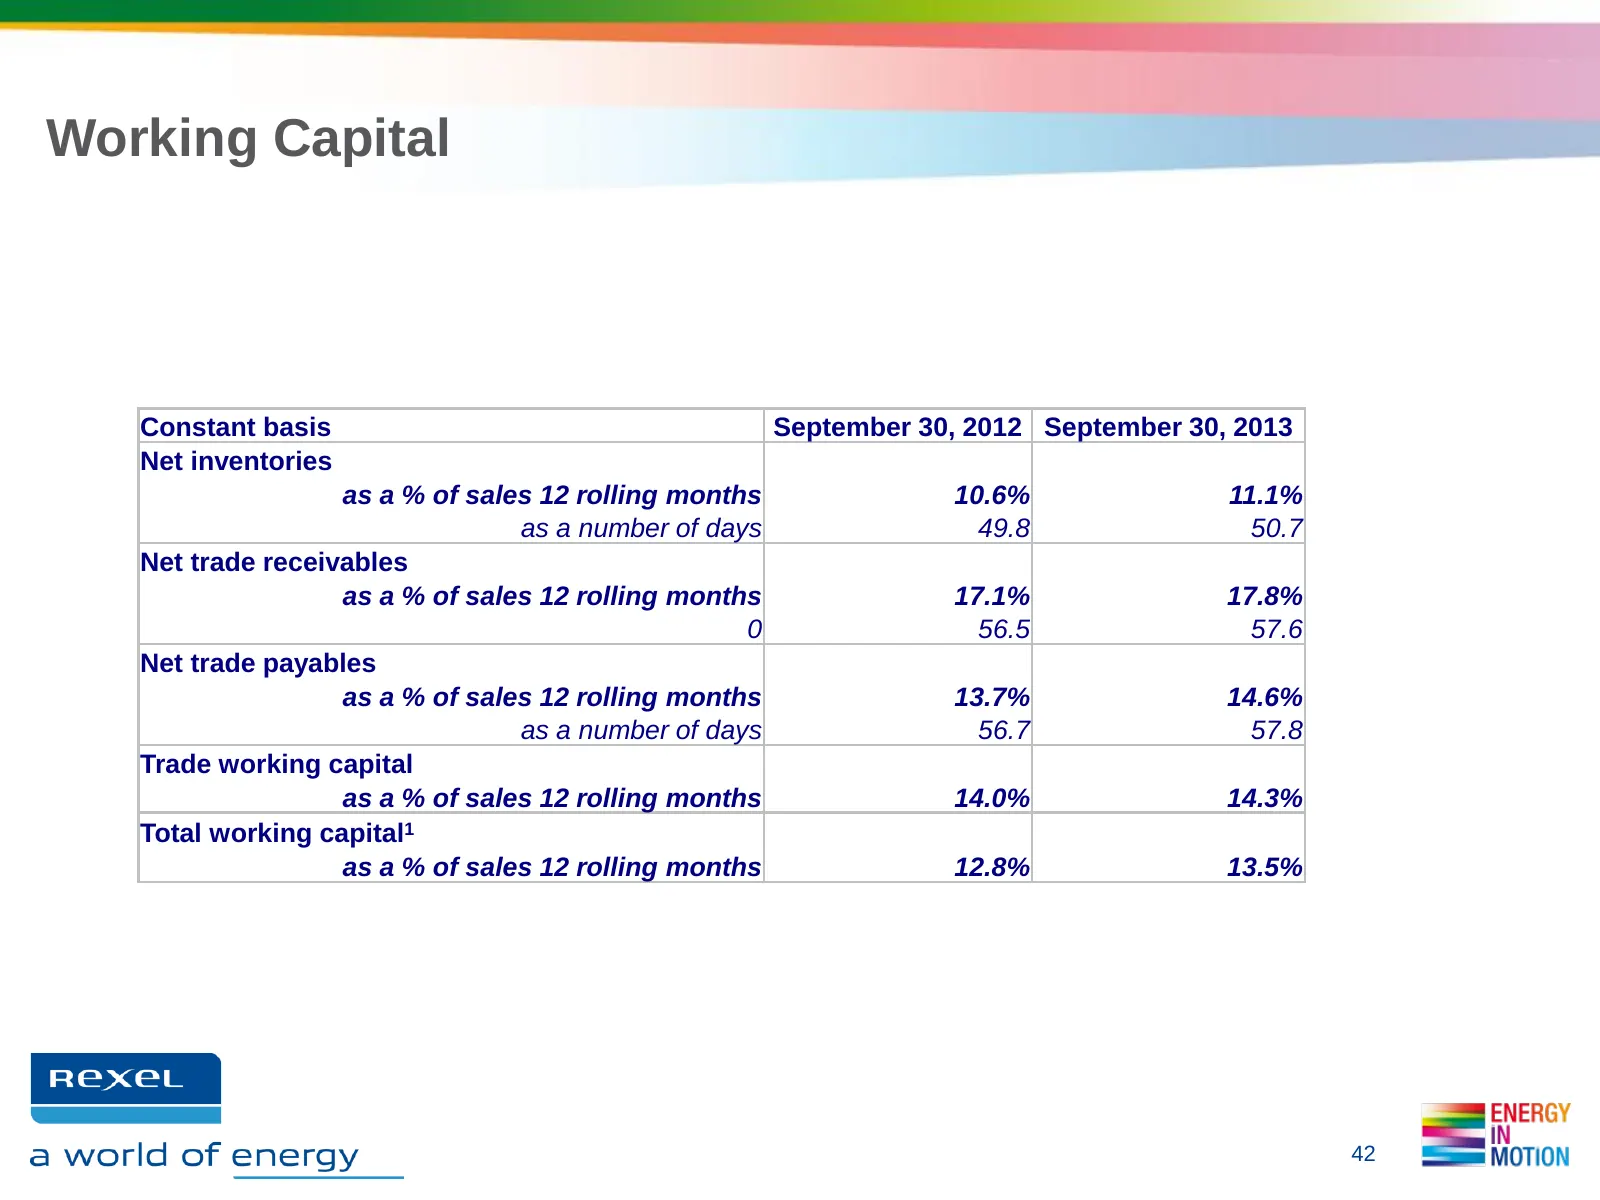
Working Capital Constant basis September 30, 2012 September 30, 2013 Net inventories as a % of sales 12 rolling months 10.6% 11.1% as a number of days 49.8 50.7 Net trade receivables as a % of sales 12 rolling months 17.1% 17.8% 0 56.5 57.6 Net trade payables as a % of sales 12 rolling months 13.7%
Slide 43: Headcount & Branch Evolution
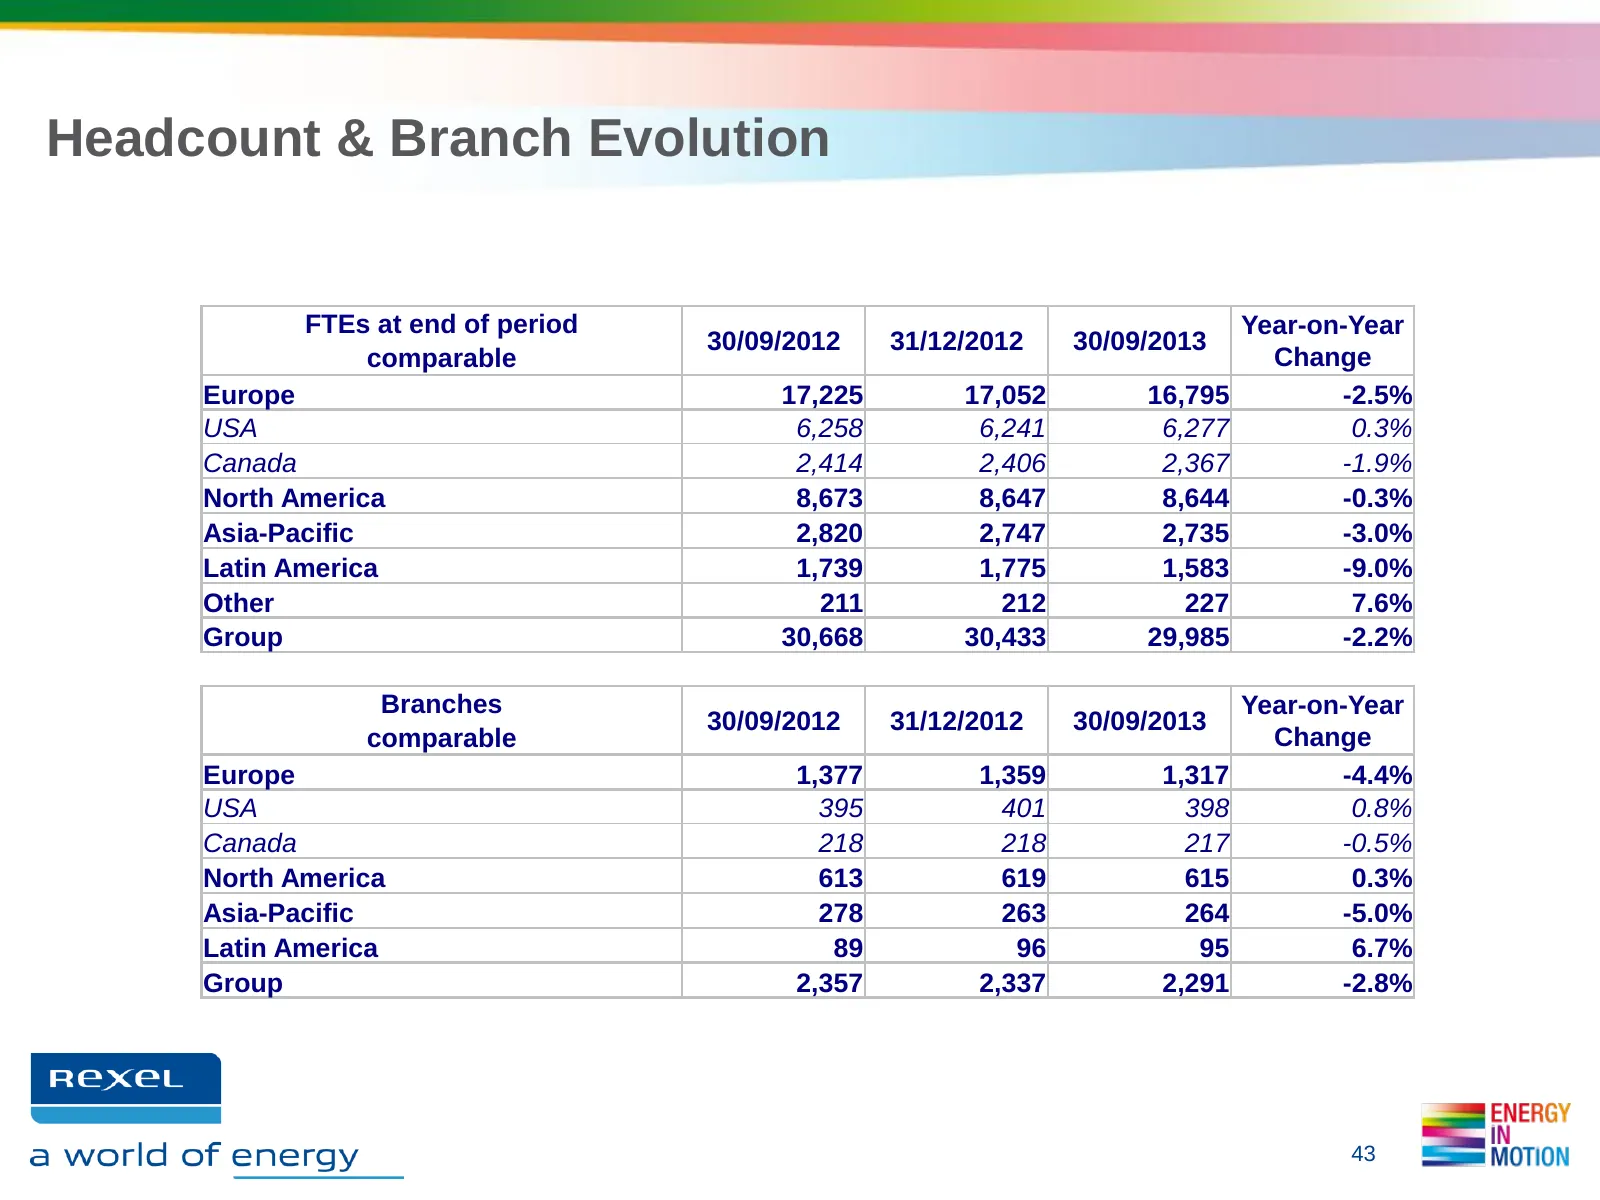
Headcount & Branch Evolution FTEs at end of period Year-on-Year 30/09/2012 31/12/2012 30/09/2013 comparable Change Europe 17,225 17,052 16,795 -2.5% USA 6,258 6,241 6,277 0.3% Canada 2,414 2,406 2,367 -1.9% North America 8,673 8,647 8,644 -0.3% Asia-Pacific 2,820 2,747 2,735 -3.0% Latin America 1,73
Slide 44: 5. Appendices to the Group Overview
5. APPENDICES TO THE GROUP OVERVIEW
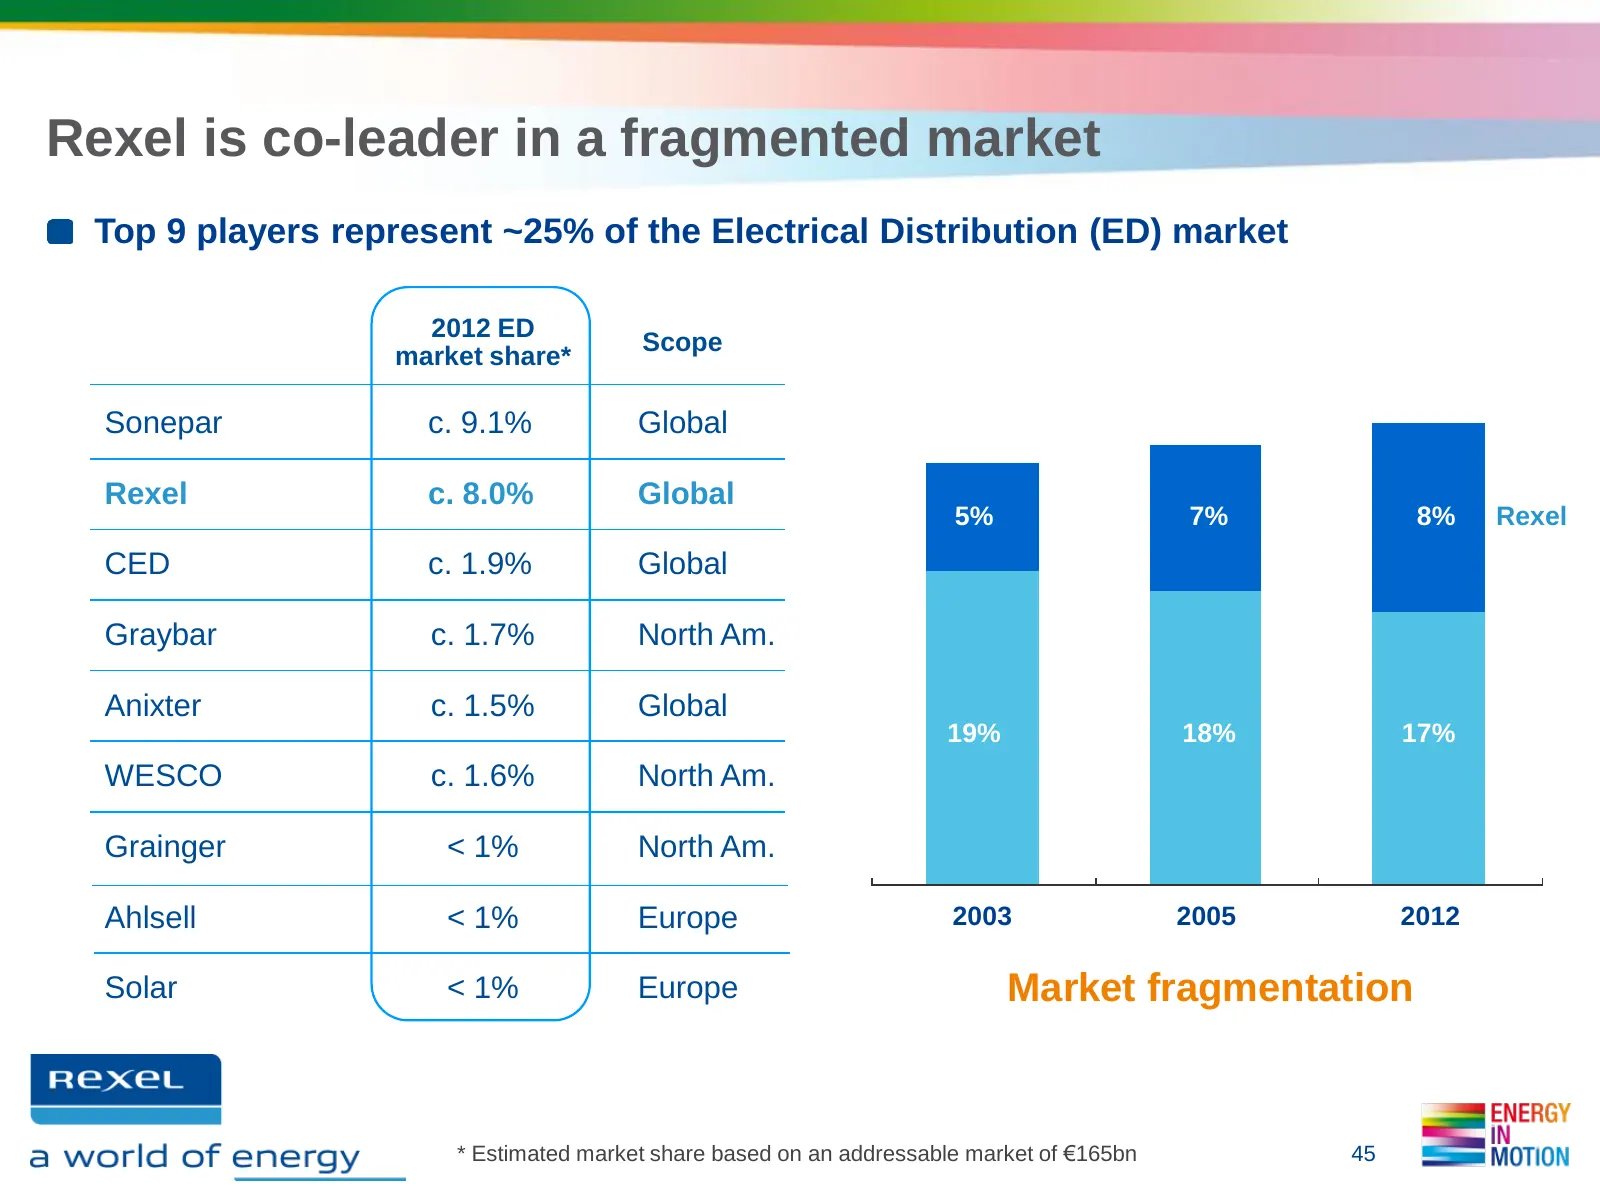
Slide 45: Rexel is co-leader in a fragmented market
Rexel is co-leader in a fragmented market Top 9 players represent ~25% of the Electrical Distribution (ED) market 2012 ED Scope market share* Sonepar c. 9.1% Global Rexel c. 8.0% Global 5% 7% 8% Rexel CED c. 1.9% Global Graybar c. 1.7% North Am. Anixter c. 1.5% Global 19% 18% 17% WESCO c. 1.6% North
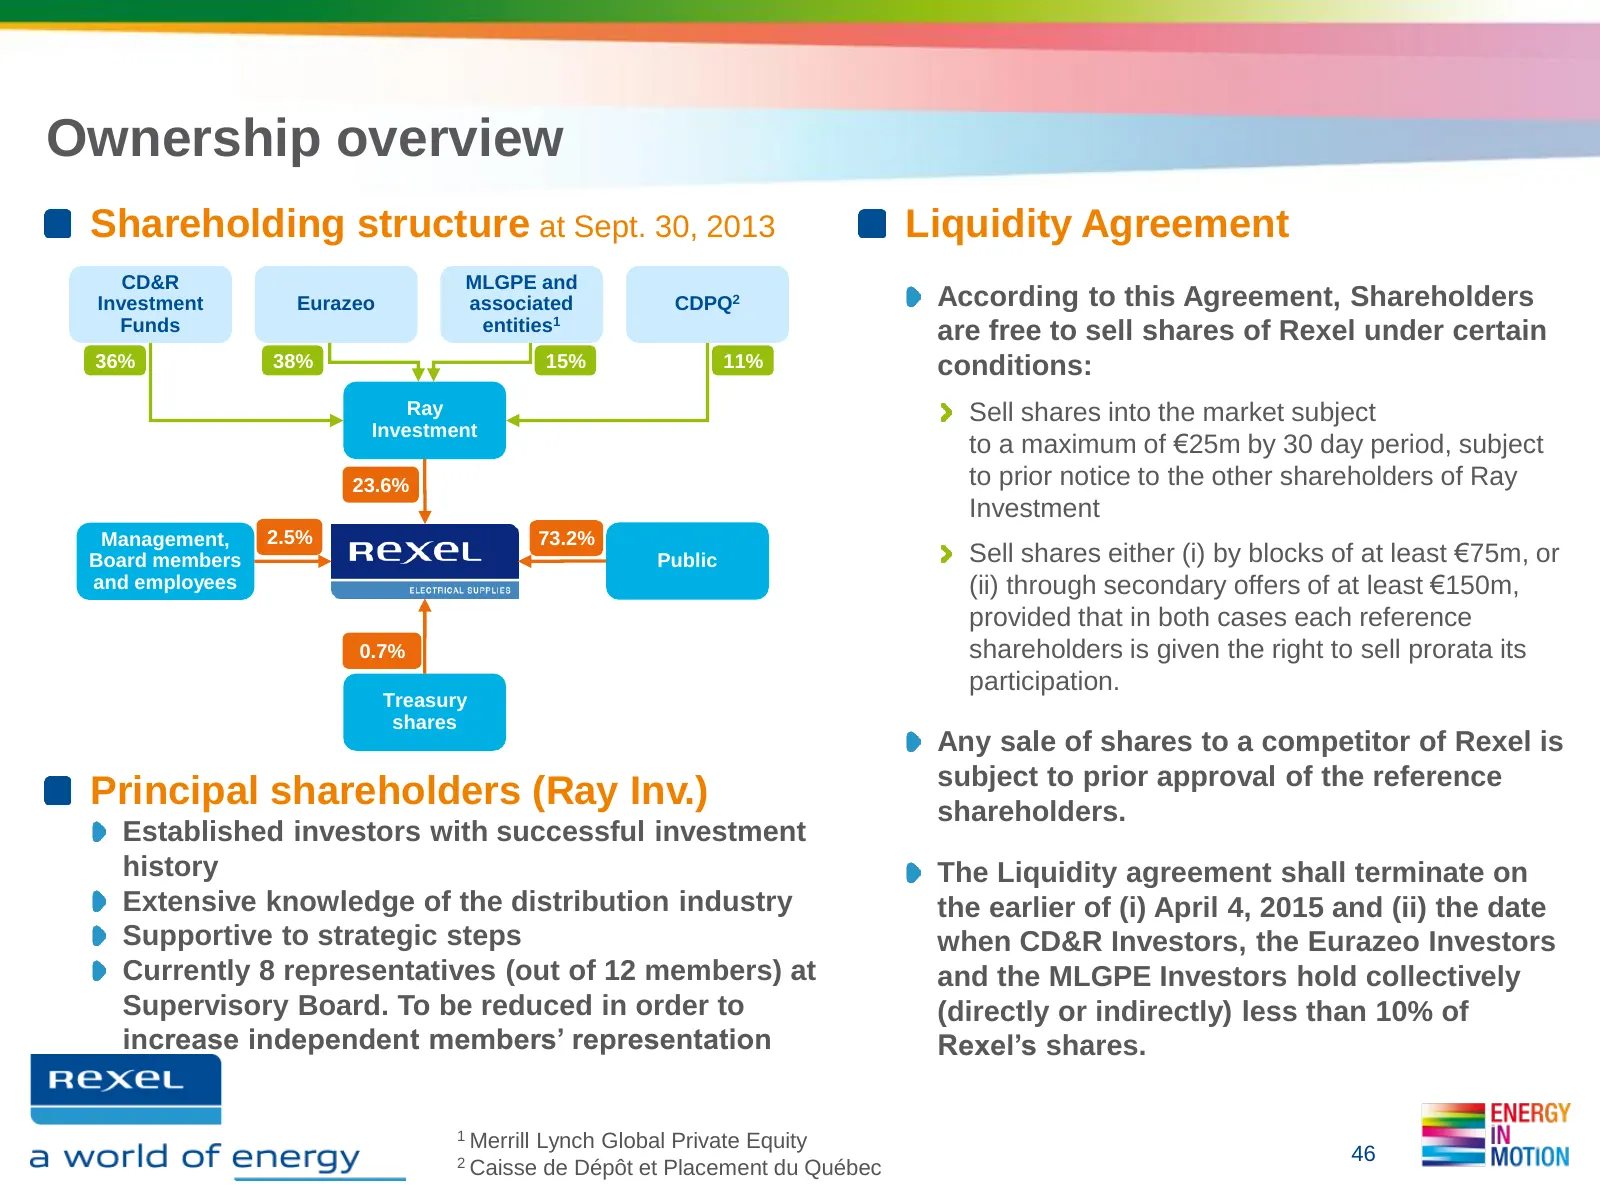
Slide 46: Ownership overview
Ownership overview Shareholding structure at Sept. 30, 2013 Liquidity Agreement CD&R MLGPE and Investment Eurazeo associated CDPQ2 According to this Agreement, Shareholders Funds entities1 are free to sell shares of Rexel under certain 36% 38% 15% 11% conditions: Ray Sell shares into the market subj
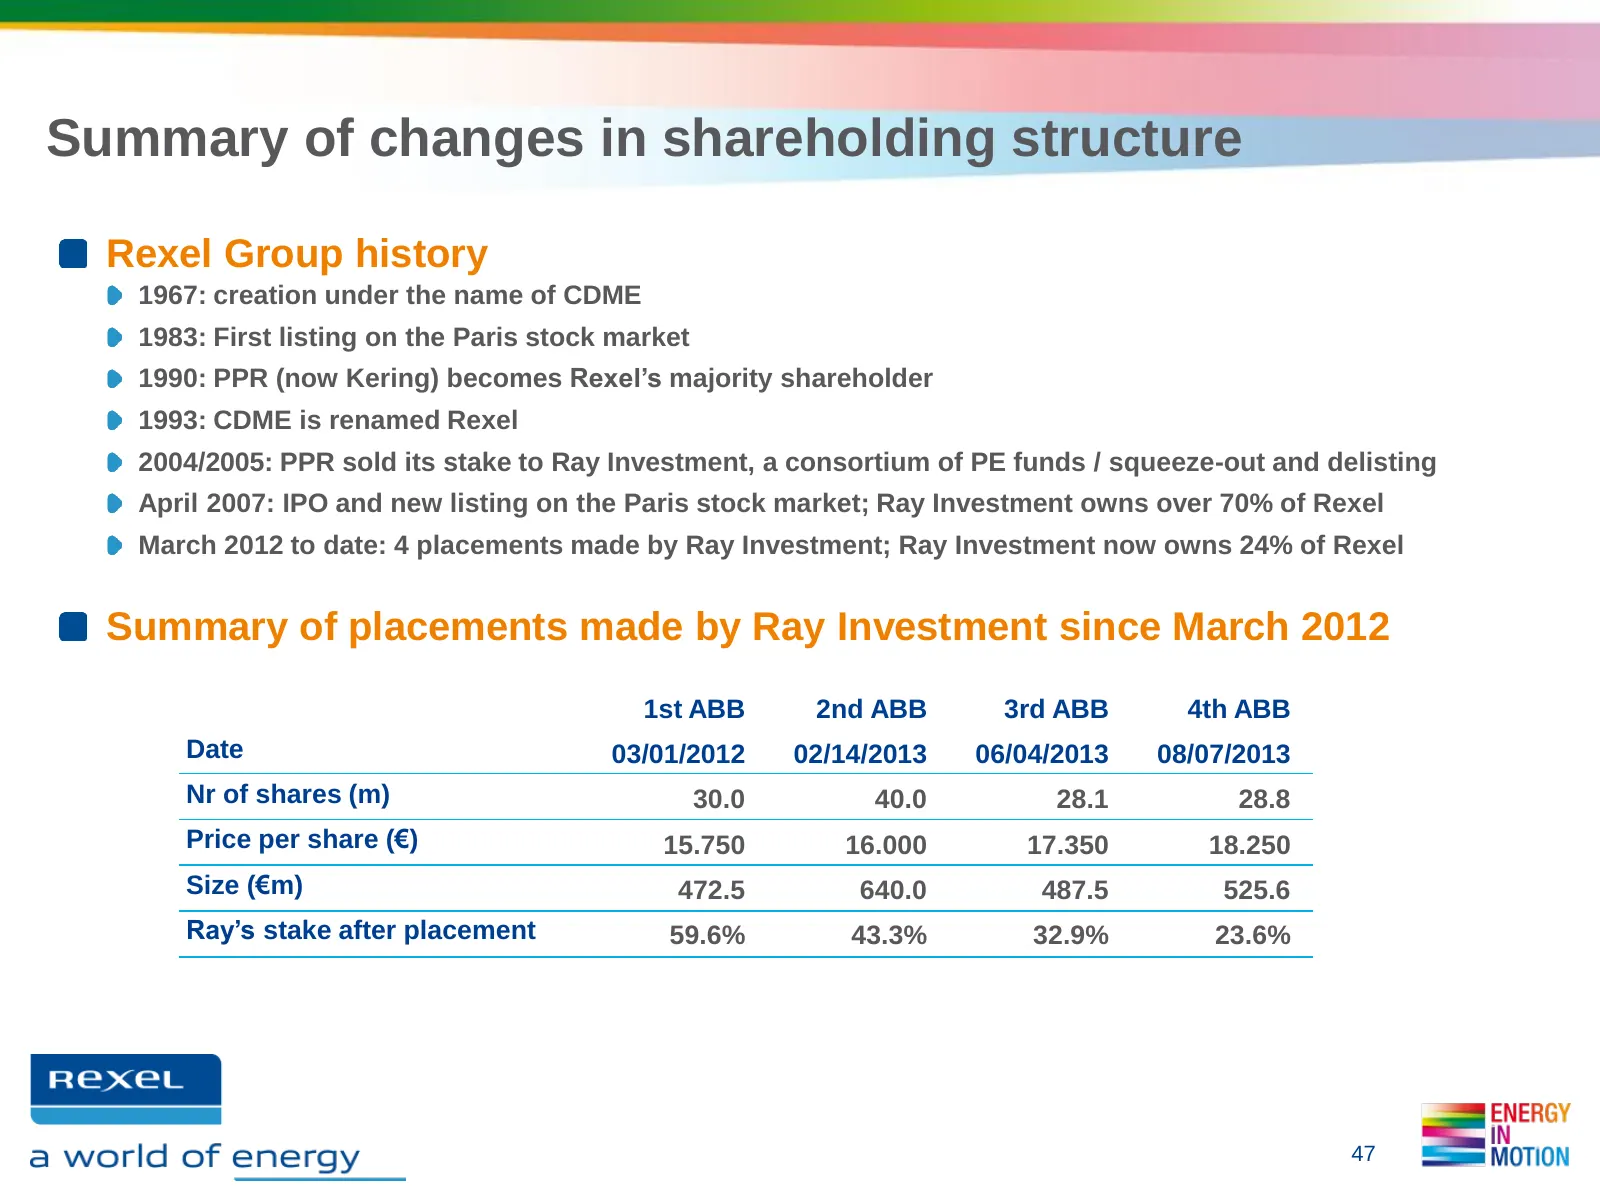
Slide 47: Summary of changes in shareholding structure
Summary of changes in shareholding structure Rexel Group history 1967: creation under the name of CDME 1983: First listing on the Paris stock market 1990: PPR (now Kering) becomes Rexel’s majority shareholder 1993: CDME is renamed Rexel 2004/2005: PPR sold its stake to Ray Investment, a consortium o
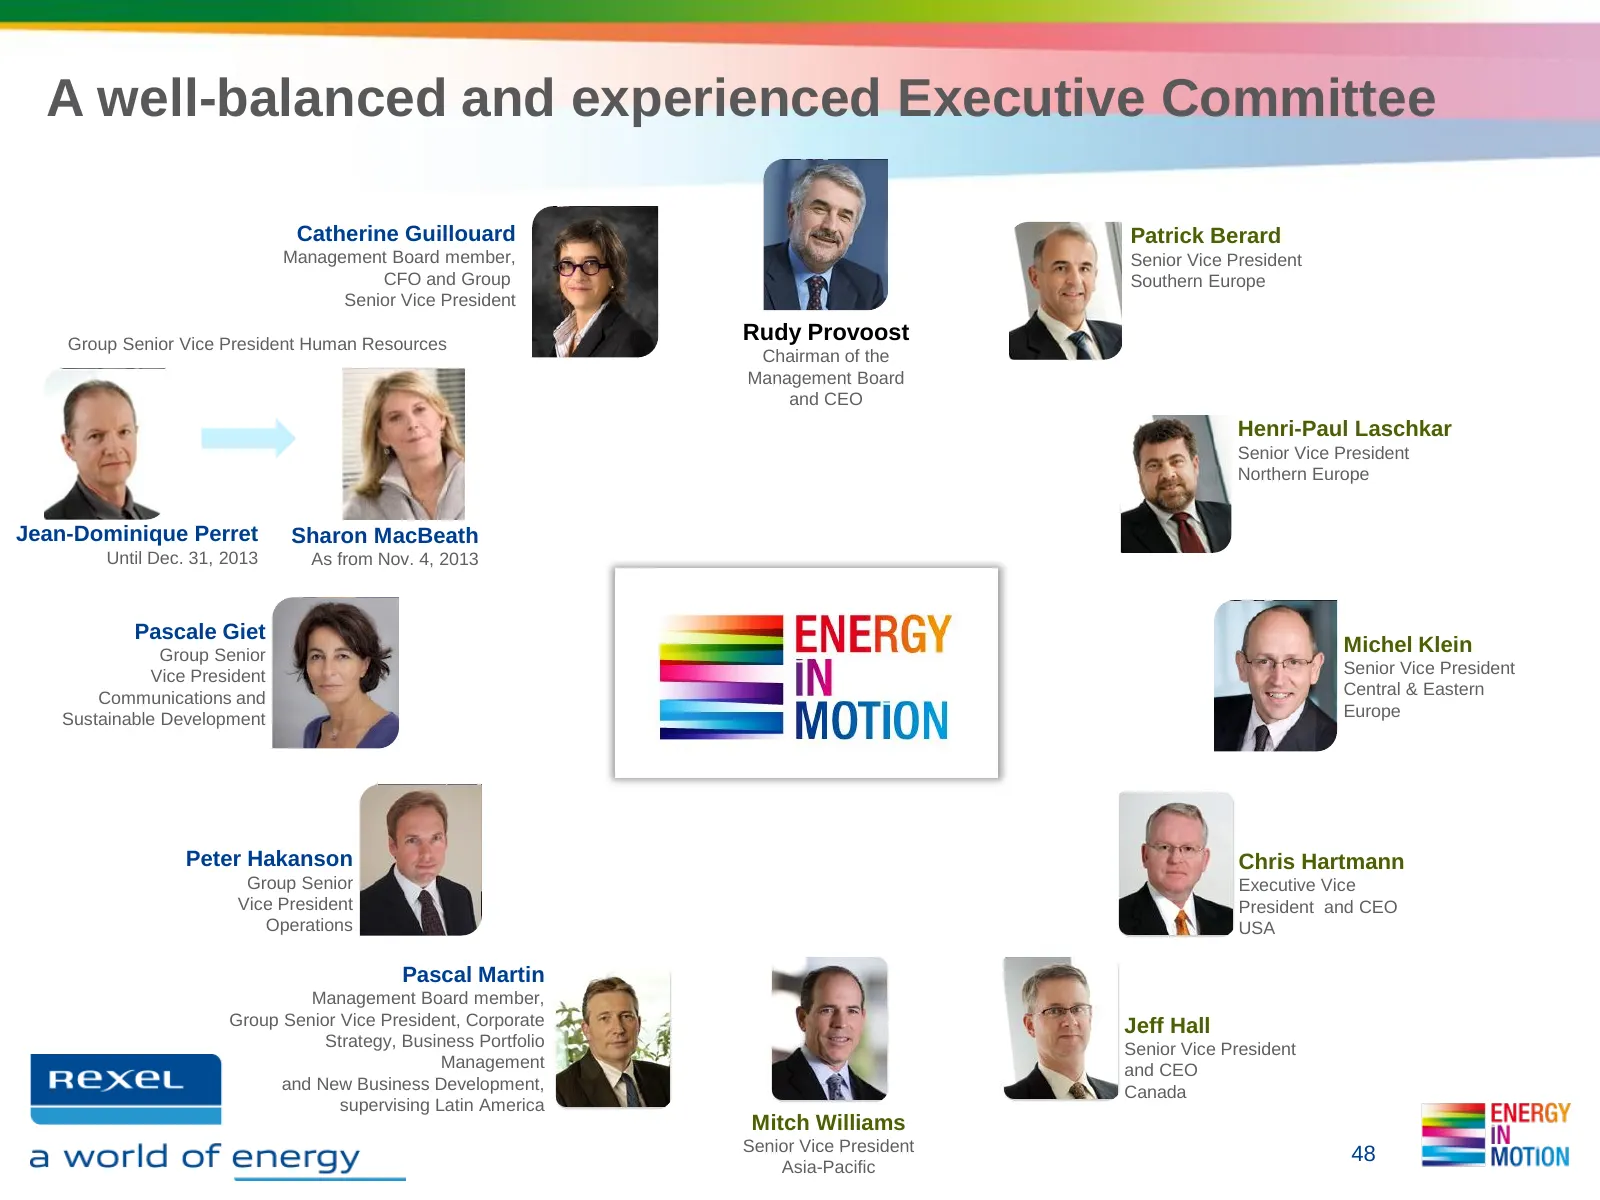
Slide 48: A well-balanced and experienced Executive Committee
A well-balanced and experienced Executive Committee Catherine Guillouard Patrick Berard Management Board member, Senior Vice President CFO and Group Southern Europe Senior Vice President Group Senior Vice President Human Resources Rudy Provoost Chairman of the Management Board and CEO Henri-Paul Las
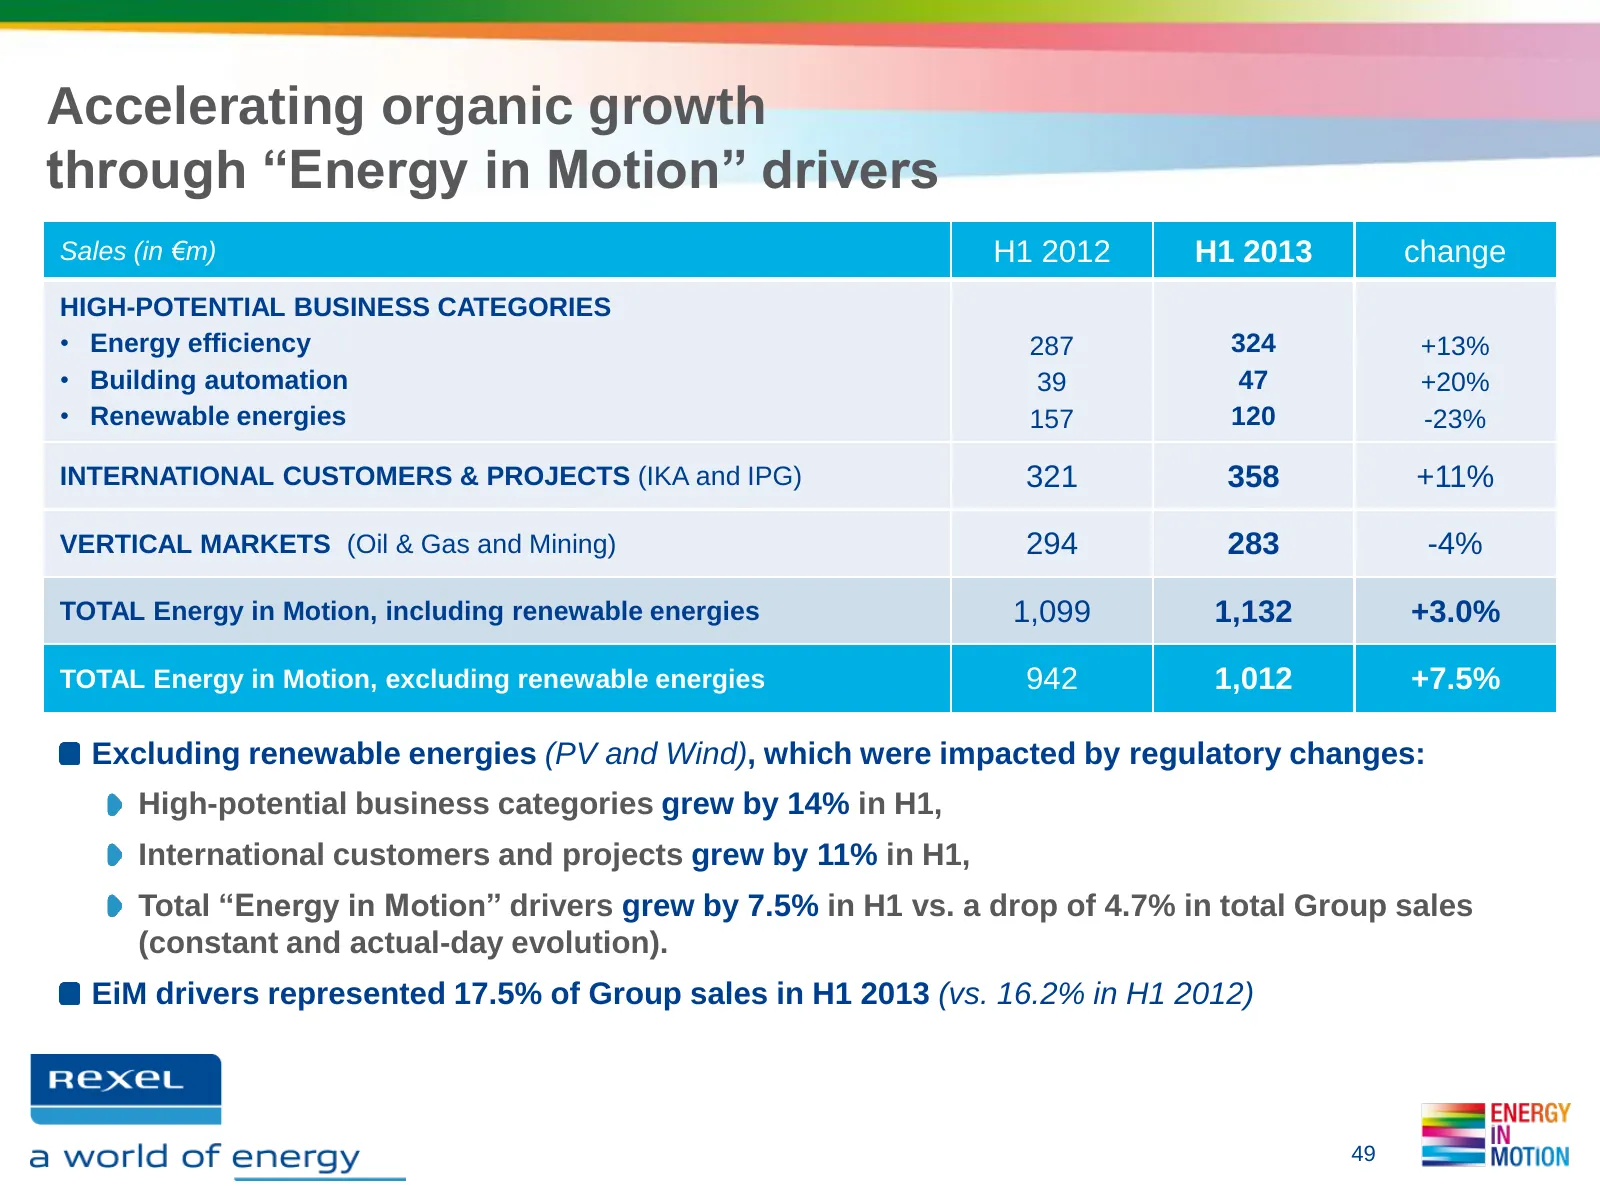
Slide 49: Accelerating organic growth through Energy in Motion drivers
Accelerating organic growth through “Energy in Motion” drivers Sales (in €m) H1 2012 H1 2013 change HIGH-POTENTIAL BUSINESS CATEGORIES • Energy efficiency 287 324 +13% • Building automation 39 47 +20% • Renewable energies 157 120 -23% INTERNATIONAL CUSTOMERS & PROJECTS (IKA and IPG) 321 358 +11% VER
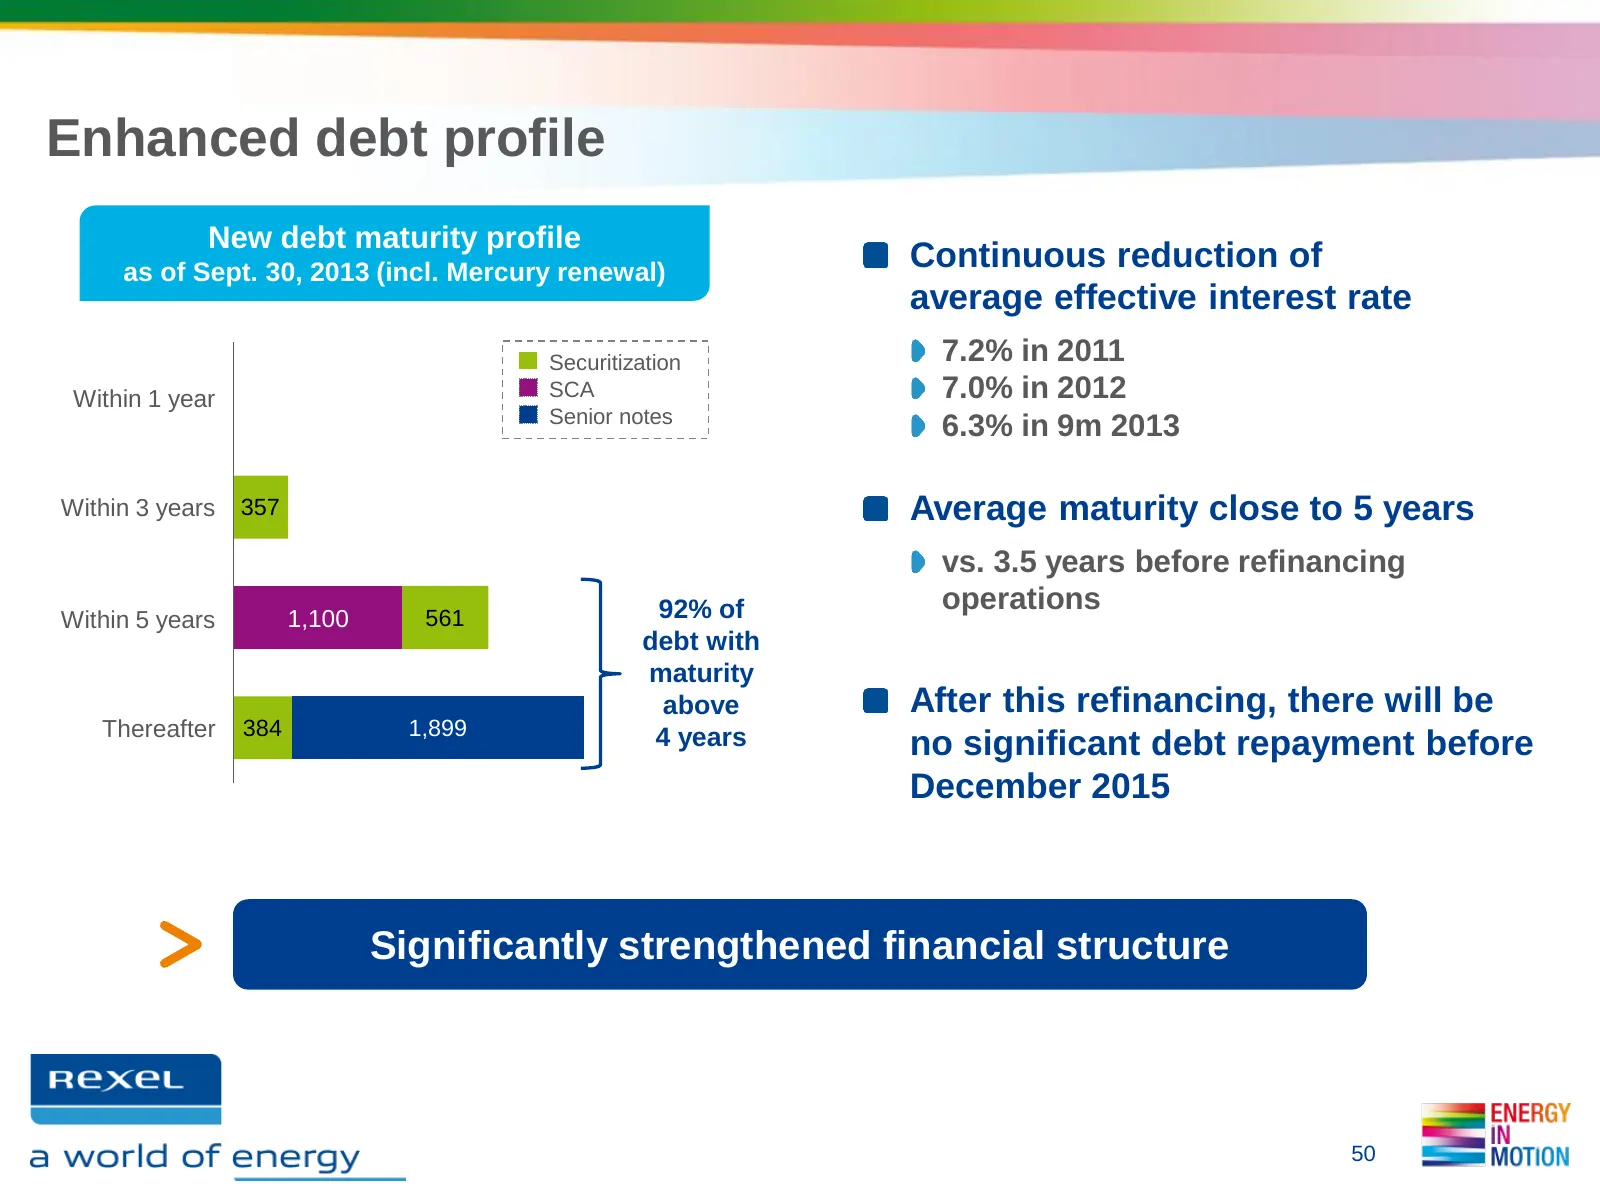
Slide 50: Enhanced debt profile
Enhanced debt profile New debt maturity profile as of Sept. 30, 2013 (incl. Mercury renewal) Continuous reduction of average effective interest rate Securitization 7.2% in 2011 Within 1 year SCA 7.0% in 2012 Senior notes 6.3% in 9m 2013 Within 3 years 357 Average maturity close to 5 years vs. 3.5 ye
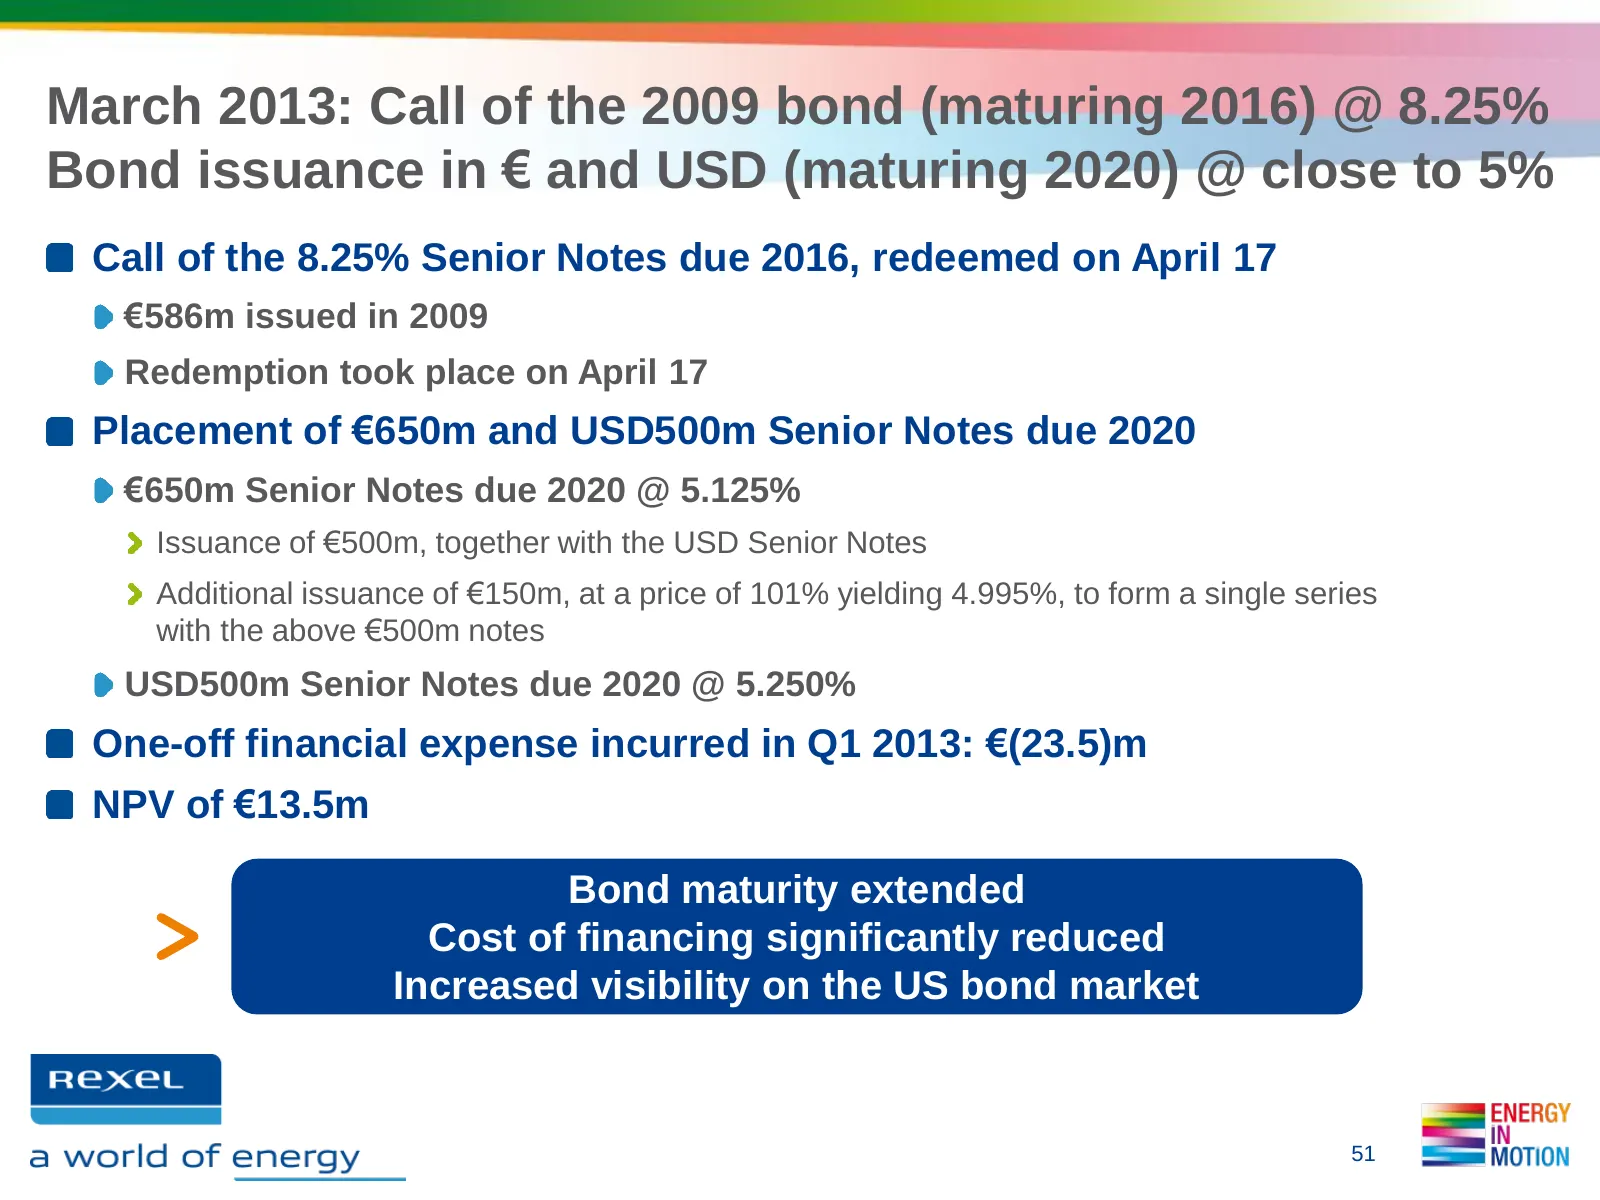
Slide 51: Bond issuance in € and USD maturing 2020
March 2013: Call of the 2009 bond (maturing 2016) @ 8.25% Bond issuance in € and USD (maturing 2020) @ close to 5% Call of the 8.25% Senior Notes due 2016, redeemed on April 17 €586m issued in 2009 Redemption took place on April 17 Placement of €650m and USD500m Senior Notes due 2020 €650m Senior No
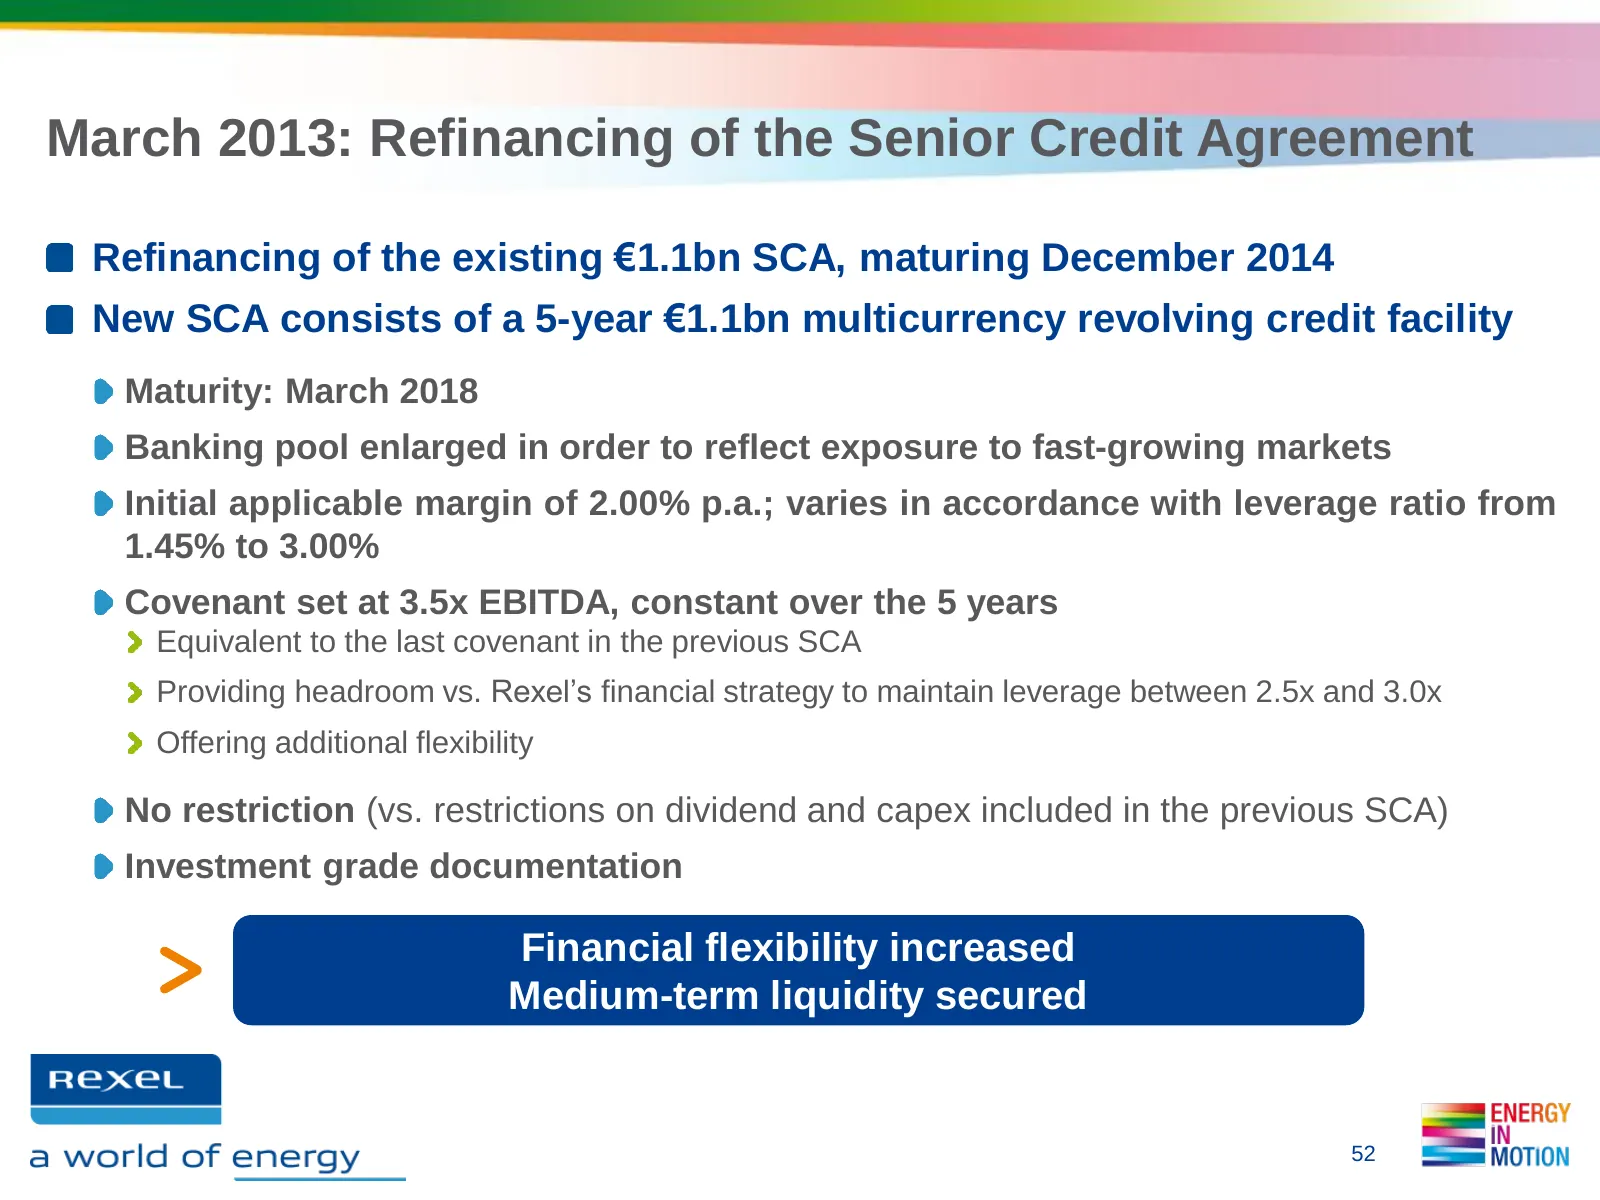
Slide 52: Refinancing of the Senior Credit Agreement
March 2013: Refinancing of the Senior Credit Agreement Refinancing of the existing €1.1bn SCA, maturing December 2014 New SCA consists of a 5-year €1.1bn multicurrency revolving credit facility Maturity: March 2018 Banking pool enlarged in order to reflect exposure to fast-growing markets Initial ap
Slide 53: Estimation of copper-based cable price evolution effects
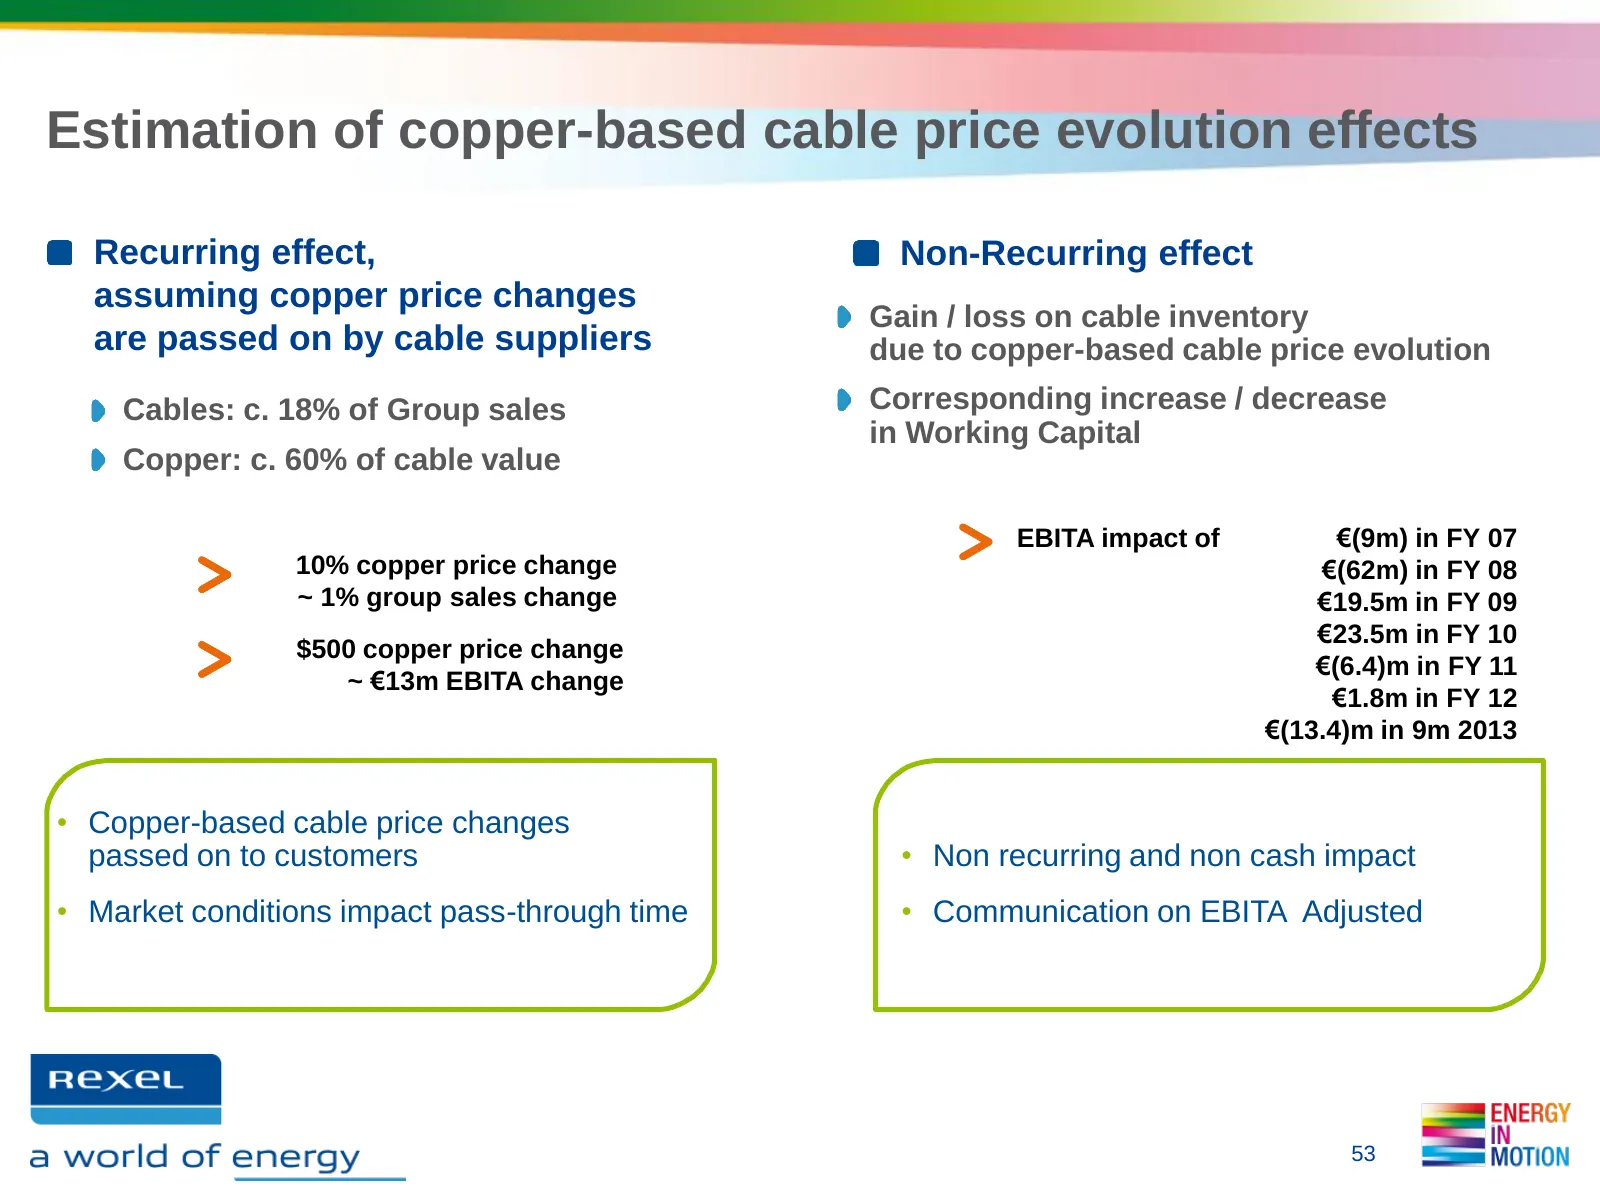
Estimation of copper-based cable price evolution effects Recurring effect, Non-Recurring effect assuming copper price changes Gain / loss on cable inventory are passed on by cable suppliers due to copper-based cable price evolution Cables: c. 18% of Group sales Corresponding increase / decrease in W
Slide 54: Three-month Copper Price Evolution
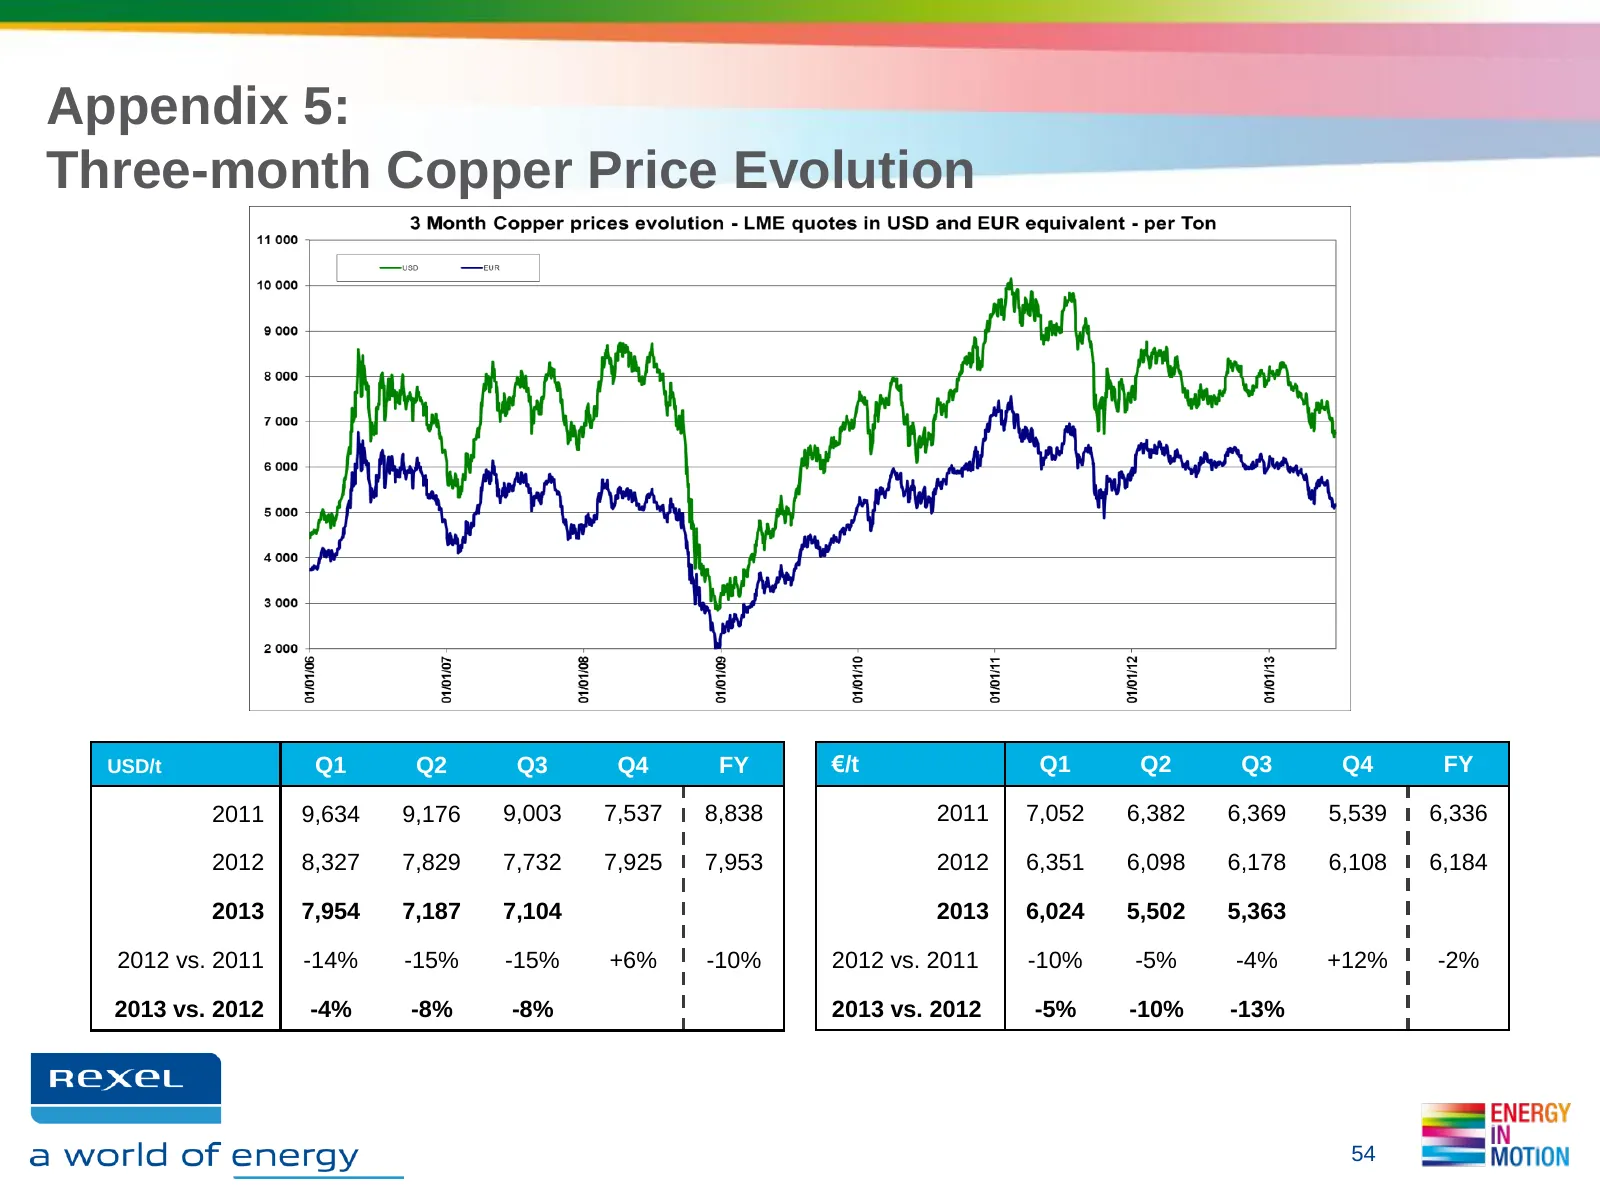
Appendix 5: Three-month Copper Price Evolution USD/t Q1 Q2 Q3 Q4 FY €/t Q1 Q2 Q3 Q4 FY 2011 9,634 9,176 9,003 7,537 8,838 2011 7,052 6,382 6,369 5,539 6,336 2012 8,327 7,829 7,732 7,925 7,953 2012 6,351 6,098 6,178 6,108 6,184 2013 7,954 7,187 7,104 2013 6,024 5,502 5,363 2012 vs. 2011 -14% -15% -15
Slide 55: Impact on sales from acquisitions
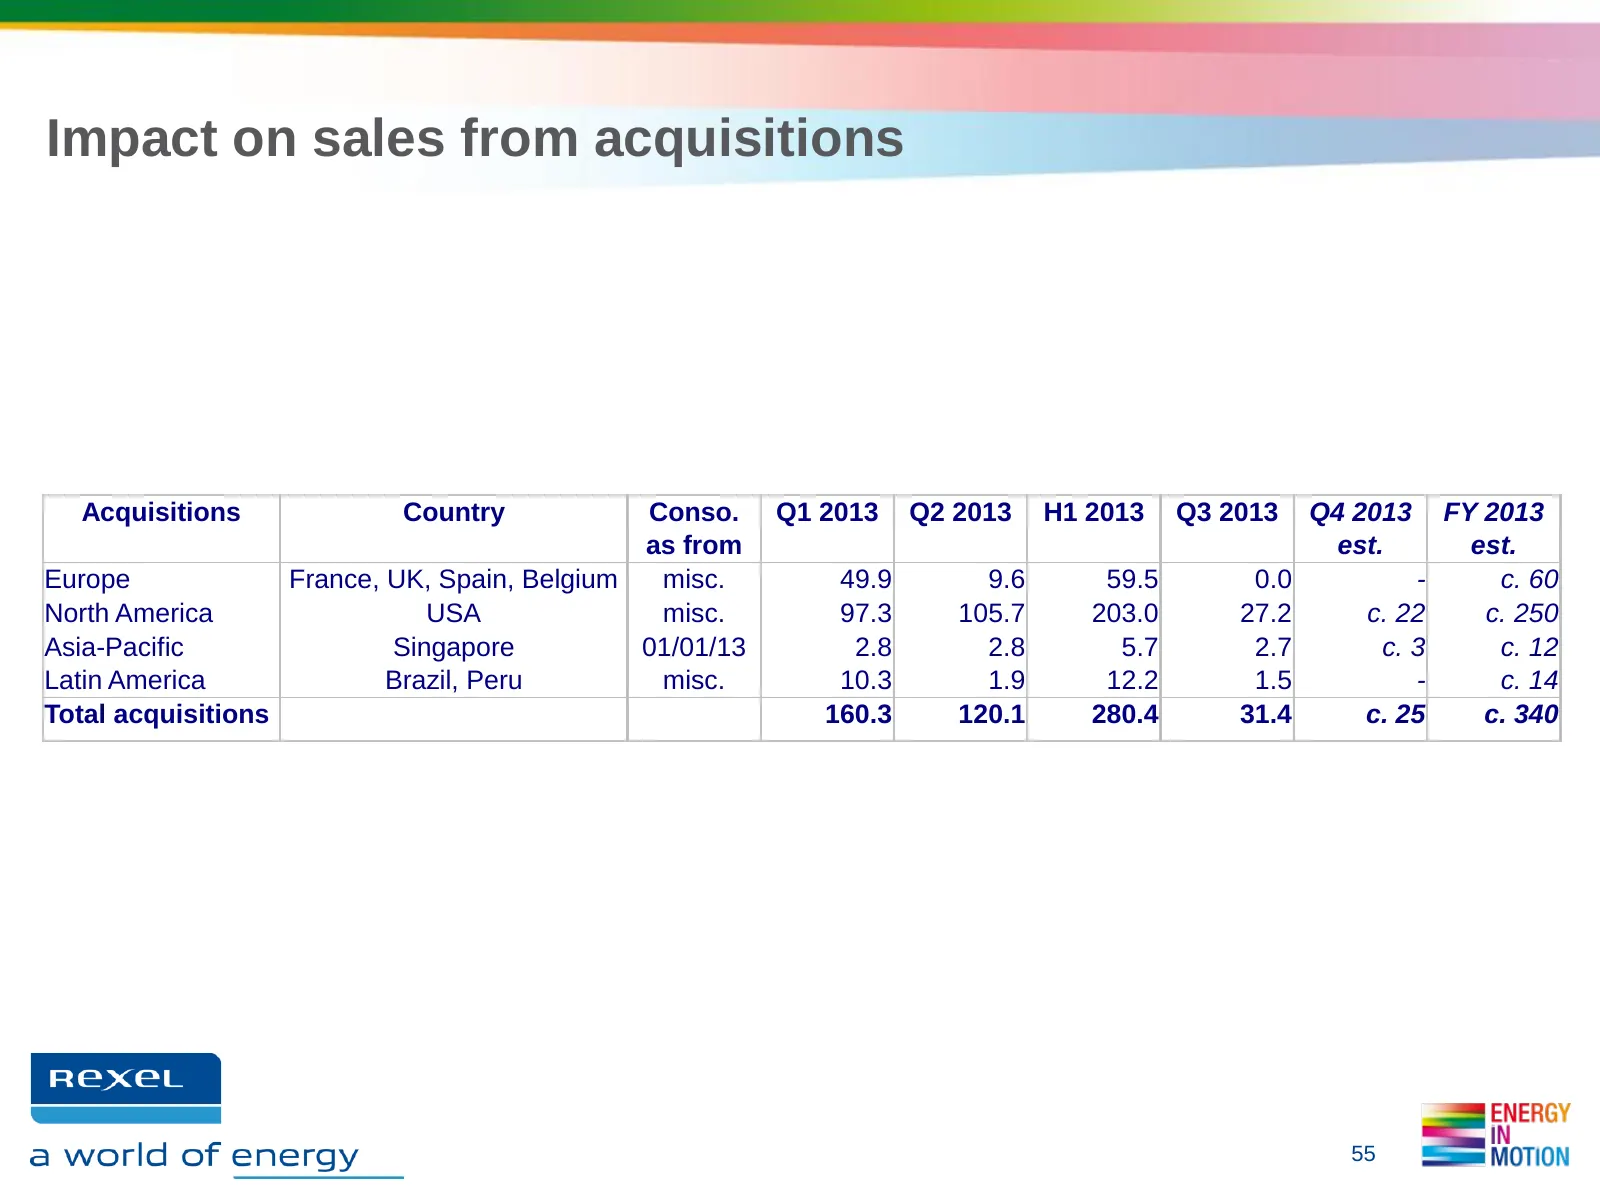
Impact on sales from acquisitions Acquisitions Country Conso. Q1 2013 Q2 2013 H1 2013 Q3 2013 Q4 2013 FY 2013 as from est. est. Europe France, UK, Spain, Belgium misc. 49.9 9.6 59.5 0.0 - c. 60 North America USA misc. 97.3 105.7 203.0 27.2 c. 22 c. 250 Asia-Pacific Singapore 01/01/13 2.8 2.8 5.7 2.7
Slide 56: Calendar impact
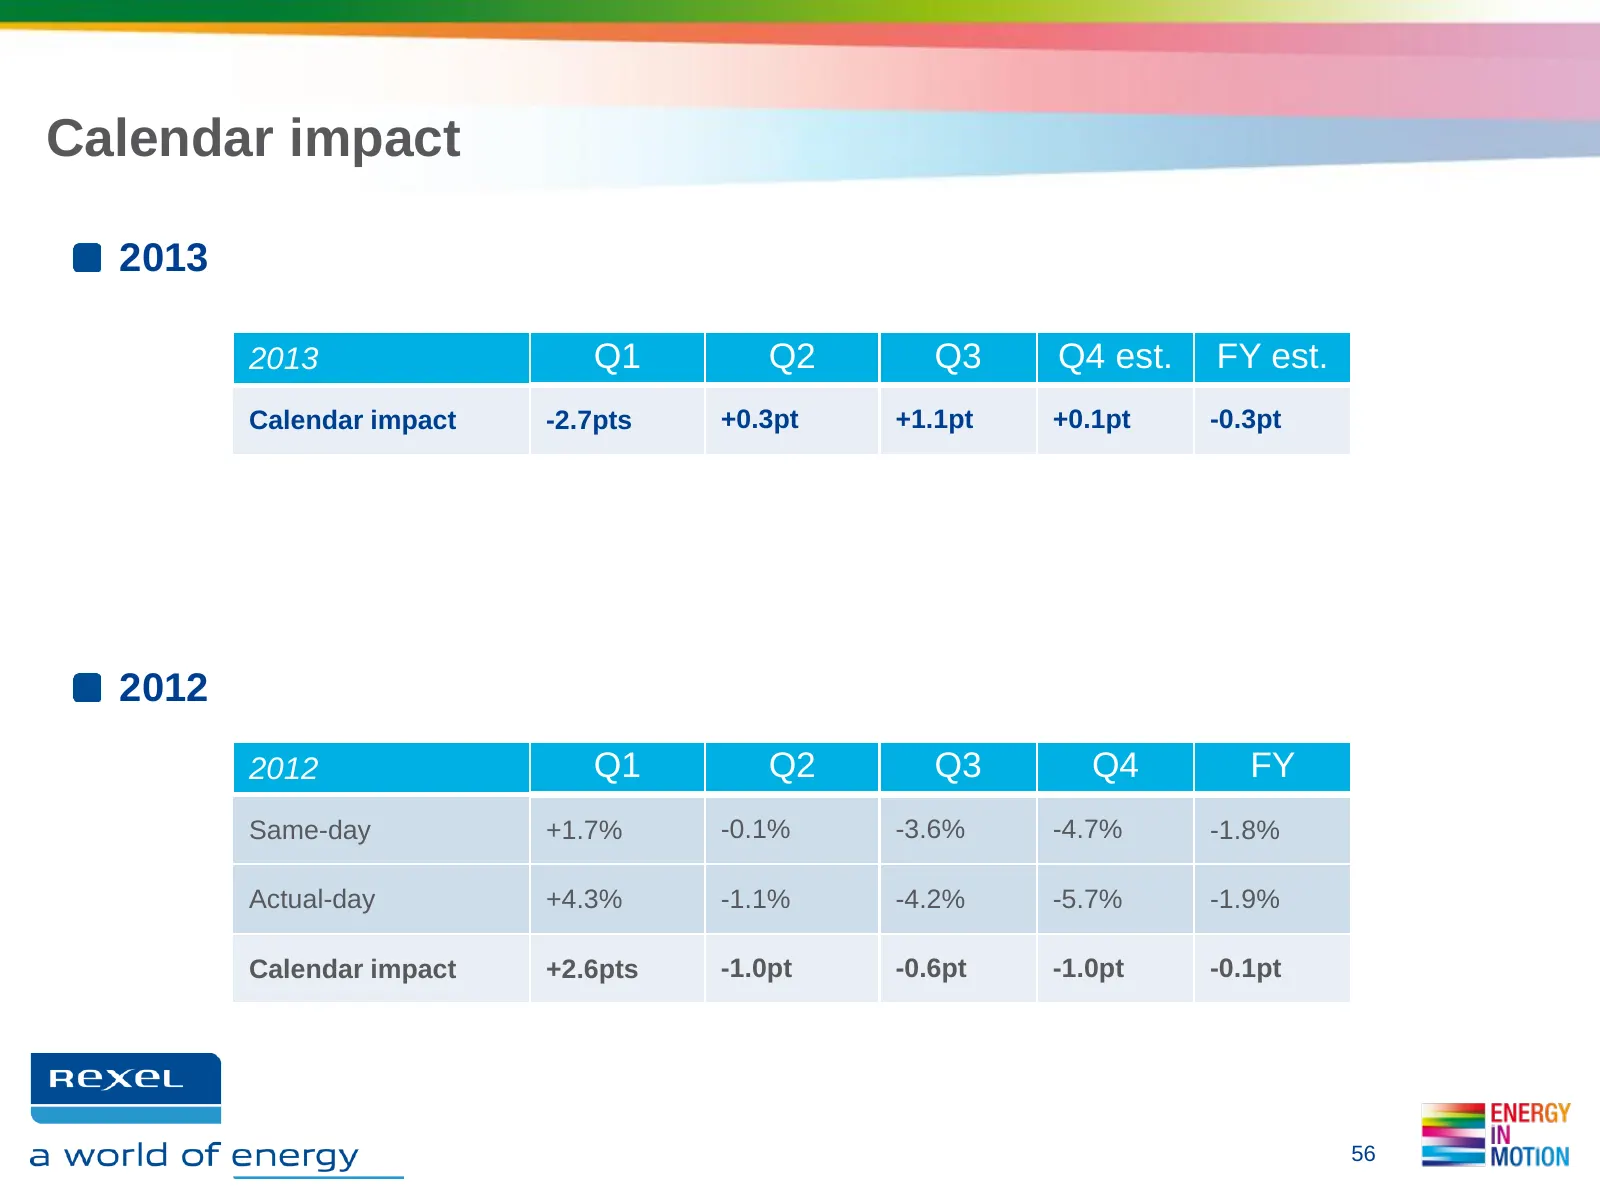
Calendar impact 2013 2013 Q1 Q2 Q3 Q4 est. FY est. Calendar impact -2.7pts +0.3pt +1.1pt +0.1pt -0.3pt 2012 2012 Q1 Q2 Q3 Q4 FY Same-day +1.7% -0.1% -3.6% -4.7% -1.8% Actual-day +4.3% -1.1% -4.2% -5.7% -1.9% Calendar impact +2.6pts -1.0pt -0.6pt -1.0pt -0.1pt 56

Slide 57: 6. Financial Calendar & Contacts
6. FINANCIAL CALENDAR & CONTACTS
Slide 58: Financial Calendar and contacts
Financial Calendar and contacts Financial Calendar Contacts • November 26, 2013 • Investors & Analysts Investor Day Marc MAILLET Tel: +33 1 42 85 76 12 • February 13, 2014 Email: marc.maillet@rexel.com Full-year 2013 results Florence MEILHAC Tel: +33 1 42 85 57 61 Email: florence.meilhac@rexel.com •
Slide 59: Disclaimer
Disclaimer The Group is exposed to fluctuations in copper prices in connection with its distribution of cable products. Cables accounted for approximately 15% of the Group's sales, and copper accounts for approximately 60% of the composition of cables. This exposure is indirect since cable prices al
Source: Internet Archive copy of rexel.com
More decks from Rexel SA
 Q3 2026 Earnings Presentation13 slides · Oct 22, 2026
 Q2 2026 Earnings Presentation24 slides · Jul 27, 2026
 FY 2025 Earnings Presentation31 slides · Feb 11, 2026
 Q3 2025 Earnings Presentation15 slides · Oct 15, 2025
 Q2 2025 Earnings Presentation20 slides · Jul 28, 2025
 Q1 2025 Earnings Presentation16 slides · Apr 29, 2025