Susquehanna Bancshares — Shareholder Meeting (May 2010)
53 slides from Susquehanna Bancshares's shareholder meeting presentation, May 7, 2010

Slide 1: Exhibit 99.1
Exhibit 99.1

Slide 2: Annual Shareholders' Meeting
Susquehanna Bancshares, Inc. Annual Shareholders’ Meeting Susquehanna Bancshares, Inc. Annual Shareholders’ Meeting May 7, 2010 Hershey Lodge and Convention Center Hershey, PA May 7, 2010 Hershey Lodge and Convention Center Hershey, PA
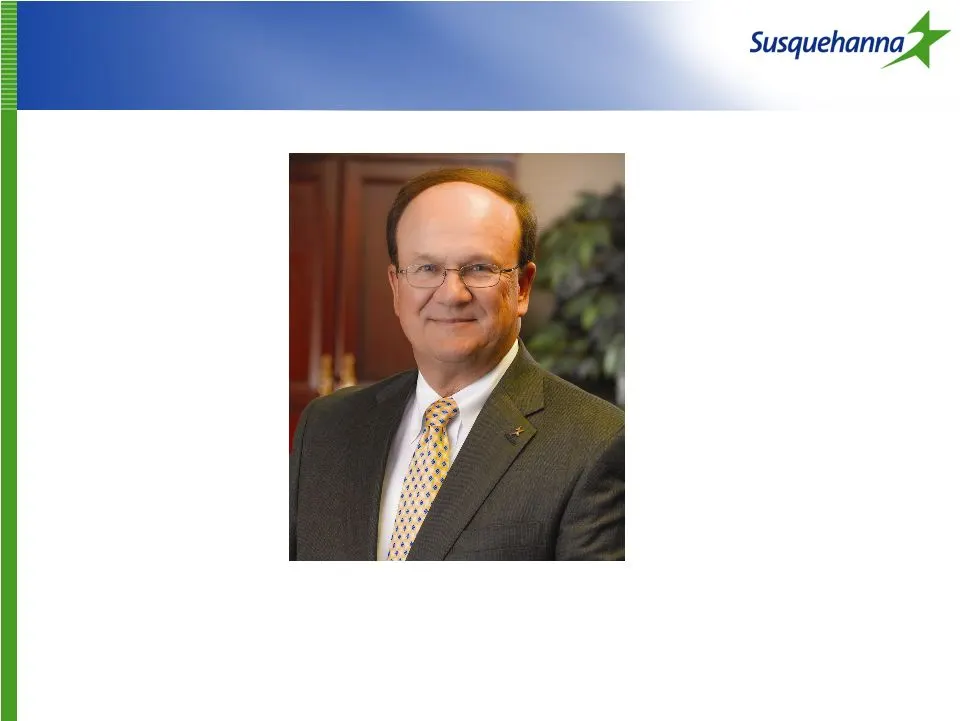
Slide 3: William J. Reuter, Chairman & CEO
William J. Reuter Chairman & CEO

Slide 4: I pledge allegiance to the flag
I pledge allegiance to the flag of the United States of America and to the republic for which it stands: one nation under God, indivisible, with liberty and justice for all.

Slide 5: Directors of Susquehanna
Directors of Susquehanna Directors of Susquehanna Anthony J. Agnone, Sr. Wayne E. Alter, Jr. Peter DeSoto Eddie L. Dunklebarger Bruce A. Hepburn Donald L. Hoffman Guy W. Miller, Jr. Michael A. Morello Scott J. Newkam E. Susan Piersol M. Zev Rose Christine Sears James A. Ulsh Dale M. Weaver Roger V.

Slide 6: Outside Counsel and CPA
Outside Counsel and CPA Outside Counsel and CPA Joanne R. Soslow, Esq. Morgan, Lewis & Bockius, LLP Stephen Connelly PricewaterhouseCoopers, LLP

Slide 7: Executive Officers
Executive Officers Executive Officers Edward Balderston, Jr. Drew K. Hostetter James G. Pierné Michael M. Quick

Slide 8: Management Team
Management Team Management Team Peter R. Unger Stephen E. DiNovis Kenneth R. Collins Lisa M. Cavage Bernard A. Francis, Jr. Michael E. Hough Rodney A. Lefever Joseph R. Lizza John H. Montgomery Jeffrey M. Seibert Edward J. Wydock

Slide 9

Slide 10: Judge of Election and Proxies
Judge of Election and Proxies Judge of Election and Proxies Scot B. Crichton Broadridge Financial Solutions, Inc. Samuel G. Reel, Jr. Thomas R. Diehl

Slide 11

Slide 12: Nominations to Board of Directors
Nominations to Board of Directors Nominations to Board of Directors Anthony J. Agnone, Sr. Wayne E. Alter, Jr. Bruce A. Hepburn Donald L. Hoffman Scott J. Newkam Christine Sears James A. Ulsh Roger V. Wiest, Sr.

Slide 13: Additional Orders of Business
Additional Orders of Business Additional Orders of Business Advisory Vote on Executive Compensation Ratification of PricewaterhouseCoopers LLP as Independent Registered Public Accountants

Slide 14

Slide 15: Voting Results: Directors Elected
Voting Results: Directors Elected Voting Results: Directors Elected Anthony J. Agnone, Sr. Wayne E. Alter, Jr. Bruce A. Hepburn Donald L. Hoffman Scott J. Newkam Christine Sears James A. Ulsh Roger V. Wiest, Sr.

Slide 16: Voting Results: Motions Approved
Voting Results: Motions Approved Voting Results: Motions Approved Resolution Regarding Executive Compensation Approved, in an Advisory Vote Ratification of PricewaterhouseCoopers LLP as Independent Registered Public Accountants

Slide 17

Slide 18: Outgoing Board Members
Outgoing Board Members Outgoing Board Members M. Zev Rose Director since 2002 Served on subsidiary bank board since 1985 Dale M. Weaver Director since 2007 Served on subsidiary bank board since 1977

Slide 19

Slide 20: Forward-looking Statements
Forward-looking Statements Forward-looking Statements During the course of this presentation, management may make projections and other forward-looking statements regarding events or the future financial performance of Susquehanna. In particular, certain statements made during this presentation may

Slide 21: Non-GAAP Financial Measures
Non-GAAP Financial Measures Non-GAAP Financial Measures Throughout this presentation we will show you certain financial measures of Susquehanna's performance or financial position that are not GAAP-based measures. Each one will be denoted with an asterisk (*). The SEC requires us to provide you with

Slide 22

Slide 23: 2009 Accomplishments
2009 Accomplishments 2009 Accomplishments Improved mix of deposits to lower cost of funds Time deposits reduced by 20% Core deposits increased by 19% th quarter net interest margin of 3.77%, highest among our peer banks in northeastern U.S. Originated $2.3 billion in loans Wealth Management business

Slide 24: 2009 Challenges
2009 Challenges 2009 Challenges Credit Quality Repositioned commercial lenders to assist borrowers Conducted special reviews of loans to certain industries Reduced relative size of construction lending portfolio Higher FDIC Payments $3 million in 2008 $75 million in 2009 Regulatory Changes Overdraft

Slide 25: 2010 Developments
2010 Developments 2010 Developments Capital Raise $345 million in common stock $50 million in trust preferred securities Capital Purchase Program Redemption Repaid $200 million of funds to U.S. Treasury Retained $100 million until further economic recovery $10 million reduction in annual preferred d

Slide 26: Capital Ratios
Capital Ratios Capital Ratios 10.0 % 16.98% Total Risk-Based Capital Ratio 6.0 % 14.67% Tier 1 Capital Ratio 5.0 % 12.45% Leverage Ratio N/A 9.03% Tier 1 Common Ratio* N/A 7.78% Tangible Common Ratio (1) * Well-Capitalized Threshold At March 31, 2010 (1) Includes deferred tax liability associated wi

Slide 27
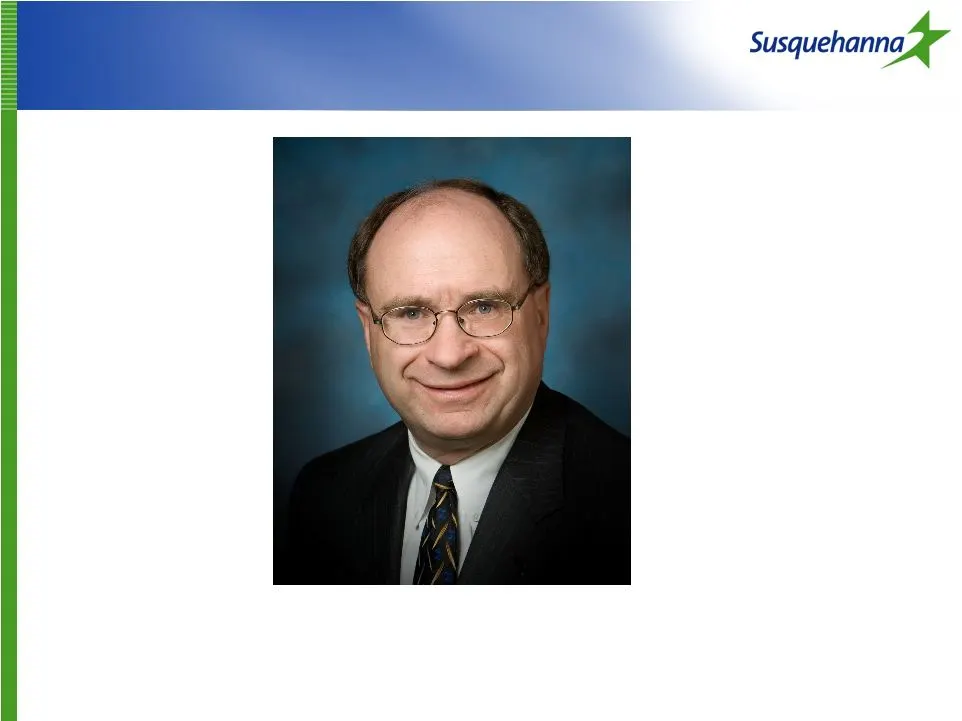
Slide 28: Drew Hostetter, Chief Financial Officer
Drew Hostetter Chief Financial Officer

Slide 29: Susquehanna Stock Price
Susquehanna Stock Price

Slide 30: Texas Ratio, a non-GAAP financial measure
Texas Ratio* a non-GAAP financial measure Non-accruing loans + OREO + 90 days or more past due ÷ Tangible common equity + Loan and lease loss reserve Texas Ratio* a non-GAAP financial measure

Slide 31: Peer Companies
Peer Companies Peer Companies Asset Peers Size Symbol Webster Financial Corporation $18.0 billion WBS Waterbury, CT Fulton Financial Corporation $16.4 billion FULT Lancaster, PA First Niagara Financial Group, Inc. $15.0 billion FNFG Buffalo, NY Valley National Bancorp. $14.5 billion VLY Wayne, NJ Fi

Slide 32: Peer Companies' Texas Ratios
Peer Companies’ Texas Ratios Peer Companies’ Texas Ratios At Peer Texas ratio FNFG 4.95% VLY 9.76% FMER 12.96% NPBC 17.14% FULT 24.01% WBS 30.16% SUSQ 30.62% * WL 62.60% Average 23.08% SUSQ Stock Price $5.89 12/31/2009

Slide 33: Susquehanna NPA Ratio
Susquehanna NPA Ratio Susquehanna NPA Ratio 1Q09 2Q09 3Q09 4Q09 1Q10 1.98% 2.49% 2.90% 2.63% 2.89% Non accruing loans + OREO + 90 days or more past due divided by total loans, leases and OREO

Slide 34: Peer Companies' NPA Ratios
Peer Companies’ NPA Ratios Peer Companies’ NPA Ratios At At 3/31/2010 12/31/2009 VLY 1.05% 1.08% FNFG 1.14% 1.03% FMER 1.93% 1.96% NPBC 1.96% 2.15% FULT 2.60% 2.54% SUSQ 2.89% 2.63% WBS 3.38% 3.53% WL 6.33% 5.79% Average 2.66% 2.59%

Slide 35: SUSQ Tangible Common Equity to Tangible Assets Ratio
SUSQ Tangible Common Equity to Tangible Assets Ratio * SUSQ Tangible Common Equity to Tangible Assets Ratio * 1Q09 2Q09 3Q09 4Q09 1Q10 4.88% 4.97% 5.29% 5.31% 7.78%

Slide 36: Peers' Tangible Common Equity to Tangible Assets Ratio
Peers’ Tangible Common Equity to Tangible Assets Ratio Peers’ Tangible Common Equity to Tangible Assets Ratio At At 3/31/2010 12/31/2009 FNFG 10.51% 10.54% WL 8.18% 5.40% FULT pro forma 7.98% 6.30% FMER 7.93% 8.99% SUSQ 7.78% * 5.31% * NPBC 6.91% 6.64% VLY 6.55% 6.68% WBS 5.59% 5.54% Average 7.66% 7

Slide 37: SUSQ Loan Lease Loss Provision to Average Loans Lease Ratios
SUSQ Loan Lease Loss Provision to Average Loans Lease Ratios SUSQ Loan Lease Loss Provision to Average Loans Lease Ratios 1Q09 2Q09 3Q09 4Q09 1Q10 1.47% 2.04% 1.93% 2.21% 1.83%

Slide 38: Peers' Loan Lease Loss Provision to Average Loans Lease Ratios
Peers’ Loan Lease Loss Provision to Average Loans Lease Ratios Peers’ Loan Lease Loss Provision to Average Loans Lease Ratios 1Q10 VLY 0.54% 0.49% FNFG 0.73% 0.65% FULT 1.36% 1.59% FMER 1.45% 1.38% WBS 1.59% 2.59% SUSQ 1.83% 1.92% NPBC 2.20% 2.45% WL 3.56% 2.22% Average 1.66% 1.66%

Slide 39: SUSQ Pre-Provision Pretax Income to Average Assets Ratio
SUSQ Pre-Provision Pretax Income to Average Assets Ratio SUSQ Pre-Provision Pretax Income to Average Assets Ratio 1Q09 2Q09 3Q09 4Q09 1Q10 1.27% 0.93% 1.56% 1.79% 1.55%

Slide 40: Peers' Pre-Provision Pretax Income to Average Assets Ratio
Peers’ Pre-Provision Pretax Income to Average Assets Ratio Peers’ Pre-Provision Pretax Income to Average Assets Ratio 1Q10 FULT 1.89% 1.70% FMER 1.80% 1.91% FNFG 1.62% 1.42% SUSQ 1.55% 1.39% VLY 1.50% 1.51% NPBC 1.40% 0.18% WL 1.20% 1.46% WBS 1.02% 0.99% Average 1.50% 1.32%

Slide 41: SUSQ Margin Trend FTE
SUSQ Margin Trend FTE SUSQ Margin Trend FTE 1Q09 2Q09 3Q09 4Q09 1Q10 3.40% 3.52% 3.64% 3.77% 3.80%

Slide 42: Peers' Margin Trend FTE
Peers’ Margin Trend FTE Peers’ Margin Trend FTE 1Q10 SUSQ 3.80% 3.58% FULT 3.78% 3.52% FMER 3.72% 3.58% VLY 3.65% 3.49% FNFG 3.61% 3.65% NPBC 3.44% 3.18% WBS 3.28% 3.13% WL 3.03% 3.08% Average 3.54% 3.40%

Slide 43: SUSQ Texas Ratio
SUSQ Texas Ratio * SUSQ Texas Ratio * 1Q09 2Q09 3Q09 4Q09 1Q10 25.69% 31.06% 34.18% 30.62% 24.72%

Slide 44: Peers' Texas Ratio at 03/31/10
Peers’ Texas Ratio at 03/31/10 Peers’ Texas Ratio at 03/31/10 At 3/31/2010 FNFG 5.41% VLY 9.71% FMER 13.38% NPBC 15.16% FULT pro forma 20.40% SUSQ 24.72% * WBS 27.91% WL 48.83% Average 20.11% SUSQ Stock Price $10.90

Slide 45
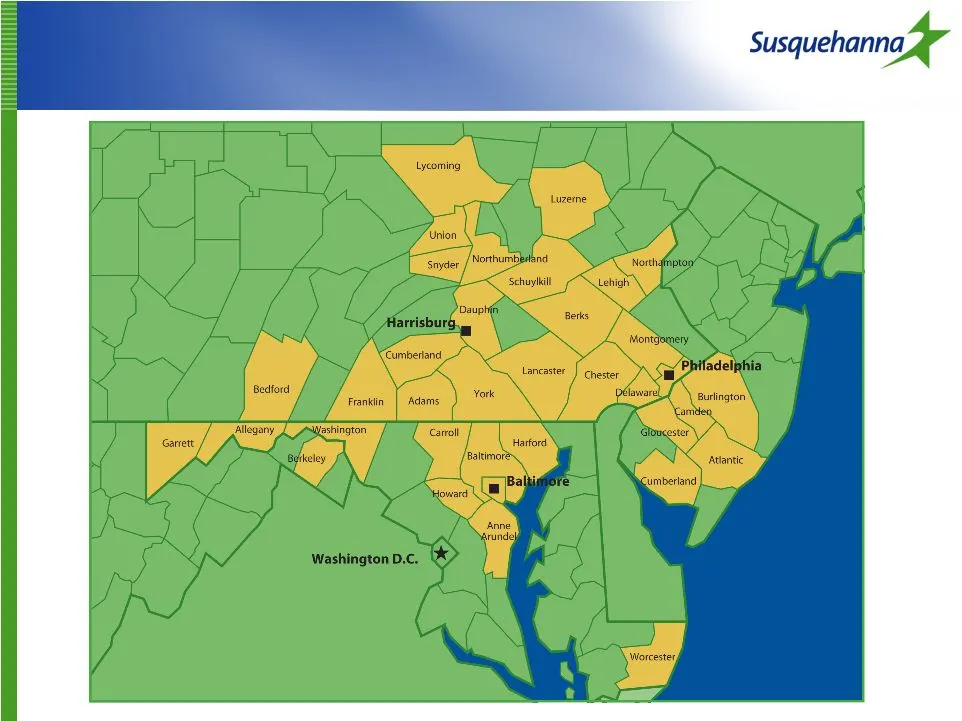
Slide 46: Susquehanna Bank Market Area
Susquehanna Bank Market Area Susquehanna Bank Market Area

Slide 47: Susquehanna Strengths
Susquehanna Strengths Susquehanna Strengths Unique market footprint Demographically and economically diverse Strong market presence Among top 4 banks in market share in 11 out of 20 markets From – 2009, improved market share in out of 20 markets Significant market share in Lancaster, PA and Hagersto

Slide 48: Susquehanna Strengths
Susquehanna Strengths Susquehanna Strengths Lending focused in relatively stable geographic market Wide range of financial products & services creates opportunity for cross-selling Customer service Susquehanna Bank ranked second among Mid-Atlantic banks in J.D. Power and Associates 2010 Retail Banki

Slide 49

Slide 50: Questions and Answers
Questions and Answers Questions and Answers Microphones are available at the front of the aisles.

Slide 51: Quarterly Webcast
Quarterly Webcast Quarterly Webcast www.susquehanna.net

Slide 52: Annual Shareholders' Meeting - Thank you for attending
Susquehanna Bancshares, Inc. Annual Shareholders’ Meeting Susquehanna Bancshares, Inc. Annual Shareholders’ Meeting Thank you for attending. Thank you for attending.

Slide 53
Source: SEC EDGAR · 8-K filed May 7, 2010
More decks from Susquehanna Bancshares Inc
 Investor Presentation (December 2014)51 slides · Dec 3, 2014
 Merger or Acquisition (November 2014)28 slides · Nov 17, 2014
 Merger or Acquisition (November 2014)13 slides · Nov 12, 2014
 Q2 2014 Earnings Presentation46 slides · Aug 11, 2014
 Investor Presentation (May 2014)44 slides · May 5, 2014
 Shareholder Meeting (May 2014)35 slides · May 2, 2014