MidSouth Bancorp — Howe Barnes, Hoefer & Arnett conference 2008
31 slides from MidSouth Bancorp's conference presentation, Aug 20, 2008

Slide 1: MidSouth Bancorp, Inc.
A MidSouth Bancorp, Inc.

Slide 2: Howe Barnes, Hoefer & Arnett, August 19-20, 2008
AMEX: MSL Howe Barnes, Hoefer & Arnett August 19-20, 2008 __________________________________________________________________________________________________________ C.R. “Rusty” Cloutier President & Chief Executive Officer J. Eustis Corrigan, Jr. Senior Executive Vice President and Chief Financial O

Slide 3: Forward-looking statements safe harbor
The Private Securities Litigation Act of 1995 provides a safe harbor for disclosure of information about a company’s anticipated future financial performance. This act protects a company from unwarranted litigation if actual results differ from management expectations. This discussion and analysis r
Slide 4: Corporate Profile
Corporate Profile Growth-oriented, bank holding company Headquarters: Lafayette, Louisiana Employees: 425 ● Locations: 35 ● ATMs: 170+ Market Statistics as of June 30, 2008 : Ø Total Assets: $938 Million Ø Market Cap: $109.3 Million Ø Stated Book Value: $10.54 (168%) ● Tangible Book Value: $9.08 (19
Slide 5: Corporate Profile: History and Business Fundamentals
Corporate Profile CORPORATE HISTORY 1985 - Chartered as a National Bank 1987 - Acquired Breaux Bridge Bank & Trust (LA) 1989 - Acquired Commerce & Energy Bank (LA) 1993 - Listed on AMEX: MSL 1995 - Acquired Sugarland State Bank (LA) 2004 - Acquired Lamar Bank (Beaumont, TX) 2008 - Merged MidSouth Ba
Slide 6: Reasons to Invest in MidSouth Bancorp
Corporate Profile Reasons to Invest in MidSouth Bancorp • Strategically positioned in attractive markets • Liquid, well-fortified balance sheet • Solid core deposit base • Experienced senior management and board • Strong capital position
Slide 7: Financial Performance: Earnings Results
Financial Performance YOY D LQ D 6.5% 6.1% 144.3% -28.8% 3.1% 6.0% 20.0% 7.8% -66.9% 63.9% -43.2% 18.3% -44.7% 16.7% Earnings Results 2Q08 2Q07 1Q08 Net Interest Income 9,839 9,237 9,274 Loan Loss Provision 1,200 Total Non-Interest Income 3,804 3,690 3,587 Total Non-Interest Expense 11,093 9,245 10,
Slide 8: Financial Performance: Balance Sheet Position
Financial Performance YOY D LQ D 4.0% -0.47% 20.6% 1.02% 13.8% 0.09% 13.0% -0.97% 11.3% -0.79% Balance Sheet Position 2Q08 2Q07 1Q08 Total Loans 567,087 545,447 569,745 Premises and Equipment 40,375 33,477 39,967 Total Assets 937,857 824,026 937,030 Total Deposits 810,083 716,892 818,004 Total Share
Slide 9: Financial Performance: Sound Capital Levels
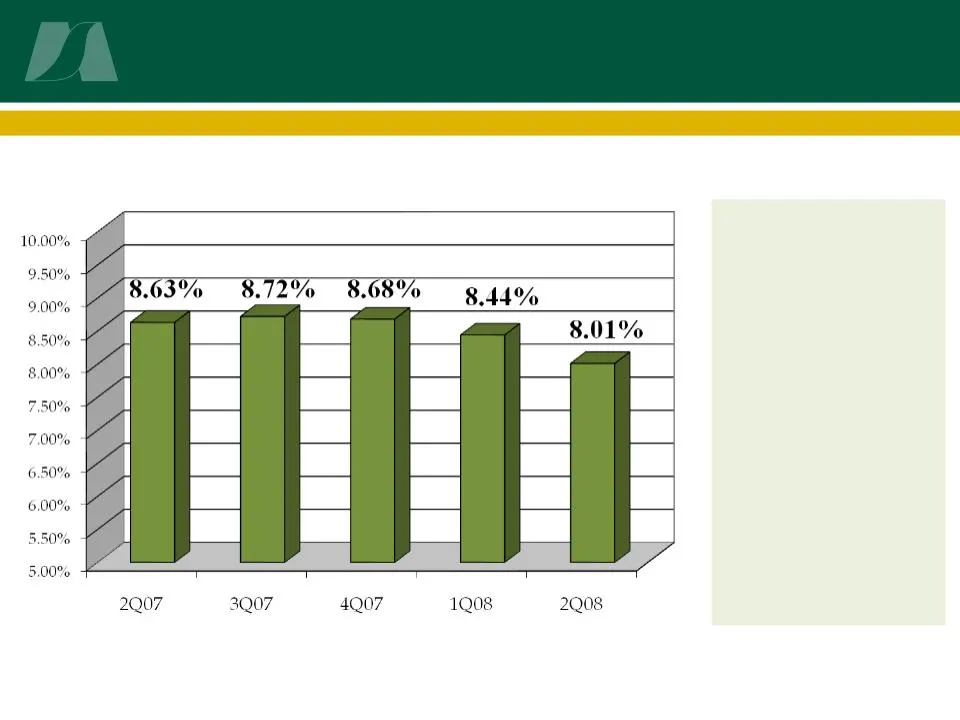
Financial Performance Sound Capital Levels ▪ Company is well capitalized ▪ Current uses of capital: - organic growth - stock buyback - acquisitions Leverage Ratio
Slide 10: Financial Performance: Yields
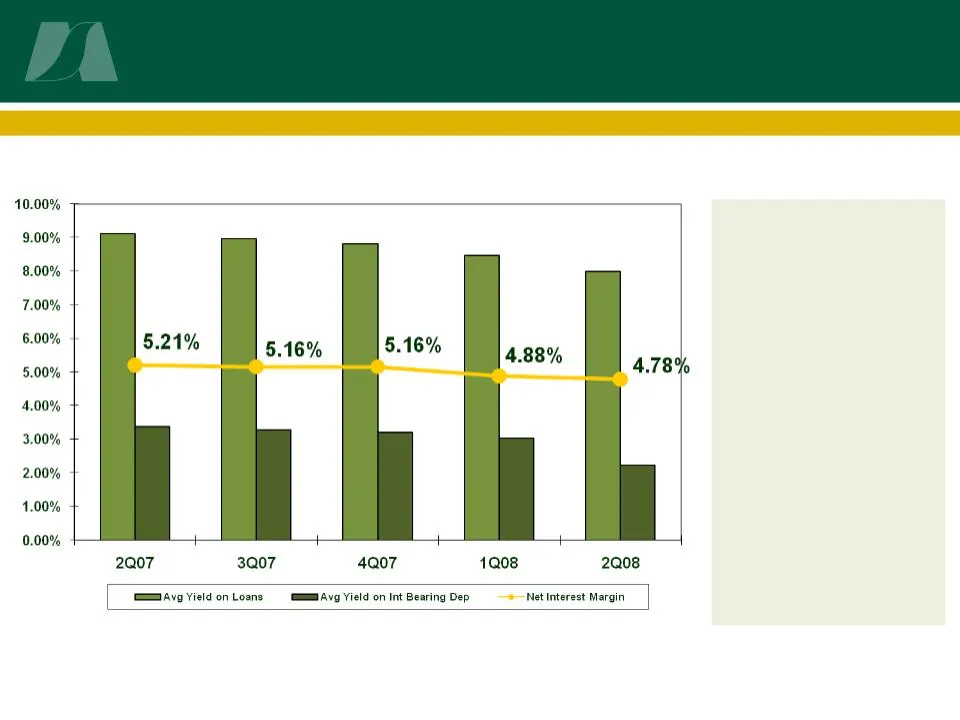
Financial Performance Yields ▪ NIM remains near the top of peer group ▪ Asset-sensitive ▪ Active management of Loan/Deposit Pricing ▪ Focus on deposit mix

Slide 11: Financial Performance: Credit Quality
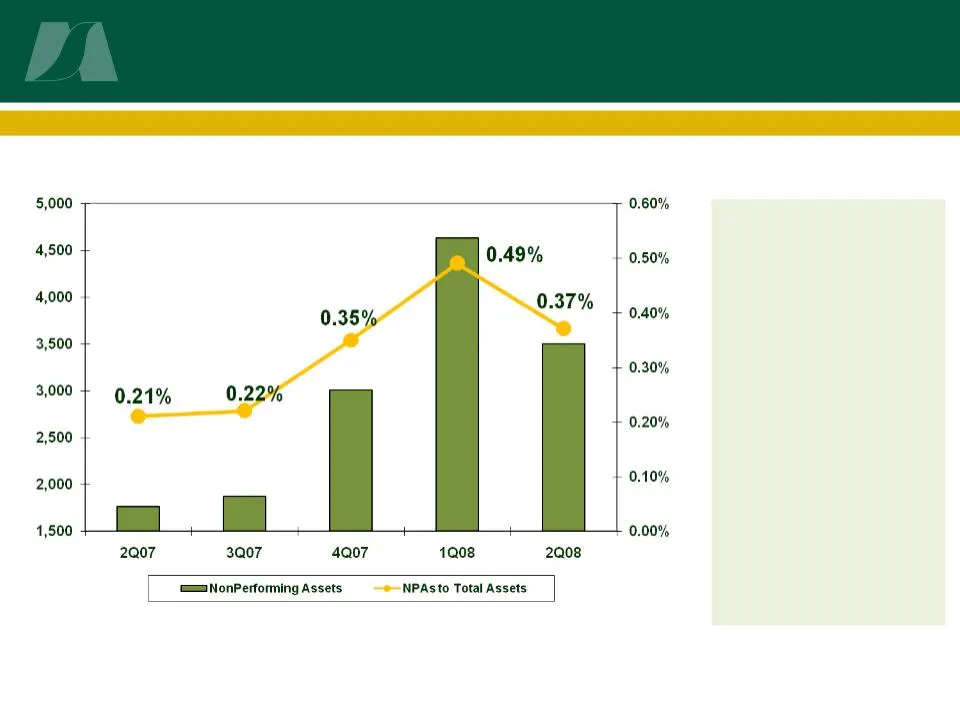
Financial Performance Credit Quality 2Q07 1Q08 2Q08 LQ D Allowance as a % of TTL Loans 0.95% 1.08% 1.11% bps NPA's to Total Assets 0.21% 0.49% 0.37% -12 bps Net YTD Charge-offs to TTL Loans 0.05% 0.48% 0.44% -4 bps • Non-accrual loans totaled $2.4 million, of which $685,000 is residential constructi
Slide 12: Financial Performance: Asset Quality
Financial Performance Asset Quality ▪ Engaged & Focused on Regional Economies ▪ Experienced and Accomplished Management & Board
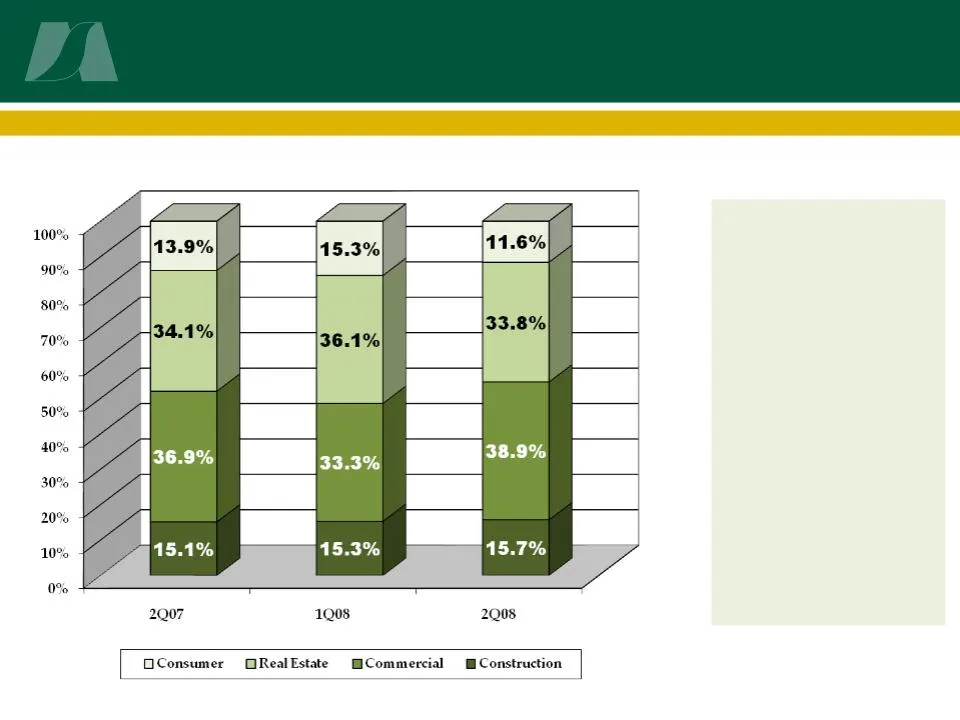
Slide 13: Financial Performance: Loan Mix
Financial Performance Loan Mix § Diversified Loan Portfolio: Industry & Geography - Mining 11% - Construction 11% - Services 22%
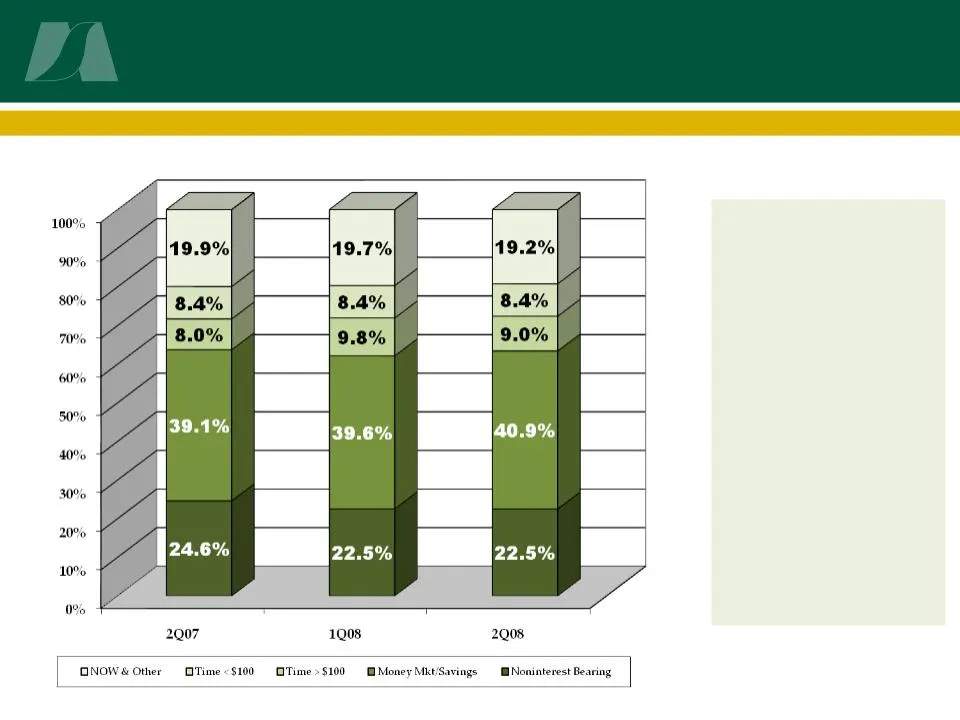
Slide 14: Financial Performance: Deposit Mix
Financial Performance Deposit Mix § Strong & Stable Core Funding Source § Maintaining Solid Non-Interest Bearing Base § Regional Economies Affecting Deposit Levels
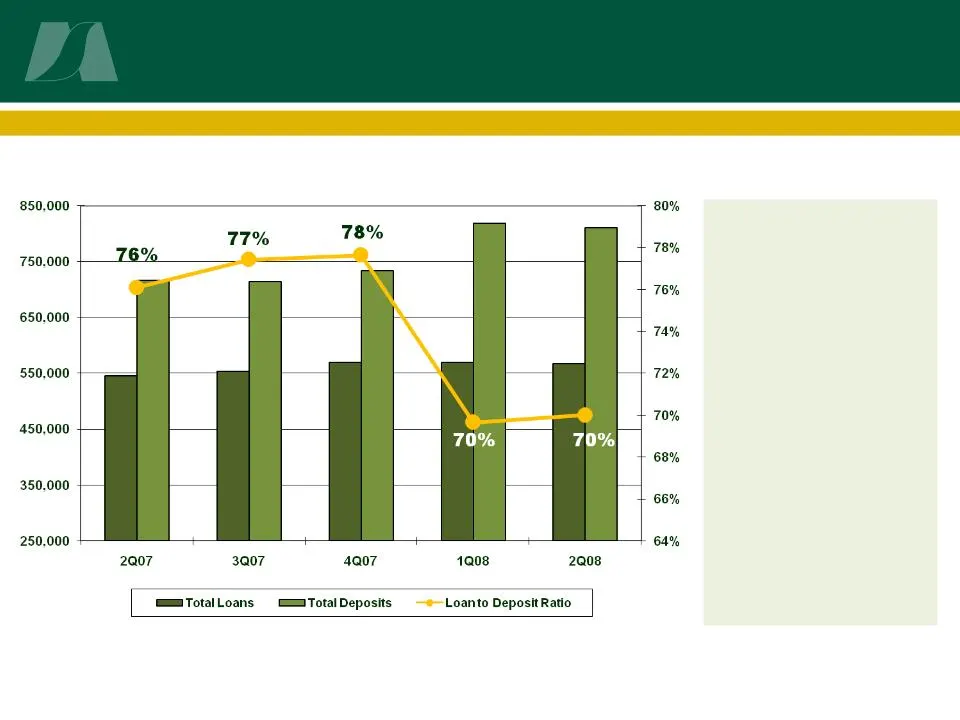
Slide 15: Financial Performance: Core Funding
Financial Performance Core Funding ▪ Funding Capacity ▪ Challenging Markets ▪ Loan Growth Suppressed by Customer Liquidity
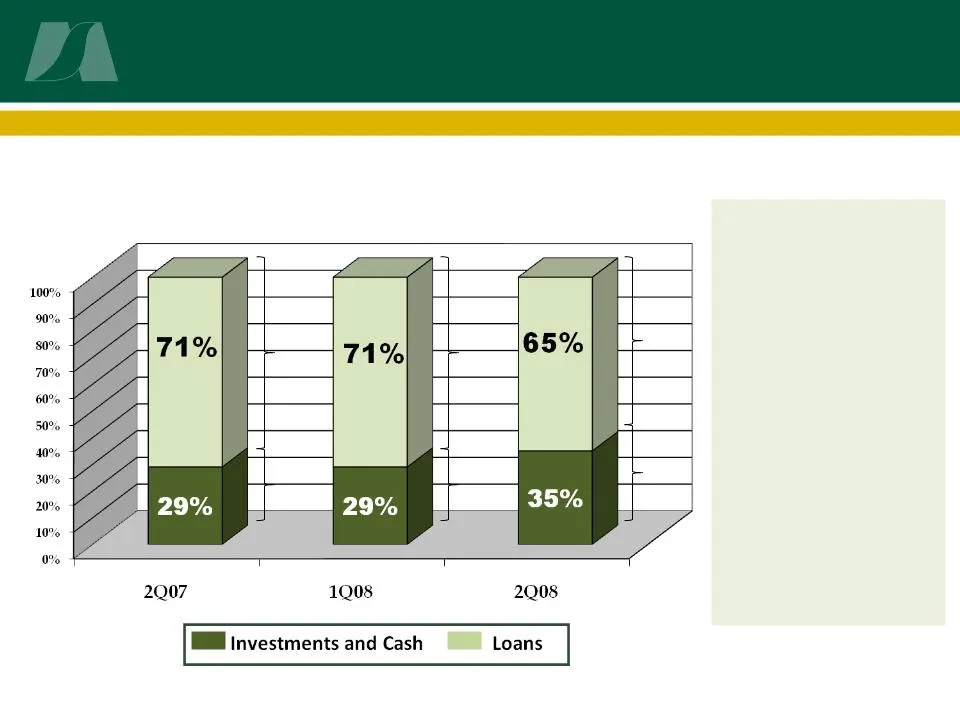
Slide 16: Financial Performance: Earning Asset Mix
Financial Performance Earning Asset Mix Tax Equivalent Yield - Securities • 4.92%- 2Q08 • 5.04%- 2Q07 5.07% 4.74% 4.08% 9.12% 8.48% 7.99%
Slide 17: Franchise Expansion
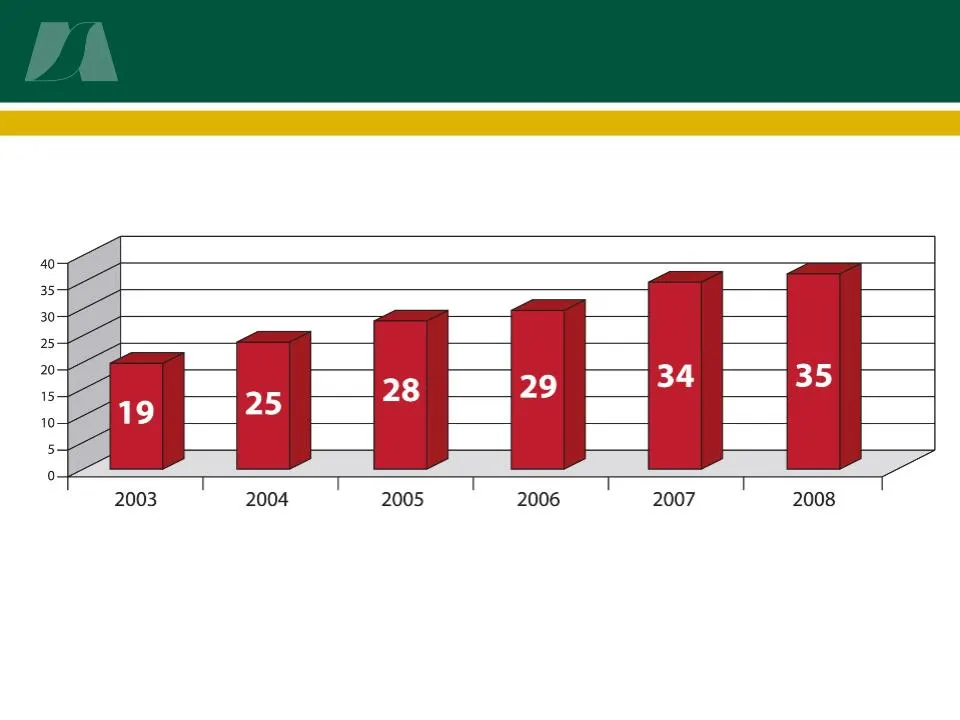
Franchise Expansion 2008 Locations • Aggressive branch and franchise expansion plan • Number of employees nearly doubled in 5 years • Well-positioned in attractive markets
Slide 18: Current Market Footprint
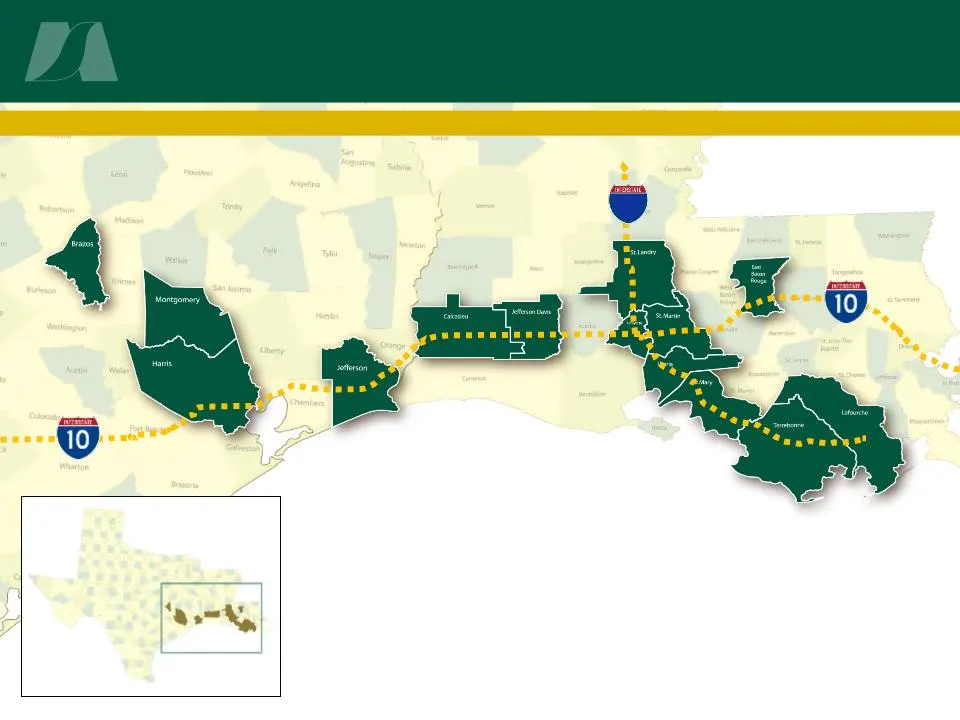
Current Market Footprint 49 · Strategically Located along I-10, I-49 and Hwy 90 Corridors
Slide 19: Market Employment
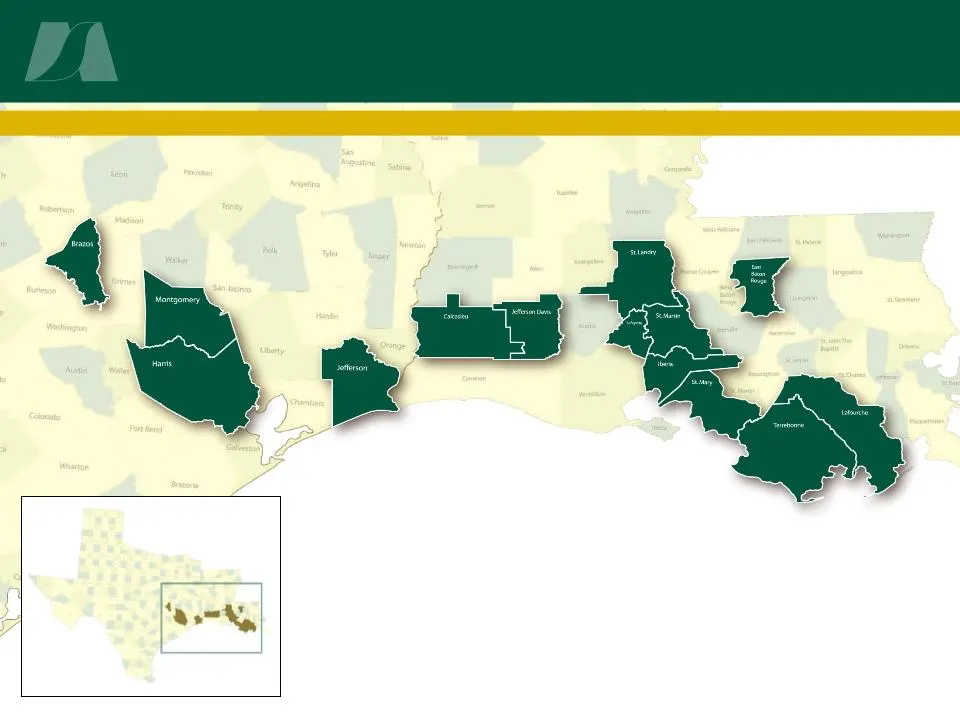
3.3 3.8 4.2 5.8 3.6 3.3 4.2 3.5 3.2 2.7 3.3 3.6 2.7 2.7 Market Employment · Unemployment Rates significantly below national · Sustained job growth Source: Bureau of Economic Analysis
Slide 20: MSA Economic Profile: Lake Charles
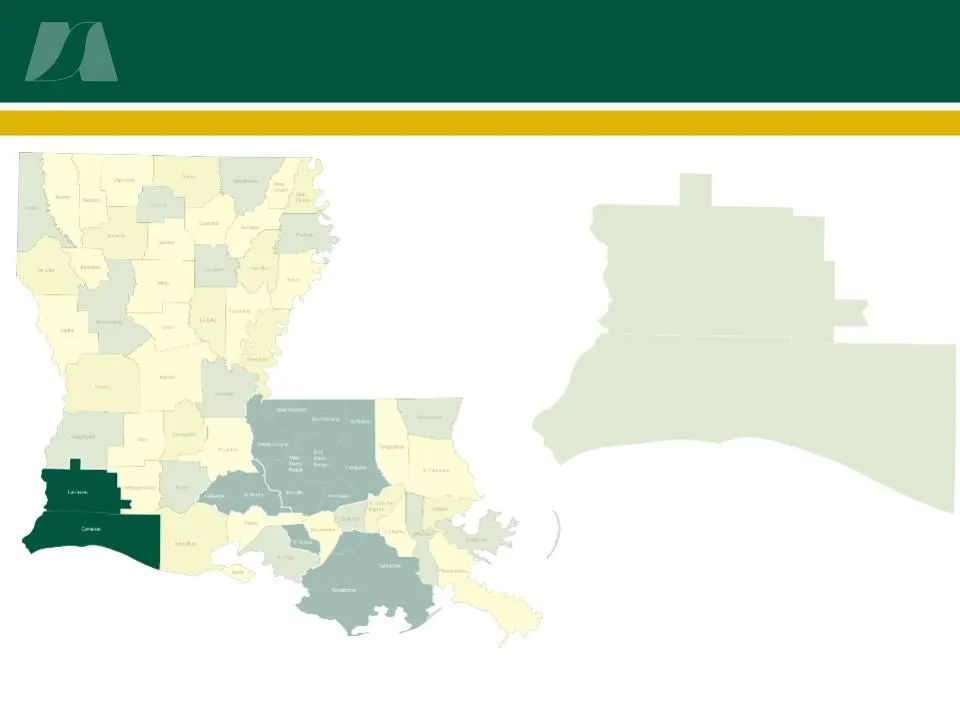
MSA Economic Profile Lake Charles MSA (92,900 non-farm jobs) Regional President: John Nichols locations ● In Top 5 fastest growing MSA in the U.S. ● Projected 2,800 new jobs over 2008-09. ● Fully recovered from Hurricane Rita and now setting record levels of employment. ● 3 dominant industries: Petr
Slide 21: MSA Economic Profile: Lafayette
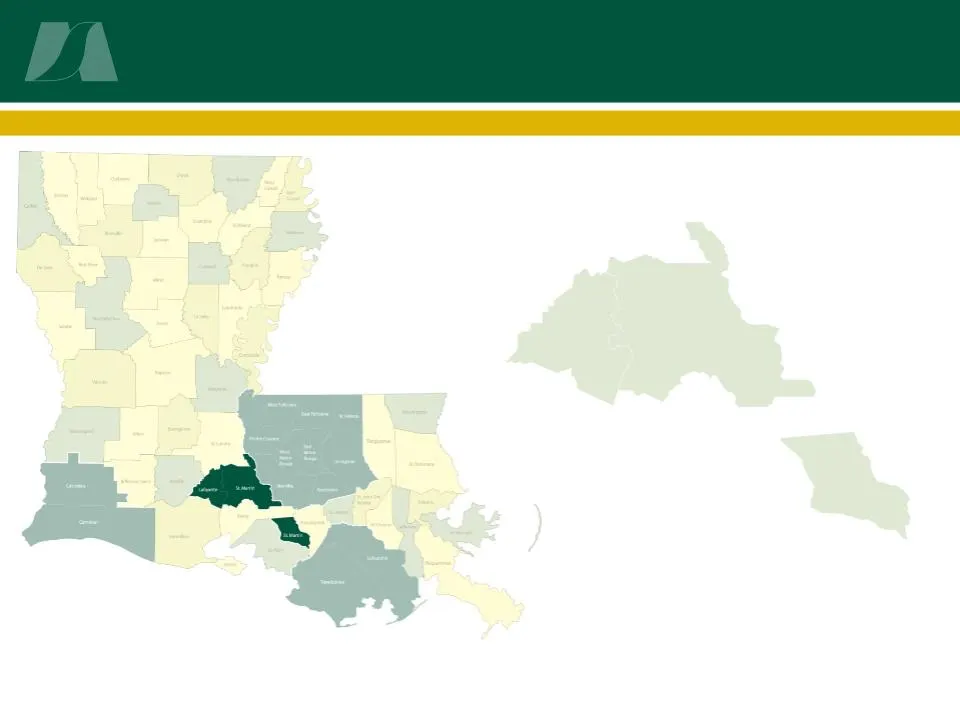
MSA Economic Profile Lafayette MSA (152,200 non-farm jobs) Regional Presidents: Central LA- Glenn Decou locations Rural LA- Irving Boudreaux locations ● Projected 6,300 new jobs over 2008-09. ● Third fastest growing MSA in Louisiana. ● High concentration of firms associated with oil and gas extracti
Slide 22: MSA Economic Profile: Baton Rouge
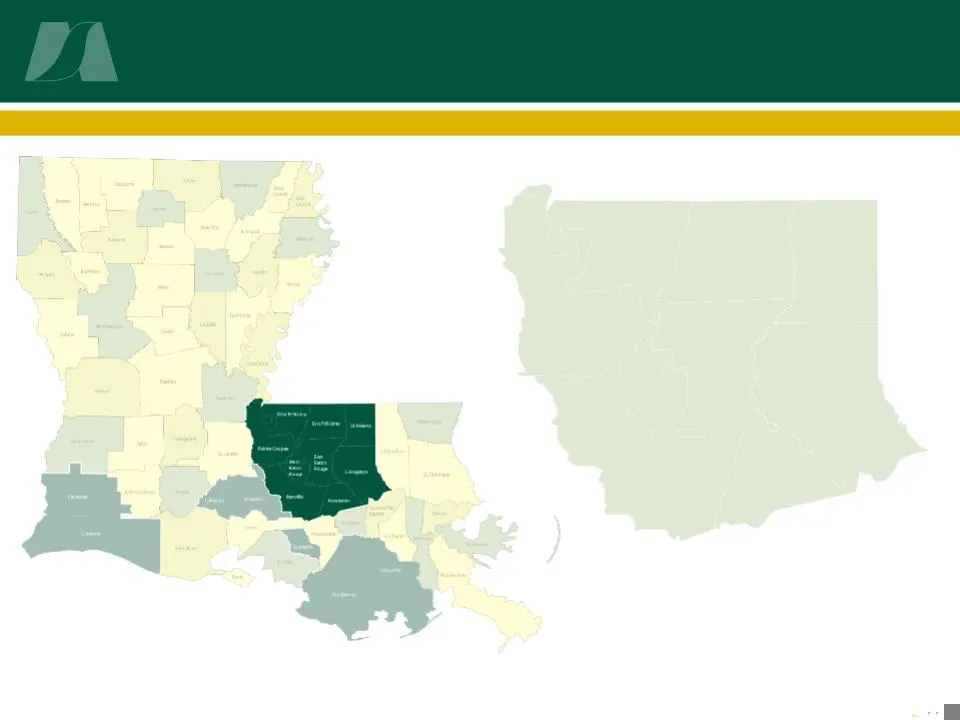
MSA Economic Profile Baton Rouge MSA (374,000 non-farm jobs) Regional President: Jim Greely locations ● Projected 14,800 new jobs over 2008-09. ● Home of two major universities - LSU and Southern University, the State Capitol, and the country’s second largest refinery. ● Incurred over 35,000 permane
Slide 23: MSA Economic Profile: Houma
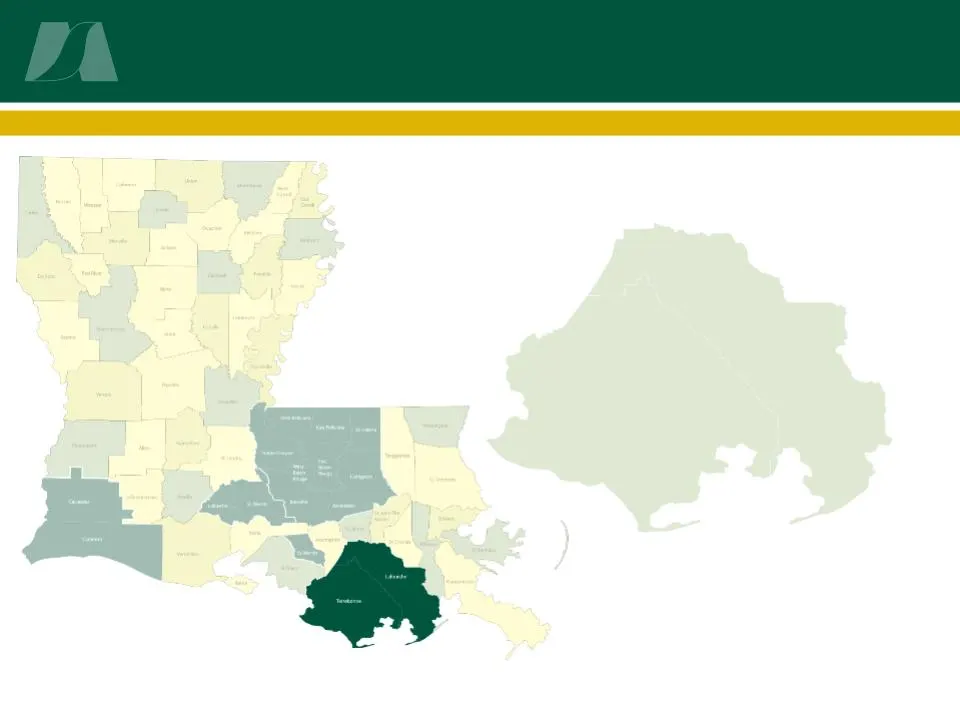
MSA Economic Profile Houma MSA (96,800 non-farm jobs) Regional President: Troy Cloutier locations ● In Top 5 fastest growing MSA in the U.S. and fastest growing in Louisiana. ● Projected 5,200 new jobs over 2008-09. ● Significant shipbuilding and fabrication sector which benefits from the rebuild ef
Slide 24: East Texas Economic Profile: Houston MSA
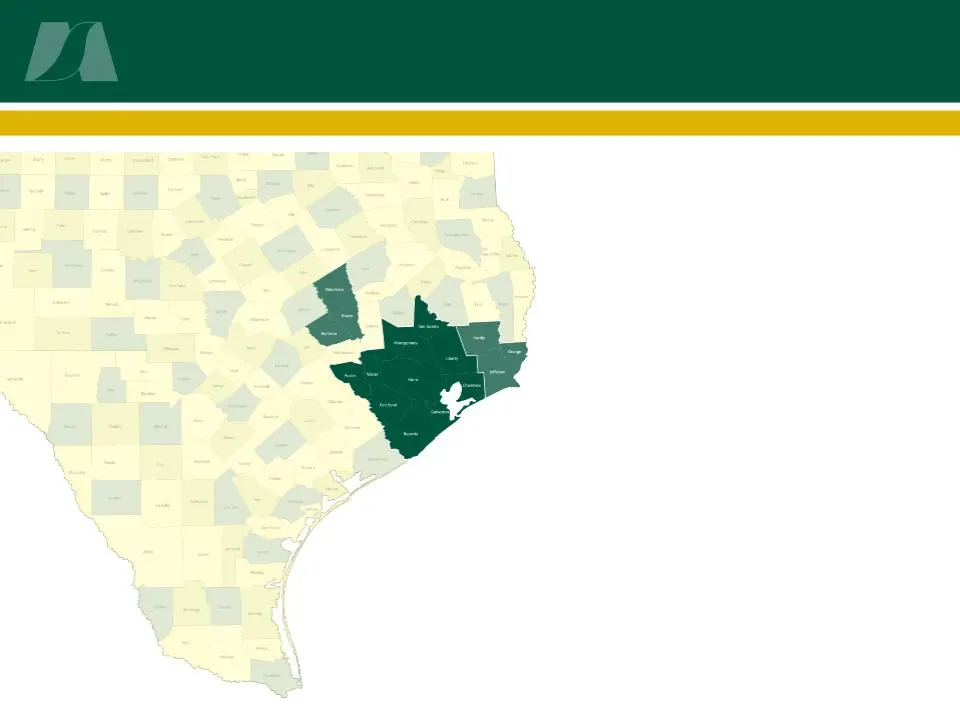
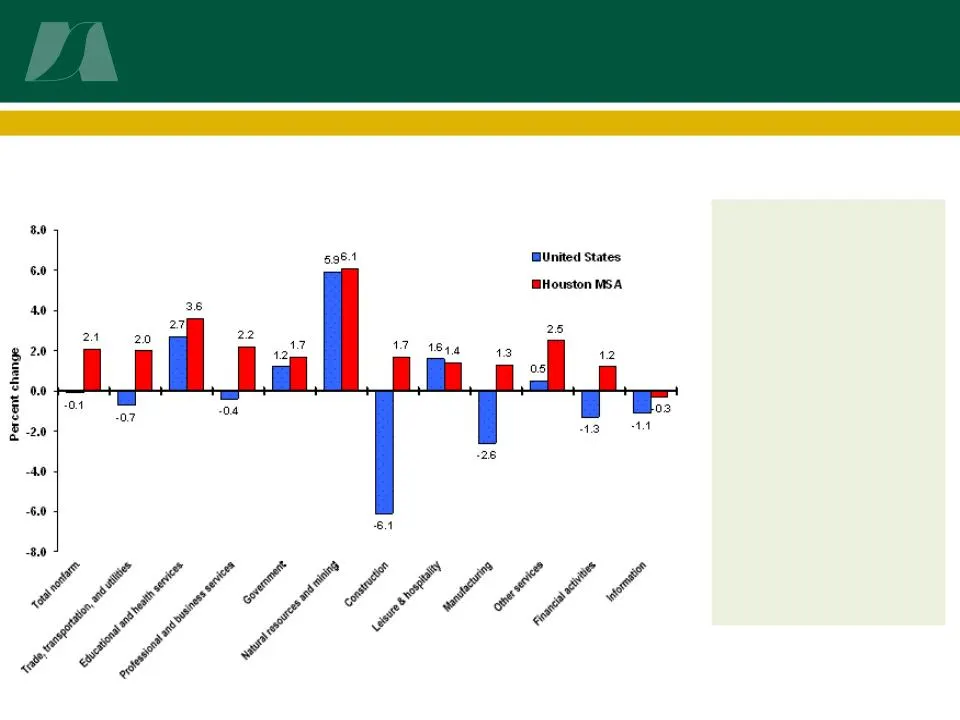
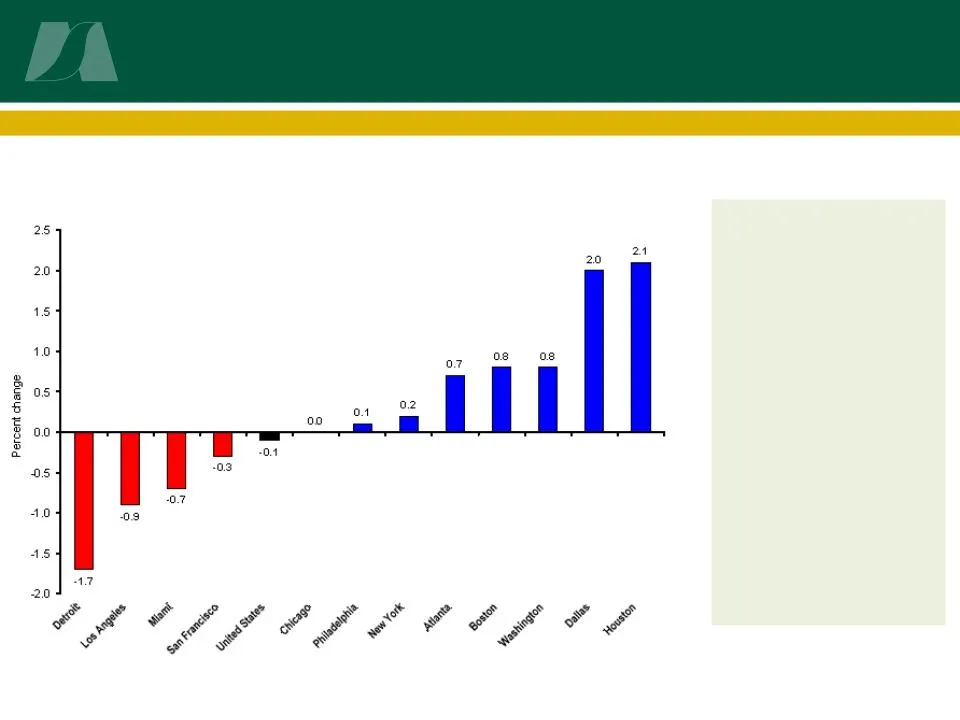
East Texas Economic Profile Houston MSA (2,619,300 non-farm jobs) Regional President: Ron Reed locations ● The Houston MSA’s job growth was #1 among the 12 largest MSAs in the country, adding 54,100 jobs from June 2007 to June 2008. ● Houston’s non-farm employment rose 2.1% compared to a 0.1 % decli
Slide 25: East Texas Economic Profile: Employment Growth vs. US
East Texas Economic Profile ▪ Houston’s annual construction employment grew by 1.7%, compared to a 6.1% decline nationally. ▪ Manufacturing employment grew by 1.3%, compared to a national 2.6% decline. Source: US Bureau of Labor Statistics Houston MSA Employment Growth vs. US
Slide 26: East Texas Economic Profile: Top 12 MSA Employment Growth
East Texas Economic Profile ▪ Of the 12 largest MSAs in the country, Houston’s MSA ranked #1 in job growth at 2.1%. ▪ Bolstering the East Texas region, Dallas followed closely at 2.0% employment growth. Source: US Bureau of Labor Statistics Top 12 National MSA Employment Growth
Slide 27: Unemployment Rates
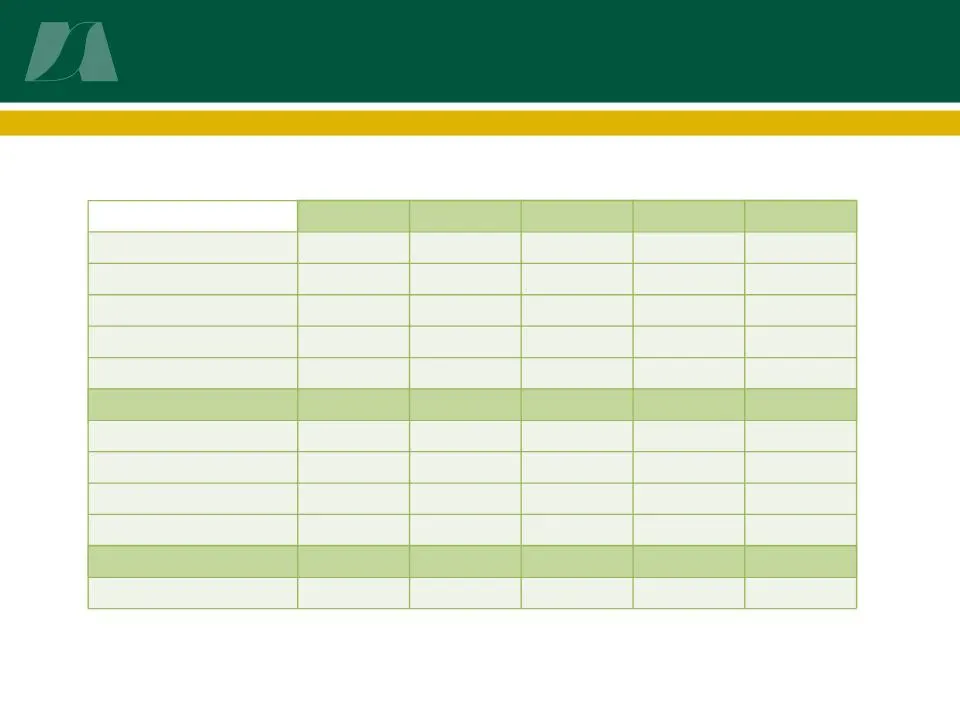
Unemployment Rates Market MSAs Jan-08 Feb-08 Mar-08 Apr-08 May-08 Louisiana 4.6 3.5 4.3 3.5 3.7 Baton Rouge 4.5 3.4 4.2 3.4 3.6 Houma 3.4 2.5 3.2 2.5 2.7 Lafayette 3.4 2.6 3.2 2.6 2.8 Lake Charles 4.8 3.6 4.2 3.3 3.6 Texas 4.6 4.3 4.2 3.9 4.3 Beaumont 6.2 5.5 5.4 5.0 5.6 College Station 3.8 3.3 3.3
Slide 28: Historical Stock Performance
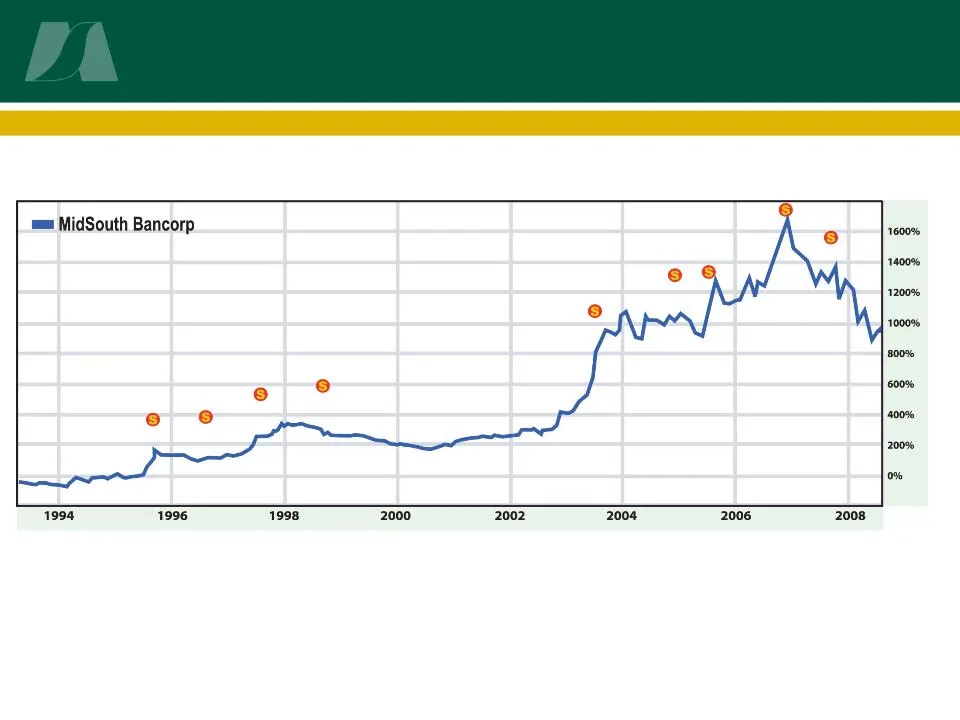
Stock Performance Historical Stock Performance ▪ Life to Date $1,000 = $12,500 ▪ Last 5 Years 89% Return April 1993 - August 2008 Source: Yahoo.Finance.com April 26, 1993 - August 11, 2008
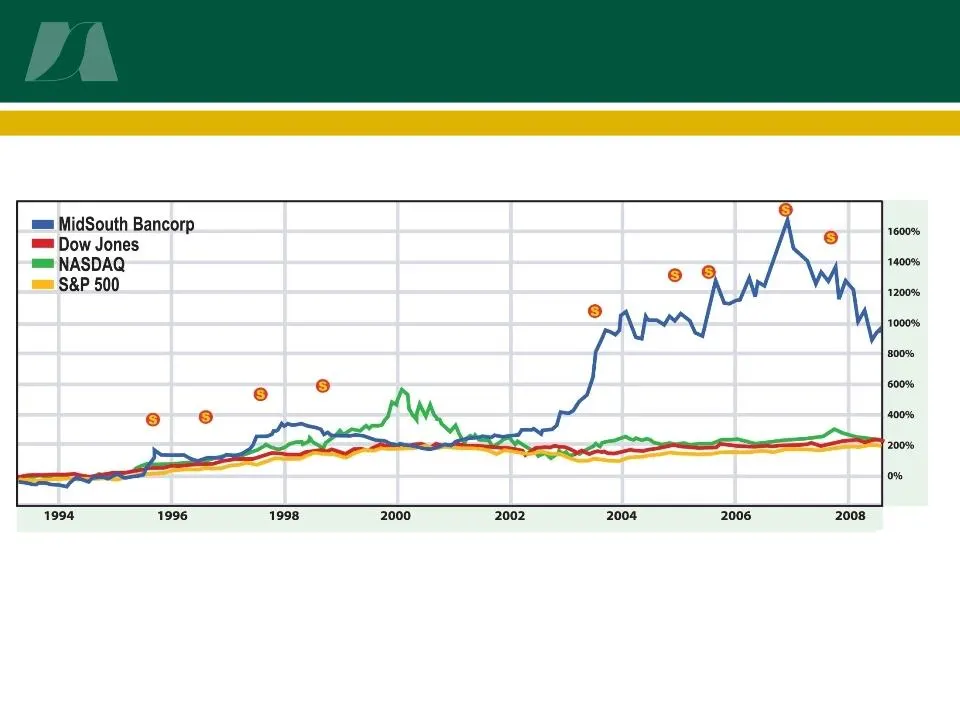
Slide 29: Relative Stock Performance
Stock Performance Relative Stock Performance ▪ MSL vs. Major Indexes ▪ Life to Date Growth April 1993 - August 2008 Source: Yahoo.Finance.com April 26, 1993 - August 11, 2008
Slide 30: Strategic Focus
MidSouth Bancorp Strategic Focus • Concentrate heavily on growth markets: Southeast Texas and South Louisiana • Capital and balance sheet management • Strengthen infrastructure in regards to operations, human capital and technology • Enhance middle market strategy and resources • Preserve customer s

Slide 31: MidSouth Bancorp contact details
MidSouth Bancorp P.O. Box 3745 - Lafayette, LA 70502 ___________________________________________________________ C.R. “Rusty” Cloutier President & Chief Executive Officer cloutier@midsouthbank.com 337-237-8343 J. Eustis Corrigan, Jr. Senior Executive Vice President and Chief Financial Officer ecorri
Source: SEC EDGAR · 8-K filed Aug 20, 2008
More decks from MidSouth Bancorp Inc
 IPO Roadshow (June 2017)36 slides · Jun 7, 2017
 Shareholder Meeting (May 2017)12 slides · May 24, 2017
 Gulf South Bank Conference 201732 slides · May 8, 2017
 Gulf South Bank Conference 201319 slides · May 14, 2013
 Merger or Acquisition (September 2012)11 slides · Sep 27, 2012
 Q3 2011 Earnings Presentation6 slides · Oct 26, 2011