MidSouth Bancorp — Gulf South Bank Conference 2013
19 slides from MidSouth Bancorp's conference presentation, May 14, 2013
Slide 1: Gulf South Bank Conference
Gulf South Bank Conference May 13, 2013 NYSE MKT: MSL
Slide 2: Forward Looking Statements
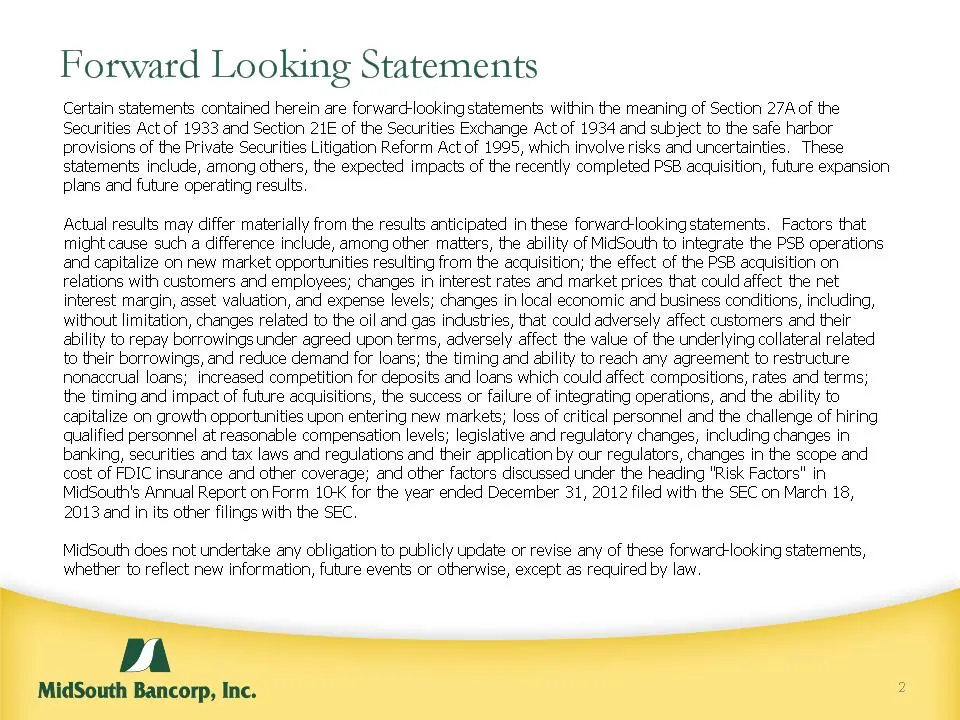
* Forward Looking Statements Certain statements contained herein are forward-looking statements within the meaning of Section 27A of the Securities Act of 1933 and Section 21E of the Securities Exchange Act of 1934 and subject to the safe harbor provisions of the Private Securities Litigation Reform
Slide 3: Company Profile
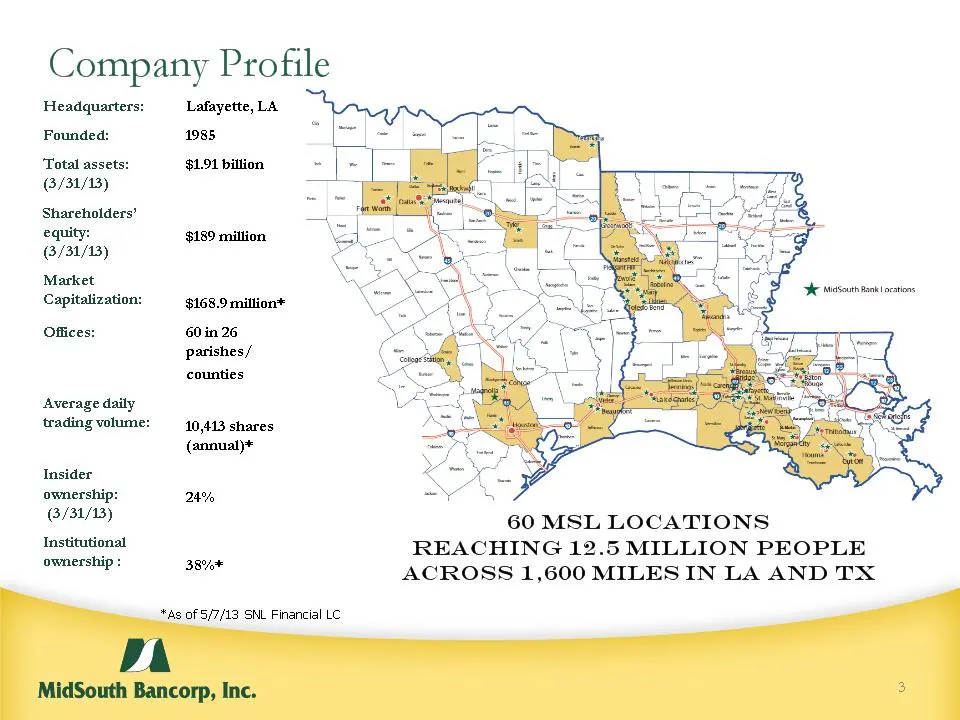
* *As of 5/7/13 SNL Financial LC Company Profile Headquarters: Lafayette, LA Founded: 1985 Total assets: (3/31/13) $1.91 billion Shareholders’ equity: (3/31/13) $189 million Market Capitalization: $168.9 million* Offices: 60 in 26 parishes/ counties Average daily trading volume: 10,413 shares (annua
Slide 4: Experienced Management Team
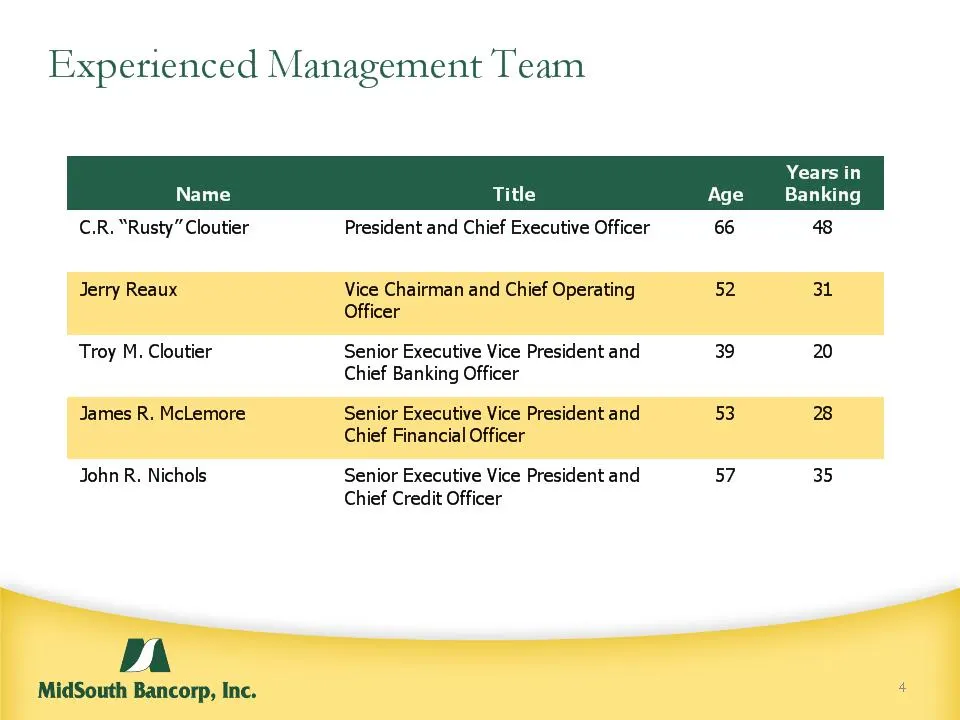
* Name Title Age Years in Banking C.R. “Rusty” Cloutier President and Chief Executive Officer 66 48 Jerry Reaux Vice Chairman and Chief Operating Officer 52 31 Troy M. Cloutier Senior Executive Vice President and Chief Banking Officer 39 20 James R. McLemore Senior Executive Vice President and Chief
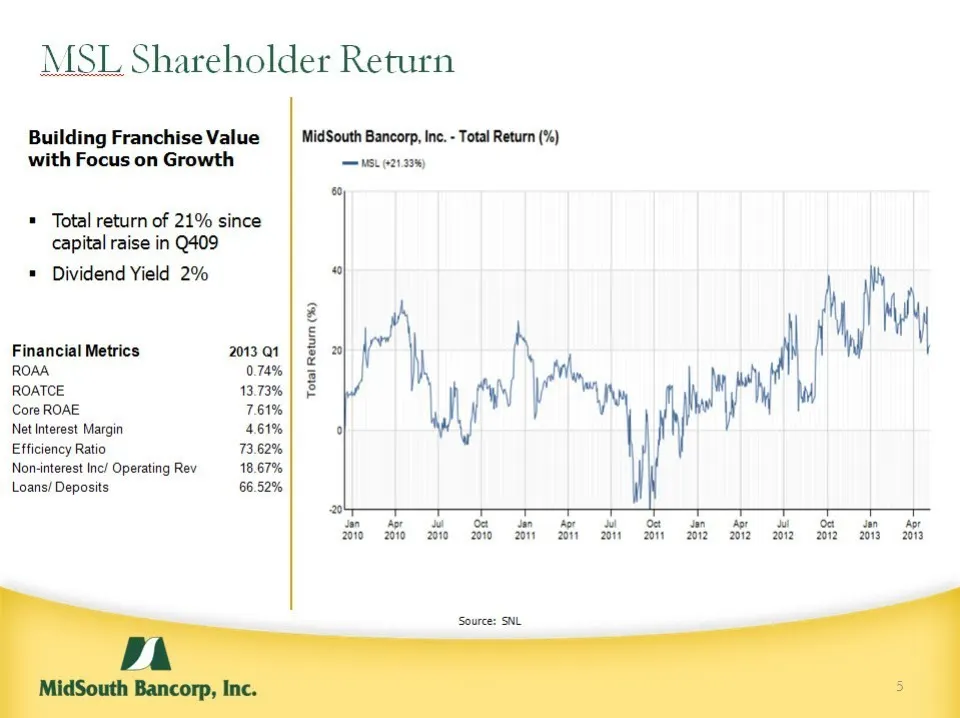
Slide 5: Building Franchise Value with Focus on Growth
* Source: SNL Building Franchise Value with Focus on Growth Total return of 21% since capital raise in Q409 Dividend Yield 2% MSL Shareholder Return Financial Metrics 2013 Q1 ROAA 0.74% ROATCE 13.73% Core ROAE 7.61% Net Interest Margin 4.61% Efficiency Ratio 73.62% Non-interest Inc/ Operating Rev 18
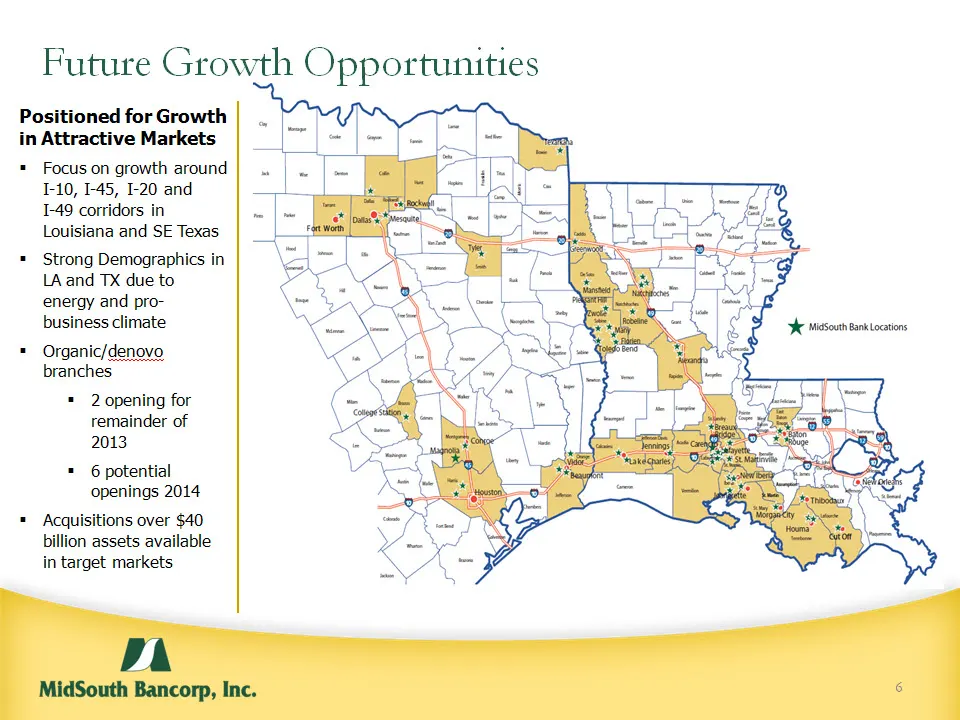
Slide 6: Positioned for Growth in Attractive Markets
* Positioned for Growth in Attractive Markets Focus on growth around I-10, I-45, I-20 and I-49 corridors in Louisiana and SE Texas Strong Demographics in LA and TX due to energy and pro-business climate Organic/denovo branches 2 opening for remainder of 2013 6 potential openings 2014 Acquisitions ov
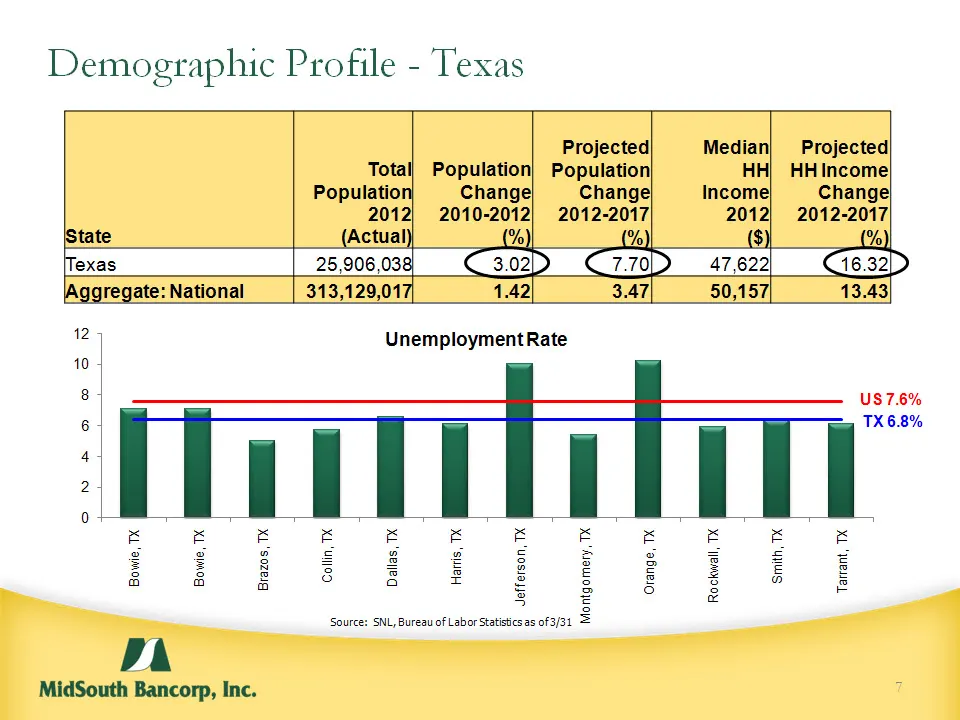
Slide 7: Demographic Profile - Texas
* Demographic Profile Demographic Profile - Texas State Total Population 2012 (Actual) Population Change 2010-2012 (%) Projected Population Change 2012-2017 (%) Median HH Income 2012 ($) Projected HH Income Change 2012-2017 (%) Texas 25,906,038 3.02 7.70 47,622 16.32 Aggregate: National 313,129,017
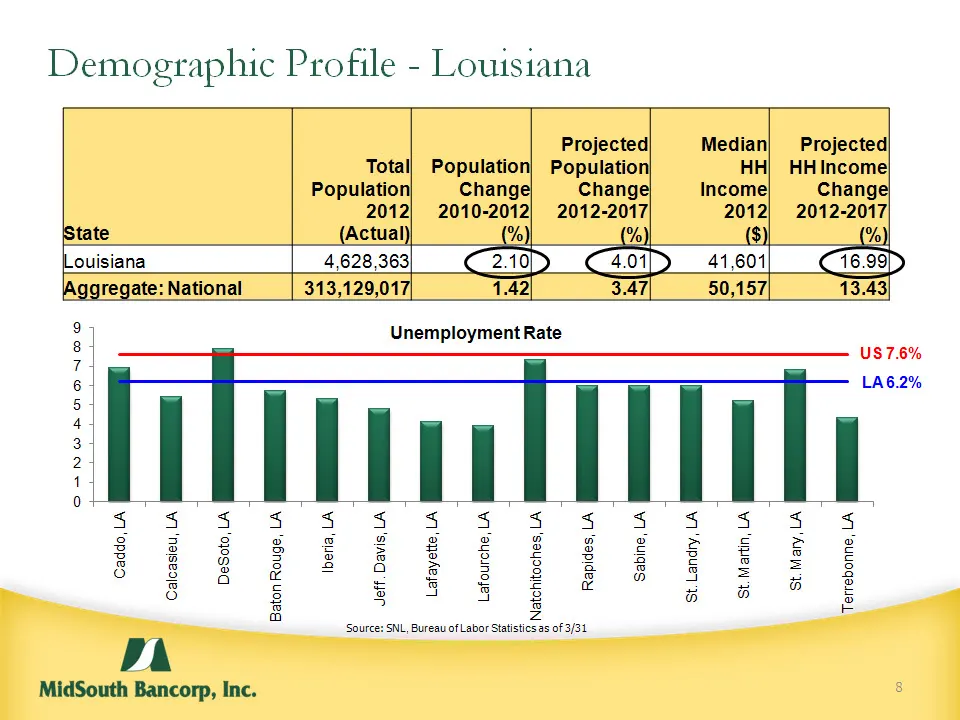
Slide 8: Demographic Profile - Louisiana
* Source: SNL, Bureau of Labor Statistics as of 3/31 Demographic Profile - Louisiana State Total Population 2012 (Actual) Population Change 2010-2012 (%) Projected Population Change 2012-2017 (%) Median HH Income 2012 ($) Projected HH Income Change 2012-2017 (%) Louisiana 4,628,363 2.10 4.01 41,601
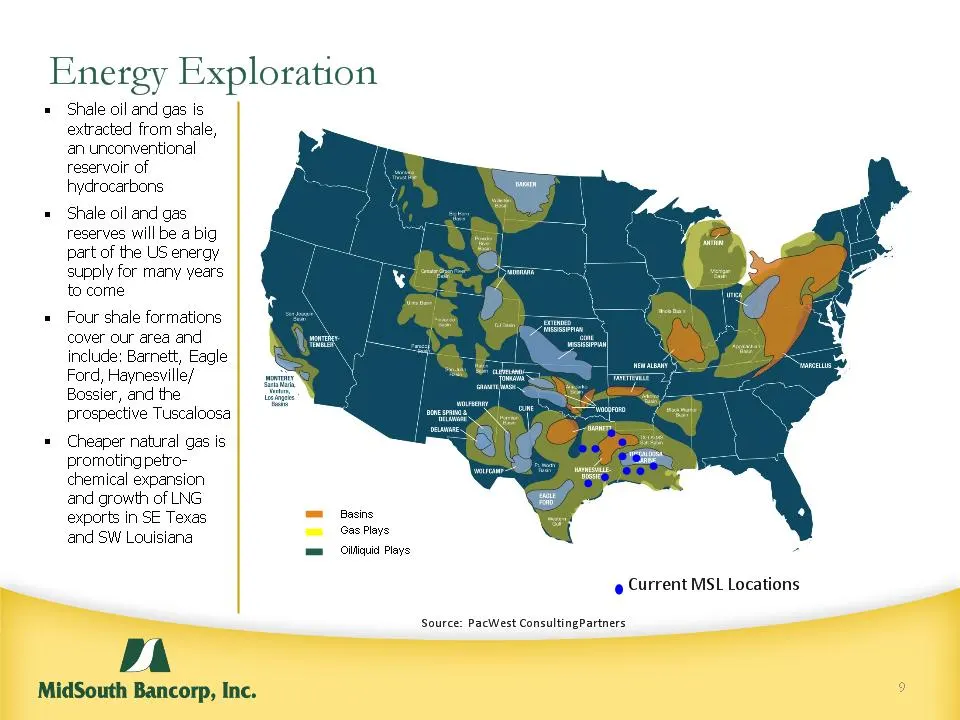
Slide 9: Energy Exploration
* Shale oil and gas is extracted from shale, an unconventional reservoir of hydrocarbons Shale oil and gas reserves will be a big part of the US energy supply for many years to come Four shale formations cover our area and include: Barnett, Eagle Ford, Haynesville/ Bossier, and the prospective Tusca
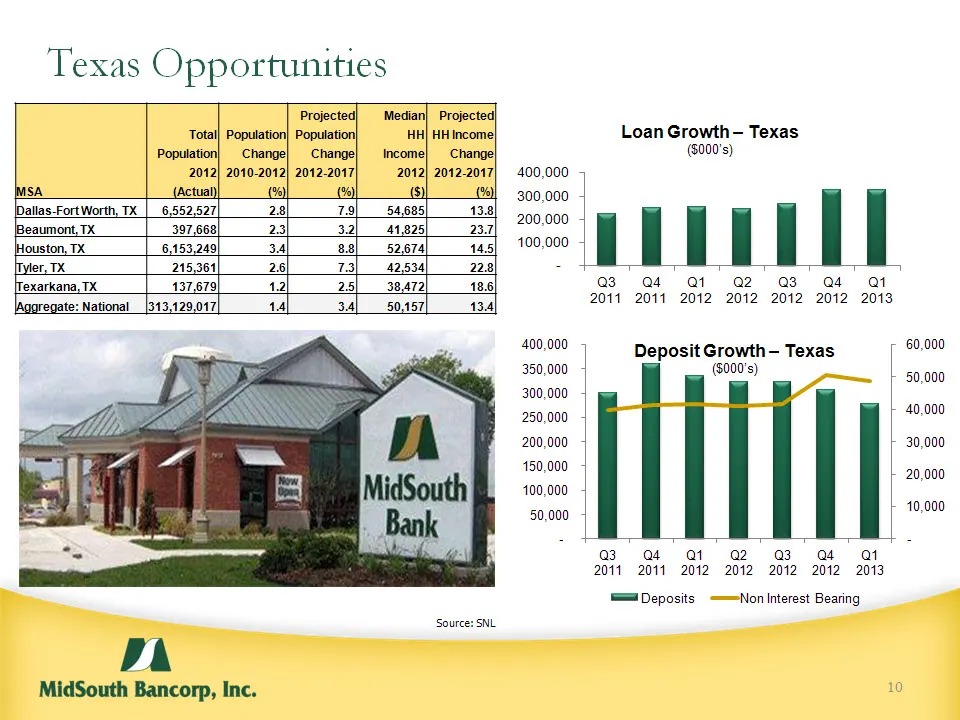
Slide 10: Texas Opportunities
* Texas Opportunities Source: SNL MSA Projected Median Projected MSA Total Population Population HH HH Income MSA Population Change Change Income Change MSA 2012 2010-2012 2012-2017 2012 2012-2017 MSA (Actual) (%) (%) ($) (%) Dallas-Fort Worth, TX 6,552,527 2.8 7.9 54,685 13.8 Beaumont, TX 397,668 2
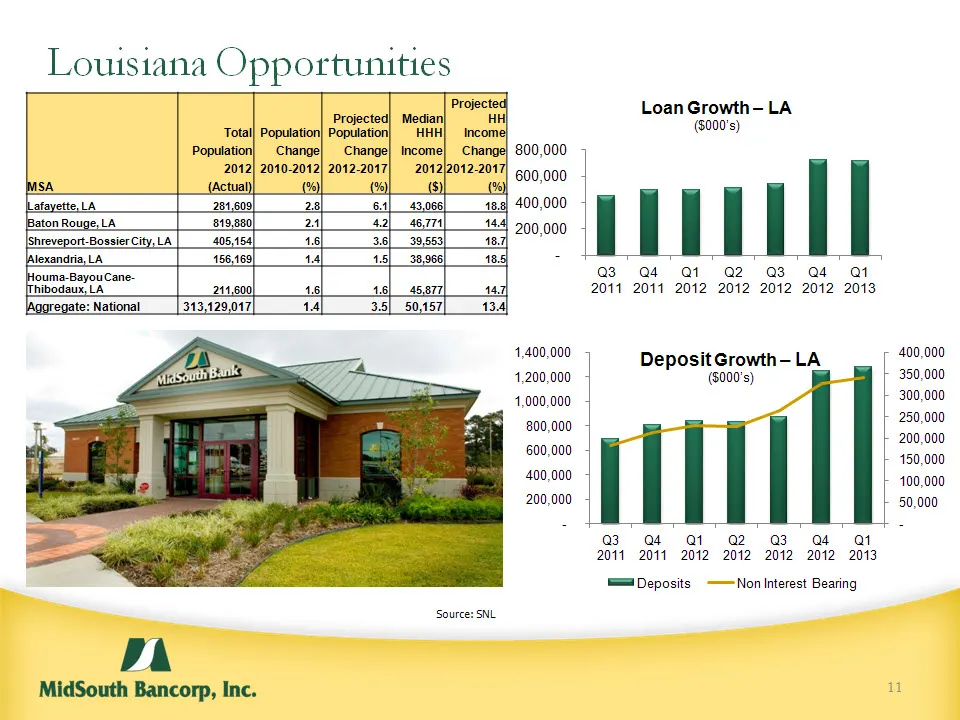
Slide 11: Louisiana Opportunities
* Louisiana Opportunities Source: SNL MSA Projected MSA Total Population Projected Population Median HHH HH Income MSA Population Change Change Income Change MSA 2012 2010-2012 2012-2017 2012 2012-2017 MSA (Actual) (%) (%) ($) (%) Lafayette, LA 281,609 2.8 6.1 43,066 18.8 Baton Rouge, LA 819,880 2.1
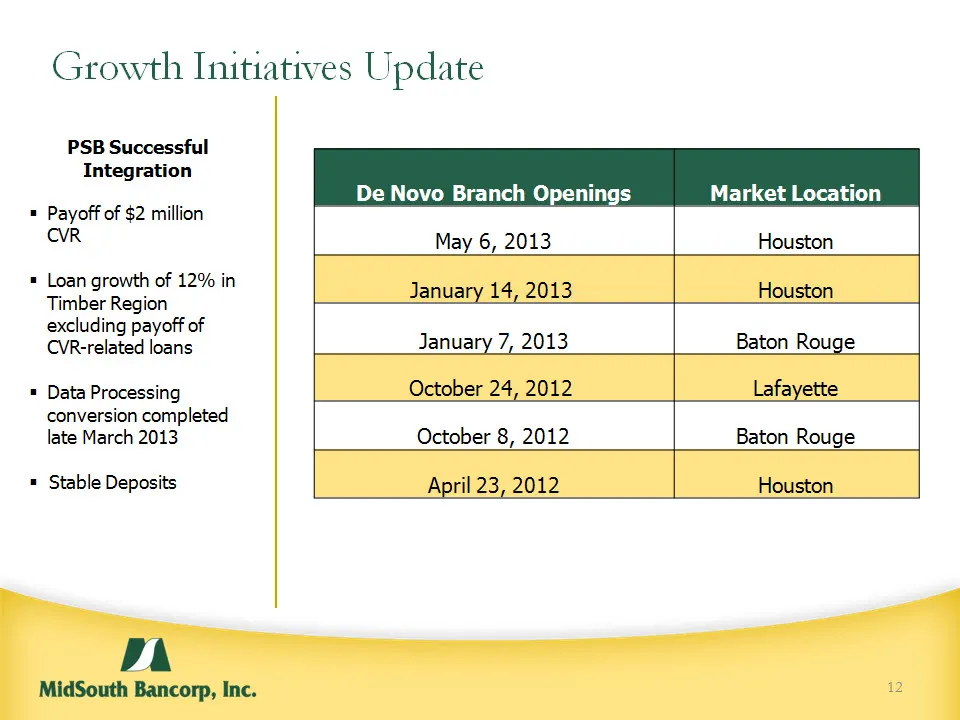
Slide 12: Growth Initiatives Update
* PSB Successful Integration Payoff of $2 million CVR Loan growth of 12% in Timber Region excluding payoff of CVR-related loans Data Processing conversion completed late March 2013 Stable Deposits Growth Initiatives Update De Novo Branch Openings Market Location May 6, 2013 Houston January 14, 2013
Slide 13: Diversified Loan Portfolio
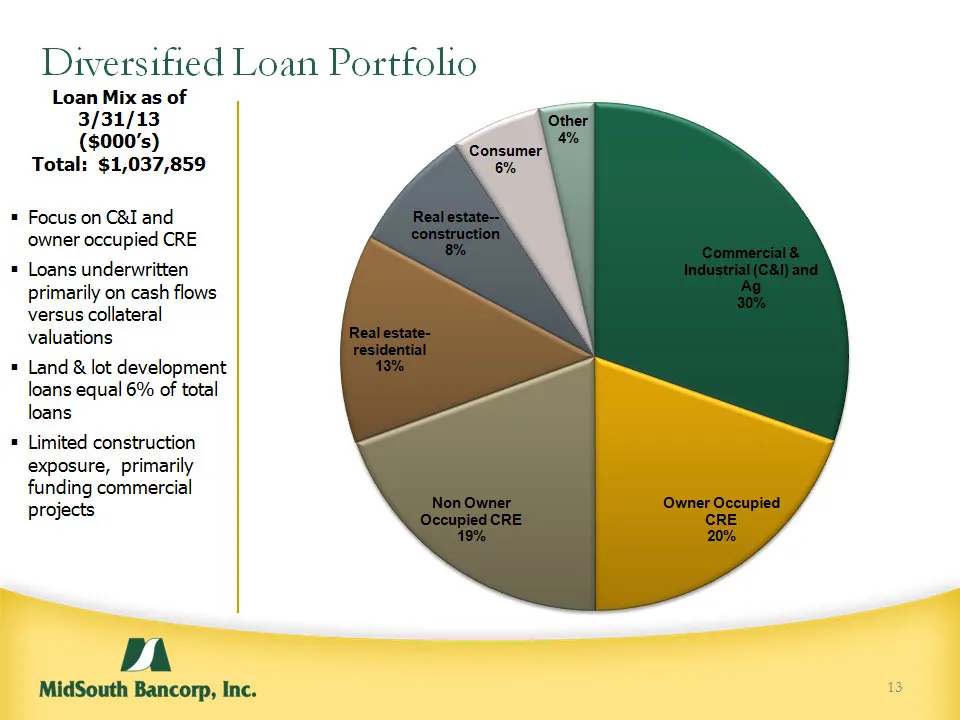
* Loan Mix as of 3/31/13 ($000’s) Total: $1,037,859 Focus on C&I and owner occupied CRE Loans underwritten primarily on cash flows versus collateral valuations Land & lot development loans equal 6% of total loans Limited construction exposure, primarily funding commercial projects Diversified Loan P
Slide 14: Organic Loan Growth
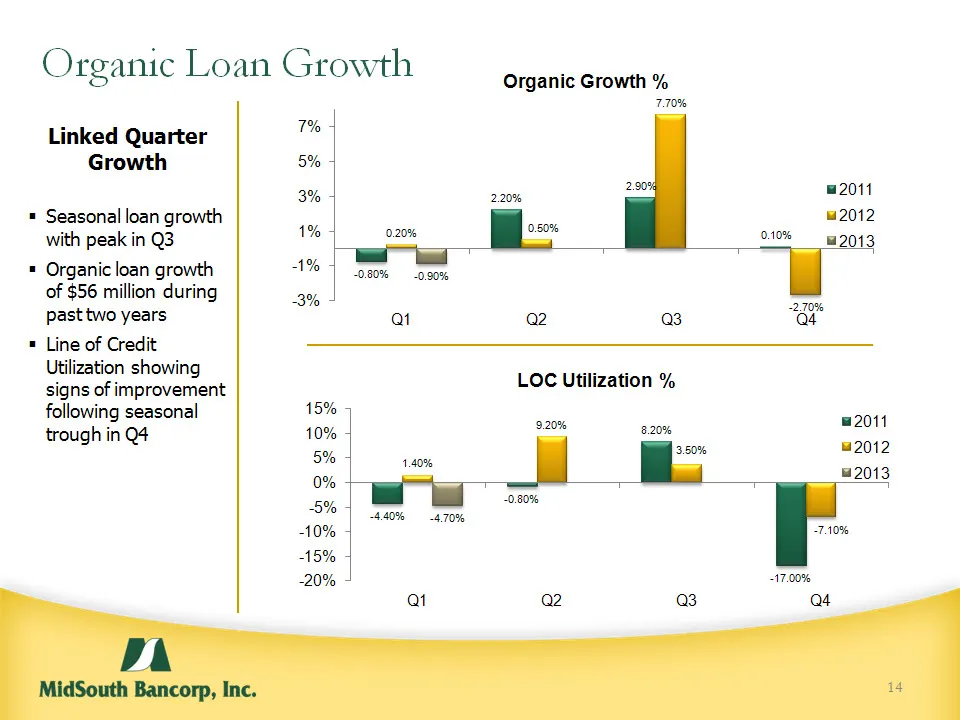
* Organic Loan Growth Linked Quarter Growth Seasonal loan growth with peak in Q3 Organic loan growth of $56 million during past two years Line of Credit Utilization showing signs of improvement following seasonal trough in Q4
Slide 15: Attractive Core Deposits
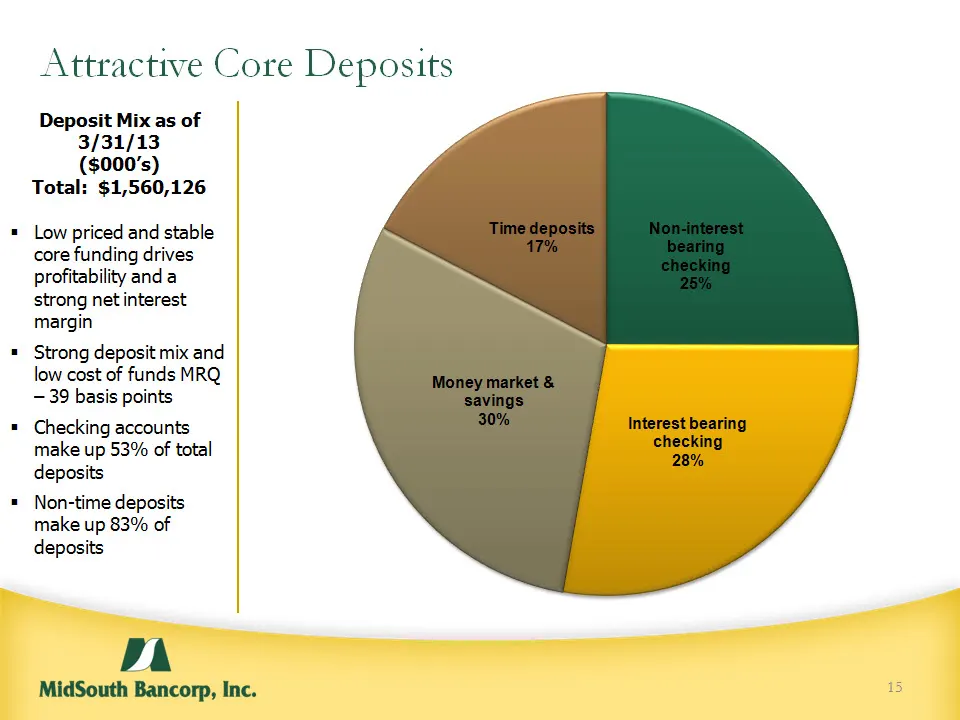
* Deposit Mix as of 3/31/13 ($000’s) Total: $1,560,126 Low priced and stable core funding drives profitability and a strong net interest margin Strong deposit mix and low cost of funds MRQ – 39 basis points Checking accounts make up 53% of total deposits Non-time deposits make up 83% of deposits Att
Slide 16: Strong Asset Quality
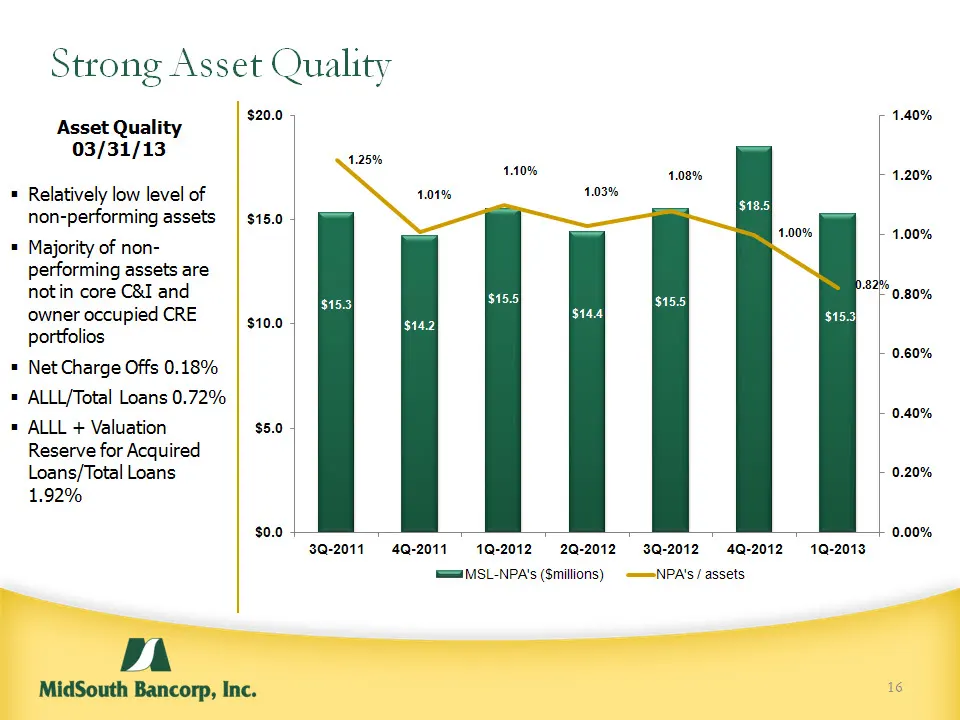
* Asset Quality 03/31/13 Relatively low level of non-performing assets Majority of non-performing assets are not in core C&I and owner occupied CRE portfolios Net Charge Offs 0.18% ALLL/Total Loans 0.72% ALLL + Valuation Reserve for Acquired Loans/Total Loans 1.92% Strong Asset Quality
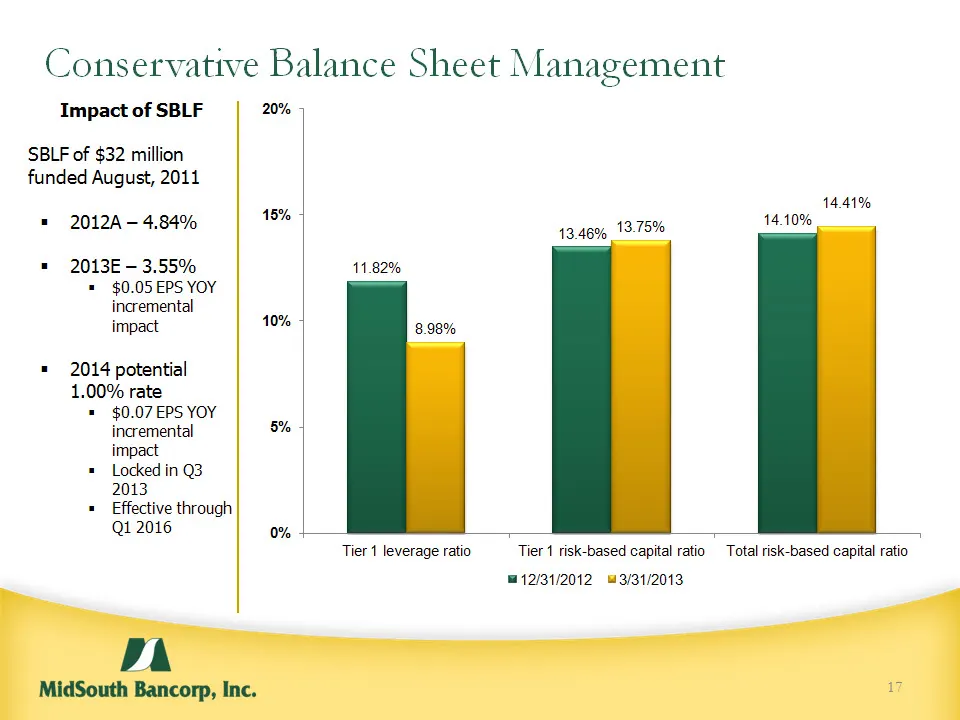
Slide 17: Conservative Balance Sheet Management
* Impact of SBLF SBLF of $32 million funded August, 2011 2012A – 4.84% 2013E – 3.55% $0.05 EPS YOY incremental impact 2014 potential 1.00% rate $0.07 EPS YOY incremental impact Locked in Q3 2013 Effective through Q1 2016 Conservative Balance Sheet Management
Slide 18: Investment Considerations
* Investment Considerations NYSE MKT: MSL Deep & experienced management team Located in resilient markets Long-term conservative operating philosophy Well capitalized, well diversified loan portfolio and trophy deposit base Disciplined and opportunistic industry consolidator organic growth and effic

Slide 19: * RustyJerry Reaux James R. McLemore, CFA Lorraine Miller, CFA President and CEO Vice
* RustyJerry Reaux James R. McLemore, CFA Lorraine Miller, CFA President and CEO Vice Chairman and COO CFO & SEVP Treasurer\Director of M&A rusty.cloutier@midsouthbank.com jerry.reaux@midsouthbank.com jim.mclemore@midsouthbank.com lorraine.miller@midsouthbank.com
Source: SEC EDGAR · 8-K filed May 14, 2013
More decks from MidSouth Bancorp Inc
 IPO Roadshow (June 2017)36 slides · Jun 7, 2017
 Shareholder Meeting (May 2017)12 slides · May 24, 2017
 Gulf South Bank Conference 201732 slides · May 8, 2017
 Merger or Acquisition (September 2012)11 slides · Sep 27, 2012
 Q3 2011 Earnings Presentation6 slides · Oct 26, 2011
 IPO Roadshow (December 2009)22 slides · Dec 9, 2009