Cbot — Sandler O'Neill & Partners eBrokerage and Global Exchange Conference 2007
18 slides from Cbot's conference presentation, Jun 7, 2007

Slide 1: Rule 425 filing legend
Filed by Chicago Mercantile Exchange Holdings Inc. pursuant to Rule 425 under the Securities Act of 1933, as amended, and deemed filed pursuant to Rule 14a-6 under the Securities Exchange Act of 1934, as amended. Subject Company: CBOT Holdings, Inc. Subject Company’s Commission File No.:001-32650
Slide 2: Sandler O'Neill & Partners eBrokerage and Global Exchange Conference 2007
Sandler O’Neill & Partners eBrokerage and Global Exchange Conference 2007 Craig Donohue, CEO Jamie Parisi, CFO June 7, 2007
Slide 3: Discussion of Forward-Looking Statements
Discussion of Forward-Looking Statements Forward-Looking Statements This presentation may contain forward-looking information regarding Chicago Mercantile Exchange Holdings Inc. and CBOT Holdings, Inc. and the combined company after the completion of the merger that are intended to be covered by the
Slide 4: CME's Growth Strategy
CME’s Growth Strategy CME will be the leading global derivatives company by: • Globalizing our business Providing liquidity in all major asset classes Expanding our customer base worldwide Deploying our technology globally • Being a leading service provider of transaction processing services • Expan
Slide 5: CME Average Daily Volume
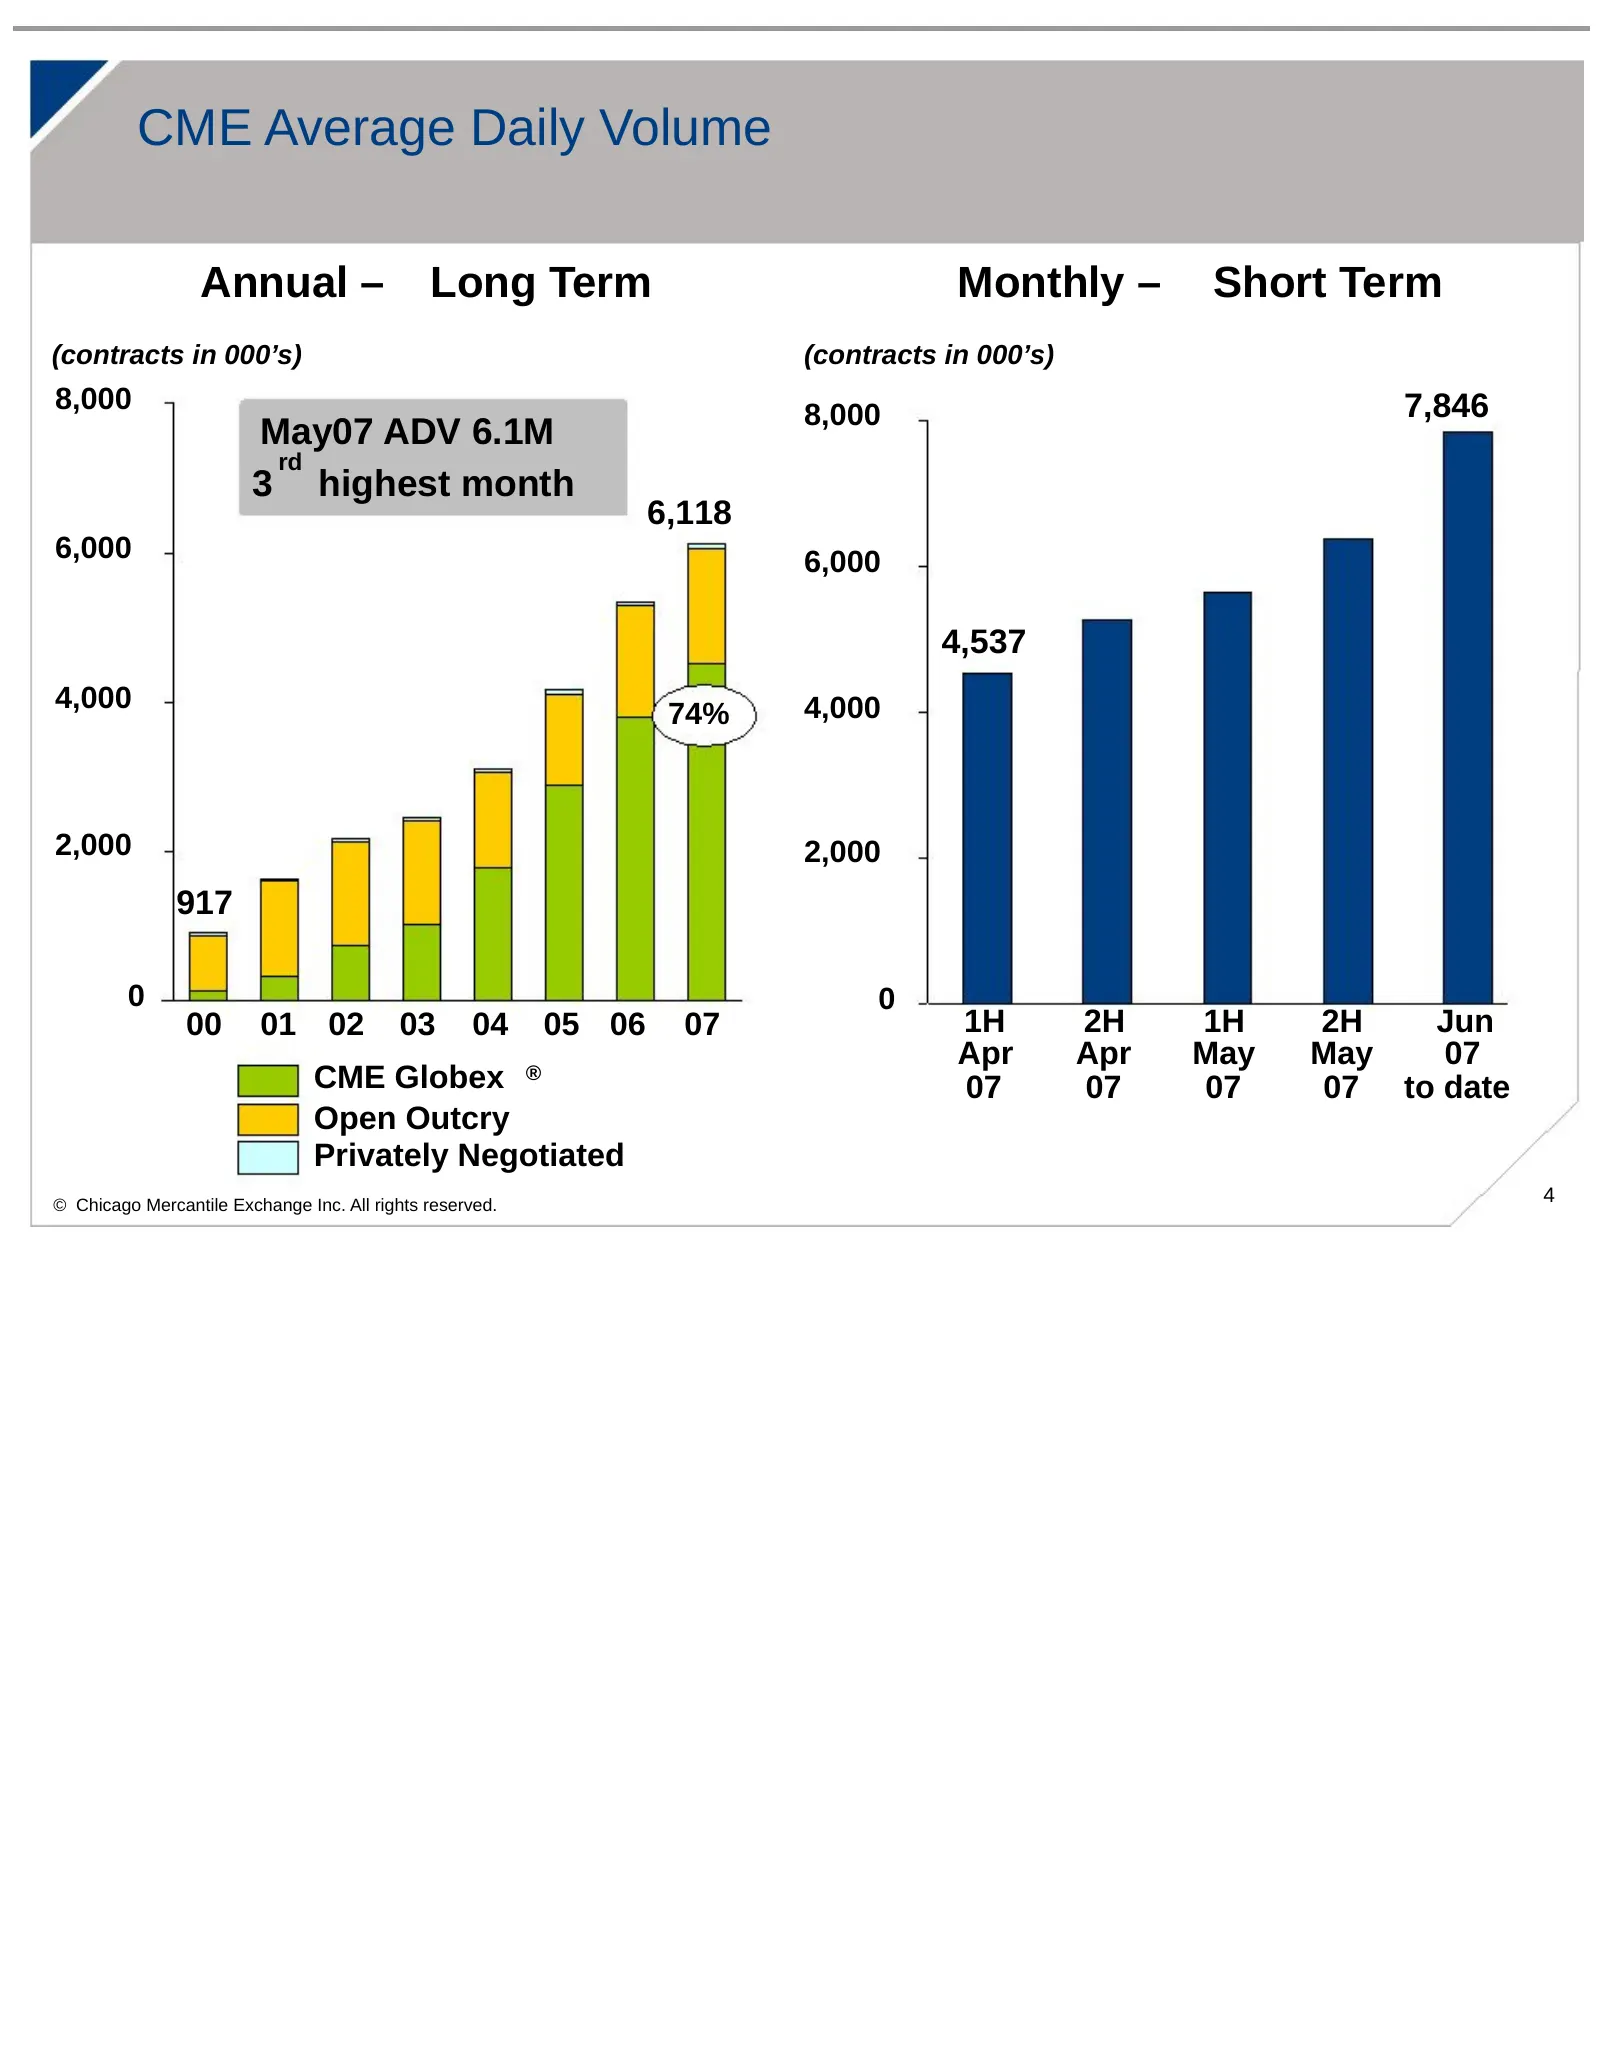
CME Average Daily Volume Annual – Long Term Monthly – Short Term (contracts in 000’s) (contracts in 000’s) 8,000 7,846 8,000 May07 ADV 6.1M rd 3 highest month 6,118 6,000 6,000 4,537 4,000 4,000 74% 2,000 2,000 917 0 0 00 01 02 03 04 05 06 07 1H 2H 1H 2H Jun Apr Apr May May 07 CME Globex ® 07 07 07
Slide 6: CME Open Interest
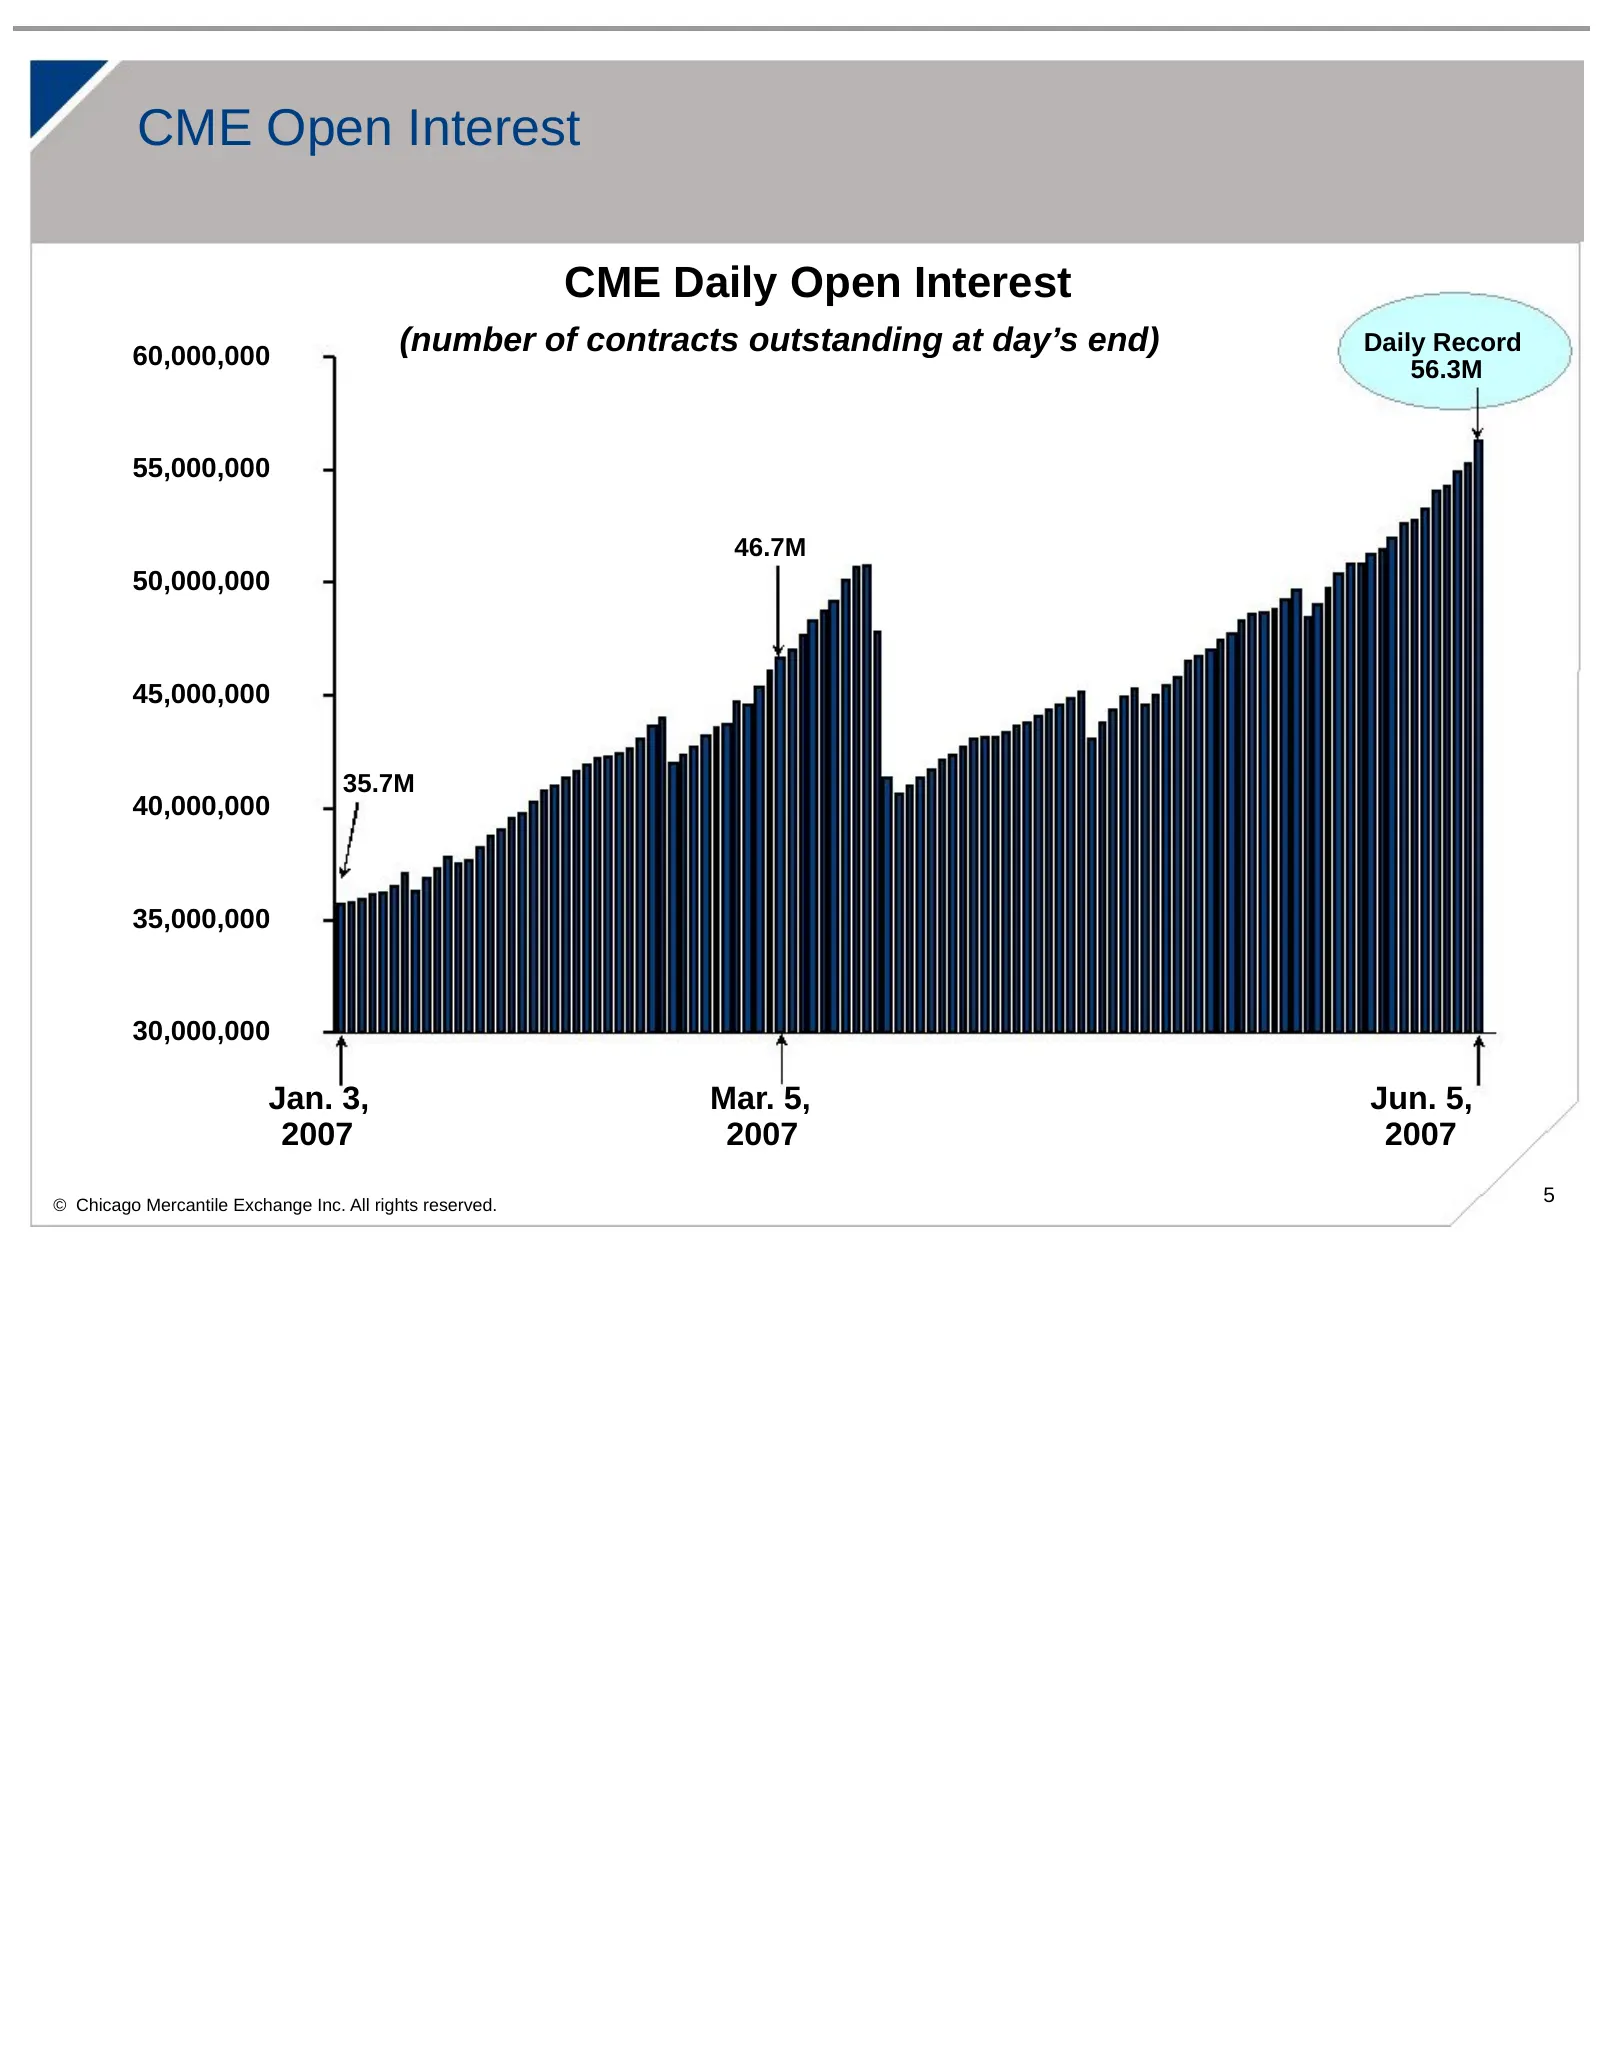
CME Open Interest CME Daily Open Interest 60,000,000 (number of contracts outstanding at day’s end) Daily Record 56.3M 55,000,000 46.7M 50,000,000 45,000,000 35.7M 40,000,000 35,000,000 30,000,000 Jan. 3, Mar. 5, Jun. 5, 2007 2007 2007 © Chicago Mercantile Exchange Inc. All rights reserved. 5
Slide 7: Core Business Growth Driver - CME Electronic Options
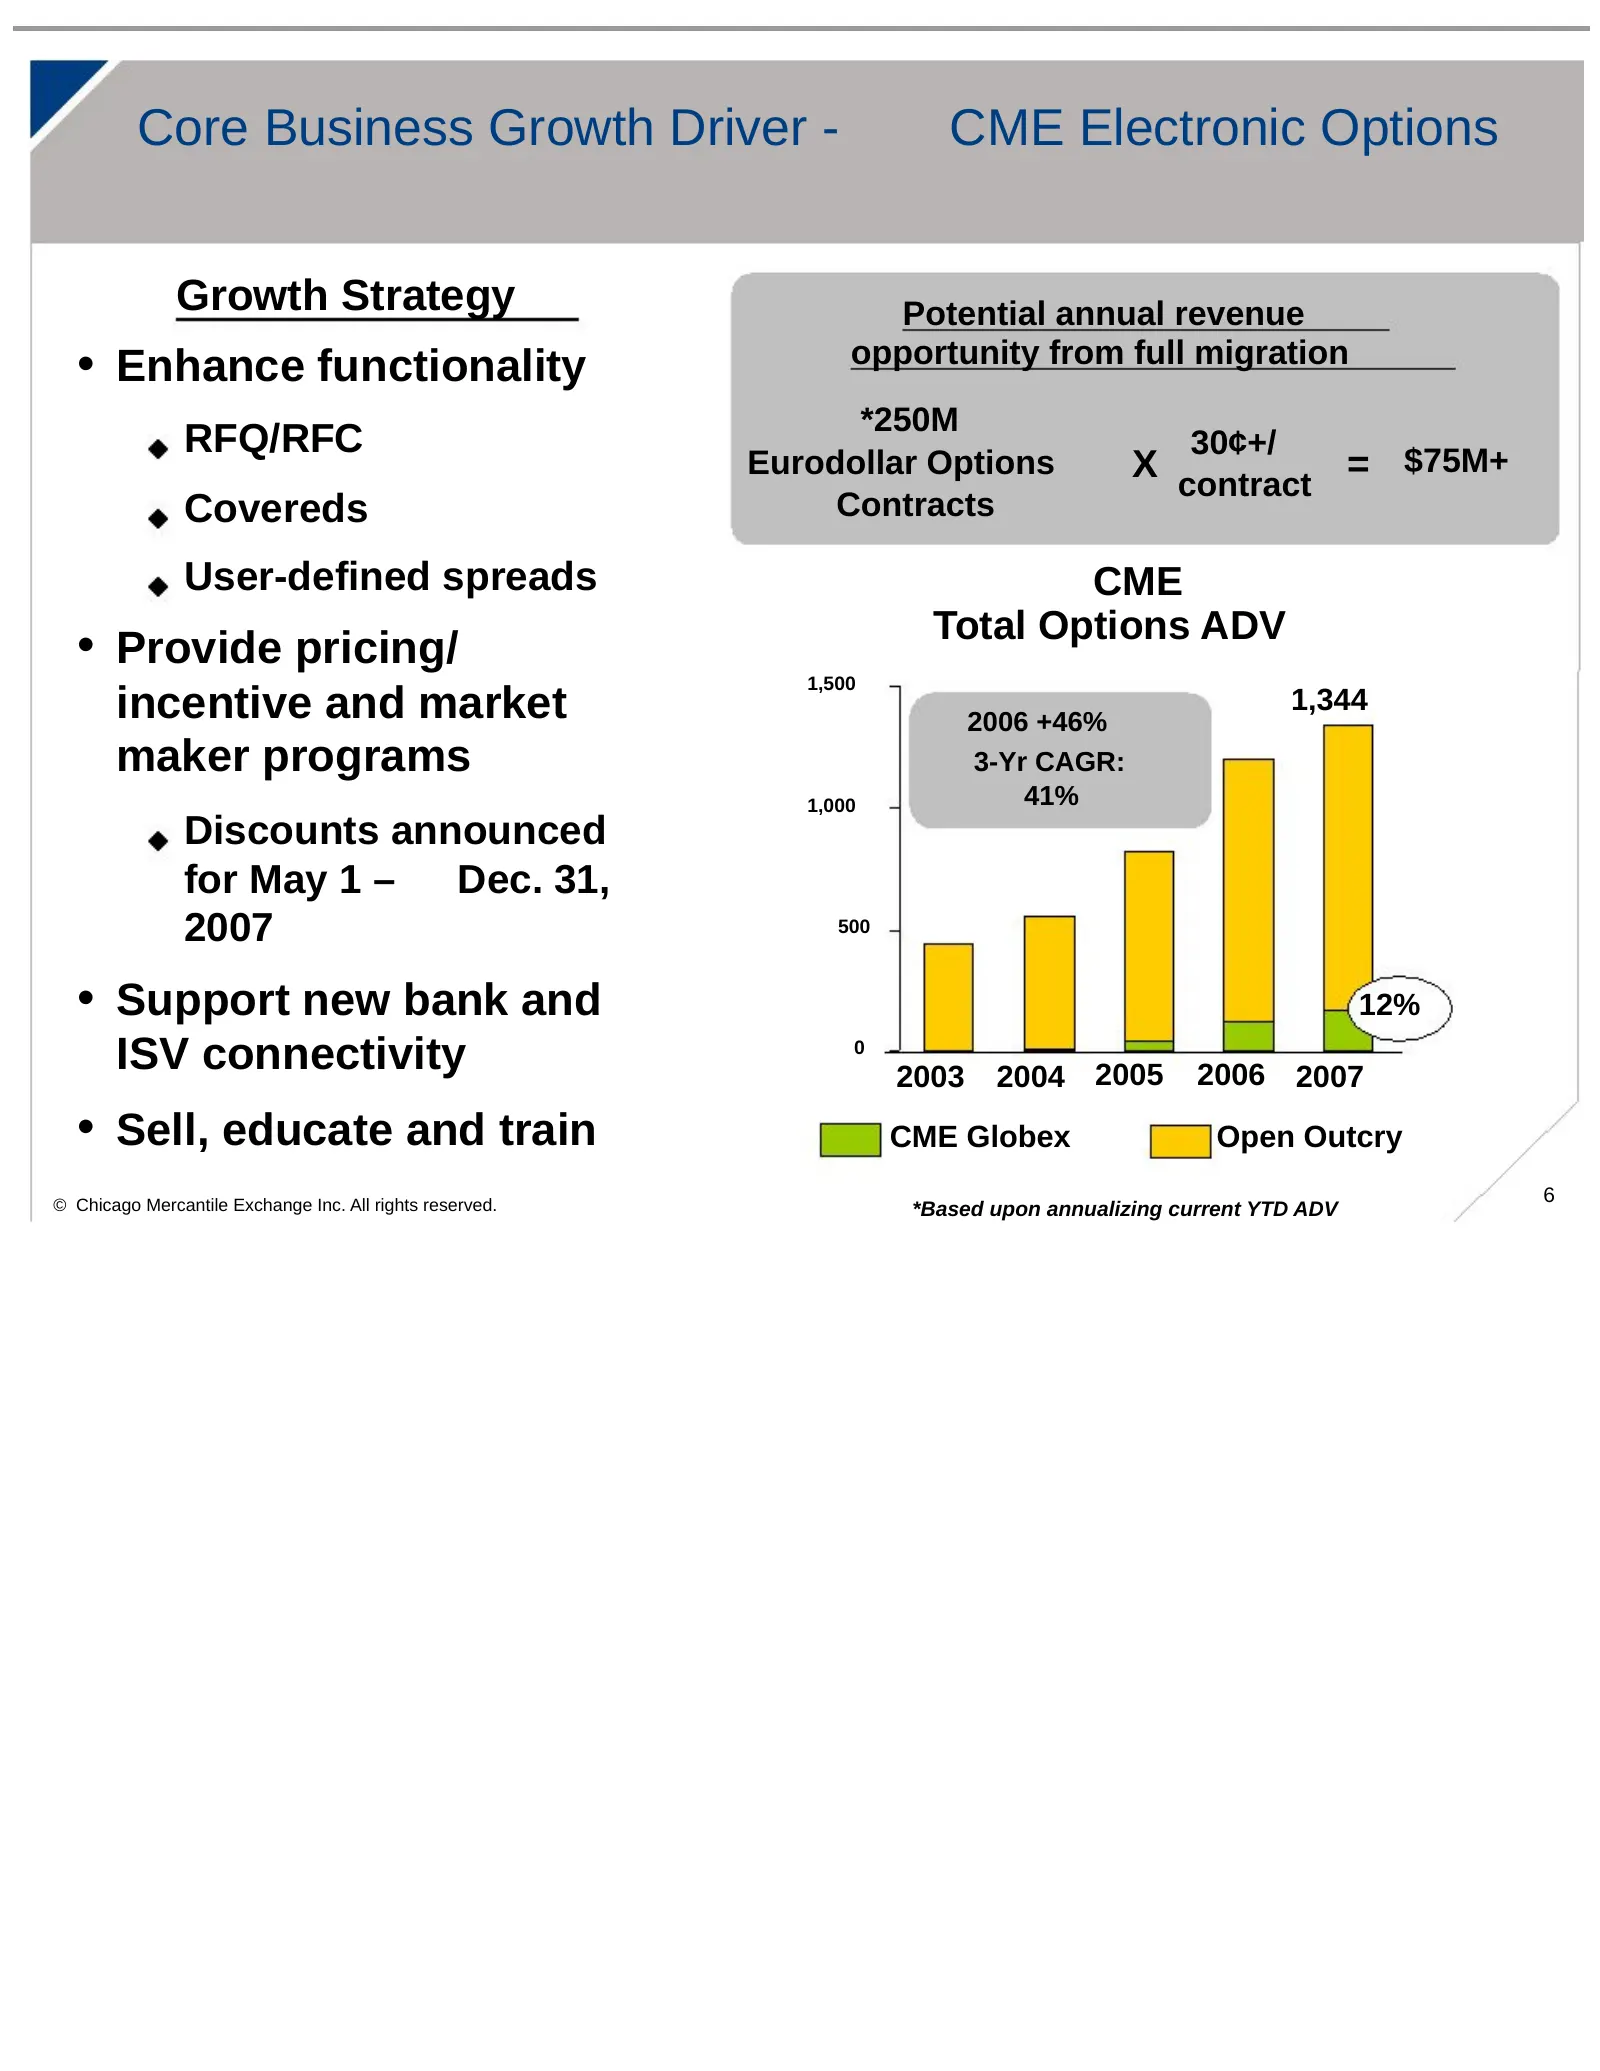
Core Business Growth Driver - CME Electronic Options Growth Strategy Potential annual revenue • Enhance functionality opportunity from full migration *250M RFQ/RFC 30¢+/ Eurodollar Options X contract = $75M+ Covereds Contracts User-defined spreads CME Total Options ADV • Provide pricing/ 1,500 incen
Slide 8: Globalizing Our Business
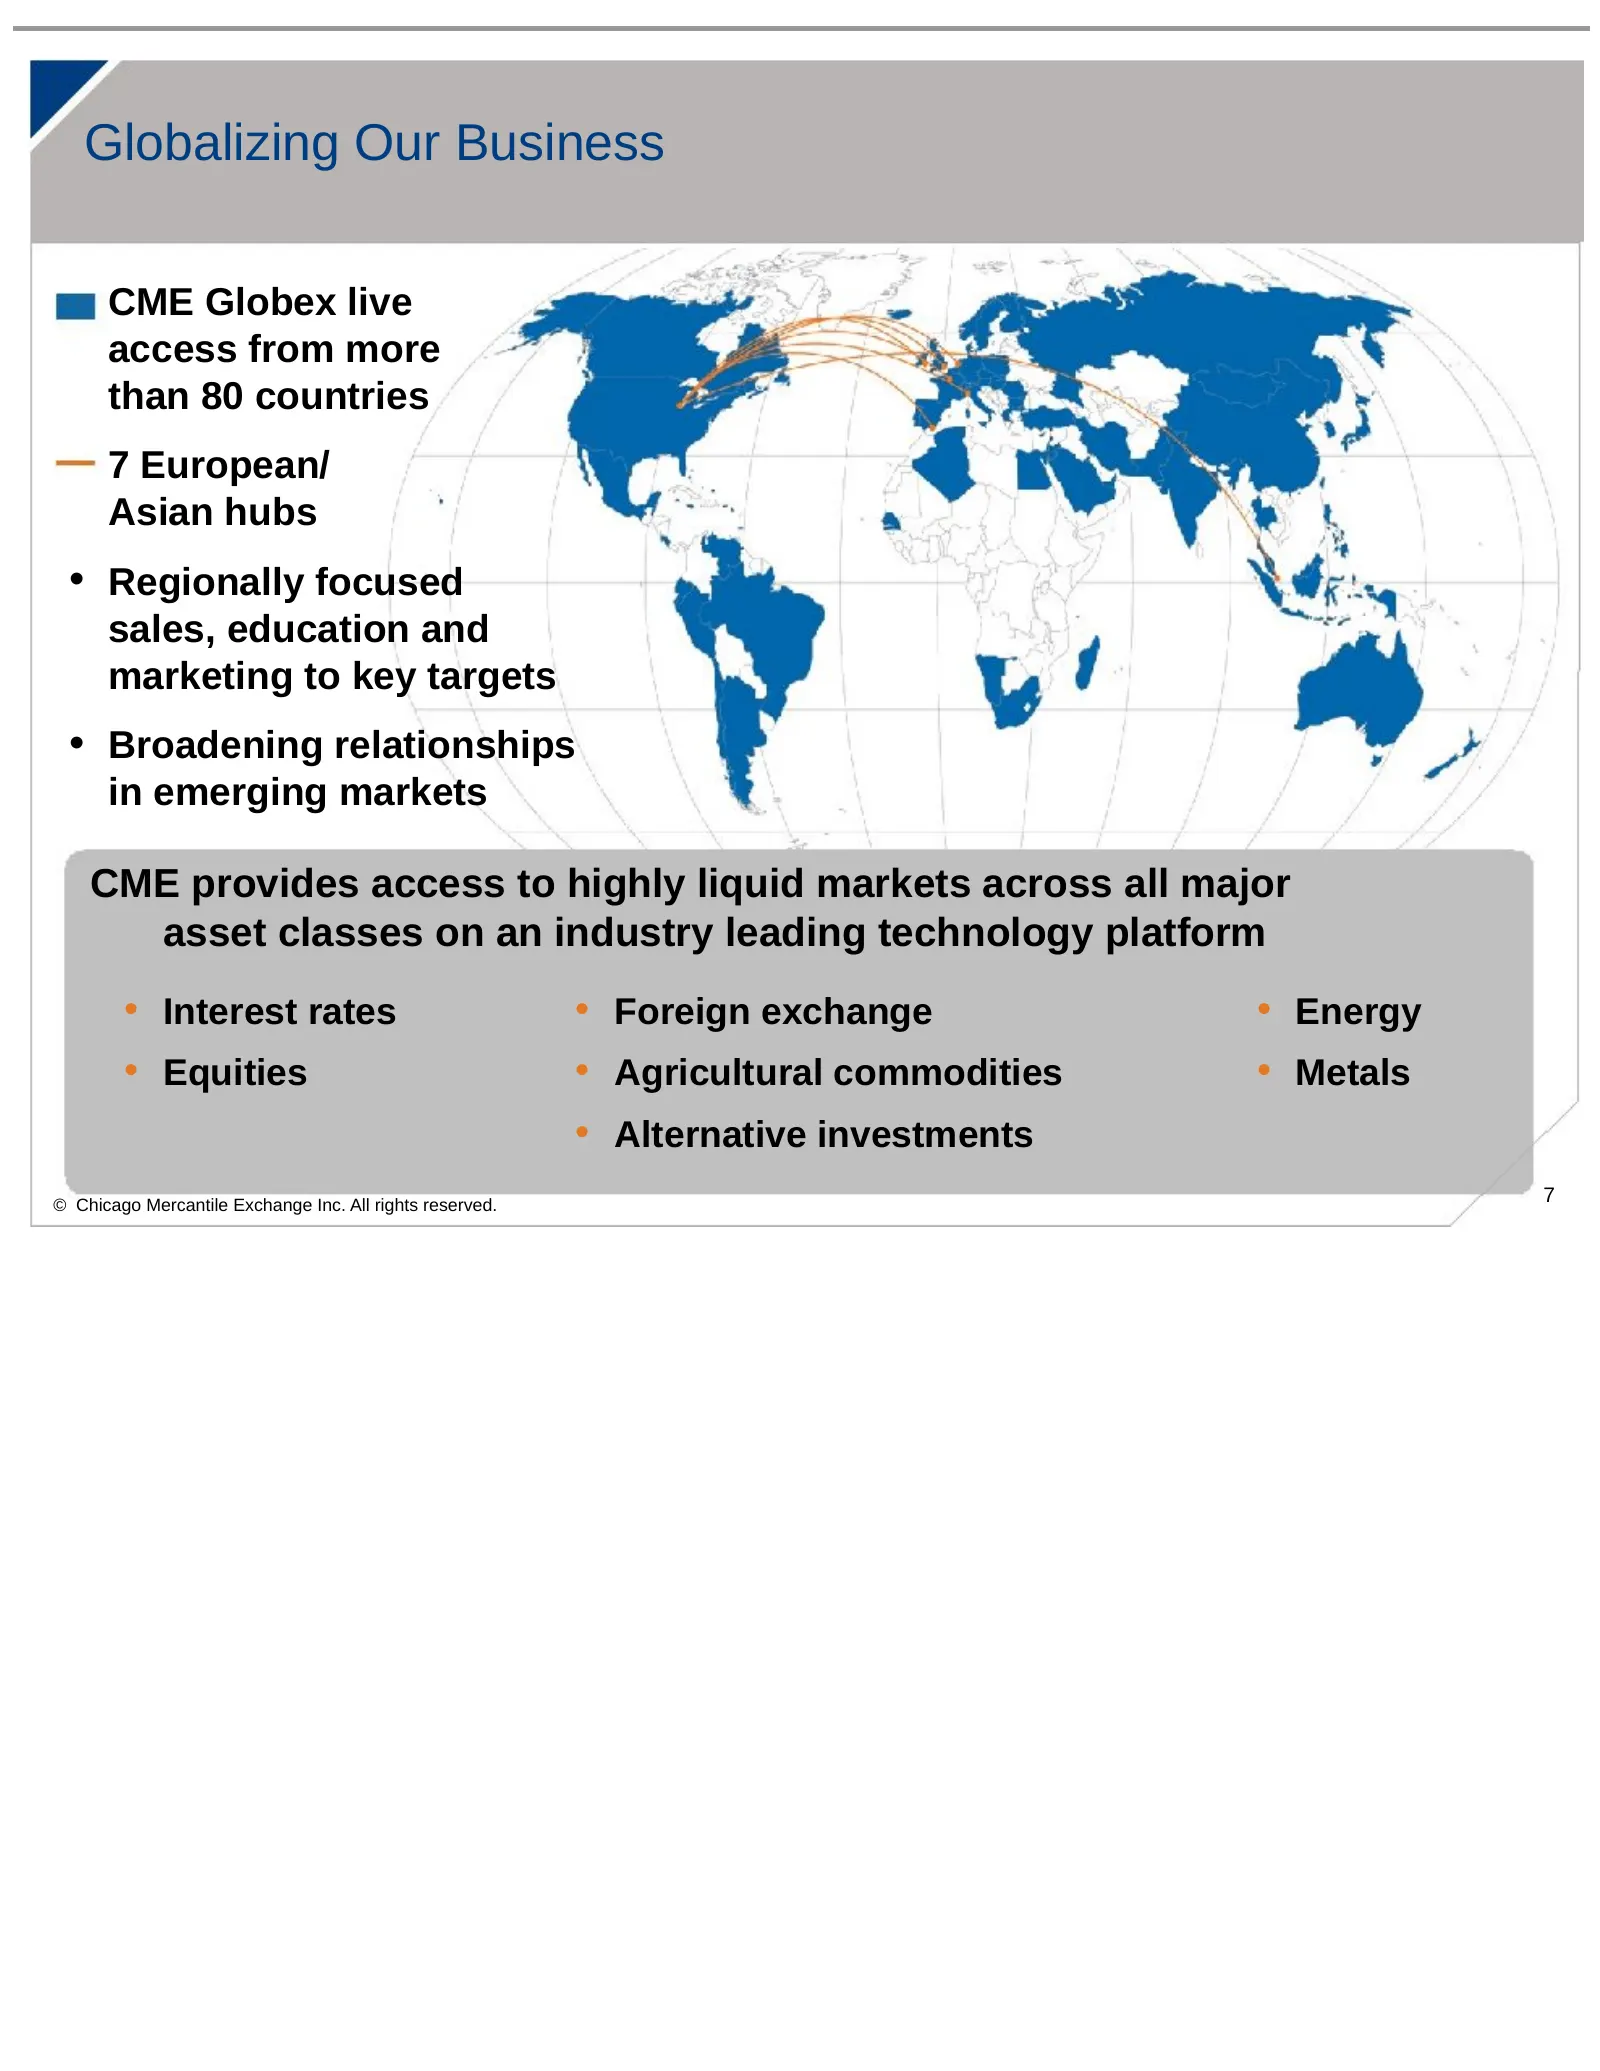
Globalizing Our Business CME Globex live access from more than 80 countries 7 European/ Asian hubs • Regionally focused sales, education and marketing to key targets • Broadening relationships in emerging markets CME provides access to highly liquid markets across all major asset classes on an indus
Slide 9: Leading Service Provider in Transaction Processing
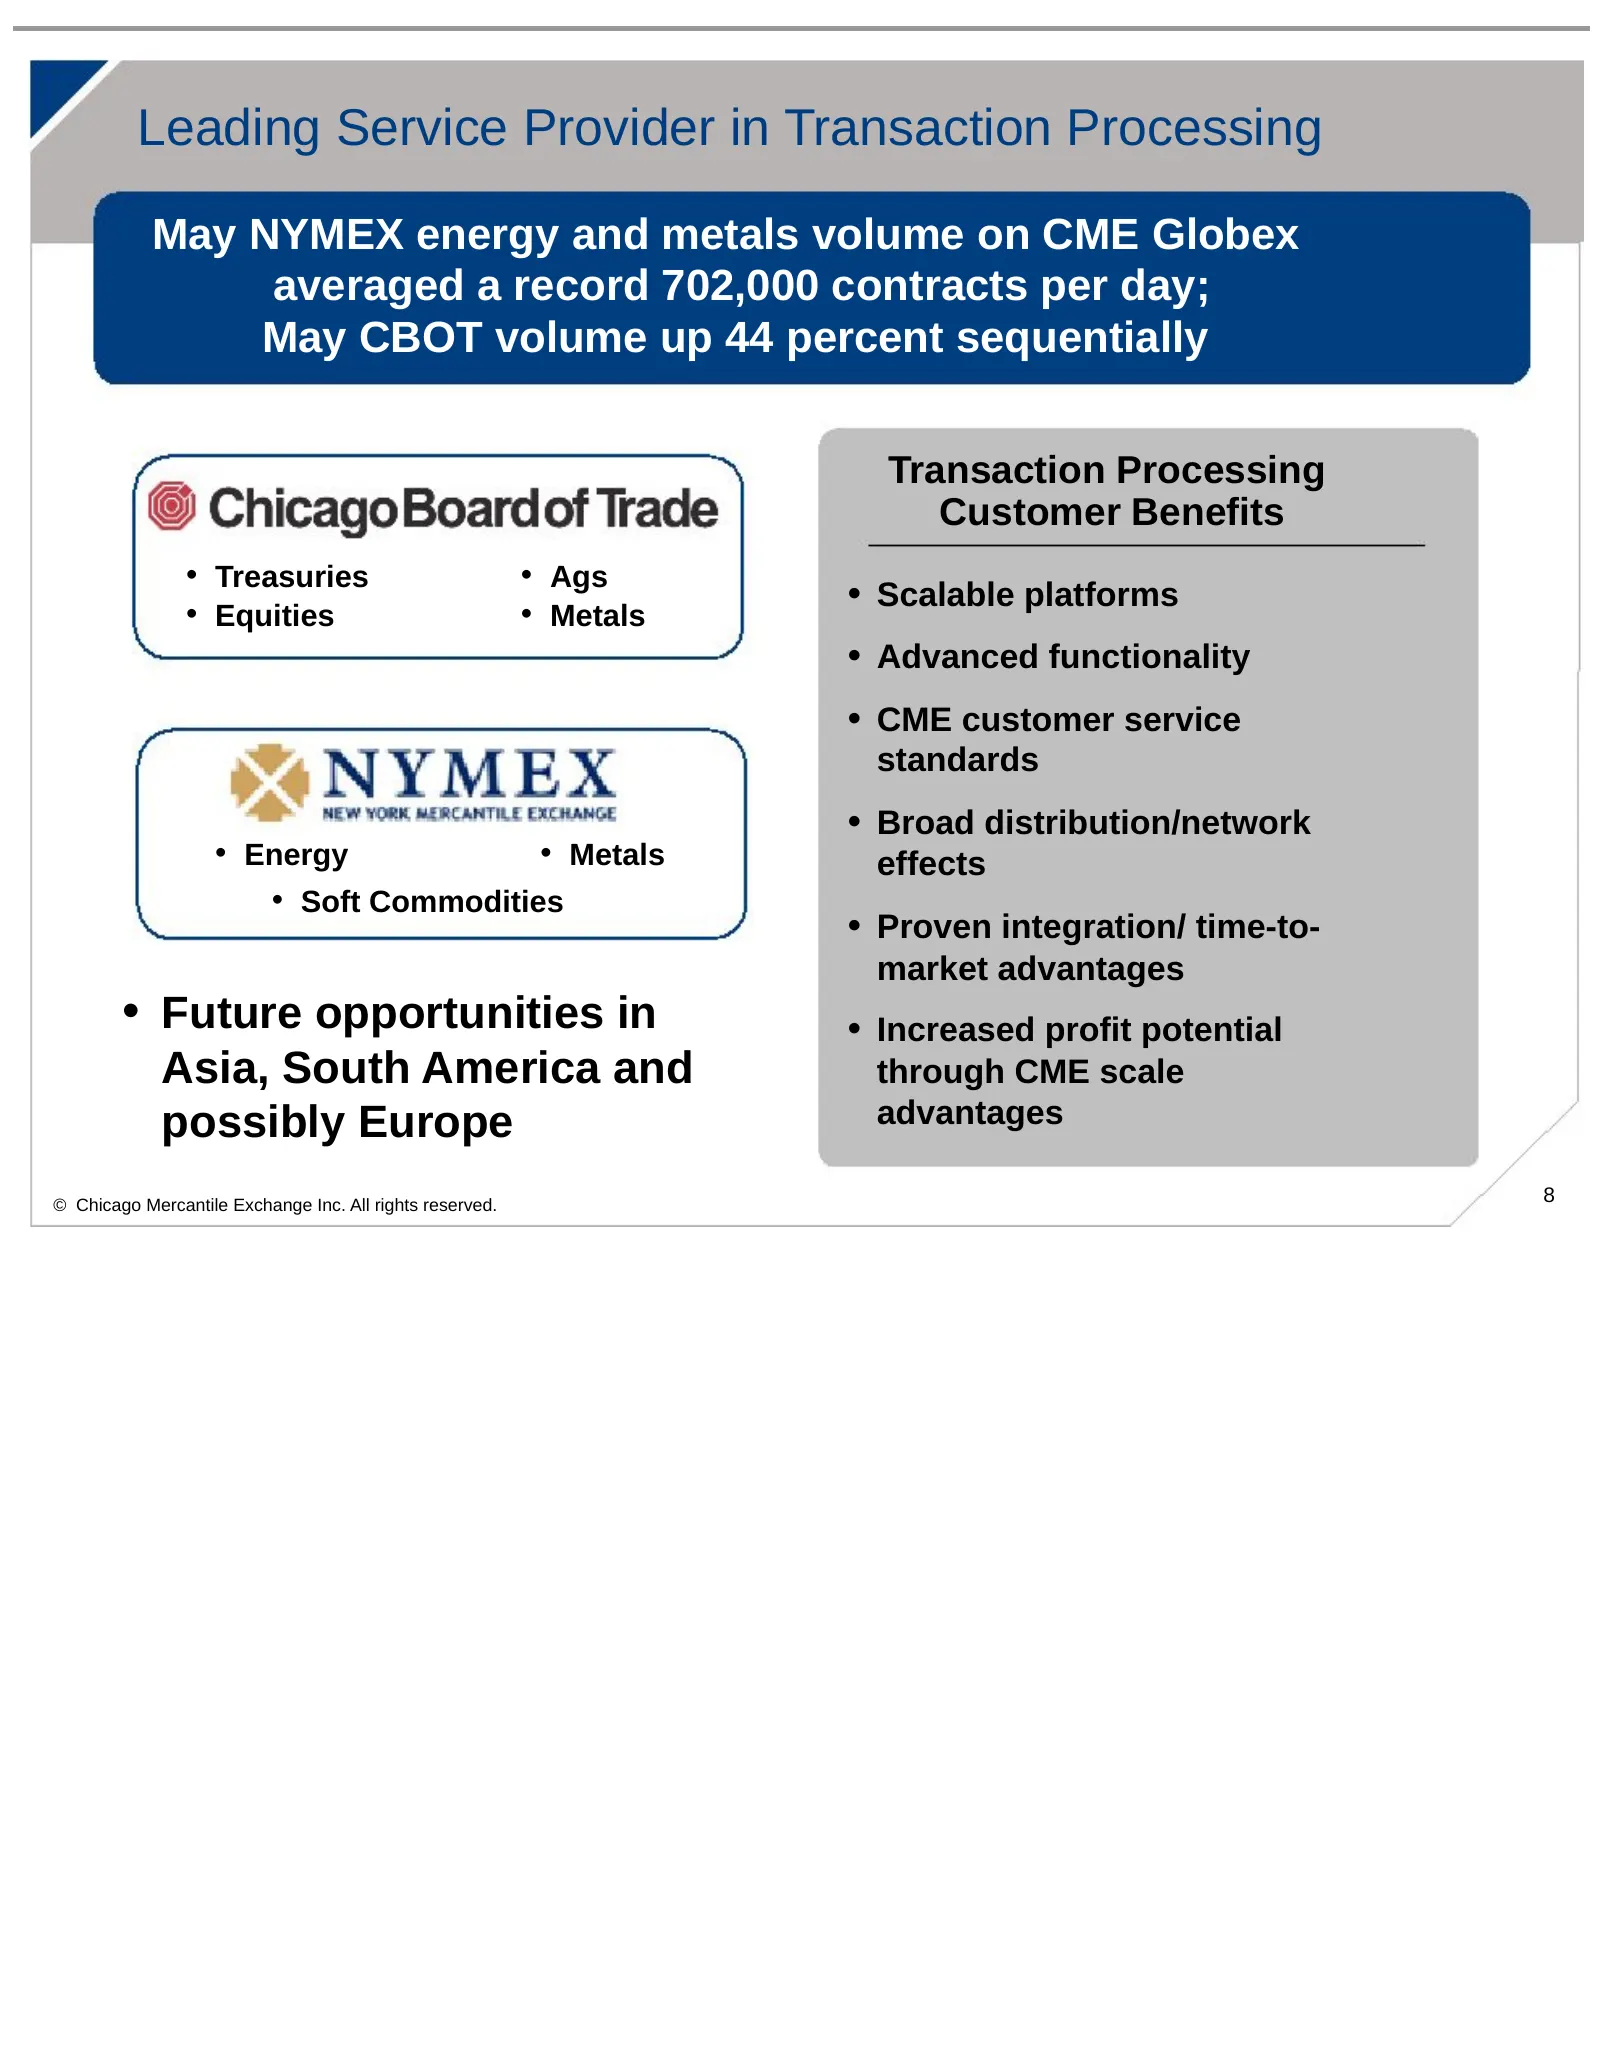
Leading Service Provider in Transaction Processing May NYMEX energy and metals volume on CME Globex averaged a record 702,000 contracts per day; May CBOT volume up 44 percent sequentially Transaction Processing Customer Benefits • Treasuries • Ags • Equities • Metals • Scalable platforms • Advanced
Slide 10: Transaction Processing – NYMEX on CME Globex
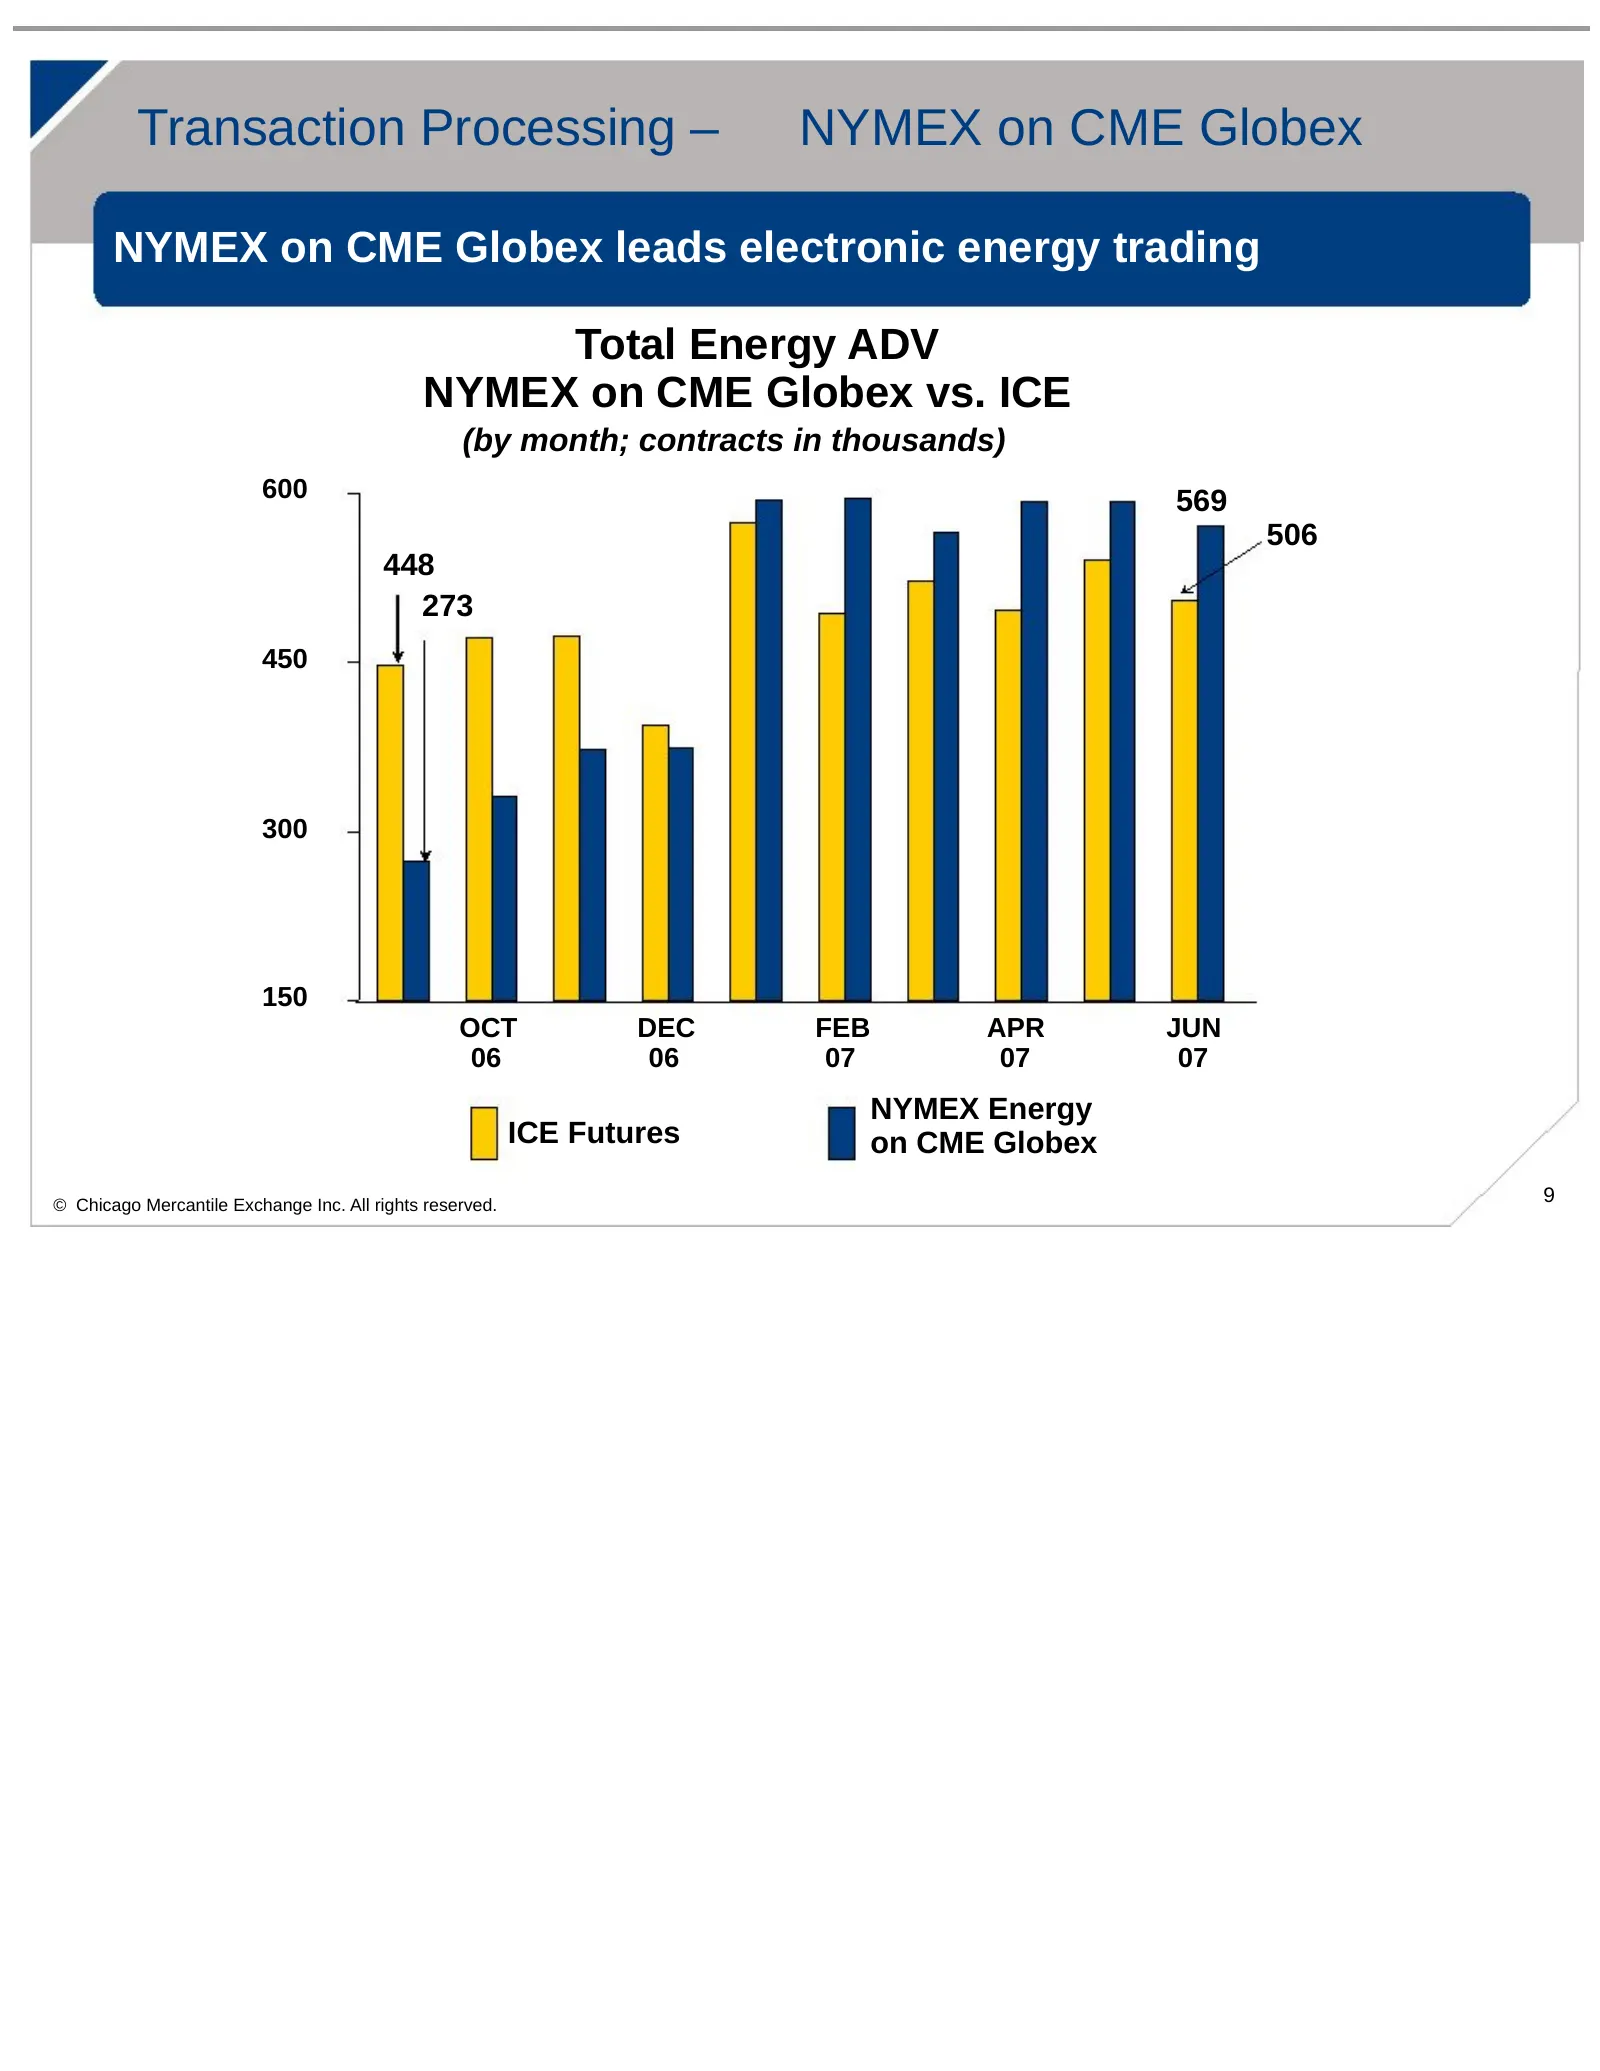
Transaction Processing – NYMEX on CME Globex NYMEX on CME Globex leads electronic energy trading Total Energy ADV NYMEX on CME Globex vs. ICE (by month; contracts in thousands) 600 569 506 448 273 450 300 150 OCT DEC FEB APR JUN 06 06 07 07 07 NYMEX Energy ICE Futures on CME Globex © Chicago Mercant
Slide 11: Significant Opportunities In Larger OTC/Spot Markets
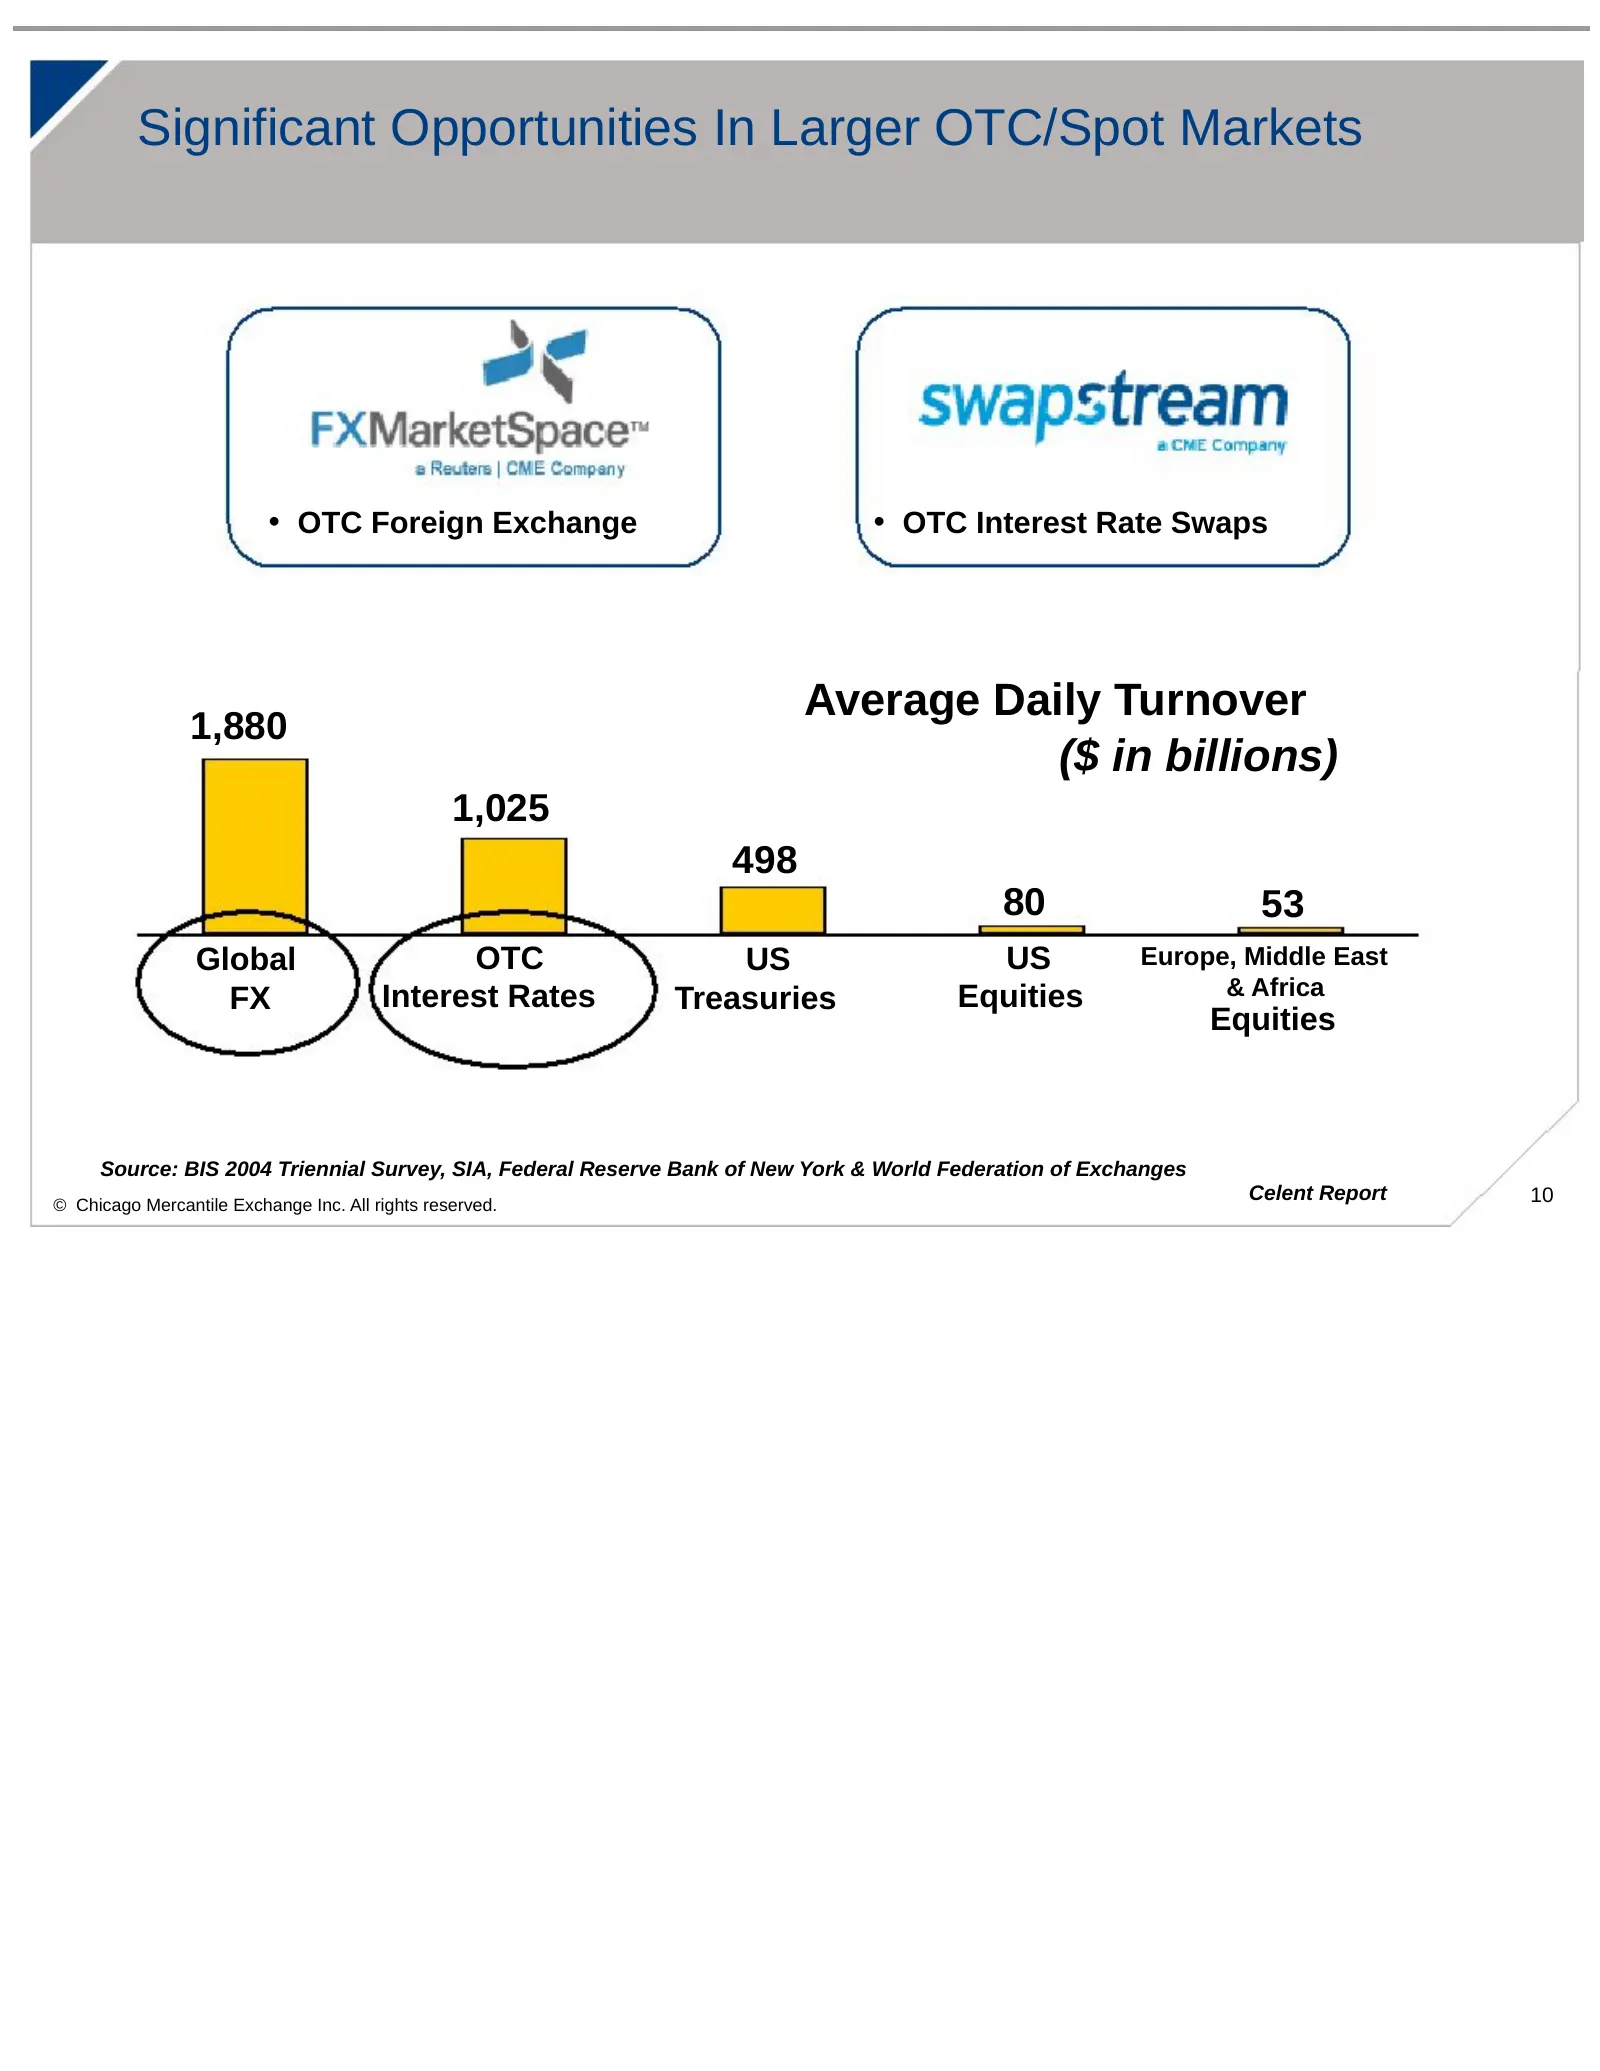
Significant Opportunities In Larger OTC/Spot Markets • OTC Foreign Exchange • OTC Interest Rate Swaps Average Daily Turnover 1,880 ($ in billions) 1,025 498 80 53 Global OTC US US Europe, Middle East Interest Rates Equities & Africa FX Treasuries Equities Source: BIS 2004 Triennial Survey, SIA, Fede
Slide 12: OTC/Spot Market Opportunities
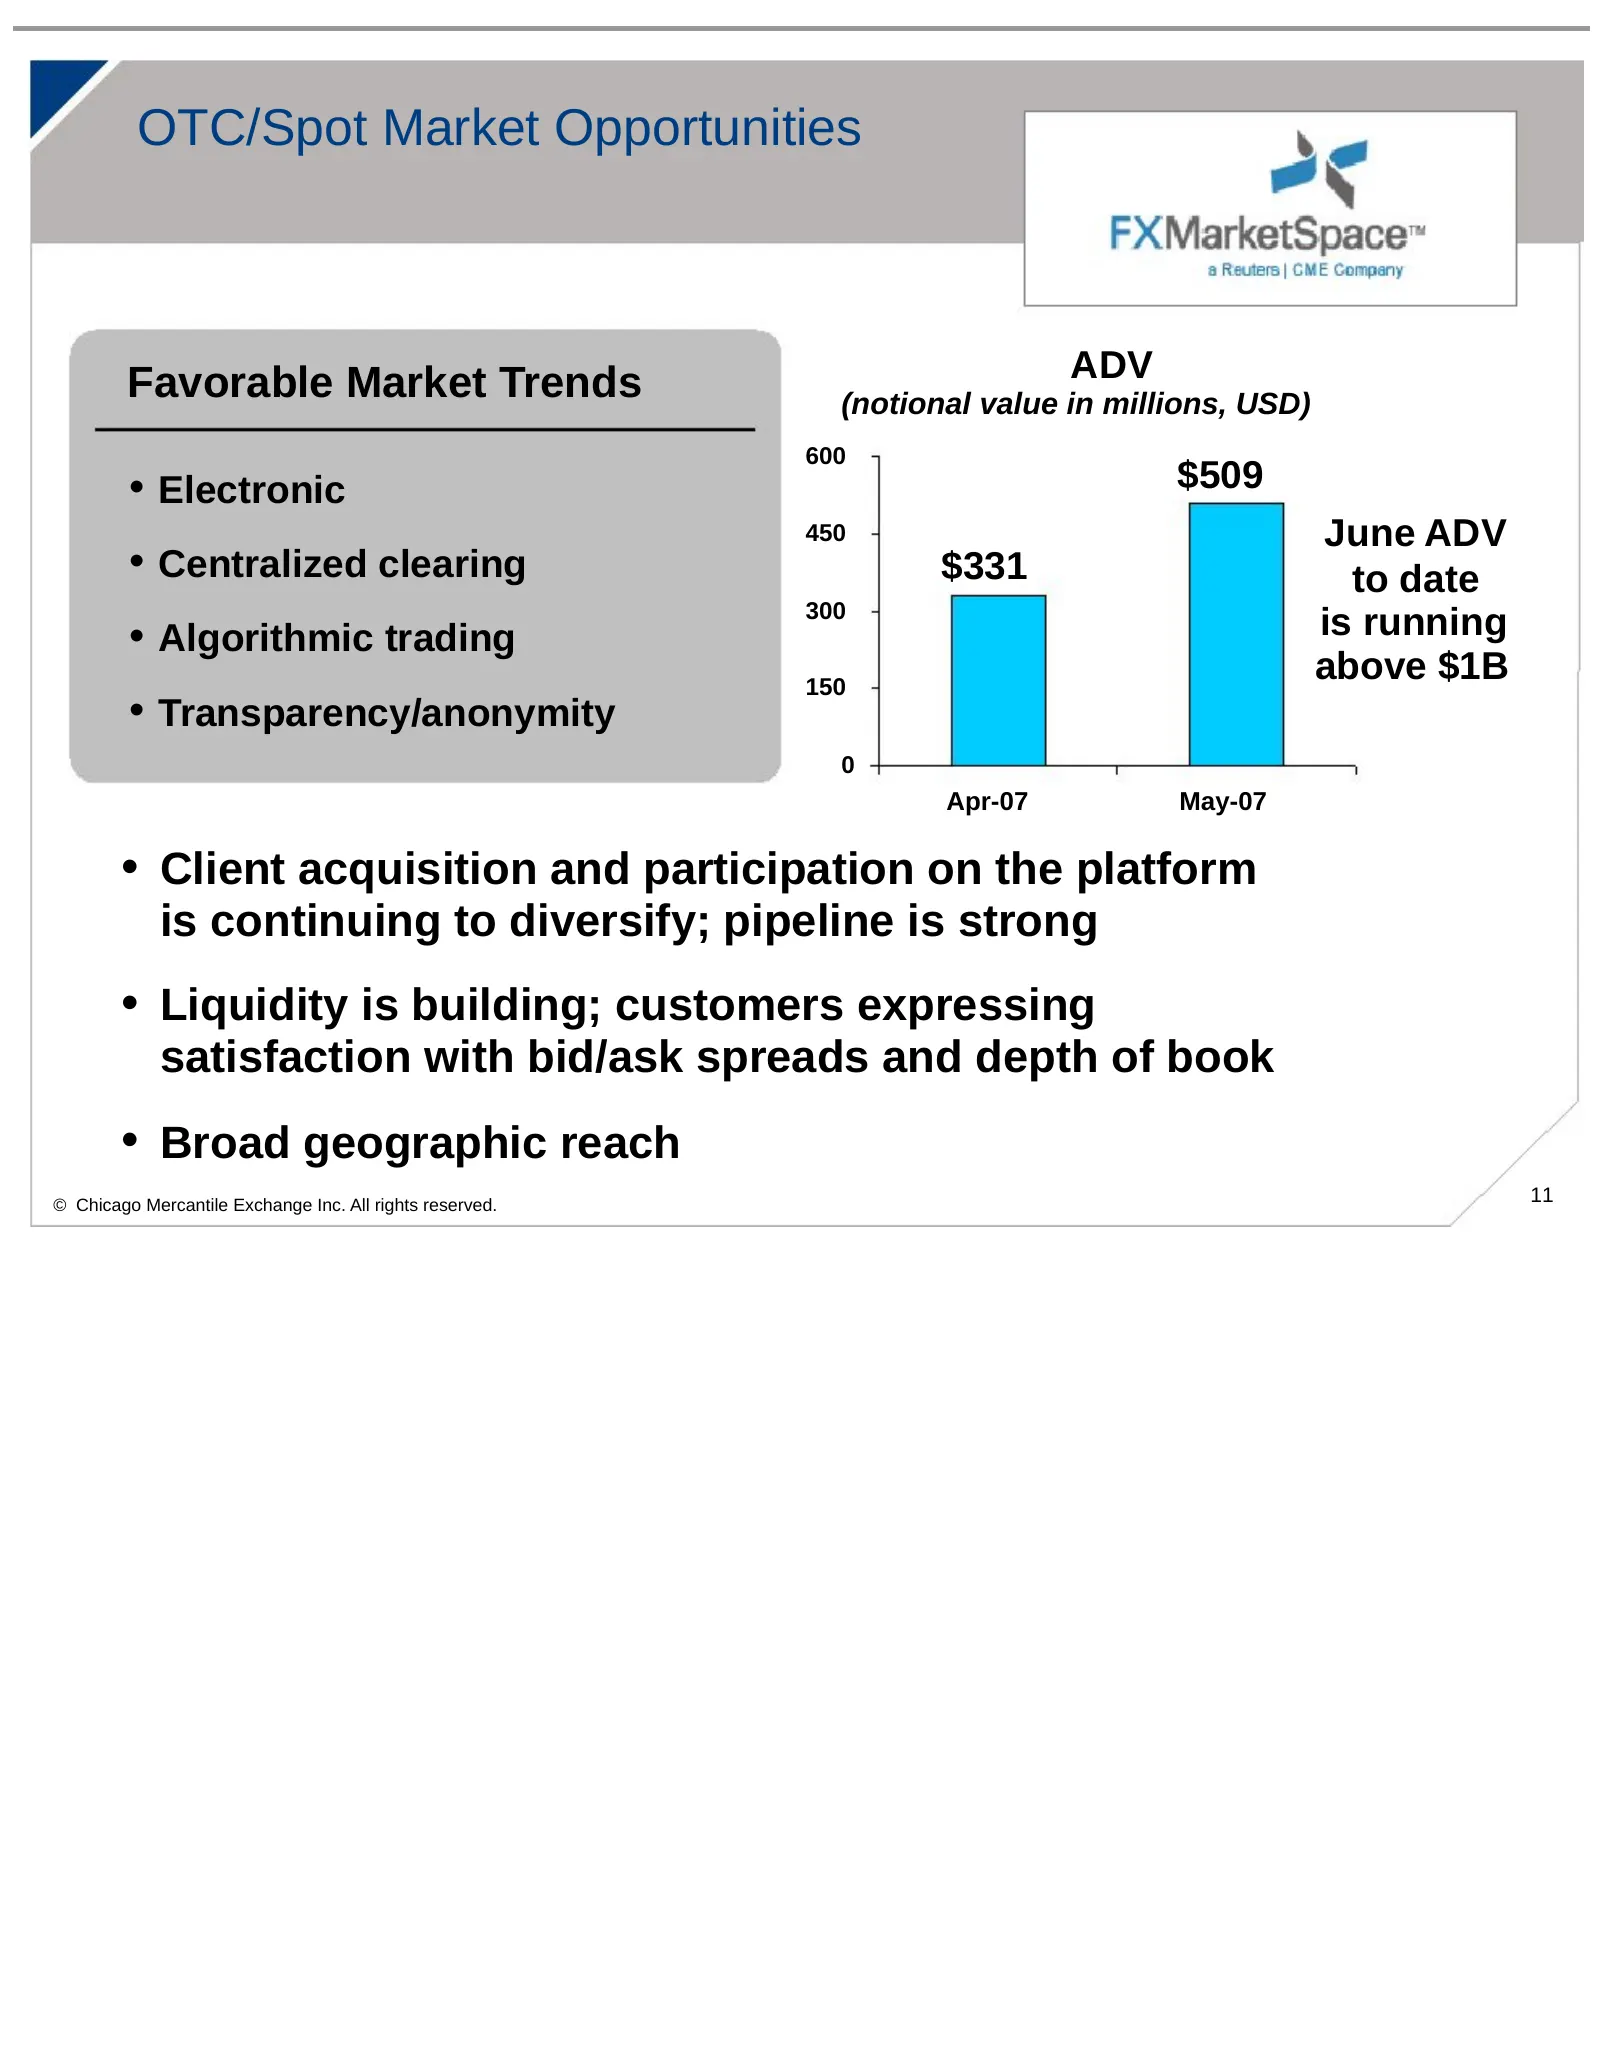
OTC/Spot Market Opportunities ADV Favorable Market Trends (notional value in millions, USD) 600 • Electronic $509 450 June ADV • Centralized clearing $331 to date 300 • Algorithmic trading is running 150 above $1B • Transparency/anonymity 0 Apr-07 May-07 • Client acquisition and participation on the
Slide 13: CME/CBOT Proposed Merger: Best strategic alternative
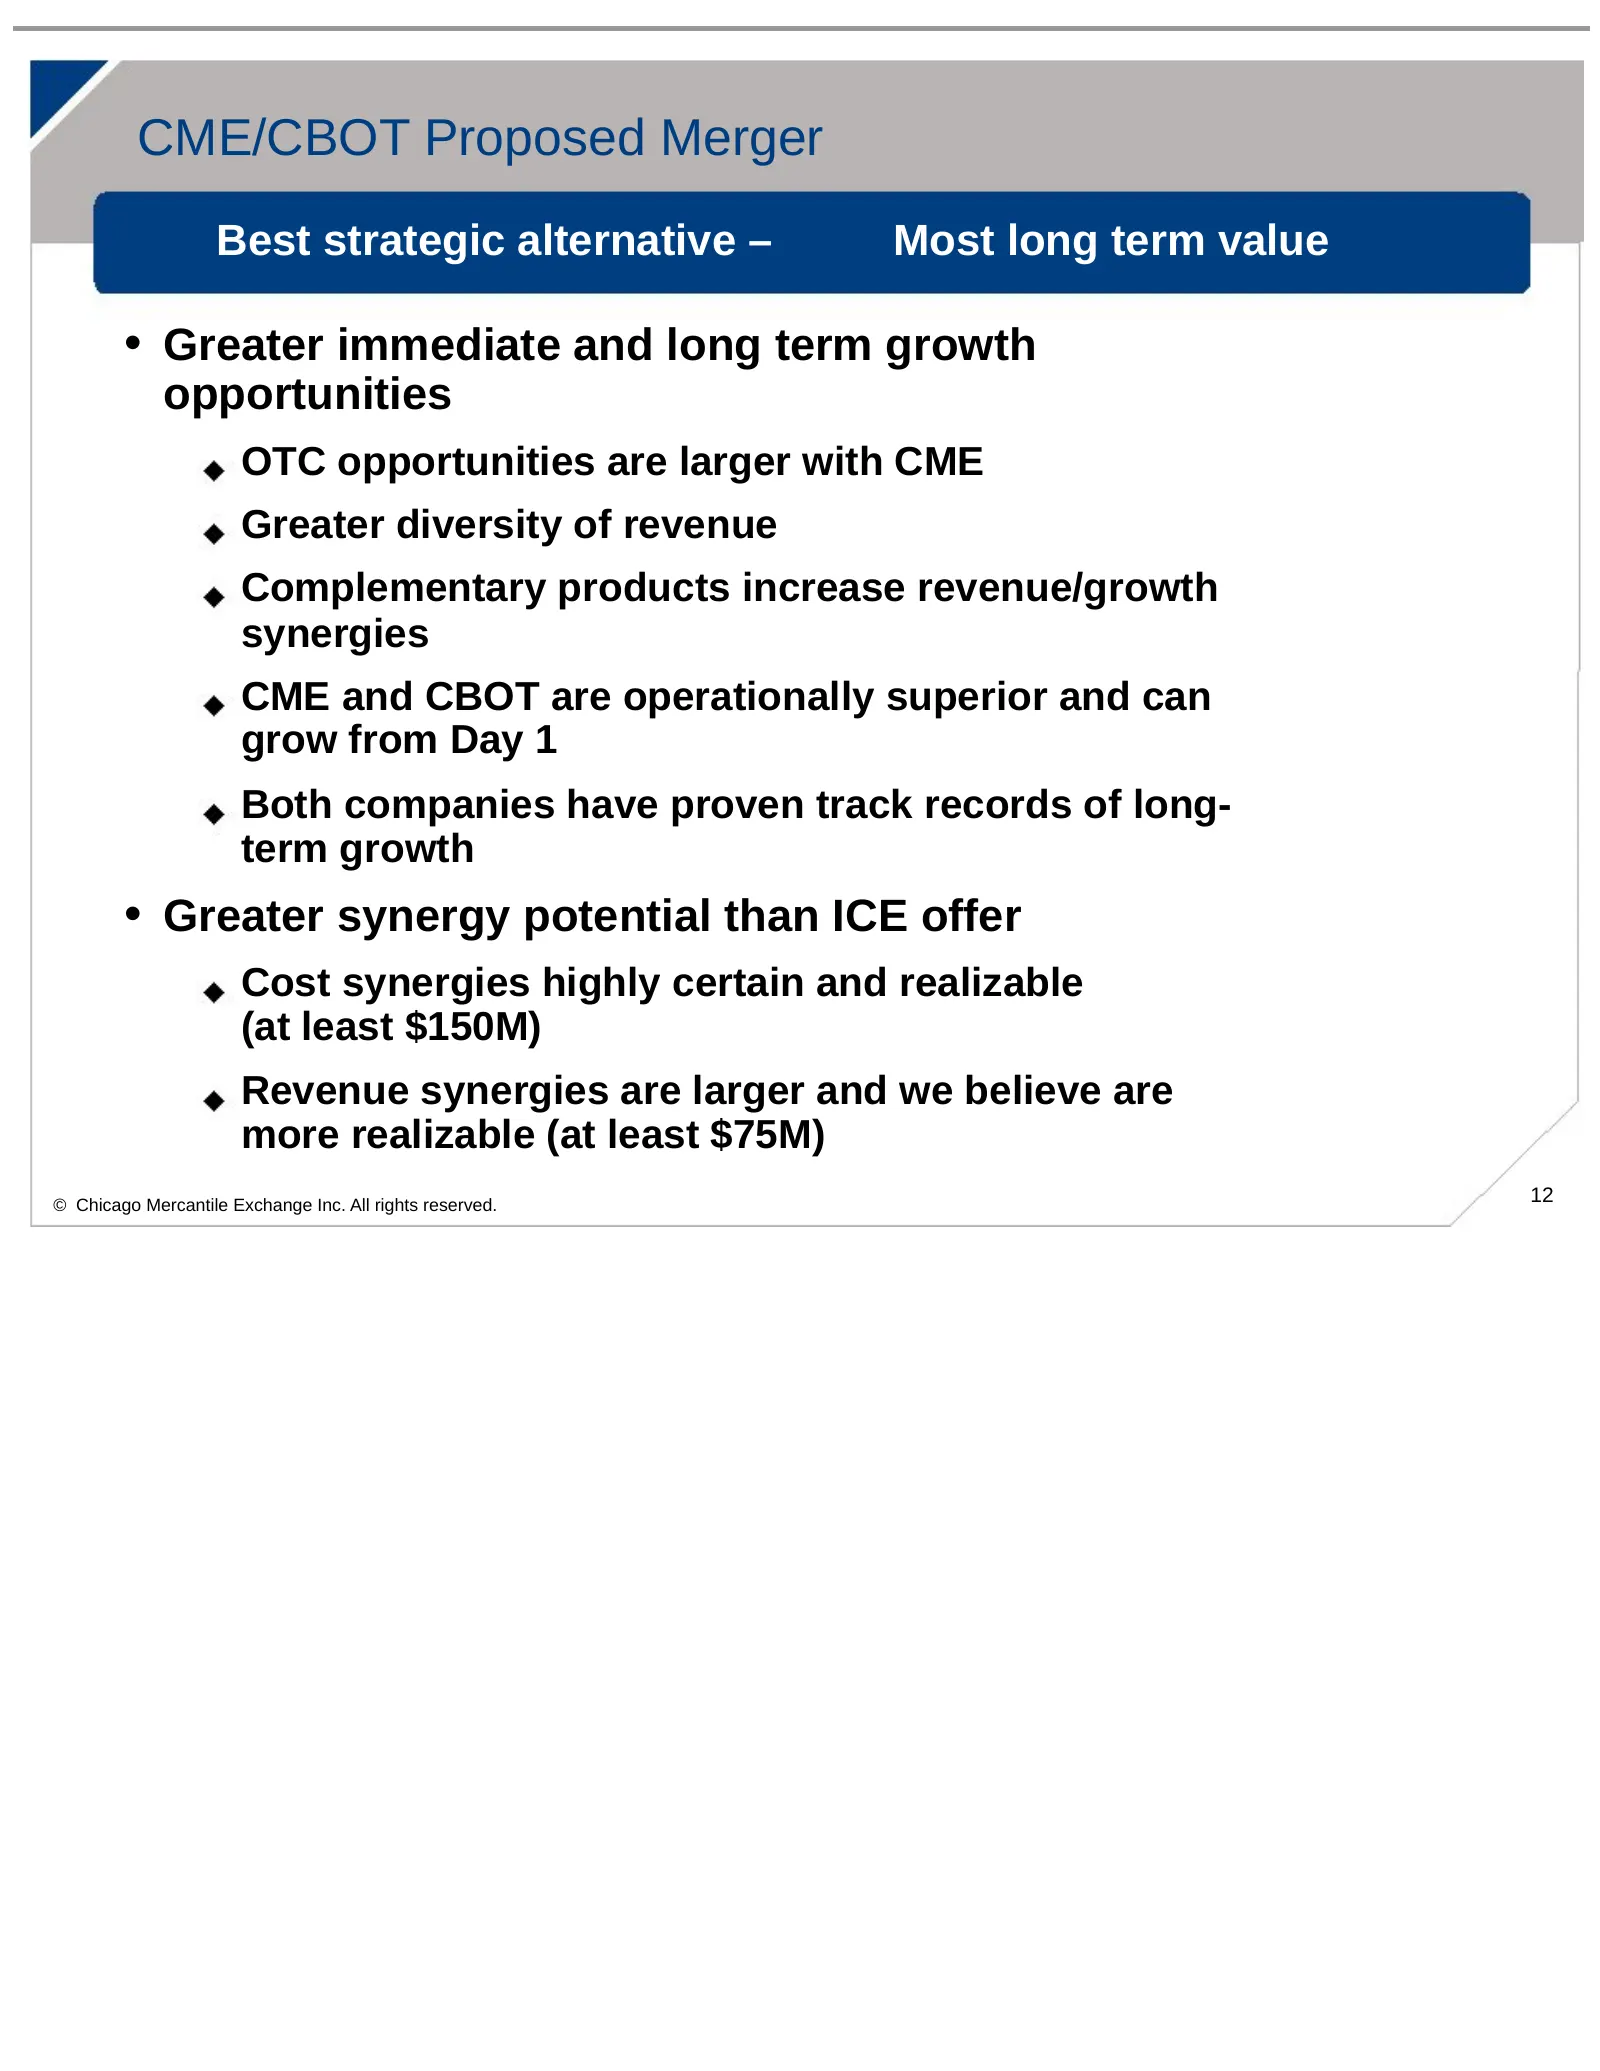
CME/CBOT Proposed Merger Best strategic alternative – Most long term value • Greater immediate and long term growth opportunities OTC opportunities are larger with CME Greater diversity of revenue Complementary products increase revenue/growth synergies CME and CBOT are operationally superior and ca
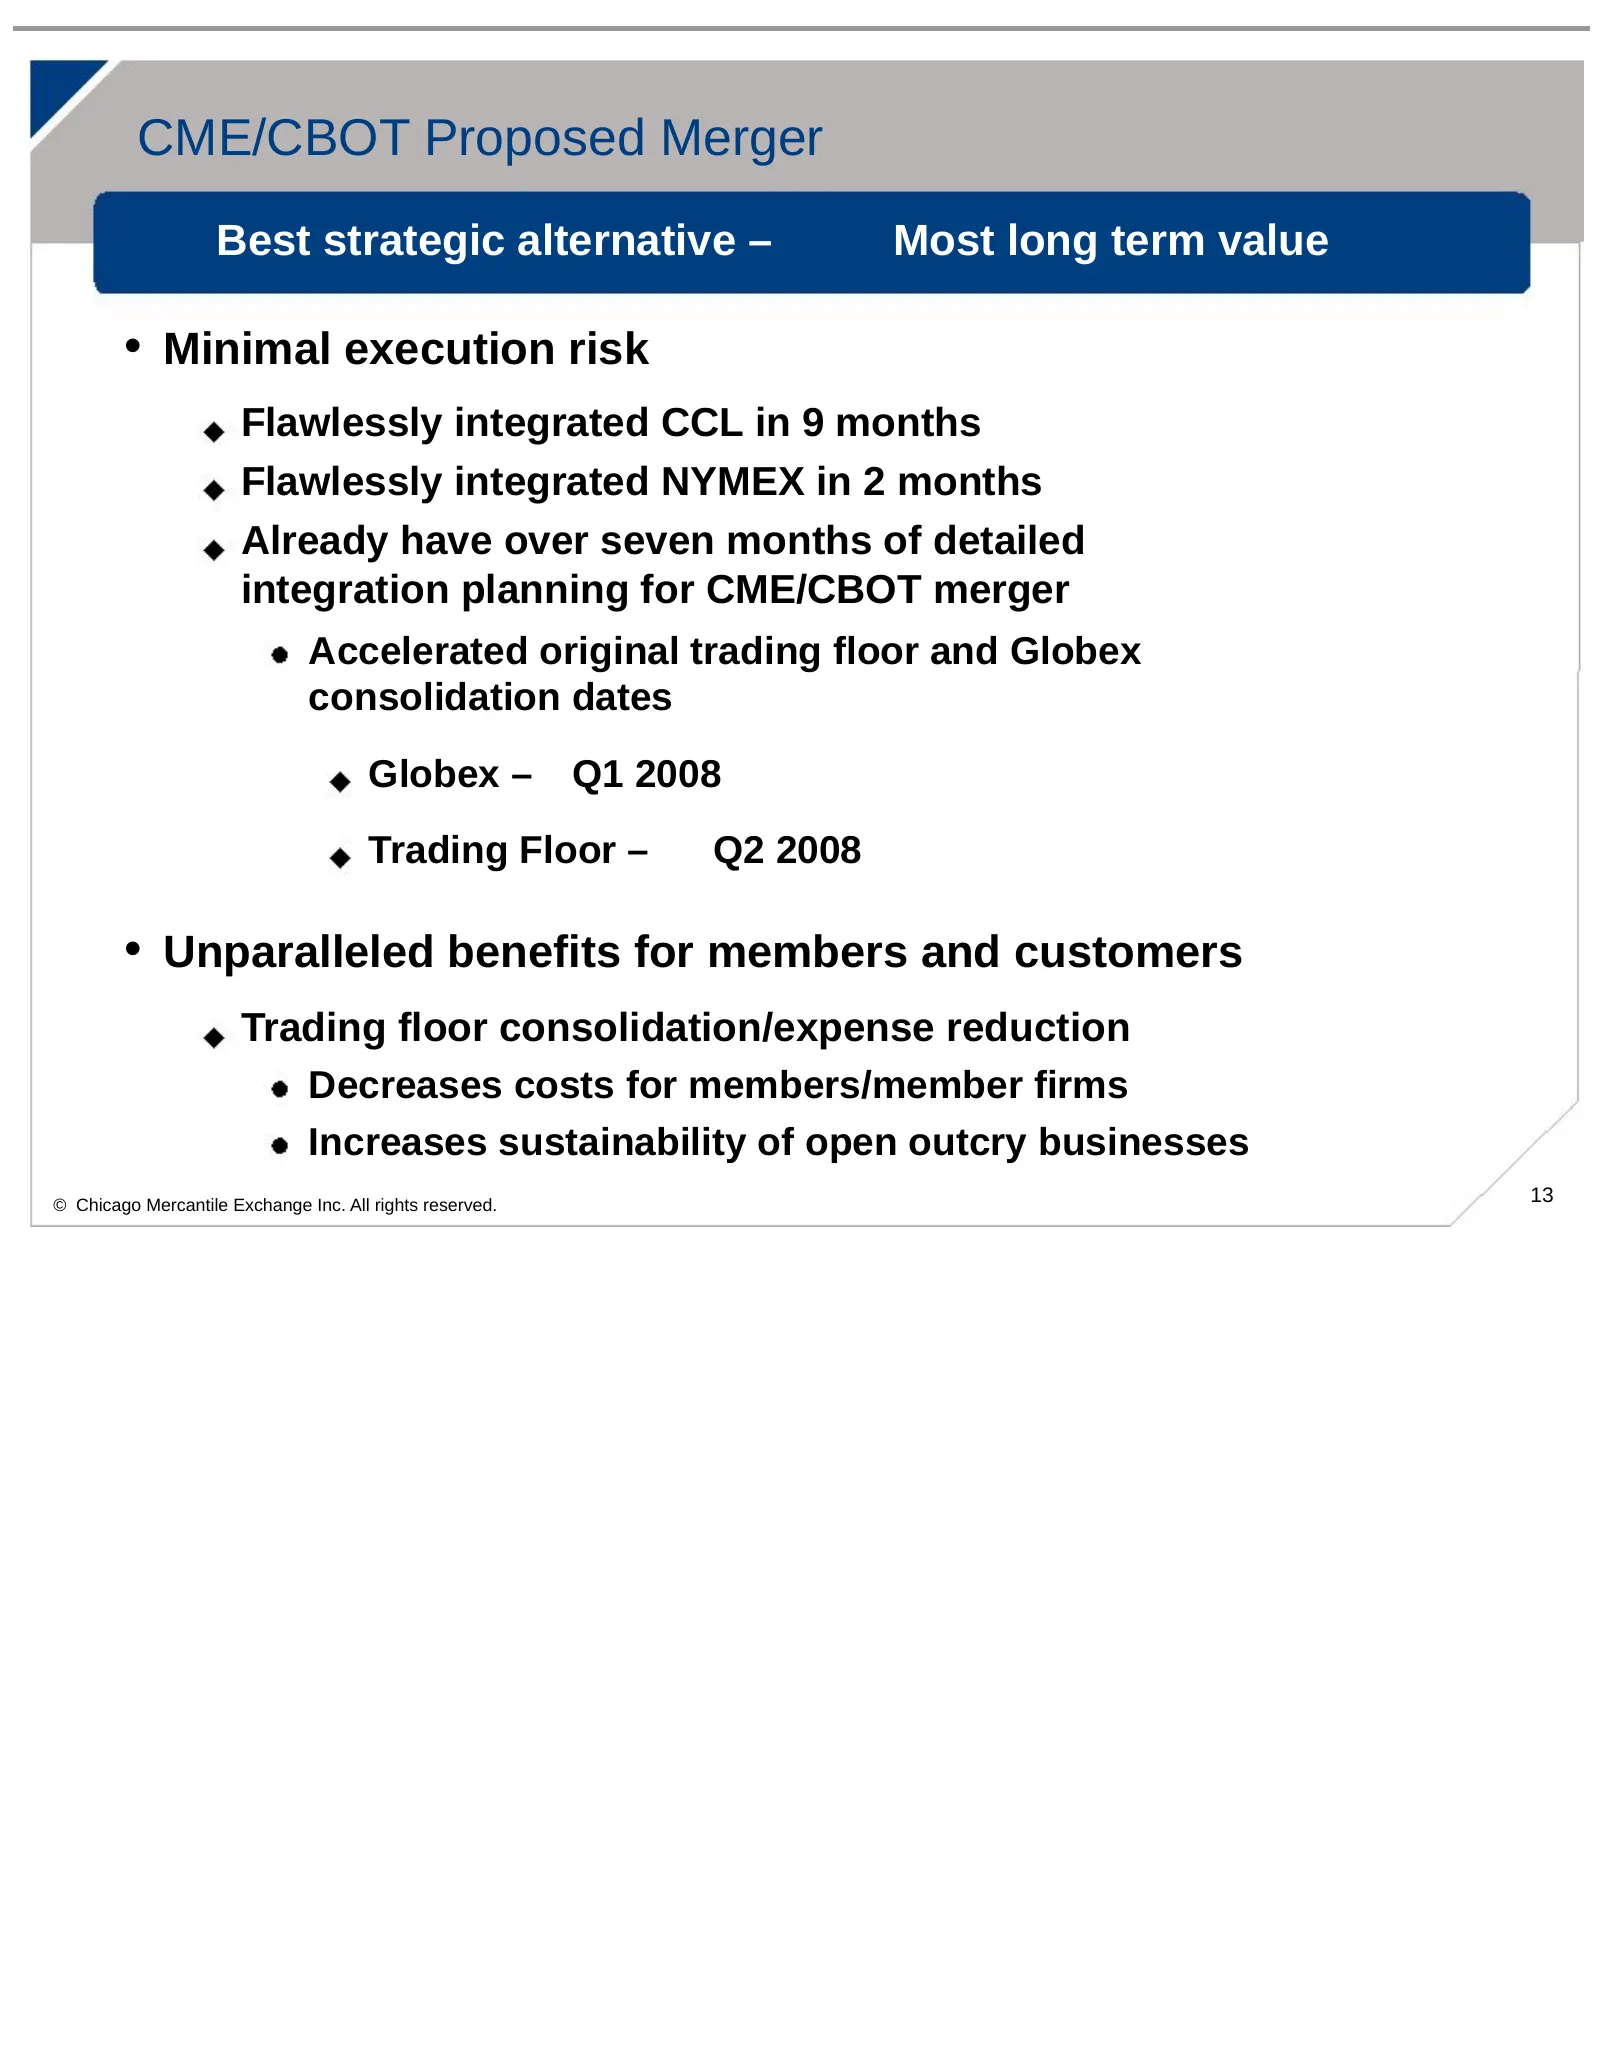
Slide 14: CME/CBOT Proposed Merger: Minimal execution risk
CME/CBOT Proposed Merger Best strategic alternative – Most long term value • Minimal execution risk Flawlessly integrated CCL in 9 months Flawlessly integrated NYMEX in 2 months Already have over seven months of detailed integration planning for CME/CBOT merger Accelerated original trading floor and
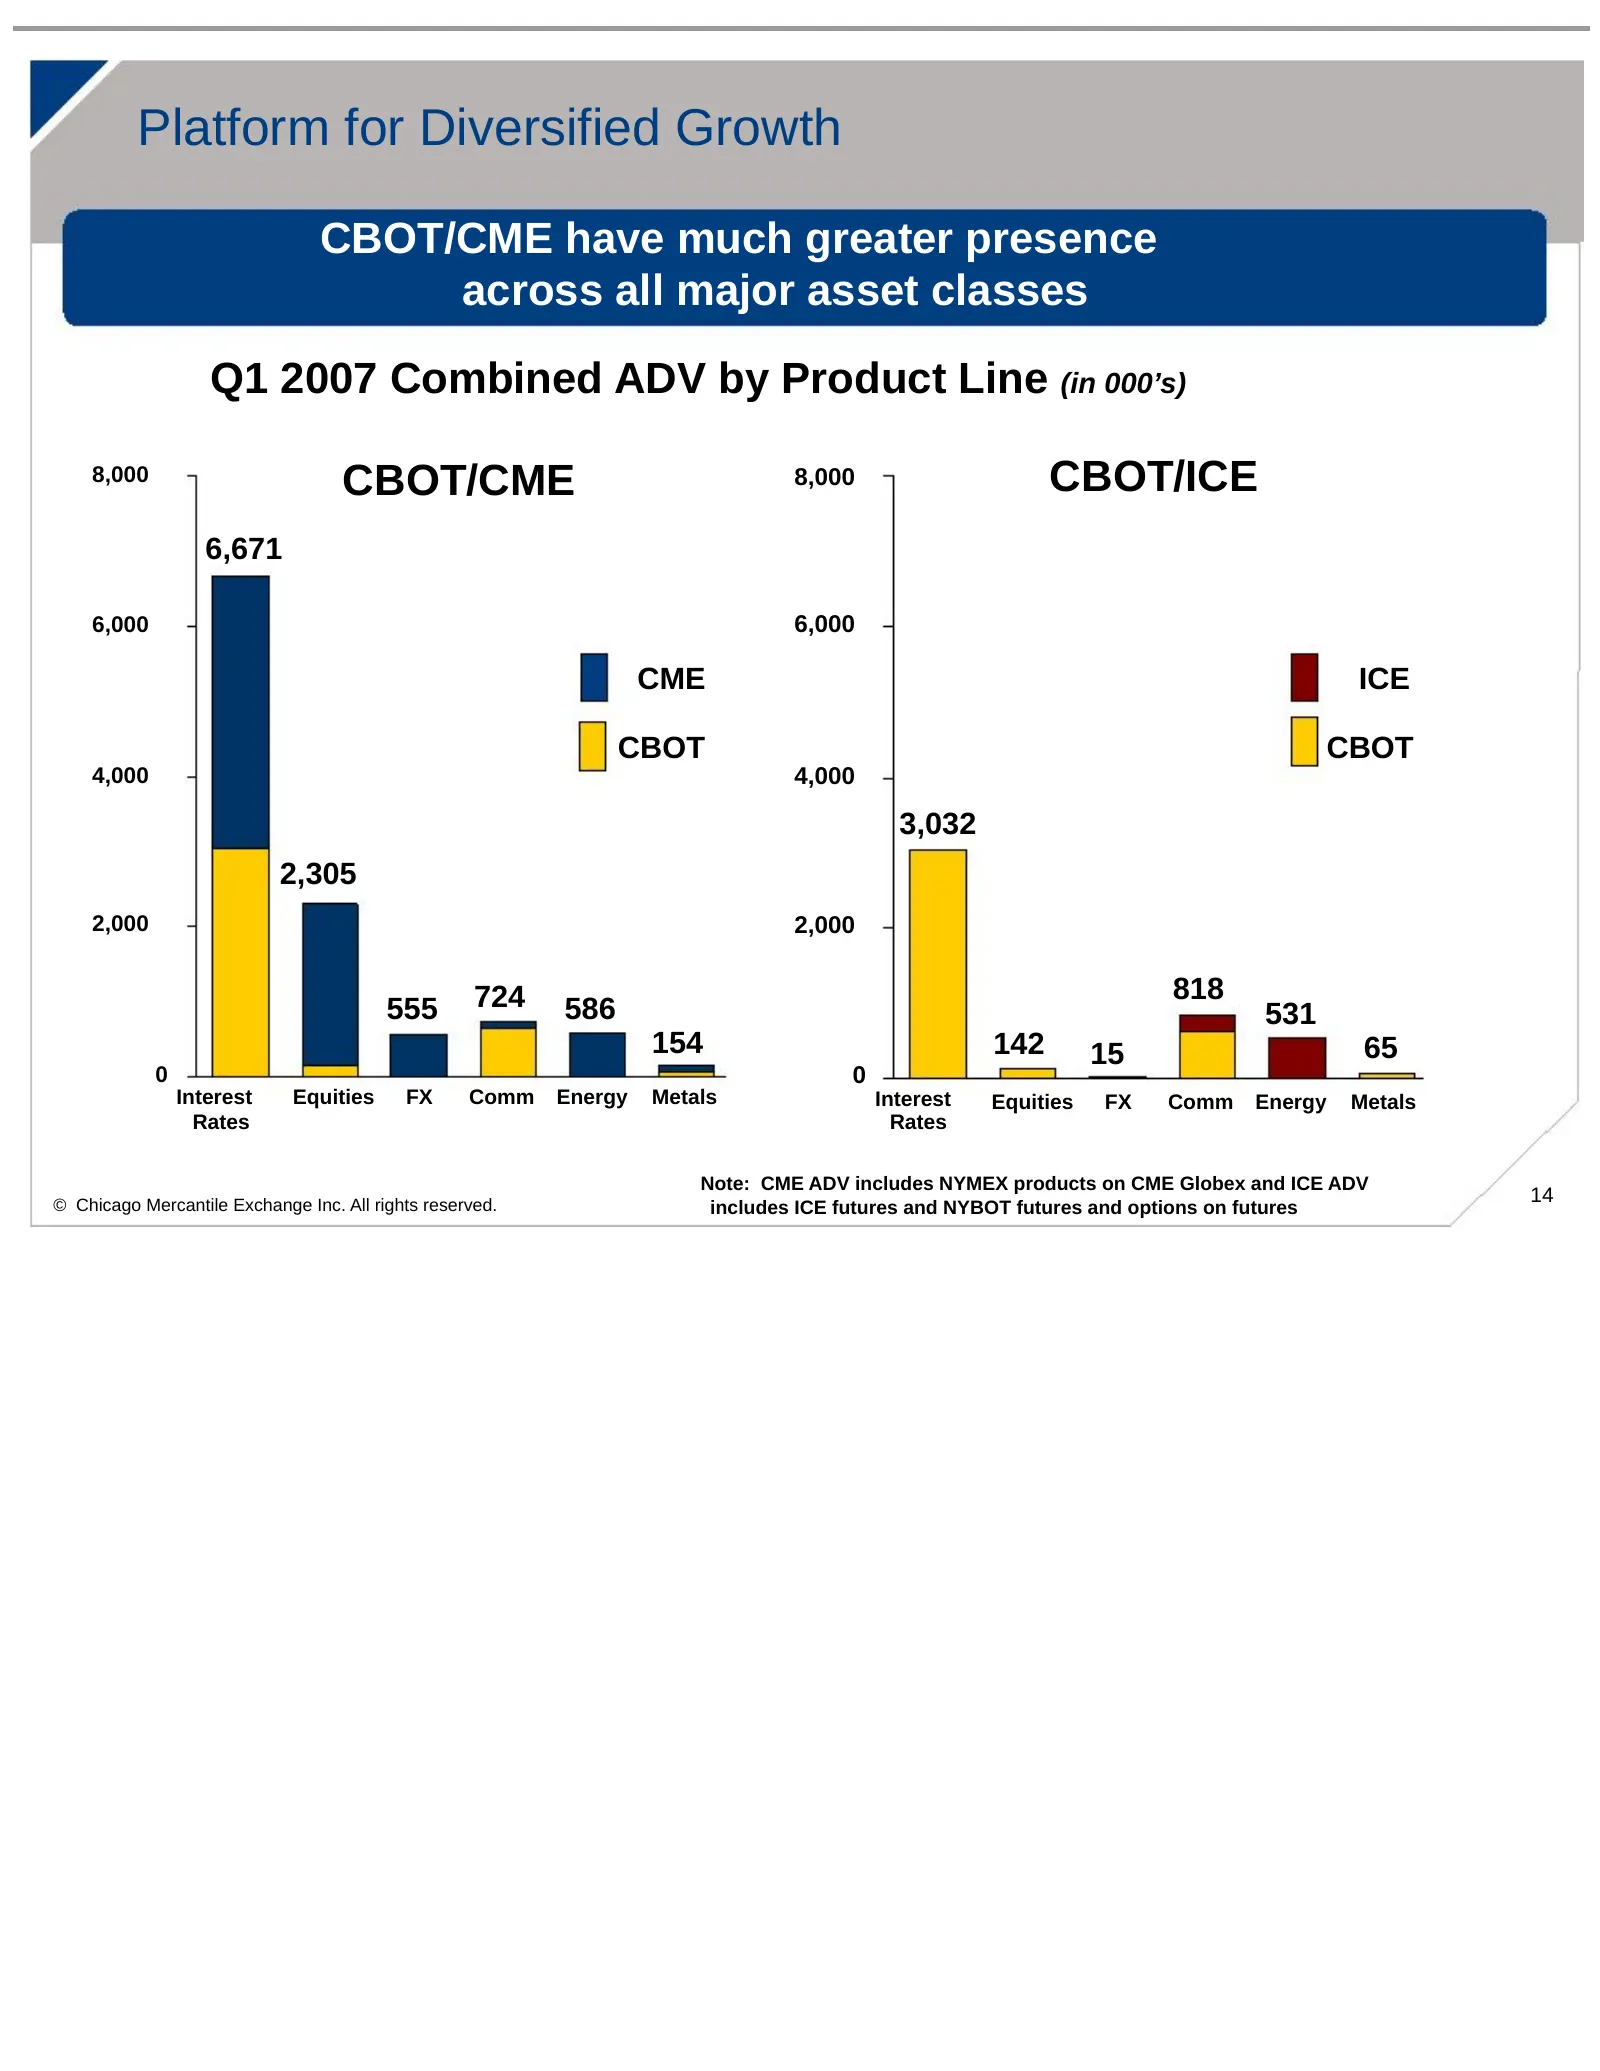
Slide 15: Platform for Diversified Growth
Platform for Diversified Growth CBOT/CME have much greater presence across all major asset classes Q1 2007 Combined ADV by Product Line (in 000’s) 8,000 CBOT/CME 8,000 CBOT/ICE 6,671 6,000 6,000 CME ICE CBOT CBOT 4,000 4,000 3,032 2,305 2,000 2,000 724 818 555 586 531 154 142 15 65 0 0 Interest Equi
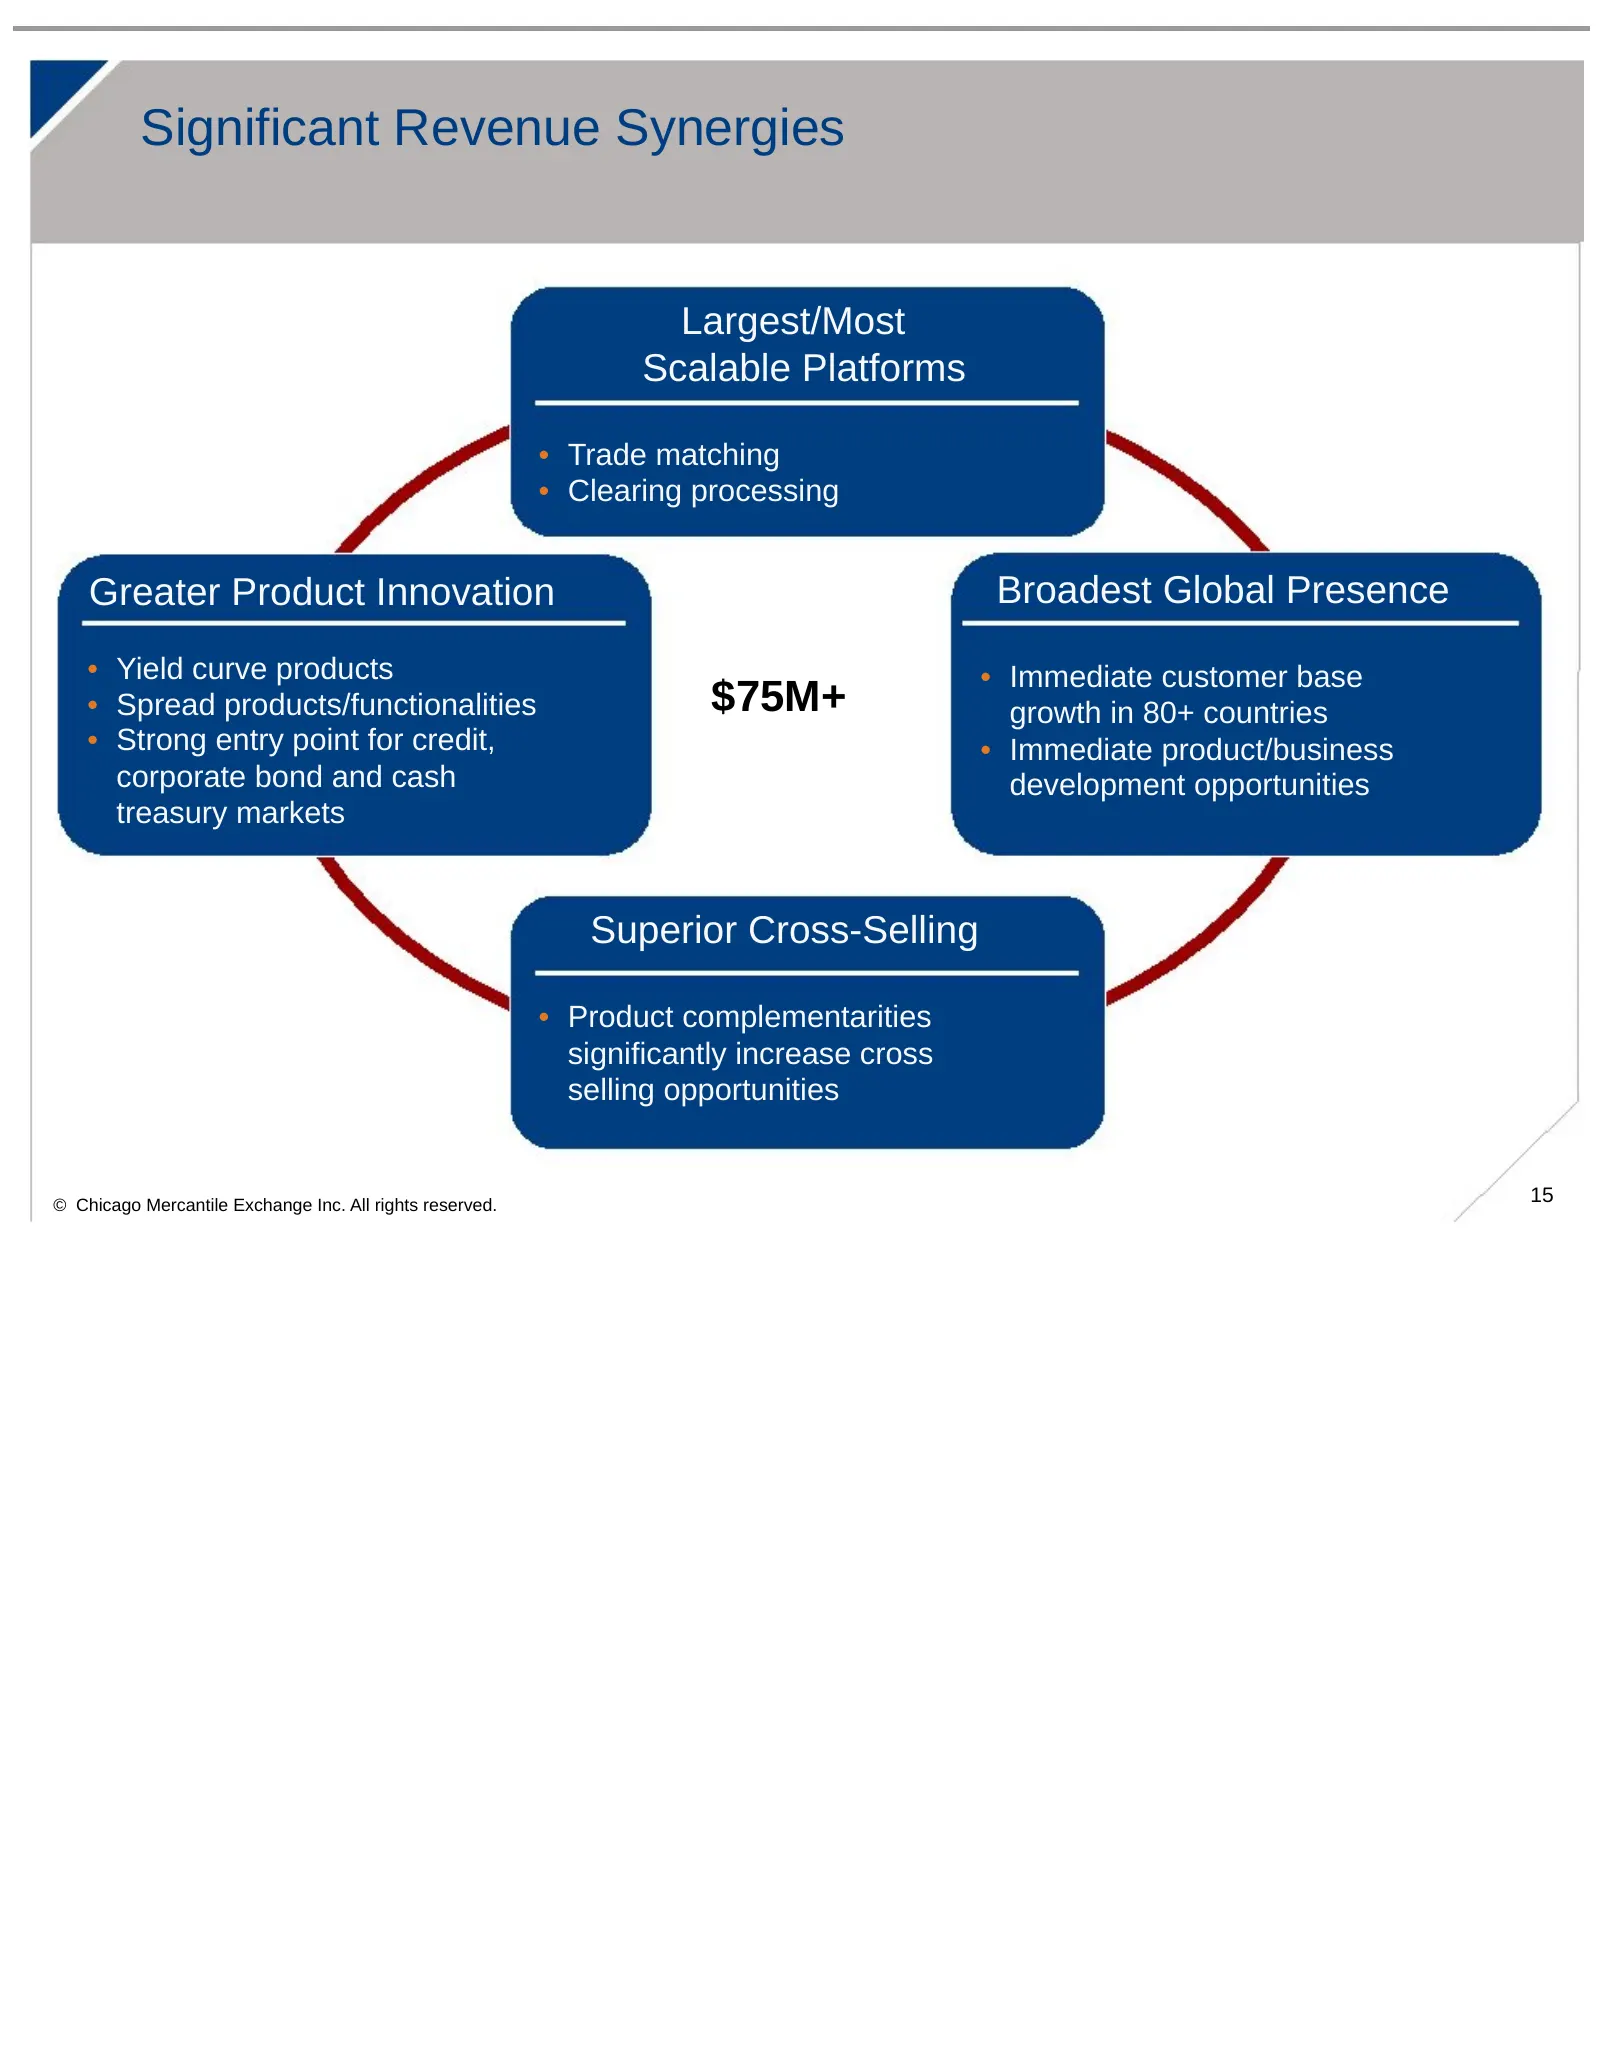
Slide 16: Significant Revenue Synergies
Significant Revenue Synergies Largest/Most Scalable Platforms • Trade matching • Clearing processing Greater Product Innovation Broadest Global Presence • Yield curve products • Immediate customer base • Spread products/functionalities $75M+ growth in 80+ countries • Strong entry point for credit, •
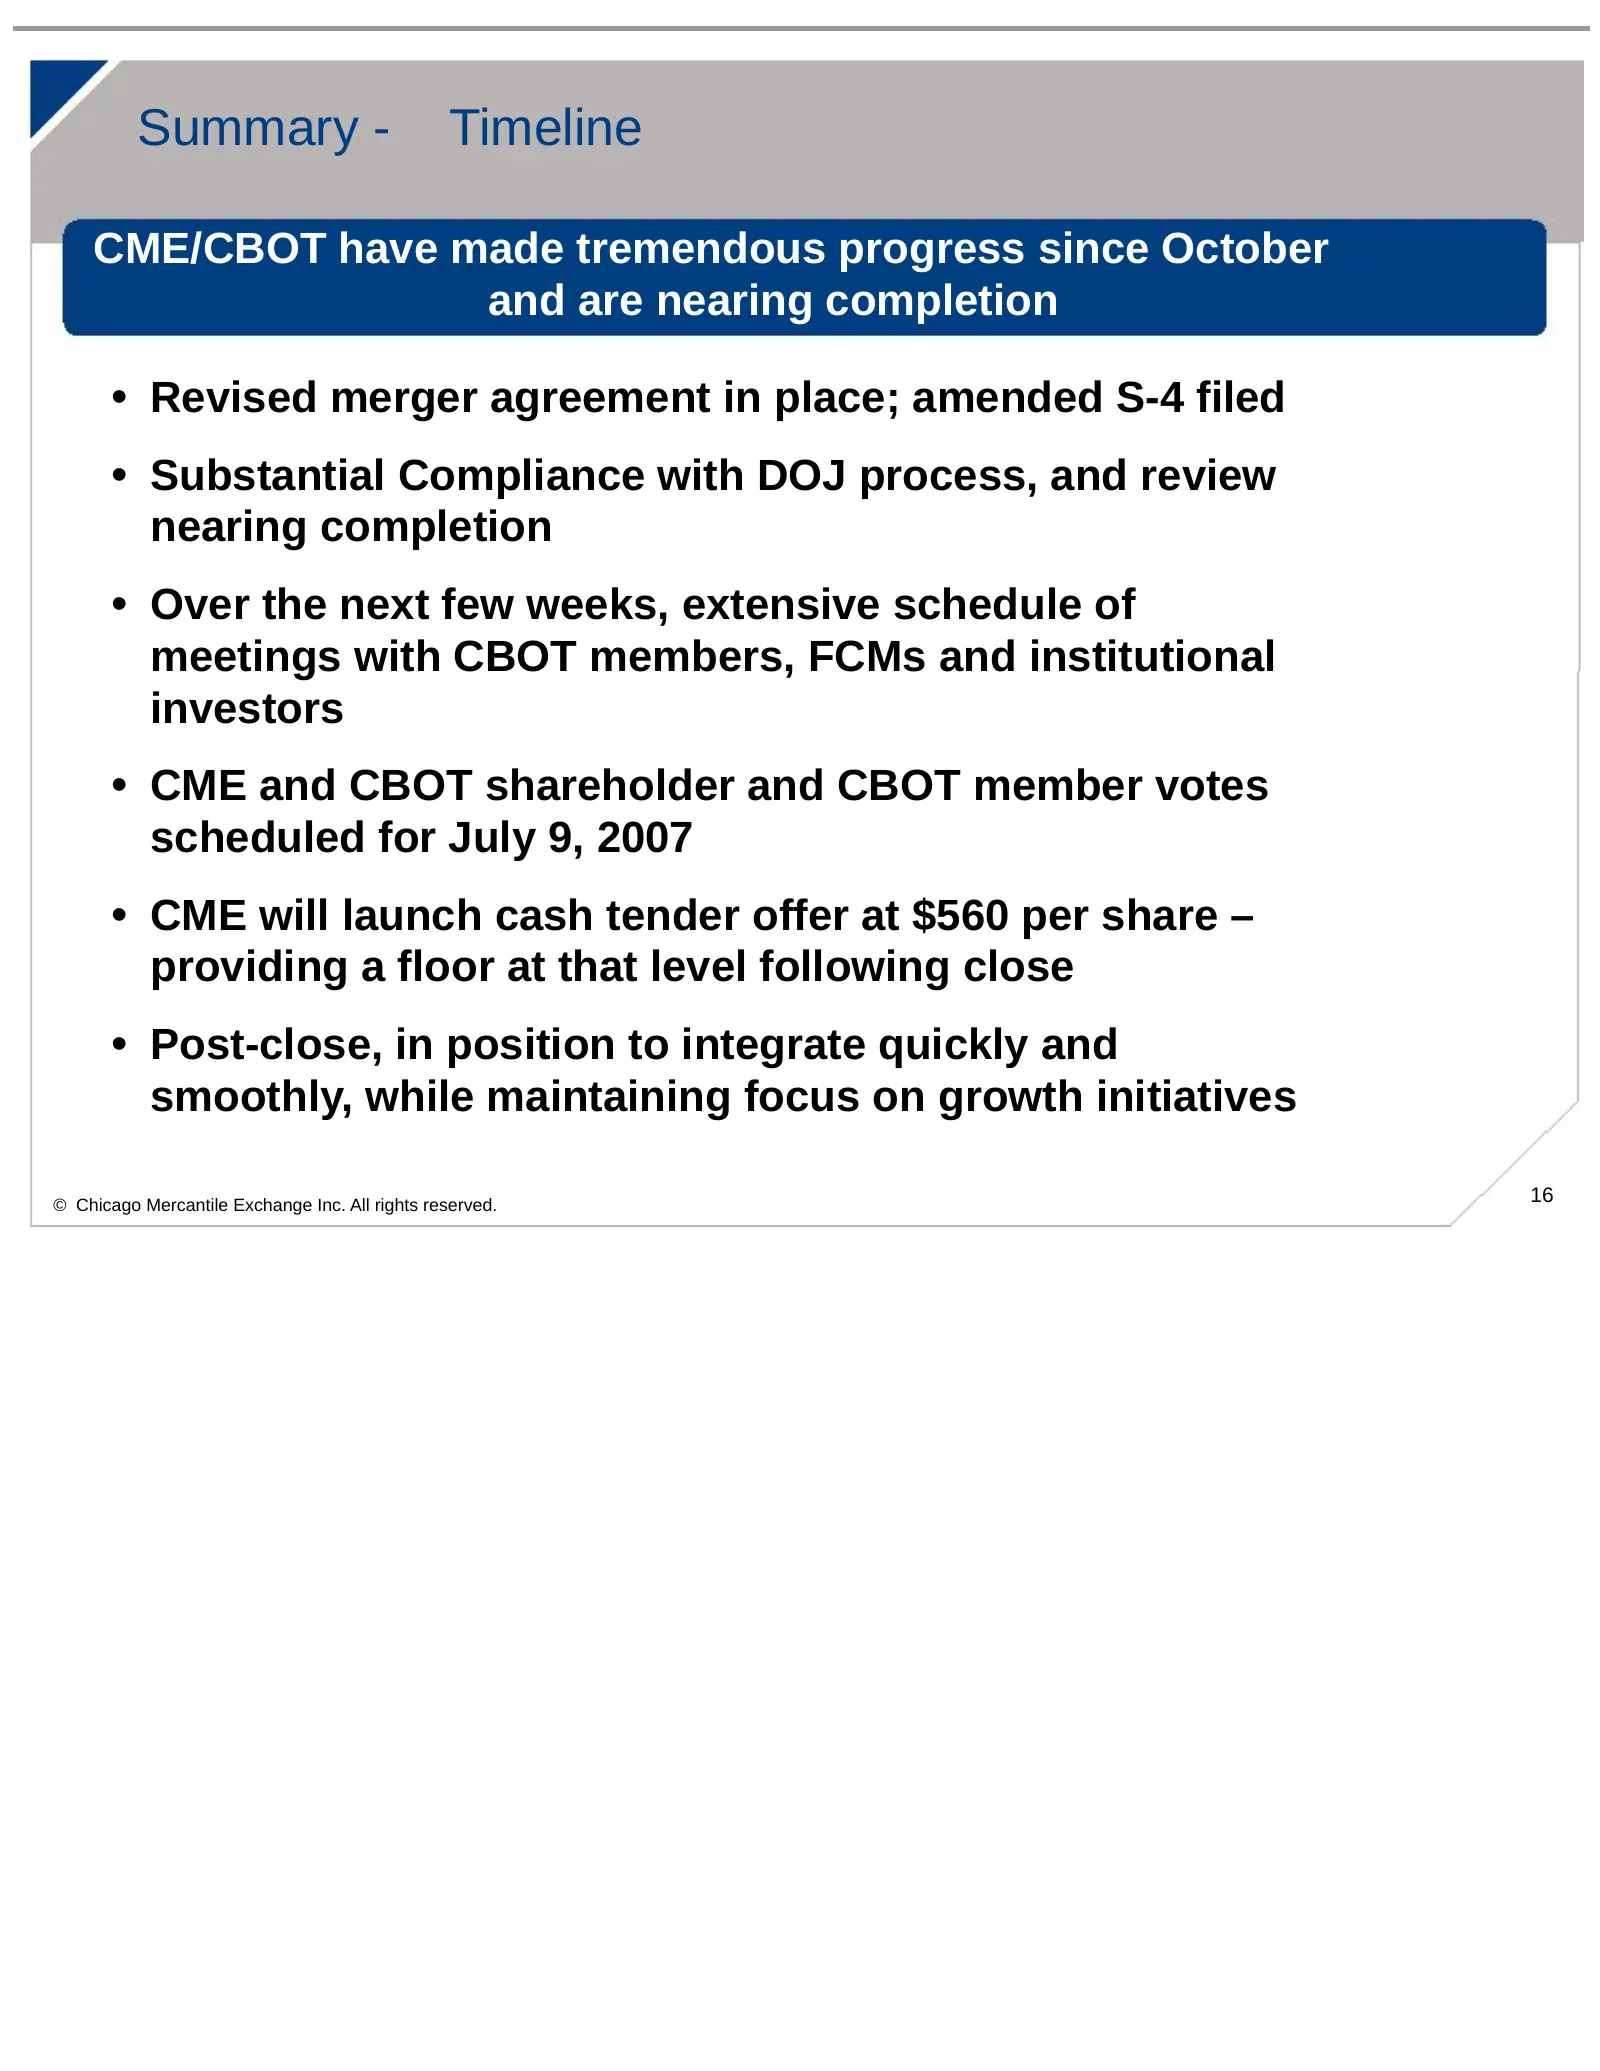
Slide 17: Summary - Timeline
Summary - Timeline CME/CBOT have made tremendous progress since October and are nearing completion • Revised merger agreement in place; amended S-4 filed • Substantial Compliance with DOJ process, and review nearing completion • Over the next few weeks, extensive schedule of meetings with CBOT membe
Slide 18: Questions?
Questions? Craig Donohue, CEO Jamie Parisi, CFO June 7, 2007
Source: SEC EDGAR · 425 filed Jun 7, 2007
More decks from Cbot Holdings Inc
 Cbot Holdings — Merger or Acquisition (June 2007)18 slides · Jun 28, 2007
 Merger or Acquisition (June 2007)30 slides · Jun 26, 2007
 Merger or Acquisition (June 2007)20 slides · Jun 26, 2007
 Cbot Holdings — Merger or Acquisition (June 2007)24 slides · Jun 25, 2007
 Merger or Acquisition (June 2007)29 slides · Jun 22, 2007
 William Blair Annual Growth Stock Conference 200743 slides · Jun 20, 2007