Snap Inc. · NYSE:SNAP
Snap — Q4 2022 Earnings Presentation
26 slides from Snap's earnings presentation, Jan 31, 2023

Slide 1: Q4 2022 Earnings Slides
Q4 2022 Earnings Slides January 31, 2023
Slide 2: Forward-Looking Statements & Non-GAAP Financial Measures
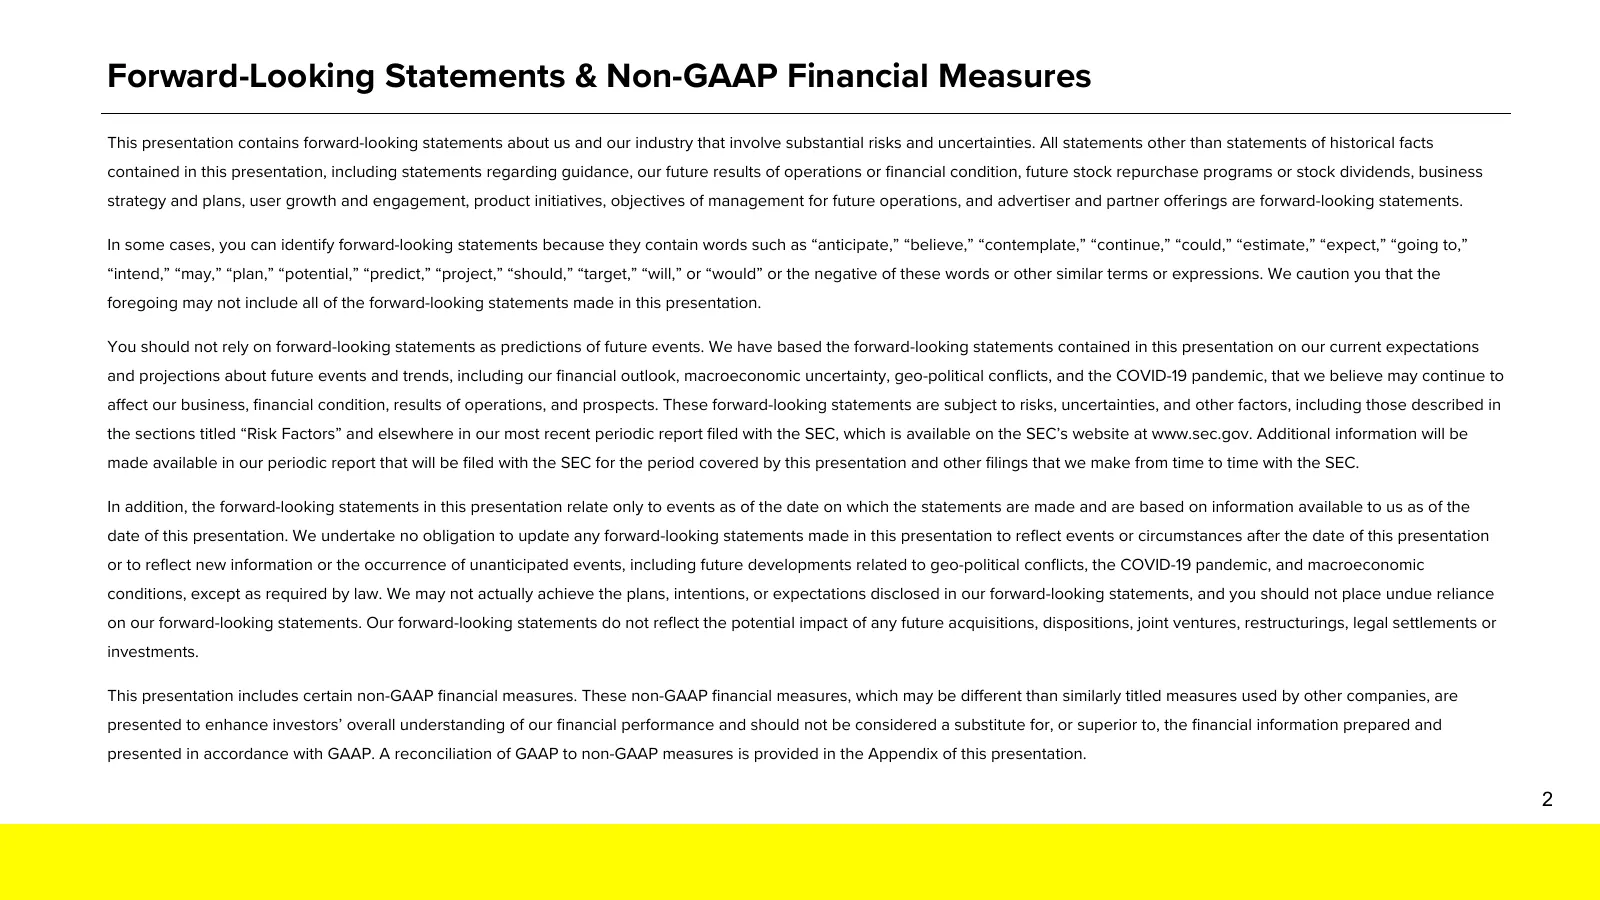
Forward-Looking Statements & Non-GAAP Financial Measures This presentation contains forward-looking statements about us and our industry that involve substantial risks and uncertainties. All statements other than statements of historical facts contained in this presentation, including statements reg
Slide 3: Fourth Quarter Financial Summary
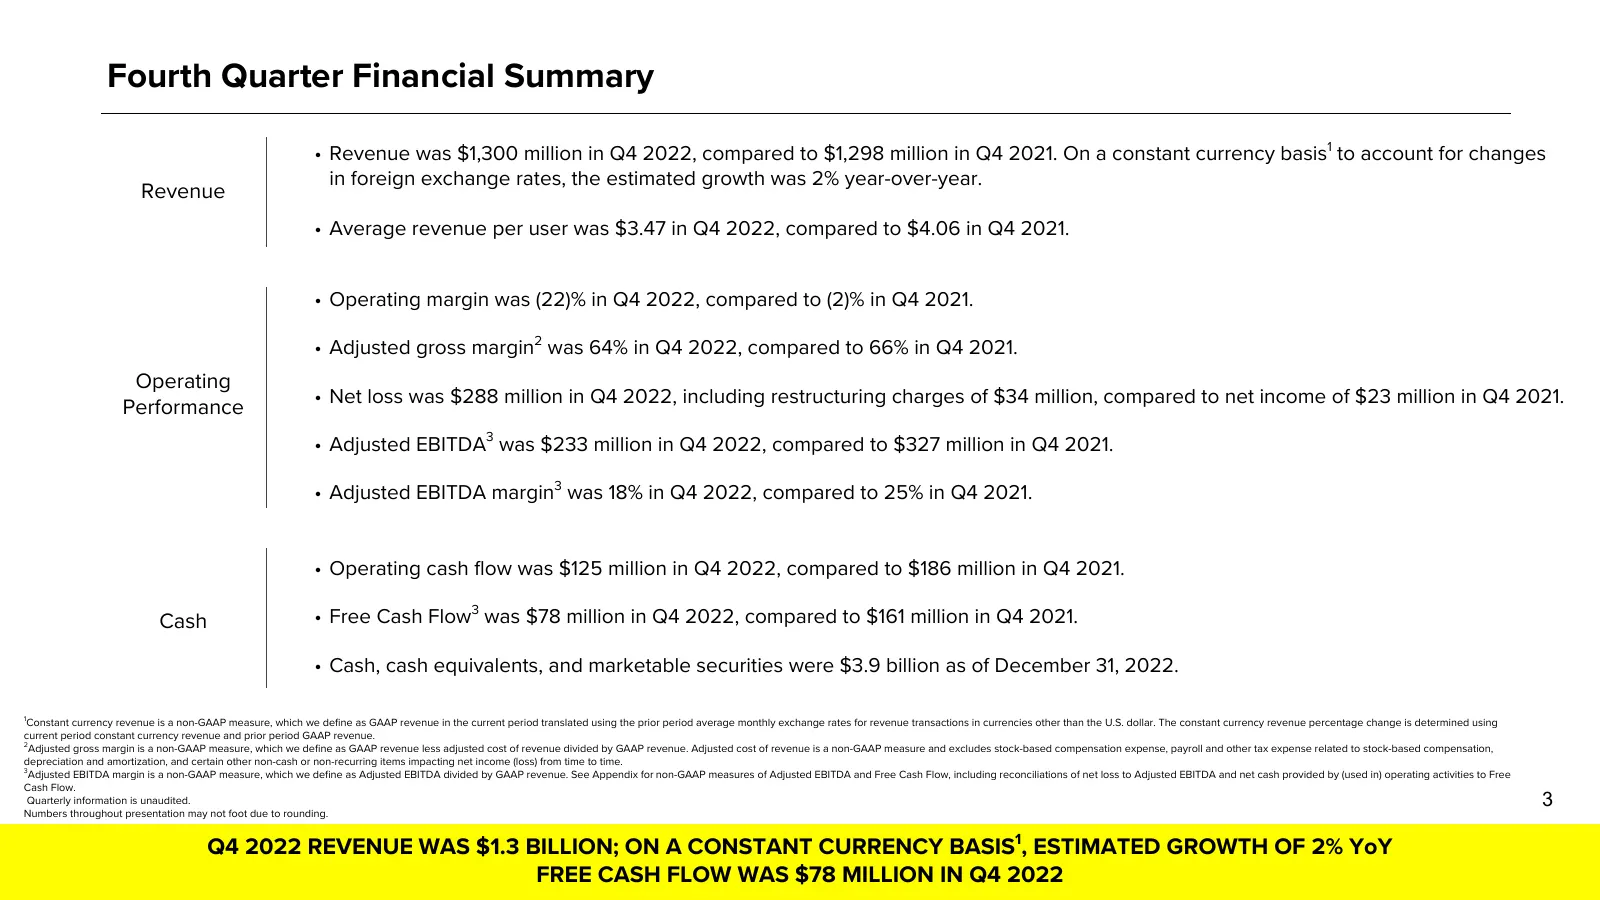
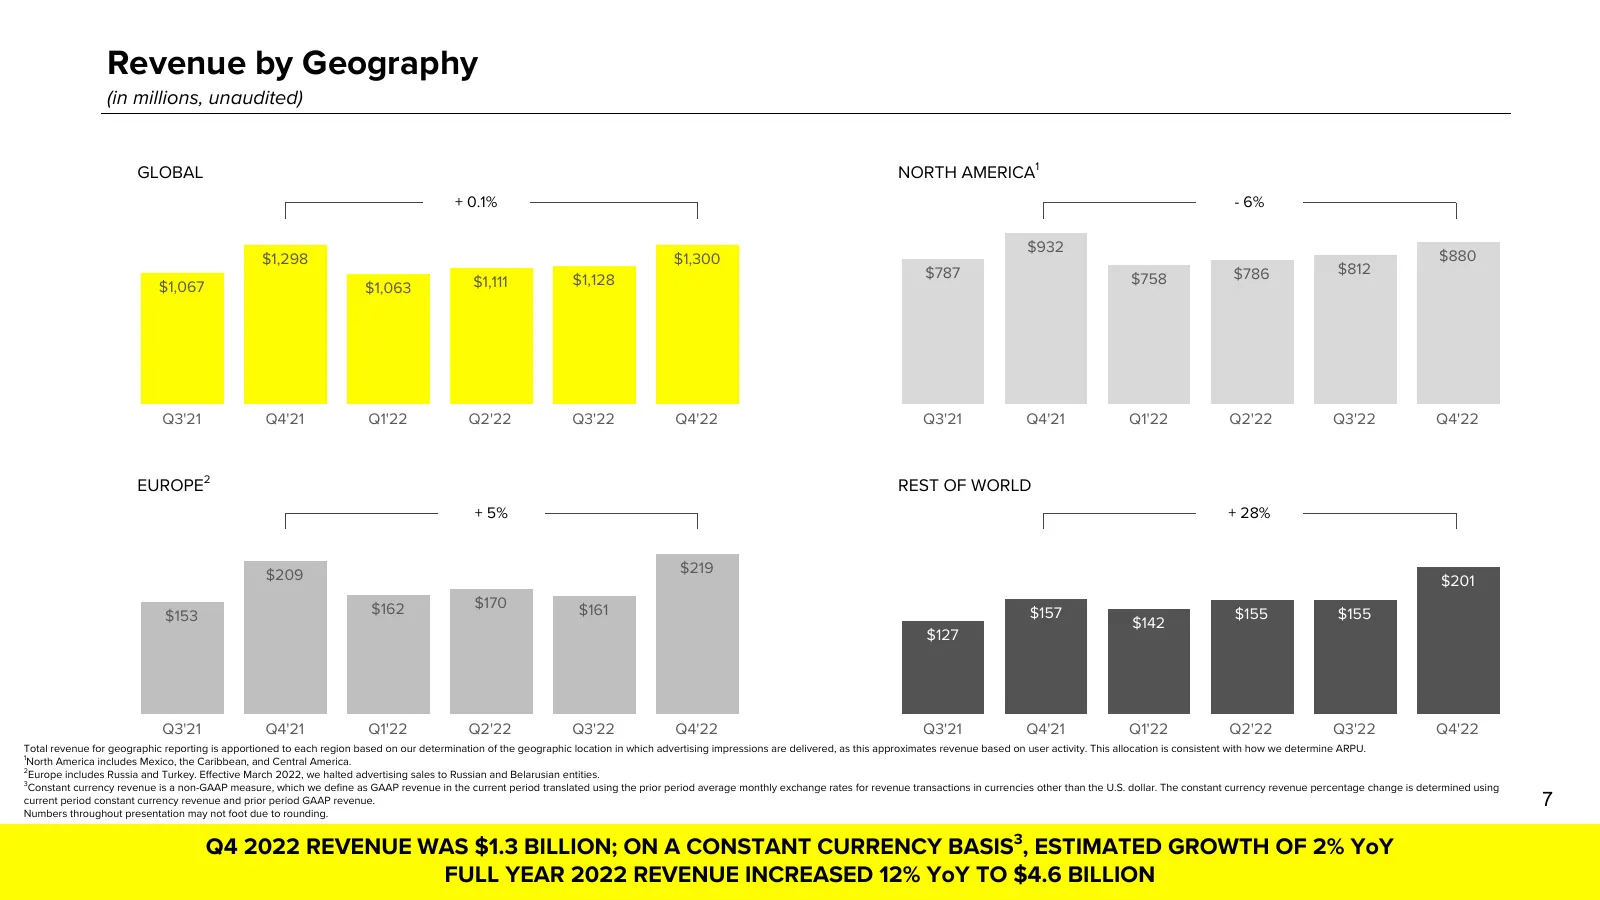
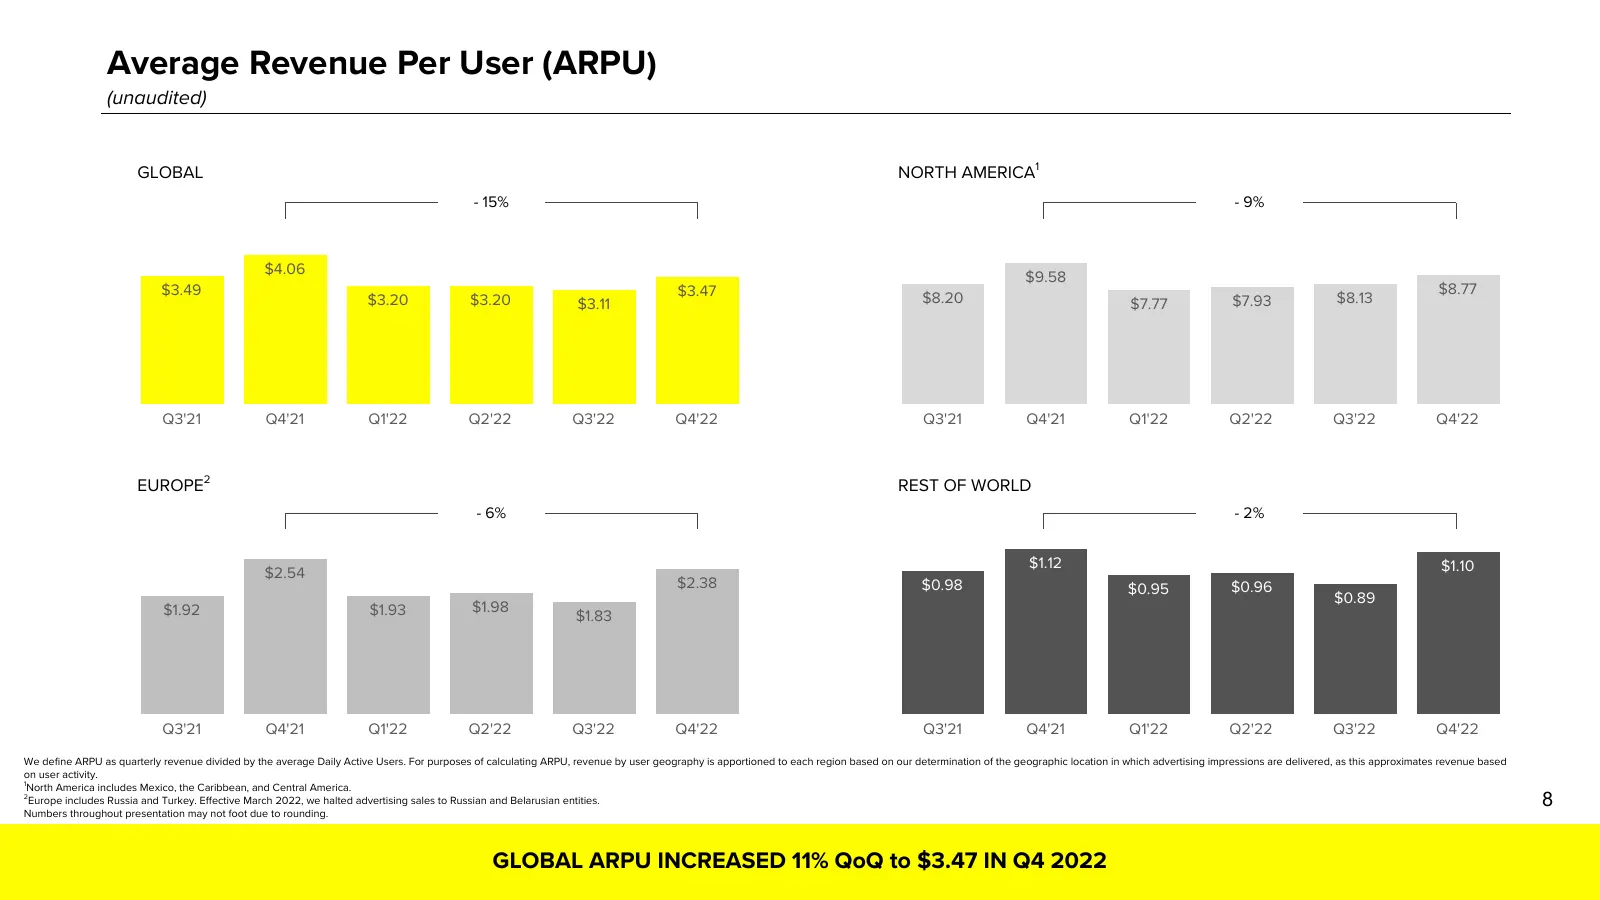
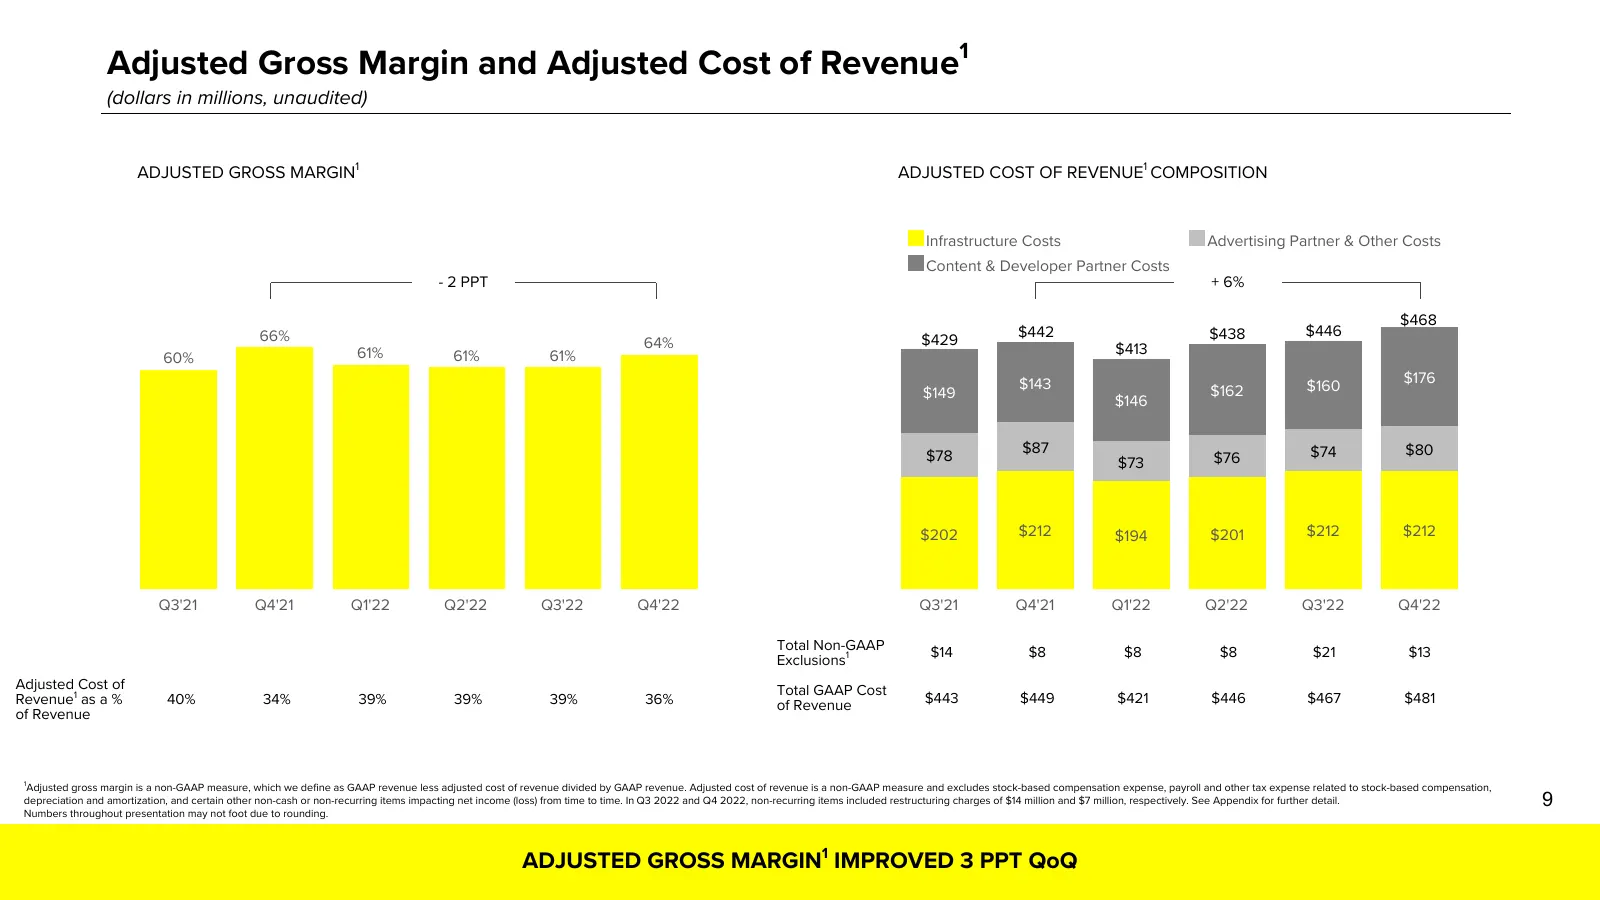
Fourth Quarter Financial Summary • Revenue was $1,300 million in Q4 2022, compared to $1,298 million in Q4 2021. On a constant currency basis1 to account for changes in foreign exchange rates, the estimated growth was 2% year-over-year. Revenue • Average revenue per user was $3.47 in Q4 2022, compar
Slide 4: Business Highlights
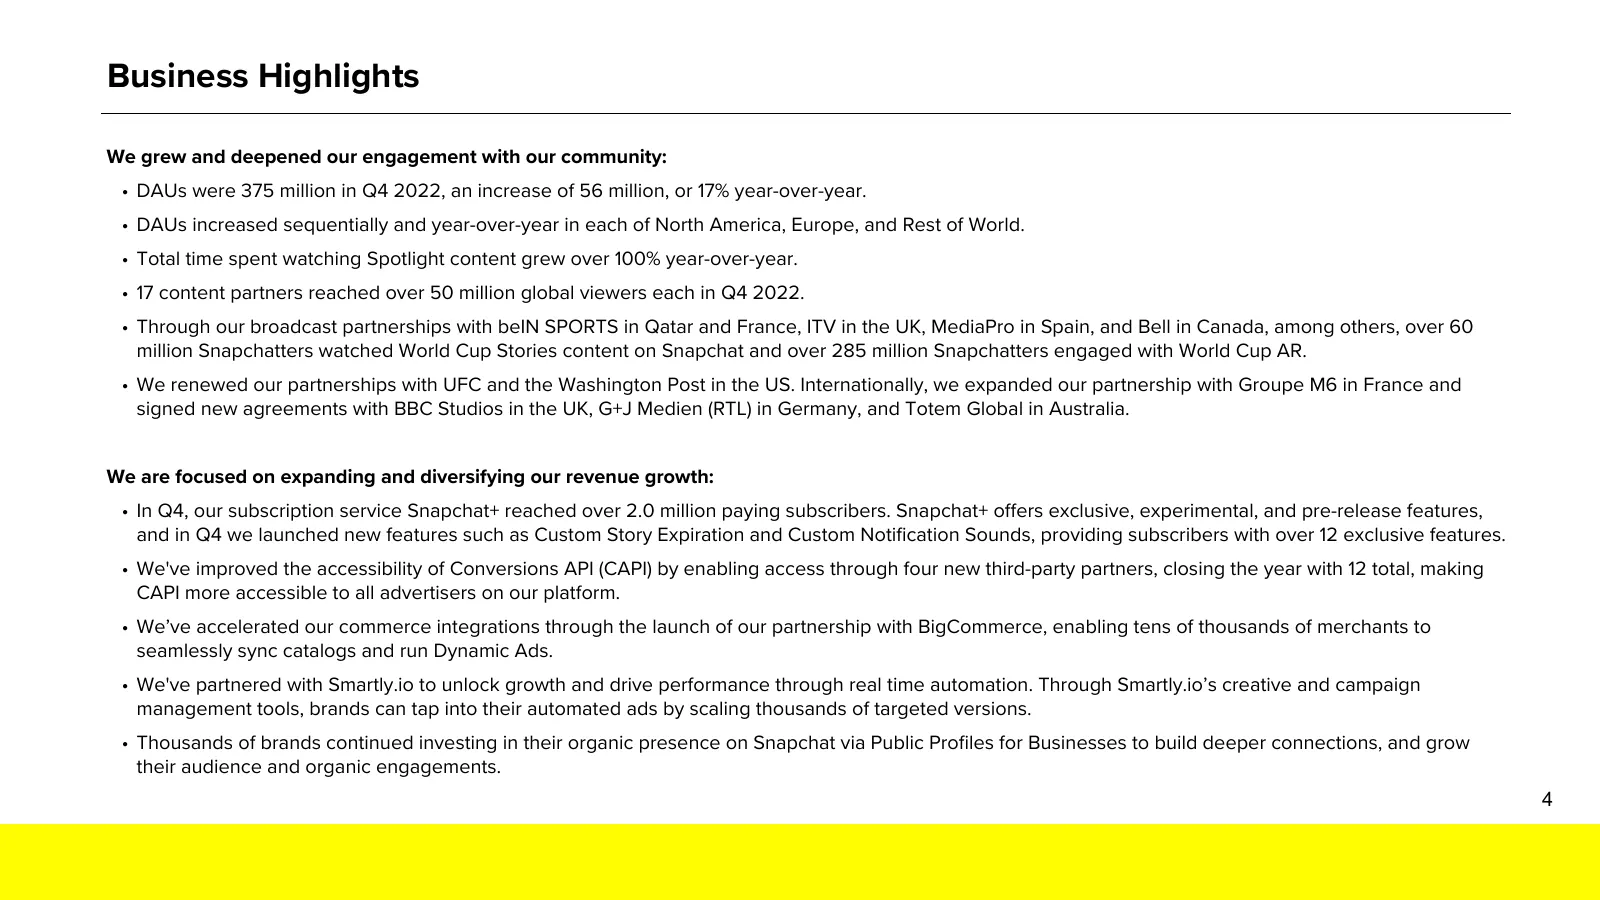
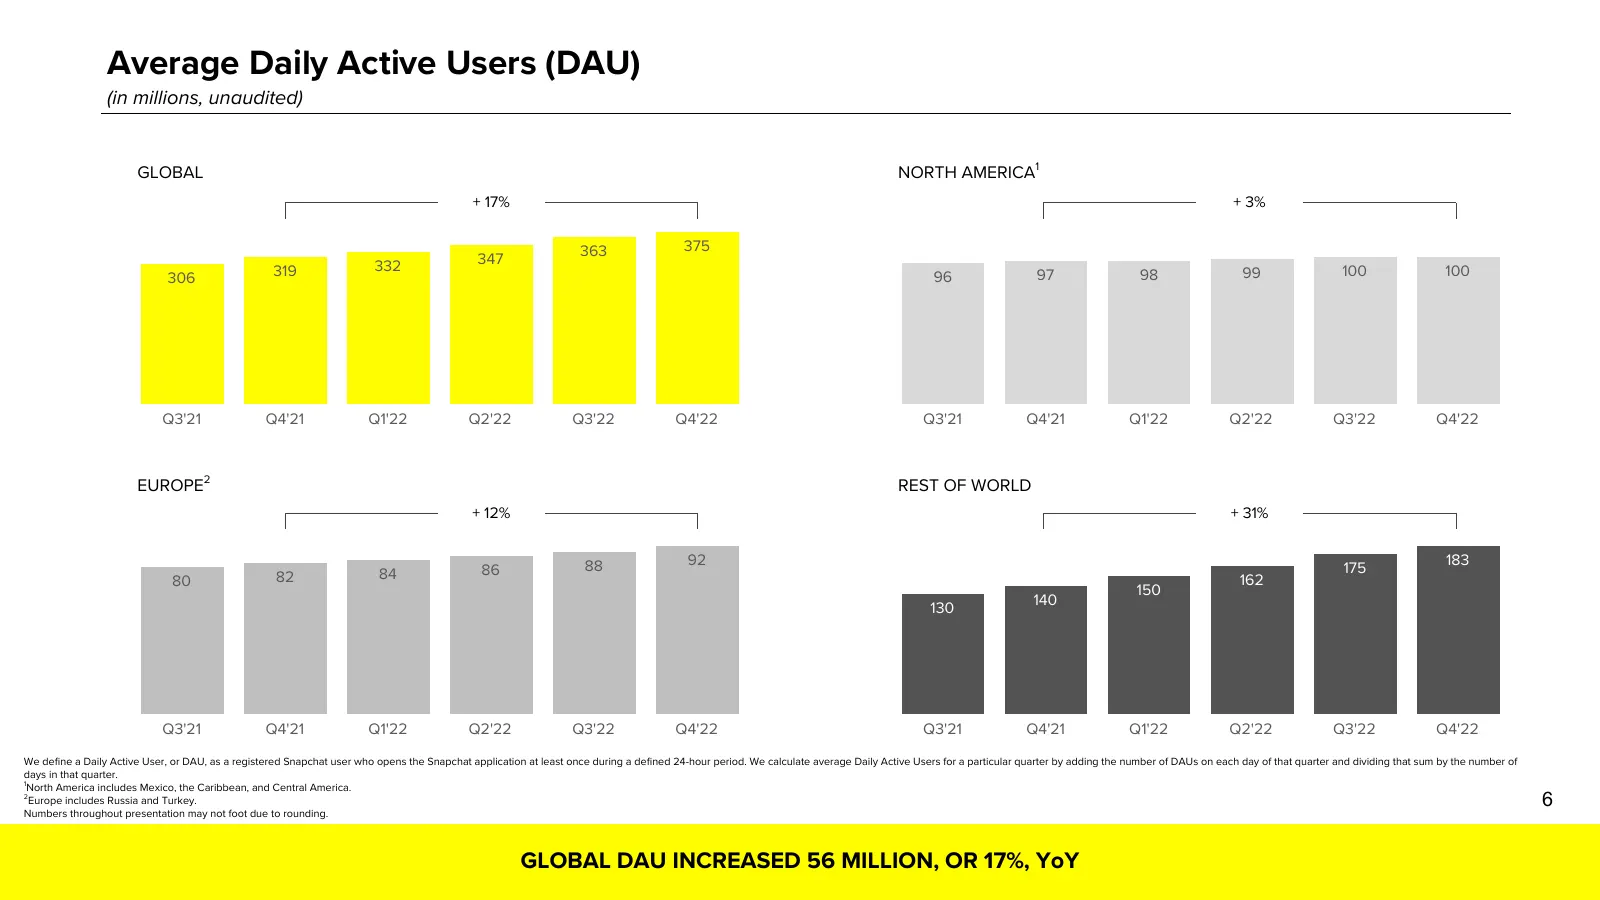
Business Highlights We grew and deepened our engagement with our community: • DAUs were 375 million in Q4 2022, an increase of 56 million, or 17% year-over-year. • DAUs increased sequentially and year-over-year in each of North America, Europe, and Rest of World. • Total time spent watching Spotligh
Slide 5: Business Highlights (Continued)
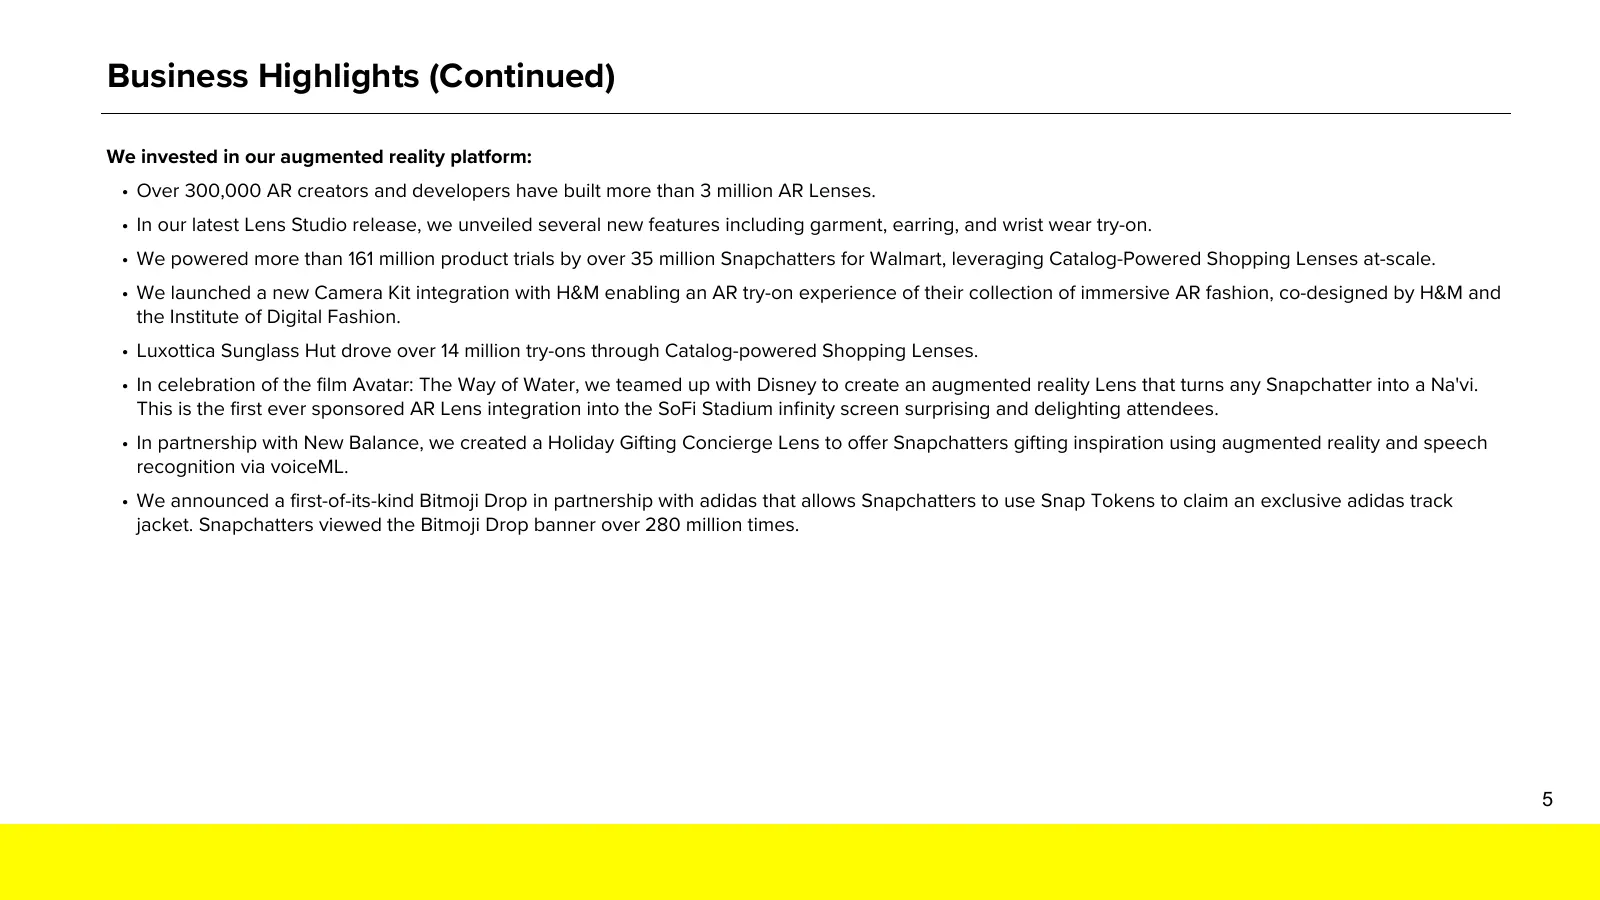
Business Highlights (Continued) We invested in our augmented reality platform: • Over 300,000 AR creators and developers have built more than 3 million AR Lenses. • In our latest Lens Studio release, we unveiled several new features including garment, earring, and wrist wear try-on. • We powered mor
Slide 6: Average Daily Active Users (DAU)
Average Daily Active Users (DAU) (in millions, unaudited) GLOBAL NORTH AMERICA1 + 17% + 3% 363 375 332 347 306 319 96 97 98 99 100 100 Q3'21 Q4'21 Q1'22 Q2'22 Q3'22 Q4'22 Q3'21 Q4'21 Q1'22 Q2'22 Q3'22 Q4'22 EUROPE2 REST OF WORLD + 12% + 31% 88 92 183 84 86 175 80 82 162 150 140 130 Q3'21 Q4'21 Q1'22
Slide 7: Revenue by Geography
Revenue by Geography (in millions, unaudited) GLOBAL NORTH AMERICA1 + 0.1% - 6% $932 $1,298 $1,300 $880 $787 $786 $812 $1,111 $1,128 $758 $1,067 $1,063 Q3'21 Q4'21 Q1'22 Q2'22 Q3'22 Q4'22 Q3'21 Q4'21 Q1'22 Q2'22 Q3'22 Q4'22 EUROPE2 REST OF WORLD + 5% + 28% $209 $219 $201 $162 $170 $161 $153 $157 $15
Slide 8: Average Revenue Per User (ARPU)
Average Revenue Per User (ARPU) (unaudited) GLOBAL NORTH AMERICA1 - 15% - 9% $4.06 $9.58 $3.49 $3.47 $8.77 $3.20 $3.20 $3.11 $8.20 $7.77 $7.93 $8.13 Q3'21 Q4'21 Q1'22 Q2'22 Q3'22 Q4'22 Q3'21 Q4'21 Q1'22 Q2'22 Q3'22 Q4'22 EUROPE2 REST OF WORLD - 6% - 2% $1.12 $1.10 $2.54 $2.38 $0.98 $0.95 $0.96 $0.89
Slide 9: Adjusted Gross Margin and Adjusted Cost of Revenue
1 Adjusted Gross Margin and Adjusted Cost of Revenue (dollars in millions, unaudited) ADJUSTED GROSS MARGIN1 ADJUSTED COST OF REVENUE1 COMPOSITION Infrastructure Costs Advertising Partner & Other Costs Content & Developer Partner Costs - 2 PPT + 6% $468 66% $442 $438 $446 64% $429 61% 61% 61% $413 6
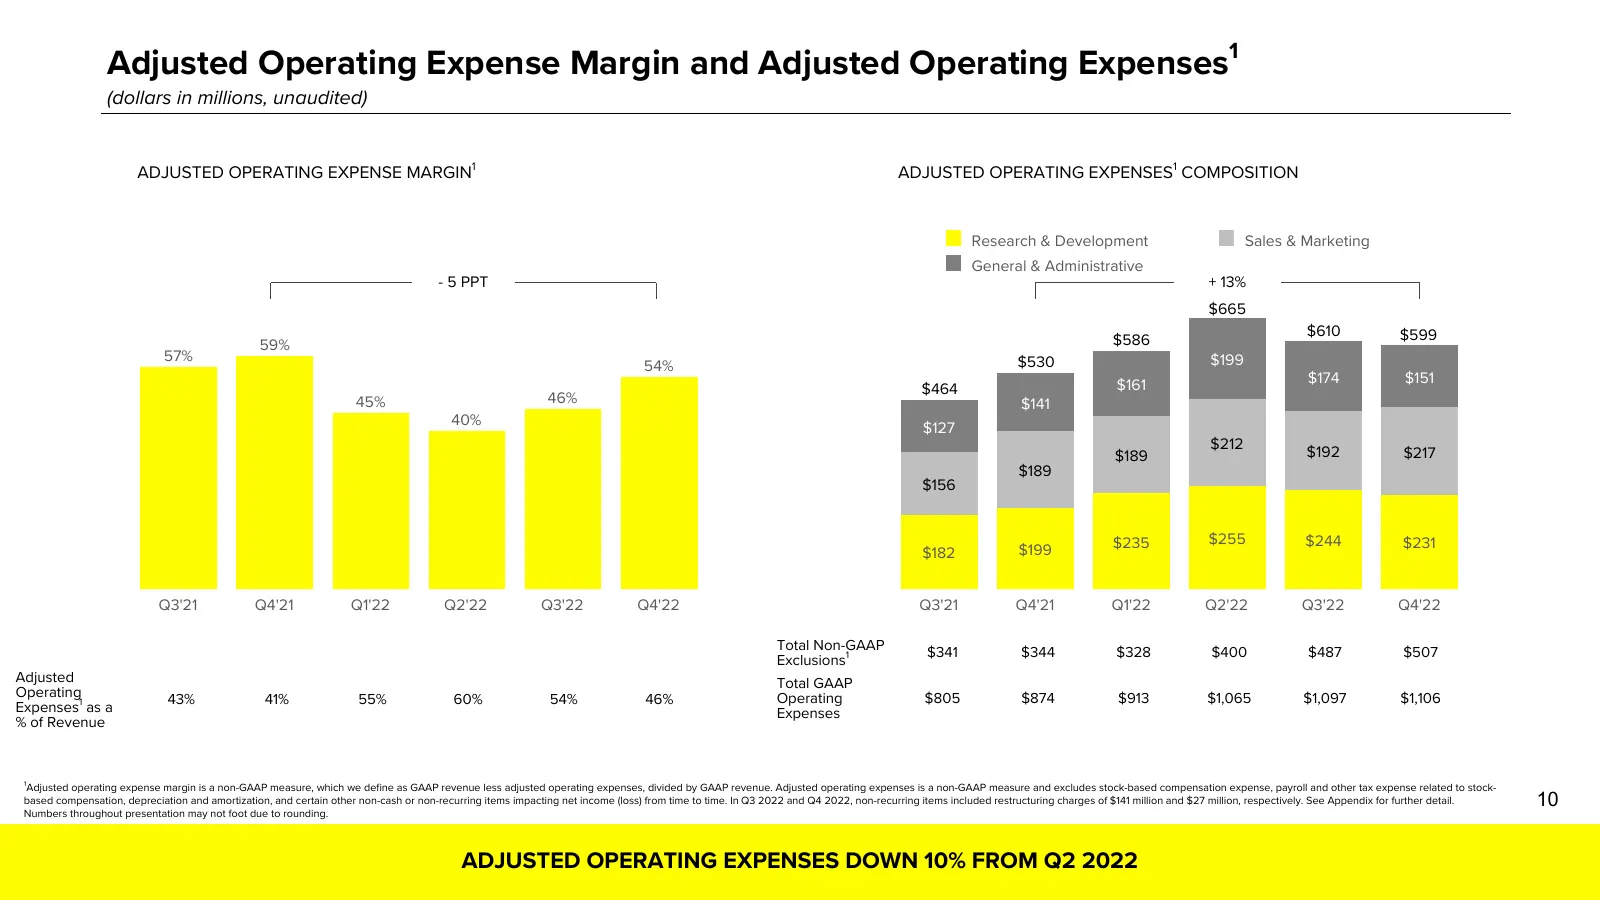
Slide 10: Adjusted Operating Expense Margin and Adjusted Operating Expenses
1 Adjusted Operating Expense Margin and Adjusted Operating Expenses (dollars in millions, unaudited) ADJUSTED OPERATING EXPENSE MARGIN1 ADJUSTED OPERATING EXPENSES1 COMPOSITION Research & Development Sales & Marketing General & Administrative - 5 PPT + 13% $665 $610 $599 59% $586 57% $530 $199 54% $
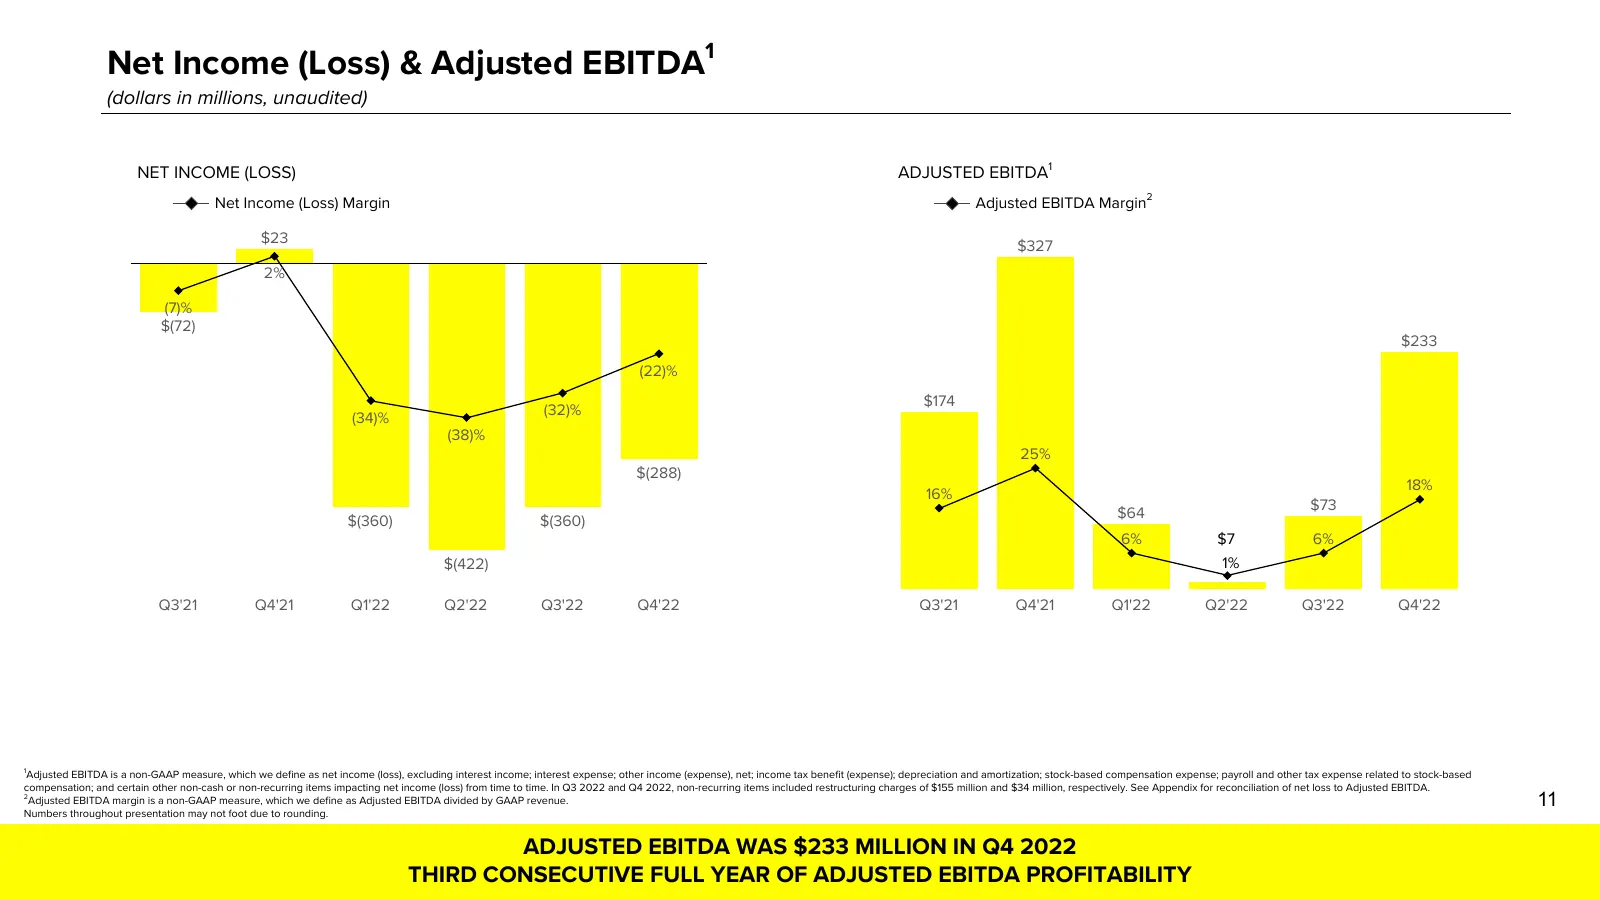
Slide 11: Net Income (Loss) & Adjusted EBITDA
1 Net Income (Loss) & Adjusted EBITDA (dollars in millions, unaudited) NET INCOME (LOSS) ADJUSTED EBITDA1 Net Income (Loss) Margin Adjusted EBITDA Margin2 $23 $327 2% (7)% $(72) $233 (22)% $174 (34)% (32)% (38)% 25% $(288) 18% 16% $73 $64 $(360) $(360) 6% $7 6% $(422) 1% Q3'21 Q4'21 Q1'22 Q2'22 Q3'2
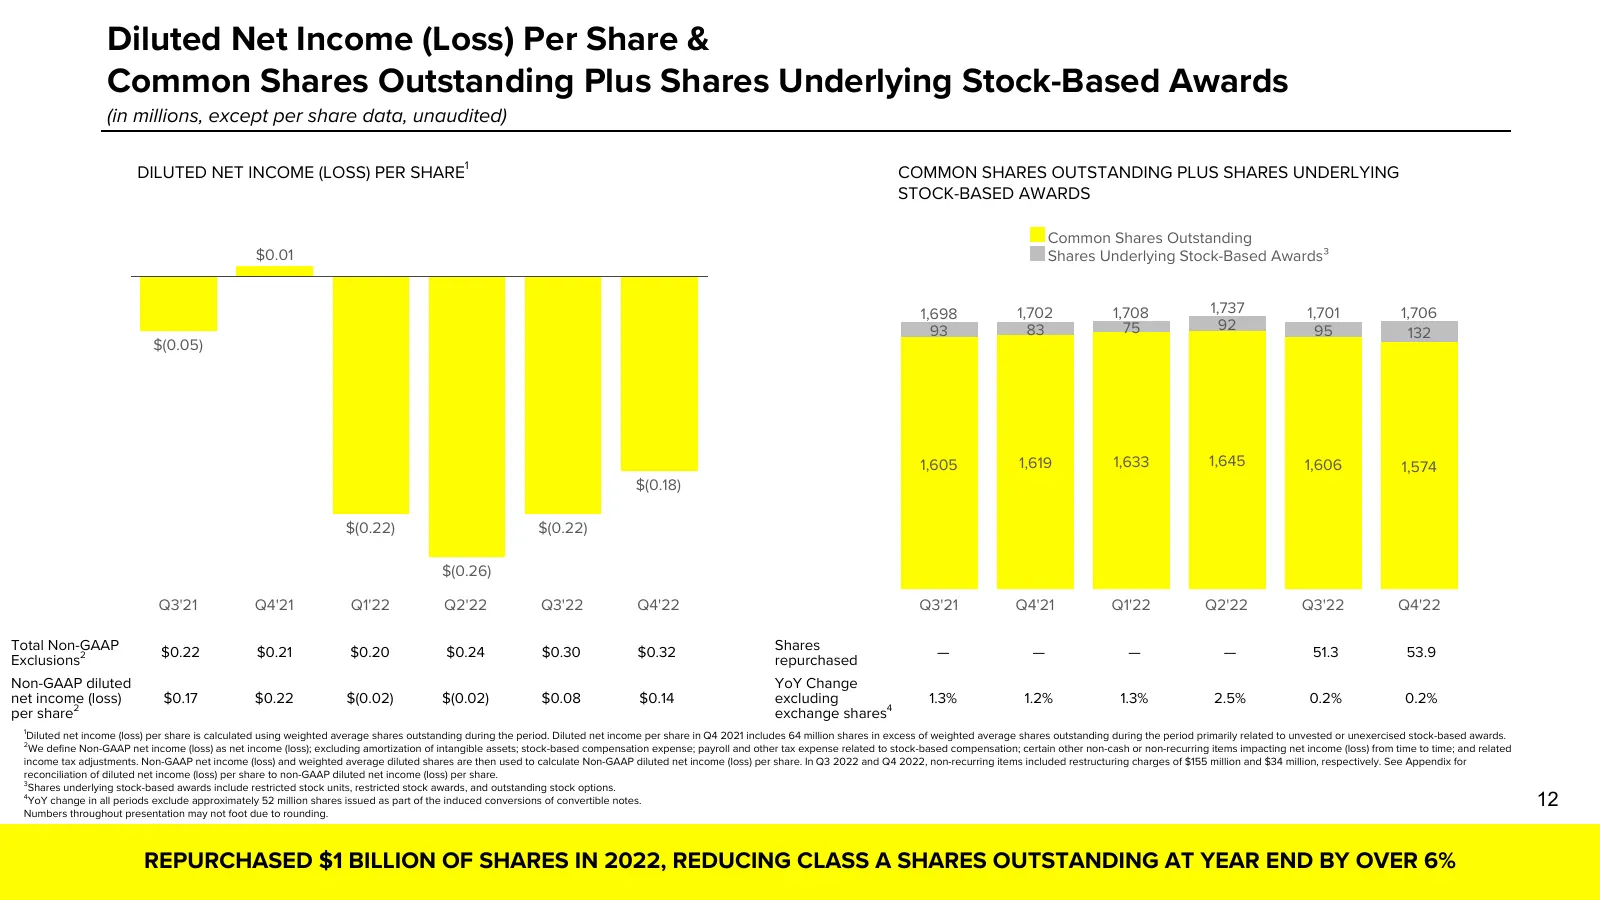
Slide 12: Diluted Net Income (Loss) Per Share & Common Shares Outstanding
Diluted Net Income (Loss) Per Share & Common Shares Outstanding Plus Shares Underlying Stock-Based Awards (in millions, except per share data, unaudited) DILUTED NET INCOME (LOSS) PER SHARE1 COMMON SHARES OUTSTANDING PLUS SHARES UNDERLYING STOCK-BASED AWARDS Common Shares Outstanding $0.01 Shares Un
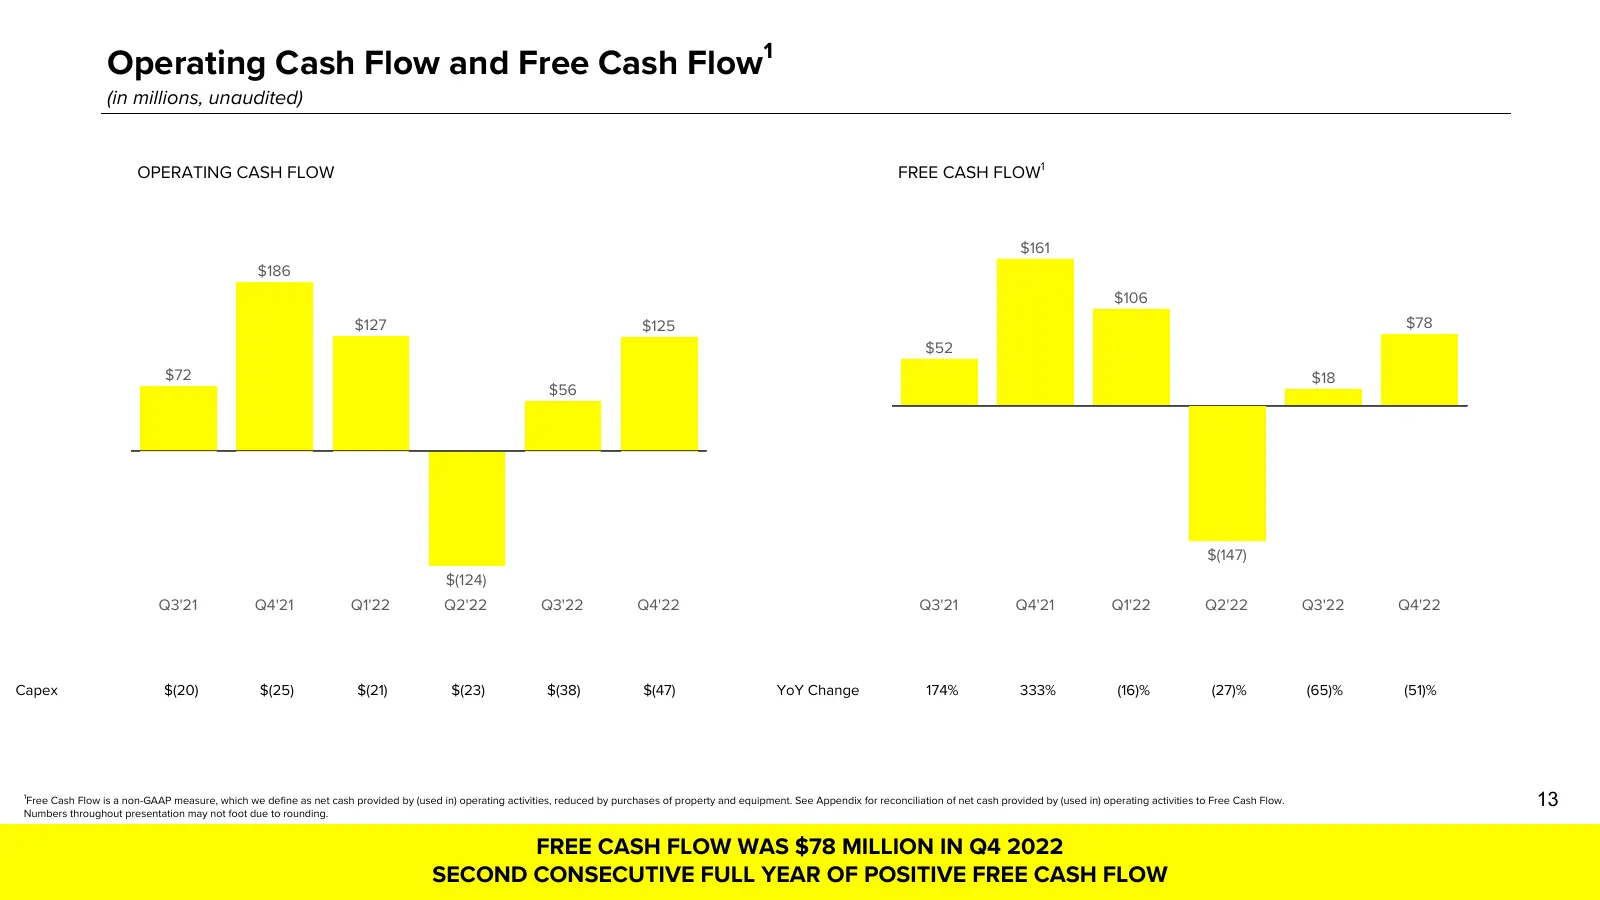
Slide 13: Operating Cash Flow and Free Cash Flow
1 Operating Cash Flow and Free Cash Flow (in millions, unaudited) OPERATING CASH FLOW FREE CASH FLOW1 $161 $186 $106 $127 $125 $78 $52 $72 $18 $56 $(147) $(124) Q3'21 Q4'21 Q1'22 Q2'22 Q3'22 Q4'22 Q3'21 Q4'21 Q1'22 Q2'22 Q3'22 Q4'22 Capex $(20) $(25) $(21) $(23) $(38) $(47) YoY Change 174% 333% (16)

Slide 14: Full Year Summary
Full Year Summary
Slide 15: Full Year Financial Summary
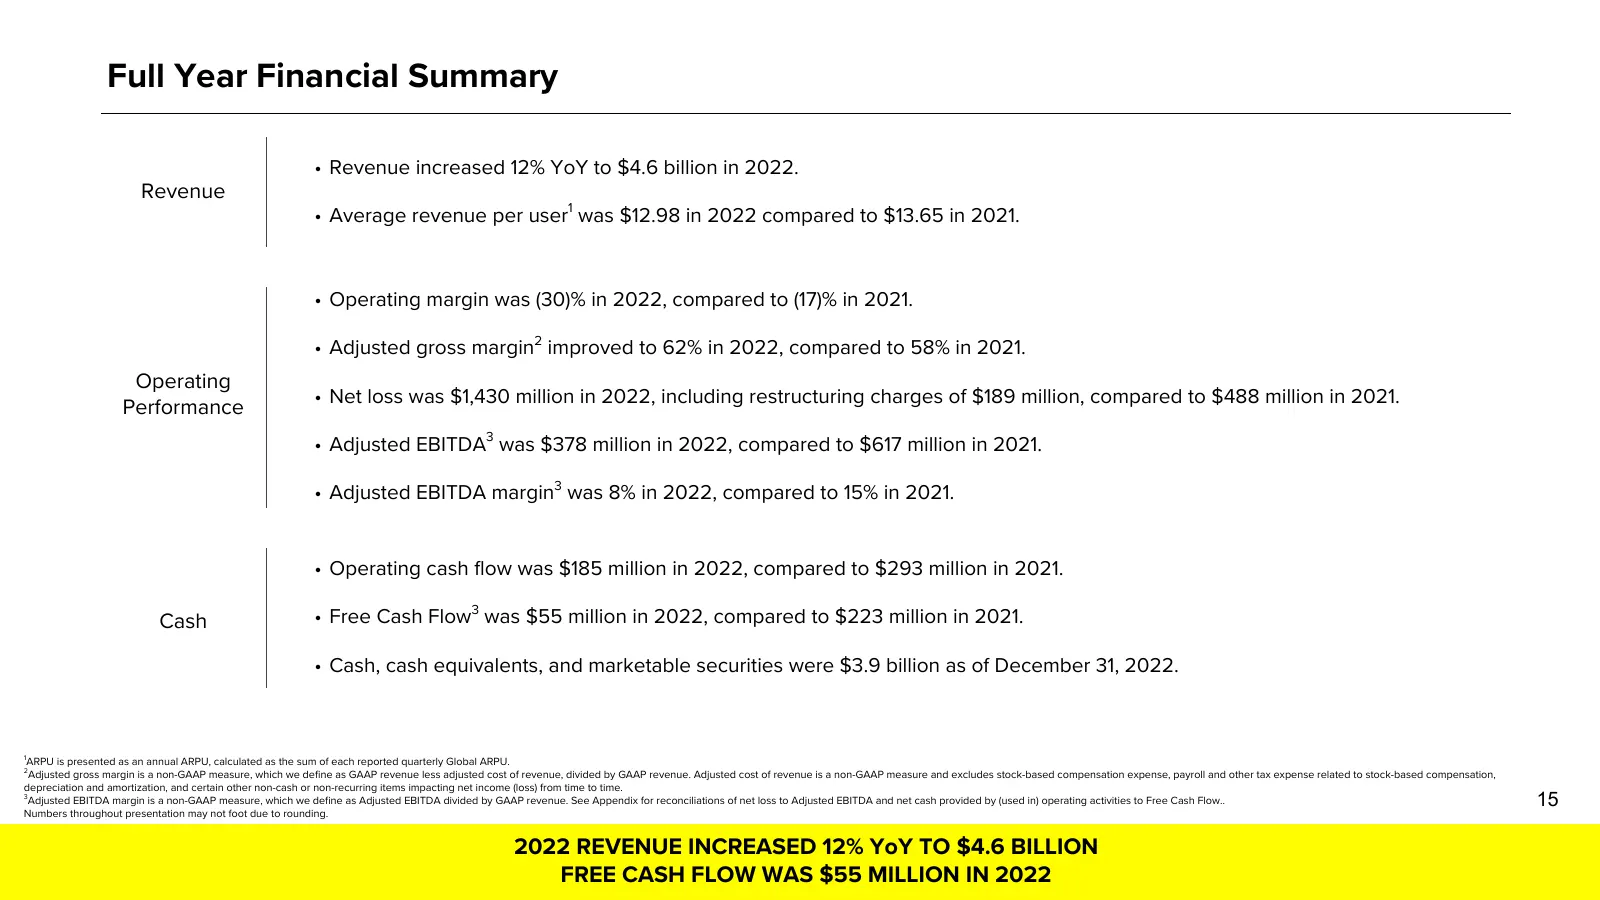
Full Year Financial Summary • Revenue increased 12% YoY to $4.6 billion in 2022. Revenue • Average revenue per user1 was $12.98 in 2022 compared to $13.65 in 2021. • Operating margin was (30)% in 2022, compared to (17)% in 2021. • Adjusted gross margin2 improved to 62% in 2022, compared to 58% in 20
Slide 16: Revenue and Average Daily Active Users (DAU)
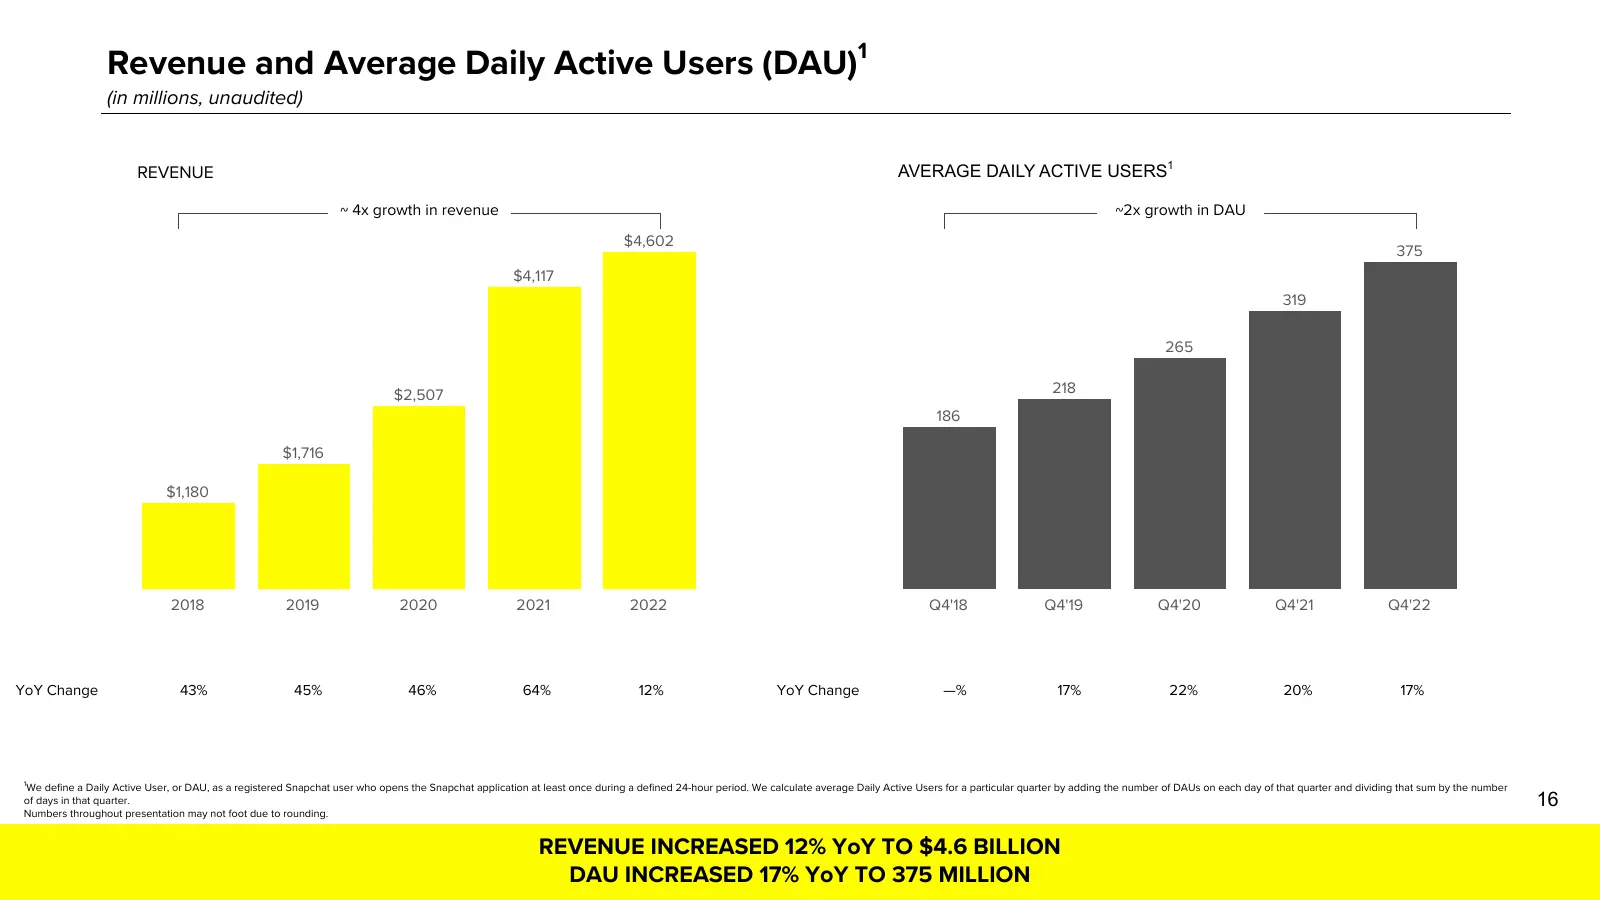
1 Revenue and Average Daily Active Users (DAU) (in millions, unaudited) REVENUE AVERAGE DAILY ACTIVE USERS1 ~ 4x growth in revenue ~2x growth in DAU $4,602 375 $4,117 319 265 $2,507 218 186 $1,716 $1,180 2018 2019 2020 2021 2022 Q4'18 Q4'19 Q4'20 Q4'21 Q4'22 YoY Change 43% 45% 46% 64% 12% YoY Change
Slide 17: Adjusted Gross Margin and Adjusted Gross Profit
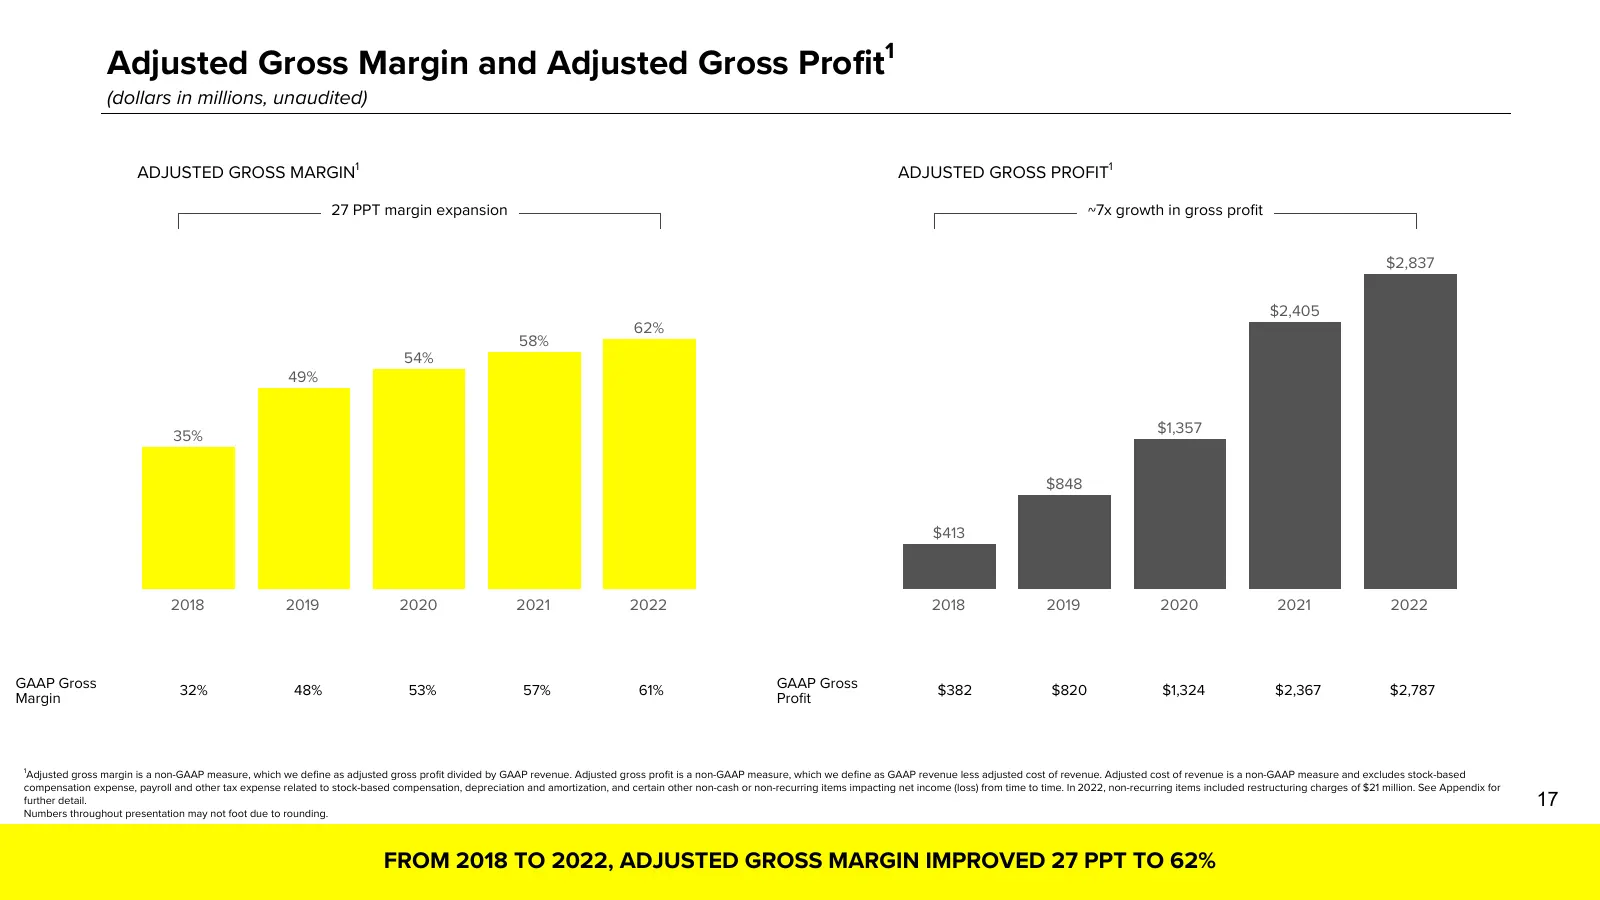
1 Adjusted Gross Margin and Adjusted Gross Profit (dollars in millions, unaudited) ADJUSTED GROSS MARGIN1 ADJUSTED GROSS PROFIT1 27 PPT margin expansion ~7x growth in gross profit $2,837 $2,405 62% 58% 54% 49% $1,357 35% $848 $413 2018 2019 2020 2021 2022 2018 2019 2020 2021 2022 GAAP Gross GAAP Gro
Slide 18: Net Loss & Adjusted EBITDA
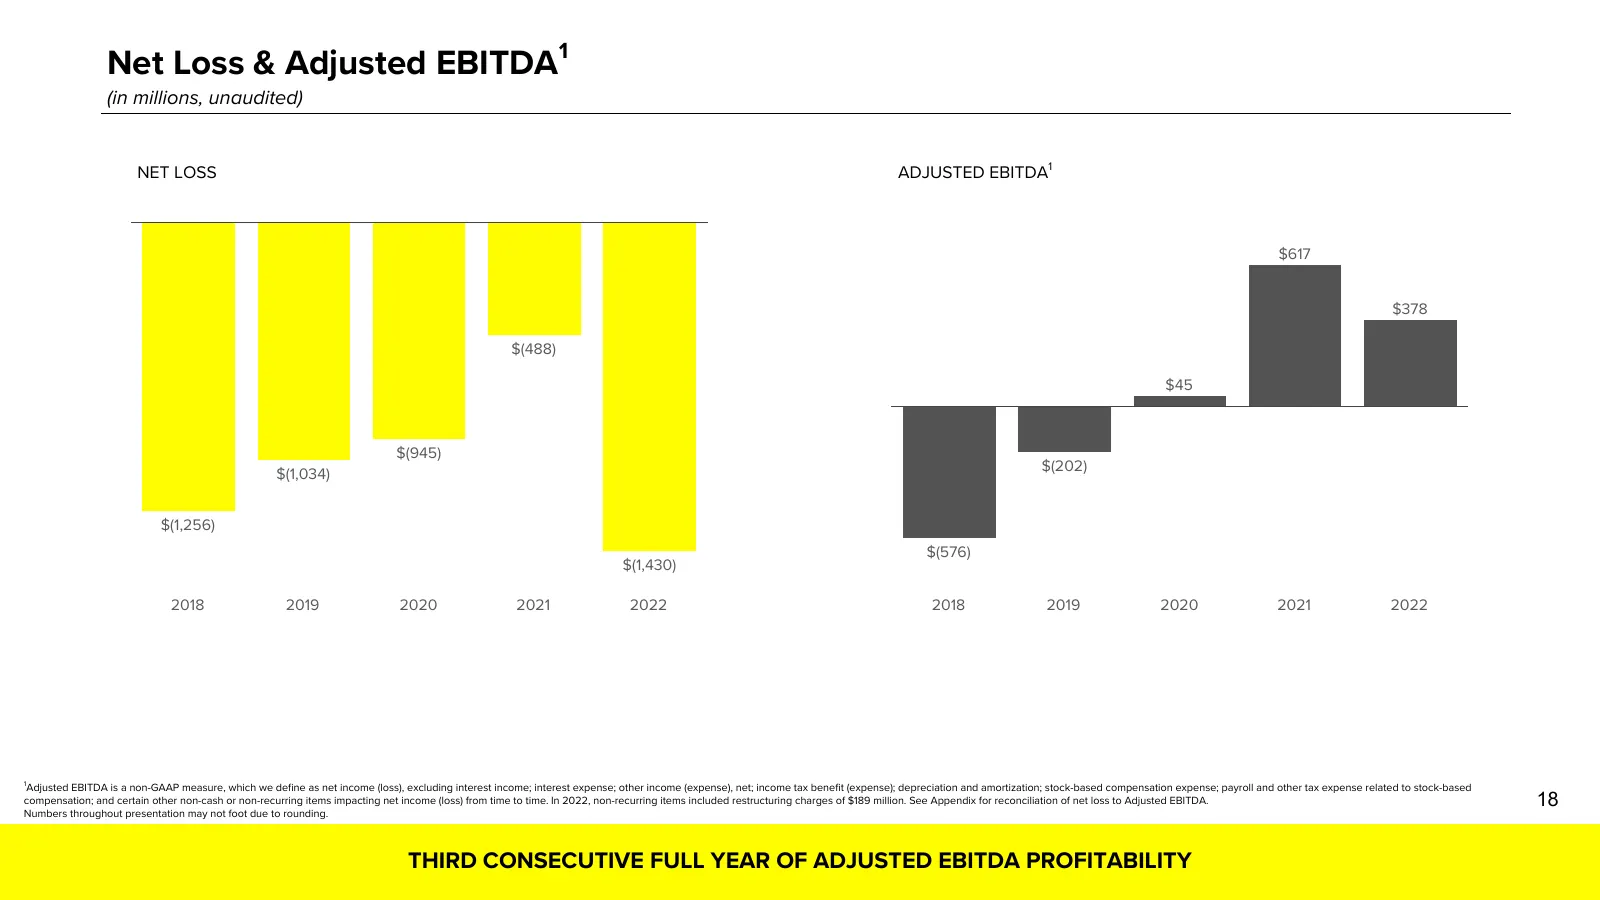
1 Net Loss & Adjusted EBITDA (in millions, unaudited) NET LOSS ADJUSTED EBITDA1 $617 $378 $(488) $45 $(945) $(1,034) $(202) $(1,256) $(576) $(1,430) 2018 2019 2020 2021 2022 2018 2019 2020 2021 2022 1 Adjusted EBITDA is a non-GAAP measure, which we define as net income (loss), excluding interest inc
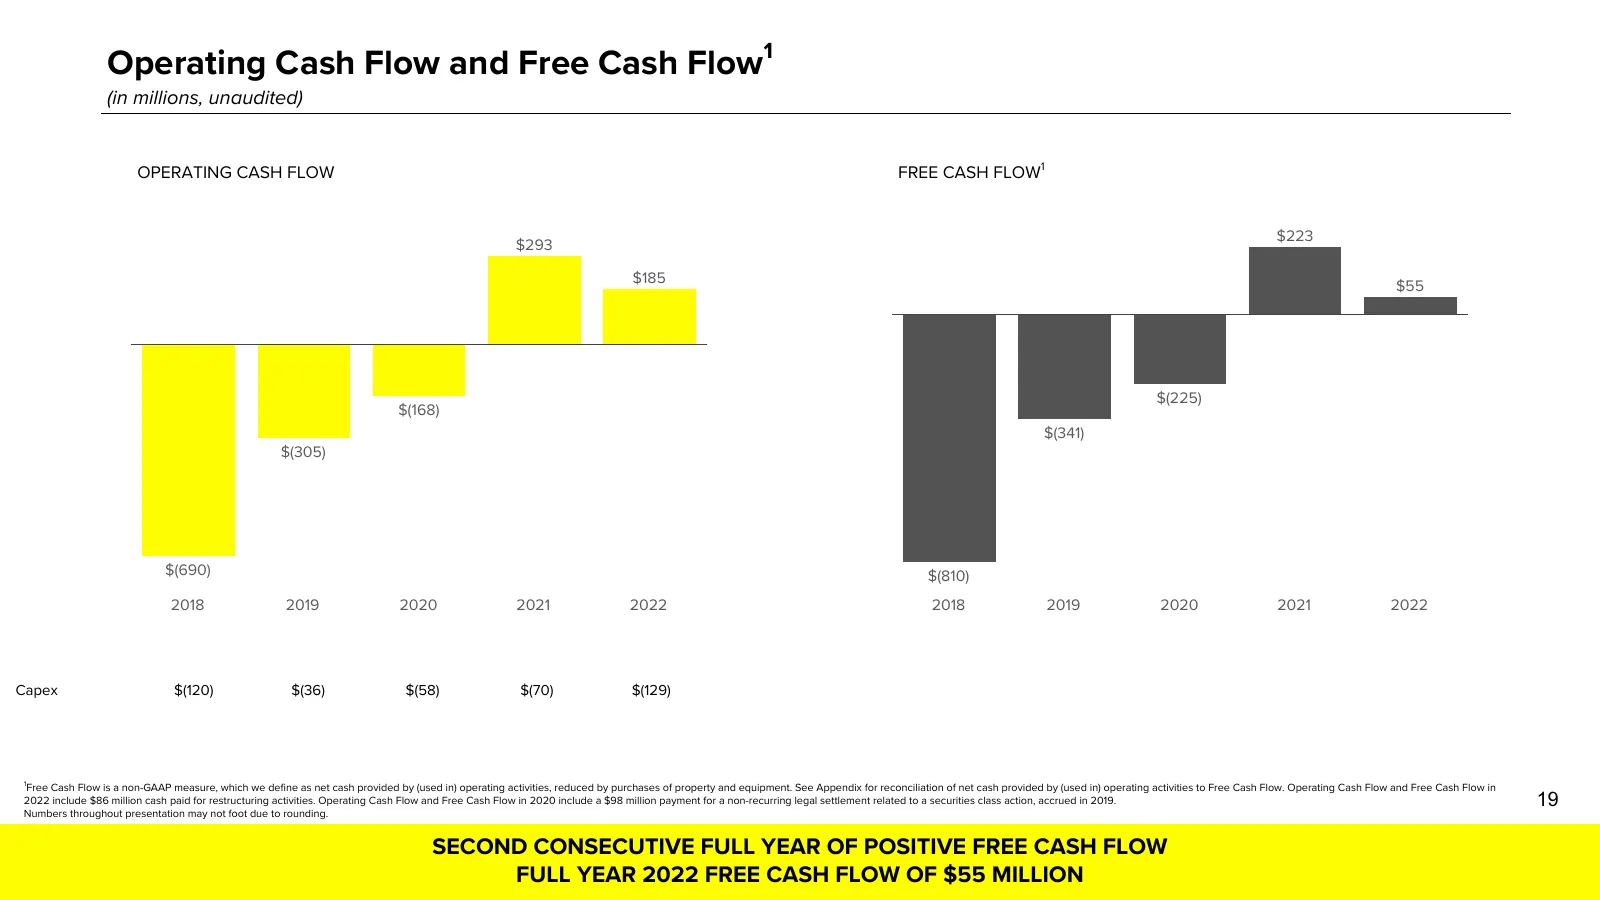
Slide 19: Operating Cash Flow and Free Cash Flow
1 Operating Cash Flow and Free Cash Flow (in millions, unaudited) OPERATING CASH FLOW FREE CASH FLOW1 $223 $293 $185 $55 $(225) $(168) $(341) $(305) $(690) $(810) 2018 2019 2020 2021 2022 2018 2019 2020 2021 2022 Capex $(120) $(36) $(58) $(70) $(129) 1 Free Cash Flow is a non-GAAP measure, which we
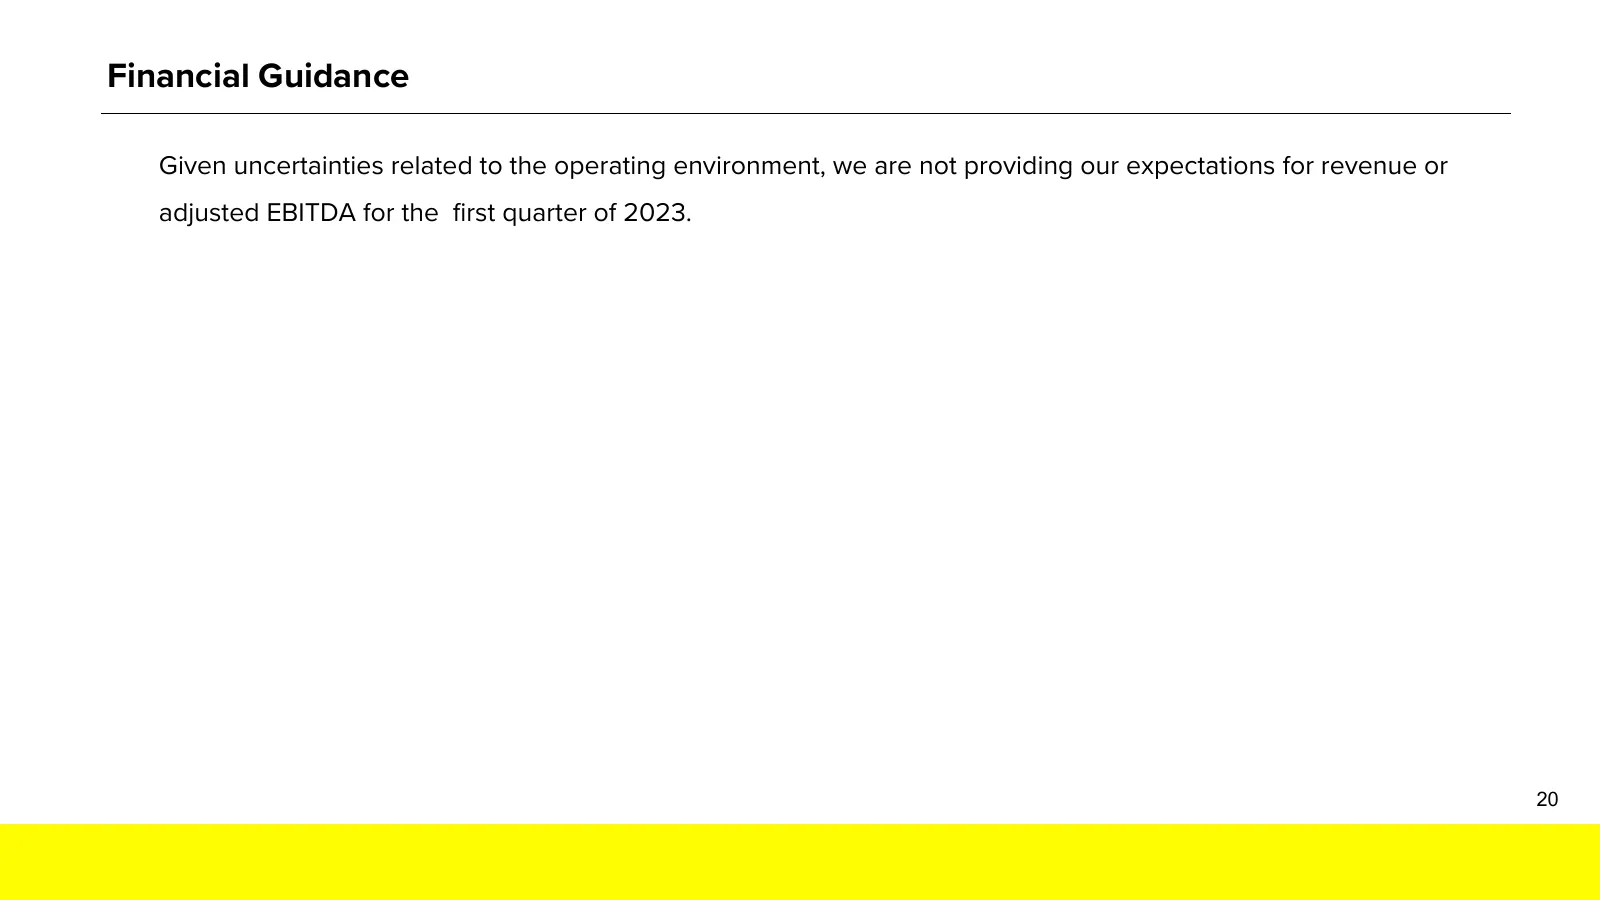
Slide 20: Financial Guidance
Financial Guidance Given uncertainties related to the operating environment, we are not providing our expectations for revenue or adjusted EBITDA for the first quarter of 2023. 20

Slide 21: Appendix
Appendix
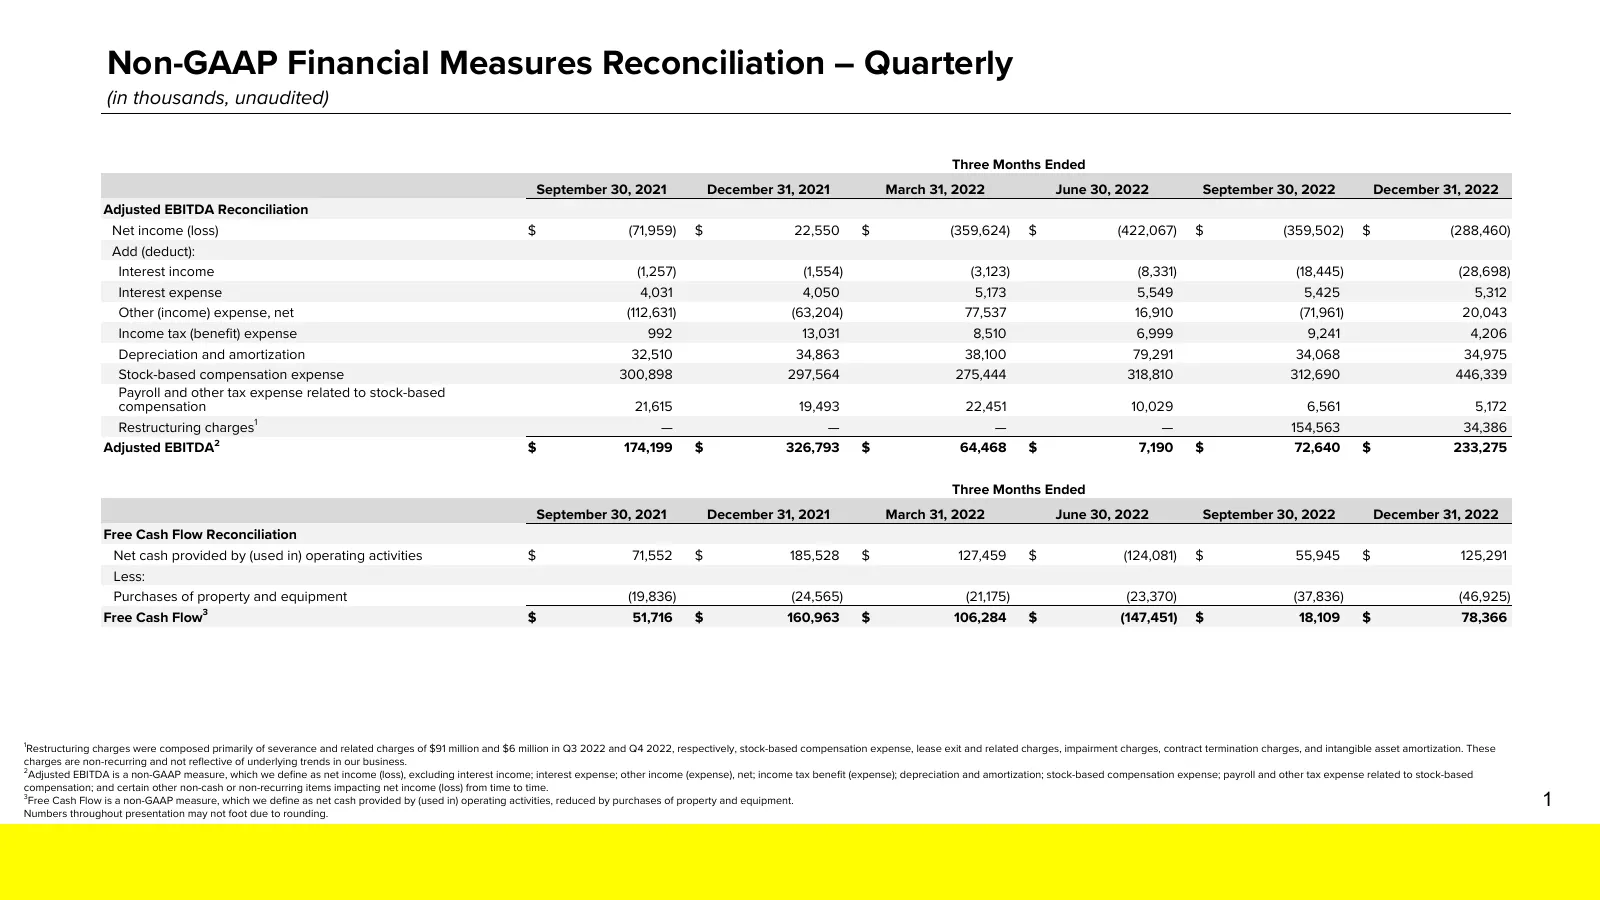
Slide 22: Non-GAAP Financial Measures Reconciliation – Quarterly
Non-GAAP Financial Measures Reconciliation – Quarterly (in thousands, unaudited) Three Months Ended September 30, 2021 December 31, 2021 March 31, 2022 June 30, 2022 September 30, 2022 December 31, 2022 Adjusted EBITDA Reconciliation Net income (loss) $ (71,959) $ 22,550 $ (359,624) $ (422,067) $ (3
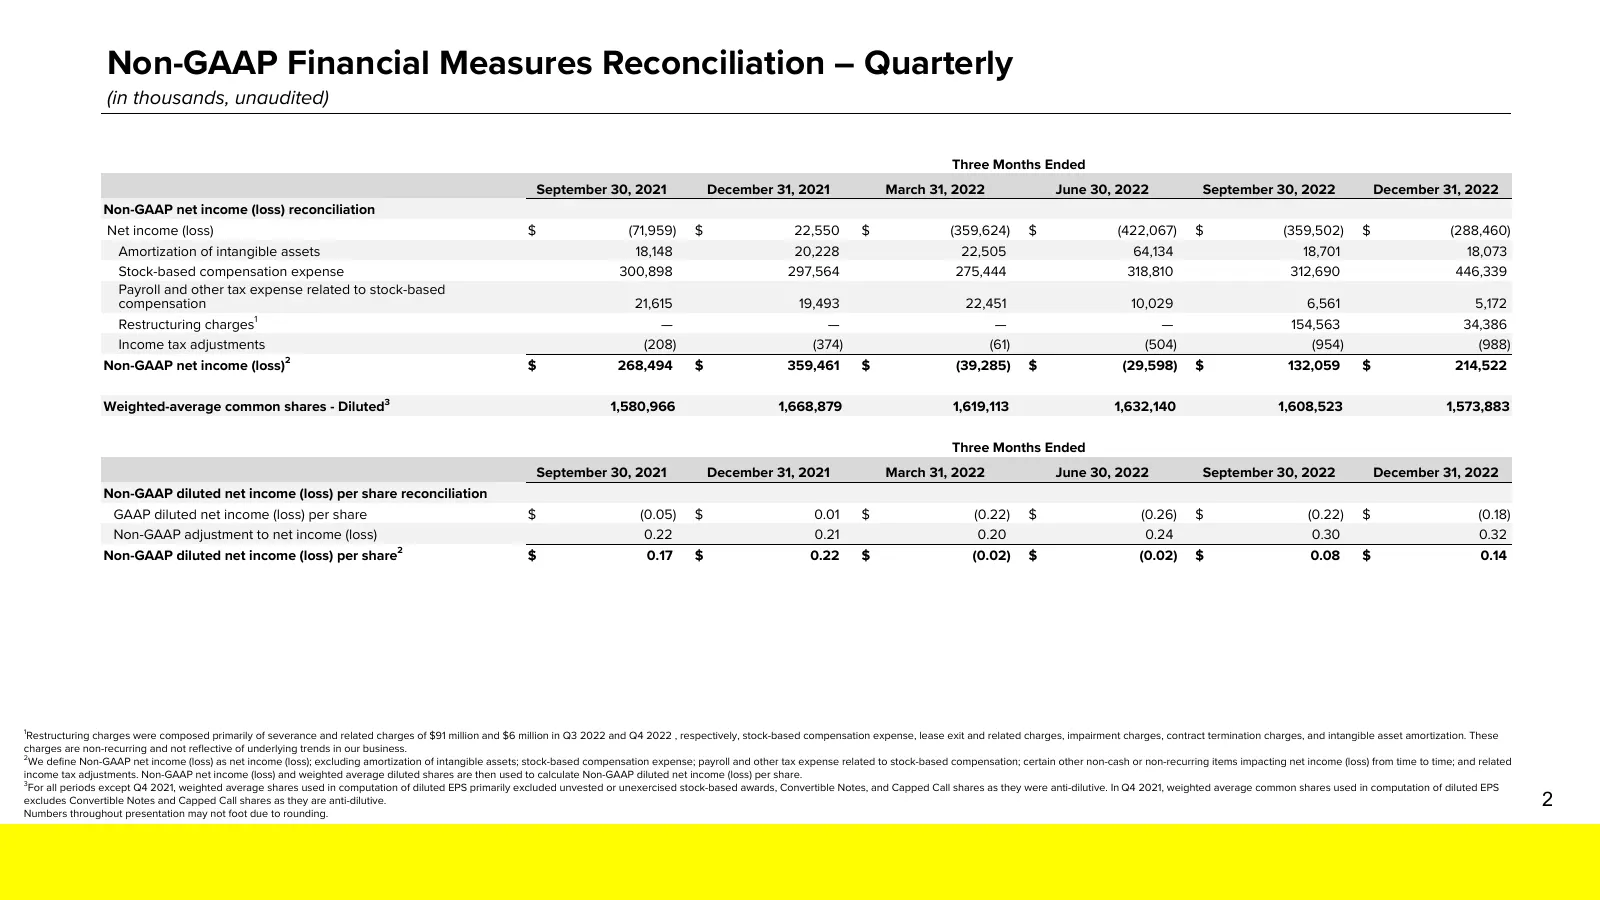
Slide 23: Non-GAAP Financial Measures Reconciliation – Quarterly
Non-GAAP Financial Measures Reconciliation – Quarterly (in thousands, unaudited) Three Months Ended September 30, 2021 December 31, 2021 March 31, 2022 June 30, 2022 September 30, 2022 December 31, 2022 Non-GAAP net income (loss) reconciliation Net income (loss) $ (71,959) $ 22,550 $ (359,624) $ (42
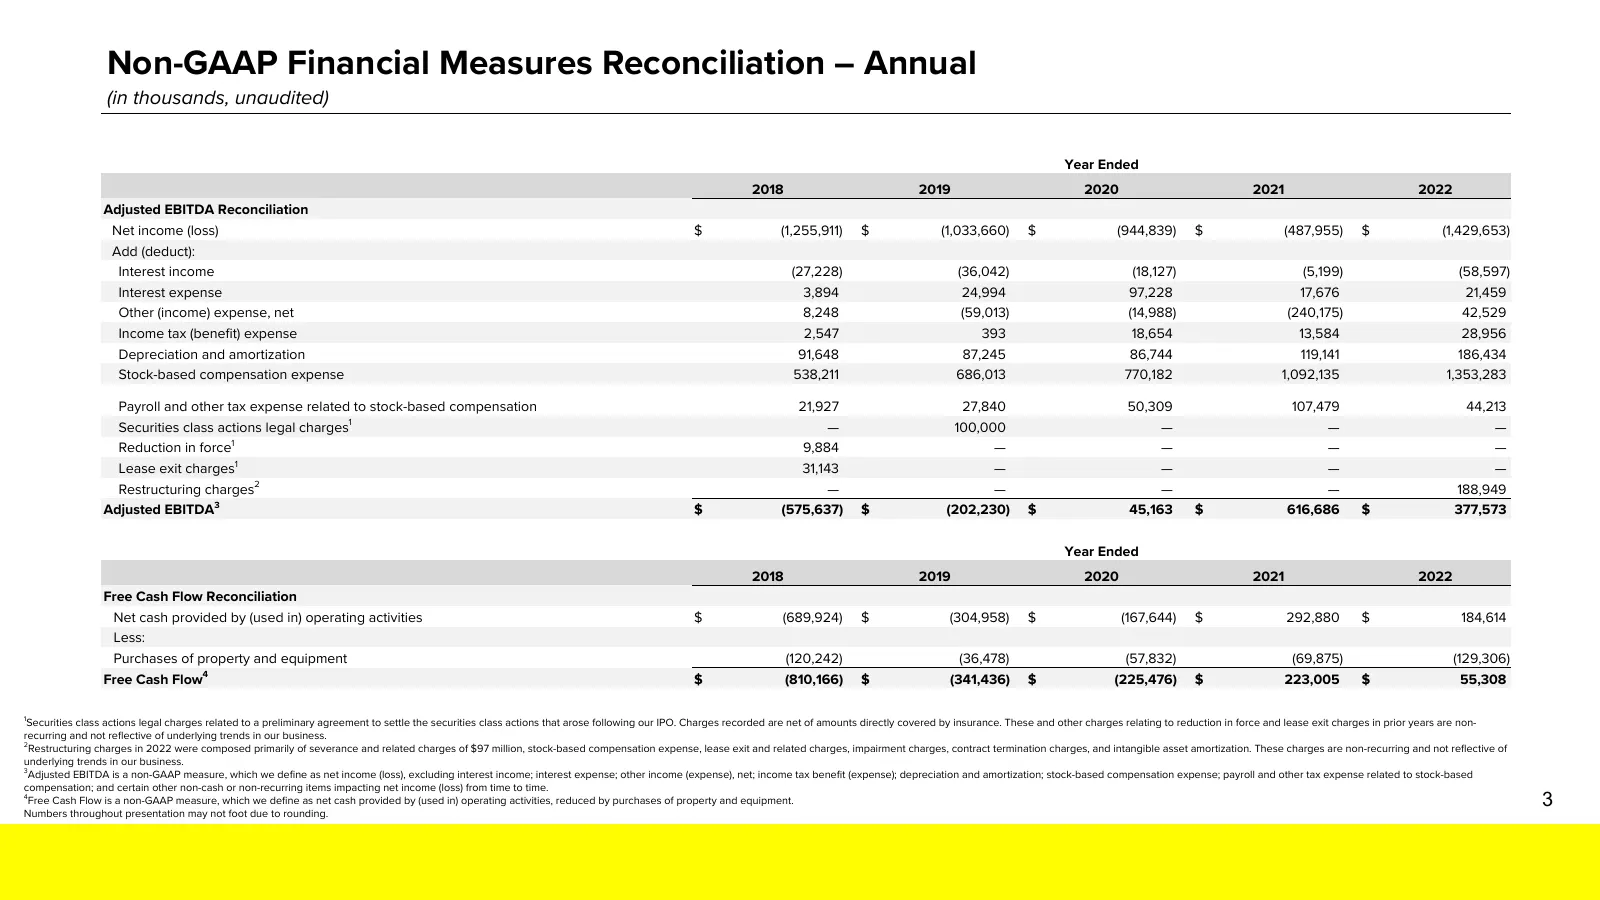
Slide 24: Non-GAAP Financial Measures Reconciliation – Annual
Non-GAAP Financial Measures Reconciliation – Annual (in thousands, unaudited) Year Ended 2018 2019 2020 2021 2022 Adjusted EBITDA Reconciliation Net income (loss) $ (1,255,911) $ (1,033,660) $ (944,839) $ (487,955) $ (1,429,653) Add (deduct): Interest income (27,228) (36,042) (18,127) (5,199) (58,59
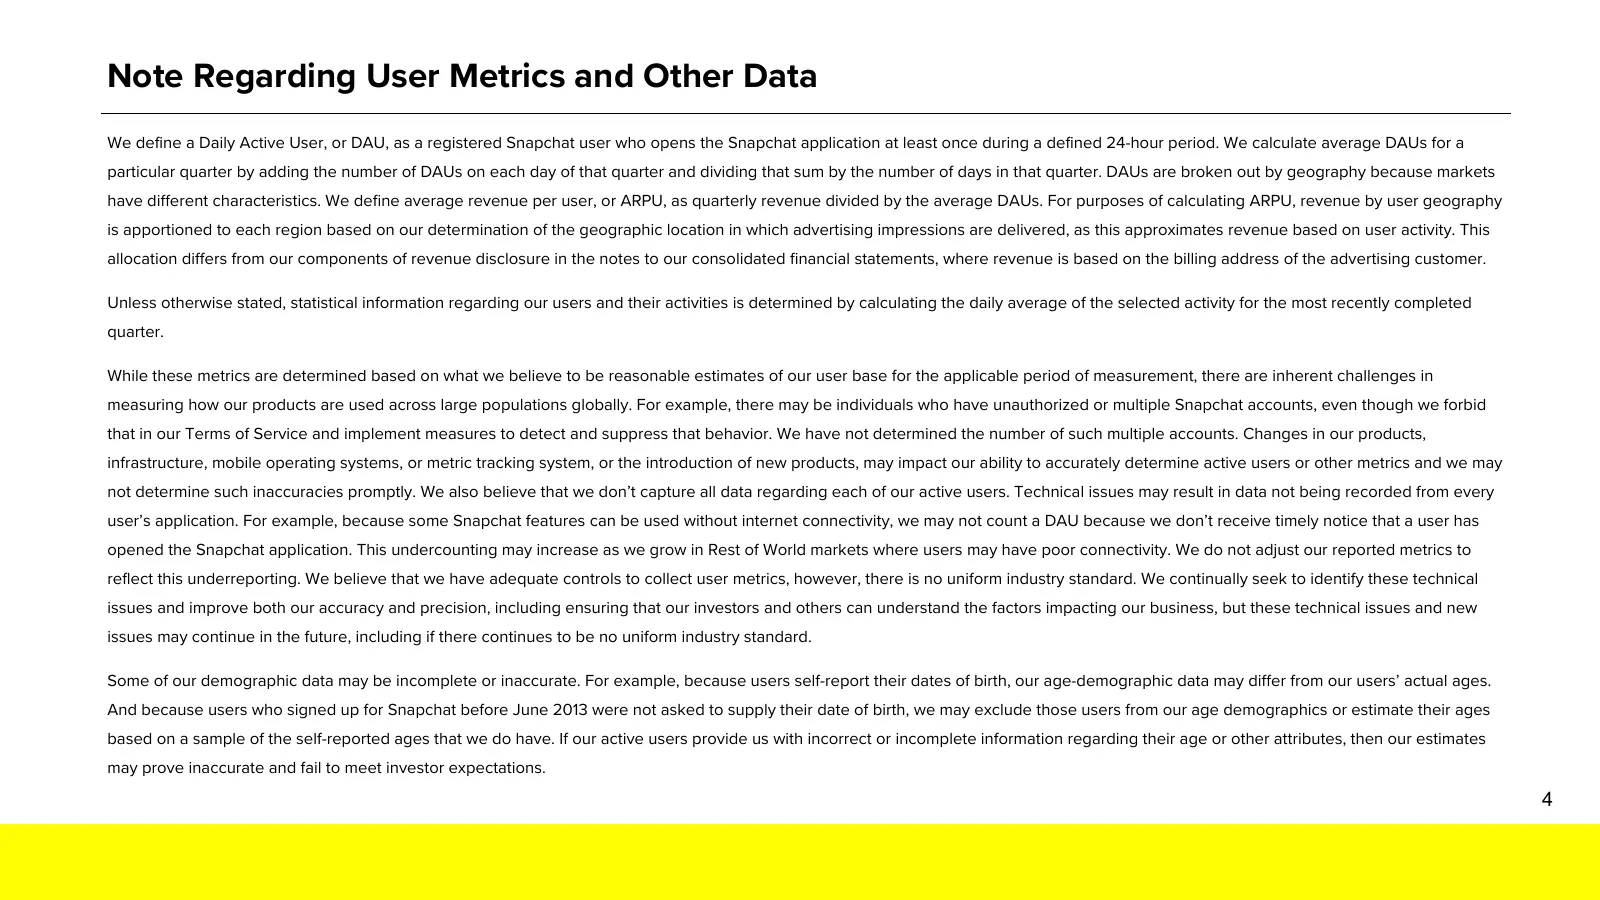
Slide 25: Note Regarding User Metrics and Other Data
Note Regarding User Metrics and Other Data We define a Daily Active User, or DAU, as a registered Snapchat user who opens the Snapchat application at least once during a defined 24-hour period. We calculate average DAUs for a particular quarter by adding the number of DAUs on each day of that quarte
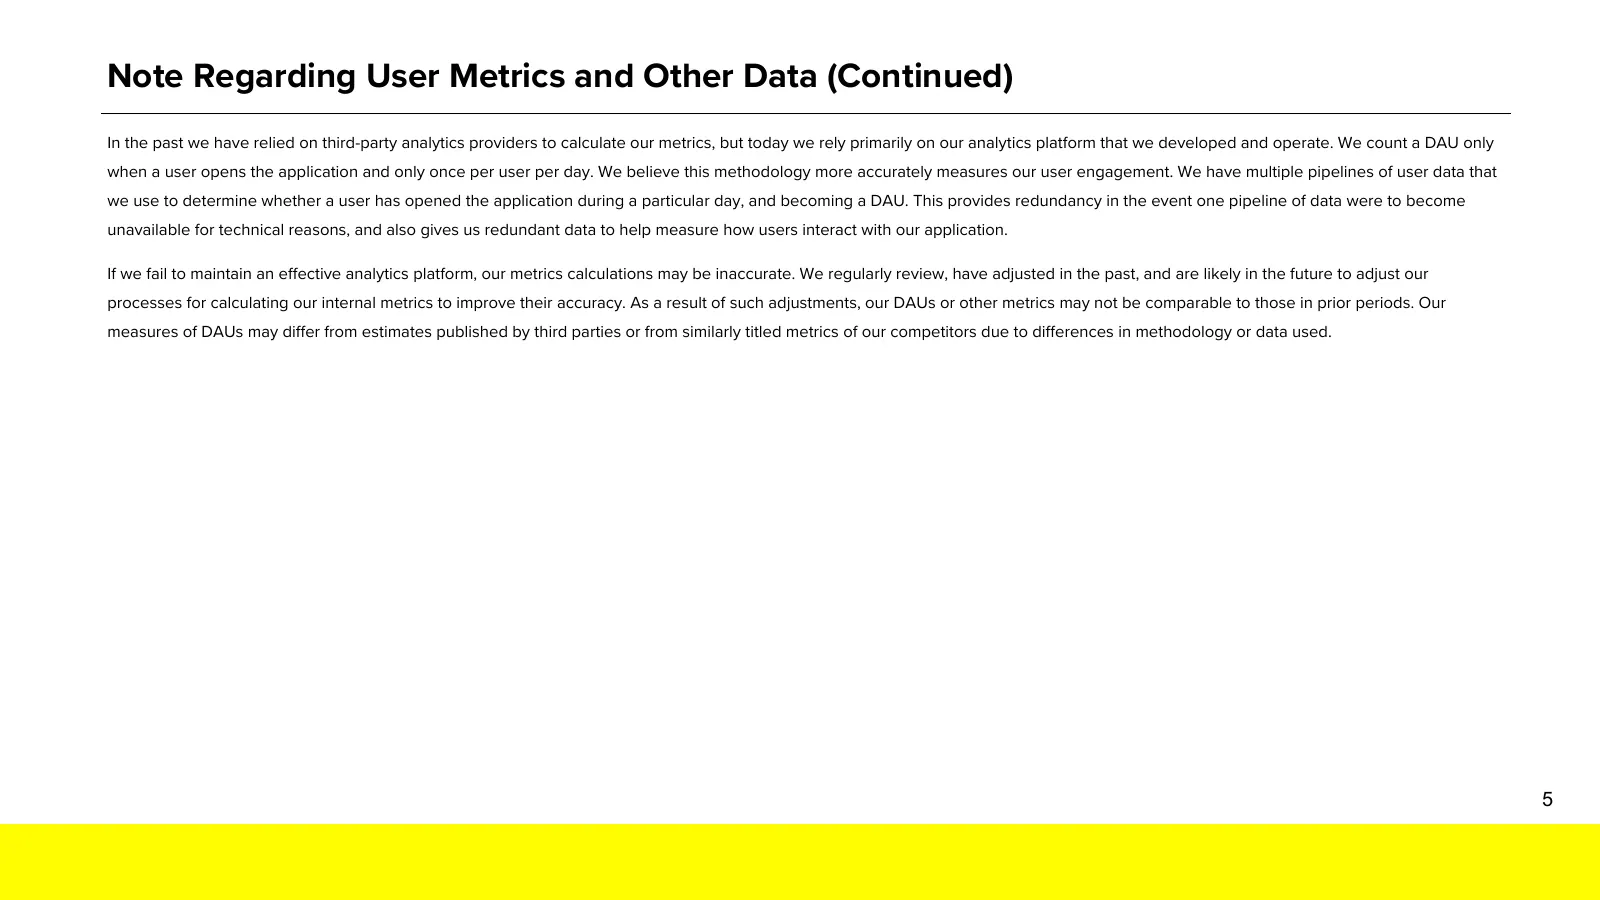
Slide 26: Note Regarding User Metrics and Other Data (Continued)
Note Regarding User Metrics and Other Data (Continued) In the past we have relied on third-party analytics providers to calculate our metrics, but today we rely primarily on our analytics platform that we developed and operate. We count a DAU only when a user opens the application and only once per
Source: Internet Archive copy of s25.q4cdn.com
More decks from Snap Inc.
 Q2 2026 Earnings Presentation21 slides · Aug 3, 2026
 Q1 2026 Earnings Presentation22 slides · May 6, 2026
 Corporate Update (April 2026)10 slides · April 2026
 Q4 2025 Earnings Presentation32 slides · Feb 4, 2026
 Q3 2025 Earnings Presentation24 slides · Nov 5, 2025
 Q2 2025 Earnings Presentation24 slides · Aug 5, 2025